Embed Size (px)
Citation preview
1
Buderim Mountain State School
2016 ANNUAL REPORT
Queensland State School Reporting
Inspiring minds. Creating opportunities. Shaping Queensland’s future. Every student succeeding. State Schools Strategy 2016-2020
Department of Education and Training

2
Contact Information
Postal address: PO Box 201 Buderim 4556
Phone: (07) 5477 2777
Fax: (07) 5477 2700
Email: [email protected]
Webpages: Additional reporting information pertaining to Queensland state schools is located on the My School website and the Queensland Government data website.
Contact Person: Neil Jenkins (Principal)

3
School Overview
Buderim Mountain State School is an Independent Public School where children experience learning opportunities in a caring,
friendly, success orientated teaching environment. We care for each child and expect high standards. Our school is steeped in
tradition and since 1875 we have been helping children develop the knowledge, skills and attitudes that will enable them to lead
worthwhile lives and be active, responsible citizens.
Our dedicated, experienced teaching staff ensure that students have many opportunities to succeed in academic, sporting and
cultural activities. Our strategic plan ensures that we are well placed to meet the challenges presented by a rapidly changing
world. There is a vibrant sense of community in the school with parents and teachers working closely together to ensure all
children leave Year 6 being able to "face the future with confidence".
Principal’s Foreword
Introduction This report reflects the School’s goals and aspirations for 2017 and includes information about our success and challenges in achieving our goals. The report includes;
A summary of our progress
A futures orientation [goals for 2017]
School profile [including staff profile and opinion survey results]
Data on National testing in Literacy and Numeracy
School Progress towards its goals in 2016
Priorities and progress from our strategic plan for the period of 2015 -2019 include:
1. Continuing a strong and positive school culture
All staff participating in annual professional development to build knowledge of s elf and team members
Increasing access to sharing of best practice through year level planning meetings and whole staff sessions
Employing a staff member to focus on increasing student attendance
Identifying opportunities at a whole school level to maximize instruction time and reduce interruptions to classroom learning
2. Supporting the full range of students to reach their academic and personal potential
Implementation of a holistic P-6 Support Services Model with increased teacher aide and support teacher resourcing in classrooms
Increased analysis of student internal data sets to determine allocation of support resources
Continued the implementation of Positive Behaviour Support
Developed a strategic approach to improving ICT access with a focus on wireles s and Ipad/laptop/computer access for students
3. Ensuring a common approach to teaching and learning
Developed a P-6 Balanced Literacy Guide outlining our approach with the teaching of reading, writing and spelling
Exposed all staff to professional development in the Literacy Guide components through options including whole staff sessions, coaching, improved resource access and sharing of best practice

4
Ensuring all teaching staff have completed a Performance Development Plan outlining focus areas for the teaching of literacy and numeracy
Developed a whole school Assessment Plan to improve consistency with collection of student data and analysis of data so that student progress can be mapped from Prep to Year 6, future teaching focus areas can be informed and whole school support resources can be directed
Employed a Head of Curriculum to lead quarterly full day year level planning meetings to ensure all year level teachers have a common understanding of curriculum and assessment focus areas
Continuing year level moderation meetings to improve consistency of assessment across year levels
4. Continuing our excellent reputation and image within the school and community
Improving communication with parents through the website, newsletter and P&C
Begun more focused interaction with local kindy/childcare providers to improve the transition to school
Continuing to support transition processes with local high schools
Implementing and directing funding towards improving facilities and the appearance of the school buildings and grounds
Future Outlook
The improvement for 2016 focusses on continuing to expand and deepen the goals identified in the strategic plan for 2015-2019 with a focus on :
1. Continuing a strong and positive school culture 2. Supporting the full range of students to reach their academic and personal potential 3. Ensuring a common approach to teaching and learning 4. Continuing our excellent reputation and image within the school and community
Within these goals, the major focus areas for 2017 include:
Ensuring our P-6 support services system is highly organized and responsive to student needs
Continuing to improve a common approach to the teaching of literacy and numeracy across all P -6 classes with a focus on the teaching of reading
Implementing a whole school Assessment Overview to improve consistency with collection of student data and analysis of data so that student progress can be mapped from Prep to Year 6, future teaching focus areas can be informed and whole school support resources can be directed
Implementing and directing funding towards improving facilities and the appearance of the school buildings and grounds
The remainder of the School Annual Report provides information on our progress through NAPLAN and school opinion surveys.

5
Our School at a Glance
School Profile
Coeducational or single sex: Coeducational
Independent Public School: Yes
Year levels offered in 2016: Prep Year - Year 6
Student enrolments for this school:
Total Girls Boys Indigenous
Enrolment Continuity
(Feb – Nov)
2014 1069 530 539 30 93%
2015* 988 486 502 30 95%
2016 974 497 477 31 96%
Student counts are based on the Census (August) enrolment collection.
*From 2015, data for all state high schools include Year 7 students. Prior to 2015, only state high schools offering Year 7 had these students included in their counts.
In 2016, there were no students enrolled in a pre-Prep** program.
** pre-Prep is a kindergarten program for Aboriginal and Torres Strait Islander children, living across 35 Aboriginal and Torres Strait Islander
communities, in the year before school (http://deta.qld.gov.au/earlychildhood/families/pre-prep-indigenous.html).
Characteristics of the Student Body
Overview Student enrolment for the year 2016 began with 974 students in 39 classes, which has increased to approximately 1000 students during the school year. The distribution of genders is similar. In 2016 we had 23 classes in Early Phase [Prep /1/2/3] and 16 classes in Middle phase [years 4/5/6]. The ICSEA rating for our school is 1078 which places the school in the upper end of the socio –economic scale. There were 29 indigenous students enrolled in 2016. 22 students verified with a disability accessed support from the Special Education Program [SEP]. The school is closely aligned to the local community and some 30 community groups regularly interact and engage with school and the students .This includes a diverse range of involvement such as the Lions Club volunteers supervising the Walk to School program , a local Church offering the’ Kids Hope’ mentoring program , the Buderim War Memorial Community Association conducting the ANZAC Day ceremony in our school grounds ,the Buderim Foundation supporting school events and the Sunshine Coast University’s Education Faculty using our School for undergraduate and post graduate practicums. In 2016, the Student welfare support was enhanced by extending the Chaplaincy program to a four day per week role. This was enabled by strong community support and funding. New additions to the Chaplaincy program includes Community Kitchen, Sunny Kids referral agency access and enhanced in-class programs.
Average Class Sizes The following table shows the average class size information for each phase of schooling.
AVERAGE CLASS SIZES
Phase 2014 2015* 2016
Prep – Year 3 22 23 24
Year 4 – Year 7 24 25 26
Year 8 – Year 10
Year 11 – Year 12
*From 2015, data for all state high schools include Year 7 students. Prior to 2015, only state high schools offering Year 7 had these students included in their counts.

6
Curriculum Delivery
Our Approach to Curriculum Delivery All students access the Australian Curriculum in Mathematics, English, Science, Geography, History, The Arts, Health & Physical Education and Japanese (Year 5 and 6). The School offers a range of Extensions and Enrichments including:
Involvement in local, state and national, literacy and numeracy competitions and enrichment challenges.
Optiminds, Performance Choirs, School Band, School Orchestra Performance Troupe
Senior and Junior Parade performances to reflect the school’s programs.
A dedicated Science Laboratory to enhance the Science program of the school.
Excursions to extend the learning environment for all year levels.
Instrumental Music Program that is complemented by a school Rock Band
School Sports and Athletics programs including Swimming, Interschool Sport, Triathlon, Cross Country, Interhouse Athletics, Swimming carnivals and Recreational Sports.
A distinctive feature of the student report card is to indicate a Recommended Learning Goal in Maths, English, Science and History
Co-curricular Activities In 2016, extracurricular engagement with the community in Buderim included:
School personal development camp for Year 6 students
Parades for each year level on a weekly basis to celebrate social, cultural and academic successes by students
Human Relationships Education program [HRE]
Life Education Program
Recycling Program
Kitchen Garden initiative
Book Week Festival /Eisteddfod/Voices on the Coast /Music festivals
School Discos and Lunch hour programs
A significant part of the extracurricula activities of the school include community-based cultural events which used the school facilities or personnel including;
Australia Day celebration
Anzac Day ceremony
Remembrance Day observances
Buderim Street Party The school Performance Troupe [Senior and Junior] and the Music ensembles, regularly engages with school and community events to share the performance arts programs of the school.
How Information and Communication Technologies are used to Assist Learning Student learning is enhanced by the use of ICT’s across the curriculum areas. Students have access to pods of computers in classrooms and 4 Computer labs which are utilized throughout the school day. In addition, we have numerous Ipads accessible for all year levels. ICT usage is directed by the Units of Work of the Curriculum. This includes the generation of student products of work, as sources of communication and display, as sources of information, as assessment and presentations of student learning and for generative communication. The use of coding and robotics programs have been introduced in the upper school in 2016.
Social Climate
Overview The school promotes a climate of respect and focused learning. The school is the oldest facility in the community [140 years old] and is now educating seventh generation children from the same family. Our History and traditions are a significant point of difference and indigenous histories are acknowledged in such ways as the name of the school, school house name, indigenous icons on sports shirts and significant art pieces throughout the school. Student population is increasing and the wearing of the school uniform is a highly regarded community standard, as is the community support for the school expectations of Learning, Respect and Safety. Staff who teach at this school tend to stay for extended periods of time. An active OSHC and Vacation Care program is run from the school.
7
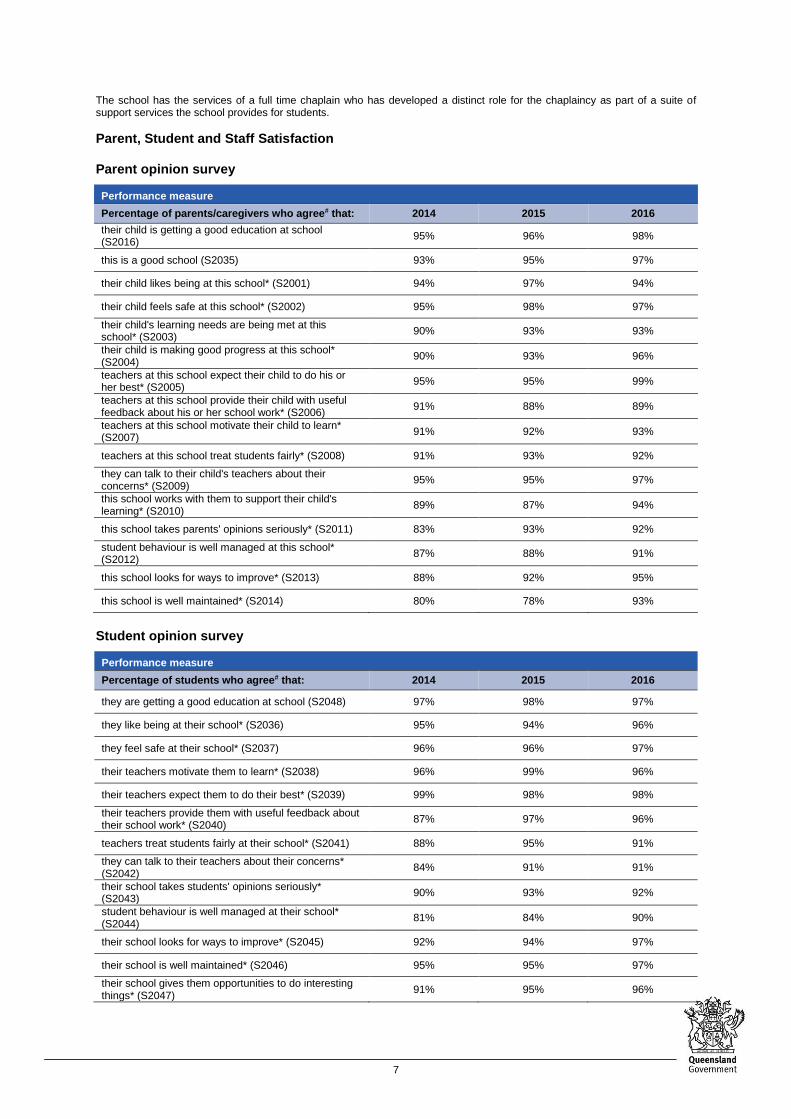
The school has the services of a full time chaplain who has developed a distinct role for the chaplaincy as part of a suite of support services the school provides for students.
Parent, Student and Staff Satisfaction Parent opinion survey
Performance measure
Percentage of parents/caregivers who agree# that: 2014 2015 2016
their child is getting a good education at school (S2016)
95% 96% 98%
this is a good school (S2035) 93% 95% 97%
their child likes being at this school* (S2001) 94% 97% 94%
their child feels safe at this school* (S2002) 95% 98% 97%
their child's learning needs are being met at this school* (S2003)
90% 93% 93%
their child is making good progress at this school* (S2004)
90% 93% 96%
teachers at this school expect their child to do his or her best* (S2005)
95% 95% 99%
teachers at this school provide their child with useful feedback about his or her school work* (S2006)
91% 88% 89%
teachers at this school motivate their child to learn* (S2007)
91% 92% 93%
teachers at this school treat students fairly* (S2008) 91% 93% 92%
they can talk to their child's teachers about their concerns* (S2009)
95% 95% 97%
this school works with them to support their child's learning* (S2010)
89% 87% 94%
this school takes parents' opinions seriously* (S2011) 83% 93% 92%
student behaviour is well managed at this school* (S2012)
87% 88% 91%
this school looks for ways to improve* (S2013) 88% 92% 95%
this school is well maintained* (S2014) 80% 78% 93%
Student opinion survey
Performance measure
Percentage of students who agree# that: 2014 2015 2016
they are getting a good education at school (S2048) 97% 98% 97%
they like being at their school* (S2036) 95% 94% 96%
they feel safe at their school* (S2037) 96% 96% 97%
their teachers motivate them to learn* (S2038) 96% 99% 96%
their teachers expect them to do their best* (S2039) 99% 98% 98%
their teachers provide them with useful feedback about their school work* (S2040)
87% 97% 96%
teachers treat students fairly at their school* (S2041) 88% 95% 91%
they can talk to their teachers about their concerns* (S2042)
84% 91% 91%
their school takes students' opinions seriously* (S2043)
90% 93% 92%
student behaviour is well managed at their school* (S2044)
81% 84% 90%
their school looks for ways to improve* (S2045) 92% 94% 97%
their school is well maintained* (S2046) 95% 95% 97%
their school gives them opportunities to do interesting things* (S2047)
91% 95% 96%

8
Staff opinion survey
Performance measure
Percentage of school staff who agree# that: 2014 2015 2016
they enjoy working at their school (S2069) 97% 98% 100%
they feel that their school is a safe place in which to work (S2070)
98% 100% 100%
they receive useful feedback about their work at their school (S2071)
83% 89% 89%
they feel confident embedding Aboriginal and Torres Strait Islander perspectives across the learning areas (S2114)
84% 98% 98%
students are encouraged to do their best at their school (S2072)
98% 100% 100%
students are treated fairly at their school (S2073) 97% 98% 100%
student behaviour is well managed at their school (S2074)
94% 97% 100%
staff are well supported at their school (S2075) 85% 95% 92%
their school takes staff opinions seriously (S2076) 82% 95% 93%
their school looks for ways to improve (S2077) 94% 97% 98%
their school is well maintained (S2078) 71% 73% 95%
their school gives them opportunities to do interesting things (S2079)
86% 91% 97%
* Nationally agreed student and parent/caregiver items # ‘Agree’ represents the percentage of respondents who Somewhat Agree, Agree or Strongly Agree with the statement. DW = Data withheld to ensure confidentiality.
Parent and community engagement Parents are encouraged to become involved in their child’s education in a variety of ways. These strategies include:
Meet the teacher interviews in week 3, mid semester and end of semester of the school year.
Yearly Overviews are provided to all parents at the beginning of the school year.
Parades for all classes once a week to celebrate student successes in Academic, Social and Cultural areas. These events are well attended by parents.
Communication that utilises an electronic newsletter to give extensive items and photographs about school events. This is extended in many cases to class newsletters.
Reporting Plan for the year that indicates times for written reports, parent interviews and information sessions to provide focused information about a child’s learning.
Principal’s report at P&C meetings and in the electronic newsletter has a strong academic focus to keep parents informed of the academic endeavours of the school.
Parents are personally invited at enrolment to keep close contact with the class teacher to stay engaged with their child’s learning.
Significantly in 2016 the school continued Recommended Learning Goals on report cards. Written in ‘plain English ’, these goals indicate to parents the next learning step for their child in the Australian Curriculum areas of English and Maths.
Respectful relationships programs The school has developed and implemented a program or programs that focus on appropriate, respectful and healthy relationships. Students at Buderim Mountain State School are taught about personal safety and awareness as well as conflict resolution through:
Units of health as part of the Australian Curriculum
Lessons, parade and classroom discussion in relation to Positive Behaviour Learning
Proactive programs run by the Chaplain and Guidance Officer in classrooms and on parades
Life Education program
9
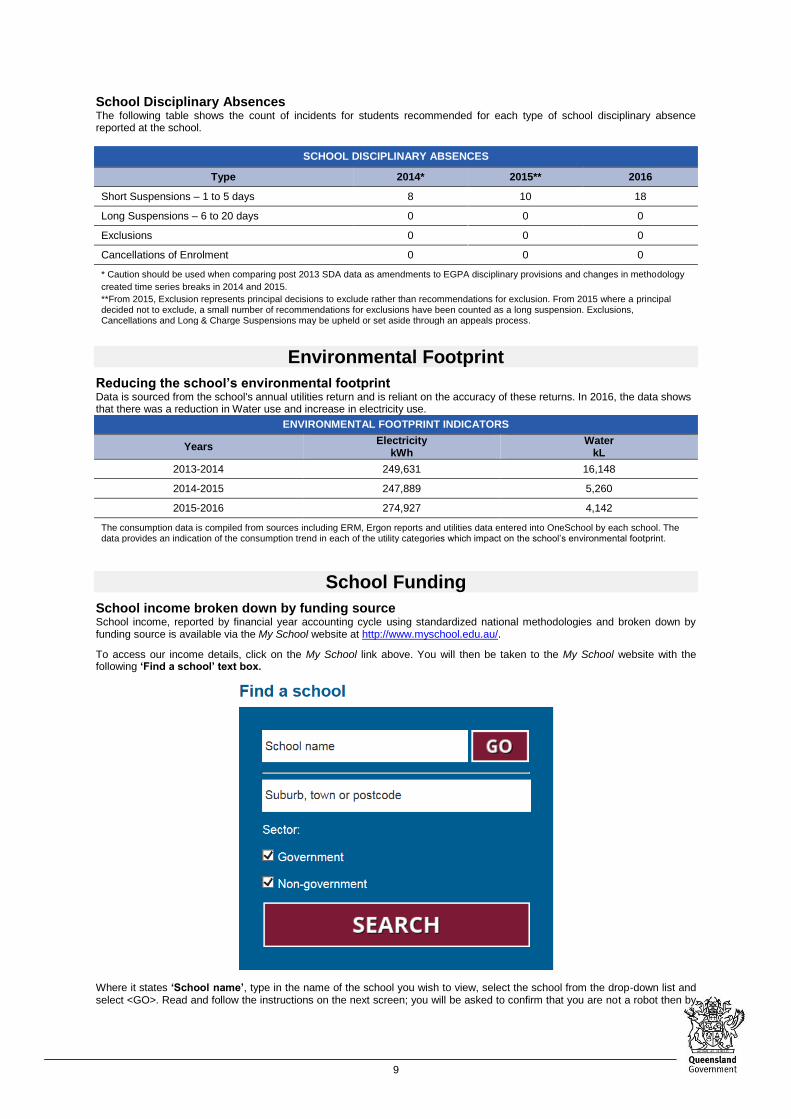
School Disciplinary Absences The following table shows the count of incidents for students recommended for each type of school disciplinary absence reported at the school.
SCHOOL DISCIPLINARY ABSENCES
Type 2014* 2015** 2016
Short Suspensions – 1 to 5 days 8 10 18
Long Suspensions – 6 to 20 days 0 0 0
Exclusions 0 0 0
Cancellations of Enrolment 0 0 0
* Caution should be used when comparing post 2013 SDA data as amendments to EGPA disciplinary provisions and changes in methodology
created time series breaks in 2014 and 2015.
**From 2015, Exclusion represents principal decisions to exclude rather than recommendations for exclusion. From 2015 where a principal decided not to exclude, a small number of recommendations for exclusions have been counted as a long suspension. Exclusions, Cancellations and Long & Charge Suspensions may be upheld or set aside through an appeals process.
Environmental Footprint
Reducing the school’s environmental footprint Data is sourced from the school's annual utilities return and is reliant on the accuracy of these returns. In 2016, the data shows that there was a reduction in Water use and increase in electricity use.
ENVIRONMENTAL FOOTPRINT INDICATORS
Years Electricity
kWh Water
kL
2013-2014 249,631 16,148
2014-2015 247,889 5,260
2015-2016 274,927 4,142
The consumption data is compiled from sources including ERM, Ergon reports and utilities data entered into OneSchool by each school. The data provides an indication of the consumption trend in each of the utility categories which impact on the school’s environmental footprint.
School Funding
School income broken down by funding source School income, reported by financial year accounting cycle using standardized national methodologies and broken down by funding source is available via the My School website at http://www.myschool.edu.au/.
To access our income details, click on the My School link above. You will then be taken to the My School website with the following ‘Find a school’ text box.
Where it states ‘School name’, type in the name of the school you wish to view, select the school from the drop-down list and select <GO>. Read and follow the instructions on the next screen; you will be asked to confirm that you are not a robot then by
10
clicking continue, you acknowledge that you have read, accepted and agree to the Terms of Use and Privacy Policy before being given access to the school’s profile webpage.
School financial information is available by selecting ‘School finances’ in the menu box in the top left corner of the school’s profile webpage. If you are unable to access the internet, please contact the school for a paper copy of income by funding source.
Our Staff Profile
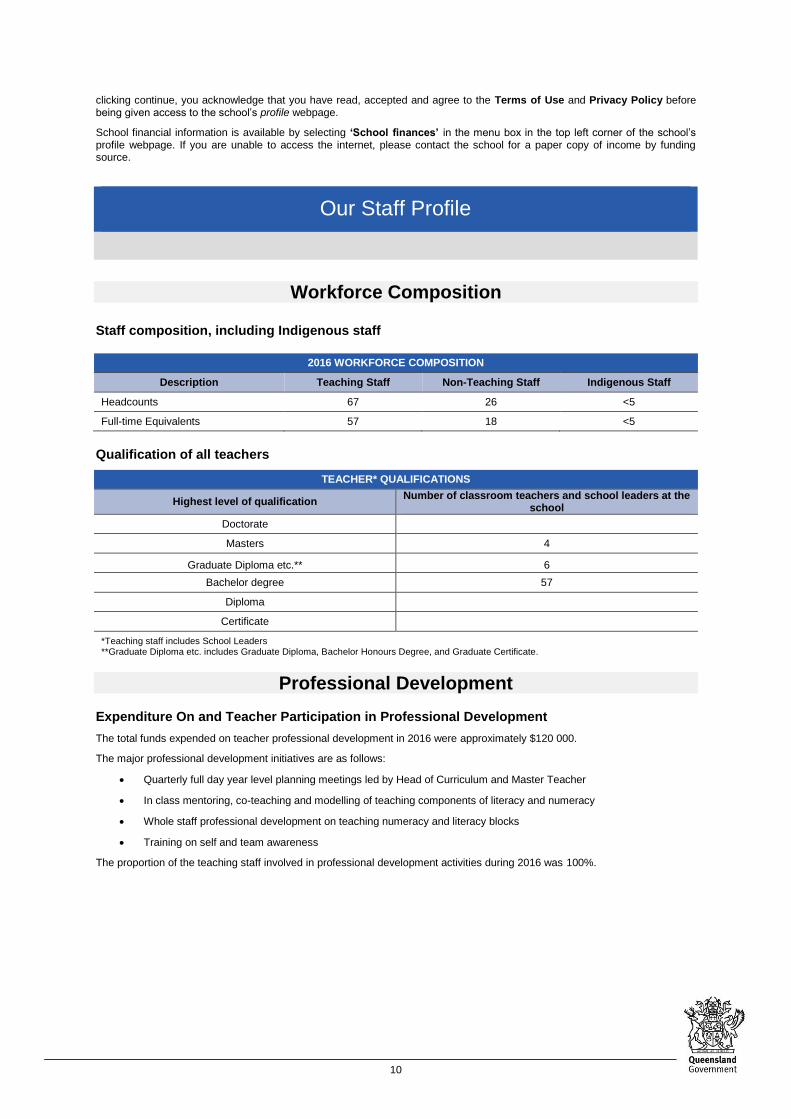
Workforce Composition
Staff composition, including Indigenous staff
2016 WORKFORCE COMPOSITION
Description Teaching Staff Non-Teaching Staff Indigenous Staff
Headcounts 67 26 <5
Full-time Equivalents 57 18 <5
Qualification of all teachers
TEACHER* QUALIFICATIONS
Highest level of qualification Number of classroom teachers and school leaders at the
school
Doctorate
Masters 4
Graduate Diploma etc.** 6
Bachelor degree 57
Diploma
Certificate
*Teaching staff includes School Leaders **Graduate Diploma etc. includes Graduate Diploma, Bachelor Honours Degree, and Graduate Certificate.
Professional Development Expenditure On and Teacher Participation in Professional Development
The total funds expended on teacher professional development in 2016 were approximately $120 000.
The major professional development initiatives are as follows:
Quarterly full day year level planning meetings led by Head of Curriculum and Master Teacher
In class mentoring, co-teaching and modelling of teaching components of literacy and numeracy
Whole staff professional development on teaching numeracy and literacy blocks
Training on self and team awareness
The proportion of the teaching staff involved in professional development activities during 2016 was 100%.
11
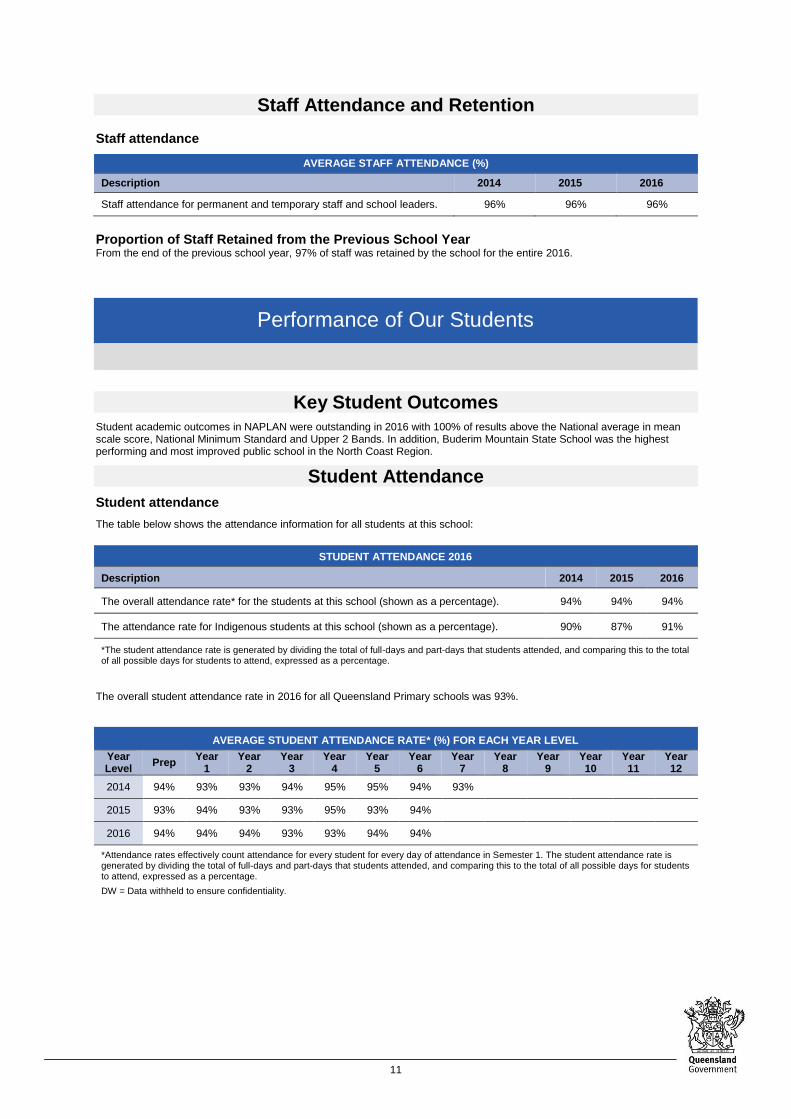
Staff Attendance and Retention Staff attendance
AVERAGE STAFF ATTENDANCE (%)
Description 2014 2015 2016
Staff attendance for permanent and temporary staff and school leaders. 96% 96% 96%
Proportion of Staff Retained from the Previous School Year From the end of the previous school year, 97% of staff was retained by the school for the entire 2016.
Performance of Our Students
Key Student Outcomes
Student academic outcomes in NAPLAN were outstanding in 2016 with 100% of results above the National average in mean scale score, National Minimum Standard and Upper 2 Bands. In addition, Buderim Mountain State School was the highest performing and most improved public school in the North Coast Region.
Student Attendance
Student attendance
The table below shows the attendance information for all students at this school:
STUDENT ATTENDANCE 2016
Description 2014 2015 2016
The overall attendance rate* for the students at this school (shown as a percentage). 94% 94% 94%
The attendance rate for Indigenous students at this school (shown as a percentage). 90% 87% 91%
*The student attendance rate is generated by dividing the total of full-days and part-days that students attended, and comparing this to the total of all possible days for students to attend, expressed as a percentage.
The overall student attendance rate in 2016 for all Queensland Primary schools was 93%.
AVERAGE STUDENT ATTENDANCE RATE* (%) FOR EACH YEAR LEVEL
Year Level
Prep Year
1 Year
2 Year
3 Year
4 Year
5 Year
6 Year
7 Year
8 Year
9 Year 10
Year 11
Year 12
2014 94% 93% 93% 94% 95% 95% 94% 93%
2015 93% 94% 93% 93% 95% 93% 94%
2016 94% 94% 94% 93% 93% 94% 94%
*Attendance rates effectively count attendance for every student for every day of attendance in Semester 1. The student attendance rate is generated by dividing the total of full-days and part-days that students attended, and comparing this to the total of all possible days for students to attend, expressed as a percentage.
DW = Data withheld to ensure confidentiality.

12
Student Attendance Distribution The proportions of students by attendance range:
8
9
9
12
11
12
30
29
27
51
51
52
0% 20% 40% 60% 80% 100%
2016
2015
2014
Proportion of Students
Attendance Rate: 0% to <85% 85% to <90% 90% to <95% 95% to 100%
Description of how non-attendance is managed by the school Non-attendance is managed in state schools in line with the DET procedures, Managing Student Absences and Enforcing Enrolment and Attendance at State Schools and Roll Marking in State Schools, which outline processes for managing and recording student attendance and absenteeism.
At Buderim Mountain State School, a staff member is employed to follow up on all unexplained absences. Reports are downloaded on a weekly basis to also identify students with below 85% attendance and Deputy Principals liaise with parents to improve attendance.
NAPLAN
Our reading, writing, spelling, grammar and punctuation, and numeracy results for the Years 3, 5, 7 and 9 are available via the My School website at http://www.myschool.edu.au/.
To access our NAPLAN results, click on the My School link above. You will then be taken to the My School website with the
following ‘Find a school’ text box.
Where it states ‘School name’, type in the name of the school you wish to view, select the school from the drop-down list and select <GO>. Read and follow the instructions on the next screen; you will be asked to confirm that you are not a robot then by clicking continue, you acknowledge that you have read, accepted and agree to the Terms of Use and Privacy Policy before being given access to the school’s profile webpage.
School NAPLAN information is available by selecting ‘NAPLAN’ in the menu box in the top left corner of the school’s profile webpage. If you are unable to access the internet, please contact the school for a paper copy of our school’s NAPLAN results.

13

14