Embed Size (px)
Citation preview

Annual Report December 31, 2015
Investors presentation
March 17, 2016

Confidentiality
This presentation has been prepared by Marcolin S.p.A. and its affiliates. The information contained
herein is confidential and has been prepared solely for the needs of the adressee and is not to be relied
upon by any other person or entity. Hence, if you wish to disclose copies of this report to any other
person or entity, you must inform they that they may not use these reports for any purpose without
Marcolin written consent.
No representation, warranty or undertaking, express or implied, is made as to, and no reliance shoud be
placed on, the fairness, accuracy, completeness or correctness of the information or the opinions
contained herein.
2
3
Appendix
Agenda
Key consolidated financials: FY 2015
Key consolidated financials
* EBITDA is affected by a number of extraordinary items. For this reason it has been adjusted to restate the one-off effects deriving from the re-organization as
represented in “Consolidated Adjusted EBITDA” page 18.
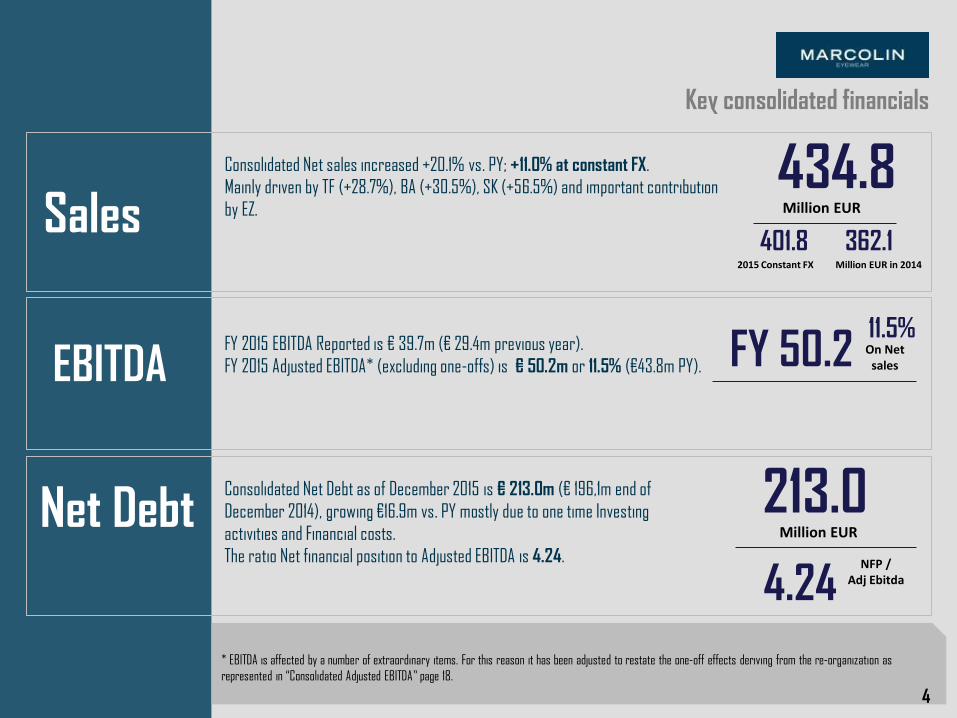
Sales Consolidated Net sales increased +20.1% vs. PY; +11.0% at constant FX.
Mainly driven by TF (+28.7%), BA (+30.5%), SK (+56.5%) and important contribution
by EZ.
434.8 Million EUR
EBITDA FY 2015 EBITDA Reported is € 39.7m (€ 29.4m previous year).
FY 2015 Adjusted EBITDA* (excluding one-offs) is € 50.2m or 11.5% (€43.8m PY). FY 50.2 11.5%
On Net sales
Net Debt
401.8 2015 Constant FX
4
Consolidated Net Debt as of December 2015 is € 213.0m (€ 196,1m end of
December 2014), growing €16.9m vs. PY mostly due to one time Investing
activities and Financial costs.
The ratio Net financial position to Adjusted EBITDA is 4.24.
Million EUR in 2014
362.1
4.24 NFP /
Adj Ebitda
213.0 Million EUR
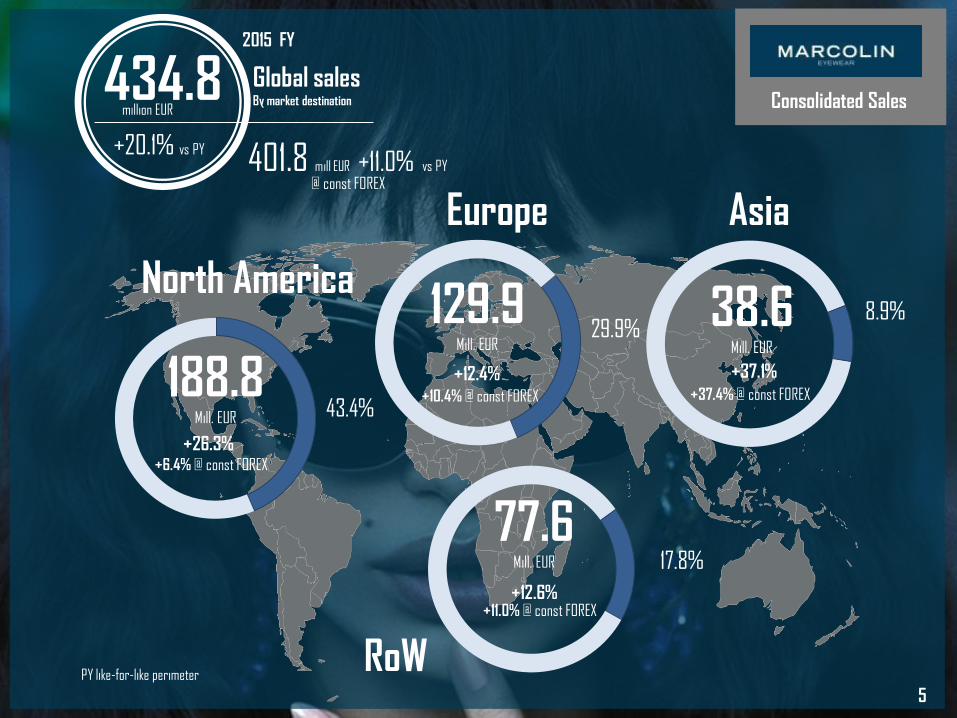
Consolidated Sales 434.8 million EUR
2015 FY
@ const FOREX
+20.1% vs PY
Global sales By market destination
401.8 mill EUR +11.0% vs PY
5
North America
Europe Asia
RoW
188.8 Mill. EUR
129.9 Mill. EUR
38.6 Mill. EUR
77.6 Mill. EUR
43.4%
29.9% 8.9%
17.8%
+12.4%
+26.3%
+37.1%
+12.6%
PY like-for-like perimeter
+6.4% @ const FOREX
+10.4% @ const FOREX +37.4% @ const FOREX
+11.0% @ const FOREX
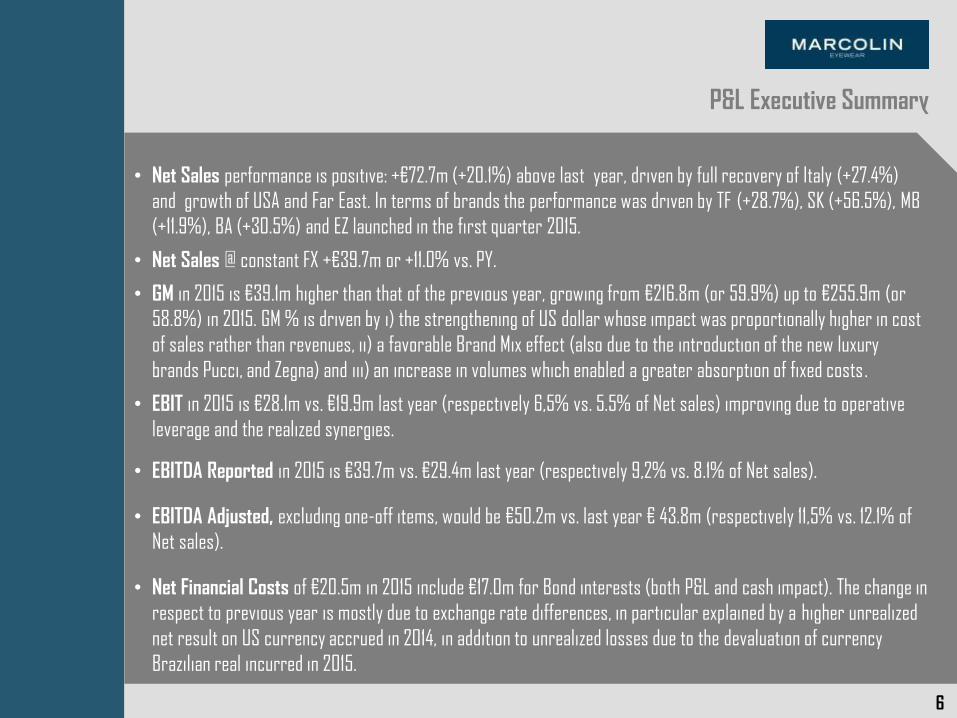
• Net Sales performance is positive: +€72.7m (+20.1%) above last year, driven by full recovery of Italy (+27.4%)
and growth of USA and Far East. In terms of brands the performance was driven by TF (+28.7%), SK (+56.5%), MB
(+11.9%), BA (+30.5%) and EZ launched in the first quarter 2015.
• Net Sales @ constant FX +€39.7m or +11.0% vs. PY.
• GM in 2015 is €39.1m higher than that of the previous year, growing from €216.8m (or 59.9%) up to €255.9m (or
58.8%) in 2015. GM % is driven by i) the strengthening of US dollar whose impact was proportionally higher in cost
of sales rather than revenues, ii) a favorable Brand Mix effect (also due to the introduction of the new luxury
brands Pucci, and Zegna) and iii) an increase in volumes which enabled a greater absorption of fixed costs.
• EBIT in 2015 is €28.1m vs. €19.9m last year (respectively 6,5% vs. 5.5% of Net sales) improving due to operative
leverage and the realized synergies.
• EBITDA Reported in 2015 is €39.7m vs. €29.4m last year (respectively 9,2% vs. 8.1% of Net sales).
• EBITDA Adjusted, excluding one-off items, would be €50.2m vs. last year € 43.8m (respectively 11,5% vs. 12.1% of
Net sales).
• Net Financial Costs of €20.5m in 2015 include €17.0m for Bond interests (both P&L and cash impact). The change in
respect to previous year is mostly due to exchange rate differences, in particular explained by a higher unrealized
net result on US currency accrued in 2014, in addition to unrealized losses due to the devaluation of currency
Brazilian real incurred in 2015.
6
P&L Executive Summary
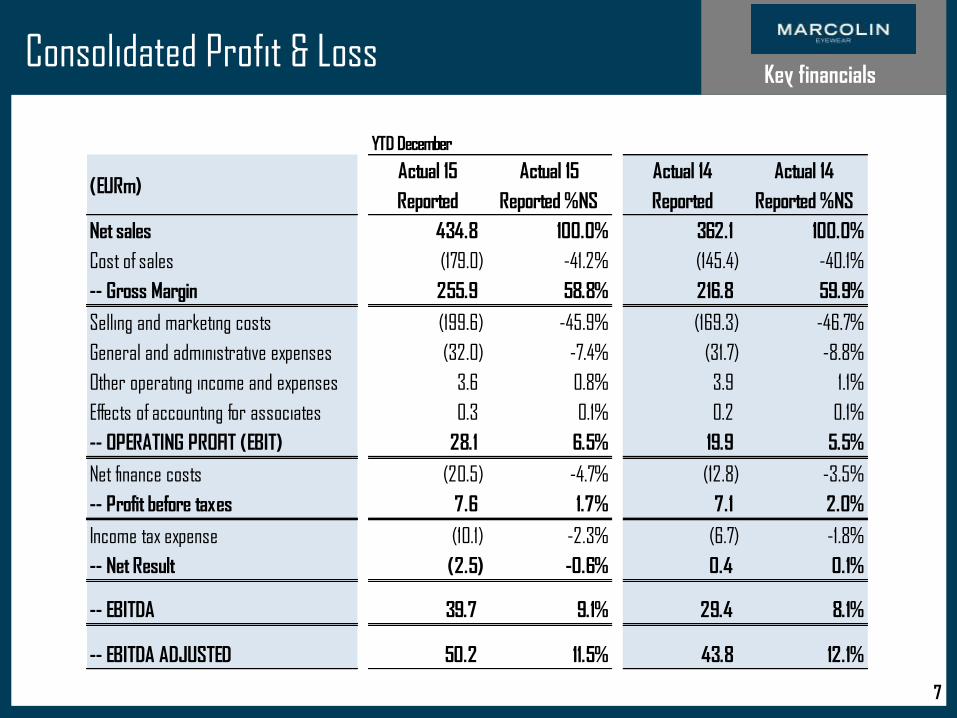
Consolidated Profit & Loss
7 7
Key financials
YTD December
(EURm)Actual 15
Reported
Actual 15
Reported %NS
Actual 14
Reported
Actual 14
Reported %NS
Net sales 434.8 100.0% 362.1 100.0%
Cost of sales (179.0) -41.2% (145.4) -40.1%
-- Gross Margin 255.9 58.8% 216.8 59.9%
Selling and marketing costs (199.6) -45.9% (169.3) -46.7%
General and administrative expenses (32.0) -7.4% (31.7) -8.8%
Other operating income and expenses 3.6 0.8% 3.9 1.1%
Effects of accounting for associates 0.3 0.1% 0.2 0.1%
-- OPERATING PROFIT (EBIT) 28.1 6.5% 19.9 5.5%
Net finance costs (20.5) -4.7% (12.8) -3.5%
-- Profit before taxes 7.6 1.7% 7.1 2.0%
Income tax expense (10.1) -2.3% (6.7) -1.8%
-- Net Result (2.5) -0.6% 0.4 0.1%
-- EBITDA 39.7 9.1% 29.4 8.1%
-- EBITDA ADJUSTED 50.2 11.5% 43.8 12.1%

• Net Trade Receivables: compared to Dec 14, the increase of €8.3m is explained by the sales growth. In the
period total consolidated DSO index is under control and decreased by 3 days.
• Inventory: compared to Dec 14 has risen by €20.1m, mostly due to turnover increase. It has been also impacted
by the discontinuity represented new brands launched in 2015, and new JVs inventory. In addition it has been
influenced by a significant foreign exchange rate difference. In 2015 total consolidated DOI index is under control
and decreased by 2 days.
• Payables: in reference to trade payables, the increase is primarily attributable to the turnover increase. In
addition, the Group’s days payables outstanding (DPO) at December 31, 2015 has significantly improved compared
to last year, also due to the successful actions taken by the Group to improve payment terms.
• Capex: primarily consisted in the investments in the new Fortogna plant (tangibles), in addition to investments in
extending/improving terms and conditions of licenses (intangibles).
• Net Financial Position: December 2015 increased from €196.1m (Dec 14) to €213.0m, with a change of €16.9m
mostly due to Investing activities and Financial costs, as detailed in the consolidated Cash Flow Statement.
8
B/S Executive Summary

Consolidated Balance Sheet
9
Key financials
Balance Sheet (EURm) Dec-15 Dec-14 Change
Net trade receivables 75.2 66.9 8.3
Inventory 120.2 100.1 20.1
Payables to suppliers (120.8) (102.3) (18.5)
TRADE WORKING CAPITAL 74.7 64.6 10.0
Other receivables 17.7 14.1 3.6
Other payables (38.7) (31.0) (7.7)
NET WORKING CAPITAL 53.7 47.8 5.9
Other receivables - medium/long term 37.8 39.4 (1.6)
Equity investments 1.8 1.9 (0.1)
Net tangible assets 27.3 24.7 2.6
Net intangible assets 43.3 37.2 6.1
Goodwill 288.2 278.0 10.2
FIXED ASSETS 398.3 381.1 17.2
Funds and reserves (9.1) (10.0) 0.9
NET INVESTED CAPITAL 442.9 418.9 24.0
Financial debts - short term 58.2 41.4 16.9
Financial debts - medium/long term 200.6 199.2 1.5
FINANCIAL POSITION 258.9 240.5 18.3
Other current financial (41.4) (39.0) (2.4)
Other non current financial (4.5) (5.5) 1.0
NET FINANCIAL POSITION 213.0 196.1 16.9
NET EQUITY 229.9 222.8 7.1
COVERAGE OF NIC 442.9 418.9 24.0
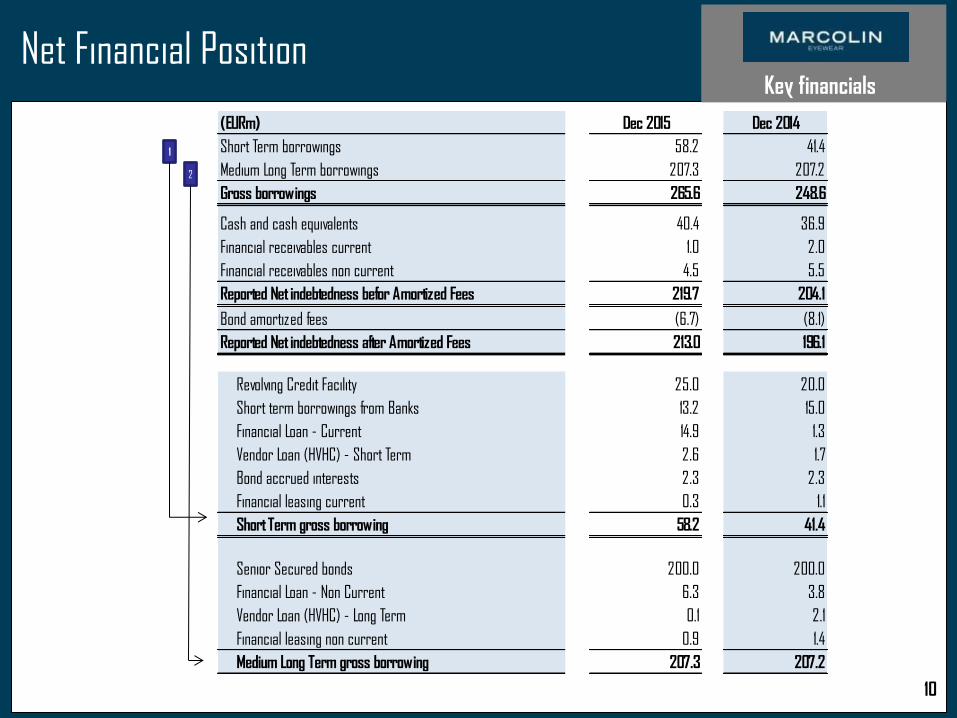
Net Financial Position
10
Key financials
1
2
(EURm) Dec 2015 Dec 2014
Short Term borrowings 58.2 41.4
Medium Long Term borrowings 207.3 207.2
Gross borrowings 265.6 248.6
Cash and cash equivalents 40.4 36.9
Financial receivables current 1.0 2.0
Financial receivables non current 4.5 5.5
Reported Net indebtedness befor Amortized Fees 219.7 204.1
Bond amortized fees (6.7) (8.1)
Reported Net indebtedness after Amortized Fees 213.0 196.1
Revolving Credit Facility 25.0 20.0
Short term borrowings from Banks 13.2 15.0
Financial Loan - Current 14.9 1.3
Vendor Loan (HVHC) - Short Term 2.6 1.7
Bond accrued interests 2.3 2.3
Financial leasing current 0.3 1.1
Short Term gross borrowing 58.2 41.4
Senior Secured bonds 200.0 200.0
Financial Loan - Non Current 6.3 3.8
Vendor Loan (HVHC) - Long Term 0.1 2.1
Financial leasing non current 0.9 1.4
Medium Long Term gross borrowing 207.3 207.2
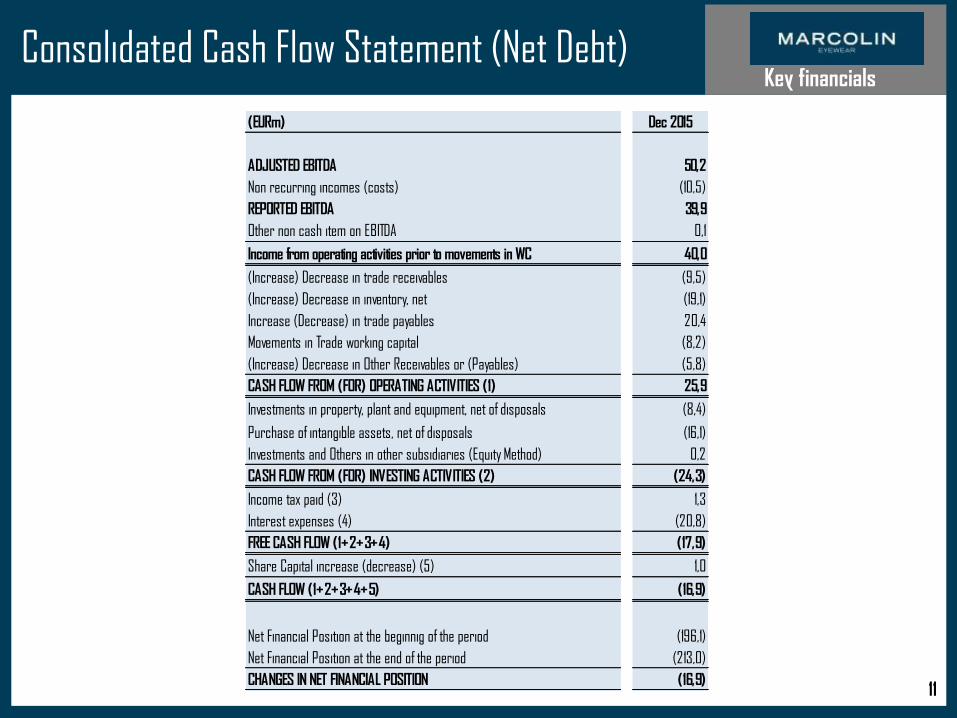
Consolidated Cash Flow Statement (Net Debt)
11
Key financials
(EURm) Dec 2015
ADJUSTED EBITDA 50,2
Non recurring incomes (costs) (10,5)
REPORTED EBITDA 39,9
Other non cash item on EBITDA 0,1
Income from operating activities prior to movements in WC 40,0
(Increase) Decrease in trade receivables (9,5)
(Increase) Decrease in inventory, net (19,1)
Increase (Decrease) in trade payables 20,4
Movements in Trade working capital (8,2)
(Increase) Decrease in Other Receivables or (Payables) (5,8)
CASH FLOW FROM (FOR) OPERATING ACTIVITIES (1) 25,9
Investments in property, plant and equipment, net of disposals (8,4)
Purchase of intangible assets, net of disposals (16,1)
Investments and Others in other subsidiaries (Equity Method) 0,2
CASH FLOW FROM (FOR) INVESTING ACTIVITIES (2) (24,3)
Income tax paid (3) 1,3
Interest expenses (4) (20,8)
FREE CASH FLOW (1+2+3+4) (17,9)
Share Capital increase (decrease) (5) 1,0
CASH FLOW (1+2+3+4+5) (16,9)
Net Financial Position at the beginnig of the period (196,1)
Net Financial Position at the end of the period (213,0)
CHANGES IN NET FINANCIAL POSITION (16,9)
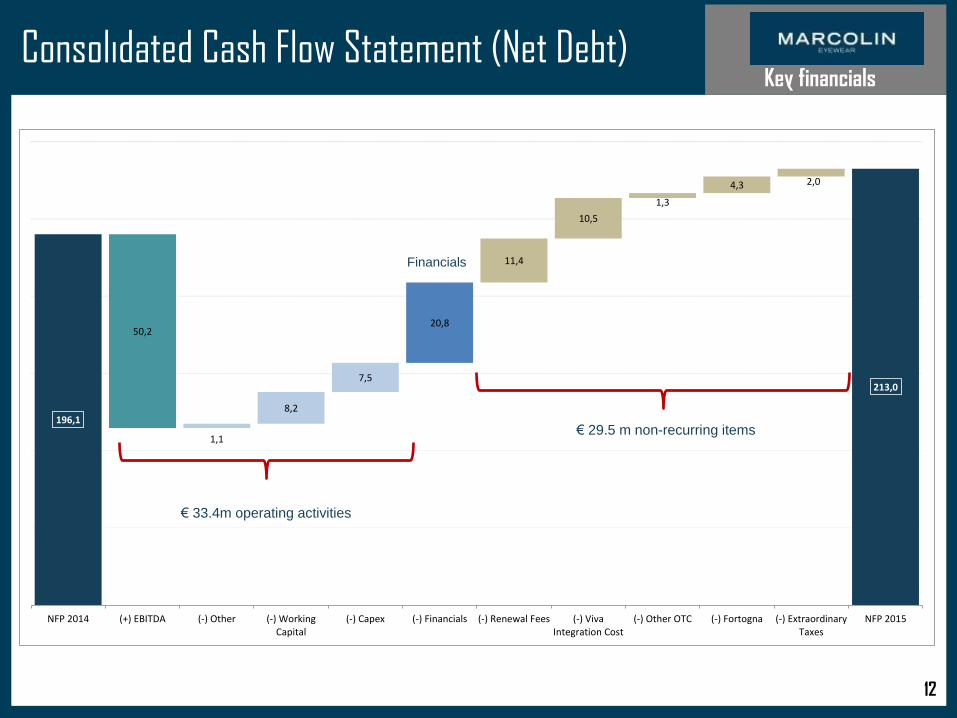
Consolidated Cash Flow Statement (Net Debt)
12
Key financials
196,1
50,2
1,1
8,2
7,5
20,8
11,4
10,5
1,3
4,3 2,0
213,0
NFP 2014 (+) EBITDA (-) Other (-) WorkingCapital
(-) Capex (-) Financials (-) Renewal Fees (-) VivaIntegration Cost
(-) Other OTC (-) Fortogna (-) ExtraordinaryTaxes
NFP 2015
€ 29.5 m non-recurring items
€ 33.4m operating activities
Financials
13
Appendix
Agenda
Key consolidated financials: FY 2015
14
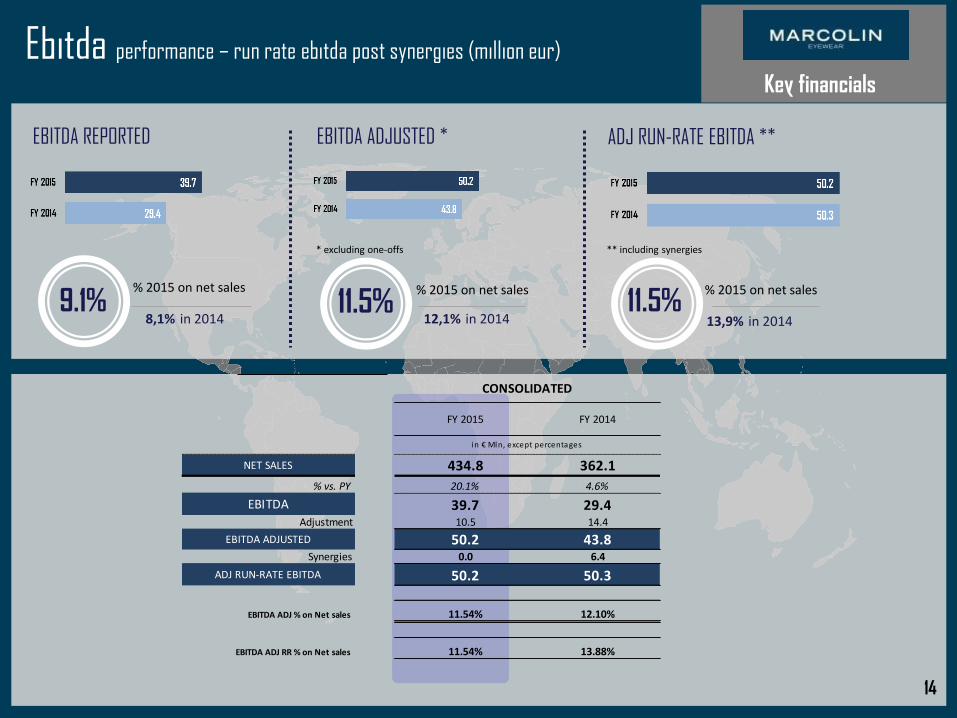
EBITDA REPORTED EBITDA ADJUSTED *
9.1%
ADJ RUN-RATE EBITDA **
% 2015 on net sales
11.5% % 2015 on net sales
8,1% in 2014 11.5%
% 2015 on net sales
12,1% in 2014 13,9% in 2014
* excluding one-offs ** including synergies
Ebitda performance – run rate ebitda post synergies (million eur)
Key financials
FY 2015 FY 2014
NET SALES 434.8 362.1
% vs. PY 20.1% 4.6%
EBITDA 39.7 29.4Adjustment 10.5 14.4
EBITDA ADJUSTED 50.2 43.8Synergies 0.0 6.4
ADJ RUN-RATE EBITDA 50.2 50.3
EBITDA ADJ % on Net sales 11.54% 12.10%
EBITDA ADJ RR % on Net sales 11.54% 13.88%
CONSOLIDATED
in € Mln, except percentages
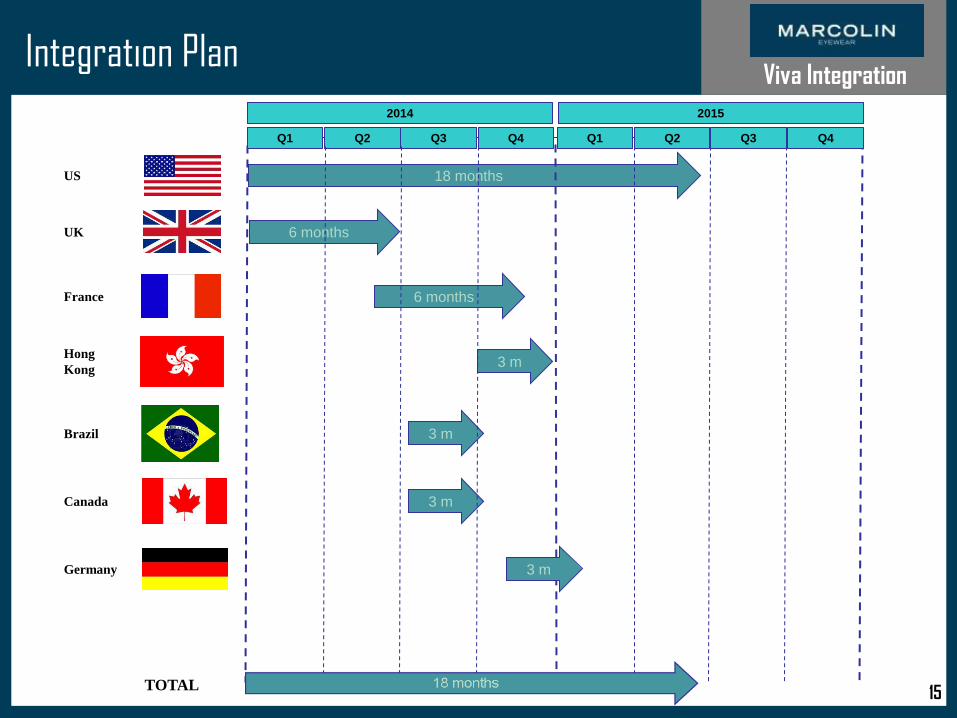
Integration Plan
15 15
Viva Integration
TOTAL
(*)
18 months
6 months
3 m
3 m
2014 2015
3 m
6 months
3 m
Q1 Q2 Q3 Q4 Q1 Q2 Q3 Q4
US
UK
France
Hong
Kong
Brazil
Canada
Germany
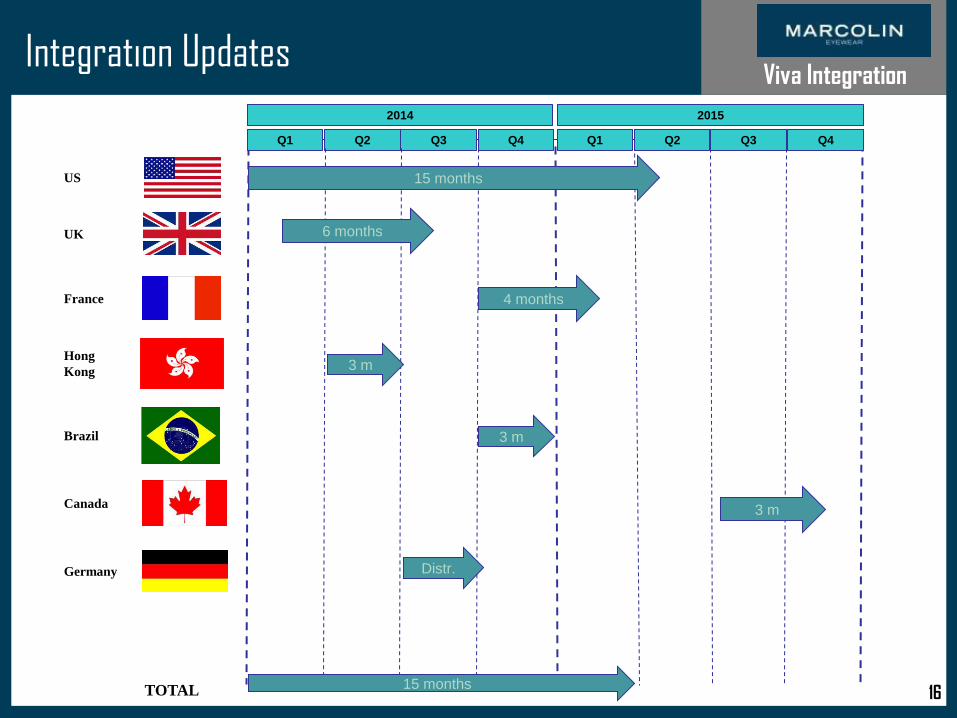
Integration Updates
16 16
Viva Integration
TOTAL
(*)
2014 2015
Q1 Q2 Q3 Q4 Q1 Q2 Q3 Q4
US
UK
France
Hong
Kong
Brazil
Canada
Germany
15 months
6 months
4 months
3 m
3 m
3 m
Distr.
15 months
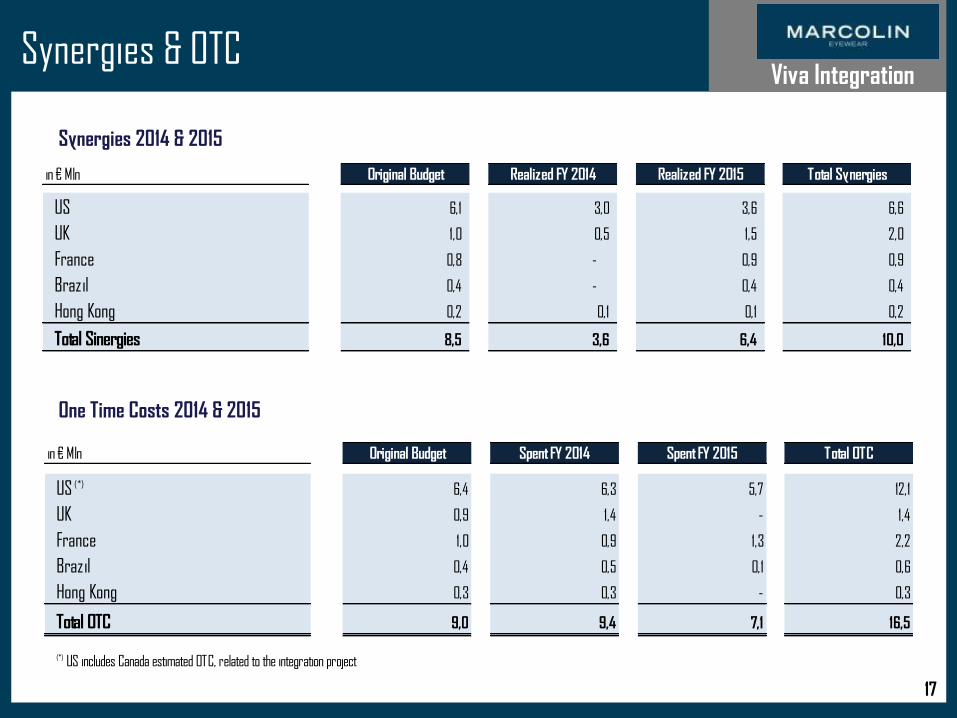
Synergies & OTC
17
Synergies 2014 & 2015
One Time Costs 2014 & 2015
Viva Integration
in € Mln Original Budget Realized FY 2014 Realized FY 2015 Total Synergies
US 6,1 3,0 3,6 6,6
UK 1,0 0,5 1,5 2,0
France 0,8 - 0,9 0,9
Brazil 0,4 - 0,4 0,4
Hong Kong 0,2 0,1 0,1 0,2
Total Sinergies 8,5 3,6 6,4 10,0
in € Mln Original Budget Spent FY 2014 Spent FY 2015 Total OTC
US (*) 6,4 6,3 5,7 12,1
UK 0,9 1,4 - 1,4
France 1,0 0,9 1,3 2,2
Brazil 0,4 0,5 0,1 0,6
Hong Kong 0,3 0,3 - 0,3
Total OTC 9,0 9,4 7,1 16,5
(*) US includes Canada estimated OTC, related to the integration project
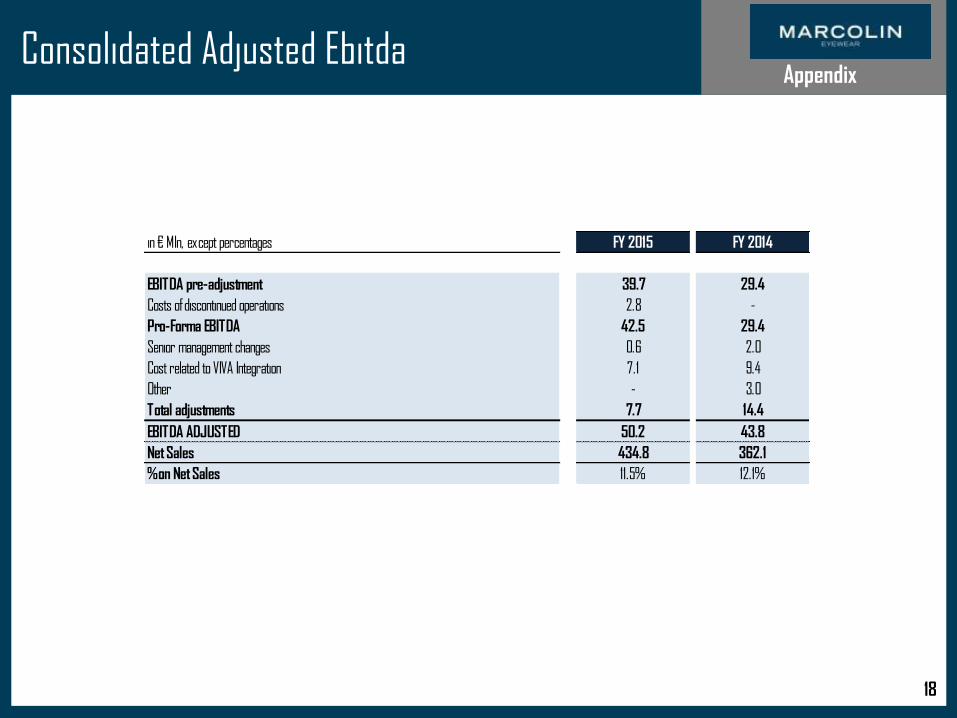
Consolidated Adjusted Ebitda
18
Appendix
in € Mln, except percentages FY 2015 FY 2014
EBITDA pre-adjustment 39.7 29.4
Costs of discontinued operations 2.8 -
Pro-Forma EBITDA 42.5 29.4
Senior management changes 0.6 2.0
Cost related to VIVA Integration 7.1 9.4
Other - 3.0
Total adjustments 7.7 14.4
EBITDA ADJUSTED 50.2 43.8
Net Sales 434.8 362.1
% on Net Sales 11.5% 12.1%
Investor relation
Marcolin Contacts:
Sergio Borgheresi
CFO
+39 0437 777204
Rami Saideh
CAO
+39 0437 777240
19