Embed Size (px)
Citation preview

Specialist Banking Asset Management Wealth & Investment
Investec strategic report incorporating governance, sustainability and the renumeration report
V.2
AR
| 2017
2017
Annual Report
Investec risk and BaselPillar III disclosures reportVolume 2

1Investec integrated annual report 2017
This report covers all our operations across the various geographies in which we operate and has been structured to provide stakeholders with relevant financial and non-financial information.
he 2017 integrated annual report covers
the period 1 April 2016 to 31 March 2017 and provides an overview of the Investec group
T
Volume 1 Volume 1
2 31Volume 1 Volume 2 Volume 3STRATEGIC REPORT INCORPORATING GOVERNANCE, SUSTAINABILITY AND REMUNERATION REPORT
RISK AND BASEL PILLAR III DISCLOSURES
ANNUAL FINANCIAL STATEMENTS
2 Investec integrated annual report 2017
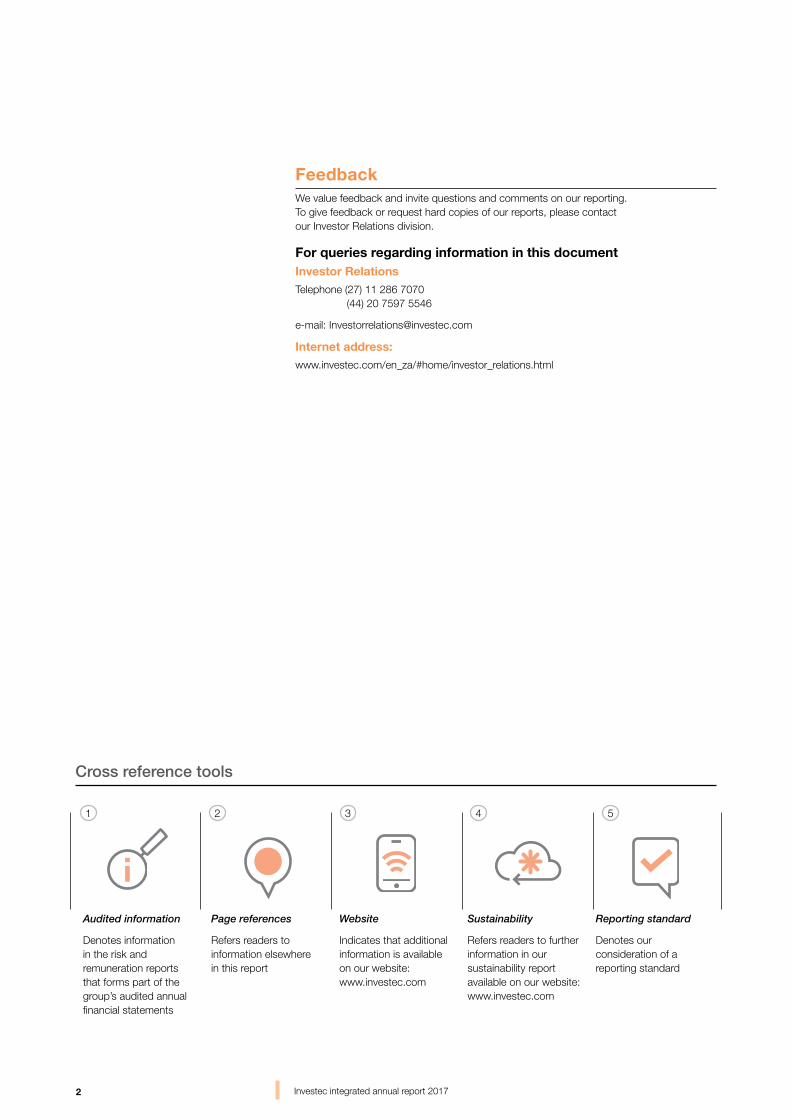
Cross reference tools
1 2 3 4 5
Feedback We value feedback and invite questions and comments on our reporting. To give feedback or request hard copies of our reports, please contact our Investor Relations division.
For queries regarding information in this documentInvestor RelationsTelephone (27) 11 286 7070 (44) 20 7597 5546
e-mail: [email protected]
Internet address:www.investec.com/en_za/#home/investor_relations.html
Audited information
Denotes information in the risk and remuneration reports that forms part of the group’s audited annual financial statements
Page references
Refers readers to information elsewhere in this report
Website
Indicates that additional information is available on our website: www.investec.com
Sustainability
Refers readers to further information in our sustainability report available on our website: www.investec.com
Reporting standard
Denotes our consideration of a reporting standard

3Investec integrated annual report 2017
Contents
01Risk and Basel Pillar III disclosuresCorporate information 4
Risk management 6
Credit ratings 98
Internal Audit 99
Compliance 100
Definitions 102
4 Investec integrated annual report 2017
Corporate information
Secretary and registered officeInvestec plcDavid Miller2 Gresham StreetLondon EC2V 7QPUnited KingdomTelephone (44) 20 7597 4000Facsimile (44) 20 7597 4491
Investec LimitedNiki van Wyk100 Grayston DriveSandown Sandton 2196PO Box 785700 Sandton 2196Telephone (27) 11 286 7000Facsimile (27) 11 286 7966
Internet addresswww.investec.com
Registration numberInvestec plcRegistration number 3633621
Investec LimitedRegistration number 1925/002833/06
AuditorsErnst & Young LLPErnst & Young Inc.
Registrars in the UKComputershare Investor Services plcThe PavilionsBridgwater RoadBristol BS99 6ZZUnited KingdomTelephone (44) 370 707 1077
Transfer secretaries in South AfricaComputershare Investor Services (Pty) LtdRosebank Towers, 15 Biermann AvenueRosebank 2196PO Box 61051Marshalltown 2107Telephone (27) 11 370 5000
DirectorateExecutive directorsStephen Koseff (chief executive officer)Bernard Kantor (managing director)Glynn R Burger (group risk and finance director)Hendrik J du Toit (chief executive officer, Investec Asset Management)
Non-executive directorsFani Titi (chairman)Zarina BM BassaLaurel C BowdenCheryl A CarolusPerry KO Crosthwaite (senior independent director)David FriedlandCharles R JacobsIan R KantorLord Malloch-Brown KCMGKhumo L ShuenyanePeter RS Thomas
For contact details for Investec offices internationally refer to pages 148 to 150 in volume three.
Investec plc and Investec Limited

01 Risk and Basel Pillar IIIdisclosures

6 Investec integrated annual report 2017
Risk and
Basel P
illar III disclosures
01 Risk management
Group Risk Management objectives are to:• Ensure adherence to our risk
management culture
• Ensure the business operates within the board-approved risk appetite
• Support the long-term sustainability of the group by providing an established, independent framework for identifying, evaluating, monitoring and mitigating risk
• Set, approve and monitor adherence to risk parameters and limits across the group and ensure they are implemented and adhered to consistently
• Aggregate and monitor our exposure across risk classes
• Coordinate risk management activities across the organisation, covering all legal entities and jurisdictions
• Give the boards reasonable assurance that the risks we are exposed to are identified and appropriately managed and controlled
• Run appropriate risk committees, as mandated by the board.
Overview of disclosure requirementsRisk disclosures provided in line with the requirements of International Financial Reporting Standard 7 Financial Instruments: Disclosures (IFRS 7) and disclosures on capital required by International Accounting Standard 1 Presentation of Financial Statements (IAS 1) are included within this section of the integrated annual report on pages 9 to 98 with further disclosures provided within the annual financial statements section in volume three.
All sections, paragraphs, tables and graphs on which an audit opinion is expressed are marked as audited.
Information provided in this section of the integrated annual report is prepared on an Investec DLC consolidated basis (i.e. incorporating the results of Investec plc and Investec Limited), unless otherwise stated.
The risk disclosures comprise certain of Investec Limited’s and Investec plc’s Pillar III disclosures as required in terms of Regulation 43 of the regulations relating to banks in South Africa and under the Capital Requirements Regulation pertaining to banks in the UK.
The group also publishes Pillar III and other risk information for its ‘silo’ entity holding companies and its significant banking subsidiaries on a consolidated basis. This information is contained in the respective annual financial statements and separate Pillar III reports (where applicable) for those respective entities.
Statement from the chairman of the group risk and capital committeePhilosophy and approach to risk management
The board risk and capital committee (comprising both executive and non-executive directors) meets six times per annum and approves the overall risk appetite for the Investec group. The group’s risk appetite statement sets broad parameters relating to the board’s expectations around performance, business stability and risk management. The board ensures that there are appropriate resources to manage the risk arising from running our businesses.
Our comprehensive risk management process involves identifying, quantifying, managing and mitigating the risks associated with each of our businesses.
Risk awareness, control and compliance are embedded in all our day-to-day activities. As fundamental to our values, we have a strong and embedded risk and capital management culture.
Group Risk Management monitors, manages and reports on our risks to ensure that they are within the stated risk appetite mandated by the board of directors through the board risk and capital committee.
We monitor and control risk exposure through independent credit, market, liquidity, operational, legal risk, internal audit and compliance teams. This approach is core to assuming a tolerable risk and reward profile, helping us to pursue controlled growth across our business.
Group Risk Management operates within an integrated geographical and divisional structure, in line with our management approach, ensuring that the appropriate processes are used to address all risks across the group. There are specialist divisions in the UK and South Africa and smaller risk divisions in other regions tasked with promoting sound risk management practices.
Risk Management units are locally responsive yet globally aware. This helps to ensure that all initiatives and businesses operate within our defined risk parameters and objectives, continually seeking new ways to enhance techniques.
We believe that the risk management systems and processes we have in place are adequate to support the group’s strategy (as explained on page 14 in volume one) and allow the group to operate within its risk appetite tolerance as set out on page 11.
This volume of our integrated annual report, explains in detail our approach to managing our business within our risk appetite tolerance, across all principal aspects of risk.
A summary of the year in review from a risk perspectiveExecutive management is intimately involved in ensuring stringent management of risk, liquidity, capital and conduct. We continue to seek to achieve an appropriate balance between risk and reward in our business, taking cognisance of all stakeholders’ interests.
Although the operating environment continues to present challenges and political uncertainty in the group’s core geographies, the group was able to maintain sound asset performance and risk metrics throughout the year in review. The group remained within the risk appetite limits/targets across the various risk disciplines, with only a few exceptions that were noted and approved by the board. Our risk appetite framework as set out on
7Investec integrated annual report 2017
Risk and
Basel P
illar III disclosures
01Risk management(continued)
page 11 continues to be assessed in light of prevailing market conditions and group strategy.
In the year under review, the UK voted to leave the European Union. So far the UK economy has remained resilient, reflected in the levels of client activity we continue to see. We have benefited from increased customer flow transactions on the back of currency hedging activity in response to fluctuations in the Pound. We are closely monitoring political developments and considering any changes we may need to make to adapt to the new legal and regulatory landscape that emerges.
Investec Bank plc, the group’s banking subsidiary in the UK, has a long-term rating of A2 (stable outlook) from Moody’s and BBB (stable outlook) from Fitch. In April 2016, Investec plc’s long-term issuer rating was upgraded one notch to Baa1 (stable outlook) from Baa2.
In South Africa, following the government cabinet reshuffle and change of Finance Minister, S&P downgraded South Africa’s sovereign foreign currency credit rating by two notches to BB+ with a negative outlook and the local currency rating was lowered by one notch to BBB- with a negative outlook. Fitch downgraded South Africa’s foreign currency and local currency ratings to BB+ with a stable outlook. Moody’s announced that South Africa had been placed on review for a downgrade and they are still in a window period to announce a decision.
Following the sovereign downgrade, the larger local banks together with Investec Bank Limited’s long-term foreign currency ratings were also downgraded and are now Baa2 from Moody’s and BB+ from Fitch and S&P.
Our core loan book growth over the year in home currencies was 8.4% in South Africa, and 10.5% in the UK. On a currency neutral basis, excluding the sharp depreciation of the Pound following the Brexit referendum, growth in the UK book was approximately 6.6%. Growth in our books has been diversified across our residential owner-occupied mortgage portfolios, private client and corporate client lending portfolios, with loan to values at conservative levels and gross asset margins broadly in line with the prior year.
Our credit exposures are to a select target market comprising high-income and high net worth individuals, established corporates, and medium-sized enterprises. Our risk appetite continues to favour lower risk, income-based lending, with exposures well collateralised and credit risk taken over a short to medium term.
Our focus over the past few years to realign and rebalance our portfolios in line with our risk appetite framework is reflected in the relative changes in asset classes on our balance sheet; showing an increase in private client and corporate and other lending, and a reduction in lending collateralised by property as a proportion of our book. Our core loan book remains well diversified with commercial rent producing property loans comprising approximately 13% of the book, other lending collateralised by property 6%, high net worth and private client lending 38% and corporate lending 43% (with most industry concentrations well below 5%).
The group has minimal exposure to the agriculture sector in South Africa, and our overall group exposure to mining and resources amounts to 2% of our credit and counterparty exposures.
Overall net defaults of the group are at a manageable level, amounting to 6.8% and 8.7% of our tier 1 equity in Investec Limited and Investec plc respectively, with total impairments amounting to 15.7% of our group pre-provision income. The percentage of default loans (net of impairments but before taking collateral into account) to core loans and advances amounted to 1.22% (2016: 1.54%). The ratio of collateral to default loans (net of impairments) remains satisfactory at 1.63 times (2016: 1.35 times).
We reported an increase in the level of impairments taken on our South African portfolio, but remain comfortable with the overall performance of the book, as the credit loss ratio amounts to 0.29%. We reported a moderate increase in defaults which was attributable to a few clients who experienced financial difficulty. We did not however, experience ‘stress’ across the portfolio as these defaults were in unrelated sectors. Increases in interest rates over the past two years in South Africa have had little impact on the performance of our book, as our target market is less sensitive to the moderate interest rate moves incurred to date. A tough macro-economic environment, volatile markets and political uncertainty have also destabilised the environment. Given the weaker growth outlook in South Africa, it is likely that defaults could increase further, although we would still expect our credit loss ratio to remain within our long-term average trend of 30bps to 40bps.
In the UK, the asset quality trends continue to reflect the solid performance of the book. Gross defaults in the UK, predominantly relating to legacy exposures, decreased to £260 million from £314 million at 31 March 2016. Impairments on our legacy portfolio continue to reduce from
£68 million to £54 million with the credit loss ratio in our UK and other businesses improving to 0.90%. Impairments on our core ‘ongoing’ UK and Other book remain low and make up only 0.27% (£21 million) of the credit loss ratio.
Our legacy portfolio in the UK has been actively reduced from £583 million at 31 March 2016 to £476 million largely through asset sales, redemptions and write-offs. Non-performing exposures are significantly impaired and total net defaults in the legacy book amount to £125 million.
The remaining legacy portfolio will continue to be managed down, although given the uncertainty in the UK, this could take longer than management’s original expectation of two to four years.
Our investment portfolios in the UK and South Africa delivered a sound performance. Overall, we remain comfortable with the performance of the major portion of our equity investment portfolios which comprise 4.2% of total assets.
Market risk within our trading portfolio remains modest with value at risk and stress testing scenarios remaining at prudent levels. Proprietary risk is limited. Potential losses that could arise in our trading book portfolio when stress tested under extreme market conditions (i.e. per extreme value theory) amount to less than 0.1% of total operating income.
We continue to spend much time and effort focusing on operational, reputational, conduct, recovery and resolution risks. Current priorities in the UK include the link between remuneration and conduct, as well as how we measure risk culture and the risk assessment process from a conduct perspective.
Financial and cybercrime remain high priorities, and Investec continually aims to strengthen its systems and controls in order to manage cyber risk as well as meet its regulatory obligations to combat money laundering, bribery and corruption.
Investec has continued to maintain a sound balance sheet with a low gearing ratio of 9.5 times and a core loans to equity ratio of 4.7 times. Our current leverage ratios for Investec Limited and Investec plc are at 7.3% and 7.8% respectively.
We have always held capital well in excess of regulatory requirements and we intend to perpetuate this philosophy. Investec plc’s common equity tier 1 ratio improved to 11.3% at 31 March 2017 while Investec Limited’s was 9.9%, just shy of our 10% target for common equity tier 1. Capital continued to grow and we are comfortable that credit growth is in line with our risk appetite framework and supported by
8 Investec integrated annual report 2017
Risk and
Basel P
illar III disclosures
01 Risk management(continued)
sound risk metrics. We believe that a common equity tier 1 ratio in excess of 10% is appropriate for our businesses, given our sound leverage ratios and we will continue to build our business in a manner that achieves this target.
In South Africa, we have applied to the SARB for approval of our advanced internal ratings approach (AIRB). Subject to the SARB approval, we expect to implement AIRB in 2018 for the purpose of calculating credit risk regulatory capital. Through the preparation process for the application Investec has enhanced a number of rating systems and risk quantification models. Since AIRB was operationalised we have seen significant benefits from using these rating systems in the management of credit risk and the quantification of internal capital. In addition we are expecting a positive impact on capital ratios in applying this approach.
In December 2016, the Bank of England (BoE) set the preferred resolution strategy for Investec Bank plc as the bank insolvency (special administration) procedure under the Investment Bank Special Administration Regulations 2011 – otherwise known as ‘modified insolvency’. As the resolution strategy is ‘modified insolvency’, the BoE has therefore set Investec Bank plc’s MREL requirement as equal to its regulatory capital requirements.
Holding a high level of readily available, high quality liquid assets remains paramount in the management of our balance sheet. We continue to maintain a low reliance on interbank wholesale funding to fund core lending asset growth. Cash and near cash balances amounted to £12.0 billion at year end, representing 41.4% of customer deposits.
We conservatively increased our liquidity levels in the UK ahead of the Brexit referendum in June 2016, and during the second half of the year, we managed this down through a combination of asset growth and liability management to achieve largely normalised balance sheet liquidity levels by 31 March 2017. Our weighted average cost of funding over the year continued to reduce. As explained in detail on page 70, the LCR reported to the PRA at 31 March 2017 was 654% for Investec plc and 616% for Investec Bank plc (solo basis). Based on our own interpretations and in line with the BCBS’ final recommendations (BCBS 295), Investec plc and Investec Bank plc (solo basis) comfortably exceed the 100% minimum level for the NSFR.
In South Africa, we maintained a strong liquidity position and continued to hold high levels of surplus liquid assets. During the past financial year the liquidity risk
profile of the balance sheet has improved. Investec grew its total customer deposits by 8.5% from R280 billion to R303 billion at 31 March 2017. Our Private Bank and Cash Investments fund raising channels grew deposits by 13% to R124 billion over the financial year. Over the same period the wholesale channels remained flat at R179 billion. This included several successful senior unsecured bond issues totalling R4.6 billion. As a result Investec Limited decreased its reliance on wholesale funding from 60.7% to 59.1% over the financial year.
The impact on our liquidity ratios was positive. The three month average LCR for Investec Bank Limited solo increased from 117.3% to 130.0% which is well above the minimum level of 80% required. By January 2019 the LCR minimum requirement moves to 100% and we remain confident of our ability to comfortably exceed this requirement whilst continuing to meet planned asset growth targets. The NSFR will also have to exceed 100% by January 2018. We are well positioned to meet this regulatory liquidity measure as currently our ratios exceed this requirement.
In South Africa, eighteen banks including Investec Limited, have been cited on allegations of collusion in relation to foreign exchange. Despite seeking further details of what the precise allegations are against us, we have not yet received the relevant information. The Competition Commission’s case against Investec Limited is confined to the alleged conduct of a single trader. This particular trader dealt with interbank clients. Revenue from forex trading activities has averaged below 1% of the South African bank’s total revenues over the past 10 years. At Investec, sound corporate governance is embedded in our values, culture, processes, functions and organisational structure. Our values require, inter alia, that employees behave with integrity and treat customers fairly. Investec does not tolerate any behaviour in contravention of its value system, the law or regulatory requirements including the Competition Act, the FX Market Code of Conduct or the applicable internal Investec policies. Investec actively monitors compliance with these requirements including compliance with the relevant South African Reserve Bank Code of Conduct with respect to, inter alia, conducting over-the-counter and FX transactions.
Investec’s stress testing framework is well embedded in its operations and is designed to identify and regularly test the group’s key ‘vulnerabilities under stress’. A fundamental part of the stress testing process is a full and comprehensive analysis of all the group’s material business activities, incorporating views from risk, the business and the executive – a
process called the ‘bottom-up’ analysis. Resulting from the ‘bottom-up’ analysis, the Investec-specific stress scenarios are designed to specifically test the unique attributes of the group’s portfolio. The key is to understand the potential threats to our sustainability and profitability and thus a number of risk scenarios have been developed and assessed. These Investec specific stress scenarios form an integral part of our capital planning process. The stress testing process also informs the risk appetite review process and the management of risk appetite limits and is a key risk management tool of the group. This process allows the group to identify underlying risks and manage them accordingly.
During the year, a number of new stress scenarios were considered and incorporated into our processes. These included, for example, the impact of a global trade war resulting from political shifts in advanced economies towards protectionist policies; and a potential Brexit downside case.
The board, through its various risk and capital committees, continued to assess the impact of its principal risks and the above mentioned stress scenarios on its business. The board has concluded that the group has robust systems and processes in place to manage these risks, and that while under a severe stress scenario, business activity would be very subdued, the group would continue to maintain adequate liquidity and capital balances to support the continued operation of the group.
Our viability statement is provided in volume one on pages 147 to 149.
ConclusionThe current regulatory, political and economic environment continues to provide new challenges to our business, however, we are comfortable that we have robust risk management processes and systems in place which provide a strong foundation to the board and the business to manage and mitigate risks within our risk appetite tolerance framework.
Signed on behalf of the board
Stephen Koseff
Chairman of the group risk and capital committee
9 June 2017
9Investec integrated annual report 2017
Risk and
Basel P
illar III disclosures
01Risk management(continued)
The group maintained a strong liquidity position well in excess of regulatory and internal policy requirements throughout the year
Geographic summary of the year in review from a risk perspective
This section should be read in conjunction with, and against the background provided in, the overview of the operating environment section on pages 32 to 37 in volume one.
Detailed information on key developments during the financial year in review is provided in the sections that follow:
Refer to pages 23 and 24, page 60 and pages 70 and 71, with a high-level geographic summary of the most salient aspects provided below.
UK and Other Credit risk We continue to realign and rebalance our portfolio in line with our stated risk appetite, which is reflected in the growth in corporate client exposures and private client mortgages and the decline in lending collateralised by property exposures as a percentage of overall portfolio. Continued progress has been made during the year in our strategic portfolio rebalancing through active portfolio management and the consistent adherence to our risk appetite statement.
Underlying core assets continue to perform well. Net core loans and advances increased by 10.5% from £7.8 billion at 31 March 2016 to £8.6 billion at 31 March 2017.
The improving asset quality trends continue to reflect the solid performance of the book. Default loans (net of impairments) have decreased from 2.19% to 1.55% of core loans and advances. The credit loss ratio is at 0.90% (2016: 1.13%), impacted by further impairments on the legacy portfolio. Impairments on our core 'ongoing' UK and Other book remain low and make up only 0.27% (£21 million) of the credit loss ratio.
Traded market riskWe continue to manage to a very low level of market risk with VaR at £0.5 million at 31 March 2017. We continue to see strong growth in client activity across the interest rate and foreign exchange corporate sales desks within Treasury Products and Distribution.
Market risk exposures across all asset classes have on average remained low throughout the year.
Volatility in the forex markets post Brexit resulted in increased client activity and interest rate hedging was again supported by good client-driven deal flow.
Balance sheet riskCash and near cash balances at 31 March 2017 amounted to £5.0 billion (2016: £5.1 billion) with total UK customer deposits increasing by 2.0% to £11.0 billion (2016: £10.8 billion). The LCR reported to the PRA at 31 March 2017 was 654% for Investec plc and 616% for Investec Bank plc (solo basis). Based on our own interpretations and in line with the BCBS’ final recommendations (BCBS 295), Investec plc and Investec Bank plc (solo basis comfortably exceed the 100% minimum level for the NSFR.
Southern AfricaCredit risk Net core loans and advances grew by 8.4% to R236 billion at 31 March 2017 with residential owner-occupied, private client lending and corporate portfolios representing the majority of the growth for the financial year in review.
Default loans (net of impairments) as a percentage of core loans and advances amounted to 1.02% with absolute levels of defaults increasing moderately over the year in relation to a few clients who experienced financial difficulty.
Traded market riskWe continue to manage to a very low level of market risk with VaR at R4.5 million at 31 March 2017. Investec remains focused on facilitating the near-term demand of our clients and the trading desks benefited from the volatility in the markets during the year. All trading areas have kept market risk exposures at low levels throughout the year.
Balance sheet riskWe maintained a strong liquidity position and continued to hold high levels of surplus liquid assets. During the past financial year the liquidity profile of the balance sheet has improved. Our total customer deposits grew by 8.5% from R280 billion to R303 billion at 31 March 2017. Cash and near cash balances decreased by 5.9% from 1 April 2016 to R118 billion at 31 March 2017. Investec Bank Limited (solo basis) ended the financial year with the three-month average of its LCR at 130.0%, which is well ahead of the minimum regulatory level of 80% required.
10 Investec integrated annual report 2017
Risk and
Basel P
illar III disclosures
01 Risk management(continued)
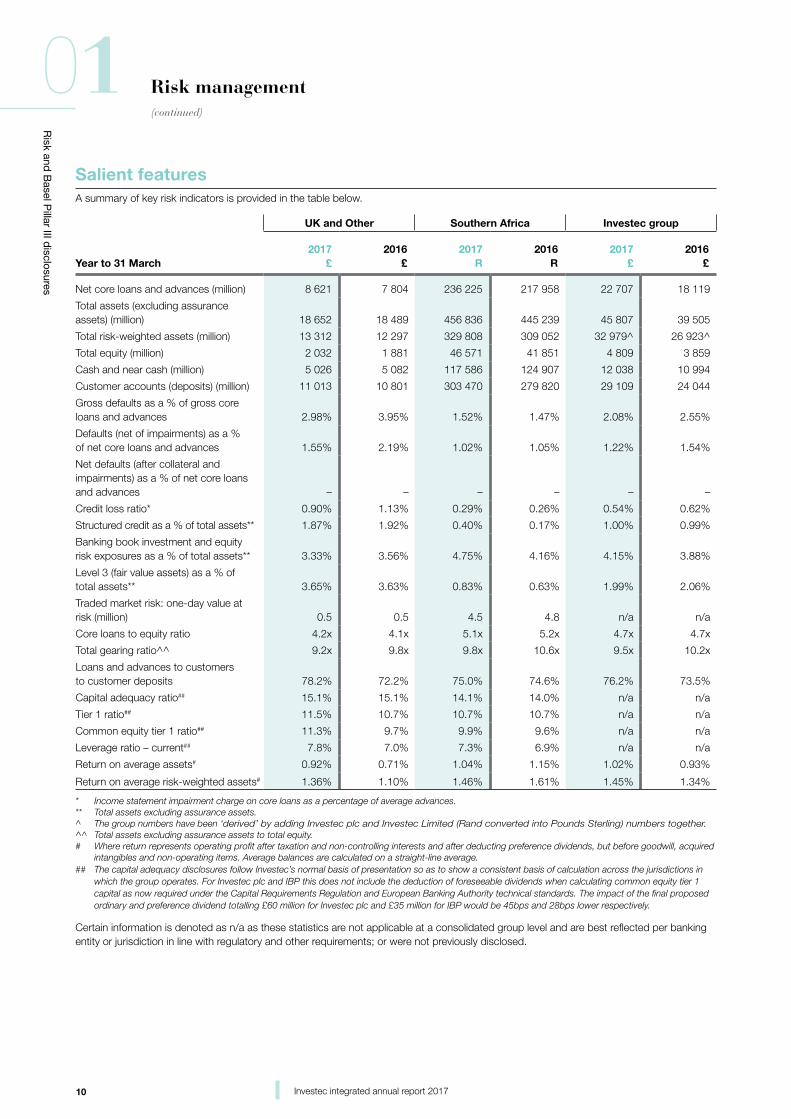
Salient featuresA summary of key risk indicators is provided in the table below.
UK and Other Southern Africa Investec group
Year to 31 March2017
£2016
£2017
R2016
R2017
£2016
£
Net core loans and advances (million) 8 621 7 804 236 225 217 958 22 707 18 119
Total assets (excluding assurance assets) (million) 18 652 18 489 456 836 445 239 45 807 39 505
Total risk-weighted assets (million) 13 312 12 297 329 808 309 052 32 979^ 26 923^
Total equity (million) 2 032 1 881 46 571 41 851 4 809 3 859
Cash and near cash (million) 5 026 5 082 117 586 124 907 12 038 10 994
Customer accounts (deposits) (million) 11 013 10 801 303 470 279 820 29 109 24 044
Gross defaults as a % of gross core loans and advances 2.98% 3.95% 1.52% 1.47% 2.08% 2.55%
Defaults (net of impairments) as a % of net core loans and advances 1.55% 2.19% 1.02% 1.05% 1.22% 1.54%
Net defaults (after collateral and impairments) as a % of net core loans and advances – – – – – –
Credit loss ratio* 0.90% 1.13% 0.29% 0.26% 0.54% 0.62%
Structured credit as a % of total assets** 1.87% 1.92% 0.40% 0.17% 1.00% 0.99%
Banking book investment and equity risk exposures as a % of total assets** 3.33% 3.56% 4.75% 4.16% 4.15% 3.88%
Level 3 (fair value assets) as a % of total assets** 3.65% 3.63% 0.83% 0.63% 1.99% 2.06%
Traded market risk: one-day value at risk (million) 0.5 0.5 4.5 4.8 n/a n/a
Core loans to equity ratio 4.2x 4.1x 5.1x 5.2x 4.7x 4.7x
Total gearing ratio^^ 9.2x 9.8x 9.8x 10.6x 9.5x 10.2x
Loans and advances to customers to customer deposits 78.2% 72.2% 75.0% 74.6% 76.2% 73.5%
Capital adequacy ratio## 15.1% 15.1% 14.1% 14.0% n/a n/a
Tier 1 ratio## 11.5% 10.7% 10.7% 10.7% n/a n/a
Common equity tier 1 ratio## 11.3% 9.7% 9.9% 9.6% n/a n/a
Leverage ratio – current## 7.8% 7.0% 7.3% 6.9% n/a n/a
Return on average assets# 0.92% 0.71% 1.04% 1.15% 1.02% 0.93%
Return on average risk-weighted assets# 1.36% 1.10% 1.46% 1.61% 1.45% 1.34%
* Income statement impairment charge on core loans as a percentage of average advances.** Total assets excluding assurance assets.^ The group numbers have been ‘derived’ by adding Investec plc and Investec Limited (Rand converted into Pounds Sterling) numbers together.^^ Total assets excluding assurance assets to total equity.# Where return represents operating profit after taxation and non-controlling interests and after deducting preference dividends, but before goodwill, acquired
intangibles and non-operating items. Average balances are calculated on a straight-line average.## The capital adequacy disclosures follow Investec’s normal basis of presentation so as to show a consistent basis of calculation across the jurisdictions in
which the group operates. For Investec plc and IBP this does not include the deduction of foreseeable dividends when calculating common equity tier 1 capital as now required under the Capital Requirements Regulation and European Banking Authority technical standards. The impact of the final proposed ordinary and preference dividend totalling £60 million for Investec plc and £35 million for IBP would be 45bps and 28bps lower respectively.
Certain information is denoted as n/a as these statistics are not applicable at a consolidated group level and are best reflected per banking entity or jurisdiction in line with regulatory and other requirements; or were not previously disclosed.
11Investec integrated annual report 2017
Risk and
Basel P
illar III disclosures
01Risk management(continued)
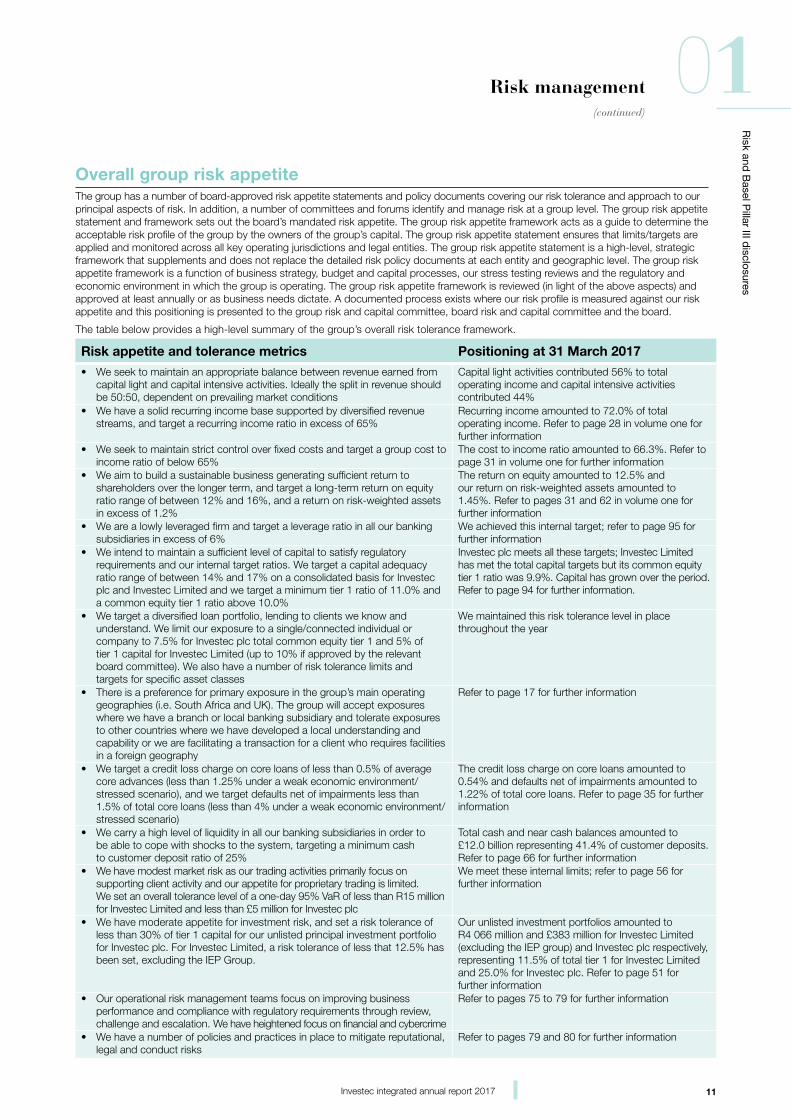
Overall group risk appetiteThe group has a number of board-approved risk appetite statements and policy documents covering our risk tolerance and approach to our principal aspects of risk. In addition, a number of committees and forums identify and manage risk at a group level. The group risk appetite statement and framework sets out the board’s mandated risk appetite. The group risk appetite framework acts as a guide to determine the acceptable risk profile of the group by the owners of the group’s capital. The group risk appetite statement ensures that limits/targets are applied and monitored across all key operating jurisdictions and legal entities. The group risk appetite statement is a high-level, strategic framework that supplements and does not replace the detailed risk policy documents at each entity and geographic level. The group risk appetite framework is a function of business strategy, budget and capital processes, our stress testing reviews and the regulatory and economic environment in which the group is operating. The group risk appetite framework is reviewed (in light of the above aspects) and approved at least annually or as business needs dictate. A documented process exists where our risk profile is measured against our risk appetite and this positioning is presented to the group risk and capital committee, board risk and capital committee and the board.
The table below provides a high-level summary of the group’s overall risk tolerance framework.
Risk appetite and tolerance metrics Positioning at 31 March 2017
• We seek to maintain an appropriate balance between revenue earned from capital light and capital intensive activities. Ideally the split in revenue should be 50:50, dependent on prevailing market conditions
Capital light activities contributed 56% to total operating income and capital intensive activities contributed 44%
• We have a solid recurring income base supported by diversified revenue streams, and target a recurring income ratio in excess of 65%
Recurring income amounted to 72.0% of total operating income. Refer to page 28 in volume one for further information
• We seek to maintain strict control over fixed costs and target a group cost to income ratio of below 65%
The cost to income ratio amounted to 66.3%. Refer to page 31 in volume one for further information
• We aim to build a sustainable business generating sufficient return to shareholders over the longer term, and target a long-term return on equity ratio range of between 12% and 16%, and a return on risk-weighted assets in excess of 1.2%
The return on equity amounted to 12.5% and our return on risk-weighted assets amounted to 1.45%. Refer to pages 31 and 62 in volume one for further information
• We are a lowly leveraged firm and target a leverage ratio in all our banking subsidiaries in excess of 6%
We achieved this internal target; refer to page 95 for further information
• We intend to maintain a sufficient level of capital to satisfy regulatory requirements and our internal target ratios. We target a capital adequacy ratio range of between 14% and 17% on a consolidated basis for Investec plc and Investec Limited and we target a minimum tier 1 ratio of 11.0% and a common equity tier 1 ratio above 10.0%
Investec plc meets all these targets; Investec Limited has met the total capital targets but its common equity tier 1 ratio was 9.9%. Capital has grown over the period. Refer to page 94 for further information.
• We target a diversified loan portfolio, lending to clients we know and understand. We limit our exposure to a single/connected individual or company to 7.5% for Investec plc total common equity tier 1 and 5% of tier 1 capital for Investec Limited (up to 10% if approved by the relevant board committee). We also have a number of risk tolerance limits and targets for specific asset classes
We maintained this risk tolerance level in place throughout the year
• There is a preference for primary exposure in the group’s main operating geographies (i.e. South Africa and UK). The group will accept exposures where we have a branch or local banking subsidiary and tolerate exposures to other countries where we have developed a local understanding and capability or we are facilitating a transaction for a client who requires facilities in a foreign geography
Refer to page 17 for further information
• We target a credit loss charge on core loans of less than 0.5% of average core advances (less than 1.25% under a weak economic environment/stressed scenario), and we target defaults net of impairments less than 1.5% of total core loans (less than 4% under a weak economic environment/stressed scenario)
The credit loss charge on core loans amounted to 0.54% and defaults net of impairments amounted to 1.22% of total core loans. Refer to page 35 for further information
• We carry a high level of liquidity in all our banking subsidiaries in order to be able to cope with shocks to the system, targeting a minimum cash to customer deposit ratio of 25%
Total cash and near cash balances amounted to £12.0 billion representing 41.4% of customer deposits. Refer to page 66 for further information
• We have modest market risk as our trading activities primarily focus on supporting client activity and our appetite for proprietary trading is limited. We set an overall tolerance level of a one-day 95% VaR of less than R15 million for Investec Limited and less than £5 million for Investec plc
We meet these internal limits; refer to page 56 for further information
• We have moderate appetite for investment risk, and set a risk tolerance of less than 30% of tier 1 capital for our unlisted principal investment portfolio for Investec plc. For Investec Limited, a risk tolerance of less that 12.5% has been set, excluding the IEP Group.
Our unlisted investment portfolios amounted to R4 066 million and £383 million for Investec Limited (excluding the IEP group) and Investec plc respectively, representing 11.5% of total tier 1 for Investec Limited and 25.0% for Investec plc. Refer to page 51 for further information
• Our operational risk management teams focus on improving business performance and compliance with regulatory requirements through review, challenge and escalation. We have heightened focus on financial and cybercrime
Refer to pages 75 to 79 for further information
• We have a number of policies and practices in place to mitigate reputational, legal and conduct risks
Refer to pages 79 and 80 for further information
12 Investec integrated annual report 2017
Risk and
Basel P
illar III disclosures
01 Risk management(continued)
An overview of our principal risksIn our daily business activities, the group enters into a number of risks that could have the potential to affect our business operations, financial performance and prospects.
These principal risks have been highlighted on pages 40 to 48 volume one.
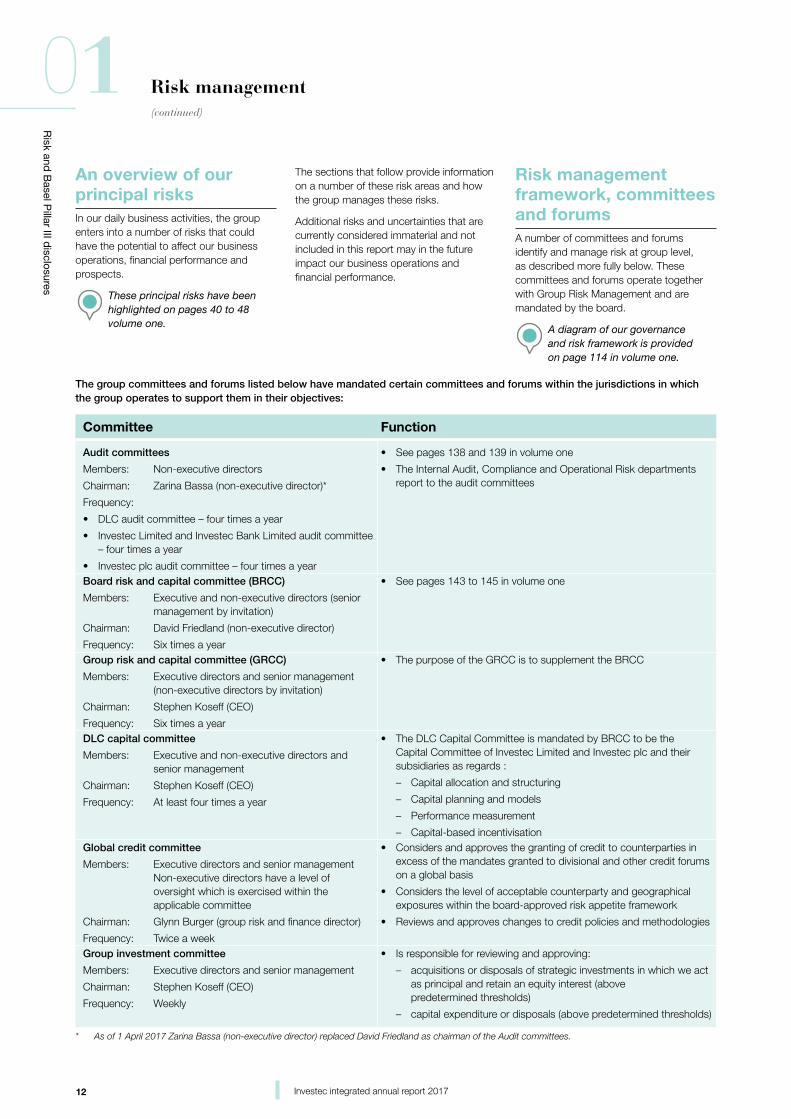
The group committees and forums listed below have mandated certain committees and forums within the jurisdictions in which the group operates to support them in their objectives:
Committee Function
Audit committees
Members: Non-executive directors
Chairman: Zarina Bassa (non-executive director)*
Frequency:
• DLC audit committee – four times a year
• Investec Limited and Investec Bank Limited audit committee – four times a year
• Investec plc audit committee – four times a year
• See pages 138 and 139 in volume one
• The Internal Audit, Compliance and Operational Risk departments report to the audit committees
Board risk and capital committee (BRCC)
Members: Executive and non-executive directors (senior management by invitation)
Chairman: David Friedland (non-executive director)
Frequency: Six times a year
• See pages 143 to 145 in volume one
Group risk and capital committee (GRCC)
Members: Executive directors and senior management (non-executive directors by invitation)
Chairman: Stephen Koseff (CEO)
Frequency: Six times a year
• The purpose of the GRCC is to supplement the BRCC
DLC capital committee
Members: Executive and non-executive directors and senior management
Chairman: Stephen Koseff (CEO)
Frequency: At least four times a year
• The DLC Capital Committee is mandated by BRCC to be the Capital Committee of Investec Limited and Investec plc and their subsidiaries as regards :
– Capital allocation and structuring
– Capital planning and models
– Performance measurement
– Capital-based incentivisationGlobal credit committee
Members: Executive directors and senior management Non-executive directors have a level of oversight which is exercised within the applicable committee
Chairman: Glynn Burger (group risk and finance director)
Frequency: Twice a week
• Considers and approves the granting of credit to counterparties in excess of the mandates granted to divisional and other credit forums on a global basis
• Considers the level of acceptable counterparty and geographical exposures within the board-approved risk appetite framework
• Reviews and approves changes to credit policies and methodologies
Group investment committee
Members: Executive directors and senior management
Chairman: Stephen Koseff (CEO)
Frequency: Weekly
• Is responsible for reviewing and approving:
– acquisitions or disposals of strategic investments in which we act as principal and retain an equity interest (above predetermined thresholds)
– capital expenditure or disposals (above predetermined thresholds)
* As of 1 April 2017 Zarina Bassa (non-executive director) replaced David Friedland as chairman of the Audit committees.
The sections that follow provide information on a number of these risk areas and how the group manages these risks.
Additional risks and uncertainties that are currently considered immaterial and not included in this report may in the future impact our business operations and financial performance.
Risk management framework, committees and forumsA number of committees and forums identify and manage risk at group level, as described more fully below. These committees and forums operate together with Group Risk Management and are mandated by the board.
A diagram of our governance and risk framework is provided on page 114 in volume one.
13Investec integrated annual report 2017
Risk and
Basel P
illar III disclosures
01Risk management(continued)
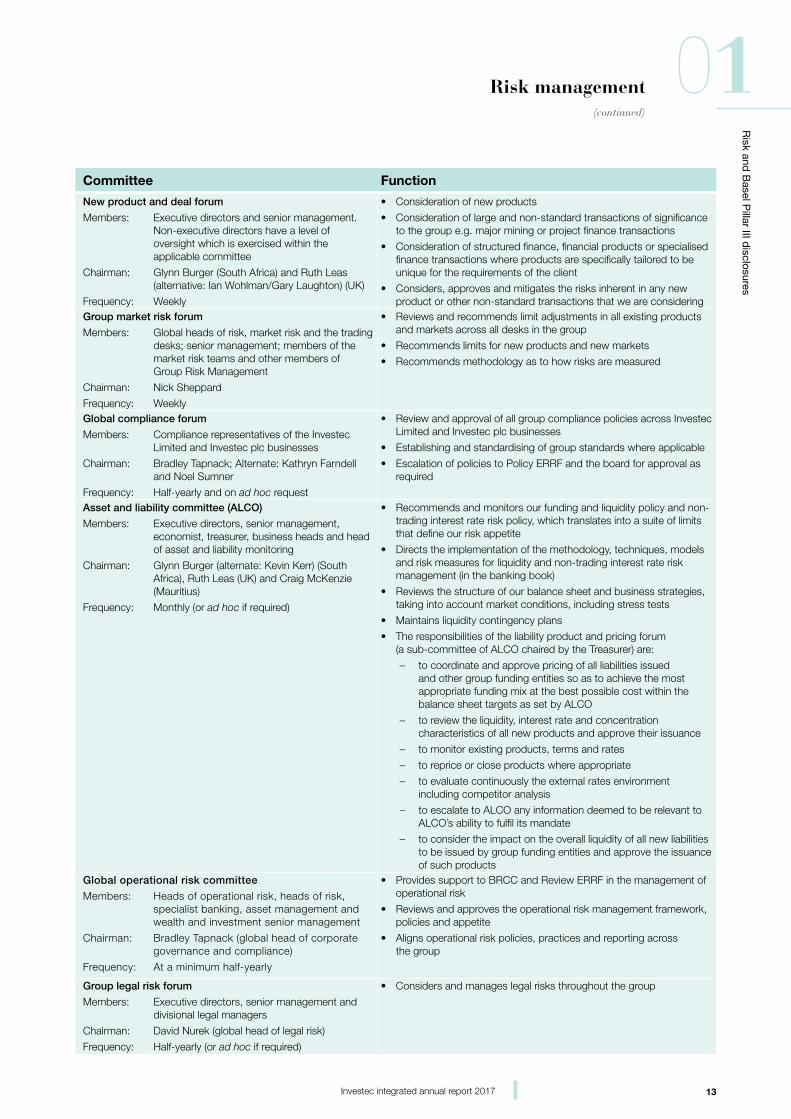
Committee Function
New product and deal forum
Members: Executive directors and senior management. Non-executive directors have a level of oversight which is exercised within the applicable committee
Chairman: Glynn Burger (South Africa) and Ruth Leas (alternative: Ian Wohlman/Gary Laughton) (UK)
Frequency: Weekly
• Consideration of new products
• Consideration of large and non-standard transactions of significance to the group e.g. major mining or project finance transactions
• Consideration of structured finance, financial products or specialised finance transactions where products are specifically tailored to be unique for the requirements of the client
• Considers, approves and mitigates the risks inherent in any new product or other non-standard transactions that we are considering
Group market risk forum
Members: Global heads of risk, market risk and the trading desks; senior management; members of the market risk teams and other members of Group Risk Management
Chairman: Nick Sheppard
Frequency: Weekly
• Reviews and recommends limit adjustments in all existing products and markets across all desks in the group
• Recommends limits for new products and new markets
• Recommends methodology as to how risks are measured
Global compliance forum
Members: Compliance representatives of the Investec Limited and Investec plc businesses
Chairman: Bradley Tapnack; Alternate: Kathryn Farndell and Noel Sumner
Frequency: Half-yearly and on ad hoc request
• Review and approval of all group compliance policies across Investec Limited and Investec plc businesses
• Establishing and standardising of group standards where applicable
• Escalation of policies to Policy ERRF and the board for approval as required
Asset and liability committee (ALCO)
Members: Executive directors, senior management, economist, treasurer, business heads and head of asset and liability monitoring
Chairman: Glynn Burger (alternate: Kevin Kerr) (South Africa), Ruth Leas (UK) and Craig McKenzie (Mauritius)
Frequency: Monthly (or ad hoc if required)
• Recommends and monitors our funding and liquidity policy and non-trading interest rate risk policy, which translates into a suite of limits that define our risk appetite
• Directs the implementation of the methodology, techniques, models and risk measures for liquidity and non-trading interest rate risk management (in the banking book)
• Reviews the structure of our balance sheet and business strategies, taking into account market conditions, including stress tests
• Maintains liquidity contingency plans
• The responsibilities of the liability product and pricing forum (a sub-committee of ALCO chaired by the Treasurer) are:
– to coordinate and approve pricing of all liabilities issued and other group funding entities so as to achieve the most appropriate funding mix at the best possible cost within the balance sheet targets as set by ALCO
– to review the liquidity, interest rate and concentration characteristics of all new products and approve their issuance
– to monitor existing products, terms and rates
– to reprice or close products where appropriate
– to evaluate continuously the external rates environment including competitor analysis
– to escalate to ALCO any information deemed to be relevant to ALCO’s ability to fulfil its mandate
– to consider the impact on the overall liquidity of all new liabilities to be issued by group funding entities and approve the issuance of such products
Global operational risk committee
Members: Heads of operational risk, heads of risk, specialist banking, asset management and wealth and investment senior management
Chairman: Bradley Tapnack (global head of corporate governance and compliance)
Frequency: At a minimum half-yearly
• Provides support to BRCC and Review ERRF in the management of operational risk
• Reviews and approves the operational risk management framework, policies and appetite
• Aligns operational risk policies, practices and reporting across the group
Group legal risk forum
Members: Executive directors, senior management and divisional legal managers
Chairman: David Nurek (global head of legal risk)
Frequency: Half-yearly (or ad hoc if required)
• Considers and manages legal risks throughout the group
14 Investec integrated annual report 2017
Risk and
Basel P
illar III disclosures
01 Risk management(continued)
Committee Function
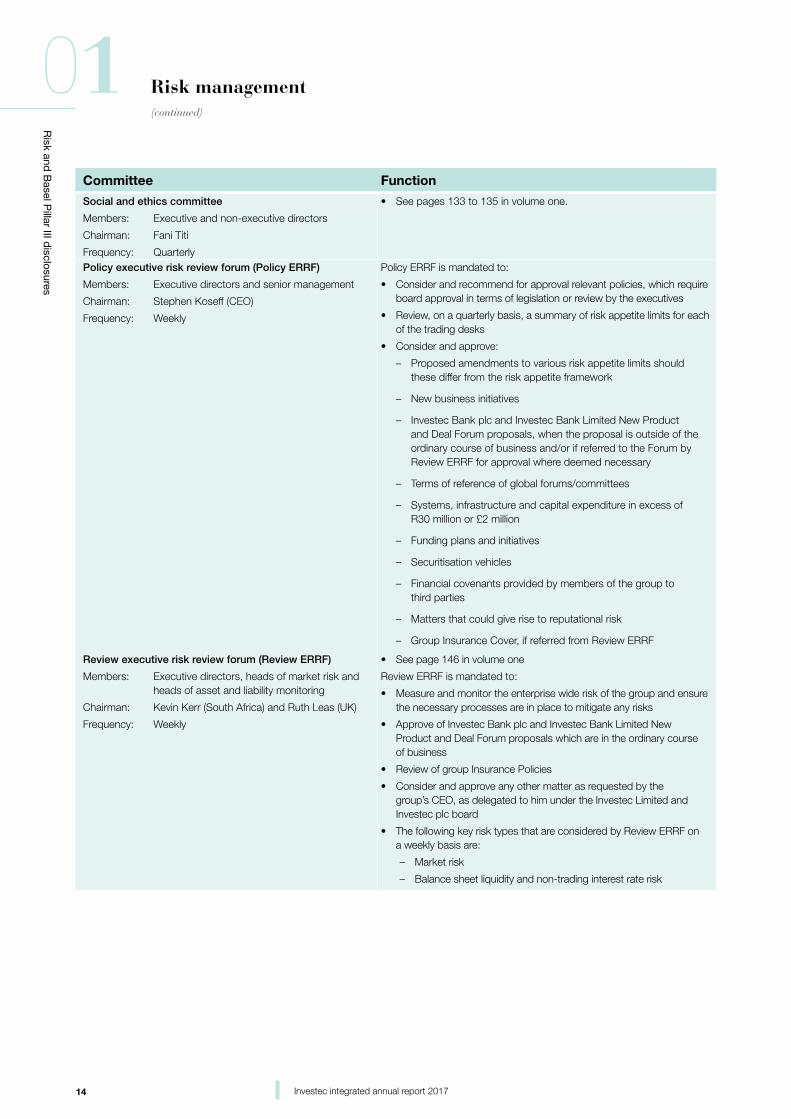
Social and ethics committee
Members: Executive and non-executive directors
Chairman: Fani Titi
Frequency: Quarterly
• See pages 133 to 135 in volume one.
Policy executive risk review forum (Policy ERRF)
Members: Executive directors and senior management
Chairman: Stephen Koseff (CEO)
Frequency: Weekly
Policy ERRF is mandated to:
• Consider and recommend for approval relevant policies, which require board approval in terms of legislation or review by the executives
• Review, on a quarterly basis, a summary of risk appetite limits for each of the trading desks
• Consider and approve:
– Proposed amendments to various risk appetite limits should these differ from the risk appetite framework
– New business initiatives
– Investec Bank plc and Investec Bank Limited New Product and Deal Forum proposals, when the proposal is outside of the ordinary course of business and/or if referred to the Forum by Review ERRF for approval where deemed necessary
– Terms of reference of global forums/committees
– Systems, infrastructure and capital expenditure in excess of R30 million or £2 million
– Funding plans and initiatives
– Securitisation vehicles
– Financial covenants provided by members of the group to third parties
– Matters that could give rise to reputational risk
– Group Insurance Cover, if referred from Review ERRF
Review executive risk review forum (Review ERRF)
Members: Executive directors, heads of market risk and heads of asset and liability monitoring
Chairman: Kevin Kerr (South Africa) and Ruth Leas (UK)
Frequency: Weekly
• See page 146 in volume one
Review ERRF is mandated to:
• Measure and monitor the enterprise wide risk of the group and ensure the necessary processes are in place to mitigate any risks
• Approve of Investec Bank plc and Investec Bank Limited New Product and Deal Forum proposals which are in the ordinary course of business
• Review of group Insurance Policies
• Consider and approve any other matter as requested by the group’s CEO, as delegated to him under the Investec Limited and Investec plc board
• The following key risk types that are considered by Review ERRF on a weekly basis are:
– Market risk
– Balance sheet liquidity and non-trading interest rate risk
15Investec integrated annual report 2017
Risk and
Basel P
illar III disclosures
01Risk management(continued)
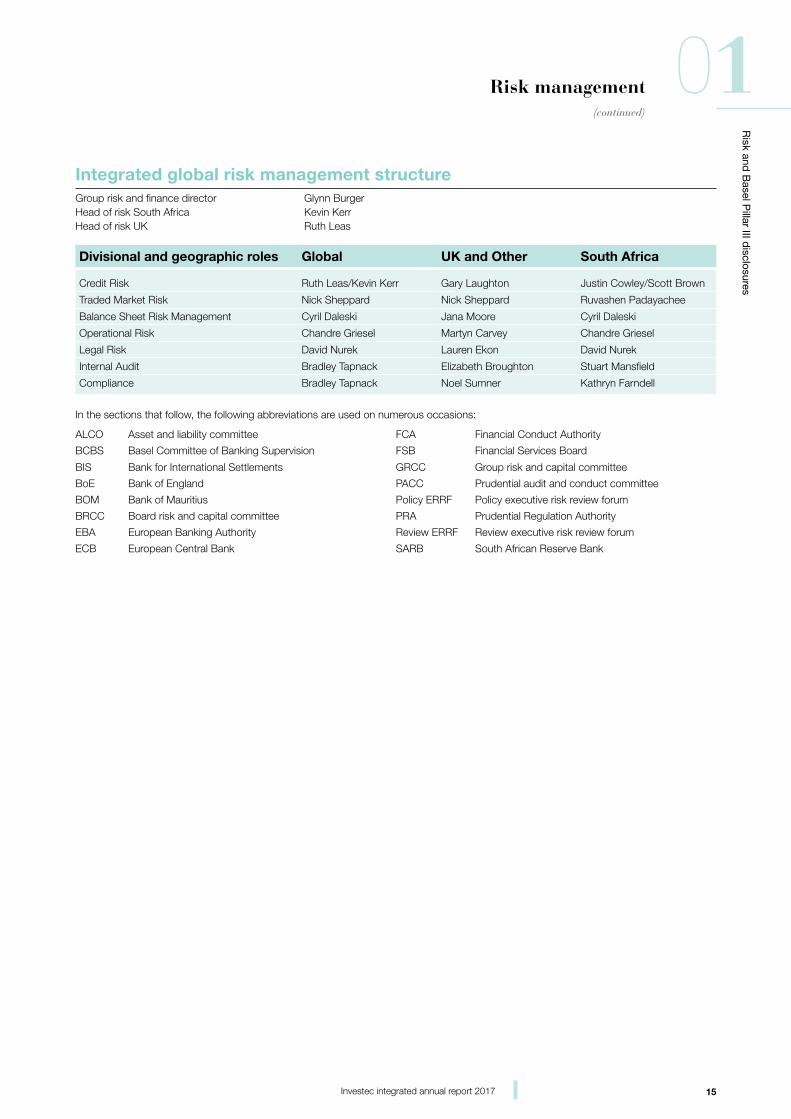
Integrated global risk management structureGroup risk and finance director Glynn BurgerHead of risk South Africa Kevin KerrHead of risk UK Ruth Leas
Divisional and geographic roles Global UK and Other South Africa
Credit Risk Ruth Leas/Kevin Kerr Gary Laughton Justin Cowley/Scott Brown
Traded Market Risk Nick Sheppard Nick Sheppard Ruvashen Padayachee
Balance Sheet Risk Management Cyril Daleski Jana Moore Cyril Daleski
Operational Risk Chandre Griesel Martyn Carvey Chandre Griesel
Legal Risk David Nurek Lauren Ekon David Nurek
Internal Audit Bradley Tapnack Elizabeth Broughton Stuart Mansfield
Compliance Bradley Tapnack Noel Sumner Kathryn Farndell
In the sections that follow, the following abbreviations are used on numerous occasions:
ALCO Asset and liability committee FCA Financial Conduct Authority
BCBS Basel Committee of Banking Supervision FSB Financial Services Board
BIS Bank for International Settlements GRCC Group risk and capital committee
BoE Bank of England PACC Prudential audit and conduct committee
BOM Bank of Mauritius Policy ERRF Policy executive risk review forum
BRCC Board risk and capital committee PRA Prudential Regulation Authority
EBA European Banking Authority Review ERRF Review executive risk review forum
ECB European Central Bank SARB South African Reserve Bank
16 Investec integrated annual report 2017
Risk and
Basel P
illar III disclosures
01 Risk management(continued)
Credit and counterparty risk management
Credit and counterparty risk description Credit and counterparty risk is defined as the risk arising from an obligor’s (typically a client or counterparty) failure to meet the terms of any agreement. Credit and counterparty risk arises when funds are extended, committed, invested, or otherwise exposed through contractual agreements, whether reflected on- or off-balance sheet.
Credit and counterparty risk arises primarily from three types of transactions:
• Lending transactions through loans and advances to clients and counterparties creates the risk that an obligor will be unable or unwilling to repay capital and/or interest on loans and advances granted to them. This category includes bank placements, where we have placed funds with other financial institutions
• Issuer risk on financial instruments where payments due from the issuer of a financial instrument may not be received
• Trading transactions, giving rise to settlement and replacement risk (collectively counterparty risk):
– Settlement risk is the risk that the settlement of a transaction does not take place as expected, with one party effecting required settlements as they fall due but not receiving the performance to which they are entitled.
– Replacement risk is the risk following defaults by the original counterparty resulting in the contract holder having to enter into a replacement contract with a second counterparty in order to fulfil the transaction.
The relevant credit committees within Investec will also consider wrong-way risk at the time of granting credit limits to each counterparty. In the banking book environment, wrong-way risk occurs where the value of collateral to secure a transaction, or guarantor, is positively correlated with the probability of default of the borrower or counterparty. For counterparty credit risk resulting from transactions in traded products (such as
OTC derivatives), wrong-way risk is defined as exposure to a counterparty that is adversely correlated with the credit quality of that counterparty. It arises when default risk and credit exposure increase together.
Credit and counterparty risk may also arise in other ways and it is the role of the global risk management functions and the various independent credit committees to identify risks falling outside these definitions.
Credit and counterparty risk governance structure To manage, measure, monitor and mitigate credit and counterparty risk, independent credit committees exist in each geography where we assume credit risk. These committees operate under board-approved delegated limits, policies and procedures. There is a high level of executive involvement and non-executive review and oversight in the credit decision-making forums. It is our policy that all centralised credit committees are comprised of voting members who are independent of the originating business unit. All decisions to enter into a transaction are based on unanimous consent.
In addition to the group credit committee, the following processes assist in managing, measuring and monitoring credit and counterparty risk:
• Day-to-day arrears management and regular arrears reporting ensure that individual positions and any potential trends are dealt with in a timely manner
• Watchlist committees, which review the management of distressed loans, potential problem loans and exposures in arrears that require additional attention and supervision
• Corporate watchlist forum, which reviews and manages exposures that may potentially become distressed as a result of changes in the economic environment or adverse share price movements, or that are vulnerable to volatile exchange rate or interest rate movements or idiosyncratic financial distress
• Arrears, default and recoveries forum which specifically reviews and manages distressed loans and potentially distressed loans for private clients. This forum also reviews and monitors counterparties who have been granted forbearance measures.
Credit and counterparty risk appetiteThe board has set a group risk appetite limit framework which regulates the maximum exposures we would be comfortable to tolerate in order to diversify and mitigate risk. This limit framework is monitored on an ongoing basis and reported to the GRCC, BRCC and the board on a regular basis. Should there be any breaches to limits, or where exposures are nearing limits, these exceptions are specifically highlighted for attention, and any remedial actions agreed.
There is a preference for primary exposure in the group’s main operating geographies (i.e. South Africa and the UK). The group will accept exposures where we have a branch or local banking subsidiary (as explained on following page) and tolerate exposures to other countries where we have a developed and local understanding and capability or we are facilitating a transaction for a client who requires facilities in a foreign geography.
Our assessment of our clients and counterparties includes consideration of their character and integrity, core competencies, track record and financial strength. A strong emphasis is placed on the historic and ongoing stability of income and cash flow streams generated by the clients. Our primary assessment method is therefore the ability of the client to meet their payment obligations.
We have little appetite for unsecured debt and require good quality collateral in support of obligations (refer to page 47 for further information).
Target clients include high net worth and/or high-income individuals, professionally qualified individuals, established corporates, small and medium enterprises, financial institutions and sovereigns. Corporates must have scale and relevance in their market, an experienced management team, able board members, strong earnings and cash flow.
We are client-centric in our approach and originate loans with the intent of holding these assets to maturity, thereby developing a ‘hands-on’ and long-standing relationship.
Interbank lending is largely reserved for those banks and institutions in the group’s core geographies of activity which are
17Investec integrated annual report 2017
Risk and
Basel P
illar III disclosures
01Risk management(continued)
systemic and highly rated. Direct exposures to cyclical industries and start-up ventures are generally avoided.
Concentration risk Concentration risk is when large exposures exist to a single client or counterparty, group of connected counterparties, or to a particular geography, asset class or industry. An example of this would be where a number of counterparties are affected by similar economic, legal, regulatory or other factors that could mean their ability to meet contractual obligations are correlated.
Concentration risk can also exist where portfolio loan maturities are clustered to single periods in time. Loan maturities are monitored on a portfolio and a transaction level by Group Risk Management, Group Lending Operations as well as the originating business units.
Credit and counterparty risk is always assessed with reference to the aggregate exposure to a single counterparty or group of related parties to manage concentration risk.
Country risk Country risk refers to the risk of lending to a counterparty operating in a particular country or the risk inherent in sovereign exposure i.e. the risk of exposure to loss caused by events in other countries. Country risk covers all forms of lending or investment activity whether to/with individuals, corporates, banks or governments. This can include geopolitical risks, transfer and convertibility risks, and the impact on the borrower’s credit profile due to local economic and political conditions.
To mitigate country risk, there is a preference for primary exposure in the group’s main operating geographies. The group will accept exposures where we have a branch or local banking subsidiary, and tolerate exposures to other countries where we are facilitating a transaction for a client who requires facilities in a foreign geography and where we have developed a local understanding and capability.
Investec’s credit risk appetite with regard to country risk is characterised by the following principles:
• Preference is to have exposure only to politically stable jurisdictions that we understand and have preferably operated in before
• There is no specific appetite for exposures outside of the group’s pre-existing core geographies or target markets
• The legal environment should be tested, have legal precedent in line with OECD standards and have good corporate governance
• In certain cases, country risk can be mitigated by taking out political risk insurance with suitable counterparties, where deemed necessary and where considered economic.
While we do not have a separate country risk committee, the relevant credit committees as well as investment committees and Policy ERRF will consider, analyse and assess the appropriate limits to be recorded when required, to assume exposure to foreign jurisdictions.
Corporate responsibility considerations Investec has a holistic approach to corporate responsibility, which runs beyond recognising our own footprint on the environment and includes our many corporate social investment activities and our funding and investing activities. This is not merely for business reasons, but based on a broader responsibility to our environment and society. Accordingly, corporate responsibility risk considerations are considered by the business credit committee and investment committee when making lending or investment decisions. There is also oversight by the social and ethics committee (board committee) on social and environmental issues. In particular the following factors are taken into account when a transaction might be approved or declined based on the outcome of the corporate responsibility considerations:
• Environmental considerations (including animal welfare and climate – related impacts)
• Social considerations (including Human Rights)
• Macro-economic considerations.
Refer to our corporate responsibility report on our website.
Management and measurement of credit and counterparty riskFundamental principles employed in the management of credit and counterparty risk are:
• A clear definition of our target market
• A quantitative and qualitative assessment of the creditworthiness of our counterparties
• Analysis of risks, including concentration risk (concentration risk considerations include asset class, industry, counterparty and geographical concentration)
• Decisions are made with reference to risk appetite limits
• Prudential limits
• Regular monitoring and review of existing and potential exposures once facilities have been approved
• A high level of executive involvement in decision-making with non-executive review and oversight.
Regular reporting of credit and counterparty risk exposures within our operating units is made to management, the executives and the board at the GRCC and BRCC. The board regularly reviews and approves the appetite for credit and counterparty risk, which is documented in risk appetite statements and policy documents. This is implemented and reviewed by Group Credit.
Despite strict adherence to the above principles, increased default risk may arise from unforeseen circumstances particularly in times of extreme market volatility and weak economic conditions.
The group applies the standardised approach for calculating capital requirements in the assessment of its credit and counterparty exposures. The group’s banking subsidiaries conduct their mapping of credit and counterparty exposures in accordance with the mapping procedures specified by the Central Bank, in the respective geographies in which the group operates.
A large proportion of the bank’s portfolio is not rated by external rating agencies. We place reliance upon internal consideration of counterparties and borrowers, and use ratings prepared externally where available as support in our decision-making process.
18 Investec integrated annual report 2017
Risk and
Basel P
illar III disclosures
01 Risk management(continued)
Within the credit approval process, internal and external ratings are included in the assessment of the client quality.
Exposures are classified to reflect the bank’s risk appetite and strategy. In our Pillar III disclosure, exposures are classified according to the Basel asset classes which include sovereign, bank, corporate, retail, equity, securitisation and specialised lending (which is further categorised into project finance; commodities finance; high volatility commercial real estate; and income-producing commercial real estate).
Fitch (UK only), S&P, Moody’s and Global Credit Ratings (South Africa only) have been nominated as eligible External Credit Assessment institutions (ECAIs) for the purposes of determining external credit ratings. The following elections have been made:
• In relation to sovereigns and securitisations, Fitch (UK only), Moody’s, S&P and Global Credit Ratings (South Africa only) have been selected by Investec as eligible ECAIs
• In relation to banks, corporates and debt securities, Fitch (UK only), Moody’s and S&P are recognised as eligible ECAIs
• If two assessments are available, the more conservative will apply
• Where there are three or more credit ratings with different risk weightings, the credit ratings corresponding to the two lowest ratings should be referred to and the higher of those two ratings should be applied.
Internal credit rating models continue to be developed to cover all material asset classes.
In South Africa, the advanced internal ratings approach (AIRB) is subject to supervisory approval to adopt the approach for our credit portfolio. Application for approval was submitted to the SARB in August 2016. Subject to formal approval from the SARB it is expected that the bank will implement AIRB by 2018 in the calculation of credit risk regulatory capital. Through the preparation process for the application Investec has enhanced a number of its rating systems and risk quantification models. Since AIRB was operationalised we have seen significant benefits from using these rating systems in the quantification, management of credit risk and usage for internal capital. In addition we are expecting a positive impact on capital ratios.
Stress testing and portfolio managementInvestec has embedded its stress testing framework which is a repeatable stress testing process, designed to identify and regularly test the bank’s key ‘vulnerabilities under stress’.
A fundamental part of the stress testing process is a full and comprehensive analysis of all the bank’s material business activities, incorporating views from Risk, the Business and the Executive – a process called the ‘bottom-up’ analysis. Out of the ‘bottom-up’ analysis the Investec-specific stress scenarios are designed to specifically test the unique attributes of the bank’s portfolio.
These Investec-specific stress scenarios form an integral part of our capital planning process. The stress testing process also informs the risk appetite review process, and the management of risk appetite limits and is a key risk management tool of the bank. This process allows the bank to identify underlying risks and manage them accordingly.
Notwithstanding the form of the stress testing process, the framework should not impede the group from being able to be flexible and perform ad hoc stress tests, which by their nature need to be completed on request and in response to emerging risk issues.
Reviews are also undertaken on all material businesses, where the portfolios are analysed to assess any migration in portfolio quality, highlight any vulnerabilities, identify portfolio concentrations and make appropriate recommendations, such as a reduction in risk appetite limits or specific exposures.
Credit and counterparty risk may also arise in other ways and it is the role of the global risk management function and the various independent credit committees to identify risks falling outside these definitions.
Credit and counterparty risk – nature of activitiesCredit and counterparty risk is assumed through a range of client-driven lending activities to private and corporate clients and other counterparties, such as financial institutions and sovereigns. These activities are diversified across a number of business activities.
Lending collateralised by property
Client quality and expertise are at the core of our credit philosophy. Our exposure to the property market is well diversified with strong bias towards prime locations for residential exposure and focus on tenant quality for commercial assets. Debt service cover ratios are a key consideration in the lending process supported by reasonable loan to security value ratios.
We provide senior debt and other funding for property transactions, with a strong preference for income producing assets supported by an experienced sponsor providing a material level of cash equity investment into the asset.
An analysis of the lending collateralised by property portfolio and asset quality information is provided on pages 42 to 45.
Private client activities
Our private banking activities target high net worth individuals, active wealthy entrepreneurs, high-income professionals, newly qualified professionals with high-income earning potential, self-employed entrepreneurs, owner managers in small to mid-cap corporates and sophisticated investors.
Lending products are tailored to meet the requirements of our clients. Central to our credit philosophy is ensuring the sustainability of cash flow and income throughout the cycle. As such, the client base has been defined to include high net worth clients (who, through diversification of income streams, will reduce income volatility) and individuals with a profession which has historically supported a high and sustainable income stream irrespective of the stage in the economic cycle.
Credit risk arises from the following activities:
• Personal Banking delivers products to enable target clients to create and manage their wealth. This includes private client mortgages, transactional banking, high net worth lending, offshore banking and foreign exchange
• Residential Mortgages provides mortgage loan facilities for high-income professionals and high net worth individuals tailored to their individual needs

19Investec integrated annual report 2017
Risk and
Basel P
illar III disclosures
01Risk management(continued)
• Specialised Lending provides tailored credit facilities to high net worth individuals and their controlled entities
• Portfolio Lending provides loans to high net worth clients against their investment portfolio, typically managed by Investec Wealth & Investment.
An analysis of the private client loan portfolio and asset quality information is provided on pages 42 to 45.
Corporate client activities
We focus on traditional client-driven corporate lending activities, in addition to customer flow related treasury and trading execution services.
Within the corporate lending businesses, credit risk can arise from corporate loans, acquisition finance, asset finance, power and infrastructure finance, asset-based lending, fund finance and resource finance. We also undertake debt origination activities for corporate clients.
The Credit Risk Management functions approve specific credit and counterparty limits that govern the maximum credit exposure to each individual counterparty. In addition, further risk management limits exist through industry and country limits to manage concentration risk. The credit appetite for each counterparty is based on the financial strength of the principal borrower, its business model and market positioning, the underlying cash flow to the transaction, the substance and track record of management, and the security package. Political risk insurance, and other insurance is taken where they are deemed appropriate.
Investec has limited appetite for unsecured credit risk and facilities are typically secured on the assets of the underlying borrower as well as shares in the borrower.
A summary of the nature of the lending and/or credit risk assumed within some of the key areas within our corporate lending business is provided below:
• Corporate Loans: provides senior secured loans to mid-to-large cap companies. Credit risk is assessed against debt serviceability based upon robust cash generation of the business based on both historical and
forecast information. We typically act as transaction lead or arranger, and have a close relationship with management and sponsors
• Corporate Debt Securities: these are tradable corporate debt instruments, based on acceptable credit fundamentals typically with a medium-term hold strategy where the underlying risk is to UK, European and South African corporates. This is a highly diversified, granular portfolio that is robust, and spread across a variety of geographies and industries
• Acquisition Finance: provides debt funding to proven management teams and sponsors, running small to mid-cap sized companies. Credit risk is assessed against debt serviceability based upon robust cash generation of the business based on both historical and forecast information. This will be based on historic and forecast information. We typically lend on a bilateral basis and benefit from a close relationship with management and sponsors
• Asset Based Lending: provides working capital and secured corporate loans to mid-caps. These loans are secured by the assets of the business, for example, the accounts receivable, inventory and, plant and machinery. In common with our corporate lending activities, strong emphasis is placed on supporting companies with scale and relevance in their industry, stability of cash flow, and experienced management
• Fund Finance: provides debt facilities to asset managers and fund vehicles, principally in private equity. The geographical focus is the UK, Western Europe, North America, Australia and South Africa where Investec can support experienced asset managers and their funds which show strong, long-term value creation and good custodianship of investors’ money. Debt facilities to fund vehicles are secured against undrawn limited partner commitments and/or the funds underlying assets. Fund manager loans are structured against committed fund management cash flows, the managers’ investment stake in their own funds and when required managers’ personal guarantees
• Small Ticket Asset Finance: provides funding to small and medium-sized corporates to support asset purchases and other business requirements. The portfolio is highly diversified by industry and number of clients and is secured against the asset being financed and is a direct obligation of the company
• Large Ticket Asset Finance: provides the finance and structuring expertise for aircraft and larger lease assets, the majority of which are senior secured loans with a combination of corporate, cash flow and asset-backed collateral against the exposure
• Power and Infrastructure Finance: arranges and provides typically long-term financing for infrastructure assets, in particular renewable and traditional power projects as well as transportation assets, against contracted future cash flows of the project(s) from well established and financially sound off-take counterparties. There is a requirement for a strong upfront equity contribution from an experienced sponsor
• Resource Finance: debt arranging and underwriting together with structured hedging solutions mainly within the mining sectors. The underlying commodities are mainly precious and base metals and coal. Our clients in this sector are established mining companies which are typically domiciled and publicly listed in one of the following geographies – the UK, North America and Australia as well as other countries where we are facilitating a transaction for a client who requires facilities in a foreign geography. All facilities are secured by the borrower’s assets and repaid from mining cash flows
• Structured Credit: these are bonds secured against a pool of assets, mainly UK residential mortgages or European or US corporate leverage loans. The bonds are typically investment grade rated, which benefit from a high-level of credit subordination and can withstand a significant level of portfolio defaults
• Treasury Placements: the treasury function, as part of the daily management of the bank’s liquidity, places funds with central banks and other commercial banks and financial
20 Investec integrated annual report 2017
Risk and
Basel P
illar III disclosures
01 Risk management(continued)
institutions. These transactions are typically short term (less than one month) money market placements or secured repurchase agreements. These market counterparties are mainly investment grade rated entities that occupy dominant and systemic positions in their domestic banking markets and internationally. These counterparties are located in the UK, Western Europe, North America, South Africa and Australia
• Corporate advisory and investment banking activities: counterparty risk in this area is modest. The business also trades approved shares on an approved basis and, in the UK, makes markets in shares where we are appointed corporate broker under pre-agreed market risk limits. Settlement trades are largely on a delivery versus payment basis, through major stock exchanges. Credit risk only occurs in the event of counterparty failure and would be linked to any fair value losses on the underlying security
• Customer trading activities to facilitate client lending and hedging: our customer trading portfolio consists of derivative contracts in interest rates, foreign exchange, commodities, credit derivatives and equities that are entered
into, to facilitate a client’s hedging requirements. The counterparties to such transactions are typically corporates, in particular where they have an exposure to foreign exchange due to operating in sectors that include imports and exports of goods and services. These positions are marked to market, typically with daily margin calls to mitigate credit exposure in the event of counterparty default.
An analysis of the corporate client loan portfolio and asset quality information is provided on pages 42 to 45.
Wealth & InvestmentInvestec Wealth & Investment provides investment management services to private clients, charities, intermediaries, pension schemes and trusts. Wealth & Investment is primarily an agency business with a limited amount of principal risk. Its core business is discretionary and non-discretionary investment management services.
Settlement risk can arise due to undertaking transactions in an agency capacity on behalf of clients. However, the risk is not considered to be material as most transactions are undertaken with large institutional clients, are monitored daily, and trades are usually settled within two to three days.
Asset Management Through the course of its normal business, Investec Asset Management is constantly transacting with market counterparties. A list of approved counterparties is maintained and procedures are in place to ensure appointed counterparties meet certain standards in order to safeguard client assets being transacted with or undertaken with approved counterparties and this is enforced through system controls where possible. In addition to due diligence, other forms of risk management are employed to reduce the impact of a counterparty failure. These measures include market conventions such as ‘Delivery versus Payment’ (DVP), and where appropriate; use of collateral or contractual protection (e.g. under ISDA). Net exposure to counterparties is monitored by Investec Asset Management’s Investment Risk Committee, and day-to-day monitoring is undertaken by a dedicated and independent Investment Risk Team.
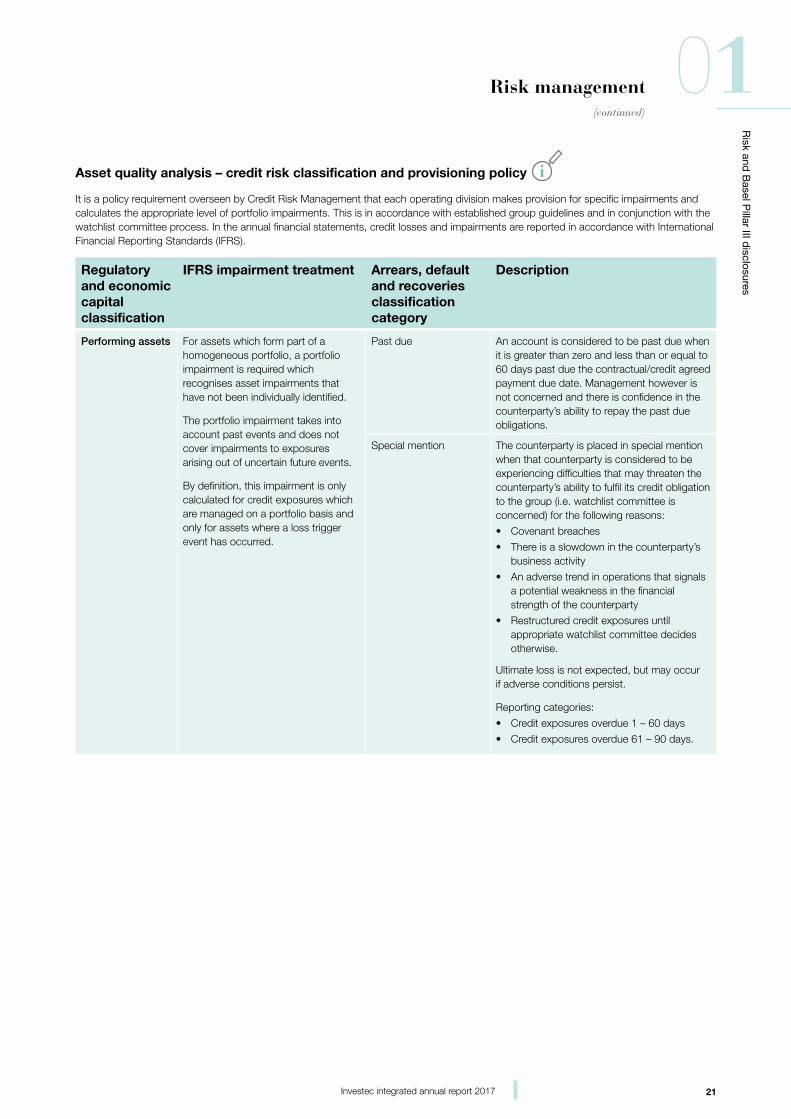
21Investec integrated annual report 2017
Risk and
Basel P
illar III disclosures
01Risk management(continued)
Asset quality analysis – credit risk classification and provisioning policy
It is a policy requirement overseen by Credit Risk Management that each operating division makes provision for specific impairments and calculates the appropriate level of portfolio impairments. This is in accordance with established group guidelines and in conjunction with the watchlist committee process. In the annual financial statements, credit losses and impairments are reported in accordance with International Financial Reporting Standards (IFRS).
Regulatory and economic capital classification
IFRS impairment treatment Arrears, default and recoveries classification category
Description
Performing assets For assets which form part of a homogeneous portfolio, a portfolio impairment is required which recognises asset impairments that have not been individually identified.
The portfolio impairment takes into account past events and does not cover impairments to exposures arising out of uncertain future events.
By definition, this impairment is only calculated for credit exposures which are managed on a portfolio basis and only for assets where a loss trigger event has occurred.
Past due An account is considered to be past due when it is greater than zero and less than or equal to 60 days past due the contractual/credit agreed payment due date. Management however is not concerned and there is confidence in the counterparty’s ability to repay the past due obligations.
Special mention The counterparty is placed in special mention when that counterparty is considered to be experiencing difficulties that may threaten the counterparty’s ability to fulfil its credit obligation to the group (i.e. watchlist committee is concerned) for the following reasons:
• Covenant breaches
• There is a slowdown in the counterparty’s business activity
• An adverse trend in operations that signals a potential weakness in the financial strength of the counterparty
• Restructured credit exposures until appropriate watchlist committee decides otherwise.
Ultimate loss is not expected, but may occur if adverse conditions persist.
Reporting categories:
• Credit exposures overdue 1 – 60 days
• Credit exposures overdue 61 – 90 days.
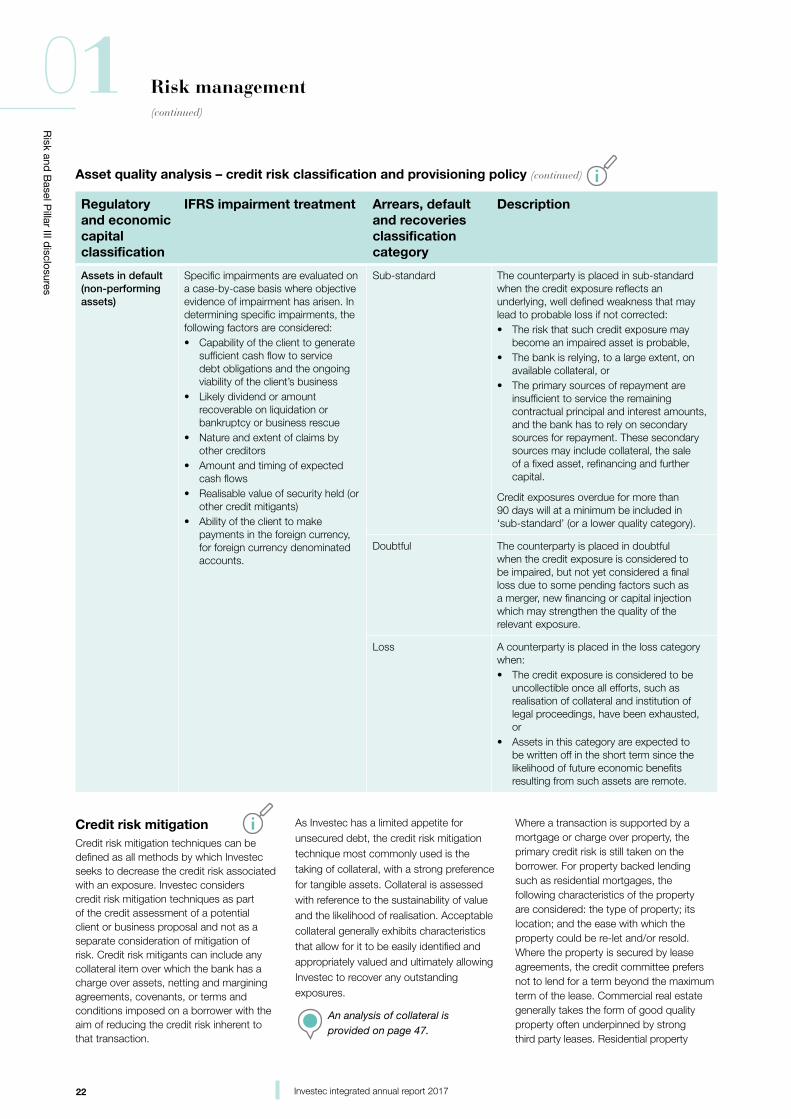
22 Investec integrated annual report 2017
Risk and
Basel P
illar III disclosures
01 Risk management(continued)
Asset quality analysis – credit risk classification and provisioning policy (continued)
Regulatory and economic capital classification
IFRS impairment treatment Arrears, default and recoveries classification category
Description
Assets in default (non-performing assets)
Specific impairments are evaluated on a case-by-case basis where objective evidence of impairment has arisen. In determining specific impairments, the following factors are considered:• Capability of the client to generate
sufficient cash flow to service debt obligations and the ongoing viability of the client’s business
• Likely dividend or amount recoverable on liquidation or bankruptcy or business rescue
• Nature and extent of claims by other creditors
• Amount and timing of expected cash flows
• Realisable value of security held (or other credit mitigants)
• Ability of the client to make payments in the foreign currency, for foreign currency denominated accounts.
Sub-standard The counterparty is placed in sub-standard when the credit exposure reflects an underlying, well defined weakness that may lead to probable loss if not corrected:• The risk that such credit exposure may
become an impaired asset is probable,• The bank is relying, to a large extent, on
available collateral, or• The primary sources of repayment are
insufficient to service the remaining contractual principal and interest amounts, and the bank has to rely on secondary sources for repayment. These secondary sources may include collateral, the sale of a fixed asset, refinancing and further capital.
Credit exposures overdue for more than 90 days will at a minimum be included in ‘sub-standard’ (or a lower quality category).
Doubtful The counterparty is placed in doubtful when the credit exposure is considered to be impaired, but not yet considered a final loss due to some pending factors such as a merger, new financing or capital injection which may strengthen the quality of the relevant exposure.
Loss A counterparty is placed in the loss category when:• The credit exposure is considered to be
uncollectible once all efforts, such as realisation of collateral and institution of legal proceedings, have been exhausted, or
• Assets in this category are expected to be written off in the short term since the likelihood of future economic benefits resulting from such assets are remote.
Credit risk mitigation Credit risk mitigation techniques can be defined as all methods by which Investec seeks to decrease the credit risk associated with an exposure. Investec considers credit risk mitigation techniques as part of the credit assessment of a potential client or business proposal and not as a separate consideration of mitigation of risk. Credit risk mitigants can include any collateral item over which the bank has a charge over assets, netting and margining agreements, covenants, or terms and conditions imposed on a borrower with the aim of reducing the credit risk inherent to that transaction.
As Investec has a limited appetite for unsecured debt, the credit risk mitigation technique most commonly used is the taking of collateral, with a strong preference for tangible assets. Collateral is assessed with reference to the sustainability of value and the likelihood of realisation. Acceptable collateral generally exhibits characteristics that allow for it to be easily identified and appropriately valued and ultimately allowing Investec to recover any outstanding exposures.
An analysis of collateral is provided on page 47.
Where a transaction is supported by a mortgage or charge over property, the primary credit risk is still taken on the borrower. For property backed lending such as residential mortgages, the following characteristics of the property are considered: the type of property; its location; and the ease with which the property could be re-let and/or resold. Where the property is secured by lease agreements, the credit committee prefers not to lend for a term beyond the maximum term of the lease. Commercial real estate generally takes the form of good quality property often underpinned by strong third party leases. Residential property
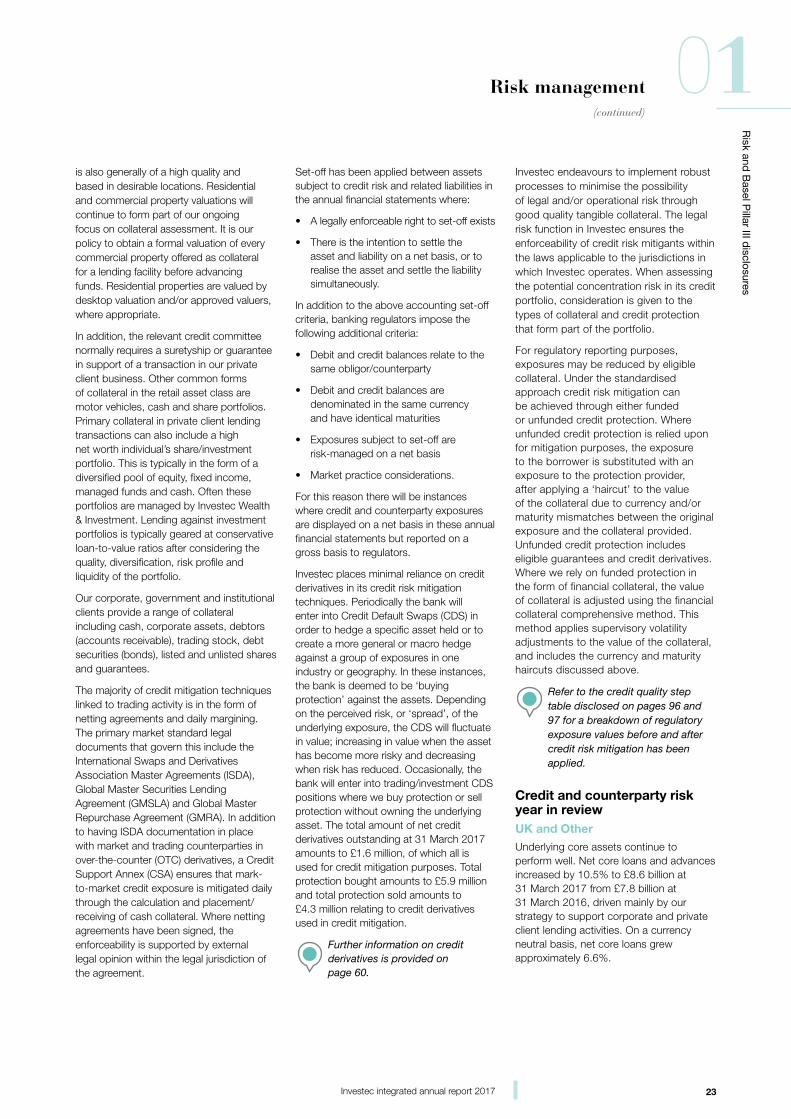
23Investec integrated annual report 2017
Risk and
Basel P
illar III disclosures
01Risk management(continued)
is also generally of a high quality and based in desirable locations. Residential and commercial property valuations will continue to form part of our ongoing focus on collateral assessment. It is our policy to obtain a formal valuation of every commercial property offered as collateral for a lending facility before advancing funds. Residential properties are valued by desktop valuation and/or approved valuers, where appropriate.
In addition, the relevant credit committee normally requires a suretyship or guarantee in support of a transaction in our private client business. Other common forms of collateral in the retail asset class are motor vehicles, cash and share portfolios. Primary collateral in private client lending transactions can also include a high net worth individual’s share/investment portfolio. This is typically in the form of a diversified pool of equity, fixed income, managed funds and cash. Often these portfolios are managed by Investec Wealth & Investment. Lending against investment portfolios is typically geared at conservative loan-to-value ratios after considering the quality, diversification, risk profile and liquidity of the portfolio.
Our corporate, government and institutional clients provide a range of collateral including cash, corporate assets, debtors (accounts receivable), trading stock, debt securities (bonds), listed and unlisted shares and guarantees.
The majority of credit mitigation techniques linked to trading activity is in the form of netting agreements and daily margining. The primary market standard legal documents that govern this include the International Swaps and Derivatives Association Master Agreements (ISDA), Global Master Securities Lending Agreement (GMSLA) and Global Master Repurchase Agreement (GMRA). In addition to having ISDA documentation in place with market and trading counterparties in over-the-counter (OTC) derivatives, a Credit Support Annex (CSA) ensures that mark-to-market credit exposure is mitigated daily through the calculation and placement/receiving of cash collateral. Where netting agreements have been signed, the enforceability is supported by external legal opinion within the legal jurisdiction of the agreement.
Set-off has been applied between assets subject to credit risk and related liabilities in the annual financial statements where:
• A legally enforceable right to set-off exists
• There is the intention to settle the asset and liability on a net basis, or to realise the asset and settle the liability simultaneously.
In addition to the above accounting set-off criteria, banking regulators impose the following additional criteria:
• Debit and credit balances relate to the same obligor/counterparty
• Debit and credit balances are denominated in the same currency and have identical maturities
• Exposures subject to set-off are risk-managed on a net basis
• Market practice considerations.
For this reason there will be instances where credit and counterparty exposures are displayed on a net basis in these annual financial statements but reported on a gross basis to regulators.
Investec places minimal reliance on credit derivatives in its credit risk mitigation techniques. Periodically the bank will enter into Credit Default Swaps (CDS) in order to hedge a specific asset held or to create a more general or macro hedge against a group of exposures in one industry or geography. In these instances, the bank is deemed to be ‘buying protection’ against the assets. Depending on the perceived risk, or ‘spread’, of the underlying exposure, the CDS will fluctuate in value; increasing in value when the asset has become more risky and decreasing when risk has reduced. Occasionally, the bank will enter into trading/investment CDS positions where we buy protection or sell protection without owning the underlying asset. The total amount of net credit derivatives outstanding at 31 March 2017 amounts to £1.6 million, of which all is used for credit mitigation purposes. Total protection bought amounts to £5.9 million and total protection sold amounts to £4.3 million relating to credit derivatives used in credit mitigation.
Further information on credit derivatives is provided on page 60.
Investec endeavours to implement robust processes to minimise the possibility of legal and/or operational risk through good quality tangible collateral. The legal risk function in Investec ensures the enforceability of credit risk mitigants within the laws applicable to the jurisdictions in which Investec operates. When assessing the potential concentration risk in its credit portfolio, consideration is given to the types of collateral and credit protection that form part of the portfolio.
For regulatory reporting purposes, exposures may be reduced by eligible collateral. Under the standardised approach credit risk mitigation can be achieved through either funded or unfunded credit protection. Where unfunded credit protection is relied upon for mitigation purposes, the exposure to the borrower is substituted with an exposure to the protection provider, after applying a ‘haircut’ to the value of the collateral due to currency and/or maturity mismatches between the original exposure and the collateral provided. Unfunded credit protection includes eligible guarantees and credit derivatives. Where we rely on funded protection in the form of financial collateral, the value of collateral is adjusted using the financial collateral comprehensive method. This method applies supervisory volatility adjustments to the value of the collateral, and includes the currency and maturity haircuts discussed above.
Refer to the credit quality step table disclosed on pages 96 and 97 for a breakdown of regulatory exposure values before and after credit risk mitigation has been applied.
Credit and counterparty risk year in reviewUK and OtherUnderlying core assets continue to perform well. Net core loans and advances increased by 10.5% to £8.6 billion at 31 March 2017 from £7.8 billion at 31 March 2016, driven mainly by our strategy to support corporate and private client lending activities. On a currency neutral basis, net core loans grew approximately 6.6%.
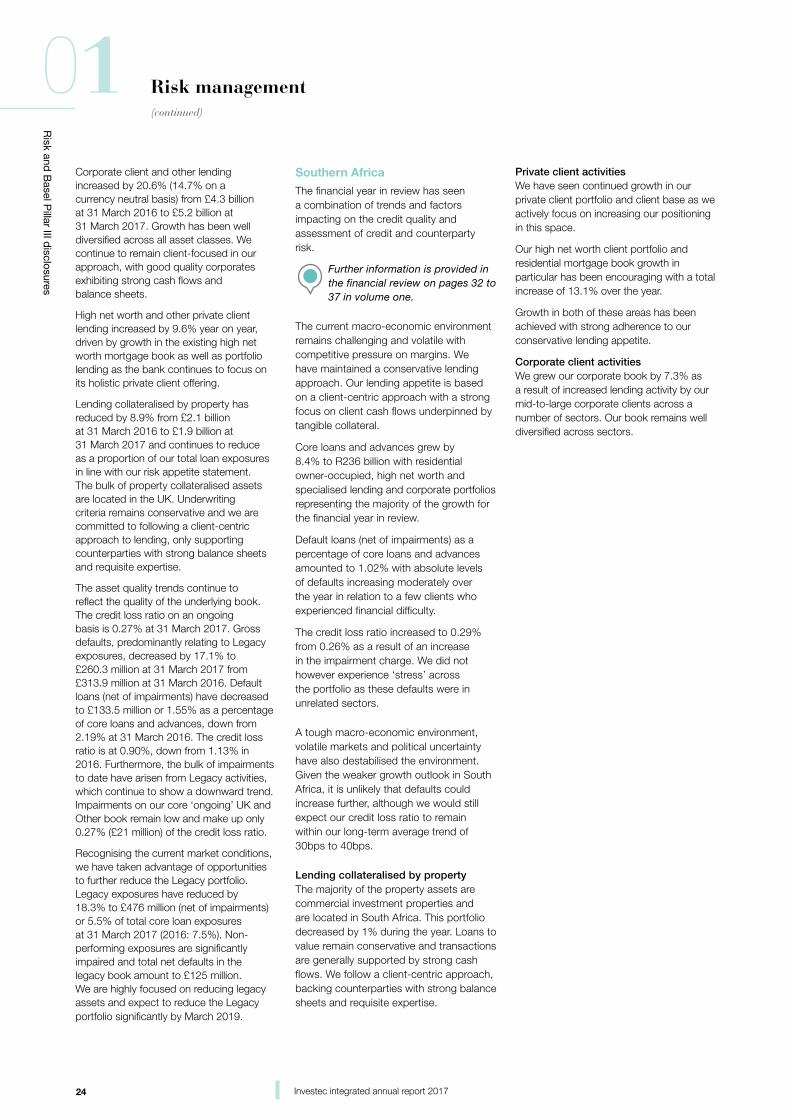
24 Investec integrated annual report 2017
Risk and
Basel P
illar III disclosures
01 Risk management(continued)
Corporate client and other lending increased by 20.6% (14.7% on a currency neutral basis) from £4.3 billion at 31 March 2016 to £5.2 billion at 31 March 2017. Growth has been well diversified across all asset classes. We continue to remain client-focused in our approach, with good quality corporates exhibiting strong cash flows and balance sheets.
High net worth and other private client lending increased by 9.6% year on year, driven by growth in the existing high net worth mortgage book as well as portfolio lending as the bank continues to focus on its holistic private client offering.
Lending collateralised by property has reduced by 8.9% from £2.1 billion at 31 March 2016 to £1.9 billion at 31 March 2017 and continues to reduce as a proportion of our total loan exposures in line with our risk appetite statement. The bulk of property collateralised assets are located in the UK. Underwriting criteria remains conservative and we are committed to following a client-centric approach to lending, only supporting counterparties with strong balance sheets and requisite expertise.
The asset quality trends continue to reflect the quality of the underlying book. The credit loss ratio on an ongoing basis is 0.27% at 31 March 2017. Gross defaults, predominantly relating to Legacy exposures, decreased by 17.1% to £260.3 million at 31 March 2017 from £313.9 million at 31 March 2016. Default loans (net of impairments) have decreased to £133.5 million or 1.55% as a percentage of core loans and advances, down from 2.19% at 31 March 2016. The credit loss ratio is at 0.90%, down from 1.13% in 2016. Furthermore, the bulk of impairments to date have arisen from Legacy activities, which continue to show a downward trend. Impairments on our core ‘ongoing’ UK and Other book remain low and make up only 0.27% (£21 million) of the credit loss ratio.
Recognising the current market conditions, we have taken advantage of opportunities to further reduce the Legacy portfolio. Legacy exposures have reduced by 18.3% to £476 million (net of impairments) or 5.5% of total core loan exposures at 31 March 2017 (2016: 7.5%). Non-performing exposures are significantly impaired and total net defaults in the legacy book amount to £125 million. We are highly focused on reducing legacy assets and expect to reduce the Legacy portfolio significantly by March 2019.
Southern Africa
The financial year in review has seen a combination of trends and factors impacting on the credit quality and assessment of credit and counterparty risk.
Further information is provided in the financial review on pages 32 to 37 in volume one.
The current macro-economic environment remains challenging and volatile with competitive pressure on margins. We have maintained a conservative lending approach. Our lending appetite is based on a client-centric approach with a strong focus on client cash flows underpinned by tangible collateral.
Core loans and advances grew by 8.4% to R236 billion with residential owner-occupied, high net worth and specialised lending and corporate portfolios representing the majority of the growth for the financial year in review.
Default loans (net of impairments) as a percentage of core loans and advances amounted to 1.02% with absolute levels of defaults increasing moderately over the year in relation to a few clients who experienced financial difficulty.
The credit loss ratio increased to 0.29% from 0.26% as a result of an increase in the impairment charge. We did not however experience ‘stress’ across the portfolio as these defaults were in unrelated sectors.
A tough macro-economic environment, volatile markets and political uncertainty have also destabilised the environment. Given the weaker growth outlook in South Africa, it is unlikely that defaults could increase further, although we would still expect our credit loss ratio to remain within our long-term average trend of 30bps to 40bps.
Lending collateralised by propertyThe majority of the property assets are commercial investment properties and are located in South Africa. This portfolio decreased by 1% during the year. Loans to value remain conservative and transactions are generally supported by strong cash flows. We follow a client-centric approach, backing counterparties with strong balance sheets and requisite expertise.
Private client activitiesWe have seen continued growth in our private client portfolio and client base as we actively focus on increasing our positioning in this space.
Our high net worth client portfolio and residential mortgage book growth in particular has been encouraging with a total increase of 13.1% over the year.
Growth in both of these areas has been achieved with strong adherence to our conservative lending appetite.
Corporate client activitiesWe grew our corporate book by 7.3% as a result of increased lending activity by our mid-to-large corporate clients across a number of sectors. Our book remains well diversified across sectors.
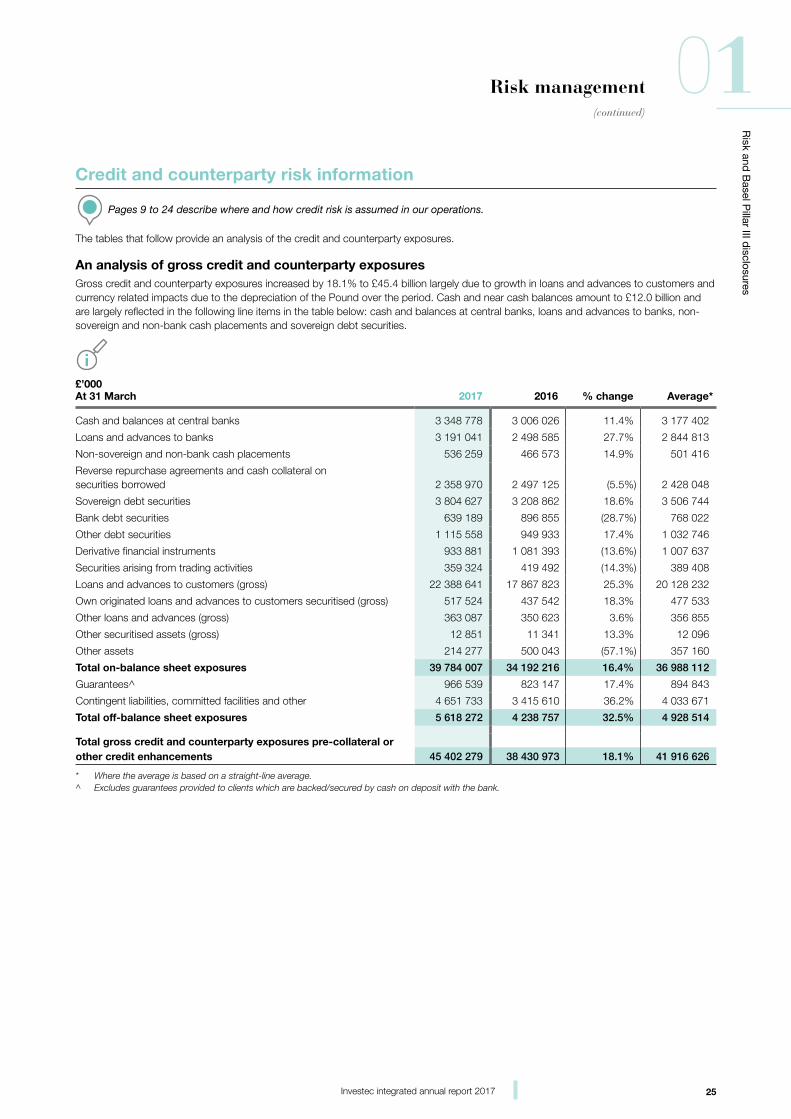
25Investec integrated annual report 2017
Risk and
Basel P
illar III disclosures
01Risk management(continued)
Credit and counterparty risk information
Pages 9 to 24 describe where and how credit risk is assumed in our operations.
The tables that follow provide an analysis of the credit and counterparty exposures.
An analysis of gross credit and counterparty exposuresGross credit and counterparty exposures increased by 18.1% to £45.4 billion largely due to growth in loans and advances to customers and currency related impacts due to the depreciation of the Pound over the period. Cash and near cash balances amount to £12.0 billion and are largely reflected in the following line items in the table below: cash and balances at central banks, loans and advances to banks, non-sovereign and non-bank cash placements and sovereign debt securities.
£’000At 31 March 2017 2016 % change Average*
Cash and balances at central banks 3 348 778 3 006 026 11.4% 3 177 402
Loans and advances to banks 3 191 041 2 498 585 27.7% 2 844 813
Non-sovereign and non-bank cash placements 536 259 466 573 14.9% 501 416
Reverse repurchase agreements and cash collateral on securities borrowed 2 358 970 2 497 125 (5.5%) 2 428 048
Sovereign debt securities 3 804 627 3 208 862 18.6% 3 506 744
Bank debt securities 639 189 896 855 (28.7%) 768 022
Other debt securities 1 115 558 949 933 17.4% 1 032 746
Derivative financial instruments 933 881 1 081 393 (13.6%) 1 007 637
Securities arising from trading activities 359 324 419 492 (14.3%) 389 408
Loans and advances to customers (gross) 22 388 641 17 867 823 25.3% 20 128 232
Own originated loans and advances to customers securitised (gross) 517 524 437 542 18.3% 477 533
Other loans and advances (gross) 363 087 350 623 3.6% 356 855
Other securitised assets (gross) 12 851 11 341 13.3% 12 096
Other assets 214 277 500 043 (57.1%) 357 160
Total on-balance sheet exposures 39 784 007 34 192 216 16.4% 36 988 112
Guarantees^ 966 539 823 147 17.4% 894 843
Contingent liabilities, committed facilities and other 4 651 733 3 415 610 36.2% 4 033 671
Total off-balance sheet exposures 5 618 272 4 238 757 32.5% 4 928 514
Total gross credit and counterparty exposures pre-collateral orother credit enhancements 45 402 279 38 430 973 18.1% 41 916 626
* Where the average is based on a straight-line average. ^ Excludes guarantees provided to clients which are backed/secured by cash on deposit with the bank.
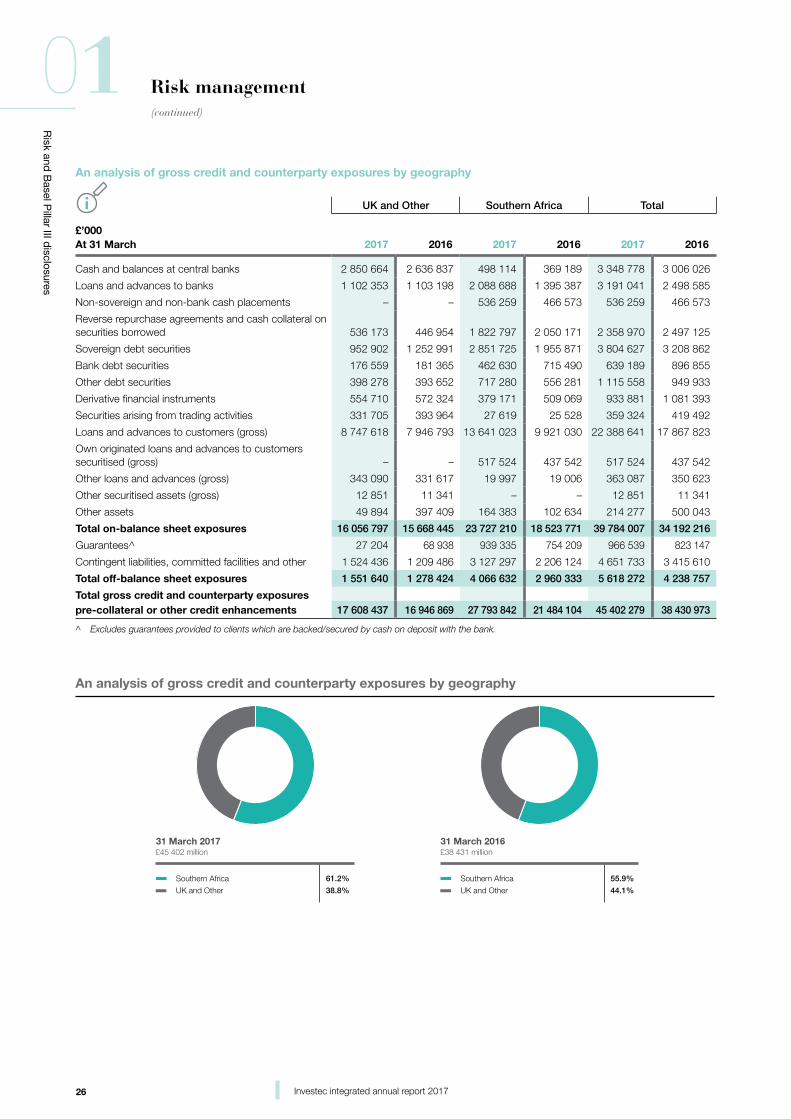
26 Investec integrated annual report 2017
Risk and
Basel P
illar III disclosures
01 Risk management(continued)
An analysis of gross credit and counterparty exposures by geography
UK and Other Southern Africa Total
£’000At 31 March 2017 2016 2017 2016 2017 2016
Cash and balances at central banks 2 850 664 2 636 837 498 114 369 189 3 348 778 3 006 026
Loans and advances to banks 1 102 353 1 103 198 2 088 688 1 395 387 3 191 041 2 498 585
Non-sovereign and non-bank cash placements – – 536 259 466 573 536 259 466 573
Reverse repurchase agreements and cash collateral on securities borrowed 536 173 446 954 1 822 797 2 050 171 2 358 970 2 497 125
Sovereign debt securities 952 902 1 252 991 2 851 725 1 955 871 3 804 627 3 208 862
Bank debt securities 176 559 181 365 462 630 715 490 639 189 896 855
Other debt securities 398 278 393 652 717 280 556 281 1 115 558 949 933
Derivative financial instruments 554 710 572 324 379 171 509 069 933 881 1 081 393
Securities arising from trading activities 331 705 393 964 27 619 25 528 359 324 419 492
Loans and advances to customers (gross) 8 747 618 7 946 793 13 641 023 9 921 030 22 388 641 17 867 823
Own originated loans and advances to customers securitised (gross) – – 517 524 437 542 517 524 437 542
Other loans and advances (gross) 343 090 331 617 19 997 19 006 363 087 350 623
Other securitised assets (gross) 12 851 11 341 – – 12 851 11 341
Other assets 49 894 397 409 164 383 102 634 214 277 500 043
Total on-balance sheet exposures 16 056 797 15 668 445 23 727 210 18 523 771 39 784 007 34 192 216
Guarantees^ 27 204 68 938 939 335 754 209 966 539 823 147
Contingent liabilities, committed facilities and other 1 524 436 1 209 486 3 127 297 2 206 124 4 651 733 3 415 610
Total off-balance sheet exposures 1 551 640 1 278 424 4 066 632 2 960 333 5 618 272 4 238 757
Total gross credit and counterparty exposurespre-collateral or other credit enhancements 17 608 437 16 946 869 27 793 842 21 484 104 45 402 279 38 430 973
^ Excludes guarantees provided to clients which are backed/secured by cash on deposit with the bank.
£38 431 million£45 402 million
55.9%
44.1%
31 March 2016
Southern Africa
UK and Other
An analysis of gross credit and counterparty exposures by geography
61.2%
38.8%
31 March 2017
Southern Africa
UK and Other
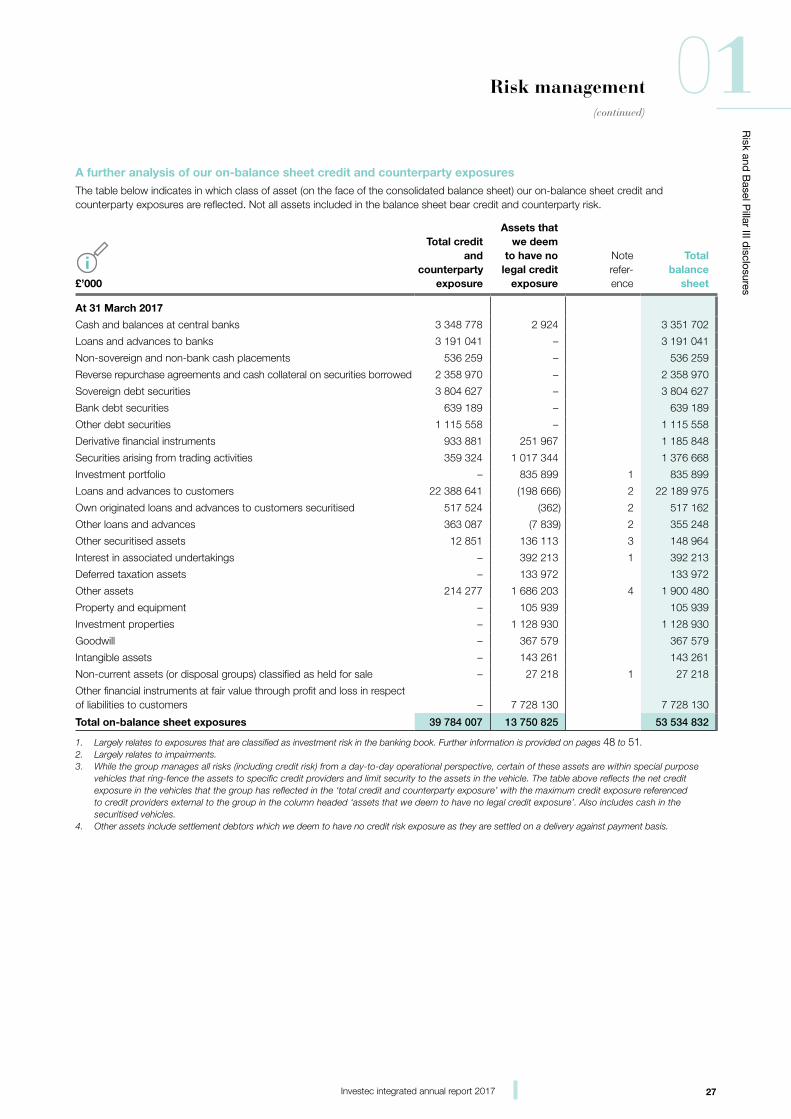
27Investec integrated annual report 2017
Risk and
Basel P
illar III disclosures
01Risk management(continued)
A further analysis of our on-balance sheet credit and counterparty exposuresThe table below indicates in which class of asset (on the face of the consolidated balance sheet) our on-balance sheet credit and counterparty exposures are reflected. Not all assets included in the balance sheet bear credit and counterparty risk.
£’000
Total credit and
counterparty exposure
Assets that we deem
to have no legal credit
exposure
Note refer-ence
Total balance
sheet
At 31 March 2017
Cash and balances at central banks 3 348 778 2 924 3 351 702
Loans and advances to banks 3 191 041 – 3 191 041
Non-sovereign and non-bank cash placements 536 259 – 536 259
Reverse repurchase agreements and cash collateral on securities borrowed 2 358 970 – 2 358 970
Sovereign debt securities 3 804 627 – 3 804 627
Bank debt securities 639 189 – 639 189
Other debt securities 1 115 558 – 1 115 558
Derivative financial instruments 933 881 251 967 1 185 848
Securities arising from trading activities 359 324 1 017 344 1 376 668
Investment portfolio – 835 899 1 835 899
Loans and advances to customers 22 388 641 (198 666) 2 22 189 975
Own originated loans and advances to customers securitised 517 524 (362) 2 517 162
Other loans and advances 363 087 (7 839) 2 355 248
Other securitised assets 12 851 136 113 3 148 964
Interest in associated undertakings – 392 213 1 392 213
Deferred taxation assets – 133 972 133 972
Other assets 214 277 1 686 203 4 1 900 480
Property and equipment – 105 939 105 939
Investment properties – 1 128 930 1 128 930
Goodwill – 367 579 367 579
Intangible assets – 143 261 143 261
Non-current assets (or disposal groups) classified as held for sale – 27 218 1 27 218
Other financial instruments at fair value through profit and loss in respect of liabilities to customers – 7 728 130 7 728 130
Total on-balance sheet exposures 39 784 007 13 750 825 53 534 832
1. Largely relates to exposures that are classified as investment risk in the banking book. Further information is provided on pages 48 to 51.2. Largely relates to impairments. 3. While the group manages all risks (including credit risk) from a day-to-day operational perspective, certain of these assets are within special purpose
vehicles that ring-fence the assets to specific credit providers and limit security to the assets in the vehicle. The table above reflects the net credit exposure in the vehicles that the group has reflected in the ‘total credit and counterparty exposure’ with the maximum credit exposure referenced to credit providers external to the group in the column headed ‘assets that we deem to have no legal credit exposure’. Also includes cash in the securitised vehicles.
4. Other assets include settlement debtors which we deem to have no credit risk exposure as they are settled on a delivery against payment basis.
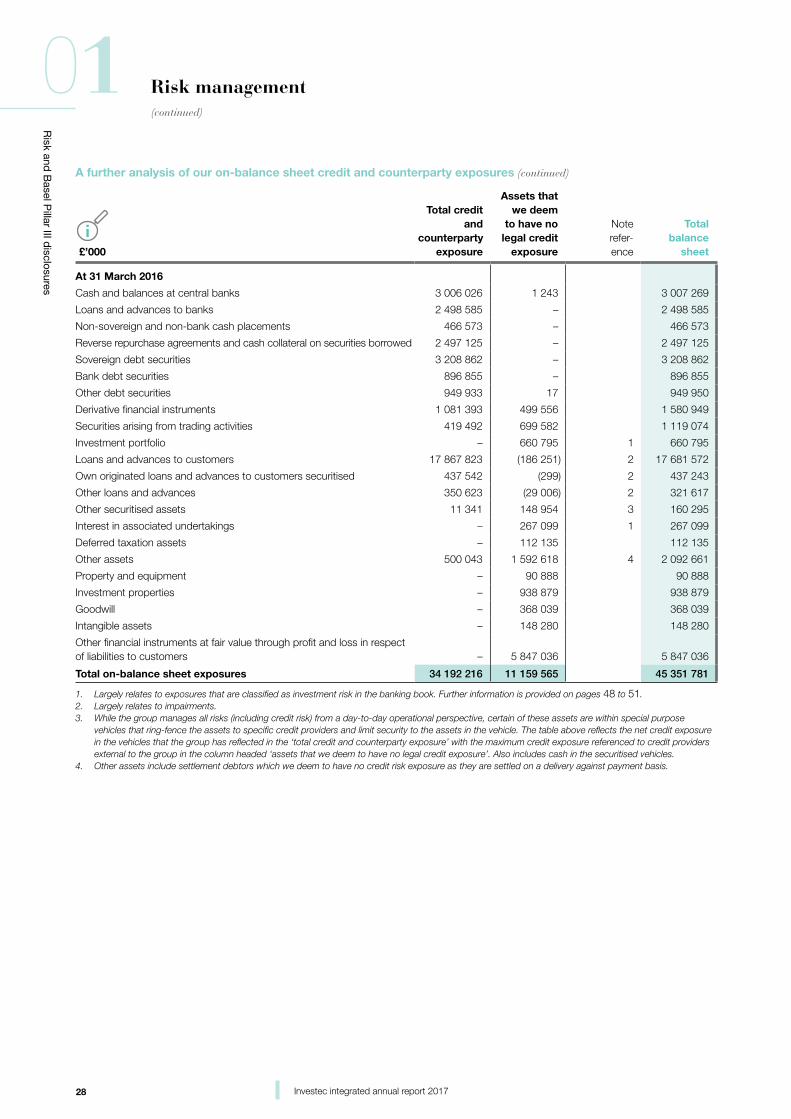
28 Investec integrated annual report 2017
Risk and
Basel P
illar III disclosures
01 Risk management(continued)
A further analysis of our on-balance sheet credit and counterparty exposures (continued)
£’000
Total credit and
counterparty exposure
Assets that we deem
to have no legal credit
exposure
Note refer-ence
Total balance
sheet
At 31 March 2016
Cash and balances at central banks 3 006 026 1 243 3 007 269
Loans and advances to banks 2 498 585 – 2 498 585
Non-sovereign and non-bank cash placements 466 573 – 466 573
Reverse repurchase agreements and cash collateral on securities borrowed 2 497 125 – 2 497 125
Sovereign debt securities 3 208 862 – 3 208 862
Bank debt securities 896 855 – 896 855
Other debt securities 949 933 17 949 950
Derivative financial instruments 1 081 393 499 556 1 580 949
Securities arising from trading activities 419 492 699 582 1 119 074
Investment portfolio – 660 795 1 660 795
Loans and advances to customers 17 867 823 (186 251) 2 17 681 572
Own originated loans and advances to customers securitised 437 542 (299) 2 437 243
Other loans and advances 350 623 (29 006) 2 321 617
Other securitised assets 11 341 148 954 3 160 295
Interest in associated undertakings – 267 099 1 267 099
Deferred taxation assets – 112 135 112 135
Other assets 500 043 1 592 618 4 2 092 661
Property and equipment – 90 888 90 888
Investment properties – 938 879 938 879
Goodwill – 368 039 368 039
Intangible assets – 148 280 148 280
Other financial instruments at fair value through profit and loss in respect of liabilities to customers – 5 847 036 5 847 036
Total on-balance sheet exposures 34 192 216 11 159 565 45 351 781
1. Largely relates to exposures that are classified as investment risk in the banking book. Further information is provided on pages 48 to 51.2. Largely relates to impairments. 3. While the group manages all risks (including credit risk) from a day-to-day operational perspective, certain of these assets are within special purpose
vehicles that ring-fence the assets to specific credit providers and limit security to the assets in the vehicle. The table above reflects the net credit exposure in the vehicles that the group has reflected in the ‘total credit and counterparty exposure’ with the maximum credit exposure referenced to credit providers external to the group in the column headed ‘assets that we deem to have no legal credit exposure’. Also includes cash in the securitised vehicles.
4. Other assets include settlement debtors which we deem to have no credit risk exposure as they are settled on a delivery against payment basis.
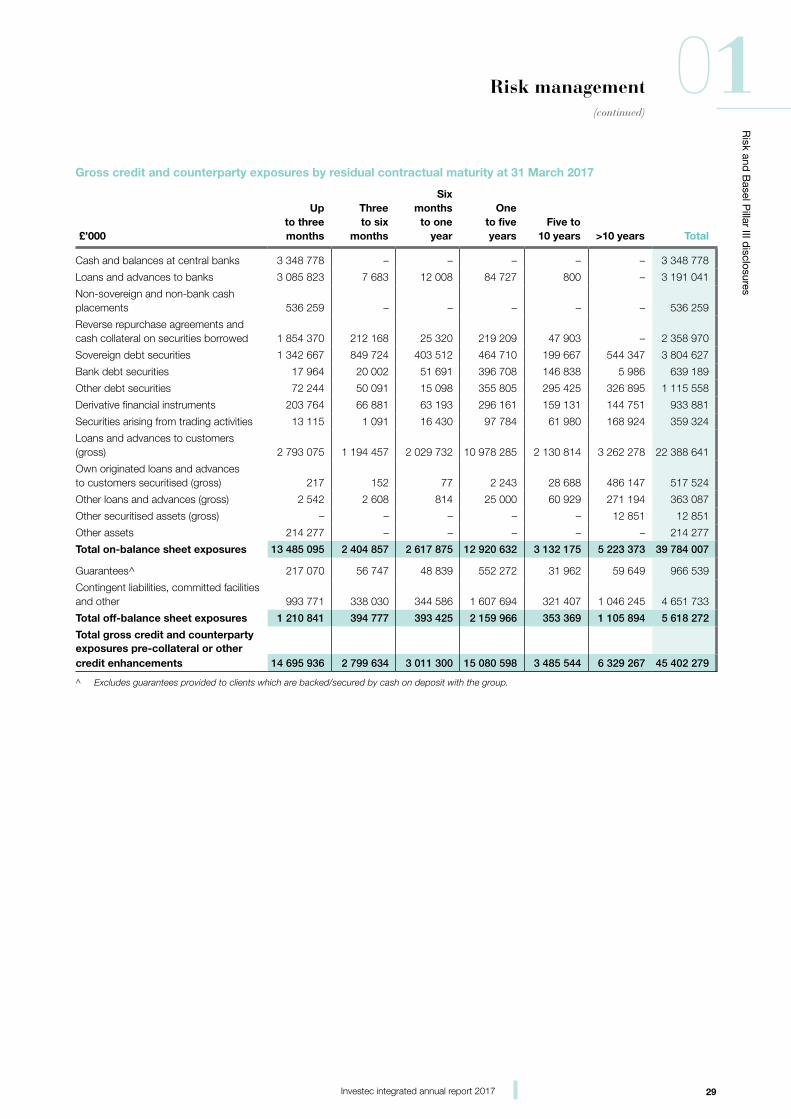
29Investec integrated annual report 2017
Risk and
Basel P
illar III disclosures
01Risk management(continued)
Gross credit and counterparty exposures by residual contractual maturity at 31 March 2017
£’000
Up to three months
Three to six
months
Six months
to one year
One to five years
Five to10 years >10 years Total
Cash and balances at central banks 3 348 778 – – – – – 3 348 778
Loans and advances to banks 3 085 823 7 683 12 008 84 727 800 – 3 191 041
Non-sovereign and non-bank cash placements 536 259 – – – – – 536 259
Reverse repurchase agreements and cash collateral on securities borrowed 1 854 370 212 168 25 320 219 209 47 903 – 2 358 970
Sovereign debt securities 1 342 667 849 724 403 512 464 710 199 667 544 347 3 804 627
Bank debt securities 17 964 20 002 51 691 396 708 146 838 5 986 639 189
Other debt securities 72 244 50 091 15 098 355 805 295 425 326 895 1 115 558
Derivative financial instruments 203 764 66 881 63 193 296 161 159 131 144 751 933 881
Securities arising from trading activities 13 115 1 091 16 430 97 784 61 980 168 924 359 324
Loans and advances to customers (gross) 2 793 075 1 194 457 2 029 732 10 978 285 2 130 814 3 262 278 22 388 641
Own originated loans and advances to customers securitised (gross) 217 152 77 2 243 28 688 486 147 517 524
Other loans and advances (gross) 2 542 2 608 814 25 000 60 929 271 194 363 087
Other securitised assets (gross) – – – – – 12 851 12 851
Other assets 214 277 – – – – – 214 277
Total on-balance sheet exposures 13 485 095 2 404 857 2 617 875 12 920 632 3 132 175 5 223 373 39 784 007
Guarantees^ 217 070 56 747 48 839 552 272 31 962 59 649 966 539
Contingent liabilities, committed facilities and other 993 771 338 030 344 586 1 607 694 321 407 1 046 245 4 651 733
Total off-balance sheet exposures 1 210 841 394 777 393 425 2 159 966 353 369 1 105 894 5 618 272
Total gross credit and counterparty exposures pre-collateral or othercredit enhancements 14 695 936 2 799 634 3 011 300 15 080 598 3 485 544 6 329 267 45 402 279
^ Excludes guarantees provided to clients which are backed/secured by cash on deposit with the group.
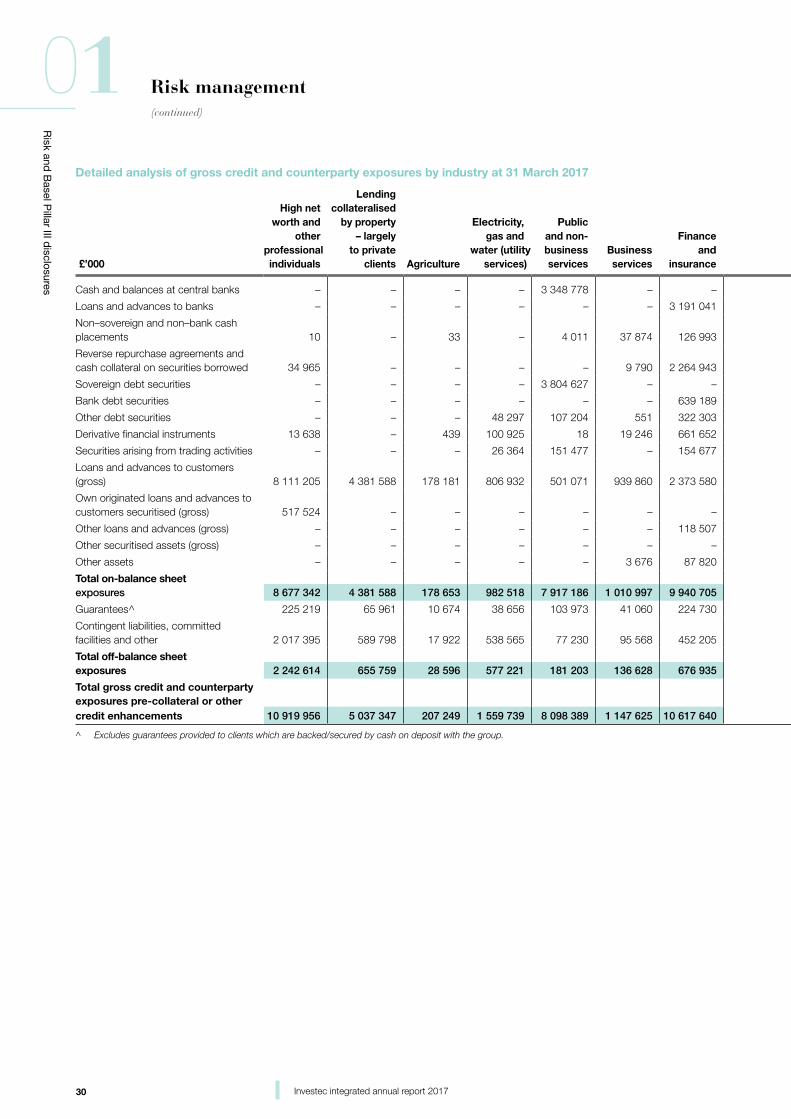
30 Investec integrated annual report 2017
Risk and
Basel P
illar III disclosures
01 Risk management(continued)
Detailed analysis of gross credit and counterparty exposures by industry at 31 March 2017
£’000
High networth and
otherprofessional individuals
Lending collateralised
by property – largely
to private clients Agriculture
Electricity, gas and
water (utility services)
Public and non-business services
Business services
Finance and
insurance
Retailers and
wholesalers
Manufac-turing and commerce
Construc-tion
Corporate commercial
real estate
Other residential mortgages
Mining and
resources
Leisure, entertain-ment and
tourism Transport
Com-munication Total
Cash and balances at central banks – – – – 3 348 778 – – – – – – – – – – – 3 348 778
Loans and advances to banks – – – – – – 3 191 041 – – – – – – – – – 3 191 041
Non–sovereign and non–bank cash placements 10 – 33 – 4 011 37 874 126 993 93 070 149 321 14 730 11 991 – 45 205 – 32 962 20 059 536 259
Reverse repurchase agreements and cash collateral on securities borrowed 34 965 – – – – 9 790 2 264 943 – 46 832 – – – – – – 2 440 2 358 970
Sovereign debt securities – – – – 3 804 627 – – – – – – – – – – – 3 804 627
Bank debt securities – – – – – – 639 189 – – – – – – – – – 639 189
Other debt securities – – – 48 297 107 204 551 322 303 195 137 851 – 42 247 74 338 184 769 2 775 43 434 151 594 1 115 558
Derivative financial instruments 13 638 – 439 100 925 18 19 246 661 652 23 646 53 399 704 21 618 – 15 412 6 821 12 585 3 778 933 881
Securities arising from trading activities – – – 26 364 151 477 – 154 677 2 313 1 771 – – 2 892 – 1 958 3 037 14 835 359 324
Loans and advances to customers (gross) 8 111 205 4 381 588 178 181 806 932 501 071 939 860 2 373 580 582 349 1 327 533 288 548 444 365 – 314 266 381 762 1 228 453 528 948 22 388 641
Own originated loans and advances to customers securitised (gross) 517 524 – – – – – – – – – – – – – – – 517 524
Other loans and advances (gross) – – – – – – 118 507 – – – 48 244 532 – – – – 363 087
Other securitised assets (gross) – – – – – – – – – – – 12 851 – – – – 12 851
Other assets – – – – – 3 676 87 820 87 658 16 305 15 968 – – – 2 363 9 478 214 277
Total on-balance sheetexposures 8 677 342 4 381 588 178 653 982 518 7 917 186 1 010 997 9 940 705 789 231 1 733 012 319 950 520 269 334 613 559 652 395 679 1 320 480 722 132 39 784 007
Guarantees^ 225 219 65 961 10 674 38 656 103 973 41 060 224 730 59 008 58 763 5 598 5 134 – 110 676 7 454 3 815 5 818 966 539
Contingent liabilities, committed facilities and other 2 017 395 589 798 17 922 538 565 77 230 95 568 452 205 195 699 116 151 32 105 24 343 – 309 786 24 046 118 571 42 349 4 651 733
Total off-balance sheetexposures 2 242 614 655 759 28 596 577 221 181 203 136 628 676 935 254 707 174 914 37 703 29 477 – 420 462 31 500 122 386 48 167 5 618 272
Total gross credit and counterparty exposures pre-collateral or othercredit enhancements 10 919 956 5 037 347 207 249 1 559 739 8 098 389 1 147 625 10 617 640 1 043 938 1 907 926 357 653 549 746 334 613 980 114 427 179 1 442 866 770 299 45 402 279
^ Excludes guarantees provided to clients which are backed/secured by cash on deposit with the group.
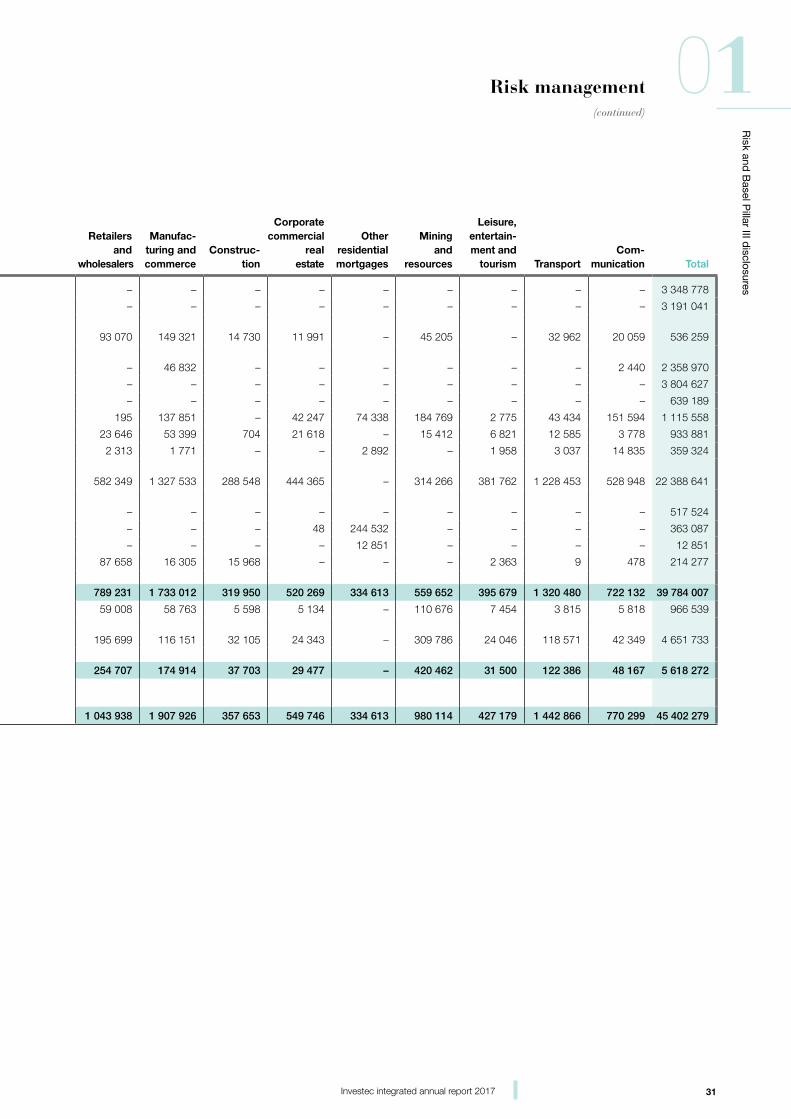
31Investec integrated annual report 2017
Risk and
Basel P
illar III disclosures
01Risk management(continued)
Detailed analysis of gross credit and counterparty exposures by industry at 31 March 2017
£’000
High networth and
otherprofessional individuals
Lending collateralised
by property – largely
to private clients Agriculture
Electricity, gas and
water (utility services)
Public and non-business services
Business services
Finance and
insurance
Retailers and
wholesalers
Manufac-turing and commerce
Construc-tion
Corporate commercial
real estate
Other residential mortgages
Mining and
resources
Leisure, entertain-ment and
tourism Transport
Com-munication Total
Cash and balances at central banks – – – – 3 348 778 – – – – – – – – – – – 3 348 778
Loans and advances to banks – – – – – – 3 191 041 – – – – – – – – – 3 191 041
Non–sovereign and non–bank cash placements 10 – 33 – 4 011 37 874 126 993 93 070 149 321 14 730 11 991 – 45 205 – 32 962 20 059 536 259
Reverse repurchase agreements and cash collateral on securities borrowed 34 965 – – – – 9 790 2 264 943 – 46 832 – – – – – – 2 440 2 358 970
Sovereign debt securities – – – – 3 804 627 – – – – – – – – – – – 3 804 627
Bank debt securities – – – – – – 639 189 – – – – – – – – – 639 189
Other debt securities – – – 48 297 107 204 551 322 303 195 137 851 – 42 247 74 338 184 769 2 775 43 434 151 594 1 115 558
Derivative financial instruments 13 638 – 439 100 925 18 19 246 661 652 23 646 53 399 704 21 618 – 15 412 6 821 12 585 3 778 933 881
Securities arising from trading activities – – – 26 364 151 477 – 154 677 2 313 1 771 – – 2 892 – 1 958 3 037 14 835 359 324
Loans and advances to customers (gross) 8 111 205 4 381 588 178 181 806 932 501 071 939 860 2 373 580 582 349 1 327 533 288 548 444 365 – 314 266 381 762 1 228 453 528 948 22 388 641
Own originated loans and advances to customers securitised (gross) 517 524 – – – – – – – – – – – – – – – 517 524
Other loans and advances (gross) – – – – – – 118 507 – – – 48 244 532 – – – – 363 087
Other securitised assets (gross) – – – – – – – – – – – 12 851 – – – – 12 851
Other assets – – – – – 3 676 87 820 87 658 16 305 15 968 – – – 2 363 9 478 214 277
Total on-balance sheetexposures 8 677 342 4 381 588 178 653 982 518 7 917 186 1 010 997 9 940 705 789 231 1 733 012 319 950 520 269 334 613 559 652 395 679 1 320 480 722 132 39 784 007
Guarantees^ 225 219 65 961 10 674 38 656 103 973 41 060 224 730 59 008 58 763 5 598 5 134 – 110 676 7 454 3 815 5 818 966 539
Contingent liabilities, committed facilities and other 2 017 395 589 798 17 922 538 565 77 230 95 568 452 205 195 699 116 151 32 105 24 343 – 309 786 24 046 118 571 42 349 4 651 733
Total off-balance sheetexposures 2 242 614 655 759 28 596 577 221 181 203 136 628 676 935 254 707 174 914 37 703 29 477 – 420 462 31 500 122 386 48 167 5 618 272
Total gross credit and counterparty exposures pre-collateral or othercredit enhancements 10 919 956 5 037 347 207 249 1 559 739 8 098 389 1 147 625 10 617 640 1 043 938 1 907 926 357 653 549 746 334 613 980 114 427 179 1 442 866 770 299 45 402 279
^ Excludes guarantees provided to clients which are backed/secured by cash on deposit with the group.
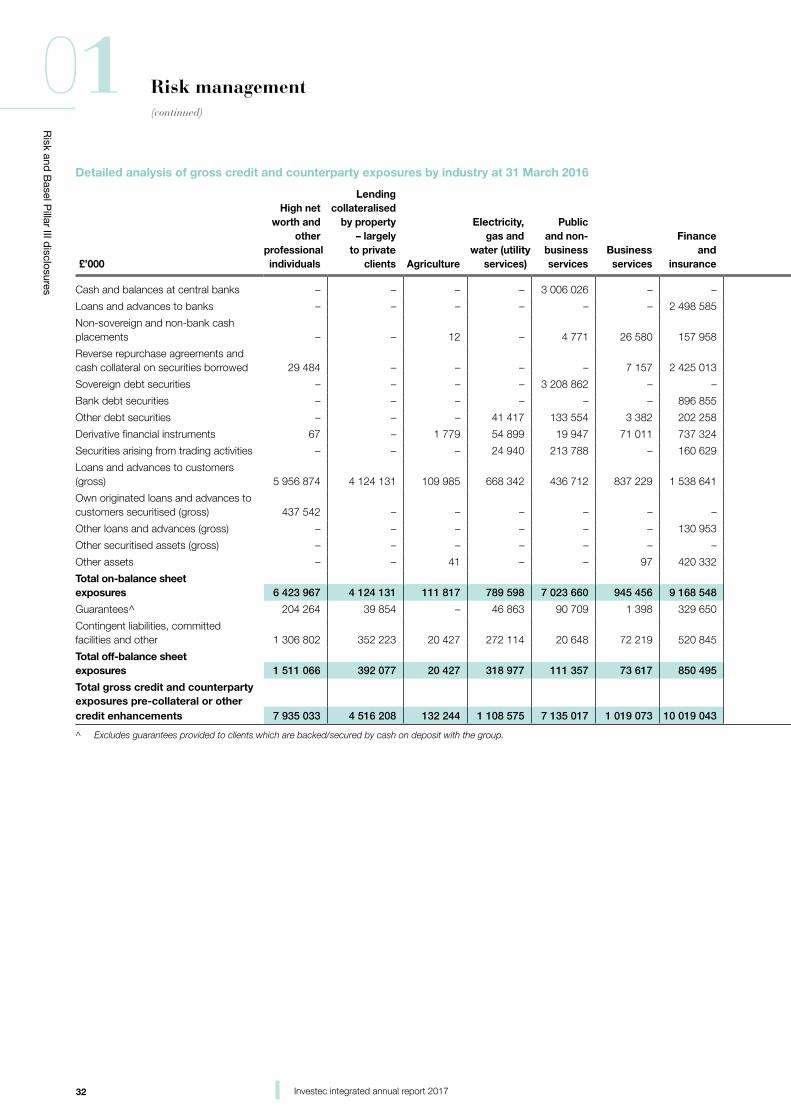
32 Investec integrated annual report 2017
Risk and
Basel P
illar III disclosures
01 Risk management(continued)
Detailed analysis of gross credit and counterparty exposures by industry at 31 March 2016
£’000
High networth and
otherprofessional individuals
Lending collateralised
by property – largely
to private clients Agriculture
Electricity, gas and
water (utility services)
Public and non-business services
Business services
Finance and
insurance
Retailers and
wholesalers
Manufac-turing and commerce
Construc-tion
Corporate commercial
real estate
Other residential mortgages
Mining and
resources
Leisure, entertain-ment and
tourism Transport
Com-munication Total
Cash and balances at central banks – – – – 3 006 026 – – – – – – – – – – – 3 006 026
Loans and advances to banks – – – – – – 2 498 585 – – – – – – – – – 2 498 585
Non-sovereign and non-bank cash placements – – 12 – 4 771 26 580 157 958 84 314 69 508 9 990 – – 74 846 – 14 776 23 818 466 573
Reverse repurchase agreements and cash collateral on securities borrowed 29 484 – – – – 7 157 2 425 013 – 31 956 – – – – – 3 515 – 2 497 125
Sovereign debt securities – – – – 3 208 862 – – – – – – – – – – – 3 208 862
Bank debt securities – – – – – – 896 855 – – – – – – – – – 896 855
Other debt securities – – – 41 417 133 554 3 382 202 258 – 60 710 – – 106 246 184 693 4 017 26 914 186 742 949 933
Derivative financial instruments 67 – 1 779 54 899 19 947 71 011 737 324 37 983 58 771 1 804 33 496 – 16 979 17 425 22 607 7 301 1 081 393
Securities arising from trading activities – – – 24 940 213 788 – 160 629 35 2 481 – 781 – – 1 093 4 856 10 889 419 492
Loans and advances to customers (gross) 5 956 874 4 124 131 109 985 668 342 436 712 837 229 1 538 641 510 846 976 420 203 047 410 962 – 361 218 313 645 955 582 464 189 17 867 823
Own originated loans and advances to customers securitised (gross) 437 542 – – – – – – – – – – – – – – – 437 542
Other loans and advances (gross) – – – – – – 130 953 – – – 85 219 585 – – – – 350 623
Other securitised assets (gross) – – – – – – – – – – – 11 341 – – – – 11 341
Other assets – – 41 – – 97 420 332 73 640 4 355 147 – – – 928 – 503 500 043
Total on-balance sheetexposures 6 423 967 4 124 131 111 817 789 598 7 023 660 945 456 9 168 548 706 818 1 204 201 214 988 445 324 337 172 637 736 337 108 1 028 250 693 442 34 192 216
Guarantees^ 204 264 39 854 – 46 863 90 709 1 398 329 650 3 553 6 424 14 537 – 87 901 8 3 073 8 899 823 147
Contingent liabilities, committed facilities and other 1 306 802 352 223 20 427 272 114 20 648 72 219 520 845 182 387 95 145 10 490 38 852 – 297 184 14 340 163 564 48 370 3 415 610
Total off-balance sheetexposures 1 511 066 392 077 20 427 318 977 111 357 73 617 850 495 185 940 101 569 10 504 39 389 – 385 085 14 348 166 637 57 269 4 238 757
Total gross credit and counterparty exposures pre-collateral or othercredit enhancements 7 935 033 4 516 208 132 244 1 108 575 7 135 017 1 019 073 10 019 043 892 758 1 305 770 225 492 484 713 337 172 1 022 821 351 456 1 194 887 750 711 38 430 973
^ Excludes guarantees provided to clients which are backed/secured by cash on deposit with the group.

33Investec integrated annual report 2017
Risk and
Basel P
illar III disclosures
01Risk management(continued)
Detailed analysis of gross credit and counterparty exposures by industry at 31 March 2016
£’000
High networth and
otherprofessional individuals
Lending collateralised
by property – largely
to private clients Agriculture
Electricity, gas and
water (utility services)
Public and non-business services
Business services
Finance and
insurance
Retailers and
wholesalers
Manufac-turing and commerce
Construc-tion
Corporate commercial
real estate
Other residential mortgages
Mining and
resources
Leisure, entertain-ment and
tourism Transport
Com-munication Total
Cash and balances at central banks – – – – 3 006 026 – – – – – – – – – – – 3 006 026
Loans and advances to banks – – – – – – 2 498 585 – – – – – – – – – 2 498 585
Non-sovereign and non-bank cash placements – – 12 – 4 771 26 580 157 958 84 314 69 508 9 990 – – 74 846 – 14 776 23 818 466 573
Reverse repurchase agreements and cash collateral on securities borrowed 29 484 – – – – 7 157 2 425 013 – 31 956 – – – – – 3 515 – 2 497 125
Sovereign debt securities – – – – 3 208 862 – – – – – – – – – – – 3 208 862
Bank debt securities – – – – – – 896 855 – – – – – – – – – 896 855
Other debt securities – – – 41 417 133 554 3 382 202 258 – 60 710 – – 106 246 184 693 4 017 26 914 186 742 949 933
Derivative financial instruments 67 – 1 779 54 899 19 947 71 011 737 324 37 983 58 771 1 804 33 496 – 16 979 17 425 22 607 7 301 1 081 393
Securities arising from trading activities – – – 24 940 213 788 – 160 629 35 2 481 – 781 – – 1 093 4 856 10 889 419 492
Loans and advances to customers (gross) 5 956 874 4 124 131 109 985 668 342 436 712 837 229 1 538 641 510 846 976 420 203 047 410 962 – 361 218 313 645 955 582 464 189 17 867 823
Own originated loans and advances to customers securitised (gross) 437 542 – – – – – – – – – – – – – – – 437 542
Other loans and advances (gross) – – – – – – 130 953 – – – 85 219 585 – – – – 350 623
Other securitised assets (gross) – – – – – – – – – – – 11 341 – – – – 11 341
Other assets – – 41 – – 97 420 332 73 640 4 355 147 – – – 928 – 503 500 043
Total on-balance sheetexposures 6 423 967 4 124 131 111 817 789 598 7 023 660 945 456 9 168 548 706 818 1 204 201 214 988 445 324 337 172 637 736 337 108 1 028 250 693 442 34 192 216
Guarantees^ 204 264 39 854 – 46 863 90 709 1 398 329 650 3 553 6 424 14 537 – 87 901 8 3 073 8 899 823 147
Contingent liabilities, committed facilities and other 1 306 802 352 223 20 427 272 114 20 648 72 219 520 845 182 387 95 145 10 490 38 852 – 297 184 14 340 163 564 48 370 3 415 610
Total off-balance sheetexposures 1 511 066 392 077 20 427 318 977 111 357 73 617 850 495 185 940 101 569 10 504 39 389 – 385 085 14 348 166 637 57 269 4 238 757
Total gross credit and counterparty exposures pre-collateral or othercredit enhancements 7 935 033 4 516 208 132 244 1 108 575 7 135 017 1 019 073 10 019 043 892 758 1 305 770 225 492 484 713 337 172 1 022 821 351 456 1 194 887 750 711 38 430 973
^ Excludes guarantees provided to clients which are backed/secured by cash on deposit with the group.
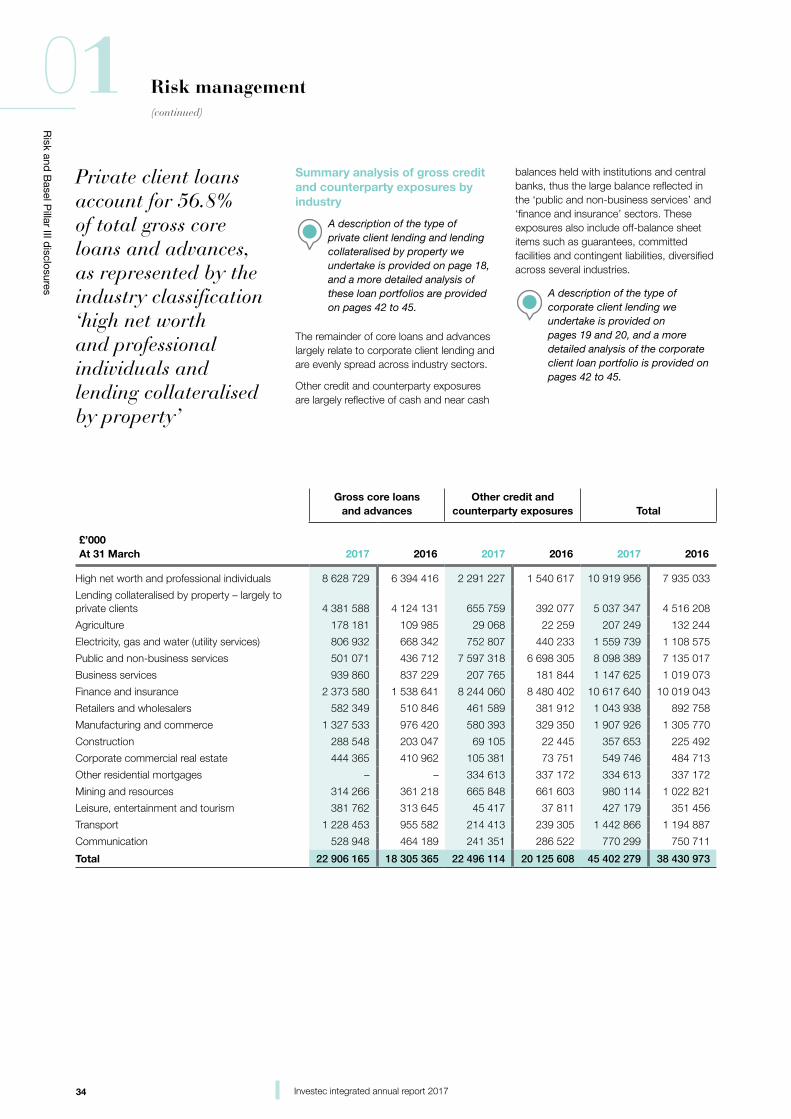
34 Investec integrated annual report 2017
Risk and
Basel P
illar III disclosures
01 Risk management(continued)
Private client loans account for 56.8% of total gross core loans and advances, as represented by the industry classification ‘high net worth and professional individuals and lending collateralised by property’
Summary analysis of gross credit and counterparty exposures by industry
A description of the type of private client lending and lending collateralised by property we undertake is provided on page 18, and a more detailed analysis of these loan portfolios are provided on pages 42 to 45.
The remainder of core loans and advances largely relate to corporate client lending and are evenly spread across industry sectors.
Other credit and counterparty exposures are largely reflective of cash and near cash
balances held with institutions and central banks, thus the large balance reflected in the ‘public and non-business services’ and ‘finance and insurance’ sectors. These exposures also include off-balance sheet items such as guarantees, committed facilities and contingent liabilities, diversified across several industries.
A description of the type of corporate client lending we undertake is provided on pages 19 and 20, and a more detailed analysis of the corporate client loan portfolio is provided on pages 42 to 45.
Gross core loans and advances
Other credit and counterparty exposures Total
£’000At 31 March 2017 2016 2017 2016 2017 2016
High net worth and professional individuals 8 628 729 6 394 416 2 291 227 1 540 617 10 919 956 7 935 033
Lending collateralised by property – largely to private clients 4 381 588 4 124 131 655 759 392 077 5 037 347 4 516 208
Agriculture 178 181 109 985 29 068 22 259 207 249 132 244
Electricity, gas and water (utility services) 806 932 668 342 752 807 440 233 1 559 739 1 108 575
Public and non-business services 501 071 436 712 7 597 318 6 698 305 8 098 389 7 135 017
Business services 939 860 837 229 207 765 181 844 1 147 625 1 019 073
Finance and insurance 2 373 580 1 538 641 8 244 060 8 480 402 10 617 640 10 019 043
Retailers and wholesalers 582 349 510 846 461 589 381 912 1 043 938 892 758
Manufacturing and commerce 1 327 533 976 420 580 393 329 350 1 907 926 1 305 770
Construction 288 548 203 047 69 105 22 445 357 653 225 492
Corporate commercial real estate 444 365 410 962 105 381 73 751 549 746 484 713
Other residential mortgages – – 334 613 337 172 334 613 337 172
Mining and resources 314 266 361 218 665 848 661 603 980 114 1 022 821
Leisure, entertainment and tourism 381 762 313 645 45 417 37 811 427 179 351 456
Transport 1 228 453 955 582 214 413 239 305 1 442 866 1 194 887
Communication 528 948 464 189 241 351 286 522 770 299 750 711
Total 22 906 165 18 305 365 22 496 114 20 125 608 45 402 279 38 430 973
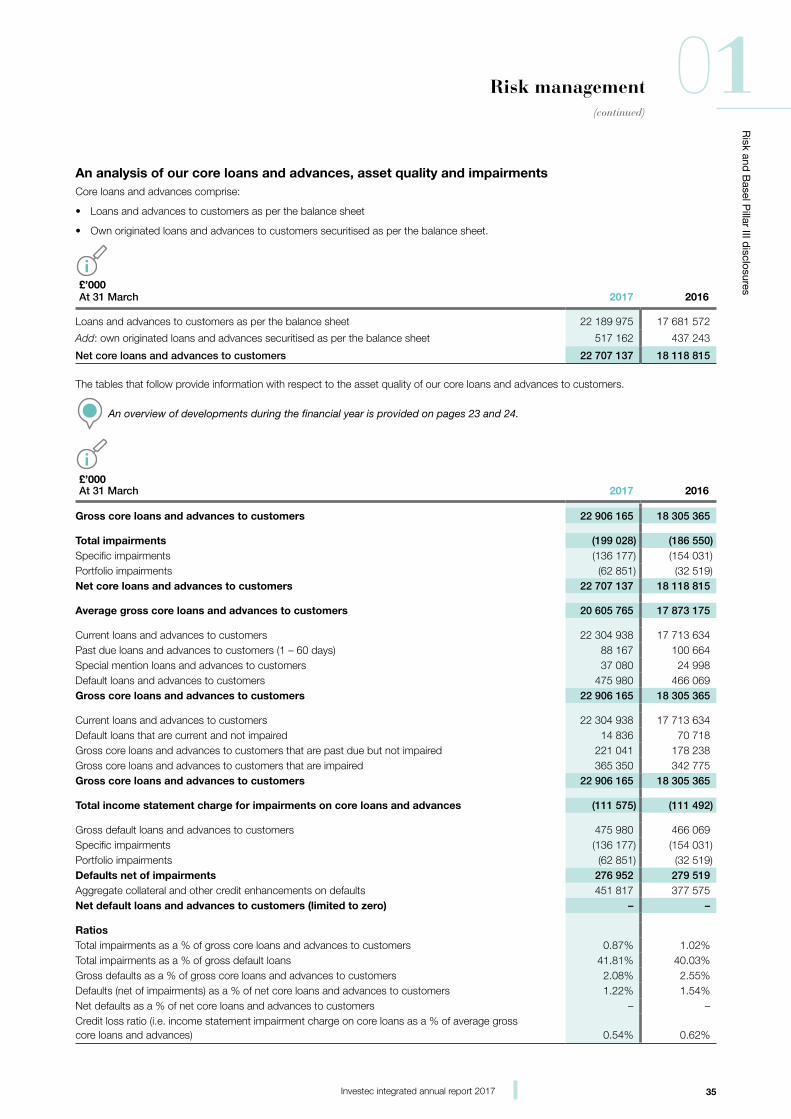
35Investec integrated annual report 2017
Risk and
Basel P
illar III disclosures
01Risk management(continued)
An analysis of our core loans and advances, asset quality and impairmentsCore loans and advances comprise:
• Loans and advances to customers as per the balance sheet
• Own originated loans and advances to customers securitised as per the balance sheet.
£’000At 31 March 2017 2016
Loans and advances to customers as per the balance sheet 22 189 975 17 681 572
Add: own originated loans and advances securitised as per the balance sheet 517 162 437 243
Net core loans and advances to customers 22 707 137 18 118 815
The tables that follow provide information with respect to the asset quality of our core loans and advances to customers.
An overview of developments during the financial year is provided on pages 23 and 24.
£’000At 31 March 2017 2016
Gross core loans and advances to customers 22 906 165 18 305 365
Total impairments (199 028) (186 550)Specific impairments (136 177) (154 031)Portfolio impairments (62 851) (32 519)Net core loans and advances to customers 22 707 137 18 118 815
Average gross core loans and advances to customers 20 605 765 17 873 175
Current loans and advances to customers 22 304 938 17 713 634 Past due loans and advances to customers (1 – 60 days) 88 167 100 664 Special mention loans and advances to customers 37 080 24 998 Default loans and advances to customers 475 980 466 069 Gross core loans and advances to customers 22 906 165 18 305 365
Current loans and advances to customers 22 304 938 17 713 634 Default loans that are current and not impaired 14 836 70 718 Gross core loans and advances to customers that are past due but not impaired 221 041 178 238 Gross core loans and advances to customers that are impaired 365 350 342 775 Gross core loans and advances to customers 22 906 165 18 305 365
Total income statement charge for impairments on core loans and advances (111 575) (111 492)
Gross default loans and advances to customers 475 980 466 069 Specific impairments (136 177) (154 031)Portfolio impairments (62 851) (32 519)Defaults net of impairments 276 952 279 519 Aggregate collateral and other credit enhancements on defaults 451 817 377 575 Net default loans and advances to customers (limited to zero) – –
RatiosTotal impairments as a % of gross core loans and advances to customers 0.87% 1.02%Total impairments as a % of gross default loans 41.81% 40.03%Gross defaults as a % of gross core loans and advances to customers 2.08% 2.55%Defaults (net of impairments) as a % of net core loans and advances to customers 1.22% 1.54%Net defaults as a % of net core loans and advances to customers – –Credit loss ratio (i.e. income statement impairment charge on core loans as a % of average gross core loans and advances) 0.54% 0.62%
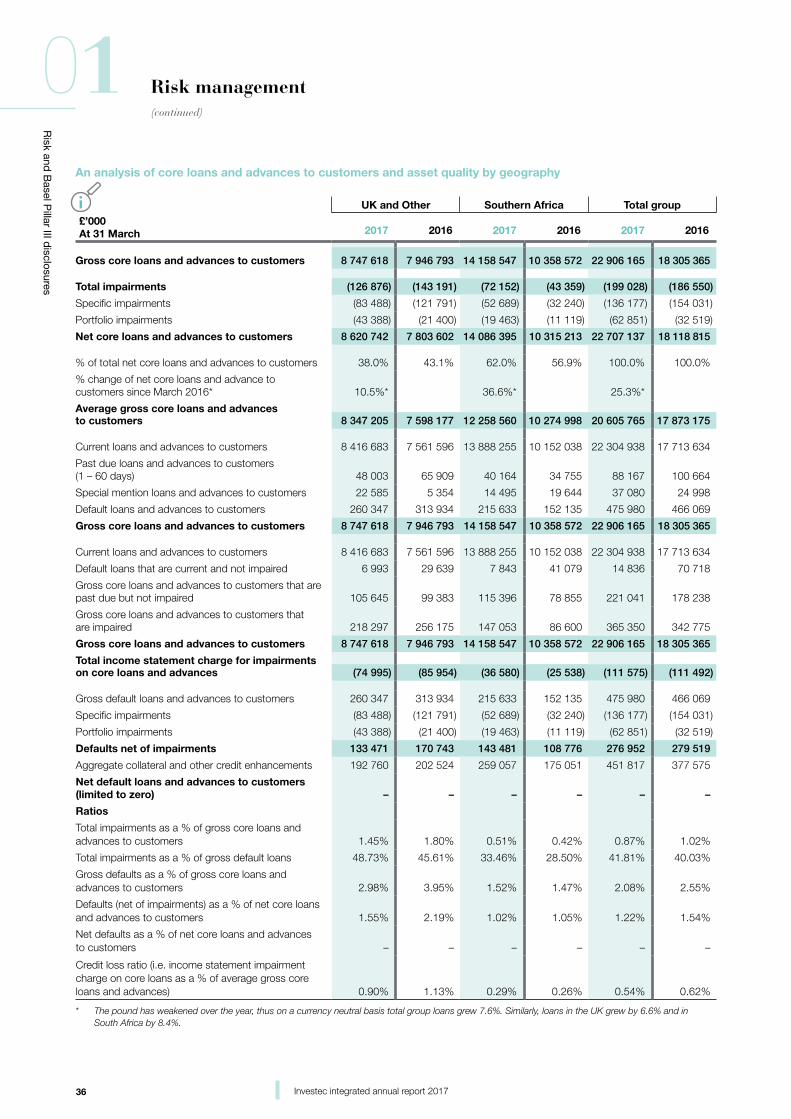
36 Investec integrated annual report 2017
Risk and
Basel P
illar III disclosures
01 Risk management(continued)
An analysis of core loans and advances to customers and asset quality by geography
£’000At 31 March
UK and Other Southern Africa Total group
2017 2016 2017 2016 2017 2016
Gross core loans and advances to customers 8 747 618 7 946 793 14 158 547 10 358 572 22 906 165 18 305 365
Total impairments (126 876) (143 191) (72 152) (43 359) (199 028) (186 550)
Specific impairments (83 488) (121 791) (52 689) (32 240) (136 177) (154 031)
Portfolio impairments (43 388) (21 400) (19 463) (11 119) (62 851) (32 519)
Net core loans and advances to customers 8 620 742 7 803 602 14 086 395 10 315 213 22 707 137 18 118 815
% of total net core loans and advances to customers 38.0% 43.1% 62.0% 56.9% 100.0% 100.0%
% change of net core loans and advance to customers since March 2016* 10.5%* 36.6%* 25.3%*
Average gross core loans and advancesto customers 8 347 205 7 598 177 12 258 560 10 274 998 20 605 765 17 873 175
Current loans and advances to customers 8 416 683 7 561 596 13 888 255 10 152 038 22 304 938 17 713 634
Past due loans and advances to customers (1 – 60 days) 48 003 65 909 40 164 34 755 88 167 100 664
Special mention loans and advances to customers 22 585 5 354 14 495 19 644 37 080 24 998
Default loans and advances to customers 260 347 313 934 215 633 152 135 475 980 466 069
Gross core loans and advances to customers 8 747 618 7 946 793 14 158 547 10 358 572 22 906 165 18 305 365
Current loans and advances to customers 8 416 683 7 561 596 13 888 255 10 152 038 22 304 938 17 713 634
Default loans that are current and not impaired 6 993 29 639 7 843 41 079 14 836 70 718
Gross core loans and advances to customers that are past due but not impaired 105 645 99 383 115 396 78 855 221 041 178 238
Gross core loans and advances to customers that are impaired 218 297 256 175 147 053 86 600 365 350 342 775
Gross core loans and advances to customers 8 747 618 7 946 793 14 158 547 10 358 572 22 906 165 18 305 365
Total income statement charge for impairmentson core loans and advances (74 995) (85 954) (36 580) (25 538) (111 575) (111 492)
Gross default loans and advances to customers 260 347 313 934 215 633 152 135 475 980 466 069
Specific impairments (83 488) (121 791) (52 689) (32 240) (136 177) (154 031)
Portfolio impairments (43 388) (21 400) (19 463) (11 119) (62 851) (32 519)
Defaults net of impairments 133 471 170 743 143 481 108 776 276 952 279 519
Aggregate collateral and other credit enhancements 192 760 202 524 259 057 175 051 451 817 377 575
Net default loans and advances to customers (limited to zero) – – – – – –
Ratios
Total impairments as a % of gross core loans and advances to customers 1.45% 1.80% 0.51% 0.42% 0.87% 1.02%
Total impairments as a % of gross default loans 48.73% 45.61% 33.46% 28.50% 41.81% 40.03%
Gross defaults as a % of gross core loans and advances to customers 2.98% 3.95% 1.52% 1.47% 2.08% 2.55%
Defaults (net of impairments) as a % of net core loans and advances to customers 1.55% 2.19% 1.02% 1.05% 1.22% 1.54%
Net defaults as a % of net core loans and advances to customers – – – – – –
Credit loss ratio (i.e. income statement impairment charge on core loans as a % of average gross core loans and advances) 0.90% 1.13% 0.29% 0.26% 0.54% 0.62%
* The pound has weakened over the year, thus on a currency neutral basis total group loans grew 7.6%. Similarly, loans in the UK grew by 6.6% and in South Africa by 8.4%.
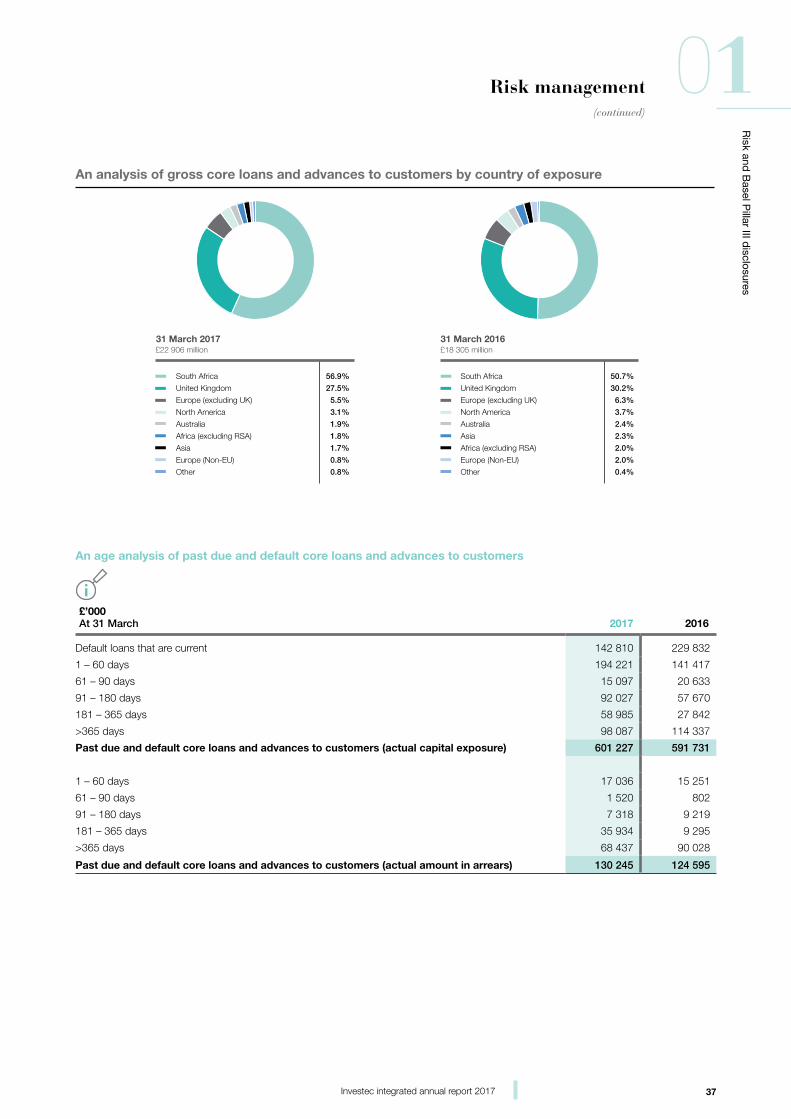
37Investec integrated annual report 2017
Risk and
Basel P
illar III disclosures
01Risk management(continued)
An age analysis of past due and default core loans and advances to customers
£’000At 31 March 2017 2016
Default loans that are current 142 810 229 832
1 – 60 days 194 221 141 417
61 – 90 days 15 097 20 633
91 – 180 days 92 027 57 670
181 – 365 days 58 985 27 842
>365 days 98 087 114 337
Past due and default core loans and advances to customers (actual capital exposure) 601 227 591 731
1 – 60 days 17 036 15 251
61 – 90 days 1 520 802
91 – 180 days 7 318 9 219
181 – 365 days 35 934 9 295
>365 days 68 437 90 028
Past due and default core loans and advances to customers (actual amount in arrears) 130 245 124 595
£18 305 million£22 906 million
50.7%
30.2%
6.3%
3.7%
2.4%
2.3%
2.0%
2.0%
0.4%
31 March 2016
South Africa
United Kingdom
Europe (excluding UK)
North America
Australia
Asia
Africa (excluding RSA)
Europe (Non-EU)
Other
An analysis of gross core loans and advances to customers by country of exposure
56.9%
27.5%
5.5%
3.1%
1.9%
1.8%
1.7%
0.8%
0.8%
31 March 2017
South Africa
United Kingdom
Europe (excluding UK)
North America
Australia
Africa (excluding RSA)
Asia
Europe (Non-EU)
Other
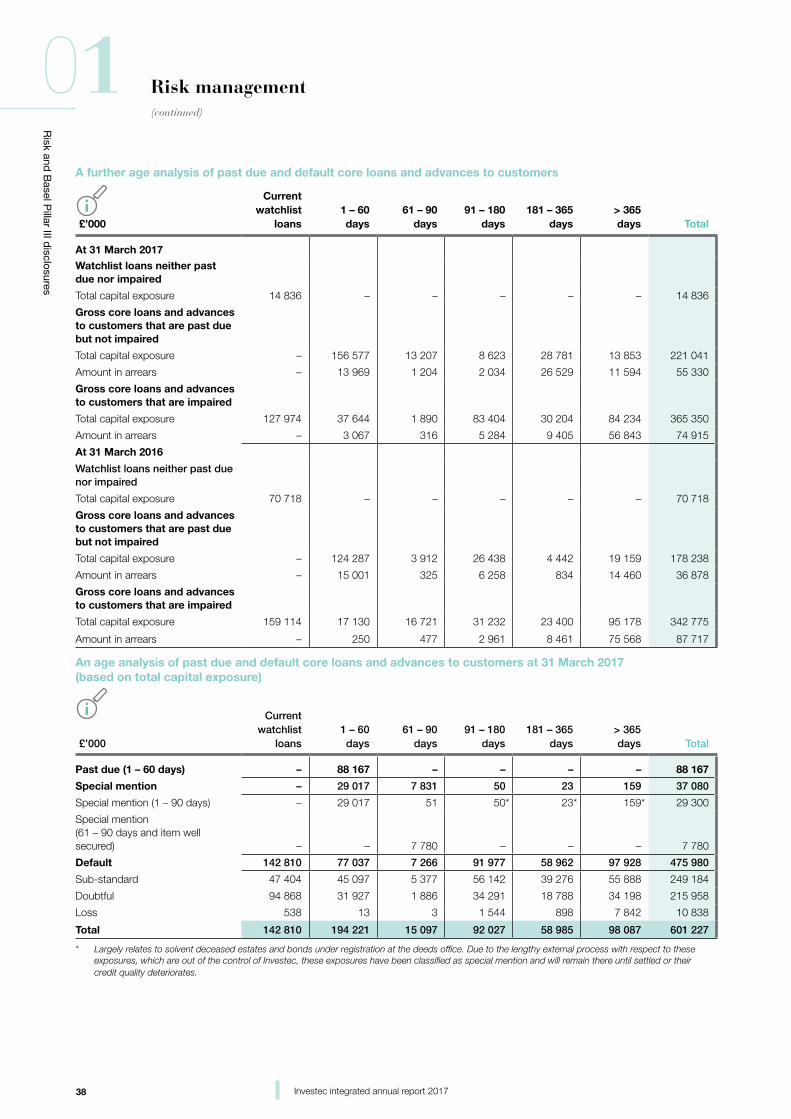
38 Investec integrated annual report 2017
Risk and
Basel P
illar III disclosures
01 Risk management(continued)
A further age analysis of past due and default core loans and advances to customers
£’000
Current watchlist
loans1 – 60 days
61 – 90 days
91 – 180 days
181 – 365 days
> 365 days Total
At 31 March 2017
Watchlist loans neither past due nor impaired
Total capital exposure 14 836 – – – – – 14 836
Gross core loans and advances to customers that are past due but not impaired
Total capital exposure – 156 577 13 207 8 623 28 781 13 853 221 041
Amount in arrears – 13 969 1 204 2 034 26 529 11 594 55 330
Gross core loans and advances to customers that are impaired
Total capital exposure 127 974 37 644 1 890 83 404 30 204 84 234 365 350
Amount in arrears – 3 067 316 5 284 9 405 56 843 74 915
At 31 March 2016
Watchlist loans neither past due nor impaired
Total capital exposure 70 718 – – – – – 70 718
Gross core loans and advances to customers that are past due but not impaired
Total capital exposure – 124 287 3 912 26 438 4 442 19 159 178 238
Amount in arrears – 15 001 325 6 258 834 14 460 36 878
Gross core loans and advances to customers that are impaired
Total capital exposure 159 114 17 130 16 721 31 232 23 400 95 178 342 775
Amount in arrears – 250 477 2 961 8 461 75 568 87 717
An age analysis of past due and default core loans and advances to customers at 31 March 2017 (based on total capital exposure)
£’000
Current watchlist
loans1 – 60 days
61 – 90 days
91 – 180 days
181 – 365 days
> 365 days Total
Past due (1 – 60 days) – 88 167 – – – – 88 167
Special mention – 29 017 7 831 50 23 159 37 080
Special mention (1 – 90 days) – 29 017 51 50* 23* 159* 29 300
Special mention (61 – 90 days and item well secured) – – 7 780 – – – 7 780
Default 142 810 77 037 7 266 91 977 58 962 97 928 475 980
Sub-standard 47 404 45 097 5 377 56 142 39 276 55 888 249 184
Doubtful 94 868 31 927 1 886 34 291 18 788 34 198 215 958
Loss 538 13 3 1 544 898 7 842 10 838
Total 142 810 194 221 15 097 92 027 58 985 98 087 601 227
* Largely relates to solvent deceased estates and bonds under registration at the deeds office. Due to the lengthy external process with respect to these exposures, which are out of the control of Investec, these exposures have been classified as special mention and will remain there until settled or their credit quality deteriorates.
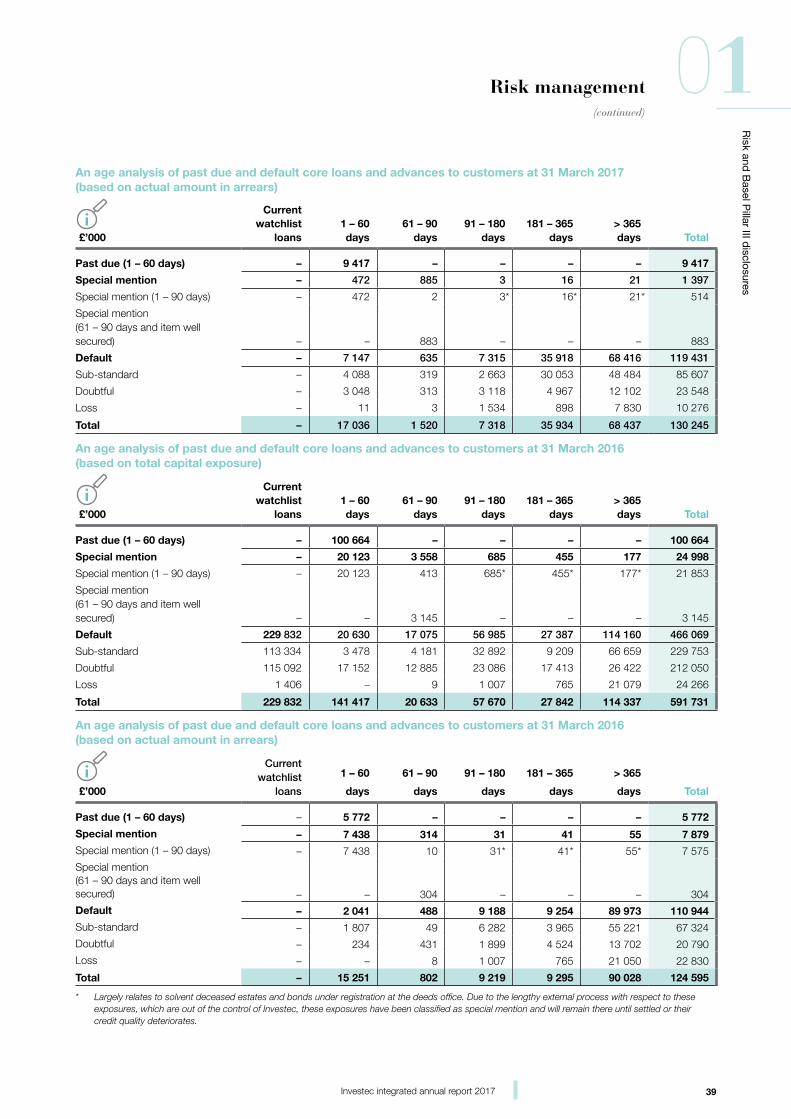
39Investec integrated annual report 2017
Risk and
Basel P
illar III disclosures
01Risk management(continued)
An age analysis of past due and default core loans and advances to customers at 31 March 2017 (based on actual amount in arrears)
£’000
Current watchlist
loans1 – 60 days
61 – 90 days
91 – 180 days
181 – 365 days
> 365 days Total
Past due (1 – 60 days) – 9 417 – – – – 9 417
Special mention – 472 885 3 16 21 1 397
Special mention (1 – 90 days) – 472 2 3* 16* 21* 514
Special mention (61 – 90 days and item well secured) – – 883 – – – 883
Default – 7 147 635 7 315 35 918 68 416 119 431
Sub-standard – 4 088 319 2 663 30 053 48 484 85 607
Doubtful – 3 048 313 3 118 4 967 12 102 23 548
Loss – 11 3 1 534 898 7 830 10 276
Total – 17 036 1 520 7 318 35 934 68 437 130 245
An age analysis of past due and default core loans and advances to customers at 31 March 2016 (based on total capital exposure)
£’000
Current watchlist
loans1 – 60 days
61 – 90 days
91 – 180 days
181 – 365 days
> 365 days Total
Past due (1 – 60 days) – 100 664 – – – – 100 664
Special mention – 20 123 3 558 685 455 177 24 998
Special mention (1 – 90 days) – 20 123 413 685* 455* 177* 21 853
Special mention (61 – 90 days and item well secured) – – 3 145 – – – 3 145
Default 229 832 20 630 17 075 56 985 27 387 114 160 466 069
Sub-standard 113 334 3 478 4 181 32 892 9 209 66 659 229 753
Doubtful 115 092 17 152 12 885 23 086 17 413 26 422 212 050
Loss 1 406 – 9 1 007 765 21 079 24 266
Total 229 832 141 417 20 633 57 670 27 842 114 337 591 731
An age analysis of past due and default core loans and advances to customers at 31 March 2016 (based on actual amount in arrears)
£’000
Current watchlist
loans
1 – 60
days
61 – 90
days
91 – 180
days
181 – 365
days
> 365
days Total
Past due (1 – 60 days) – 5 772 – – – – 5 772
Special mention – 7 438 314 31 41 55 7 879
Special mention (1 – 90 days) – 7 438 10 31* 41* 55* 7 575
Special mention (61 – 90 days and item well secured) – – 304 – – – 304
Default – 2 041 488 9 188 9 254 89 973 110 944
Sub-standard – 1 807 49 6 282 3 965 55 221 67 324
Doubtful – 234 431 1 899 4 524 13 702 20 790
Loss – – 8 1 007 765 21 050 22 830
Total – 15 251 802 9 219 9 295 90 028 124 595
* Largely relates to solvent deceased estates and bonds under registration at the deeds office. Due to the lengthy external process with respect to these exposures, which are out of the control of Investec, these exposures have been classified as special mention and will remain there until settled or their credit quality deteriorates.
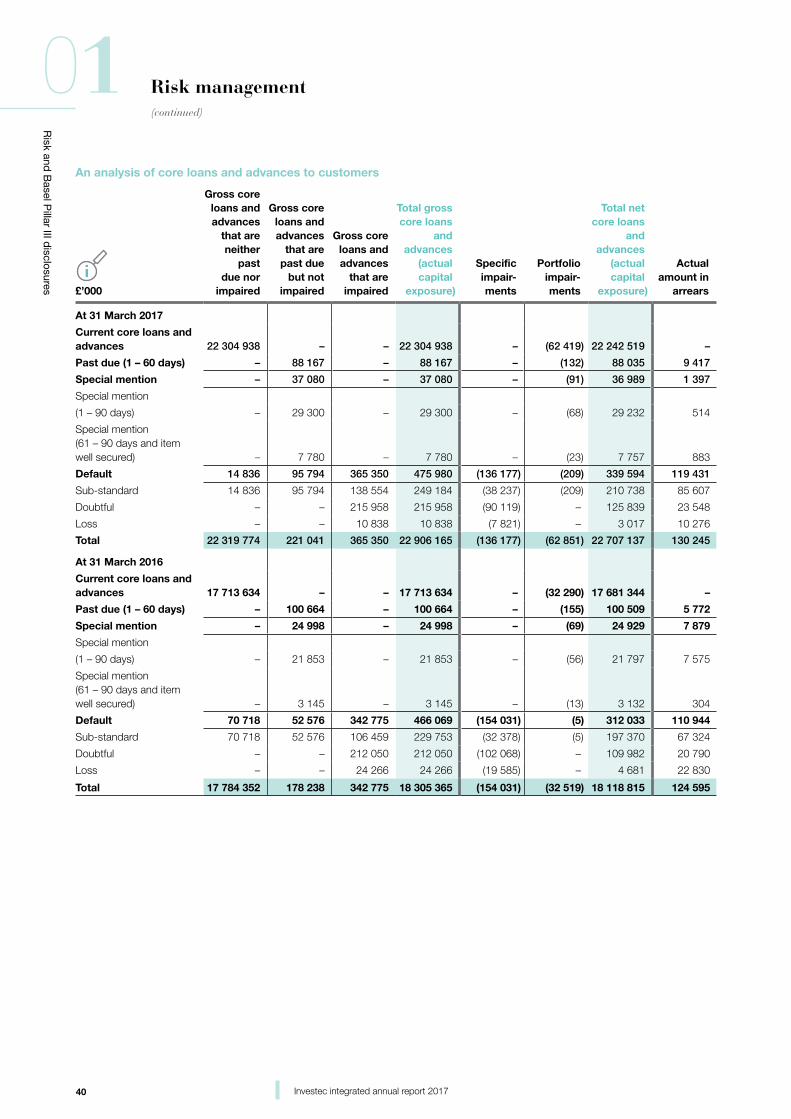
40 Investec integrated annual report 2017
Risk and
Basel P
illar III disclosures
01 Risk management(continued)
An analysis of core loans and advances to customers
£’000
Gross core loans and advances
that are neither
past due nor
impaired
Gross core loans and advances
that are past due
but not impaired
Gross core loans and advances
that are impaired
Total gross core loans
and advances
(actual capital
exposure)
Specific impair-
ments
Portfolio impair-
ments
Total net core loans
and advances
(actual capital
exposure)
Actual amount in
arrears
At 31 March 2017
Current core loans and advances 22 304 938 – – 22 304 938 – (62 419) 22 242 519 –
Past due (1 – 60 days) – 88 167 – 88 167 – (132) 88 035 9 417
Special mention – 37 080 – 37 080 – (91) 36 989 1 397
Special mention
(1 – 90 days) – 29 300 – 29 300 – (68) 29 232 514
Special mention (61 – 90 days and item well secured) – 7 780 – 7 780 – (23) 7 757 883
Default 14 836 95 794 365 350 475 980 (136 177) (209) 339 594 119 431
Sub-standard 14 836 95 794 138 554 249 184 (38 237) (209) 210 738 85 607
Doubtful – – 215 958 215 958 (90 119) – 125 839 23 548
Loss – – 10 838 10 838 (7 821) – 3 017 10 276
Total 22 319 774 221 041 365 350 22 906 165 (136 177) (62 851) 22 707 137 130 245
At 31 March 2016
Current core loans and advances 17 713 634 – – 17 713 634 – (32 290) 17 681 344 –
Past due (1 – 60 days) – 100 664 – 100 664 – (155) 100 509 5 772
Special mention – 24 998 – 24 998 – (69) 24 929 7 879
Special mention
(1 – 90 days) – 21 853 – 21 853 – (56) 21 797 7 575
Special mention (61 – 90 days and item well secured) – 3 145 – 3 145 – (13) 3 132 304
Default 70 718 52 576 342 775 466 069 (154 031) (5) 312 033 110 944
Sub-standard 70 718 52 576 106 459 229 753 (32 378) (5) 197 370 67 324
Doubtful – – 212 050 212 050 (102 068) – 109 982 20 790
Loss – – 24 266 24 266 (19 585) – 4 681 22 830
Total 17 784 352 178 238 342 775 18 305 365 (154 031) (32 519) 18 118 815 124 595
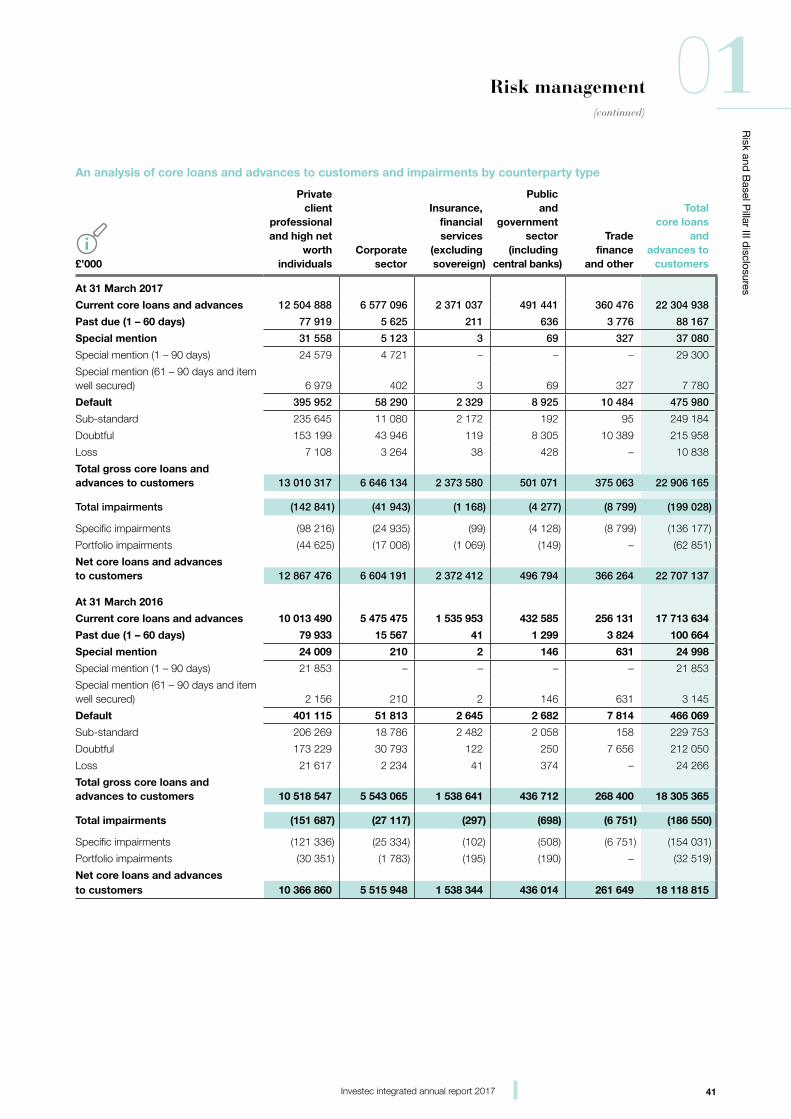
41Investec integrated annual report 2017
Risk and
Basel P
illar III disclosures
01Risk management(continued)
An analysis of core loans and advances to customers and impairments by counterparty type
£’000
Privateclient
professional and high net
worth individuals
Corporate sector
Insurance, financial services
(excluding sovereign)
Public and
government sector
(including central banks)
Trade finance
and other
Total core loans
and advances to customers
At 31 March 2017
Current core loans and advances 12 504 888 6 577 096 2 371 037 491 441 360 476 22 304 938
Past due (1 – 60 days) 77 919 5 625 211 636 3 776 88 167
Special mention 31 558 5 123 3 69 327 37 080
Special mention (1 – 90 days) 24 579 4 721 – – – 29 300
Special mention (61 – 90 days and item well secured) 6 979 402 3 69 327 7 780
Default 395 952 58 290 2 329 8 925 10 484 475 980
Sub-standard 235 645 11 080 2 172 192 95 249 184
Doubtful 153 199 43 946 119 8 305 10 389 215 958
Loss 7 108 3 264 38 428 – 10 838
Total gross core loans andadvances to customers 13 010 317 6 646 134 2 373 580 501 071 375 063 22 906 165
Total impairments (142 841) (41 943) (1 168) (4 277) (8 799) (199 028)
Specific impairments (98 216) (24 935) (99) (4 128) (8 799) (136 177)
Portfolio impairments (44 625) (17 008) (1 069) (149) – (62 851)
Net core loans and advancesto customers 12 867 476 6 604 191 2 372 412 496 794 366 264 22 707 137
At 31 March 2016
Current core loans and advances 10 013 490 5 475 475 1 535 953 432 585 256 131 17 713 634
Past due (1 – 60 days) 79 933 15 567 41 1 299 3 824 100 664
Special mention 24 009 210 2 146 631 24 998
Special mention (1 – 90 days) 21 853 – – – – 21 853
Special mention (61 – 90 days and item well secured) 2 156 210 2 146 631 3 145
Default 401 115 51 813 2 645 2 682 7 814 466 069
Sub-standard 206 269 18 786 2 482 2 058 158 229 753
Doubtful 173 229 30 793 122 250 7 656 212 050
Loss 21 617 2 234 41 374 – 24 266
Total gross core loans andadvances to customers 10 518 547 5 543 065 1 538 641 436 712 268 400 18 305 365
Total impairments (151 687) (27 117) (297) (698) (6 751) (186 550)
Specific impairments (121 336) (25 334) (102) (508) (6 751) (154 031)
Portfolio impairments (30 351) (1 783) (195) (190) – (32 519)
Net core loans and advancesto customers 10 366 860 5 515 948 1 538 344 436 014 261 649 18 118 815
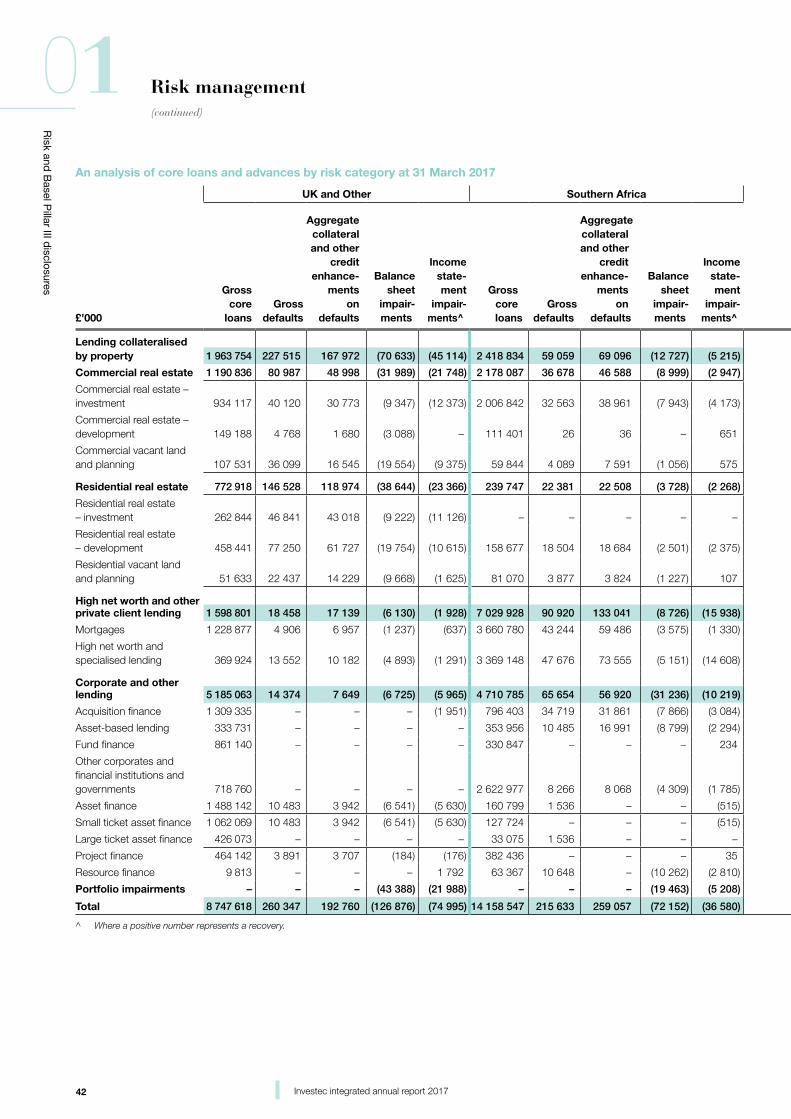
42 Investec integrated annual report 2017
Risk and
Basel P
illar III disclosures
01 Risk management(continued)
An analysis of core loans and advances by risk category at 31 March 2017
UK and Other Southern Africa Total group
£’000
Gross core
loansGross
defaults
Aggregatecollateraland other
creditenhance-
mentson
defaults
Balance sheet
impair-ments
Incomestate-ment
impair-ments^
Gross core loans
Gross defaults
Aggregatecollateraland other
creditenhance-
mentson
defaults
Balance sheet
impair-ments
Incomestate-ment
impair-ments^
Gross core
loansGross
defaults
Aggregatecollateraland other
creditenhance-
mentson
defaults
Balance sheet
impair-ments
Incomestatement
impair-ments^
Lending collateralisedby property 1 963 754 227 515 167 972 (70 633) (45 114) 2 418 834 59 059 69 096 (12 727) (5 215) 4 381 588 286 574 237 068 (83 360) (50 329)
Commercial real estate 1 190 836 80 987 48 998 (31 989) (21 748) 2 178 087 36 678 46 588 (8 999) (2 947) 3 368 923 117 665 95 586 (40 988) (24 695)
Commercial real estate – investment 934 117 40 120 30 773 (9 347) (12 373) 2 006 842 32 563 38 961 (7 943) (4 173) 2 940 959 72 683 69 734 (17 290) (16 546)
Commercial real estate – development 149 188 4 768 1 680 (3 088) – 111 401 26 36 – 651 260 589 4 794 1 716 (3 088) 651
Commercial vacant land and planning 107 531 36 099 16 545 (19 554) (9 375) 59 844 4 089 7 591 (1 056) 575 167 375 40 188 24 136 (20 610) (8 800)
Residential real estate 772 918 146 528 118 974 (38 644) (23 366) 239 747 22 381 22 508 (3 728) (2 268) 1 012 665 168 909 141 482 (42 372) (25 634)
Residential real estate – investment 262 844 46 841 43 018 (9 222) (11 126) – – – – – 262 844 46 841 43 018 (9 222) (11 126)
Residential real estate – development 458 441 77 250 61 727 (19 754) (10 615) 158 677 18 504 18 684 (2 501) (2 375) 617 118 95 754 80 411 (22 255) (12 990)
Residential vacant land and planning 51 633 22 437 14 229 (9 668) (1 625) 81 070 3 877 3 824 (1 227) 107 132 703 26 314 18 053 (10 895) (1 518)
High net worth and otherprivate client lending 1 598 801 18 458 17 139 (6 130) (1 928) 7 029 928 90 920 133 041 (8 726) (15 938) 8 628 729 109 378 150 180 (14 856) (17 866)
Mortgages 1 228 877 4 906 6 957 (1 237) (637) 3 660 780 43 244 59 486 (3 575) (1 330) 4 889 657 48 150 66 443 (4 812) (1 967)
High net worth and specialised lending 369 924 13 552 10 182 (4 893) (1 291) 3 369 148 47 676 73 555 (5 151) (14 608) 3 739 072 61 228 83 737 (10 044) (15 899)
Corporate and otherlending 5 185 063 14 374 7 649 (6 725) (5 965) 4 710 785 65 654 56 920 (31 236) (10 219) 9 895 848 80 028 64 569 (37 961) (16 184)
Acquisition finance 1 309 335 – – – (1 951) 796 403 34 719 31 861 (7 866) (3 084) 2 105 738 34 719 31 861 (7 866) (5 035)
Asset-based lending 333 731 – – – – 353 956 10 485 16 991 (8 799) (2 294) 687 687 10 485 16 991 (8 799) (2 294)
Fund finance 861 140 – – – – 330 847 – – – 234 1 191 987 – – – 234
Other corporates and financial institutions and governments 718 760 – – – – 2 622 977 8 266 8 068 (4 309) (1 785) 3 341 737 8 266 8 068 (4 309) (1 785)
Asset finance 1 488 142 10 483 3 942 (6 541) (5 630) 160 799 1 536 – – (515) 1 648 941 12 019 3 942 (6 541) (6 145)
Small ticket asset finance 1 062 069 10 483 3 942 (6 541) (5 630) 127 724 – – – (515) 1 189 793 10 483 3 942 (6 541) (6 145)
Large ticket asset finance 426 073 – – – – 33 075 1 536 – – – 459 148 1 536 – – –
Project finance 464 142 3 891 3 707 (184) (176) 382 436 – – – 35 846 578 3 891 3 707 (184) (141)
Resource finance 9 813 – – – 1 792 63 367 10 648 – (10 262) (2 810) 73 180 10 648 – (10 262) (1 018)
Portfolio impairments – – – (43 388) (21 988) – – – (19 463) (5 208) – – – (62 851) (27 196)
Total 8 747 618 260 347 192 760 (126 876) (74 995) 14 158 547 215 633 259 057 (72 152) (36 580) 22 906 165 475 980 451 817 (199 028) (111 575)
^ Where a positive number represents a recovery.
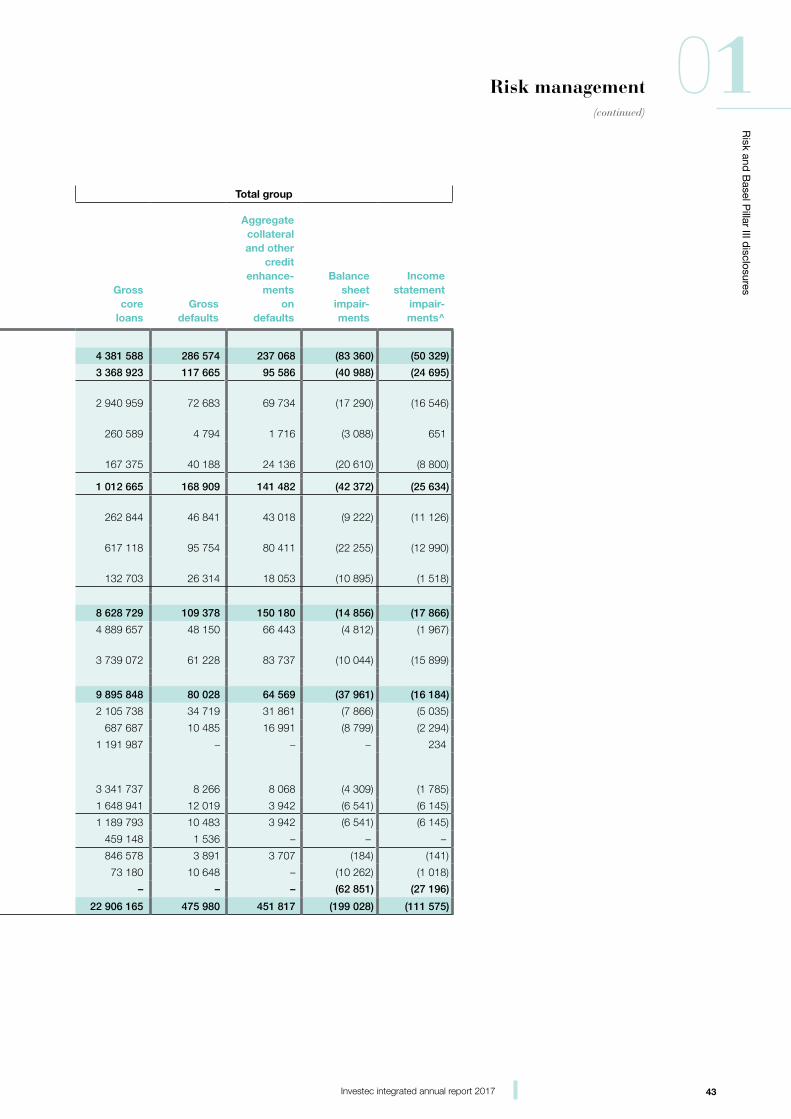
43Investec integrated annual report 2017
Risk and
Basel P
illar III disclosures
01Risk management(continued)
An analysis of core loans and advances by risk category at 31 March 2017
UK and Other Southern Africa Total group
£’000
Gross core
loansGross
defaults
Aggregatecollateraland other
creditenhance-
mentson
defaults
Balance sheet
impair-ments
Incomestate-ment
impair-ments^
Gross core loans
Gross defaults
Aggregatecollateraland other
creditenhance-
mentson
defaults
Balance sheet
impair-ments
Incomestate-ment
impair-ments^
Gross core
loansGross
defaults
Aggregatecollateraland other
creditenhance-
mentson
defaults
Balance sheet
impair-ments
Incomestatement
impair-ments^
Lending collateralisedby property 1 963 754 227 515 167 972 (70 633) (45 114) 2 418 834 59 059 69 096 (12 727) (5 215) 4 381 588 286 574 237 068 (83 360) (50 329)
Commercial real estate 1 190 836 80 987 48 998 (31 989) (21 748) 2 178 087 36 678 46 588 (8 999) (2 947) 3 368 923 117 665 95 586 (40 988) (24 695)
Commercial real estate – investment 934 117 40 120 30 773 (9 347) (12 373) 2 006 842 32 563 38 961 (7 943) (4 173) 2 940 959 72 683 69 734 (17 290) (16 546)
Commercial real estate – development 149 188 4 768 1 680 (3 088) – 111 401 26 36 – 651 260 589 4 794 1 716 (3 088) 651
Commercial vacant land and planning 107 531 36 099 16 545 (19 554) (9 375) 59 844 4 089 7 591 (1 056) 575 167 375 40 188 24 136 (20 610) (8 800)
Residential real estate 772 918 146 528 118 974 (38 644) (23 366) 239 747 22 381 22 508 (3 728) (2 268) 1 012 665 168 909 141 482 (42 372) (25 634)
Residential real estate – investment 262 844 46 841 43 018 (9 222) (11 126) – – – – – 262 844 46 841 43 018 (9 222) (11 126)
Residential real estate – development 458 441 77 250 61 727 (19 754) (10 615) 158 677 18 504 18 684 (2 501) (2 375) 617 118 95 754 80 411 (22 255) (12 990)
Residential vacant land and planning 51 633 22 437 14 229 (9 668) (1 625) 81 070 3 877 3 824 (1 227) 107 132 703 26 314 18 053 (10 895) (1 518)
High net worth and otherprivate client lending 1 598 801 18 458 17 139 (6 130) (1 928) 7 029 928 90 920 133 041 (8 726) (15 938) 8 628 729 109 378 150 180 (14 856) (17 866)
Mortgages 1 228 877 4 906 6 957 (1 237) (637) 3 660 780 43 244 59 486 (3 575) (1 330) 4 889 657 48 150 66 443 (4 812) (1 967)
High net worth and specialised lending 369 924 13 552 10 182 (4 893) (1 291) 3 369 148 47 676 73 555 (5 151) (14 608) 3 739 072 61 228 83 737 (10 044) (15 899)
Corporate and otherlending 5 185 063 14 374 7 649 (6 725) (5 965) 4 710 785 65 654 56 920 (31 236) (10 219) 9 895 848 80 028 64 569 (37 961) (16 184)
Acquisition finance 1 309 335 – – – (1 951) 796 403 34 719 31 861 (7 866) (3 084) 2 105 738 34 719 31 861 (7 866) (5 035)
Asset-based lending 333 731 – – – – 353 956 10 485 16 991 (8 799) (2 294) 687 687 10 485 16 991 (8 799) (2 294)
Fund finance 861 140 – – – – 330 847 – – – 234 1 191 987 – – – 234
Other corporates and financial institutions and governments 718 760 – – – – 2 622 977 8 266 8 068 (4 309) (1 785) 3 341 737 8 266 8 068 (4 309) (1 785)
Asset finance 1 488 142 10 483 3 942 (6 541) (5 630) 160 799 1 536 – – (515) 1 648 941 12 019 3 942 (6 541) (6 145)
Small ticket asset finance 1 062 069 10 483 3 942 (6 541) (5 630) 127 724 – – – (515) 1 189 793 10 483 3 942 (6 541) (6 145)
Large ticket asset finance 426 073 – – – – 33 075 1 536 – – – 459 148 1 536 – – –
Project finance 464 142 3 891 3 707 (184) (176) 382 436 – – – 35 846 578 3 891 3 707 (184) (141)
Resource finance 9 813 – – – 1 792 63 367 10 648 – (10 262) (2 810) 73 180 10 648 – (10 262) (1 018)
Portfolio impairments – – – (43 388) (21 988) – – – (19 463) (5 208) – – – (62 851) (27 196)
Total 8 747 618 260 347 192 760 (126 876) (74 995) 14 158 547 215 633 259 057 (72 152) (36 580) 22 906 165 475 980 451 817 (199 028) (111 575)
^ Where a positive number represents a recovery.
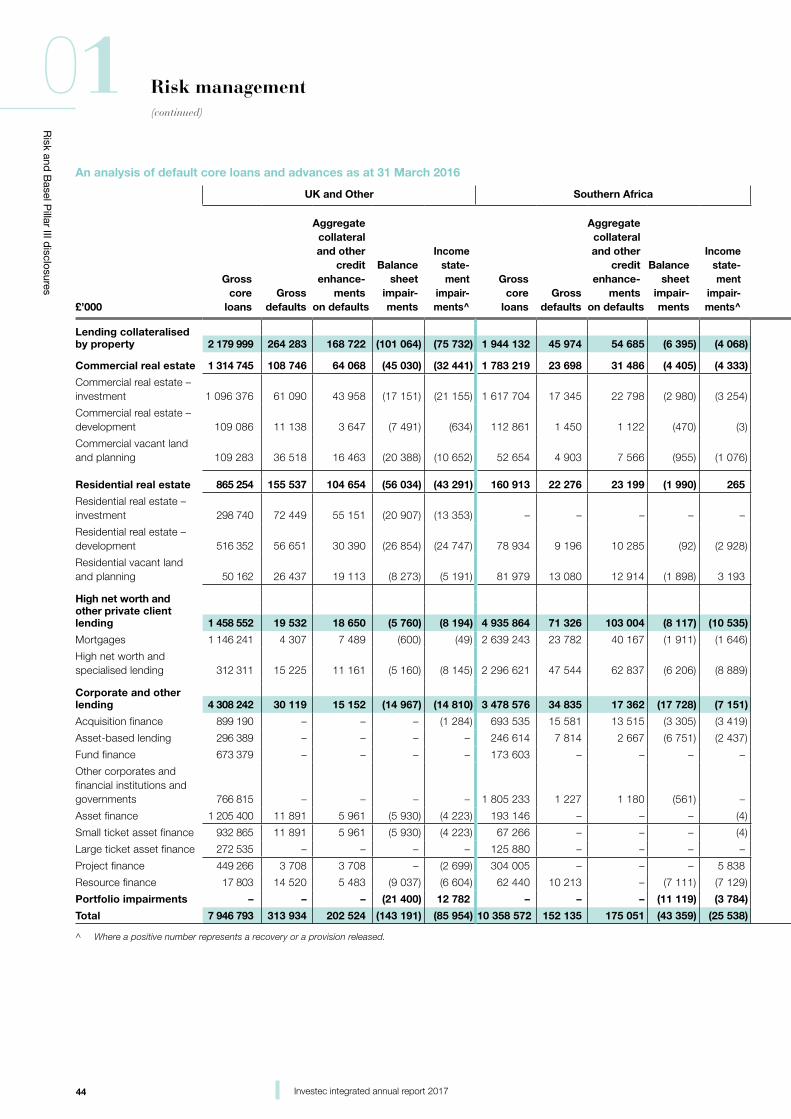
44 Investec integrated annual report 2017
Risk and
Basel P
illar III disclosures
01 Risk management(continued)
An analysis of default core loans and advances as at 31 March 2016
UK and Other Southern Africa Total group
£’000
Gross core
loansGross
defaults
Aggregate collateral and other
credit enhance-
ments on defaults
Balance sheet
impair-ments
Incomestate-ment
impair-ments^
Gross core
loansGross
defaults
Aggregate collateral and other
credit enhance-
ments on defaults
Balance sheet
impair-ments
Incomestate-ment
impair-ments^
Gross core
loansGross
defaults
Aggregate collateral and other
credit enhance-
ments on defaults
Balance sheet
impair-ments
Incomestatement
impair-ments^
Lending collateralisedby property 2 179 999 264 283 168 722 (101 064) (75 732) 1 944 132 45 974 54 685 (6 395) (4 068) 4 124 131 310 257 223 407 (107 459) (79 800)
Commercial real estate 1 314 745 108 746 64 068 (45 030) (32 441) 1 783 219 23 698 31 486 (4 405) (4 333) 3 097 964 132 444 95 554 (49 435) (36 774)
Commercial real estate – investment 1 096 376 61 090 43 958 (17 151) (21 155) 1 617 704 17 345 22 798 (2 980) (3 254) 2 714 080 78 435 66 756 (20 131) (24 409)
Commercial real estate – development 109 086 11 138 3 647 (7 491) (634) 112 861 1 450 1 122 (470) (3) 221 947 12 588 4 769 (7 961) (637)
Commercial vacant land and planning 109 283 36 518 16 463 (20 388) (10 652) 52 654 4 903 7 566 (955) (1 076) 161 937 41 421 24 029 (21 343) (11 728)
Residential real estate 865 254 155 537 104 654 (56 034) (43 291) 160 913 22 276 23 199 (1 990) 265 1 026 167 177 813 127 853 (58 024) (43 026)
Residential real estate – investment 298 740 72 449 55 151 (20 907) (13 353) – – – – – 298 740 72 449 55 151 (20 907) (13 353)
Residential real estate – development 516 352 56 651 30 390 (26 854) (24 747) 78 934 9 196 10 285 (92) (2 928) 595 286 65 847 40 675 (26 946) (27 675)
Residential vacant land and planning 50 162 26 437 19 113 (8 273) (5 191) 81 979 13 080 12 914 (1 898) 3 193 132 141 39 517 32 027 (10 171) (1 998)
High net worth andother private clientlending 1 458 552 19 532 18 650 (5 760) (8 194) 4 935 864 71 326 103 004 (8 117) (10 535) 6 394 416 90 858 121 654 (13 877) (18 729)
Mortgages 1 146 241 4 307 7 489 (600) (49) 2 639 243 23 782 40 167 (1 911) (1 646) 3 785 484 28 089 47 656 (2 511) (1 695)
High net worth and specialised lending 312 311 15 225 11 161 (5 160) (8 145) 2 296 621 47 544 62 837 (6 206) (8 889) 2 608 932 62 769 73 998 (11 366) (17 034)
Corporate and otherlending 4 308 242 30 119 15 152 (14 967) (14 810) 3 478 576 34 835 17 362 (17 728) (7 151) 7 786 818 64 954 32 514 (32 695) (21 961)
Acquisition finance 899 190 – – – (1 284) 693 535 15 581 13 515 (3 305) (3 419) 1 592 725 15 581 13 515 (3 305) (4 703)
Asset-based lending 296 389 – – – – 246 614 7 814 2 667 (6 751) (2 437) 543 003 7 814 2 667 (6 751) (2 437)
Fund finance 673 379 – – – – 173 603 – – – – 846 982 – – – –
Other corporates and financial institutions and governments 766 815 – – – – 1 805 233 1 227 1 180 (561) – 2 572 048 1 227 1 180 (561) –
Asset finance 1 205 400 11 891 5 961 (5 930) (4 223) 193 146 – – – (4) 1 398 546 11 891 5 961 (5 930) (4 227)
Small ticket asset finance 932 865 11 891 5 961 (5 930) (4 223) 67 266 – – – (4) 1 000 131 11 891 5 961 (5 930) (4 227)
Large ticket asset finance 272 535 – – – – 125 880 – – – – 398 415 – – – –
Project finance 449 266 3 708 3 708 – (2 699) 304 005 – – – 5 838 753 271 3 708 3 708 – 3 139
Resource finance 17 803 14 520 5 483 (9 037) (6 604) 62 440 10 213 – (7 111) (7 129) 80 243 24 733 5 483 (16 148) (13 733)
Portfolio impairments – – – (21 400) 12 782 – – – (11 119) (3 784) – – – (32 519) 8 998
Total 7 946 793 313 934 202 524 (143 191) (85 954) 10 358 572 152 135 175 051 (43 359) (25 538) 18 305 365 466 069 377 575 (186 550) (111 492)
^ Where a positive number represents a recovery or a provision released.
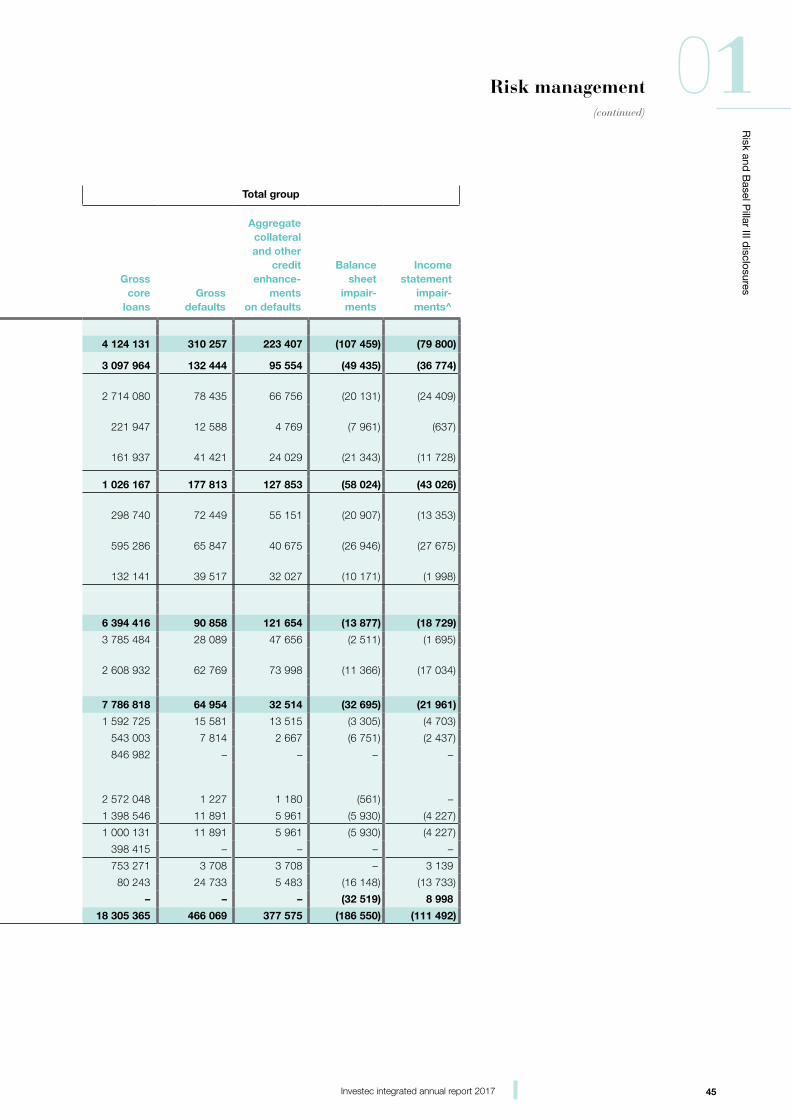
45Investec integrated annual report 2017
Risk and
Basel P
illar III disclosures
01Risk management(continued)
An analysis of default core loans and advances as at 31 March 2016
UK and Other Southern Africa Total group
£’000
Gross core
loansGross
defaults
Aggregate collateral and other
credit enhance-
ments on defaults
Balance sheet
impair-ments
Incomestate-ment
impair-ments^
Gross core
loansGross
defaults
Aggregate collateral and other
credit enhance-
ments on defaults
Balance sheet
impair-ments
Incomestate-ment
impair-ments^
Gross core
loansGross
defaults
Aggregate collateral and other
credit enhance-
ments on defaults
Balance sheet
impair-ments
Incomestatement
impair-ments^
Lending collateralisedby property 2 179 999 264 283 168 722 (101 064) (75 732) 1 944 132 45 974 54 685 (6 395) (4 068) 4 124 131 310 257 223 407 (107 459) (79 800)
Commercial real estate 1 314 745 108 746 64 068 (45 030) (32 441) 1 783 219 23 698 31 486 (4 405) (4 333) 3 097 964 132 444 95 554 (49 435) (36 774)
Commercial real estate – investment 1 096 376 61 090 43 958 (17 151) (21 155) 1 617 704 17 345 22 798 (2 980) (3 254) 2 714 080 78 435 66 756 (20 131) (24 409)
Commercial real estate – development 109 086 11 138 3 647 (7 491) (634) 112 861 1 450 1 122 (470) (3) 221 947 12 588 4 769 (7 961) (637)
Commercial vacant land and planning 109 283 36 518 16 463 (20 388) (10 652) 52 654 4 903 7 566 (955) (1 076) 161 937 41 421 24 029 (21 343) (11 728)
Residential real estate 865 254 155 537 104 654 (56 034) (43 291) 160 913 22 276 23 199 (1 990) 265 1 026 167 177 813 127 853 (58 024) (43 026)
Residential real estate – investment 298 740 72 449 55 151 (20 907) (13 353) – – – – – 298 740 72 449 55 151 (20 907) (13 353)
Residential real estate – development 516 352 56 651 30 390 (26 854) (24 747) 78 934 9 196 10 285 (92) (2 928) 595 286 65 847 40 675 (26 946) (27 675)
Residential vacant land and planning 50 162 26 437 19 113 (8 273) (5 191) 81 979 13 080 12 914 (1 898) 3 193 132 141 39 517 32 027 (10 171) (1 998)
High net worth andother private clientlending 1 458 552 19 532 18 650 (5 760) (8 194) 4 935 864 71 326 103 004 (8 117) (10 535) 6 394 416 90 858 121 654 (13 877) (18 729)
Mortgages 1 146 241 4 307 7 489 (600) (49) 2 639 243 23 782 40 167 (1 911) (1 646) 3 785 484 28 089 47 656 (2 511) (1 695)
High net worth and specialised lending 312 311 15 225 11 161 (5 160) (8 145) 2 296 621 47 544 62 837 (6 206) (8 889) 2 608 932 62 769 73 998 (11 366) (17 034)
Corporate and otherlending 4 308 242 30 119 15 152 (14 967) (14 810) 3 478 576 34 835 17 362 (17 728) (7 151) 7 786 818 64 954 32 514 (32 695) (21 961)
Acquisition finance 899 190 – – – (1 284) 693 535 15 581 13 515 (3 305) (3 419) 1 592 725 15 581 13 515 (3 305) (4 703)
Asset-based lending 296 389 – – – – 246 614 7 814 2 667 (6 751) (2 437) 543 003 7 814 2 667 (6 751) (2 437)
Fund finance 673 379 – – – – 173 603 – – – – 846 982 – – – –
Other corporates and financial institutions and governments 766 815 – – – – 1 805 233 1 227 1 180 (561) – 2 572 048 1 227 1 180 (561) –
Asset finance 1 205 400 11 891 5 961 (5 930) (4 223) 193 146 – – – (4) 1 398 546 11 891 5 961 (5 930) (4 227)
Small ticket asset finance 932 865 11 891 5 961 (5 930) (4 223) 67 266 – – – (4) 1 000 131 11 891 5 961 (5 930) (4 227)
Large ticket asset finance 272 535 – – – – 125 880 – – – – 398 415 – – – –
Project finance 449 266 3 708 3 708 – (2 699) 304 005 – – – 5 838 753 271 3 708 3 708 – 3 139
Resource finance 17 803 14 520 5 483 (9 037) (6 604) 62 440 10 213 – (7 111) (7 129) 80 243 24 733 5 483 (16 148) (13 733)
Portfolio impairments – – – (21 400) 12 782 – – – (11 119) (3 784) – – – (32 519) 8 998
Total 7 946 793 313 934 202 524 (143 191) (85 954) 10 358 572 152 135 175 051 (43 359) (25 538) 18 305 365 466 069 377 575 (186 550) (111 492)
^ Where a positive number represents a recovery or a provision released.
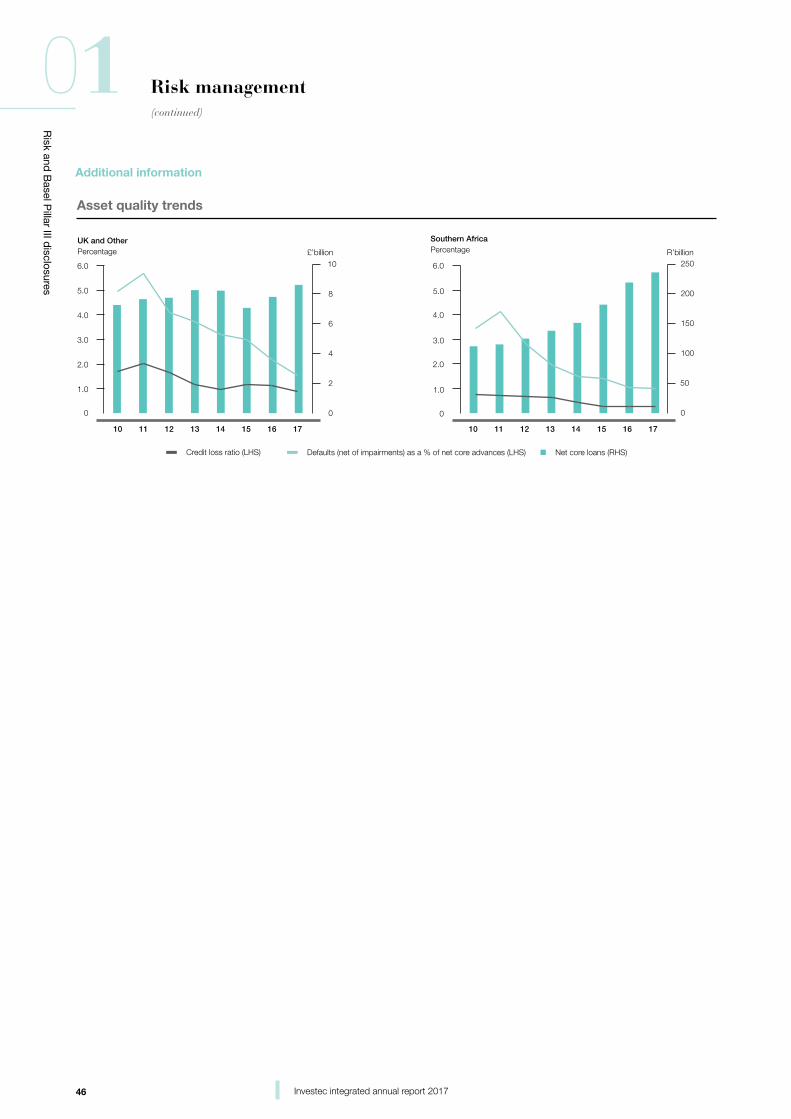
46 Investec integrated annual report 2017
Risk and
Basel P
illar III disclosures
01 Risk management(continued)
PercentageUK and Other
£’billion
0
2
4
6
8
10
PercentageSouthern Africa
R’billion
Credit loss ratio (LHS) Defaults (net of impairments) as a % of net core advances (LHS) Net core loans (RHS)
0
50
100
150
200
250
0
1.0
2.0
3.0
4.0
5.0
6.0
0
1.0
2.0
3.0
4.0
5.0
6.0
1510 11 12 13 14 1716
Asset quality trends
1510 11 12 13 14 1716
Additional information
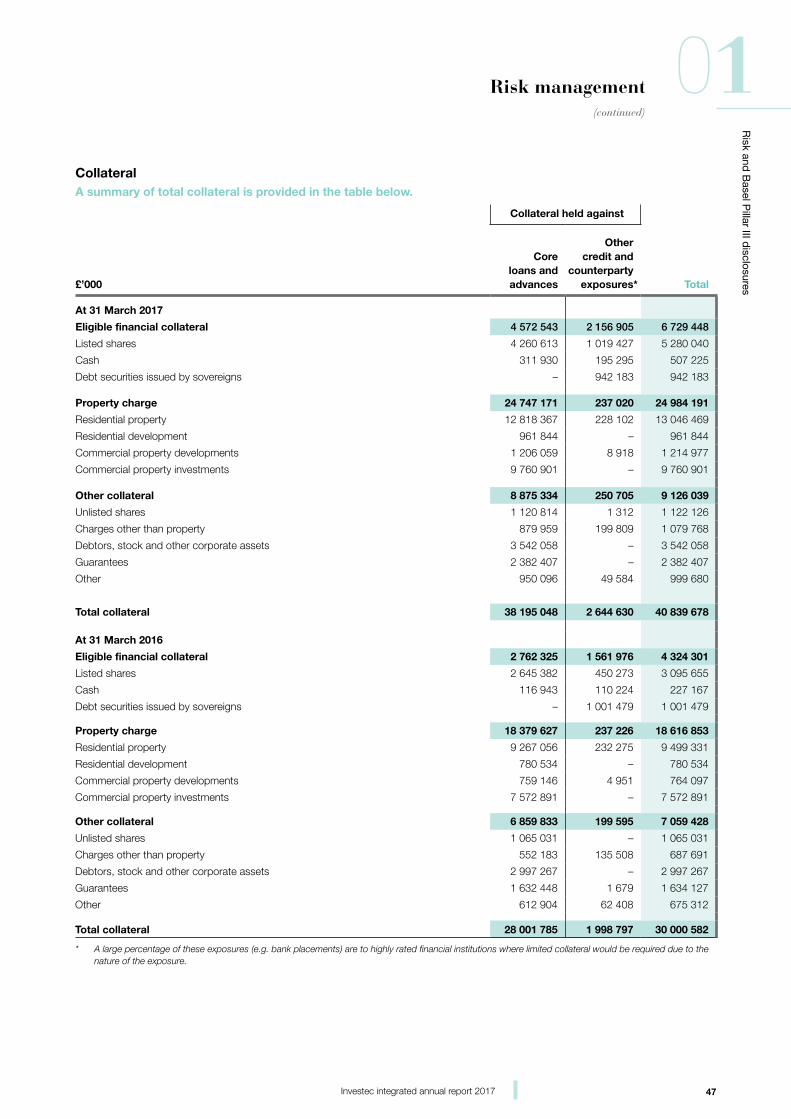
47Investec integrated annual report 2017
Risk and
Basel P
illar III disclosures
01Risk management(continued)
CollateralA summary of total collateral is provided in the table below.
Collateral held against
£’000
Core loans and advances
Other credit and
counterparty exposures* Total
At 31 March 2017
Eligible financial collateral 4 572 543 2 156 905 6 729 448
Listed shares 4 260 613 1 019 427 5 280 040
Cash 311 930 195 295 507 225
Debt securities issued by sovereigns – 942 183 942 183
Property charge 24 747 171 237 020 24 984 191
Residential property 12 818 367 228 102 13 046 469
Residential development 961 844 – 961 844
Commercial property developments 1 206 059 8 918 1 214 977
Commercial property investments 9 760 901 – 9 760 901
Other collateral 8 875 334 250 705 9 126 039
Unlisted shares 1 120 814 1 312 1 122 126
Charges other than property 879 959 199 809 1 079 768
Debtors, stock and other corporate assets 3 542 058 – 3 542 058
Guarantees 2 382 407 – 2 382 407
Other 950 096 49 584 999 680
Total collateral 38 195 048 2 644 630 40 839 678
At 31 March 2016
Eligible financial collateral 2 762 325 1 561 976 4 324 301
Listed shares 2 645 382 450 273 3 095 655
Cash 116 943 110 224 227 167
Debt securities issued by sovereigns – 1 001 479 1 001 479
Property charge 18 379 627 237 226 18 616 853
Residential property 9 267 056 232 275 9 499 331
Residential development 780 534 – 780 534
Commercial property developments 759 146 4 951 764 097
Commercial property investments 7 572 891 – 7 572 891
Other collateral 6 859 833 199 595 7 059 428
Unlisted shares 1 065 031 – 1 065 031
Charges other than property 552 183 135 508 687 691
Debtors, stock and other corporate assets 2 997 267 – 2 997 267
Guarantees 1 632 448 1 679 1 634 127
Other 612 904 62 408 675 312
Total collateral 28 001 785 1 998 797 30 000 582
* A large percentage of these exposures (e.g. bank placements) are to highly rated financial institutions where limited collateral would be required due to the nature of the exposure.
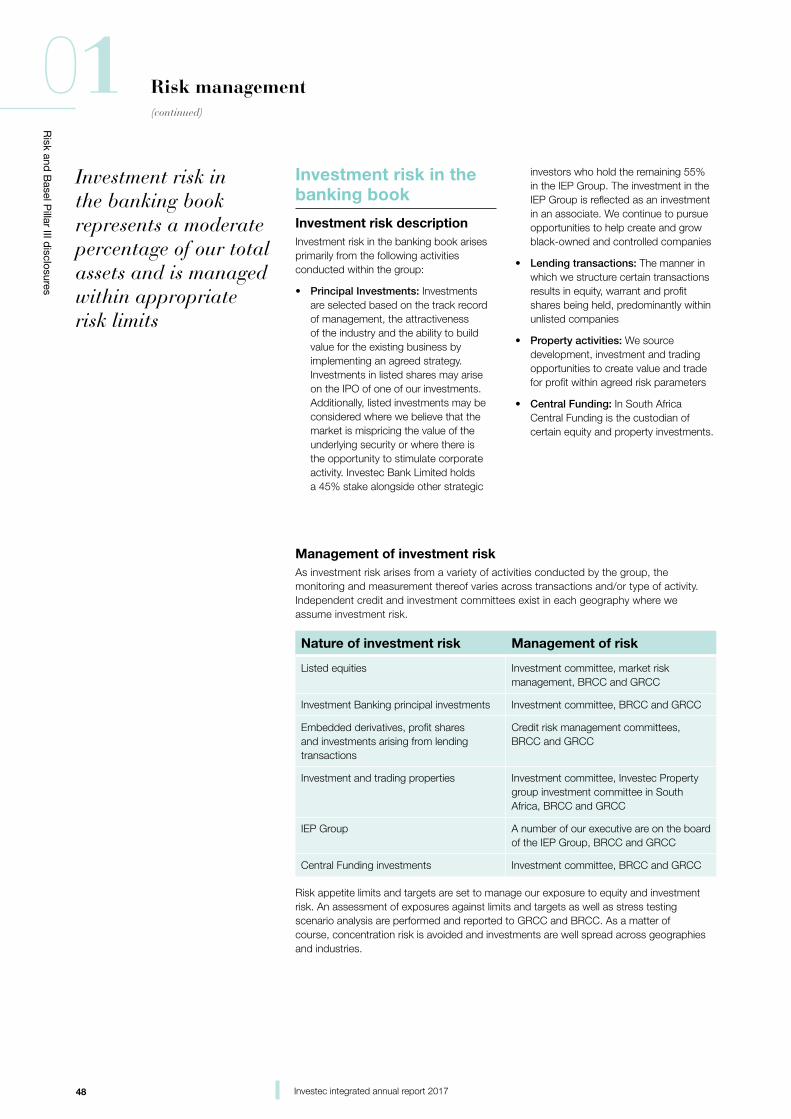
48 Investec integrated annual report 2017
Risk and
Basel P
illar III disclosures
01 Risk management(continued)
Investment risk in the banking book represents a moderate percentage of our total assets and is managed within appropriate risk limits
Investment risk in the banking book
Investment risk descriptionInvestment risk in the banking book arises primarily from the following activities conducted within the group:
• Principal Investments: Investments are selected based on the track record of management, the attractiveness of the industry and the ability to build value for the existing business by implementing an agreed strategy. Investments in listed shares may arise on the IPO of one of our investments. Additionally, listed investments may be considered where we believe that the market is mispricing the value of the underlying security or where there is the opportunity to stimulate corporate activity. Investec Bank Limited holds a 45% stake alongside other strategic
investors who hold the remaining 55% in the IEP Group. The investment in the IEP Group is reflected as an investment in an associate. We continue to pursue opportunities to help create and grow black-owned and controlled companies
• Lending transactions: The manner in which we structure certain transactions results in equity, warrant and profit shares being held, predominantly within unlisted companies
• Property activities: We source development, investment and trading opportunities to create value and trade for profit within agreed risk parameters
• Central Funding: In South Africa Central Funding is the custodian of certain equity and property investments.
Management of investment riskAs investment risk arises from a variety of activities conducted by the group, the monitoring and measurement thereof varies across transactions and/or type of activity. Independent credit and investment committees exist in each geography where we assume investment risk.
Nature of investment risk Management of risk
Listed equities Investment committee, market risk management, BRCC and GRCC
Investment Banking principal investments Investment committee, BRCC and GRCC
Embedded derivatives, profit shares and investments arising from lending transactions
Credit risk management committees, BRCC and GRCC
Investment and trading properties Investment committee, Investec Property group investment committee in South Africa, BRCC and GRCC
IEP Group A number of our executive are on the board of the IEP Group, BRCC and GRCC
Central Funding investments Investment committee, BRCC and GRCC
Risk appetite limits and targets are set to manage our exposure to equity and investment risk. An assessment of exposures against limits and targets as well as stress testing scenario analysis are performed and reported to GRCC and BRCC. As a matter of course, concentration risk is avoided and investments are well spread across geographies and industries.
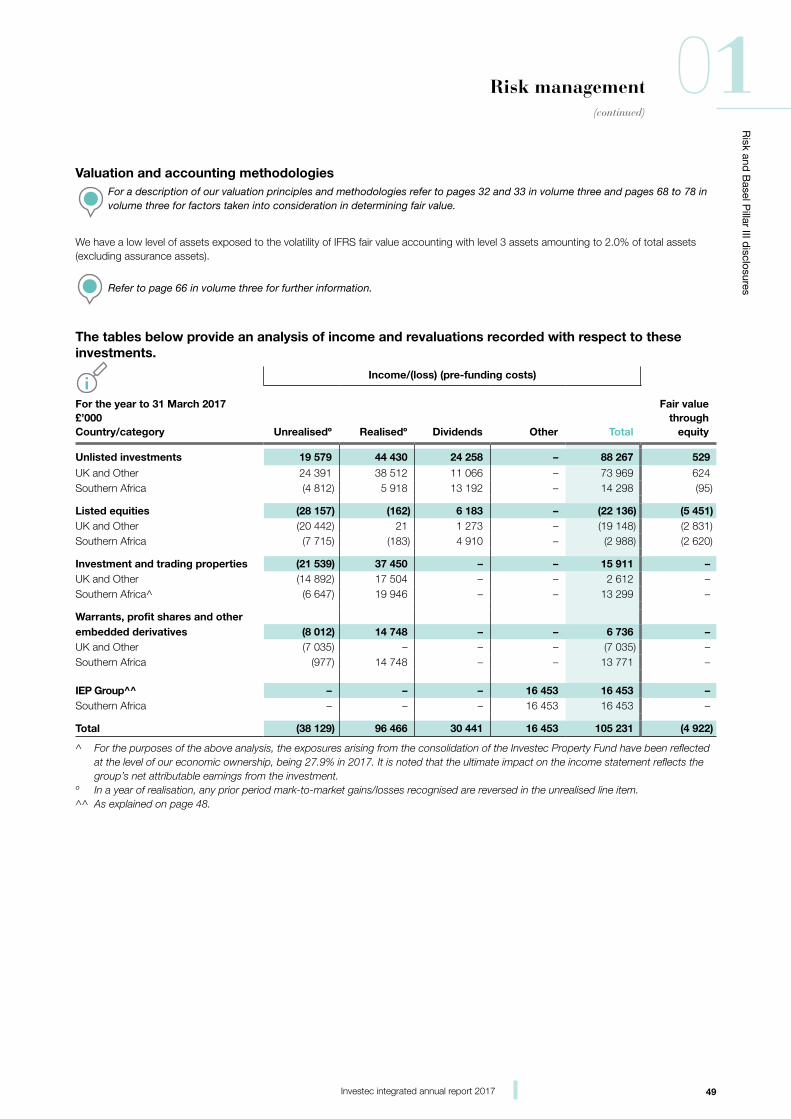
49Investec integrated annual report 2017
Risk and
Basel P
illar III disclosures
01Risk management(continued)
Valuation and accounting methodologies
For a description of our valuation principles and methodologies refer to pages 32 and 33 in volume three and pages 68 to 78 in volume three for factors taken into consideration in determining fair value.
We have a low level of assets exposed to the volatility of IFRS fair value accounting with level 3 assets amounting to 2.0% of total assets (excluding assurance assets).
Refer to page 66 in volume three for further information.
The tables below provide an analysis of income and revaluations recorded with respect to these investments.
Income/(loss) (pre-funding costs)
For the year to 31 March 2017 £’000Country/category Unrealisedº Realisedº Dividends Other Total
Fair value through
equity
Unlisted investments 19 579 44 430 24 258 – 88 267 529
UK and Other 24 391 38 512 11 066 – 73 969 624Southern Africa (4 812) 5 918 13 192 – 14 298 (95)
Listed equities (28 157) (162) 6 183 – (22 136) (5 451)UK and Other (20 442) 21 1 273 – (19 148) (2 831)Southern Africa (7 715) (183) 4 910 – (2 988) (2 620)
Investment and trading properties (21 539) 37 450 – – 15 911 –UK and Other (14 892) 17 504 – – 2 612 –Southern Africa^ (6 647) 19 946 – – 13 299 –
Warrants, profit shares and other embedded derivatives (8 012) 14 748 – – 6 736 –UK and Other (7 035) – – – (7 035) –Southern Africa (977) 14 748 – – 13 771 –
IEP Group^^ – – – 16 453 16 453 –Southern Africa – – – 16 453 16 453 –
Total (38 129) 96 466 30 441 16 453 105 231 (4 922)
^ For the purposes of the above analysis, the exposures arising from the consolidation of the Investec Property Fund have been reflected at the level of our economic ownership, being 27.9% in 2017. It is noted that the ultimate impact on the income statement reflects the group’s net attributable earnings from the investment.
º In a year of realisation, any prior period mark-to-market gains/losses recognised are reversed in the unrealised line item.^^ As explained on page 48.
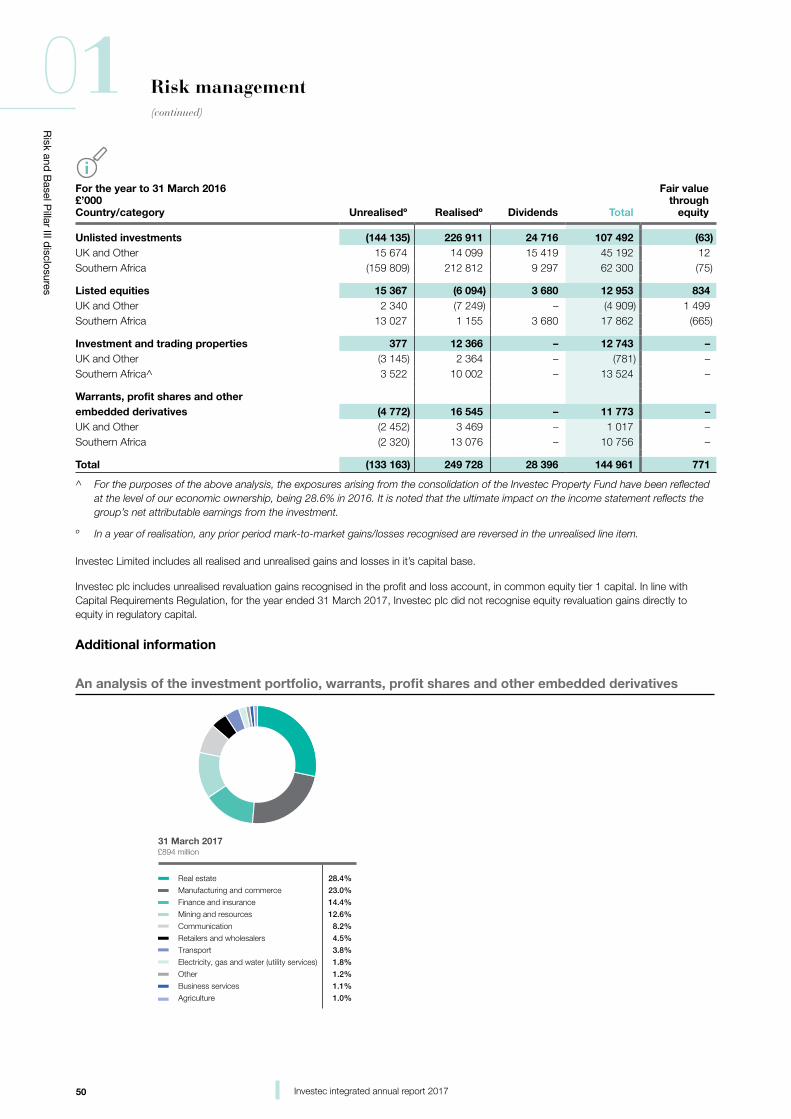
50 Investec integrated annual report 2017
Risk and
Basel P
illar III disclosures
01 Risk management(continued)
For the year to 31 March 2016 £’000Country/category Unrealisedº Realisedº Dividends Total
Fair value through
equity
Unlisted investments (144 135) 226 911 24 716 107 492 (63)UK and Other 15 674 14 099 15 419 45 192 12Southern Africa (159 809) 212 812 9 297 62 300 (75)
Listed equities 15 367 (6 094) 3 680 12 953 834UK and Other 2 340 (7 249) – (4 909) 1 499Southern Africa 13 027 1 155 3 680 17 862 (665)
Investment and trading properties 377 12 366 – 12 743 –UK and Other (3 145) 2 364 – (781) –Southern Africa^ 3 522 10 002 – 13 524 –
Warrants, profit shares and other embedded derivatives (4 772) 16 545 – 11 773 –UK and Other (2 452) 3 469 – 1 017 –Southern Africa (2 320) 13 076 – 10 756 –
Total (133 163) 249 728 28 396 144 961 771
^ For the purposes of the above analysis, the exposures arising from the consolidation of the Investec Property Fund have been reflected at the level of our economic ownership, being 28.6% in 2016. It is noted that the ultimate impact on the income statement reflects the group’s net attributable earnings from the investment.
º In a year of realisation, any prior period mark-to-market gains/losses recognised are reversed in the unrealised line item.
Investec Limited includes all realised and unrealised gains and losses in it’s capital base.
Investec plc includes unrealised revaluation gains recognised in the profit and loss account, in common equity tier 1 capital. In line with Capital Requirements Regulation, for the year ended 31 March 2017, Investec plc did not recognise equity revaluation gains directly to equity in regulatory capital.
Additional information
An analysis of the investment portfolio, warrants, pro�t shares and other embedded derivatives
£894 million31 March 2017
28.4%
23.0%
14.4%
12.6%
8.2%
4.5%
3.8%
1.8%
1.2%
1.1%
1.0%
Real estate
Manufacturing and commerce
Finance and insurance
Mining and resources
Communication
Retailers and wholesalers
Transport
Electricity, gas and water (utility services)
Other
Business services
Agriculture
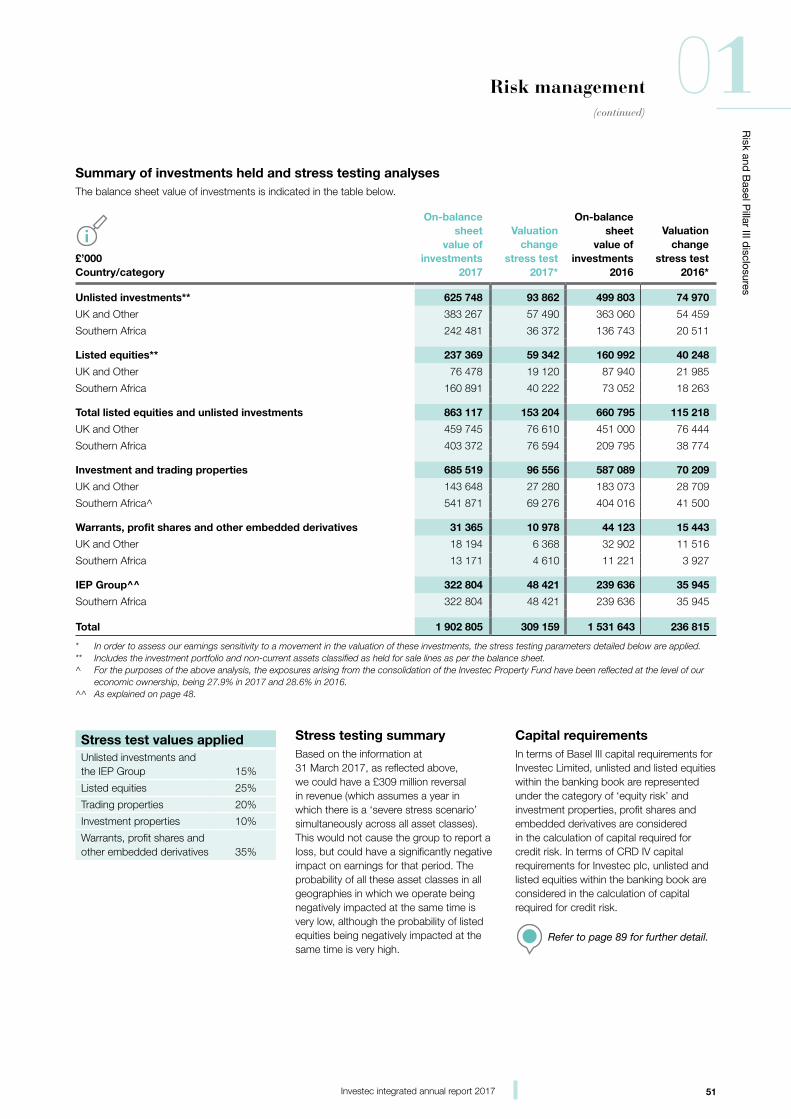
51Investec integrated annual report 2017
Risk and
Basel P
illar III disclosures
01Risk management(continued)
Summary of investments held and stress testing analysesThe balance sheet value of investments is indicated in the table below.
£’000Country/category
On-balance sheet
value of investments
2017
Valuation change
stress test2017*
On-balance sheet
value of investments
2016
Valuation change
stress test2016*
Unlisted investments** 625 748 93 862 499 803 74 970
UK and Other 383 267 57 490 363 060 54 459
Southern Africa 242 481 36 372 136 743 20 511
Listed equities** 237 369 59 342 160 992 40 248
UK and Other 76 478 19 120 87 940 21 985
Southern Africa 160 891 40 222 73 052 18 263
Total listed equities and unlisted investments 863 117 153 204 660 795 115 218
UK and Other 459 745 76 610 451 000 76 444
Southern Africa 403 372 76 594 209 795 38 774
Investment and trading properties 685 519 96 556 587 089 70 209
UK and Other 143 648 27 280 183 073 28 709
Southern Africa^ 541 871 69 276 404 016 41 500
Warrants, profit shares and other embedded derivatives 31 365 10 978 44 123 15 443
UK and Other 18 194 6 368 32 902 11 516
Southern Africa 13 171 4 610 11 221 3 927
IEP Group^^ 322 804 48 421 239 636 35 945
Southern Africa 322 804 48 421 239 636 35 945
Total 1 902 805 309 159 1 531 643 236 815
* In order to assess our earnings sensitivity to a movement in the valuation of these investments, the stress testing parameters detailed below are applied.** Includes the investment portfolio and non-current assets classified as held for sale lines as per the balance sheet.^ For the purposes of the above analysis, the exposures arising from the consolidation of the Investec Property Fund have been reflected at the level of our
economic ownership, being 27.9% in 2017 and 28.6% in 2016.^^ As explained on page 48.
Stress testing summaryBased on the information at 31 March 2017, as reflected above, we could have a £309 million reversal in revenue (which assumes a year in which there is a ‘severe stress scenario’ simultaneously across all asset classes). This would not cause the group to report a loss, but could have a significantly negative impact on earnings for that period. The probability of all these asset classes in all geographies in which we operate being negatively impacted at the same time is very low, although the probability of listed equities being negatively impacted at the same time is very high.
Stress test values appliedUnlisted investments and the IEP Group 15%
Listed equities 25%
Trading properties 20%
Investment properties 10%
Warrants, profit shares and other embedded derivatives 35%
Capital requirementsIn terms of Basel III capital requirements for Investec Limited, unlisted and listed equities within the banking book are represented under the category of ‘equity risk’ and investment properties, profit shares and embedded derivatives are considered in the calculation of capital required for credit risk. In terms of CRD IV capital requirements for Investec plc, unlisted and listed equities within the banking book are considered in the calculation of capital required for credit risk.
Refer to page 89 for further detail.
52 Investec integrated annual report 2017
Risk and
Basel P
illar III disclosures
01 Risk management(continued)
Securitisation/structured credit activities exposures
OverviewThe group’s definition of securitisation/structured credit activities (as explained below) is wider than the definition as applied for regulatory capital purposes, which largely focuses on those securitisations in which the group has achieved significant risk transfer. We, however, believe that the information provided below is meaningful in that it groups all these related activities in order for a reviewer to obtain a fuller picture of the activities that we have conducted in this space. Some of the information provided below overlaps with the group’s credit and counterparty exposure information.
Refer to page 27 for the balance sheet and credit risk classification.
The group applies the standardised approach in the assessment of regulatory capital for securitisation exposures within its banking book and trading book. The trading book exposures at 31 March 2017 are not material, and therefore no further information is disclosed for these positions.
The information below sets out the initiatives we have focused on over the past few years, albeit that most of these business lines have been curtailed given the changes in the securitisation market and given the strategic divestments Investec has undertaken in the last couple of years.
UK and OtherThe primary focus for new securitisation transactions remains to provide a cost effective, alternative source of financing to the bank.
During the year we did not undertake any new securitisation transactions.
We hold rated structured credit instruments. These exposures are largely in the UK and US and amount to £339 million at 31 March 2017 (31 March 2016: £343 million). This is intended as a hold to maturity portfolio rather than a trading portfolio. Therefore, since our commercial intention is to hold these assets to maturity, the portfolio is typically valued on an amortised cost basis. These investments are risk weighted for regulatory capital purposes.
South AfricaIn South Africa we engage in transactions that involve the use of both special purpose entities and asset securitisation structures. Securitisation represents a relatively modest proportion of our current funding profile, but provides additional flexibility and a source of liquidity. We do not depend on special purpose vehicles for funding in its normal course of business. These entities form part of the consolidated group balance sheet as reported.
We have securitised assets originated by our Private Client business in South Africa. The primary motivations for the securitisation of these assets are to:
• Provide an alternative source of funding
• Act as a mechanism to transfer risk
• Leverage returns through the retention of equity tranches in low default rate portfolios
• Create a potential committed liquidity facility (CLF) asset.
Total assets that have been originated and securitised by the Private Client division amount to R8.7 billion at 31 March 2017 (31 March 2016: R9.2 billion) and consist of residential mortgages (R8.7 billion). Within these securitisation vehicles loans greater than 90 days in arrears amounted to R14 million.
Further details of our various securitisation vehicles are highlighted below:
• Fox Street 1: R0.9 billion notes of the original R1.5 billion are still in issue. No notes are held internally
• Fox Street 2: R0.9 billion notes of the original R1.5 billion are still in issue. R247 million of the notes are held internally
• Fox Street 3: R1.4 billion notes of the original R2.0 billion are still in issue. All notes are held internally
• Fox Street 4: R2.6 billion notes of the original R3.7 billion are still in issue. All notes are held internally
• Fox Street 5: R2.6 billion notes of the original R2.9 billion are still in issue. All notes are held internally.
Forecast amortisation is modelled at 8%.
There is a clean-up call option than can be exercised at 10% of original notes issued. The margin on the notes increases at pre-specified intervals and coincides with the originator call option dates.
Refer to pages 53 and 54.
We have also sought out select opportunities in the credit/debt markets and traded in and purchased structured credit. These have largely been rated UK and European Residential mortgage backed securities (RMBS), totalling R0.9 billion at 31 March 2017 (31 March 2016: R0.8 billion) and unrated South African RMBS totalling R0.9 billion at 31 March 2017 (31 March 2016: nil).
We determine regulatory capital requirements for securitised credit exposures based on specific regulatory rule sets which, at maximum, carry a risk weight of 1250%. This is capped to the capital requirement had we been exposed to the entire portfolio.
Accounting policies
Refer to page 33 in volume three.
53Investec integrated annual report 2017
Risk and
Basel P
illar III disclosures
01Risk management(continued)
Risk managementAll existing or proposed exposures to a securitisation or a resecuritisation are analysed on a case-by-case basis, with final approval typically required from the relevant credit committee. The analysis looks through to the historical and expected future performance of the underlying assets, the position of the relevant tranche in the capital structure as well as analysis of the cash flow waterfall under a variety of stress scenarios. External ratings are presented, but only for information purposes since the bank principally relies on its own internal risk assessment. Overarching these transaction level principles is the board-approved risk appetite policy, which details the group’s appetite for such exposures, and each exposure is considered relative to the group’s overall risk appetite. We can use explicit credit risk mitigation techniques where required, however, the group prefers to address and manage these risks by only approving exposures to which the group has explicit appetite through the constant and consistent application of the risk appetite policy.
In addition, securitisations of Investec own originated assets are assessed in terms of the credit risk management philosophies and principles as set out on page 52.
Credit analysisIn terms of our analysis of our credit and counterparty risk, exposures arising from securitisation/structured credit activities reflect only those exposures to which we consider ourselves to be at risk. Assets that have been securitised by our Private Client division in South Africa are reflected as part of our core lending exposures and not our securitisation/structured credit exposures as we believe this reflects the true nature and intent of these exposures and activities.
At 31 March Nature of exposure/activity
Exposure 2017
£’million
Exposure2016
£’millionBalance sheet and credit risk classification
Asset quality – relevant comments
Structured credit (gross exposure)* 457 392
Other debt securities and other loans and advances
Rated 390 380
Unrated 67 12
Loans and advances to customers and third party intermediary originating platforms (mortgage loans)(net exposure)
160 174 Other loans and advances
South Africa – Private Client division assets which have been securitised
517 437 Own originated loans and advances to customers
Analysed as part of the group’s overall asset quality on core loans and advances as reflected on page 35
South Africa – liquidity facilities provided to third party corporate securitisation vehicles
– 1 Off-balance sheet
* Analysed further on page 54.
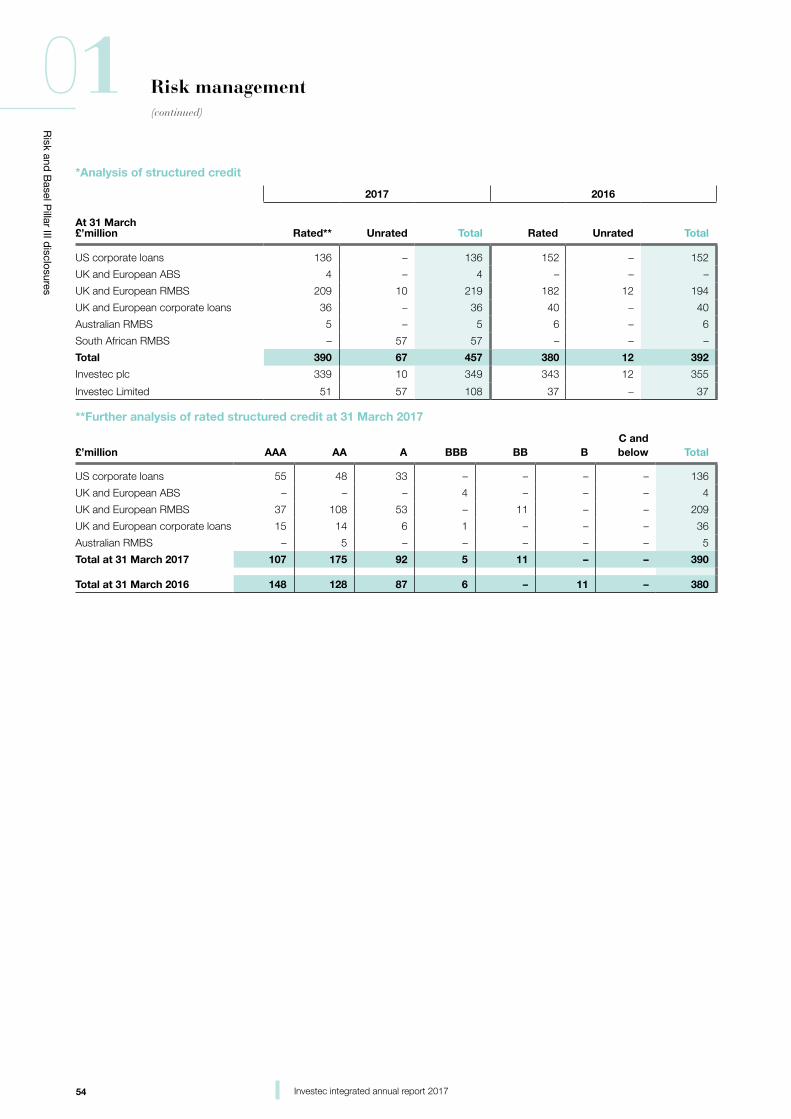
54 Investec integrated annual report 2017
Risk and
Basel P
illar III disclosures
01 Risk management(continued)
*Analysis of structured credit
2017 2016
At 31 March £’million Rated** Unrated Total Rated Unrated Total
US corporate loans 136 – 136 152 – 152
UK and European ABS 4 – 4 – – –
UK and European RMBS 209 10 219 182 12 194
UK and European corporate loans 36 – 36 40 – 40
Australian RMBS 5 – 5 6 – 6
South African RMBS – 57 57 – – –
Total 390 67 457 380 12 392
Investec plc 339 10 349 343 12 355
Investec Limited 51 57 108 37 – 37
**Further analysis of rated structured credit at 31 March 2017
£’million AAA AA A BBB BB B C andbelow Total
US corporate loans 55 48 33 – – – – 136
UK and European ABS – – – 4 – – – 4
UK and European RMBS 37 108 53 – 11 – – 209
UK and European corporate loans 15 14 6 1 – – – 36
Australian RMBS – 5 – – – – – 5
Total at 31 March 2017 107 175 92 5 11 – – 390
Total at 31 March 2016 148 128 87 6 – 11 – 380
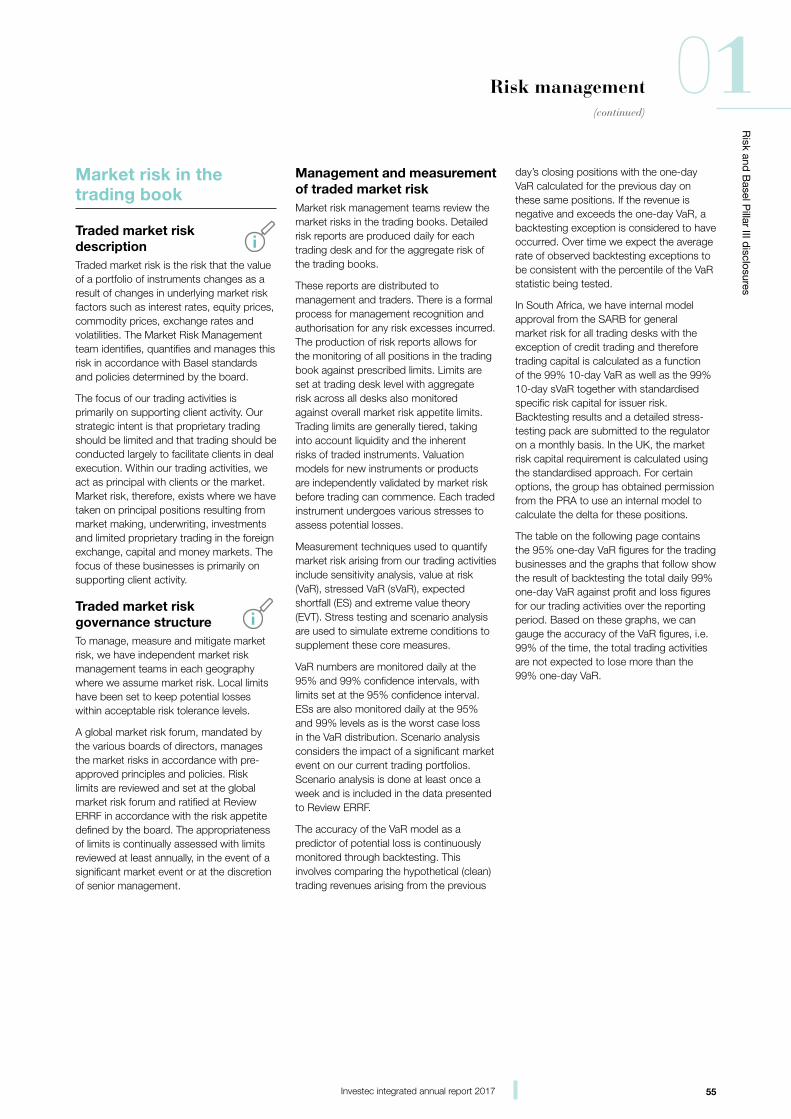
55Investec integrated annual report 2017
Risk and
Basel P
illar III disclosures
01Risk management(continued)
Market risk in the trading book
Traded market risk description Traded market risk is the risk that the value of a portfolio of instruments changes as a result of changes in underlying market risk factors such as interest rates, equity prices, commodity prices, exchange rates and volatilities. The Market Risk Management team identifies, quantifies and manages this risk in accordance with Basel standards and policies determined by the board.
The focus of our trading activities is primarily on supporting client activity. Our strategic intent is that proprietary trading should be limited and that trading should be conducted largely to facilitate clients in deal execution. Within our trading activities, we act as principal with clients or the market. Market risk, therefore, exists where we have taken on principal positions resulting from market making, underwriting, investments and limited proprietary trading in the foreign exchange, capital and money markets. The focus of these businesses is primarily on supporting client activity.
Traded market risk governance structure To manage, measure and mitigate market risk, we have independent market risk management teams in each geography where we assume market risk. Local limits have been set to keep potential losses within acceptable risk tolerance levels.
A global market risk forum, mandated by the various boards of directors, manages the market risks in accordance with pre-approved principles and policies. Risk limits are reviewed and set at the global market risk forum and ratified at Review ERRF in accordance with the risk appetite defined by the board. The appropriateness of limits is continually assessed with limits reviewed at least annually, in the event of a significant market event or at the discretion of senior management.
Management and measurement of traded market riskMarket risk management teams review the market risks in the trading books. Detailed risk reports are produced daily for each trading desk and for the aggregate risk of the trading books.
These reports are distributed to management and traders. There is a formal process for management recognition and authorisation for any risk excesses incurred. The production of risk reports allows for the monitoring of all positions in the trading book against prescribed limits. Limits are set at trading desk level with aggregate risk across all desks also monitored against overall market risk appetite limits. Trading limits are generally tiered, taking into account liquidity and the inherent risks of traded instruments. Valuation models for new instruments or products are independently validated by market risk before trading can commence. Each traded instrument undergoes various stresses to assess potential losses.
Measurement techniques used to quantify market risk arising from our trading activities include sensitivity analysis, value at risk (VaR), stressed VaR (sVaR), expected shortfall (ES) and extreme value theory (EVT). Stress testing and scenario analysis are used to simulate extreme conditions to supplement these core measures.
VaR numbers are monitored daily at the 95% and 99% confidence intervals, with limits set at the 95% confidence interval. ESs are also monitored daily at the 95% and 99% levels as is the worst case loss in the VaR distribution. Scenario analysis considers the impact of a significant market event on our current trading portfolios. Scenario analysis is done at least once a week and is included in the data presented to Review ERRF.
The accuracy of the VaR model as a predictor of potential loss is continuously monitored through backtesting. This involves comparing the hypothetical (clean) trading revenues arising from the previous
day’s closing positions with the one-day VaR calculated for the previous day on these same positions. If the revenue is negative and exceeds the one-day VaR, a backtesting exception is considered to have occurred. Over time we expect the average rate of observed backtesting exceptions to be consistent with the percentile of the VaR statistic being tested.
In South Africa, we have internal model approval from the SARB for general market risk for all trading desks with the exception of credit trading and therefore trading capital is calculated as a function of the 99% 10-day VaR as well as the 99% 10-day sVaR together with standardised specific risk capital for issuer risk. Backtesting results and a detailed stress-testing pack are submitted to the regulator on a monthly basis. In the UK, the market risk capital requirement is calculated using the standardised approach. For certain options, the group has obtained permission from the PRA to use an internal model to calculate the delta for these positions.
The table on the following page contains the 95% one-day VaR figures for the trading businesses and the graphs that follow show the result of backtesting the total daily 99% one-day VaR against profit and loss figures for our trading activities over the reporting period. Based on these graphs, we can gauge the accuracy of the VaR figures, i.e. 99% of the time, the total trading activities are not expected to lose more than the 99% one-day VaR.

56 Investec integrated annual report 2017
Risk and
Basel P
illar III disclosures
01 Risk management(continued)
UK and OtherThe average VaR utilisation was largely unchanged from 2016. Using hypothetical (clean) profit and loss data for backtesting resulted in zero exceptions over the year at the 99% confidence level, i.e. where the loss was greater than the 99% one-day VaR.
VaR31 March 2017 31 March 2016
Year end Average High Low Year end Average High Low
UK and Other (using 95% VaR)
Equities (£’000) 503 547 1 317 340 515 557 699 412
Foreign exchange (£’000) 13 34 162 1 37 32 101 12
Interest rates (£’000) 88 191 287 83 202 195 505 128
Consolidated (£’000)* 547 586 1 364 373 529 589 723 488
Southern Africa (using 95% VaR)
Commodities (R’million) 0.1 0.1 0.5 – 0.1 0.1 0.2 –
Equities (R’million) 2.4 3.6 22.8 1.9 2.6 2.3 5.8 1.2
Foreign exchange (R’million) 3.7 1.7 5.3 0.9 3.0 2.6 6.4 1.2
Interest rates (R’million) 0.8 1.6 3.2 0.6 1.1 1.2 3.0 0.5
Consolidated (R’million)* 4.5 4.2 21.8 2.1 4.8 3.9 8.5 1.8
* The consolidated VaR for each entity is lower than the sum of the individual VaRs. This arises from the consolidation offset between various asset classes (diversification).
£
Hypothetical P/L
99% one-day VaR-2 500 000
-2 000 000
-1 500 000
-1 000 000
-500 000
0
500 000
1 000 000
1 500 000
2 000 000
2 500 000
30 A
pril
201
6
1 A
pril
201
6
31 M
ay 2
016
30 J
une
2016
31 J
uly
2016
31 A
ugus
t 2
016
30 S
epte
mb
er 2
016
31 O
ctob
er 2
016
30 N
ovem
ber
201
6
31 D
ecem
ber
201
6
31 J
anua
ry 2
017
28 F
ebru
ary
2017
31 M
arch
201
799% one-day VaR backtesting
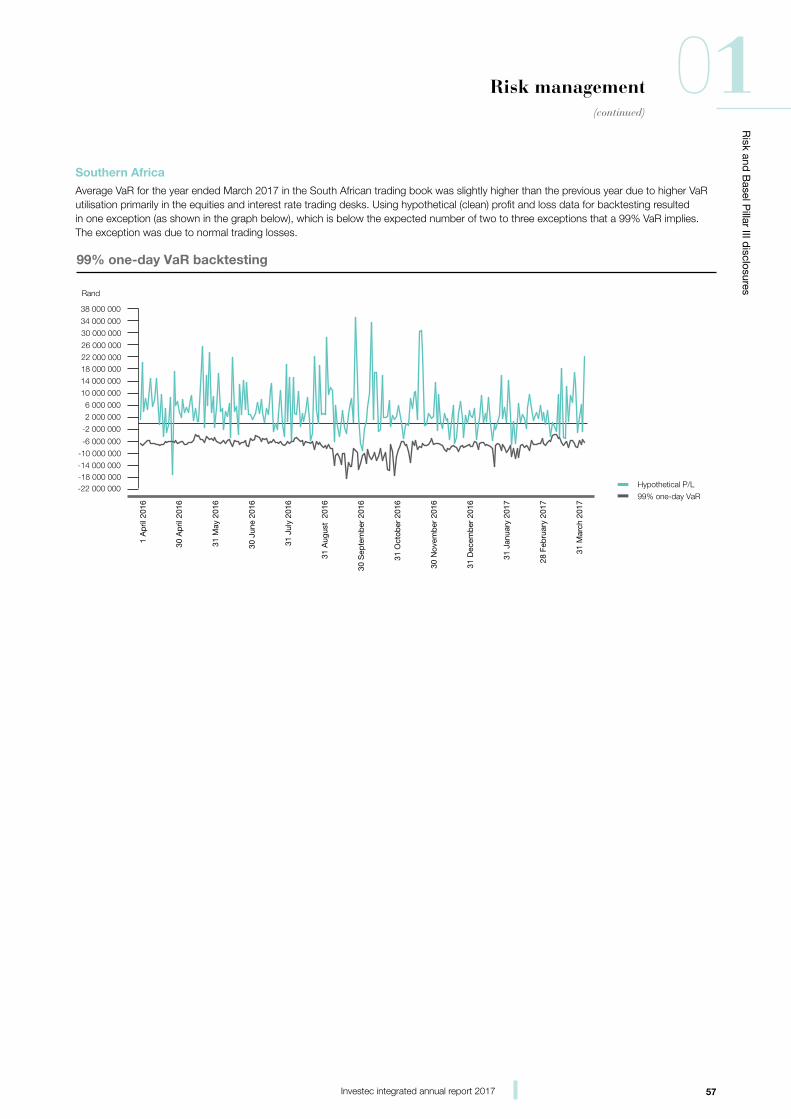
57Investec integrated annual report 2017
Risk and
Basel P
illar III disclosures
01Risk management(continued)
Southern AfricaAverage VaR for the year ended March 2017 in the South African trading book was slightly higher than the previous year due to higher VaR utilisation primarily in the equities and interest rate trading desks. Using hypothetical (clean) profit and loss data for backtesting resulted in one exception (as shown in the graph below), which is below the expected number of two to three exceptions that a 99% VaR implies. The exception was due to normal trading losses.
Hypothetical P/L
99% one-day VaR
Rand
-22 000 000-18 000 000-14 000 000
-10 000 000
-6 000 000
-2 000 000
2 000 000
6 000 000
10 000 000
14 000 000
18 000 00022 000 000
26 000 000
30 000 000
34 000 000
38 000 000
99% one-day VaR backtesting
30 A
pril
201
6
1 A
pril
201
6
31 M
ay 2
016
30 J
une
2016
31 J
uly
2016
31 A
ugus
t 2
016
30 S
epte
mb
er 2
016
31 O
ctob
er 2
016
30 N
ovem
ber
201
6
31 D
ecem
ber
201
6
31 J
anua
ry 2
017
28 F
ebru
ary
2017
31 M
arch
201
7
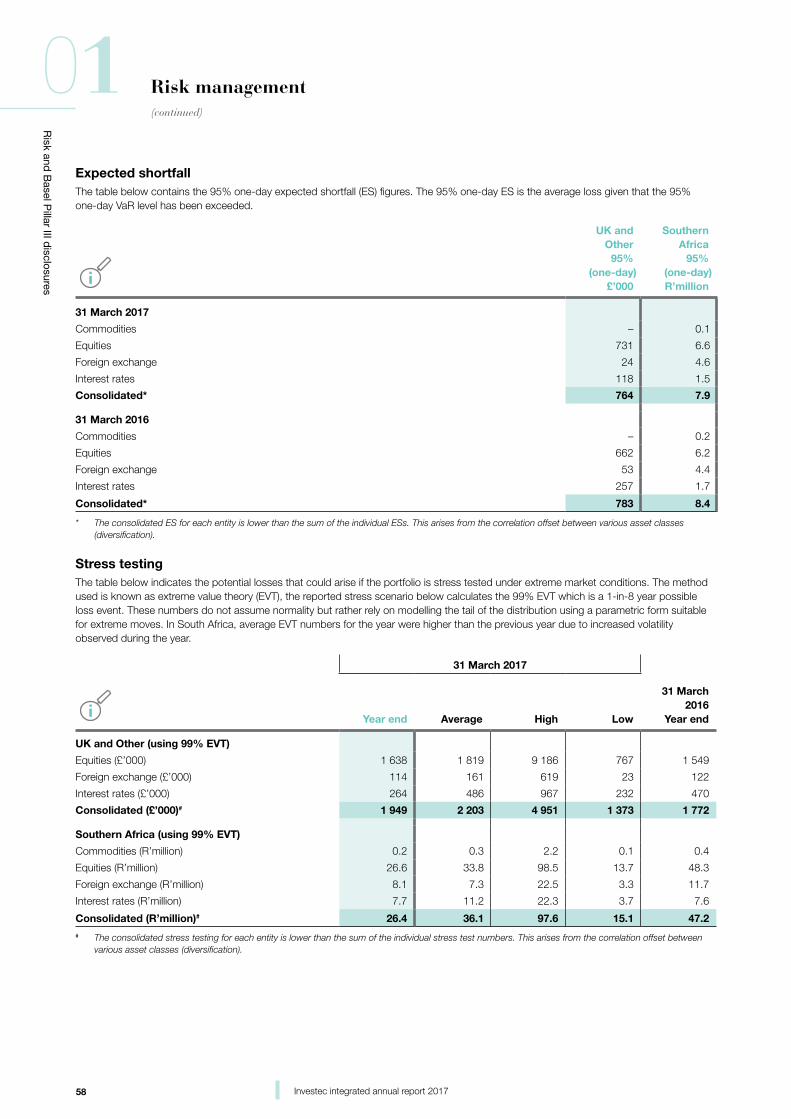
58 Investec integrated annual report 2017
Risk and
Basel P
illar III disclosures
01 Risk management(continued)
Expected shortfallThe table below contains the 95% one-day expected shortfall (ES) figures. The 95% one-day ES is the average loss given that the 95% one-day VaR level has been exceeded.
UK andOther
95% (one-day)
£’000
Southern Africa
95% (one-day)R’million
31 March 2017
Commodities – 0.1
Equities 731 6.6
Foreign exchange 24 4.6
Interest rates 118 1.5
Consolidated* 764 7.9
31 March 2016
Commodities – 0.2
Equities 662 6.2
Foreign exchange 53 4.4
Interest rates 257 1.7
Consolidated* 783 8.4
* The consolidated ES for each entity is lower than the sum of the individual ESs. This arises from the correlation offset between various asset classes (diversification).
Stress testingThe table below indicates the potential losses that could arise if the portfolio is stress tested under extreme market conditions. The method used is known as extreme value theory (EVT), the reported stress scenario below calculates the 99% EVT which is a 1-in-8 year possible loss event. These numbers do not assume normality but rather rely on modelling the tail of the distribution using a parametric form suitable for extreme moves. In South Africa, average EVT numbers for the year were higher than the previous year due to increased volatility observed during the year.
31 March 2017
Year end Average High Low
31 March 2016
Year end
UK and Other (using 99% EVT)
Equities (£’000) 1 638 1 819 9 186 767 1 549
Foreign exchange (£’000) 114 161 619 23 122
Interest rates (£’000) 264 486 967 232 470
Consolidated (£’000)# 1 949 2 203 4 951 1 373 1 772
Southern Africa (using 99% EVT)
Commodities (R’million) 0.2 0.3 2.2 0.1 0.4
Equities (R’million) 26.6 33.8 98.5 13.7 48.3
Foreign exchange (R’million) 8.1 7.3 22.5 3.3 11.7
Interest rates (R’million) 7.7 11.2 22.3 3.7 7.6
Consolidated (R’million)# 26.4 36.1 97.6 15.1 47.2# The consolidated stress testing for each entity is lower than the sum of the individual stress test numbers. This arises from the correlation offset between
various asset classes (diversification).
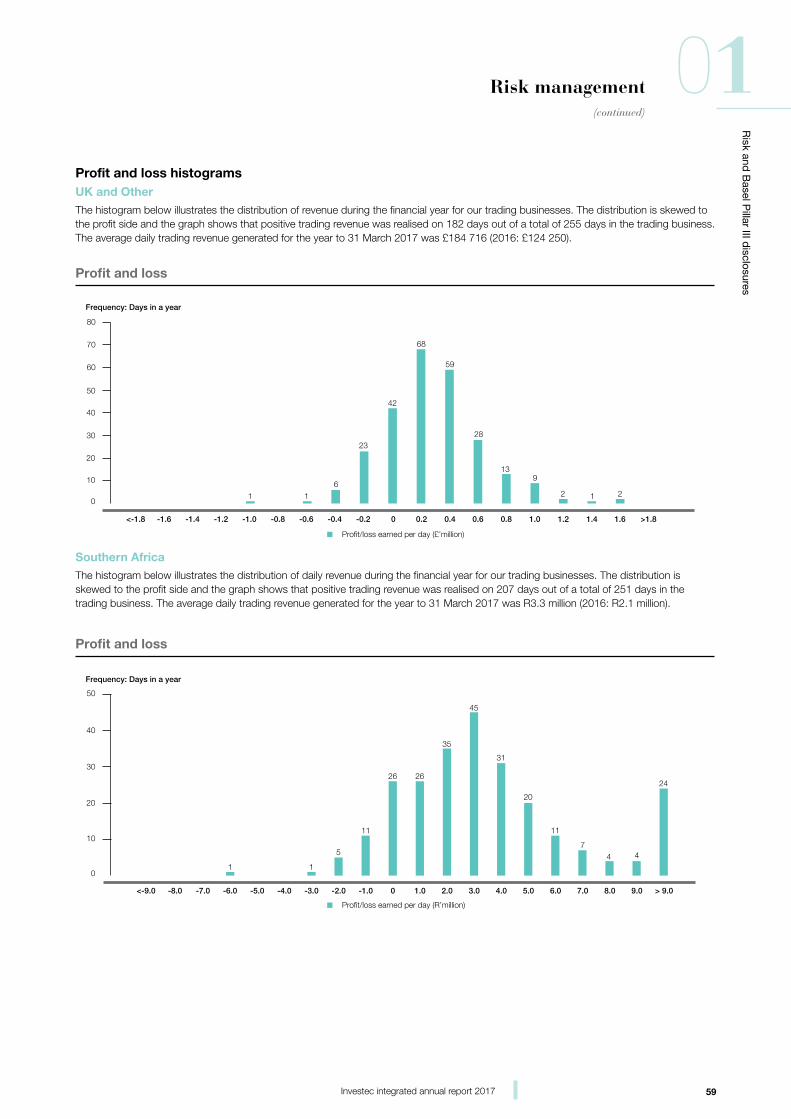
59Investec integrated annual report 2017
Risk and
Basel P
illar III disclosures
01Risk management(continued)
Profit and loss histogramsUK and OtherThe histogram below illustrates the distribution of revenue during the financial year for our trading businesses. The distribution is skewed to the profit side and the graph shows that positive trading revenue was realised on 182 days out of a total of 255 days in the trading business. The average daily trading revenue generated for the year to 31 March 2017 was £184 716 (2016: £124 250).
Southern AfricaThe histogram below illustrates the distribution of daily revenue during the financial year for our trading businesses. The distribution is skewed to the profit side and the graph shows that positive trading revenue was realised on 207 days out of a total of 251 days in the trading business. The average daily trading revenue generated for the year to 31 March 2017 was R3.3 million (2016: R2.1 million).
Frequency: Days in a year
-1.2-1.4-1.6<-1.8 -1.0 -0.8 -0.6 -0.4 -0.2 0 0.2 0.4 0.6 0.8 1.0 1.2 1.4 1.6 >1.8
0
10
20
30
40
50
60
70
80
Profit/loss earned per day (£’million)
1
6
23
1
42
68
59
28
139
2 1 2
Pro�t and loss
Frequency: Days in a year
<-9.0 -8.0 -7.0 -6.0 -5.0 -4.0 -3.0 -2.0 -1.0 0 1.0 2.0 3.0 4.0 5.0 6.0 7.0 8.0 9.0 > 9.0
0
10
20
30
40
50
Profit/loss earned per day (R’million)
1 1
5
11
26 26
35
45
31
20
11
4 47
24
Pro�t and loss
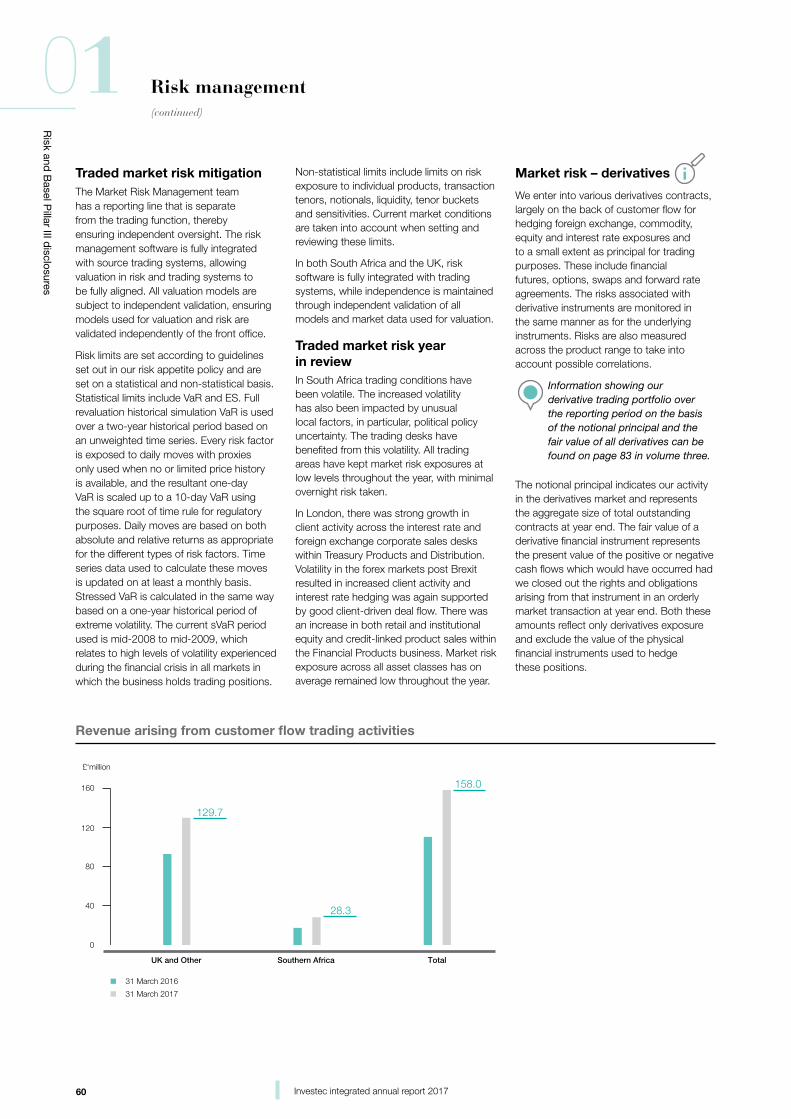
60 Investec integrated annual report 2017
Risk and
Basel P
illar III disclosures
01 Risk management(continued)
Traded market risk mitigationThe Market Risk Management team has a reporting line that is separate from the trading function, thereby ensuring independent oversight. The risk management software is fully integrated with source trading systems, allowing valuation in risk and trading systems to be fully aligned. All valuation models are subject to independent validation, ensuring models used for valuation and risk are validated independently of the front office.
Risk limits are set according to guidelines set out in our risk appetite policy and are set on a statistical and non-statistical basis. Statistical limits include VaR and ES. Full revaluation historical simulation VaR is used over a two-year historical period based on an unweighted time series. Every risk factor is exposed to daily moves with proxies only used when no or limited price history is available, and the resultant one-day VaR is scaled up to a 10-day VaR using the square root of time rule for regulatory purposes. Daily moves are based on both absolute and relative returns as appropriate for the different types of risk factors. Time series data used to calculate these moves is updated on at least a monthly basis. Stressed VaR is calculated in the same way based on a one-year historical period of extreme volatility. The current sVaR period used is mid-2008 to mid-2009, which relates to high levels of volatility experienced during the financial crisis in all markets in which the business holds trading positions.
Non-statistical limits include limits on risk exposure to individual products, transaction tenors, notionals, liquidity, tenor buckets and sensitivities. Current market conditions are taken into account when setting and reviewing these limits.
In both South Africa and the UK, risk software is fully integrated with trading systems, while independence is maintained through independent validation of all models and market data used for valuation.
Traded market risk year in reviewIn South Africa trading conditions have been volatile. The increased volatility has also been impacted by unusual local factors, in particular, political policy uncertainty. The trading desks have benefited from this volatility. All trading areas have kept market risk exposures at low levels throughout the year, with minimal overnight risk taken.
In London, there was strong growth in client activity across the interest rate and foreign exchange corporate sales desks within Treasury Products and Distribution. Volatility in the forex markets post Brexit resulted in increased client activity and interest rate hedging was again supported by good client-driven deal flow. There was an increase in both retail and institutional equity and credit-linked product sales within the Financial Products business. Market risk exposure across all asset classes has on average remained low throughout the year.
£‘million
28.3
129.7
158.0
31 March 2016
31 March 2017
0
40
80
120
160
TotalUK and Other Southern Africa
Revenue arising from customer �ow trading activities
Market risk – derivatives
We enter into various derivatives contracts, largely on the back of customer flow for hedging foreign exchange, commodity, equity and interest rate exposures and to a small extent as principal for trading purposes. These include financial futures, options, swaps and forward rate agreements. The risks associated with derivative instruments are monitored in the same manner as for the underlying instruments. Risks are also measured across the product range to take into account possible correlations.
Information showing our derivative trading portfolio over the reporting period on the basis of the notional principal and the fair value of all derivatives can be found on page 83 in volume three.
The notional principal indicates our activity in the derivatives market and represents the aggregate size of total outstanding contracts at year end. The fair value of a derivative financial instrument represents the present value of the positive or negative cash flows which would have occurred had we closed out the rights and obligations arising from that instrument in an orderly market transaction at year end. Both these amounts reflect only derivatives exposure and exclude the value of the physical financial instruments used to hedge these positions.
61Investec integrated annual report 2017
Risk and
Basel P
illar III disclosures
01Risk management(continued)
Balance sheet risk management
Balance sheet risk descriptionBalance sheet risk encompasses the financial risks relating to our asset and liability portfolios, comprising market liquidity, funding, concentration, encumbrance and non-trading interest rate risk.
Balance sheet risk governance structure and risk mitigationUnder delegated authority of the board, the group has established asset and liability monitoring committees (ALCOs) within each core geography in which it operates, using regional expertise and local market access as appropriate. The ALCOs are mandated to ensure independent supervision of liquidity risk and non-trading interest rate risk within a board-approved risk appetite.
The size, materiality, complexity, maturity and depth of the market as well as access to stable funds are all inputs considered when establishing the liquidity and non-trading interest rate risk appetite for each geographic region. Specific statutory requirements may further dictate special policies to be adopted in a region.
Detailed policies cover both domestic and foreign currency funds and set out sources and amounts of funds necessary to ensure the continuation of our operations without undue interruption. We seek to hedge residual currency exchange risk arising from deposit and loan banking activities where it is practical and efficient to do so.
In terms of regulatory requirements and the group’s liquidity policy, Investec plc (and its subsidiaries) are ring-fenced from Investec Limited (and its subsidiaries) (and vice versa) and both legal entities are therefore required to be self-funded.
The ALCOs comprise the group risk director, the head of balance sheet risk, the head of risk, the head of corporate and institutional banking activities, head of private banking distribution channels, economists, the treasurer, divisional heads, and the balance sheet risk management team. The ALCOs formally meet on a monthly basis to review the exposures that lie within the balance sheet together with market conditions, and decide on strategies to mitigate any undesirable liquidity risk and non-trading
interest rate risk. The Central Treasury function within each region is mandated to holistically manage the liquidity mismatch and non-trading interest rate risk arising from our asset and liability portfolios on a day-to-day basis.
The treasurers are required to exercise tight control of funding, liquidity, concentration and non-trading interest rate risk within parameters defined by the board-approved risk appetite policy. Non-trading interest rate risk and asset funding requirements are transferred from the originating business to the treasury function.
The central treasury, by core geography, directs pricing for all deposit products, establishes and maintains access to stable funds with the appropriate tenor and pricing characteristics, and manages liquid securities and collateral, thus providing prudential management and a flexible response to volatile market conditions. The Central Treasury functions are the sole interface to the market for both cash and derivative transactions.
We maintain an internal funds transfer pricing system based on prevailing market rates. Our funds transfer pricing system charges the businesses the price of short-term and long-term liquidity taking into account the behavioural duration of the asset. The costs and risks of liquidity are clearly and transparently attributed to business lines and are understood by business line management, thereby ensuring that price of liquidity is integrated into business level decision-making and drives the appropriate mix of sources and uses of funds.
The balance sheet risk management team, in their respective geographies based within Group Risk Management, independently identify, quantify and monitor risks, providing daily independent governance and oversight of the treasury activities and the execution of the bank’s policy, continuously assessing the risks while taking changes in market conditions into account. In carrying out its duties, the balance sheet risk management team monitors historical liquidity trends, tracks prospective on – and off-balance sheet liquidity obligations, identifies and measures internal and external liquidity warning signals which permit early detection of potential liquidity concerns through daily
liquidity reporting, and further perform scenario analysis which quantifies our exposure, thus providing a comprehensive and consistent governance framework. The balance sheet risk management team proactively identifies proposed regulatory developments, best risk practice, and measures adopted in the broader market, and implements changes to the bank’s risk management and governance framework where relevant.
Scenario modelling and rigorous daily liquidity stress tests are designed to measure and manage the liquidity position such that payment obligations can be met under a wide range of company-specific and market-driven stress scenarios. These assume the rate and timing of deposit withdrawals and drawdowns on lending facilities are varied, and the ability to access funding and to generate funds from asset portfolios is restricted.
The parameters used in the scenarios are reviewed regularly, taking into account changes in the business environments and input from business units. The objective is to analyse the possible impact of an economic event risk on cash flow, liquidity, profitability and solvency position, so as to maintain sufficient liquidity, in an acute stress, to continue to operate for a minimum period as detailed in the board-approved risk appetite.
We further carry out reverse stress tests to identify business model vulnerabilities which tests ‘tail risks’ that can be missed in normal stress tests. The group has calculated the severity of stress required to breach the liquidity requirements. This scenario is considered highly unlikely given the group’s strong liquidity position, as it requires an extreme withdrawal of deposits combined with the inability to take any management actions to breach liquidity minima that threatens Investec’s liquidity position.
The integrated balance sheet risk management framework is based on similar methodologies to those contemplated under the Basel Committee on Banking Supervision’s (BCBS) ‘International framework for liquidity risk measurement, standards and monitoring’ and is compliant with the ‘principles for sound liquidity risk management and supervision’ as well as ‘principles for management and supervision of interest rate risk in the banking book’.
62 Investec integrated annual report 2017
Risk and
Basel P
illar III disclosures
01 Risk management(continued)
Each banking entity within the group maintains a contingency funding plan designed to protect depositors, creditors and shareholders and maintain market confidence during adverse liquidity conditions and pave the way for the group to emerge from a potential funding crisis with the best possible reputation and financial condition for continuing operations. The liquidity contingency plans outline extensive early warning indicators, clear lines of communication, and decisive crisis response strategies.
There is a regular audit of the Balance Sheet Risk Management function, the frequency of which is determined by the independent audit committees.
The group operates an industry-recognised third party risk modelling system in addition to custom-built management information systems designed to measure and monitor liquidity risk on both a current and forward looking basis. The system is reconciled to the bank’s general ledger and audited by Internal and External Audit thereby ensuring integrity of the process.
Daily, weekly and monthly reports are independently produced highlighting bank activity, exposures and key measures against thresholds and limits and are distributed to management, ALCO, the Central Treasury function, Review ERRF, GRCC, BRCC as well as summarised reports for board meetings.
Statutory reports are submitted to the relevant regulators in each jurisdiction within which we operate.
Liquidity risk Liquidity risk description
Liquidity risk refers to the possibility that, despite being solvent, we have insufficient capacity to fund increases in assets, or are unable to meet our payment obligations as they fall due, without incurring unacceptable losses. This includes repaying depositors or maturing wholesale debt. This risk is inherent in all banking operations and can be impacted by a range of institution-specific and market-wide events.
Liquidity risk is further broken down into:• Funding liquidity: this relates to the risk
that the bank will be unable to meet current and/or future cash flow or collateral requirements in the normal
course of business, without adversely affecting its financial position or its reputation
• Market liquidity: this relates to the risk that the bank may be unable to trade in specific markets or that it may only be able to do so with difficulty due to market disruptions or a lack of market liquidity.
Sources of liquidity risk include:• Unforeseen withdrawals of deposits
• Restricted access to new funding with appropriate maturity and interest rate characteristics
• Inability to liquidate a marketable asset in a timely manner with minimal risk of capital loss
• Unpredicted customer non-payment of loan obligations
• A sudden increased demand for loans in the absence of corresponding funding inflows of appropriate maturity.
Management and measurement of liquidity risk
Maturity transformation performed by banks is a crucial part of financial intermediation that contributes to efficient resource allocation and credit creation.
Cohesive liquidity management is vital for protecting our depositors, preserving market confidence, safeguarding our reputation and ensuring sustainable growth with established funding sources. Through active liquidity management, we seek to preserve stable, reliable and cost-effective sources of funding. As such, the group considers ongoing access to appropriate liquidity for all its operations to be of paramount importance, and our core liquidity philosophy is reflected in day-to-day practices which encompass the following robust and comprehensive set of policies and procedures for assessing, measuring and controlling the liquidity risk:
• The group complies with the BCBS principles for sound liquidity risk management and supervision
• Our liquidity management processes encompass principles set out by the regulatory authorities in each jurisdiction, namely the PRA, EBA, SARB, BOM, Guernsey Financial Services and FINMA
• The risk appetite is clearly defined by the board and each geographic entity must have its own board-approved policies with respect to liquidity risk management
• We maintain a liquidity buffer in the form of unencumbered cash, government or rated securities (typically eligible for repurchase with the central bank), and near cash well in excess of the statutory requirements as protection against unexpected disruptions in cash flows
• Funding is diversified with respect to currency, term, product, client type and counterparty to ensure a satisfactory overall funding mix
• We monitor and evaluate each banking entity’s maturity ladder and funding gap (cash flow maturity mismatch) on a ‘liquidation’, ‘going concern’ and ‘stress’ basis
• The balance sheet risk management team independently monitors key daily funding metrics and liquidity ratios to assess potential risks to the liquidity position, which further act as early warning indicators of potential normal market disruption
• The maintenance of sustainable prudent liquidity resources takes precedence over profitability
• The group maintains adequate contingency funding plans designed to protect depositors, creditors and shareholders and maintain market confidence during adverse liquidity conditions.
Our liquidity risk management reflects evolving best practice standards in light of the challenging environment. Liquidity risk management encompasses the ongoing management of structural, tactical day-to-day and contingent stress liquidity.
Management uses assumptions-based planning and scenario modelling that considers market conditions, prevailing interest rates and projected balance sheet growth, to estimate future funding and liquidity needs while taking the desired nature and profile of liabilities into account. These metrics are used to develop our funding strategy and measure and manage the execution thereof. The funding plan details the proportion of our external assets

63Investec integrated annual report 2017
Risk and
Basel P
illar III disclosures
01Risk management(continued)
dependence on any one source so as to ensure a satisfactory overall funding mix to support loan growth.
We acknowledge the importance of our private client base as the principal source of stable and well diversified funding for Investec’s risk assets. We continue to develop products to attract and service the investment needs of our Private Bank client base. We also have a number of innovative retail deposit initiatives within our Private Banking division and these continued to experience strong inflows during the financial year. Customer deposits have continued to grow during the year and our customers display a strong ‘stickiness’ and willingness to reinvest in our suite of savings, term and notice products.
Entities within the group actively participate in global financial markets and our relationship is continuously enhanced through regular investor presentations internationally. Entities are only allowed to have funding exposure to wholesale markets where they can demonstrate that the market is sufficiently deep and liquid, and then only relative to the size and complexity of their business. We have instituted various offshore syndicated loan programmes to broaden and diversify term funding in supplementary markets and currencies, enhancing the proven capacity to borrow in the money markets. The group remains committed to increasing its core deposits and accessing domestic and foreign capital markets when appropriate. Decisions on the timing and tenor of accessing these markets are based on relative costs, general market conditions, prospective views of balance sheet growth and a targeted liquidity profile.
The group’s ability to access funding at cost-effective levels is influenced by maintaining or improving the entity’s credit rating. A reduction in these ratings could have an adverse effect on the group’s funding costs, and access to wholesale term funding. Credit ratings are dependent on multiple factors, including operating environment, business model, strategy, capital adequacy levels, quality of earnings, risk appetite and exposure, and control framework.
We hold a liquidity buffer in the form of cash, unencumbered high quality liquid
which are funded by customer liabilities, unsecured wholesale debt, equity and loan capital, thus maintaining an appropriate mix of structural and term funding, resulting in strong balance sheet liquidity ratios.
We measure liquidity risk by quantifying and calculating various liquidity risk metrics and ratios to assess potential risks to the liquidity position. Metrics and ratios include:
• Local regulatory requirements
• Contractual run-off based actual cash flows with no modelling adjustment
• ‘Business as usual’ normal environment where we apply rollover and reinvestment assumptions under benign market conditions
• Basel standards for liquidity measurement:
– Liquidity Coverage Ratio (LCR)
– Net Stable Funding Ratio (NSFR)
• Stress scenarios based on statistical historical analysis, documented experience and prudent judgement
• Quantification of a ‘survival horizon’ under stress conditions. The survival horizon is the number of business days it takes under combined stress before the bank’s cash position turns negative
• Other key funding and balance sheet ratios
• Monitoring and analysing market trends and the external environment.
This ensures the smooth management of the day-to-day liquidity position within conservative parameters and further validates that we are able to generate sufficient liquidity to withstand short-term liquidity stress or market disruptions in the event of either a firm-specific or general market contingent event.
We maintain a funding structure with stable customer deposits and long-term wholesale funding well in excess of illiquid assets. We target a diversified funding base, avoiding undue concentrations by investor type, maturity, market source, instrument and currency. This validates our ability to generate funding from a broad range of sources in a variety of geographic locations, which enhances financial flexibility and limits
assets (typically in the form of government or rated securities eligible for repurchase with the central bank), and near cash, well in excess of the statutory requirements as protection against unexpected disruptions in cash flows. These portfolios are managed within board approved targets, and apart from acting as a buffer under going concern conditions, also form an integral part of the broader liquidity generation strategy. Investec remains a net liquidity provider to the interbank market, placing significantly more funds with other banks than our short-term interbank borrowings. We do not rely on interbank deposits to fund term lending.
From 1 April 2016 to 31 March 2017 average cash and near cash balances over the period amounted to £12.8 billion (£5.9 billion in UK and Other; R125.2 billion in South Africa).
We are currently unaware of any circumstances that could significantly detract from our ability to raise funding appropriate to our needs.
The liquidity contingency plans outline extensive early warning indicators, clear lines of communication and decisive crisis response strategies. Early warning indicators span both bank-specific and systemic crises. Rapid response strategies address :
• action plans
• roles and responsibilities
• composition of decision-making bodies involved in liquidity crisis management
• internal and external communications including public relations
• sources of liquidity
• avenues available to access additional liquidity
• supplementary information requirements required to manage liquidity during such an event.
This plan helps to ensure that cash flow estimates and commitments can be met in the event of general market disruption or adverse bank-specific events, while minimising detrimental long-term implications for the business.
64 Investec integrated annual report 2017
Risk and
Basel P
illar III disclosures
01 Risk management(continued)
Asset encumbranceAn asset is defined as encumbered if it has been pledged as collateral against an existing liability and, as a result, is no longer available to the group to secure funding, satisfy collateral needs or be sold to reduce the funding requirement. An asset is therefore categorised as unencumbered if it has not been pledged against an existing liability. In the UK, Risk Management monitors and manages total balance sheet encumbrance via a board-approved risk appetite framework.
The group utilises securitisation in order to raise external term funding as part of its diversified liability base. Securitisation notes issued are also retained by the group which are available to provide a pool of collateral eligible to support central bank liquidity facilities, including the Bank of England's Funding for Lending and Term Funding Schemes.
The group uses secured transactions to manage short-term cash and collateral needs. Details of assets pledged through repurchase activity and collateral pledges are reported by line item of the balance sheet on which they are reflected on
page 80 in volume three. Related liabilities are also reported including derivative margin posted.
On page 80 in volume three we disclose further details of assets that have been received as collateral under reverse repurchase agreements and securities borrowing transactions where the assets are allowed to be resold or pledged.
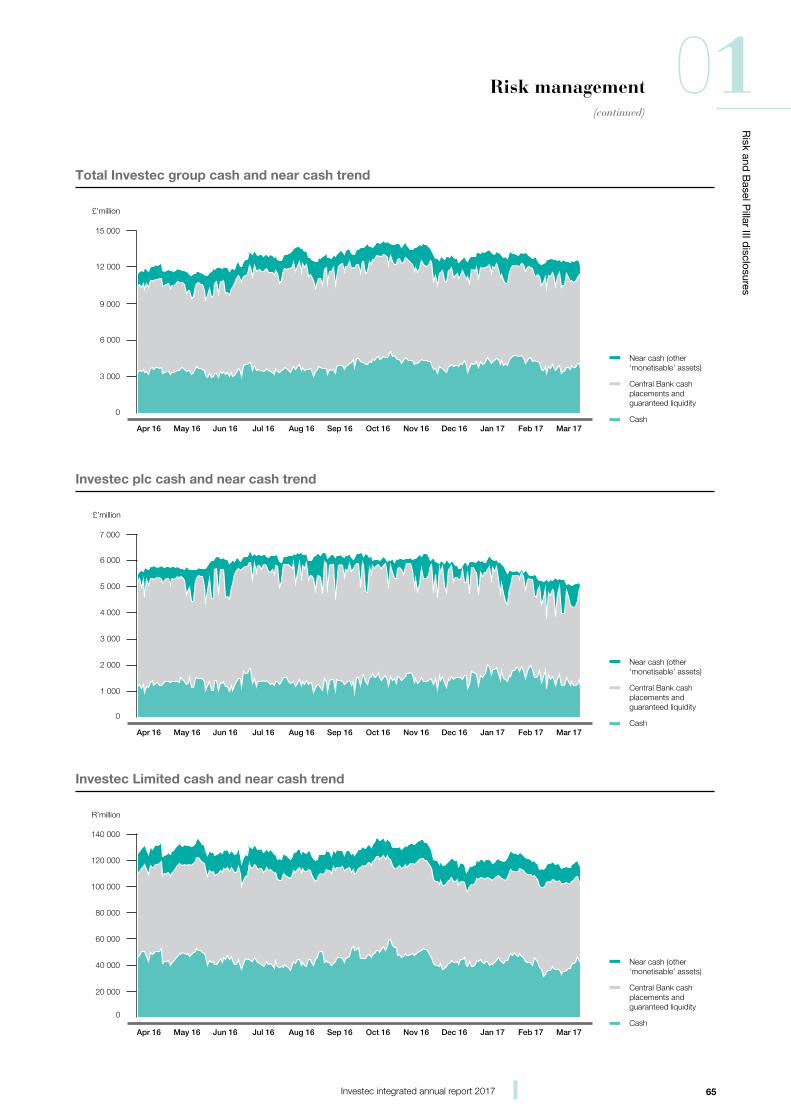
65Investec integrated annual report 2017
Risk and
Basel P
illar III disclosures
01Risk management(continued)
R’million
0
20 000
40 000
60 000
80 000
100 000
120 000
140 000
Near cash (other ‘monetisable’ assets)
Central Bank cash placements and guaranteed liquidity
Cash
Investec Limited cash and near cash trend
Apr 16 May 16 Jun 16 Jul 16 Aug 16 Sep 16 Oct 16 Nov 16 Dec 16 Jan 17 Feb 17 Mar 17
£’million
0
3 000
6 000
9 000
12 000
15 000
Apr 16 May 16 Jun 16 Jul 16 Aug 16 Sep 16 Oct 16 Nov 16 Dec 16 Jan 17 Feb 17 Mar 17
Near cash (other ‘monetisable’ assets)
Central Bank cash placements and guaranteed liquidity
Cash
Total Investec group cash and near cash trend
£’million
0
1 000
2 000
3 000
4 000
5 000
6 000
7 000
Near cash (other ‘monetisable’ assets)
Central Bank cash placements and guaranteed liquidity
Cash
Investec plc cash and near cash trend
Apr 16 May 16 Jun 16 Jul 16 Aug 16 Sep 16 Oct 16 Nov 16 Dec 16 Jan 17 Feb 17 Mar 17
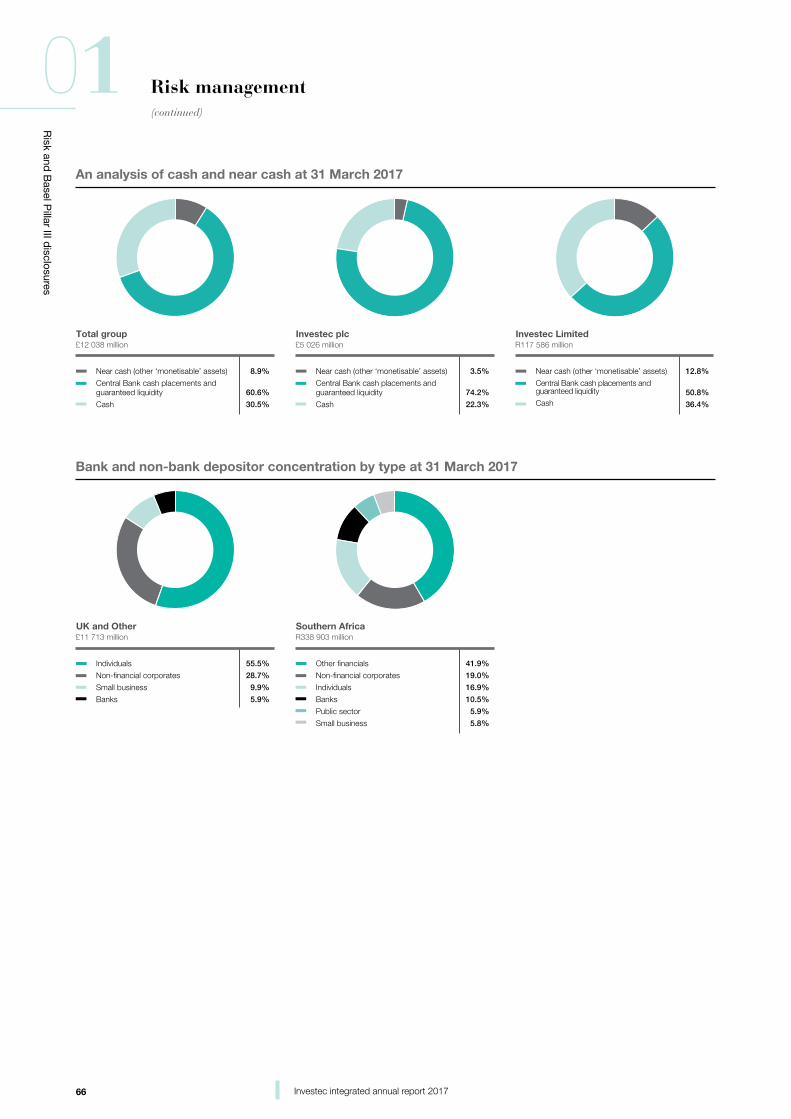
66 Investec integrated annual report 2017
Risk and
Basel P
illar III disclosures
01 Risk management(continued)
£12 038 million
An analysis of cash and near cash at 31 March 2017
8.9%
60.6%
30.5%
Total group
Near cash (other ‘monetisable’ assets)
Central Bank cash placements and guaranteed liquidity
Cash
£5 026 million
3.5%
74.2%
22.3%
Investec plc
Near cash (other ‘monetisable’ assets)
Central Bank cash placements and guaranteed liquidity
Cash
R117 586 million
12.8%
50.8%
36.4%
Investec Limited
Near cash (other ‘monetisable’ assets)
Central Bank cash placements and guaranteed liquidity
Cash
£11 713 million
Bank and non-bank depositor concentration by type at 31 March 2017
55.5%
28.7%
9.9%
5.9%
UK and Other
Individuals
Non-financial corporates
Small business
Banks
R338 903 million
41.9%
19.0%
16.9%
10.5%
5.9%
5.8%
Southern Africa
Other financials
Non-financial corporates
Individuals
Banks
Public sector
Small business
67Investec integrated annual report 2017
Risk and
Basel P
illar III disclosures
01Risk management(continued)
The liquidity position of the group remained sound with total cash and near cash balances amounting to £12 billion
Liquidity mismatchThe tables that follow show our contractual liquidity mismatch across our core geographies.
The tables will not agree directly to the balances disclosed in the respective balance sheets since the tables incorporate cash flows on a contractual, undiscounted basis based on the earliest date on which the group can be required to pay.
The tables reflect that loans and advances to customers are financed by stable funding sources.
With respect to the contractual liquidity mismatch:
• No assumptions are made except as mentioned below, and we record all assets and liabilities with the underlying contractual maturity as determined by the cash flow profile for each deal
• As an integral part of the broader liquidity generation strategy, we maintain a liquidity buffer in the form of unencumbered cash, government, or rated securities and near cash against both expected and unexpected cash flows
• The actual contractual profile of the assets in the liquidity buffer is of little consequence, as practically Investec would meet any unexpected net cash outflows by repo’ing or selling these securities. We have:
– set the time horizon to ‘on demand’ to monetise our statutory liquid assets for which liquidity is guaranteed by the central bank;
– set the time horizon to one month to monetise our cash and near cash portfolio of ‘available-for-sale’ discretionary treasury assets, where there are deep secondary markets for this elective asset class; and
– reported the ‘contractual’ profile by way of a note to the tables.
With respect to the behavioural liquidity mismatch:
• Behavioural liquidity mismatch tends to display a high probability, low severity liquidity position. Many retail deposits, which are included within customer accounts, are repayable on demand or at short notice on a contractual basis. In practice, these instruments form a stable base for the group’s operations and liquidity needs because of the broad base of customers. To this end, behavioural profiling is applied to liabilities with an undefined maturity, as the contractual repayments of many customer accounts are on demand or at short notice but expected cash flows vary significantly from contractual maturity. An internal analysis model is used, based on statistical research of the historical series of products. This is used to identify significant additional sources of structural liquidity in the form of core deposits that exhibit stable behaviour. In addition, reinvestment behaviour, with profile and attrition based on history, is applied to term deposits in the normal course of business.
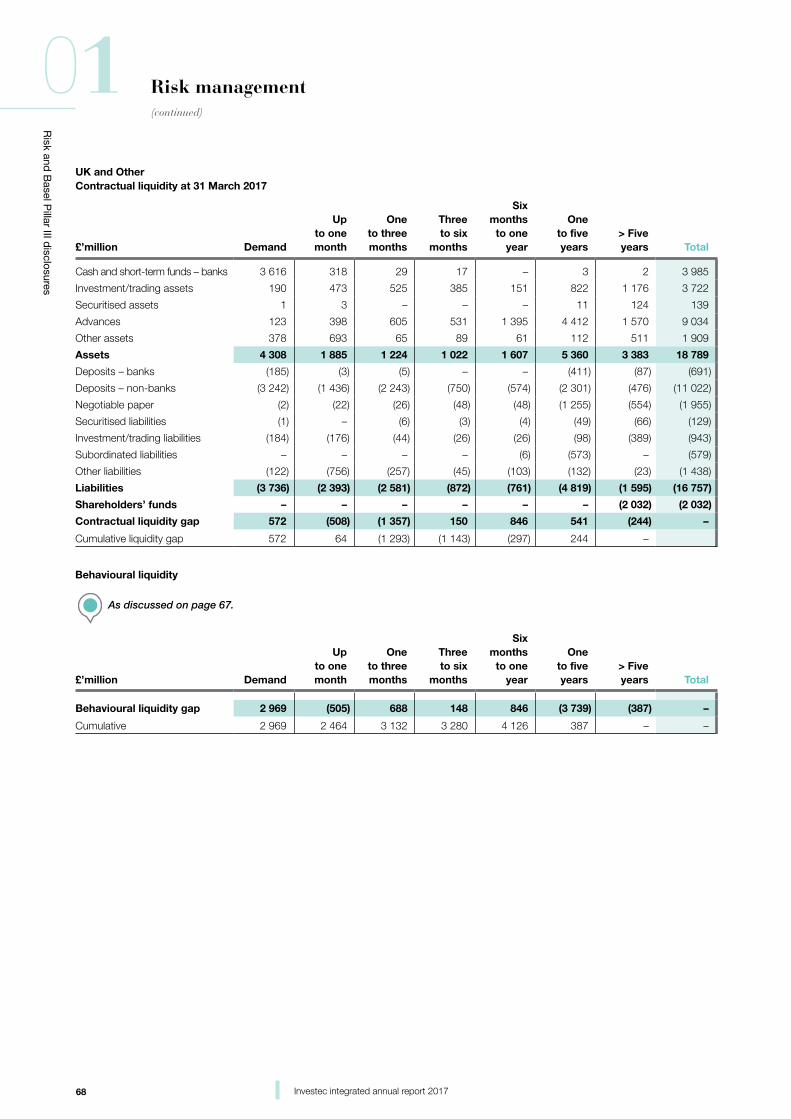
68 Investec integrated annual report 2017
Risk and
Basel P
illar III disclosures
01 Risk management(continued)
UK and OtherContractual liquidity at 31 March 2017
£’million Demand
Up to one
month
One to three months
Three to six
months
Six months to one
year
One to five years
> Five years Total
Cash and short-term funds – banks 3 616 318 29 17 – 3 2 3 985
Investment/trading assets 190 473 525 385 151 822 1 176 3 722
Securitised assets 1 3 – – – 11 124 139
Advances 123 398 605 531 1 395 4 412 1 570 9 034
Other assets 378 693 65 89 61 112 511 1 909
Assets 4 308 1 885 1 224 1 022 1 607 5 360 3 383 18 789
Deposits – banks (185) (3) (5) – – (411) (87) (691)
Deposits – non-banks (3 242) (1 436) (2 243) (750) (574) (2 301) (476) (11 022)
Negotiable paper (2) (22) (26) (48) (48) (1 255) (554) (1 955)
Securitised liabilities (1) – (6) (3) (4) (49) (66) (129)
Investment/trading liabilities (184) (176) (44) (26) (26) (98) (389) (943)
Subordinated liabilities – – – – (6) (573) – (579)
Other liabilities (122) (756) (257) (45) (103) (132) (23) (1 438)
Liabilities (3 736) (2 393) (2 581) (872) (761) (4 819) (1 595) (16 757)
Shareholders’ funds – – – – – – (2 032) (2 032)
Contractual liquidity gap 572 (508) (1 357) 150 846 541 (244) –
Cumulative liquidity gap 572 64 (1 293) (1 143) (297) 244 –
Behavioural liquidity
As discussed on page 67.
£’million Demand
Up to one
month
One to three months
Three to six
months
Six months to one
year
One to five years
> Five years Total
Behavioural liquidity gap 2 969 (505) 688 148 846 (3 739) (387) –
Cumulative 2 969 2 464 3 132 3 280 4 126 387 – –
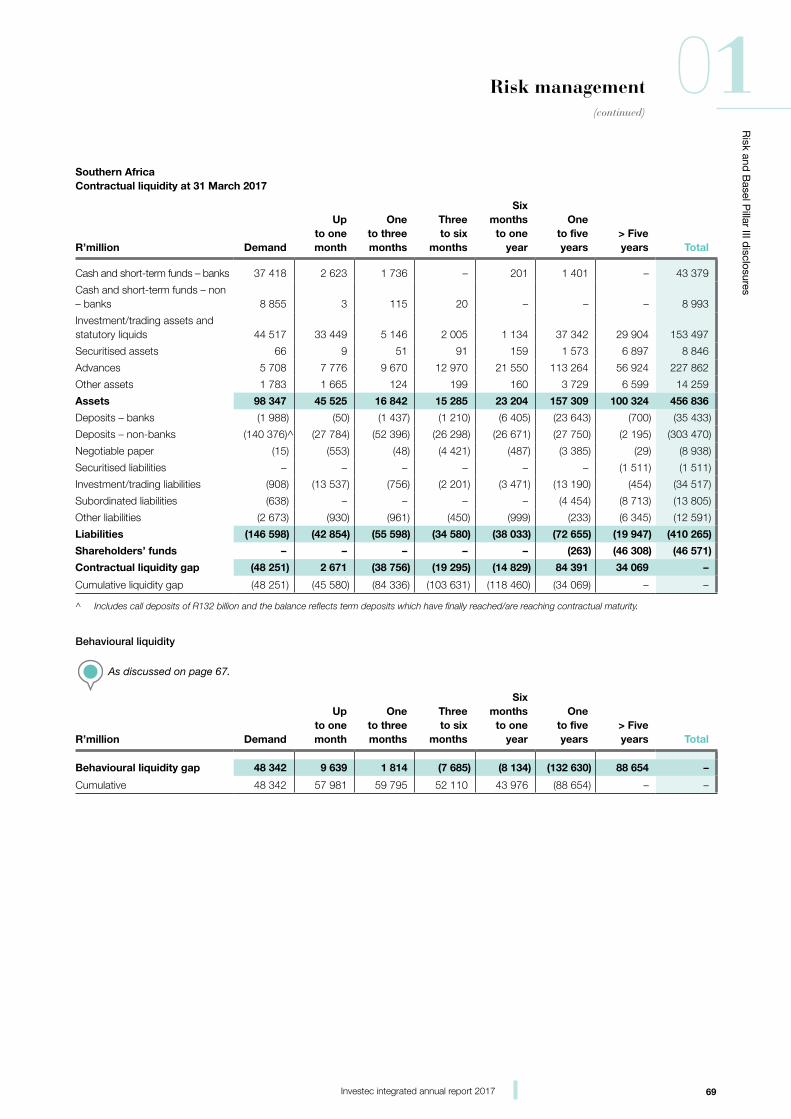
69Investec integrated annual report 2017
Risk and
Basel P
illar III disclosures
01Risk management(continued)
Southern AfricaContractual liquidity at 31 March 2017
R’million Demand
Up to one
month
One to three months
Three to six
months
Six months to one
year
One to five years
> Five years Total
Cash and short-term funds – banks 37 418 2 623 1 736 – 201 1 401 – 43 379
Cash and short-term funds – non – banks 8 855 3 115 20 – – – 8 993
Investment/trading assets and statutory liquids 44 517 33 449 5 146 2 005 1 134 37 342 29 904 153 497
Securitised assets 66 9 51 91 159 1 573 6 897 8 846
Advances 5 708 7 776 9 670 12 970 21 550 113 264 56 924 227 862
Other assets 1 783 1 665 124 199 160 3 729 6 599 14 259
Assets 98 347 45 525 16 842 15 285 23 204 157 309 100 324 456 836
Deposits – banks (1 988) (50) (1 437) (1 210) (6 405) (23 643) (700) (35 433)
Deposits – non-banks (140 376)^ (27 784) (52 396) (26 298) (26 671) (27 750) (2 195) (303 470)
Negotiable paper (15) (553) (48) (4 421) (487) (3 385) (29) (8 938)
Securitised liabilities – – – – – – (1 511) (1 511)
Investment/trading liabilities (908) (13 537) (756) (2 201) (3 471) (13 190) (454) (34 517)
Subordinated liabilities (638) – – – – (4 454) (8 713) (13 805)
Other liabilities (2 673) (930) (961) (450) (999) (233) (6 345) (12 591)
Liabilities (146 598) (42 854) (55 598) (34 580) (38 033) (72 655) (19 947) (410 265)
Shareholders’ funds – – – – – (263) (46 308) (46 571)
Contractual liquidity gap (48 251) 2 671 (38 756) (19 295) (14 829) 84 391 34 069 –
Cumulative liquidity gap (48 251) (45 580) (84 336) (103 631) (118 460) (34 069) – –
^ Includes call deposits of R132 billion and the balance reflects term deposits which have finally reached/are reaching contractual maturity.
Behavioural liquidity
As discussed on page 67.
R’million Demand
Up to one
month
One to three months
Three to six
months
Six months to one
year
One to five years
> Five years Total
Behavioural liquidity gap 48 342 9 639 1 814 (7 685) (8 134) (132 630) 88 654 –
Cumulative 48 342 57 981 59 795 52 110 43 976 (88 654) – –
70 Investec integrated annual report 2017
Risk and
Basel P
illar III disclosures
01 Risk management(continued)
The group has committed itself to implementation of the BCBS guidelines for liquidity risk measurement standards and the enhanced regulatory framework
Balance sheet risk year in review• Investec maintained its strong liquidity
position and continued to hold high levels of surplus liquid assets
• We sustained strong term funding in demanding market conditions while focusing on lowering the weighted average cost of funding
• Our liquidity risk management process remains robust and comprehensive.
UK and Other
A very strong, surplus liquidity position was defensively maintained ahead of the EU Referendum in June. After a brief period of volatility following the result of the referendum, markets have been strong and the excess liquidity has been managed down in the second half of the year through both net asset growth, liability management and pricing.
Following these actions, the strategy to normalise liquidity has largely been completed by the year end. The overall liquidity position still remains strong across a range of metrics in line with our overall conservative approach to balance sheet risk management.
The ratings of Investec Bank plc remained stable during the year. Investec Bank plc’s long-term deposit rating is A2 (stable outlook) from Moody’s and BBB (stable outlook) from Fitch. In April 2016 Investec plc’s long-term issuer rating was upgraded by Moody's one notch further to Baa1 (stable outlook).
The active management of the liability channels, particularly in the second half of the year, has enabled a reduction in funding rates across both channels and tenor. However, throughout this liability management strategy, a diverse mix of liabilities by currency, channel and tenor has continued to be maintained to avoid reliance on any particular channel and allow continued access to a range of deposits. Furthermore, selective opportunities in the wholesale and secured funding space continue to be employed in a strategic manner to extend the contractual maturity of balance sheet liabilities, while avoiding refinancing risks.
Cash and near cash balances at 31 March 2017 amounted to £5.0 billion (2016: £5.1 billion). Total UK and Other customer deposits was £11.0 billion at 31 March 2017 (2016: £10.8 billion). The LCR reported to the PRA at 31 March 2017 was 654% for Investec plc and 616% for Investec Bank plc (solo basis). Based on our own interpretations and in line with the BCBS’ final recommendations (BCBS 295), Investec plc and Investec Bank plc (solo basis) comfortably exceed the 100% minimum level for the NSFR.
South Africa
During the past financial year the liquidity risk profile of the balance sheet has improved. Investec grew its total customer deposits by 8.5% from R280 billion to R303 billion at 31 March 2017. Our Private Bank and Cash Investments fund raising channels grew deposits by 13% to R124 billion over the financial year. Over
the same period the wholesale channels remained flat at R179 billion. This included several successful senior unsecured bond issues totalling R4.6 billion. As a result Investec decreased its reliance on wholesale funding from 60.7% to 59.1% over the financial year.
The impact on our liquidity ratios was positive. The three month average LCR for Investec Bank Limited solo increased from 117.3% to 130.0% which is well above the minimum level of 80% required. By January 2019 the LCR minimum requirement moves to 100% and we remain confident of our ability to comfortably exceed this requirement whilst continuing to meet planned asset growth targets. The NSFR will also have to exceed 100% by January 2018. We are well positioned to meet this regulatory liquidity measure as currently our ratios exceed this requirement.
Three and five year term foreign currency loan deals totalling US$835 million were concluded this financial year.
In order to improve our return on assets, lower yielding cash and near cash balances have been deliberately paired back ending the financial year at R117.6 billion.
In conclusion we remain well positioned to meet the challenges that heightened political instability may bring in the new financial year.
71Investec integrated annual report 2017
Risk and
Basel P
illar III disclosures
01Risk management(continued)
Regulatory considerations – balance sheet riskIn response to the global financial crisis, national and supranational regulators have introduced changes to laws and regulations designed to both strengthen and harmonise global capital and liquidity standards to ensure a strong financial sector and global economy.
Two key liquidity measures were defined:
• The liquidity coverage ratio (LCR) is designed to promote short-term resilience of one-month liquidity profile, by ensuring that banks have sufficient high quality liquid assets to meet potential outflows in a stressed environment. The BCBS published the final calibration of the LCR in January 2013. The LCR ratio is being phased in from 2015 to 2019
• The net stable funding ratio (NSFR) is designed to capture structural issues over a longer time horizon by requiring banks to have a sustainable maturity structure of assets and liabilities. The BCBS published the final document on the NSFR in October 2014.
UK and OtherOn 1 October 2015 under European Commission Delegated Regulation 2015/61, the LCR became the PRA’s primary regulatory reporting standard for liquidity. The LCR is a Pillar I metric to which the PRA apply Pillar II add-ons. The LCR is being introduced on a phased basis, and the PRA has opted to impose higher liquidity coverage requirements during the phased-in period than the minimum required by CRD IV. From 1 January 2017, UK banks were required to maintain a minimum of 90%, rising to 100% on 1 January 2018. The published LCR excludes Pillar II add-ons. For Investec plc and Investec Bank plc (solo basis), the LCR is calculated using our own interpretations of the EU Delegated Act. The reported LCR may change over time with regulatory developments. The LCR reported to the PRA at 31 March 2017 was 654% for Investec plc and 616% for Investec Bank plc (solo basis).
In November 2016, the European Commission released a number of proposals amending the CRR including a number of adjustments with respect to the NSFR. Banks will be expected to hold a NSFR of at least 100% on an ongoing basis and report their NSFR at least quarterly. The implementation date of this requirement will be two years after the date of entry into
force of the proposed regulation. The NSFR therefore remains subject to an observation period in advance of such implementation and we will continue to monitor these rules until final implementation. The reported NSFR may change over time with regulatory developments.
Based on our own interpretations and in line with the BCBS’ final recommendations (BCBS 295), Investec plc and Investec Bank plc (solo basis) comfortably exceed 100% minimum level for the NSFR.
South AfricaSouth Africa, a member of the G20, has adopted the published BCBS guidelines for ‘liquidity risk measurement standards and monitoring’.
However, there are certain shortcomings and constraints in the South African environment and the banking sector in South Africa is characterised by certain structural features such as:
• A low discretionary savings rate and a higher degree of contractual savings that are captured by institutions such as pension funds, provident funds and providers of asset management services
• There is currently no ‘deposit protection scheme’ in South Africa. However, the regulators plan to incorporate a deposit protection scheme within the broader amendments to the recovery and resolution framework
• South Africa has an insufficient supply of level 1 assets in domestic currency to meet the aggregate demand.
Nevertheless, there are various regulatory and economic barriers that prevent liquidity from flowing out of the domestic economy. Namely, South Africa has exchange control that limits capital flows, along with prudential requirements on financial corporates.
A positive consequence of the above is that the Rand funding that the South African banks use is contained within the financial system and therefore the Rand is unlikely to be drained by currency withdrawal from off-shore sources, or placements in offshore accounts.
To address this systemic challenge, the SARB exercised national discretion and has announced:
• The introduction of a committed liquidity facility (CLF) whereby South African banks can apply to the Reserve Bank for the CLF against eligible collateral for a
prescribed commitment fee. The CLF is limited to 40% of net outflows under the LCR. Investec Bank Limited used the CLF offered by the SARB, as a buffer, to augment the LCR by approximately 10% until December 2016, and 5% to the end of the financial year. Investec Bank Limited exceeds the minimum requirement for the LCR in March 2017
• A change to available stable funding factor as applied to less than six months term deposits from the financial sector. The change recognises 35% of less than six months financial sector deposits which has the impact of reducing the amount of greater than six months term deposits required by local banks to meet the NSFR.
Notwithstanding the above constraints, Investec Bank in South Africa is fully compliant with the LCR and NSFR liquidity ratios, having embedded these ratios into our processes.
Non-trading interest rate risk descriptionNon-trading interest rate risk, otherwise known as interest rate risk in the banking book, arises from the impact on net interest earnings and economic value of equity of adverse movements in interest rates.
Sources of interest rate risk include:
• Repricing risk: arises from the timing differences in the fixed rate maturity and floating rate repricing of bank assets, liabilities and off-balance sheet derivative positions. This affects the interest rate margin realised between lending income and borrowing costs when applied to our rate sensitive portfolios
• Yield curve risk: repricing mismatches also expose the bank to changes in the slope and shape of the yield curve
• Basis risk: arises from imperfect correlation in the adjustments of the rates earned and paid on different instruments with otherwise similar repricing characteristics
• Embedded option risk: arises from optional elements embedded in items where the bank or its customers can alter the level and timing of their cash flows
• Endowment risk: refers to the interest rate risk exposure arising from the net differential between interest rate insensitive assets, interest rate insensitive liabilities and capital.
72 Investec integrated annual report 2017
Risk and
Basel P
illar III disclosures
01 Risk management(continued)
The above sources of interest rate risk affect the interest rate margin realised between lending income and borrowing costs, when applied to our rate sensitive asset and liability portfolios, which has a direct effect on future net interest income and the economic value of equity.
Management and measurement of non-trading interest rate riskNon-trading interest rate risk in the banking book is an inherent consequence of conducting banking activities, and arises from the provision of retail and wholesale (non-trading) banking products and services. The group considers the management of banking margin of importance, and our core non-trading interest rate risk philosophy is reflected in day-to-day practices.
The aim of non-trading interest rate risk management is to protect and enhance net interest income and economic value of equity in accordance with the board-approved risk appetite, and to ensure a high degree of stability of the net interest margin over an interest rate cycle. Non-trading interest rate risk is measured and analysed by utilising standard tools of traditional interest rate repricing mismatch and NPV sensitivity to changes in interest rate risk factors:
• Income metrics capture the change in accruals expected over a specified time horizon in response to a change in interest rates
• Economic value metrics capture all future cash flows in order to calculate the bank’s net worth and therefore can highlight risks beyond the short-term earnings time horizon.
These metrics are used to assess and to communicate to senior management the financial impact of possible future interest rate scenarios, covering (i) interest rate expectations and perceived risks to the central view (ii) standard shocks to levels and shapes of interest rates and yield curves (iii) historically-based yield curve changes.
The repricing gap provides a basic representation of the balance sheet, with
the sensitivity of earnings to changes to interest rates calculated off the repricing gap. This allows for the detection of interest rate risk by concentration of repricing buckets. Net interest income sensitivity measures the change in accruals expected over the specified horizon in response to a shift in the yield curve, while economic value sensitivity and stress testing to macro-economic movement or changes to the yield curve measures the interest risk implicit change in net worth as a result of a change in interest rates on the current values of financial assets and liabilities. Economic value measures have the advantage that all future cash flows are considered and therefore can highlight risk beyond the earnings horizon.
Each geographic entity has its own board-approved non-trading interest rate risk policy and risk appetite, which is clearly defined in relation to both income risk and economic value risk. The policy dictates that long-term (>1 year) non-trading interest rate risk is materially eliminated. Where natural hedges between banking book items do not suffice to reduce the exposure within defined limits, interest rate swaps are used to transform fixed rate assets and liabilities into variable rate items.
Operationally, daily management of interest rate risk is centralised within the Central Treasury of each geographic entity and is subject to local independent risk and ALCO review. Non-trading interest rate risk is transferred within predefined guidelines from the originating business to the Central Treasury function and aggregated or netted providing Central Treasury with a holistic view of the residual exposure. Central Treasury then implements appropriate balance sheet strategies to achieve a cost-effective source of funding and mitigates any residual undesirable risk where possible, by changing the duration of the banking group’s discretionary liquid asset portfolio, or through derivative transactions which transfer the risk into the trading books within the Corporate and Institutional Banking division to be traded with the external market. The Central Treasury mandate allows for a tactical response to market opportunities which may arise during changing interest rate cycles. Any
resultant interest rate position is managed under the market risk limits.
Together with the business, the treasurer develops strategies regarding changes in the volume, composition, pricing and interest rate characteristics of assets and liabilities to mitigate the interest rate risk and ensure a high degree of net interest margin stability over an interest rate cycle. These are presented, debated and challenged in the liability product and pricing forum and ALCO.
Balance Sheet Risk Management independently monitors various interest rate risk metrics to changes in interest rate risk factors, detailing the sources of interest rate exposure.
We are exposed to automatic optionality risk for those lending products where the bank applies a minimum lending rate. This is an income protection mechanism allowing for upward potential and no downside risk. We are not materially exposed to behavioural embedded option risk, as contract breakage penalties on fixed-rate items specifically cover this risk, while early termination of variable rate contracts has negligible impact on interest rate risk.
Investec has a relatively small endowment risk due to paying market rates on all deposits, compared to banks with significant low or non-interest-bearing current and cheque accounts. Endowment risk due to free funding, comprising mainly ordinary share capital and reserves, is managed passively, with the focus on measuring and monitoring. The endowment risk is included within our non-trading interest rate risk measures.
The group complies with the BCBS framework which is currently in force for assessing banking book (non-trading) interest rate risk, and is in the process of enhancing its existing framework to adhere to the new BCBS principles which come into effect in 2018.
Internal capital is allocated for non-trading interest rate risk.
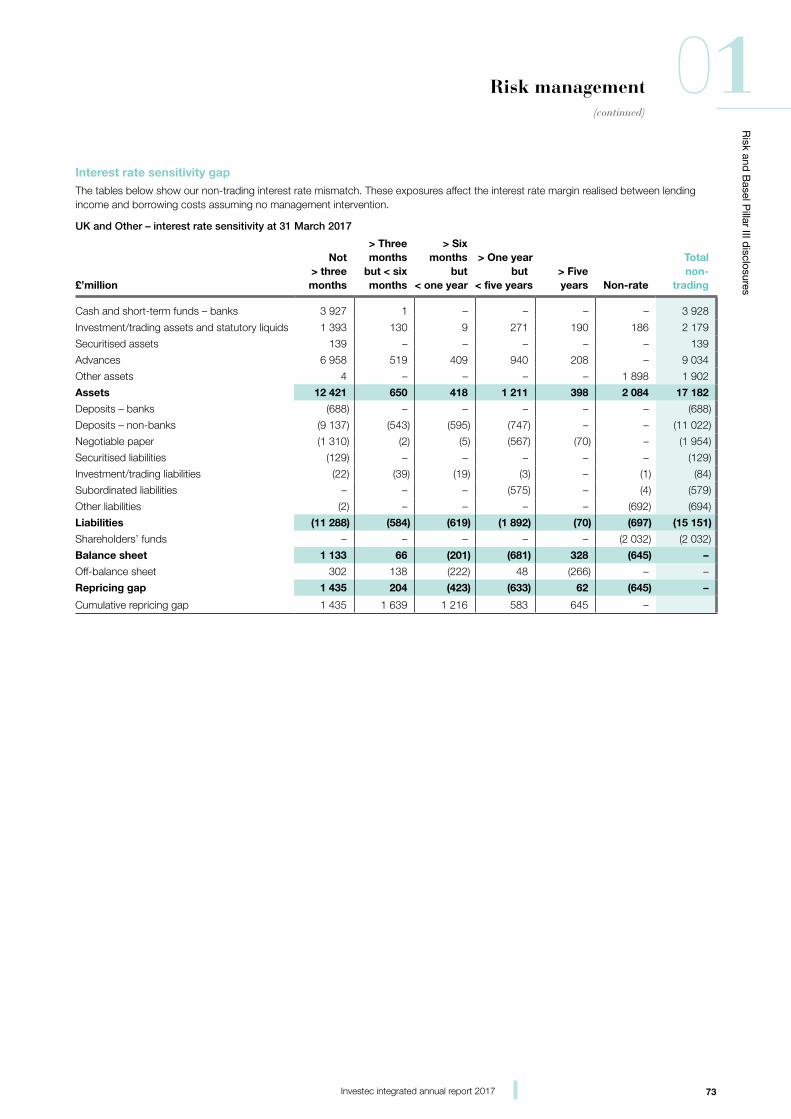
73Investec integrated annual report 2017
Risk and
Basel P
illar III disclosures
01Risk management(continued)
Interest rate sensitivity gapThe tables below show our non-trading interest rate mismatch. These exposures affect the interest rate margin realised between lending income and borrowing costs assuming no management intervention.
UK and Other – interest rate sensitivity at 31 March 2017
£’million
Not > three months
> Three months but < six months
> Six months
but < one year
> One year but
< five years > Five years Non-rate
Total non-
trading
Cash and short-term funds – banks 3 927 1 – – – – 3 928
Investment/trading assets and statutory liquids 1 393 130 9 271 190 186 2 179
Securitised assets 139 – – – – – 139
Advances 6 958 519 409 940 208 – 9 034
Other assets 4 – – – – 1 898 1 902
Assets 12 421 650 418 1 211 398 2 084 17 182
Deposits – banks (688) – – – – – (688)
Deposits – non-banks (9 137) (543) (595) (747) – – (11 022)
Negotiable paper (1 310) (2) (5) (567) (70) – (1 954)
Securitised liabilities (129) – – – – – (129)
Investment/trading liabilities (22) (39) (19) (3) – (1) (84)
Subordinated liabilities – – – (575) – (4) (579)
Other liabilities (2) – – – – (692) (694)
Liabilities (11 288) (584) (619) (1 892) (70) (697) (15 151)
Shareholders’ funds – – – – – (2 032) (2 032)
Balance sheet 1 133 66 (201) (681) 328 (645) –
Off-balance sheet 302 138 (222) 48 (266) – –
Repricing gap 1 435 204 (423) (633) 62 (645) –
Cumulative repricing gap 1 435 1 639 1 216 583 645 –
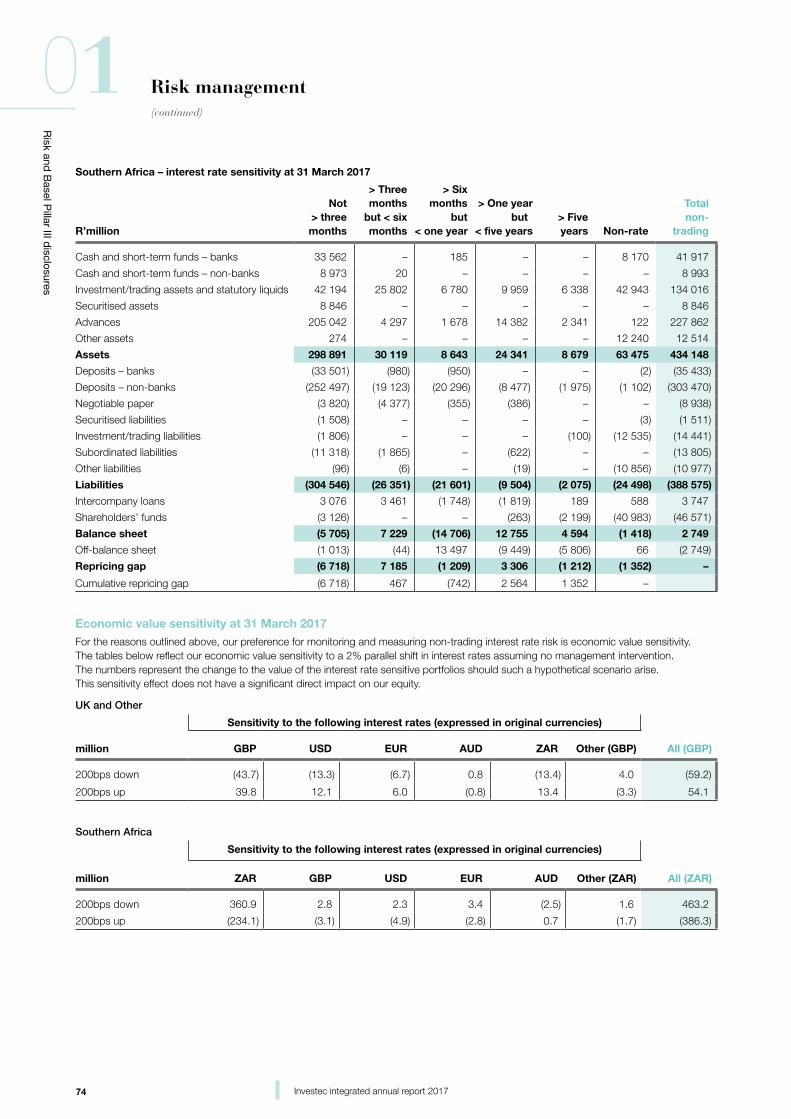
74 Investec integrated annual report 2017
Risk and
Basel P
illar III disclosures
01 Risk management(continued)
Southern Africa – interest rate sensitivity at 31 March 2017
R’million
Not > three months
> Three months but < six months
> Six months
but < one year
> One year but
< five years > Five years Non-rate
Total non-
trading
Cash and short-term funds – banks 33 562 – 185 – – 8 170 41 917
Cash and short-term funds – non-banks 8 973 20 – – – – 8 993
Investment/trading assets and statutory liquids 42 194 25 802 6 780 9 959 6 338 42 943 134 016
Securitised assets 8 846 – – – – – 8 846
Advances 205 042 4 297 1 678 14 382 2 341 122 227 862
Other assets 274 – – – – 12 240 12 514
Assets 298 891 30 119 8 643 24 341 8 679 63 475 434 148
Deposits – banks (33 501) (980) (950) – – (2) (35 433)
Deposits – non-banks (252 497) (19 123) (20 296) (8 477) (1 975) (1 102) (303 470)
Negotiable paper (3 820) (4 377) (355) (386) – – (8 938)
Securitised liabilities (1 508) – – – – (3) (1 511)
Investment/trading liabilities (1 806) – – – (100) (12 535) (14 441)
Subordinated liabilities (11 318) (1 865) – (622) – – (13 805)
Other liabilities (96) (6) – (19) – (10 856) (10 977)
Liabilities (304 546) (26 351) (21 601) (9 504) (2 075) (24 498) (388 575)
Intercompany loans 3 076 3 461 (1 748) (1 819) 189 588 3 747
Shareholders’ funds (3 126) – – (263) (2 199) (40 983) (46 571)
Balance sheet (5 705) 7 229 (14 706) 12 755 4 594 (1 418) 2 749
Off-balance sheet (1 013) (44) 13 497 (9 449) (5 806) 66 (2 749)
Repricing gap (6 718) 7 185 (1 209) 3 306 (1 212) (1 352) –
Cumulative repricing gap (6 718) 467 (742) 2 564 1 352 –
Economic value sensitivity at 31 March 2017For the reasons outlined above, our preference for monitoring and measuring non-trading interest rate risk is economic value sensitivity. The tables below reflect our economic value sensitivity to a 2% parallel shift in interest rates assuming no management intervention. The numbers represent the change to the value of the interest rate sensitive portfolios should such a hypothetical scenario arise. This sensitivity effect does not have a significant direct impact on our equity.
UK and Other
Sensitivity to the following interest rates (expressed in original currencies)
million GBP USD EUR AUD ZAR Other (GBP) All (GBP)
200bps down (43.7) (13.3) (6.7) 0.8 (13.4) 4.0 (59.2)
200bps up 39.8 12.1 6.0 (0.8) 13.4 (3.3) 54.1
Southern Africa
Sensitivity to the following interest rates (expressed in original currencies)
million ZAR GBP USD EUR AUD Other (ZAR) All (ZAR)
200bps down 360.9 2.8 2.3 3.4 (2.5) 1.6 463.2
200bps up (234.1) (3.1) (4.9) (2.8) 0.7 (1.7) (386.3)
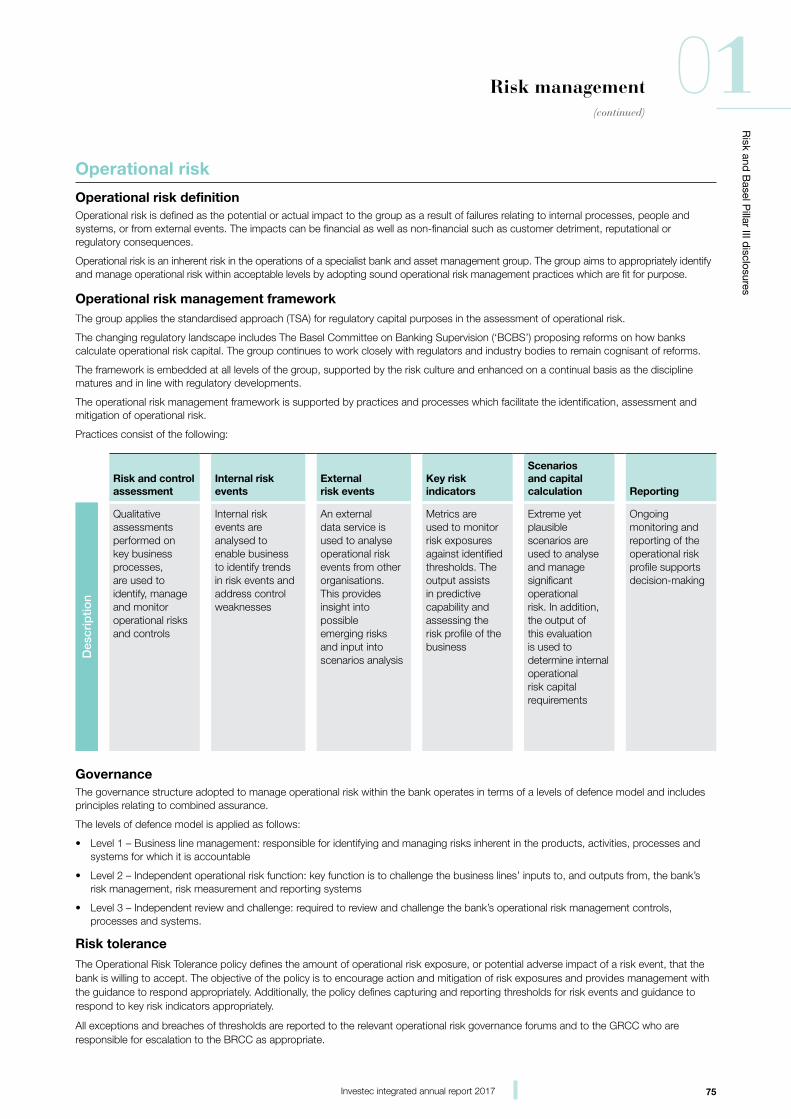
75Investec integrated annual report 2017
Risk and
Basel P
illar III disclosures
01Risk management(continued)
Operational risk
Operational risk definitionOperational risk is defined as the potential or actual impact to the group as a result of failures relating to internal processes, people and systems, or from external events. The impacts can be financial as well as non-financial such as customer detriment, reputational or regulatory consequences.
Operational risk is an inherent risk in the operations of a specialist bank and asset management group. The group aims to appropriately identify and manage operational risk within acceptable levels by adopting sound operational risk management practices which are fit for purpose.
Operational risk management frameworkThe group applies the standardised approach (TSA) for regulatory capital purposes in the assessment of operational risk.
The changing regulatory landscape includes The Basel Committee on Banking Supervision (‘BCBS’) proposing reforms on how banks calculate operational risk capital. The group continues to work closely with regulators and industry bodies to remain cognisant of reforms.
The framework is embedded at all levels of the group, supported by the risk culture and enhanced on a continual basis as the discipline matures and in line with regulatory developments.
The operational risk management framework is supported by practices and processes which facilitate the identification, assessment and mitigation of operational risk.
Practices consist of the following:
Risk and control assessment
Internal risk events
External risk events
Key risk indicators
Scenarios and capital calculation Reporting
Des
crip
tion
Qualitative assessments performed on key business processes, are used to identify, manage and monitor operational risks and controls
Internal risk events are analysed to enable business to identify trends in risk events and address control weaknesses
An external data service is used to analyse operational risk events from other organisations. This provides insight into possible emerging risks and input into scenarios analysis
Metrics are used to monitor risk exposures against identified thresholds. The output assists in predictive capability and assessing the risk profile of the business
Extreme yet plausible scenarios are used to analyse and manage significant operational risk. In addition, the output of this evaluation is used to determine internal operational risk capital requirements
Ongoing monitoring and reporting of the operational risk profile supports decision-making
GovernanceThe governance structure adopted to manage operational risk within the bank operates in terms of a levels of defence model and includes principles relating to combined assurance.
The levels of defence model is applied as follows:
• Level 1 – Business line management: responsible for identifying and managing risks inherent in the products, activities, processes and systems for which it is accountable
• Level 2 – Independent operational risk function: key function is to challenge the business lines’ inputs to, and outputs from, the bank’s risk management, risk measurement and reporting systems
• Level 3 – Independent review and challenge: required to review and challenge the bank’s operational risk management controls, processes and systems.
Risk tolerance The Operational Risk Tolerance policy defines the amount of operational risk exposure, or potential adverse impact of a risk event, that the bank is willing to accept. The objective of the policy is to encourage action and mitigation of risk exposures and provides management with the guidance to respond appropriately. Additionally, the policy defines capturing and reporting thresholds for risk events and guidance to respond to key risk indicators appropriately.
All exceptions and breaches of thresholds are reported to the relevant operational risk governance forums and to the GRCC who are responsible for escalation to the BRCC as appropriate.
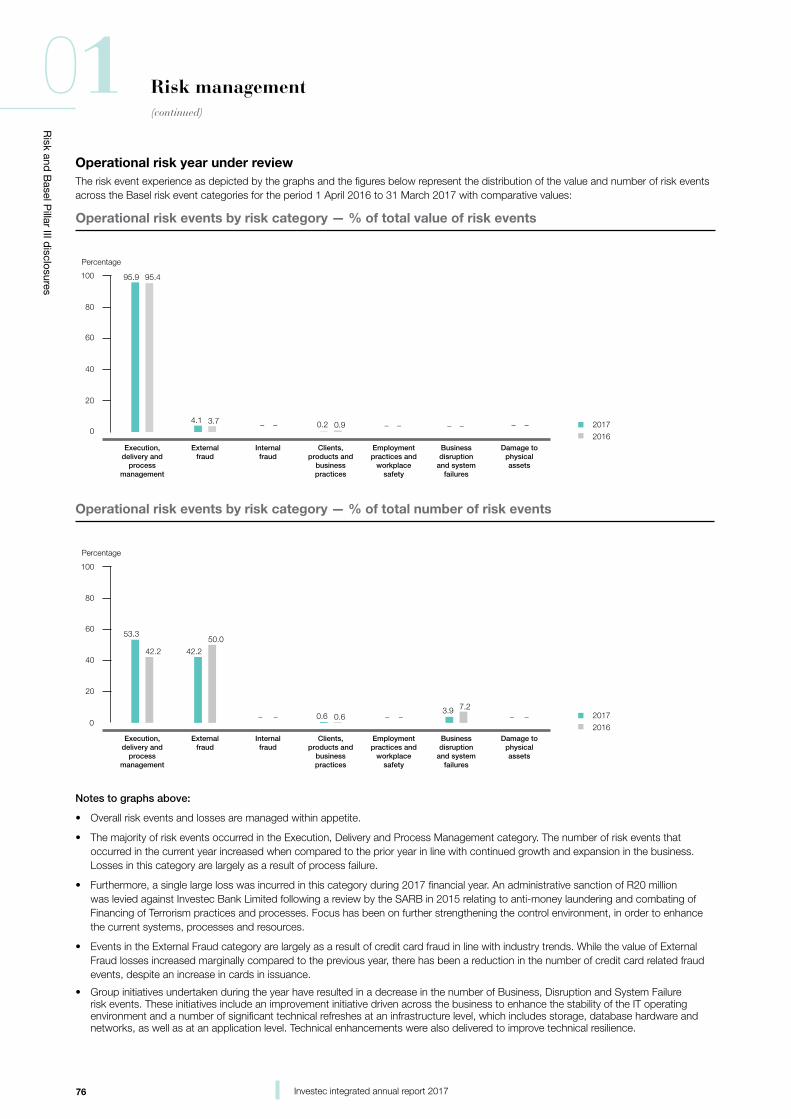
76 Investec integrated annual report 2017
Risk and
Basel P
illar III disclosures
01 Risk management(continued)
Operational risk year under reviewThe risk event experience as depicted by the graphs and the figures below represent the distribution of the value and number of risk events across the Basel risk event categories for the period 1 April 2016 to 31 March 2017 with comparative values:
Percentage
0
20
40
60
80
100
2017
2016Execution,
delivery and process
management
External fraud
Internal fraud
Clients, products and
business practices
Employment practices and
workplace safety
Business disruption
and system failures
Damage to physical assets
95.9
4.1
95.4
3.7 0.2− − − −0.9 − − − −
Operational risk events by risk category — % of total value of risk events
Percentage
0
20
40
60
80
100
Execution, delivery and
process management
External fraud
Internal fraud
Clients, products and
business practices
Employment practices and
workplace safety
Business disruption
and system failures
Damage to physical assets
42.2
53.350.0
0.6 0.6 − −− − −
42.2
3.9 7.2−
Operational risk events by risk category — % of total number of risk events
2017
2016
Notes to graphs above:
• Overall risk events and losses are managed within appetite.
• The majority of risk events occurred in the Execution, Delivery and Process Management category. The number of risk events that occurred in the current year increased when compared to the prior year in line with continued growth and expansion in the business. Losses in this category are largely as a result of process failure.
• Furthermore, a single large loss was incurred in this category during 2017 financial year. An administrative sanction of R20 million was levied against Investec Bank Limited following a review by the SARB in 2015 relating to anti-money laundering and combating of Financing of Terrorism practices and processes. Focus has been on further strengthening the control environment, in order to enhance the current systems, processes and resources.
• Events in the External Fraud category are largely as a result of credit card fraud in line with industry trends. While the value of External Fraud losses increased marginally compared to the previous year, there has been a reduction in the number of credit card related fraud events, despite an increase in cards in issuance.
• Group initiatives undertaken during the year have resulted in a decrease in the number of Business, Disruption and System Failure risk events. These initiatives include an improvement initiative driven across the business to enhance the stability of the IT operating environment and a number of significant technical refreshes at an infrastructure level, which includes storage, database hardware and networks, as well as at an application level. Technical enhancements were also delivered to improve technical resilience.
77Investec integrated annual report 2017
Risk and
Basel P
illar III disclosures
01Risk management(continued)
Looking forwardKey operational risk considerations for the year ahead
Definition of risk Mitigation approach and priority for 2017/2018
Business continuity
Risk associated with disruptive incidents which can impact premises, staff, equipment, systems, and key business processes
• Enhance the global business continuity management capability through a team of dedicated resources and a thorough governance process
• Respond to disruptions to maintain continuity by relocating impacted business to alternate processing sites and the use of high availability technology solutions
• Incorporate resilience into business operations to lessen the impact of disruptions
• Conduct ongoing verification of recovery strategies to ensure they are effective and appropriate
• Participate in industry-wide discussions to keep abreast of regulatory developments and collaboratively minimise systemic continuity risks
Cybersecurity
Risk associated with cyberattacks which can result in fraud, data theft, cyber terrorism, espionage, or disrupt client-facing services
• Maintain a risk-based and adaptive cybersecurity strategy to ensure the group is adequately protected against advanced cyberattacks
• Continuous improvement of prediction, prevention, detection and response capabilities
• Security testing of IT systems to ensure they are secure both by design and as they evolve
• Establish an effective and globally co-ordinated security incident response process
• Build robust cyber resilience to be able to anticipate, withstand, and recover from cyber events
Financial crime
Risk associated with fraud, bribery, corruption, theft, money laundering, terrorist financing, tax evasion, forgery and integrity misconduct by staff, clients, suppliers and other stakeholders
• Targeted training for specific risk roles, regular campaigns to all employees to raise awareness of financial crime risk and associated policies and encourage escalation
• Operate an Integrity Line which allows employees to make disclosures including regulatory breaches, allegations of bribery, fraud and corruption, and non-compliance with policies
• Proactive strategy for the effective prevention, detection and investigation of all financial crime types which includes business and client risk assessments
• Continuous monitoring of adherence to financial crime prevention policies and embedding of practices which comply with regulations, industry guidance and best practice
• Research and review of external and industry events through engagement with relevant industry bodies and external partners
Information security
Risk associated with the protection of information assets against unauthorised access, use, disclosure, modification or destruction
• Identify high-value information assets based on confidentiality and business criticality
• Implement strong security controls to protect information against compromise
• Manage access to systems and data in support of least-privilege and segregation of duty principles
• Establish effective security monitoring to identify and swiftly respond to suspicious activity
• Align practices and controls with the rapidly changing legal and regulatory privacy requirements
78 Investec integrated annual report 2017
Risk and
Basel P
illar III disclosures
01 Risk management(continued)
Definition of risk Mitigation approach and priority for 2017/2018
Outsourcing
Risk associated with the use of a service provider to perform on a continuing basis a business activity which could be undertaken by the group
• Governance structures are in place to approve outsource arrangements
• Framework and policies support ongoing management and monitoring of outsource providers
• Outsource arrangements are managed in accordance with regulatory requirements which includes the suitability of the outsource provider to perform services
• Continuous assessment of the strategic decision to outsource including the appropriateness of the outsource provider
Process failure
Risk associated with inadequate internal processes, including human errors and control failures within the business. This includes process origination, execution and operations
• Proactive assessment relating to new products and projects to implement adequate and effective controls including the management of change
• Continuous automation of processes
• Segregation of incompatible duties and appropriate authorisation controls
• Causal analysis is used to identify weaknesses in controls following the occurrence of risk events
• Risk and performance indicators are used to monitor the effectiveness of controls across business units
• Thematic reviews across business units to ensure consistent and efficient application of controls
Regulatory and compliance
Risk associated with identification, implementation and monitoring of compliance with regulations
• Align regulatory and compliance approach to reflect new regulatory landscapes particularly change of regulatory structures in UK and SA
• Manage business impact and implementation challenges as a result of significant volumes of statutory and regulatory changes and developments
• Ensuring existing monitoring remains focused appropriately as areas of conduct and regulatory risk develop
• Group Compliance and Group Legal assist in the management of regulatory and compliance risk
• Identification and adherence to legal and regulatory requirements
Technology
Risk associated with the reliance on technology to support business processes and client services
• Align architecture across the group to reduce technical complexity and leverage common functions and processes
• Enhance operational processes to better control IT changes and manage IT incidents, in order to minimise business impact
• Drive automation and proactive monitoring of the technology environment to reduce human error whilst enhancing visibility
• Implement infrastructure upgrades and legacy application replacements to improve technology capacity, scalability and resilience
• Perform continuous risk management to proactively address control gaps in IT people, processes or systems
• Maintain and test IT recovery capabilities to withstand system failures and safeguard against service disruptions
79Investec integrated annual report 2017
Risk and
Basel P
illar III disclosures
01Risk management(continued)
InsuranceThe group maintains adequate insurance to cover key insurable risks. The insurance process and requirements are managed by the group insurance risk manager. Regular interaction between Group Operational Risk Management and Group Insurance Risk Management ensures that there is an exchange of information in order to enhance the mitigation of operational risk.
Recovery and resolution planningThe purpose of the recovery plans are to document how the board and management will recover from extreme financial stress to avoid liquidity and capital difficulties in Investec plc and Investec Limited. The plans are reviewed and approved by the board on an annual basis.
The recovery plans for Investec plc and Investec Limited:
• Integrate with existing contingency planning
• Analyse the potential for severe stress in the group
• Identify roles and responsibilities
• Identify early warning indicators and trigger levels
• Analyse how the group could be affected by the stresses under various scenarios
• Include potential recovery actions available to the board and management to respond to the situation, including immediate, intermediate and strategic actions
• Assess how the group might recover as a result of these actions to avoid resolution.
UK and OtherA significant addition to the EU legislative framework for financial institutions has been the Bank Recovery and Resolution Directive (BRRD) which establishes a framework for the recovery and resolution of EU credit institutions and investment firms.
As implemented, the BRRD gives resolution authorities powers to intervene in and resolve a financial institution that is no longer viable, including through the transfers of business and, when implemented in relevant member states, creditor financed recapitalisation (bail-in within resolution) that allocates losses to shareholders and unsecured and uninsured creditors in their order of seniority, at a regulator determined point of non-viability that may precede insolvency. The concept of bail-in will affect the rights of unsecured creditors subject to any bail-in in the event of a resolution of a failing bank.
The BRRD also requires competent authorities to impose a Minimum Requirement for own funds and Eligible Liabilities (MREL) on financial institutions to facilitate the effective exercise of the bail-in tool.
For more detail on MREL, please refer to page 82.
The BRRD also requires the development of recovery and resolution plans at group and firm level. The BRRD sets out a harmonised set of resolution tools across the European Union, including the power to impose a temporary stay on the rights of creditors to terminate, accelerate or close out contracts.
The PRA has made rules that require authorised firms to draw up recovery plans and resolution packs. Recovery plans are designed to outline credible recovery actions that authorised firms could implement in the event of severe stress in order to restore their business to a stable and sustainable condition. The resolution pack contains detailed information on the authorised firm in question which will be used to develop resolution strategies for that firm, assess its current level of resolvability against the strategy, and to inform work on identifying barriers to the implementation of operational resolution plans.
In line with PRA and EU requirements, Investec plc maintains a resolution pack and a recovery plan.
South AfricaFinancial Stability Board member countries are required to have recovery and resolution plans in place for all systemically significant financial institutions. The SARB has adopted this requirement and has to date required South African domestically significant banking institutions to develop recovery plans. Guidance issued by the Financial Stability Board and the SARB has been incorporated into Investec’s recovery plan.
The SARB has continued to focus on finalising the recovery plans for the local banks and together with the South African Treasury are considering legislation to adopt a resolution framework. We will be subject to this legislation once it is adopted.
Reputational and strategic riskReputational risk is damage to our reputation, name or brand. Reputational risk is often associated with strategic decisions made by the board and also arises as a result of other risks manifesting and not being mitigated.
The group aspires to maintain an excellent reputation for entrepreneurship, strong risk management discipline, a client-centric approach and an ability to be flexible and innovative. The group recognises the serious consequences of any adverse publicity or damage to reputation, whatever the underlying cause.
We have various policies and practices to mitigate reputational risk, including strong values that are regularly and proactively reinforced. We also subscribe to sound corporate governance practices, which require that activities, processes and decisions are based on carefully considered principles. We are aware of the impact of practices that may result in a breakdown of trust and confidence in the organisation. The group’s policies and practices are regularly reinforced through transparent communication, accurate reporting, continuous group culture and values assessment, internal audit and regulatory compliance review, and risk management
80 Investec integrated annual report 2017
Risk and
Basel P
illar III disclosures
01 Risk management(continued)
practices. Strategic and reputational risk is mitigated as much as possible through these detailed processes and governance/escalation procedures from business units to the board, and from regular, clear communication with shareholders, customers and all stakeholders. In addition, Investec’s policy is to avoid any transaction, service or association which may bring with it the risk of potential damage to our reputation. Transaction approval governance structures such as credit, engagement and new product committees have therefore been tasked with this responsibility in relation to all new business undertaken. A disclosure and public communications policy has also been approved by the board.
Pension riskPension risk arises from obligations arising from defined benefit pension schemes, where Investec plc is required to fund any deficit in the schemes.
There are two defined benefit schemes within Investec plc and both are closed to new business. Pension risk arises if the net present value of future cash outflows is greater than the current value of the asset pool set aside to cover those payments.
Primary sources of risk include:
• A mismatch in the duration of the assets relative to the liabilities
• Market-driven asset price volatility
• Increased life expectancy of individuals leading to increased liabilities.
Investec plc monitors the position of the funds closely and regularly assesses potential adverse movements in the schemes in close conjunction with external independent advisers.
Further information is provided on pages 97 to 100 in volume three.
Legal risk managementLegal risk is the risk of loss resulting from any of our rights not being fully enforceable or from our obligations not being properly performed. This includes our rights and obligations under contracts entered into with counterparties. Such risk is especially applicable where the counterparty defaults and the relevant documentation may not give rise to the rights and remedies anticipated when the transaction was entered into.
Our objective is to identify, manage, monitor and mitigate legal risks throughout the group. We seek to actively mitigate these risks by identifying them, setting minimum standards for their management and allocating clear responsibility for such management to legal risk managers, as well as ensuring compliance through proactive monitoring.
The scope of our activities is continuously reviewed and includes the following areas:
• Relationship contracts
• Legislation/governance
• Litigation
• Corporate events
• Incident or crisis management
• Ongoing quality control.
The legal risk policy is implemented through:
• Identification and ongoing review of areas where legal risk is found to be present
• Allocation of responsibility for the development of procedures for management and mitigation of these risks
• Installation of appropriate segregation of duties, so that legal documentation is reviewed and executed with the appropriate level of independence from the persons involved in proposing or promoting the transaction
• Ongoing examination of the inter-relationship between legal risk and other areas of risk management, so as to ensure that there are no ‘gaps’ in the risk management process
• Establishing minimum standards for mitigating and controlling each risk. This is the nature and extent of work to be undertaken by our internal and external legal resources
• Establishing procedures to monitor compliance, taking into account the required minimum standards
• Establishing legal risk forums (bringing together the various legal risk managers) to ensure we keep abreast of developments and changes in the nature and extent of our activities, and to benchmark our processes against best practice.
Overall responsibility for this policy rests with the board. The board delegates responsibility for implementation of the policy to the global head of legal risk. The global head assigns responsibility for controlling these risks to the managers of appropriate departments and focused units throughout the group.
A legal risk forum is constituted in each significant legal entity within the group. Each forum meets at least half-yearly and more frequently where business needs dictate, and is chaired by the global head of legal risk or an appointed deputy.
Conduct risk
UK and OtherThe FCA in the UK has outlined its approach to managing firms’ conduct:
By conduct risk we mean the risk that detriment is caused to the bank, its customers, its counterparties or the market, as a result of inappropriate execution of business activities.
81Investec integrated annual report 2017
Risk and
Basel P
illar III disclosures
01Risk management(continued)
The focus on conduct risk is intended to go beyond the current compliance monitoring frameworks in order to move away from the culture of ‘tick box’ compliance. As a result, firms are expected to look across their business models and strategies and assess how to balance the pursuit of profits with good outcomes for clients and proper standards of market conduct. All firms will be expected to take a holistic approach to assessing their key conduct risks and to ensure that these are being managed in accordance with FCA’s strategic objectives of protecting clients, ensuring markets function effectively and promoting competition.
The group’s work on conduct risk, includes assessing key risks across the business, identifying key controls and ensuring that the board is receiving the right information to enable it to challenge effectively the management of such risks by the business.
South AfricaThe South African financial sector regulatory landscape has been under review for the last few years. A new regulatory structure is developing, and existing legislation is also being amended. Although the conduct of financial institutions is currently regulated under various pieces of legislation, and by various regulators, this will change under the new regulatory structure. The resultant strategic and operational impact is expected to last for at least the next five years.
Capital management and allocation
Capital measurementInvestec Limited (and its subsidiaries) and Investec plc (and its subsidiaries) are managed independently and have their respective capital bases ring-fenced, however, the governance of capital management is consistent across the two groups. The DLC structure requires the two groups to independently manage each group’s balance sheet and hence capital is managed on this basis. This approach is overseen by the BRCC (via the Investec
DLC capital committee) which is a board sub-committee with ultimate responsibility for the capital adequacy of both Investec Limited and Investec plc.
The legal and regulatory treatment of capital is independent of existing shareholder arrangements that are in place to ensure that shareholders have common economic and voting interests as if Investec plc and Investec Limited were a single, unified enterprise.
Investec Limited and Investec plc are separately regulated entities operating under different regulatory capital regimes. It is therefore difficult to directly compare the capital adequacy of the two entities.
Regulatory capital – Investec Limited
Current regulatory frameworkInvestec Limited is supervised for capital purposes by the SARB on a consolidated basis.
Investec Limited calculates capital resources and requirements at a group level using the Basel III framework, as implemented in South Africa by the SARB, in accordance with the Bank’s Act and all related regulations.
Investec Limited currently uses the standardised approach to calculate its credit and counterparty credit risk and operational risk capital requirements. Capital requirements for equity risk is calculated using the internal ratings-based (IRB) approach by applying the simple risk-weight method. The market risk capital requirement is measured using an internal risk management model, approved by the SARB.
Various subsidiaries of Investec Limited are subject to additional regulation covering various activities or implemented by local regulators in other jurisdictions. For capital management purposes, it is the prevailing rules applied to the consolidated Investec Limited group that are monitored most closely. Nevertheless, where capital is a relevant consideration, management within each regulated entity pays close attention to prevailing local regulatory rules as
determined by their respective regulators. Management of each regulated entity, with the support of the group’s capital management functions, ensures that capital remains prudently above minimum requirements at all times.
Regulatory capital – Investec plc Current regulatory frameworkInvestec plc is authorised by the PRA and is regulated by the FCA and the PRA on a consolidated basis. Investec plc calculates capital resources and requirements at a group level using the Basel III framework, as implemented in the European Union through the Capital Requirements Directive IV (CRD IV). The group continues to phase in the remaining CRD IV rule changes, notably the grandfathering provisions applicable to non-qualifying capital instruments (reducing by 10% per annum until fully derecognised in 2022) and the transitional arrangements applicable to additional tier 1 and tier 2 capital continue to be phased out at 20% per annum, until 1 January 2018.
UK banks are required to meet minimum capital requirements as prescribed by CRD IV. The common equity tier 1 capital requirement is 4.5% of risk-weighted assets, while the tier 1 capital requirement is 6.0% of risk-weighted assets and total capital requirement of 8% of risk-weighted assets. In addition Investec plc continues to meet 56% of its individual capital guidance, as determined by the internal capital adequacy assessment and supervisory review process, with common equity tier 1 capital. The PRA issued the Investec plc group with a reformatted Pillar IIA requirement of 1.8% of risk-weighted assets, of which 1.0% has to be met from common equity tier 1 capital.
The PRA buffer will also need to be met from common equity tier 1 capital, and will be transitioned in at 25% per annum, until fully phased in by January 2019.
In line with the CRD IV provision on capital buffers, in the UK firms are required to meet a combined buffer requirement in addition to their Pillar I and Pillar II capital
82 Investec integrated annual report 2017
Risk and
Basel P
illar III disclosures
01 Risk management(continued)
requirements. The combined buffer includes the capital conservation buffer and countercyclical capital buffer and must be met with common equity tier 1 capital. The buffer for global systemically important institutions (G-SIIs) and the systemic risk buffer do not apply to Investec plc and will not be included in the combined buffer requirement. Investec is also not defined as an Other Systemically Important Institution (O-SII) by the PRA and hence does not have to hold an O-SII buffer; furthermore HM Treasury has also confirmed that the UK O-SII buffer will be set at 0%.
From 1 January 2016 Investec plc began phasing in the capital conservation buffer at 0.625% of risk-weighted assets. An additional 0.625% of risk-weighted assets will be phased-in each year until fully implemented by 1 January 2019. Investec plc is also subject to the countercyclical capital buffer requirement, which is calculated based on the relevant exposures held in jurisdictions in which a buffer rate has been set. In the UK, the Financial Policy Committee has reaffirmed that it expects to maintain a rate of 0% until at least June 2017. As at 31 March 2017, five jurisdictions have implemented countercyclical capital buffer rates: Norway (1.5%), Sweden (2%), Hong Kong (1.25%), Czech Republic (0.5%), Iceland (1%). Slovakia have set a rate of 0.5% effective 1 August 2017.
The group continues to hold capital in excess of all the new capital requirements and buffers.
Investec plc uses the standardised approach to calculate its credit and counterparty credit risk, securitisation and operational risk capital requirements. The mark-to-market method is used to calculate the counterparty credit risk exposure amount. The market risk capital requirement is calculated using the standardised approach. For certain options, the group has obtained permission from the PRA to use an internal model to calculate the delta for these positions.
Subsidiaries of Investec plc may be subject to additional regulations, as implemented by local regulators in other relevant jurisdictions. Where capital is
a relevant consideration, management within each regulated entity pays close attention to prevailing local regulatory rules as determined by their respective regulators. For capital management purposes, it is the prevailing rules applied to the consolidated Investec plc group that are monitored closely. With the support of the group’s capital management function, local management of each regulated entity ensures that capital remains prudently above minimum requirements at all times.
Regulatory considerationsThe regulatory environment has continued to evolve during 2017, with a vast number of new consultations, regulatory technical standards and implementing technical standards and other proposals being published or adopted, notably by the PRA, the BCBS, EBA and the SARB.
InternationalThroughout 2016 the Basel Committee on Banking Supervision (BCBS) continued to develop their package of reforms to the existing Basel III framework. In January 2017, the Basel Committee on Banking Supervision (BCBS) announced that its finalisation of reforms to Basel III had been delayed. The BCBS is now expected to issue updated standards on the calculation of operational risk, the standardised framework for credit risk and restrictions on the use of internal models and the application of an RWA floor based on the standardised approaches later in 2017. As these measures will require EU and domestic legislation, the implementation date has yet to be determined.
IFRS 9International Financial Reporting Standards 9 Financial Instruments (IFRS 9) will come into effect from 1 January 2018. As a result, the BCBS has proposed some transitional arrangements that individual jurisdictions may choose to implement.
UKMinimum requirement for own funds and eligible liabilities (MREL).
The Bank of England (BoE) has finalised its policy on setting MREL. The purpose of MREL is to help ensure that when banks, building societies and investment firms fail, that failure can be managed in an orderly way while minimising risk to financial stability, disruption to critical economic functions, and risk to public funds. The BoE, as resolution authority, is required to determine an amount necessary for loss absorption in resolution and an amount necessary for recapitalisation, dependent on a firm’s resolution strategy.
The BoE has set the preferred strategy for Investec Bank plc to be Modified Insolvency. As a result, Investec Bank plc’s MREL requirement will equal its regulatory capital requirements (Pillar I + Pillar IIA).
As noted in the statement of policy on the BoE approach to setting MREL, the actual approach taken to resolve an institution will depend on the circumstances at the time of its failure. The preferred resolution strategy may not necessarily be followed if a different approach would better meet the resolution objectives at the time.
The three broad resolution strategies are:
Modified insolvency process: where the BoE has assessed that firms do not provide any critical economic functions, these institutions will be able to comply with MREL by meeting their existing capital requirements.
Partial transfer: some firms may have critical economic functions that would need to continue after a firm has been placed into resolution. MREL would need to be assessed at a level that could ensure that these functions could be transferred to another institution.
Bail in: the most complex firms will be required to maintain sufficient MREL so that they can be recapitalised and continue to meet the PRA’s conditions for authorisation without requiring tax payer support.
83Investec integrated annual report 2017
Risk and
Basel P
illar III disclosures
01Risk management(continued)
requirements and the individual groups continue to remain well capitalised.
Accordingly, we are targeting a minimum common equity tier 1 capital ratio of above 10%, a tier 1 capital ratio of above 11%, and a total capital adequacy ratio target in the range of 14% to 17%. These targets are continuously assessed for appropriateness.
LeverageInvestec is currently targeting a leverage ratio above 6%.
Management of capital and leverageCapitalThe DLC capital committee is responsible for ensuring that the impact of any regulatory change is analysed, understood and planned for. To allow the committee to carry out this function, the group’s prudential advisory and reporting team closely monitors regulatory developments and regularly present to the committee on the latest developments and proposals. As part of any assessment, the committee is provided with analysis setting out the group’s capital adequacy position, taking into account the most up-to-date interpretation of the rule changes. In addition, regular sessions with the board are held to ensure that members are kept up to date with the most salient changes to ensure the impact on the group and its subsidiaries is monitored and understood.
LeverageAt present Investec Limited calculates and reports its leverage ratio based on the latest SARB regulations. The leverage ratio is a non-risk-based measure intended to prevent excessive build up of leverage and mitigate the risks associated with deleveraging during periods of market uncertainty. The reporting of the leverage ratio in South Africa has been mandatory since 1 January 2013 as part of an exercise to monitor South African banks’ readiness to comply with the minimum standard of 4% from 1 January 2018. Following guidance from the SARB, Investec applies the rules as outlined in the most recent BCBS publication.
EuropeCRR 2/CRD VIn November 2016, the European Commission proposed a number of revisions to CRD IV which reflect some of the proposals already completed or under development by the BCBS. Together, these changes are known as the ‘CRR2/CRDV’ package. The CRR2/CRDV package includes the following:
• A new standardised approach for counterparty credit risk to replace the existing current exposure and Standardised methods
• Changes to the rules for determining the trading book boundary and the methodologies for calculating market risk capital charges
• A binding leverage ratio for all banks. The UK leverage ratio framework is currently only applicable to PRA-regulated banks and building societies with retail deposits equal to or greater than £50 billion on an individual or a consolidated basis. Investec plc is not within the scope of this framework
• A new methodology for capital charges for equity investments in funds
• Restrictions to the capital base and changes to the exposure limits for the calculation of large exposures
• Proposed transitional arrangements for implementation of IFRS 9
The CRR2/CRD V package is expected to apply from two years after the date of its entry into the European Commission Official Journal except for provisions relating to IFRS 9 which will apply from the date it comes into force (1 January 2018).
Capital and leverage ratio targetsCapitalOver recent years, capital adequacy standards for banks have been raised as part of attempts to increase the stability and resilience of the global banking sector. Investec Limited and Investec plc have always held capital in excess of regulatory
In the UK, the leverage ratio was subject to a monitoring period from 1 January 2014 to 30 June 2016, at which point the EBA reported to the European Commission suggesting a 3% leverage ratio was adequate. Also appropriate adjustments to the capital and total exposure measure were proposed. The latest proposals in the CRR2 implement a 3% leverage ratio which will come into effect two years from publication in the European Commissions Official Journal.
As with the governance of capital management, the DLC capital committee is responsible for ensuring that the impact of any regulatory changes on the leverage ratio is calculated, analysed and understood at all reporting levels. The leverage exposure measure is calculated on a monthly and quarterly basis and is presented to the DLC capital committee on a regular basis. The DLC capital committee is responsible for monitoring the risk of excessive leverage.
Capital managementPhilosophy and approachBoth the Investec Limited and Investec plc groups operate an approach to capital management that utilises both regulatory capital as appropriate to that jurisdiction and internal capital, which is an internal risk-based assessment of capital requirements. Capital management primarily relates to management of the interaction of both, with the emphasis on regulatory capital for managing portfolio level capital sufficiency and on internal capital for ensuring that returns are appropriate given the level of risk taken at an individual transaction or business unit level.
The determination of target capital is driven by our risk profile, strategy and risk appetite, taking into account the regulatory and market factors applicable to the group. At the most fundamental level, we seek to balance our capital consumption between prudent capitalisation in the context of the group’s risk profile and optimisation of shareholder returns. Our internal capital framework is designed to manage and achieve this balance.
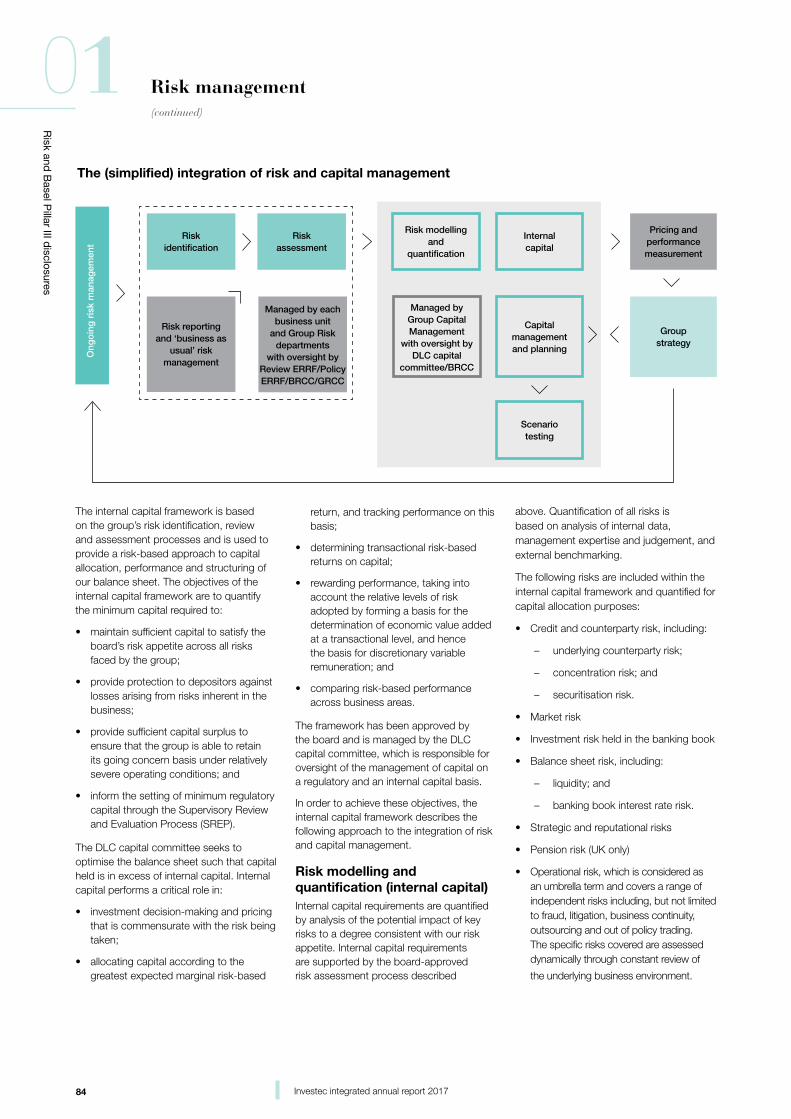
84 Investec integrated annual report 2017
Risk and
Basel P
illar III disclosures
01 Risk management(continued)
The internal capital framework is based on the group’s risk identification, review and assessment processes and is used to provide a risk-based approach to capital allocation, performance and structuring of our balance sheet. The objectives of the internal capital framework are to quantify the minimum capital required to:
• maintain sufficient capital to satisfy the board’s risk appetite across all risks faced by the group;
• provide protection to depositors against losses arising from risks inherent in the business;
• provide sufficient capital surplus to ensure that the group is able to retain its going concern basis under relatively severe operating conditions; and
• inform the setting of minimum regulatory capital through the Supervisory Review and Evaluation Process (SREP).
The DLC capital committee seeks to optimise the balance sheet such that capital held is in excess of internal capital. Internal capital performs a critical role in:
• investment decision-making and pricing that is commensurate with the risk being taken;
• allocating capital according to the greatest expected marginal risk-based
return, and tracking performance on this basis;
• determining transactional risk-based returns on capital;
• rewarding performance, taking into account the relative levels of risk adopted by forming a basis for the determination of economic value added at a transactional level, and hence the basis for discretionary variable remuneration; and
• comparing risk-based performance across business areas.
The framework has been approved by the board and is managed by the DLC capital committee, which is responsible for oversight of the management of capital on a regulatory and an internal capital basis.
In order to achieve these objectives, the internal capital framework describes the following approach to the integration of risk and capital management.
Risk modelling and quantification (internal capital)Internal capital requirements are quantified by analysis of the potential impact of key risks to a degree consistent with our risk appetite. Internal capital requirements are supported by the board-approved risk assessment process described
above. Quantification of all risks is based on analysis of internal data, management expertise and judgement, and external benchmarking.
The following risks are included within the internal capital framework and quantified for capital allocation purposes:
• Credit and counterparty risk, including:
– underlying counterparty risk;
– concentration risk; and
– securitisation risk.
• Market risk
• Investment risk held in the banking book
• Balance sheet risk, including:
– liquidity; and
– banking book interest rate risk.
• Strategic and reputational risks
• Pension risk (UK only)
• Operational risk, which is considered as an umbrella term and covers a range of independent risks including, but not limited to fraud, litigation, business continuity, outsourcing and out of policy trading. The specific risks covered are assessed dynamically through constant review of
the underlying business environment.
The (simplified) integration of risk and capital management
Risk reportingand ‘business as
usual’ riskmanagement
Risk modellingand
quantification
Managed by Group Capital Management
with oversight byDLC capital
committee/BRCC
Capitalmanagementand planning
Scenariotesting
Internal capital
Riskassessment
Riskidentification
Ong
oin
g r
isk
man
agem
ent
Groupstrategy
Pricing andperformancemeasurement
Managed by eachbusiness unit
and Group Riskdepartments
with oversight by Review ERRF/Policy ERRF/BRCC/GRCC
85Investec integrated annual report 2017
Risk and
Basel P
illar III disclosures
01Risk management(continued)
Capital planning and stress/scenario testingA group capital plan is prepared and maintained to facilitate discussion of the impact of business strategy and market conditions on capital adequacy. This plan is designed to assess capital adequacy under a range of economic and internal conditions over the medium term (three years), with the impact on earnings, asset growth, risk appetite and liquidity considered. The plan provides the board (via the BRCC) with an input into strategy and the setting of risk appetite by considering business risks and potential vulnerabilities, capital usage and funding requirements given constraints where these exist.
Capital planning is performed regularly, with regulatory capital being the key driver of decision-making. The goal of capital planning is to provide insight into potential sources of vulnerability of capital adequacy by way of market, economic or internal events. As such, we stress the capital plans based on conditions most likely to place us under duress. The conditions themselves are agreed by the DLC capital committee after research and consultation with relevant internal experts. Such plans are used by management to formulate balance sheet strategy and agree management actions, trigger points and influence the determination of our risk appetite.
The output of capital planning allows senior management to make decisions to ensure that the group continues to hold sufficient capital to meet regulatory and internal capital targets. On certain occasions, especially under stressed scenarios, management may plan to undertake a number of actions. Assessment of the relative merits of undertaking various actions is then considered using an internal view of relative returns across portfolios which are themselves based on internal assessments of risk and capital.
Our capital plans are designed to allow senior management and the board to review:
• Changes to capital demand caused by implementation of agreed strategic objectives, including the creation or acquisition of new businesses, or as a result of the manifestation of one or more of the risks to which we are potentially susceptible
• The impact on profitability of current and future strategies
• Required changes to the capital structure
• The impact of implementing a proposed dividend strategy
• The impact of alternate market or operating conditions on any of the above.
At a minimum level, each capital plan assesses the impact on our capital adequacy over expected case, upturn and downturn scenarios. On the basis of the results of this analysis, the DLC capital committee and the BRCC are presented with the potential variability in capital adequacy and are responsible, in consultation with the board, for considering the appropriate response.
Pricing and performance measurementThe use of internal capital as an allocation tool means that all transactions are considered in the context of their contribution to return on risk-adjusted capital. This ensures that expected returns are sufficient after taking recognition of the inherent risk generated for a given transaction. This approach allows us to embed risk and capital discipline at the
Internal capital requirements are quantified by analysis of the potential impact of key risks to a degree consistent with our risk appetite
86 Investec integrated annual report 2017
Risk and
Basel P
illar III disclosures
01 Risk management(continued)
level of deal initiation. Using expectations of risk-based returns as the basis for pricing and deal acceptance ensures that risk management retains a key role in ensuring the portfolio is appropriately managed for that risk.
In addition to pricing, returns on internal capital are monitored and relative performance is assessed on this basis. Assessment of performance in this way is a fundamental consideration used in setting strategy and risk appetite as well as rewarding performance.
These processes have been embedded across the business with the process designed to ensure that risk and capital management form the basis for key decisions, at both a group and at a transactional level. Responsibility for oversight for each of these processes ultimately falls to the BRCC.
For an assessment of return on equity and our return on internal capital utilised refer to pages 64 to 66 in volume one.
Accounting and regulatory treatment of group subsidiariesInvestec plc and Investec Limited are the two listed holding companies in terms of the DLC structure. Investec Bank plc and Investec Bank Limited are the main banking subsidiaries of Investec plc and Investec Limited, respectively.
Basis of consolidationThe regulatory basis of consolidation differs from the basis of consolidation used for financial reporting purposes. The financial accounting position of the DLC group is reported under IFRS and is described on page 30 of the annual financial statements.
The regulatory consolidation includes all financial sector subsidiaries, the majority
of which are wholly owned by the relevant parent company. Investments in financial sector associates are equity accounted in the financial accounting consolidation. In the regulatory consolidation, we proportionally consolidate our exposures to financial sector associates. Subsidiaries and associates engaged in non-financial activities are excluded from the regulatory consolidation. In addition SPEs are not consolidated for regulatory purposes, where significant credit risk has been transferred to third parties. The positions the firm continues to hold in these securitisation SPEs will either be risk-weighted and/or deducted from common equity tier 1 capital.
Investec Bank plc, a regulated subsidiary of Investec plc, applies the provisions laid down in article 9 of the Capital Requirements Regulation (solo-consolidation waiver) and reports to the PRA on a solo-consolidation basis. Investec Bank plc has two solo-consolidation subsidiaries namely Investec Finance plc and Investec Investments (UK) Limited.
There are no current or foreseen material practical or legal impediments to the prompt transfer of capital resources or repayment of liabilities among the parent undertaking and its subsidiary undertakings.
Regulatory capital requirements are driven by the regulatory balance sheet and not the financial accounting balance sheet.
Regulatory capital and requirementsRegulatory capital is divided into three main categories, namely common equity tier 1, tier 1 and tier 2 capital and comprise the following:
• Common equity tier 1 capital comprises shareholders’ equity and related eligible non-controlling interests after giving effect to deductions for disallowed items
(for example, goodwill and intangible assets) and other adjustments
• Additional tier 1 capital includes qualifying capital instruments that are capable of being fully and permanently written down or converted into common equity tier 1 capital at the point of non-viability of the firm and other additional tier 1 instruments, which no longer qualify as additional tier 1 capital and are subject to grandfathering provisions and related eligible non-controlling interests
• Tier 2 capital comprises qualifying subordinated debt and related eligible non-controlling interests and other tier 2 instruments, which no longer qualify as tier 2 capital and are subject to grandfathering provisions.
Capital disclosuresThe composition of our regulatory capital under a Basel III/CRD IV basis is provided in the table below.
Summary information on the terms and conditions of the main features of all capital instruments is provided on pages 101 to 113 in volume three.
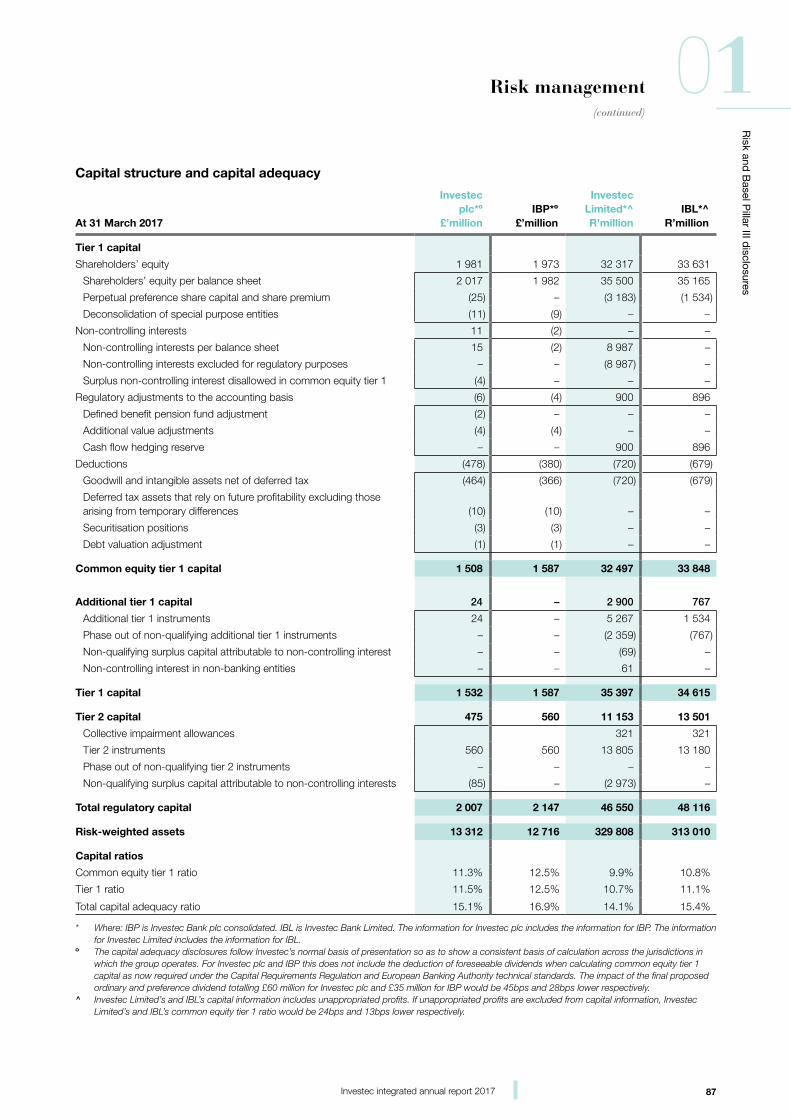
87Investec integrated annual report 2017
Risk and
Basel P
illar III disclosures
01Risk management(continued)
Capital structure and capital adequacy
At 31 March 2017
Investec plc*º
£’millionIBP*º
£’million
Investec Limited*^R’million
IBL*^R’million
Tier 1 capital
Shareholders’ equity 1 981 1 973 32 317 33 631
Shareholders’ equity per balance sheet 2 017 1 982 35 500 35 165
Perpetual preference share capital and share premium (25) – (3 183) (1 534)
Deconsolidation of special purpose entities (11) (9) – –
Non-controlling interests 11 (2) – –
Non-controlling interests per balance sheet 15 (2) 8 987 –
Non-controlling interests excluded for regulatory purposes – – (8 987) –
Surplus non-controlling interest disallowed in common equity tier 1 (4) – – –
Regulatory adjustments to the accounting basis (6) (4) 900 896
Defined benefit pension fund adjustment (2) – – –
Additional value adjustments (4) (4) – –
Cash flow hedging reserve – – 900 896
Deductions (478) (380) (720) (679)
Goodwill and intangible assets net of deferred tax (464) (366) (720) (679)
Deferred tax assets that rely on future profitability excluding those arising from temporary differences (10) (10) – –
Securitisation positions (3) (3) – –
Debt valuation adjustment (1) (1) – –
Common equity tier 1 capital 1 508 1 587 32 497 33 848
Additional tier 1 capital 24 – 2 900 767
Additional tier 1 instruments 24 – 5 267 1 534
Phase out of non-qualifying additional tier 1 instruments – – (2 359) (767)
Non-qualifying surplus capital attributable to non-controlling interest – – (69) –
Non-controlling interest in non-banking entities – – 61 –
Tier 1 capital 1 532 1 587 35 397 34 615
Tier 2 capital 475 560 11 153 13 501
Collective impairment allowances 321 321
Tier 2 instruments 560 560 13 805 13 180
Phase out of non-qualifying tier 2 instruments – – – –
Non-qualifying surplus capital attributable to non-controlling interests (85) – (2 973) –
Total regulatory capital 2 007 2 147 46 550 48 116
Risk-weighted assets 13 312 12 716 329 808 313 010
Capital ratios
Common equity tier 1 ratio 11.3% 12.5% 9.9% 10.8%
Tier 1 ratio 11.5% 12.5% 10.7% 11.1%
Total capital adequacy ratio 15.1% 16.9% 14.1% 15.4%
* Where: IBP is Investec Bank plc consolidated. IBL is Investec Bank Limited. The information for Investec plc includes the information for IBP. The information for Investec Limited includes the information for IBL.
º The capital adequacy disclosures follow Investec’s normal basis of presentation so as to show a consistent basis of calculation across the jurisdictions in which the group operates. For Investec plc and IBP this does not include the deduction of foreseeable dividends when calculating common equity tier 1 capital as now required under the Capital Requirements Regulation and European Banking Authority technical standards. The impact of the final proposed ordinary and preference dividend totalling £60 million for Investec plc and £35 million for IBP would be 45bps and 28bps lower respectively.
^ Investec Limited’s and IBL’s capital information includes unappropriated profits. If unappropriated profits are excluded from capital information, Investec Limited’s and IBL’s common equity tier 1 ratio would be 24bps and 13bps lower respectively.
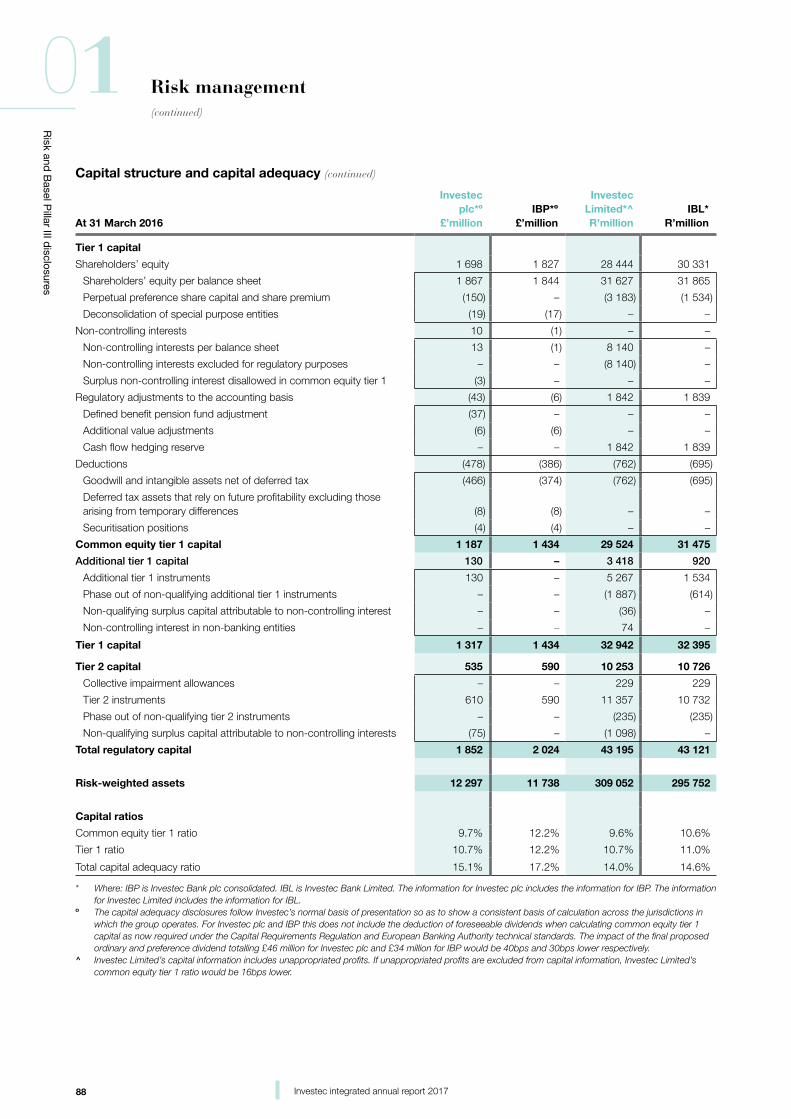
88 Investec integrated annual report 2017
Risk and
Basel P
illar III disclosures
01 Risk management(continued)
Capital structure and capital adequacy (continued)
At 31 March 2016
Investec plc*º
£’millionIBP*º
£’million
Investec Limited*^R’million
IBL*R’million
Tier 1 capital
Shareholders’ equity 1 698 1 827 28 444 30 331
Shareholders’ equity per balance sheet 1 867 1 844 31 627 31 865
Perpetual preference share capital and share premium (150) – (3 183) (1 534)
Deconsolidation of special purpose entities (19) (17) – –
Non-controlling interests 10 (1) – –
Non-controlling interests per balance sheet 13 (1) 8 140 –
Non-controlling interests excluded for regulatory purposes – – (8 140) –
Surplus non-controlling interest disallowed in common equity tier 1 (3) – – –
Regulatory adjustments to the accounting basis (43) (6) 1 842 1 839
Defined benefit pension fund adjustment (37) – – –
Additional value adjustments (6) (6) – –
Cash flow hedging reserve – – 1 842 1 839
Deductions (478) (386) (762) (695)
Goodwill and intangible assets net of deferred tax (466) (374) (762) (695)
Deferred tax assets that rely on future profitability excluding those arising from temporary differences (8) (8) – –
Securitisation positions (4) (4) – –
Common equity tier 1 capital 1 187 1 434 29 524 31 475
Additional tier 1 capital 130 – 3 418 920
Additional tier 1 instruments 130 – 5 267 1 534
Phase out of non-qualifying additional tier 1 instruments – – (1 887) (614)
Non-qualifying surplus capital attributable to non-controlling interest – – (36) –
Non-controlling interest in non-banking entities – – 74 –
Tier 1 capital 1 317 1 434 32 942 32 395
Tier 2 capital 535 590 10 253 10 726
Collective impairment allowances – – 229 229
Tier 2 instruments 610 590 11 357 10 732
Phase out of non-qualifying tier 2 instruments – – (235) (235)
Non-qualifying surplus capital attributable to non-controlling interests (75) – (1 098) –
Total regulatory capital 1 852 2 024 43 195 43 121
Risk-weighted assets 12 297 11 738 309 052 295 752
Capital ratios
Common equity tier 1 ratio 9.7% 12.2% 9.6% 10.6%
Tier 1 ratio 10.7% 12.2% 10.7% 11.0%
Total capital adequacy ratio 15.1% 17.2% 14.0% 14.6%
* Where: IBP is Investec Bank plc consolidated. IBL is Investec Bank Limited. The information for Investec plc includes the information for IBP. The information for Investec Limited includes the information for IBL.
º The capital adequacy disclosures follow Investec’s normal basis of presentation so as to show a consistent basis of calculation across the jurisdictions in which the group operates. For Investec plc and IBP this does not include the deduction of foreseeable dividends when calculating common equity tier 1 capital as now required under the Capital Requirements Regulation and European Banking Authority technical standards. The impact of the final proposed ordinary and preference dividend totalling £46 million for Investec plc and £34 million for IBP would be 40bps and 30bps lower respectively.
^ Investec Limited’s capital information includes unappropriated profits. If unappropriated profits are excluded from capital information, Investec Limited’s common equity tier 1 ratio would be 16bps lower.
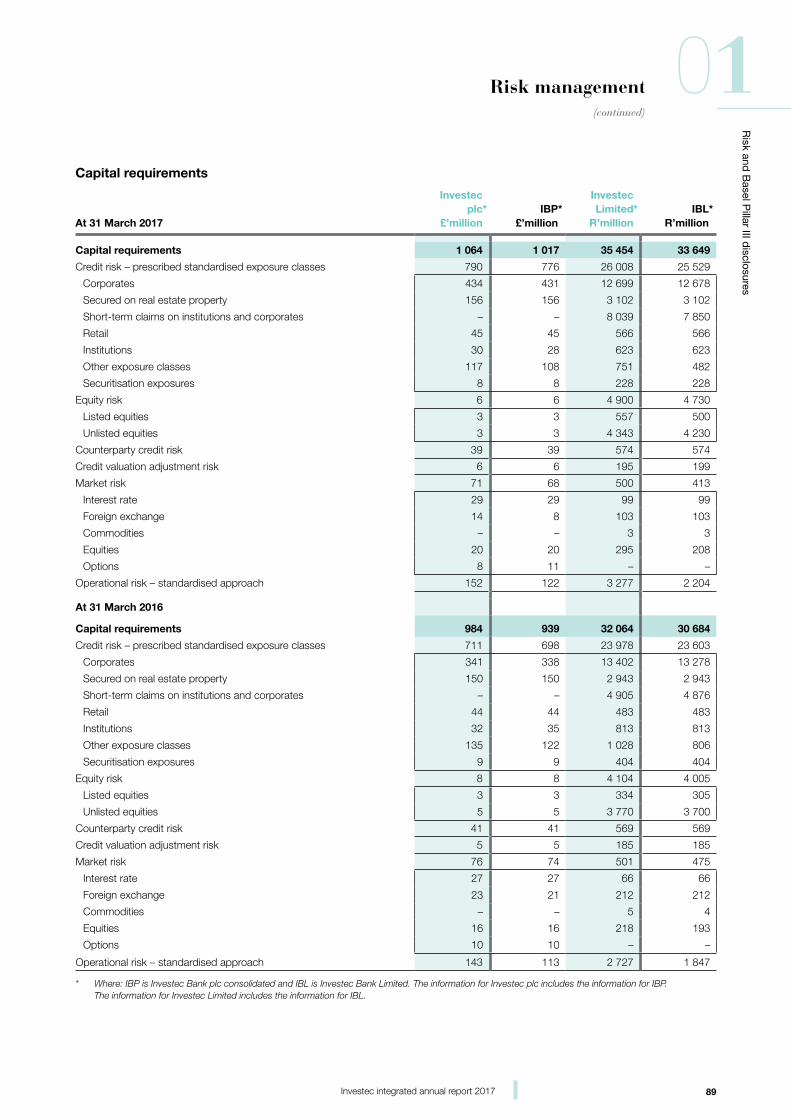
89Investec integrated annual report 2017
Risk and
Basel P
illar III disclosures
01Risk management(continued)
Capital requirements
At 31 March 2017
Investec plc*
£’millionIBP*
£’million
Investec Limited*
R’millionIBL*
R’million
Capital requirements 1 064 1 017 35 454 33 649
Credit risk – prescribed standardised exposure classes 790 776 26 008 25 529
Corporates 434 431 12 699 12 678
Secured on real estate property 156 156 3 102 3 102
Short-term claims on institutions and corporates – – 8 039 7 850
Retail 45 45 566 566
Institutions 30 28 623 623
Other exposure classes 117 108 751 482
Securitisation exposures 8 8 228 228
Equity risk 6 6 4 900 4 730
Listed equities 3 3 557 500
Unlisted equities 3 3 4 343 4 230
Counterparty credit risk 39 39 574 574
Credit valuation adjustment risk 6 6 195 199
Market risk 71 68 500 413
Interest rate 29 29 99 99
Foreign exchange 14 8 103 103
Commodities – – 3 3
Equities 20 20 295 208
Options 8 11 – –
Operational risk – standardised approach 152 122 3 277 2 204
At 31 March 2016
Capital requirements 984 939 32 064 30 684
Credit risk – prescribed standardised exposure classes 711 698 23 978 23 603
Corporates 341 338 13 402 13 278
Secured on real estate property 150 150 2 943 2 943
Short-term claims on institutions and corporates – – 4 905 4 876
Retail 44 44 483 483
Institutions 32 35 813 813
Other exposure classes 135 122 1 028 806
Securitisation exposures 9 9 404 404
Equity risk 8 8 4 104 4 005
Listed equities 3 3 334 305
Unlisted equities 5 5 3 770 3 700
Counterparty credit risk 41 41 569 569
Credit valuation adjustment risk 5 5 185 185
Market risk 76 74 501 475
Interest rate 27 27 66 66
Foreign exchange 23 21 212 212
Commodities – – 5 4
Equities 16 16 218 193
Options 10 10 – –
Operational risk – standardised approach 143 113 2 727 1 847
* Where: IBP is Investec Bank plc consolidated and IBL is Investec Bank Limited. The information for Investec plc includes the information for IBP. The information for Investec Limited includes the information for IBL.
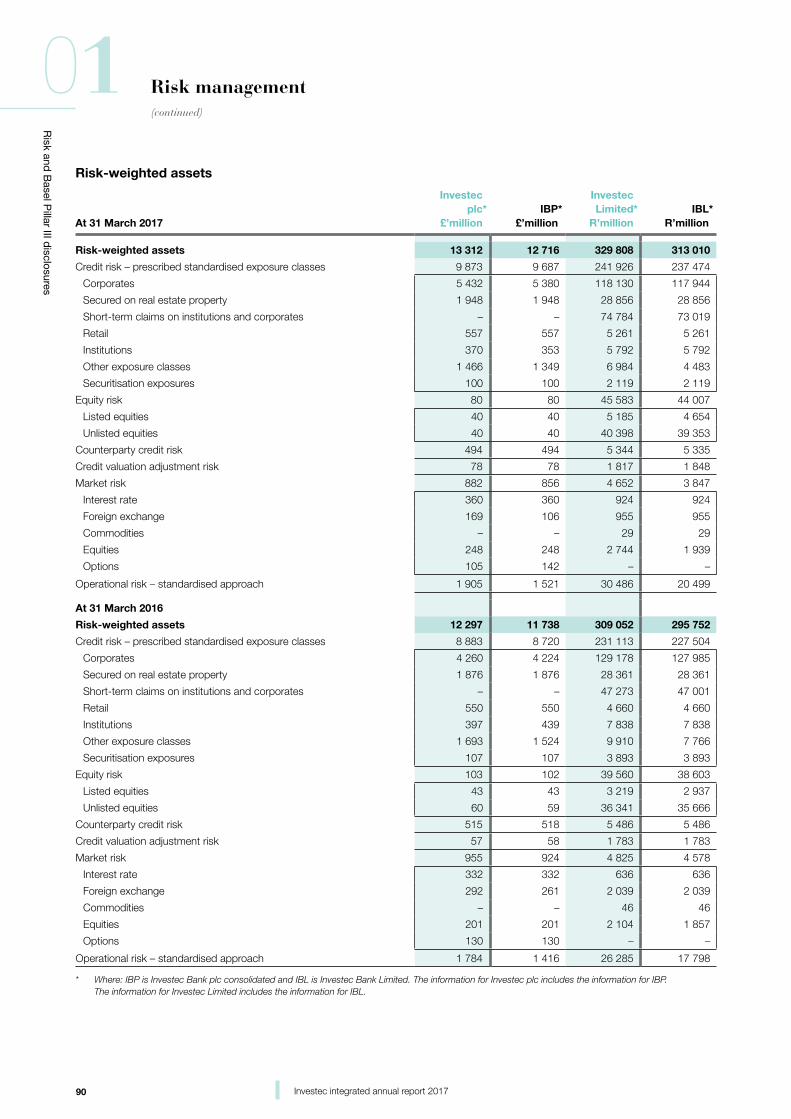
90 Investec integrated annual report 2017
Risk and
Basel P
illar III disclosures
01 Risk management(continued)
Risk-weighted assets
At 31 March 2017
Investec plc*
£’millionIBP*
£’million
Investec Limited*
R’millionIBL*
R’million
Risk-weighted assets 13 312 12 716 329 808 313 010
Credit risk – prescribed standardised exposure classes 9 873 9 687 241 926 237 474
Corporates 5 432 5 380 118 130 117 944
Secured on real estate property 1 948 1 948 28 856 28 856
Short-term claims on institutions and corporates – – 74 784 73 019
Retail 557 557 5 261 5 261
Institutions 370 353 5 792 5 792
Other exposure classes 1 466 1 349 6 984 4 483
Securitisation exposures 100 100 2 119 2 119
Equity risk 80 80 45 583 44 007
Listed equities 40 40 5 185 4 654
Unlisted equities 40 40 40 398 39 353
Counterparty credit risk 494 494 5 344 5 335
Credit valuation adjustment risk 78 78 1 817 1 848
Market risk 882 856 4 652 3 847
Interest rate 360 360 924 924
Foreign exchange 169 106 955 955
Commodities – – 29 29
Equities 248 248 2 744 1 939
Options 105 142 – –
Operational risk – standardised approach 1 905 1 521 30 486 20 499
At 31 March 2016
Risk-weighted assets 12 297 11 738 309 052 295 752
Credit risk – prescribed standardised exposure classes 8 883 8 720 231 113 227 504
Corporates 4 260 4 224 129 178 127 985
Secured on real estate property 1 876 1 876 28 361 28 361
Short-term claims on institutions and corporates – – 47 273 47 001
Retail 550 550 4 660 4 660
Institutions 397 439 7 838 7 838
Other exposure classes 1 693 1 524 9 910 7 766
Securitisation exposures 107 107 3 893 3 893
Equity risk 103 102 39 560 38 603
Listed equities 43 43 3 219 2 937
Unlisted equities 60 59 36 341 35 666
Counterparty credit risk 515 518 5 486 5 486
Credit valuation adjustment risk 57 58 1 783 1 783
Market risk 955 924 4 825 4 578
Interest rate 332 332 636 636
Foreign exchange 292 261 2 039 2 039
Commodities – – 46 46
Equities 201 201 2 104 1 857
Options 130 130 – –
Operational risk – standardised approach 1 784 1 416 26 285 17 798
* Where: IBP is Investec Bank plc consolidated and IBL is Investec Bank Limited. The information for Investec plc includes the information for IBP. The information for Investec Limited includes the information for IBL.
91Investec integrated annual report 2017
Risk and
Basel P
illar III disclosures
01Risk management(continued)
Investec plcMovement in risk-weighted assetsTotal risk-weighted assets (RWAs) have increased by 8.3% over the period, predominantly within credit risk RWAs.
Credit risk RWAsFor Investec plc consolidated reporting, we have adopted the standardised approach for calculating credit risk RWAs. Credit risk RWAs, which include equity risk, increased by £967 million. The increase is primarily attributable to a growth in secured corporate and residential mortgage lending.
Counterparty credit risk RWAs and Credit Valuation Risk (CVA)Counterparty credit risk and CVA RWAs decreased by £21 million mainly due to central clearing some of our derivative exposures.
Market risk RWAsWe apply the standardised approach for calculating market risk RWAs. Market risk RWAs decreased by £73 million primarily driven by a decrease in FX risk which was achieved through hedging.
Operational risk RWAsOperational risk RWAs are calculated using the standardised approach increased by £121 million. The increase is due to a higher three year average operating income.
Investec LimitedMovement in risk-weighted assetsTotal RWAs grew by 6.7% over the period, with approximately 52% of this growth attributable to credit risk, 29% to equity risk and the remaining risk types contributing the balance.
Credit risk RWAsFor Investec Limited consolidated reporting, we have adopted the standardised approach for calculating credit risk RWAs. Credit risk RWAs grew by R10.8 billion with strong growth across the various businesses, including Corporate and Institutional Banking and Private Client Lending. While a portion of this growth is due to currency movement on foreign-denominated assets, the majority is the result of consistent growth across multiple asset classes, the most noticeable being term and short-dated corporate lending and lending secured by residential real estate. The impact of Basel III and the associated enhancements to the Banks Act by the South African Reserve Bank were implemented in 2013, and there has been minimal change in the methodology governing the calculation of required capital during the 2017 financial year.
Counterparty credit risk and credit valuation adjustment RWAsCounterparty credit risk RWAs decreased marginally by R142 million, while CVA over the period increased by R34 million. CVA was implemented as part of Basel III in South Africa and captures the risk of deterioration in the credit quality of a bank’s OTC derivative counterparties. We currently apply the standardised approach to the calculation of the CVA capital requirement.
Equity risk RWAsEquity risk grew by approximately R6 billion over the period. The risk weight attributable to equity investments is relatively high, with listed equities attracting an effective 318% and unlisted equities 424%.
The impact of this is a proportionally much larger increase in RWAs than the associated balance sheet equity value. The growth is attributable to new investments and revaluations of existing assets.
Market risk RWAsMarket Risk RWAs are calculated using the Value at Risk (VaR) approach and has shown a decrease, due to market volatility.
Operational risk RWAsOperational risk is calculated using the standardised approach and is driven by the levels of income over a three-year average period, applying specific factors applicable to the nature of the business generating the income.
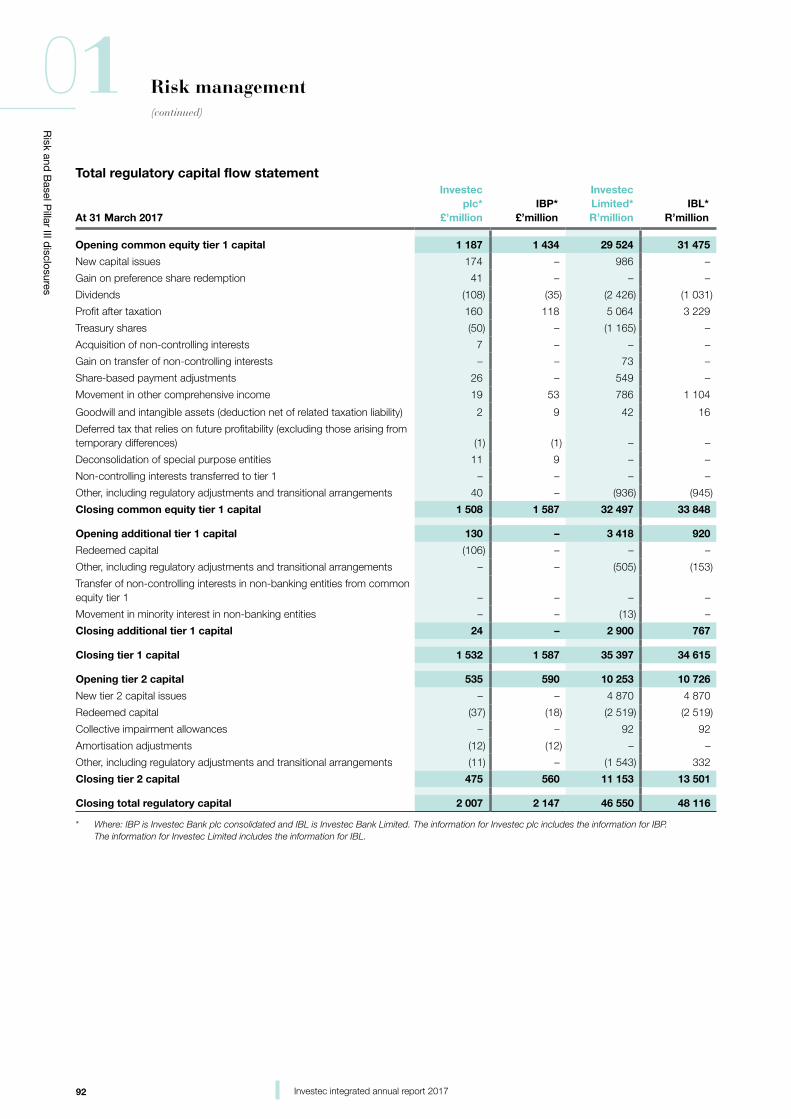
92 Investec integrated annual report 2017
Risk and
Basel P
illar III disclosures
01 Risk management(continued)
Total regulatory capital flow statement
At 31 March 2017
Investec plc*
£’millionIBP*
£’million
Investec Limited*R’million
IBL*R’million
Opening common equity tier 1 capital 1 187 1 434 29 524 31 475
New capital issues 174 – 986 –
Gain on preference share redemption 41 – – –
Dividends (108) (35) (2 426) (1 031)
Profit after taxation 160 118 5 064 3 229
Treasury shares (50) – (1 165) –
Acquisition of non-controlling interests 7 – – –
Gain on transfer of non-controlling interests – – 73 –
Share-based payment adjustments 26 – 549 –
Movement in other comprehensive income 19 53 786 1 104
Goodwill and intangible assets (deduction net of related taxation liability) 2 9 42 16
Deferred tax that relies on future profitability (excluding those arising from temporary differences) (1) (1) – –
Deconsolidation of special purpose entities 11 9 – –
Non-controlling interests transferred to tier 1 – – – –
Other, including regulatory adjustments and transitional arrangements 40 – (936) (945)
Closing common equity tier 1 capital 1 508 1 587 32 497 33 848
Opening additional tier 1 capital 130 – 3 418 920
Redeemed capital (106) – – –
Other, including regulatory adjustments and transitional arrangements – – (505) (153)
Transfer of non-controlling interests in non-banking entities from common equity tier 1 – – – –
Movement in minority interest in non-banking entities – – (13) –
Closing additional tier 1 capital 24 – 2 900 767
Closing tier 1 capital 1 532 1 587 35 397 34 615
Opening tier 2 capital 535 590 10 253 10 726
New tier 2 capital issues – – 4 870 4 870
Redeemed capital (37) (18) (2 519) (2 519)
Collective impairment allowances – – 92 92
Amortisation adjustments (12) (12) – –
Other, including regulatory adjustments and transitional arrangements (11) – (1 543) 332
Closing tier 2 capital 475 560 11 153 13 501
Closing total regulatory capital 2 007 2 147 46 550 48 116
* Where: IBP is Investec Bank plc consolidated and IBL is Investec Bank Limited. The information for Investec plc includes the information for IBP. The information for Investec Limited includes the information for IBL.
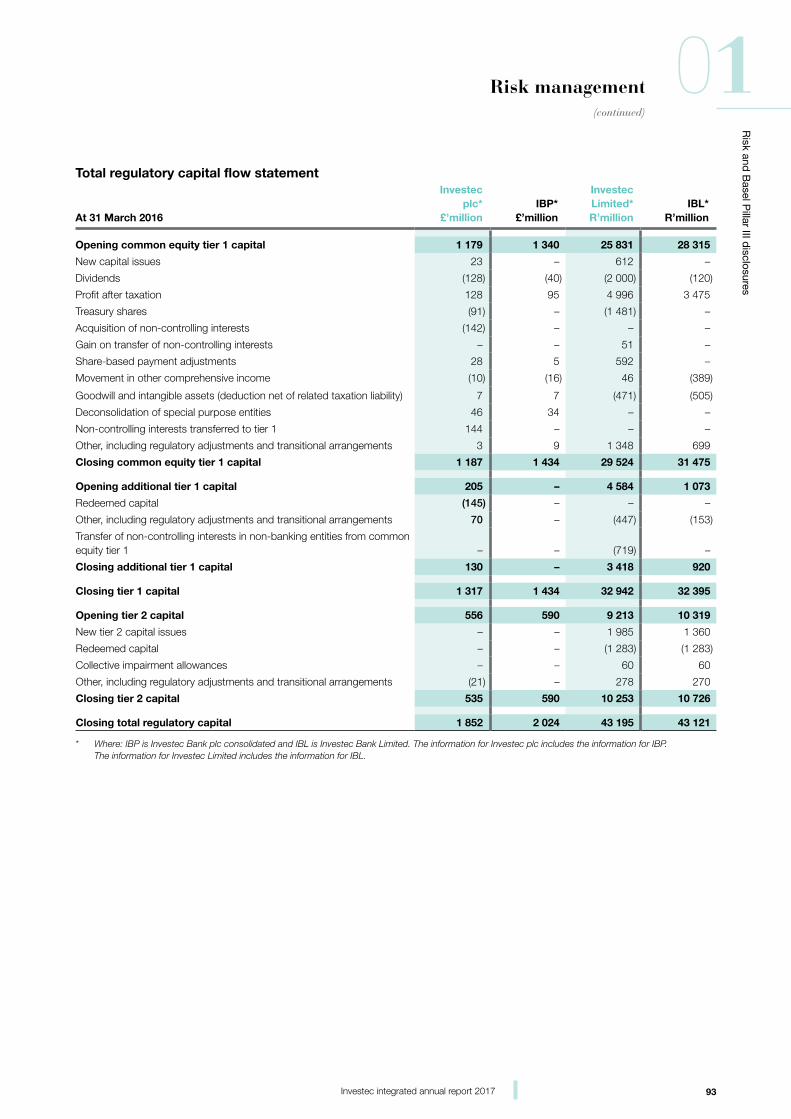
93Investec integrated annual report 2017
Risk and
Basel P
illar III disclosures
01Risk management(continued)
Total regulatory capital flow statement
At 31 March 2016
Investec plc*
£’millionIBP*
£’million
Investec Limited*R’million
IBL* R’million
Opening common equity tier 1 capital 1 179 1 340 25 831 28 315
New capital issues 23 – 612 –
Dividends (128) (40) (2 000) (120)
Profit after taxation 128 95 4 996 3 475
Treasury shares (91) – (1 481) –
Acquisition of non-controlling interests (142) – – –
Gain on transfer of non-controlling interests – – 51 –
Share-based payment adjustments 28 5 592 –
Movement in other comprehensive income (10) (16) 46 (389)
Goodwill and intangible assets (deduction net of related taxation liability) 7 7 (471) (505)
Deconsolidation of special purpose entities 46 34 – –
Non-controlling interests transferred to tier 1 144 – – –
Other, including regulatory adjustments and transitional arrangements 3 9 1 348 699
Closing common equity tier 1 capital 1 187 1 434 29 524 31 475
Opening additional tier 1 capital 205 – 4 584 1 073
Redeemed capital (145) – – –
Other, including regulatory adjustments and transitional arrangements 70 – (447) (153)
Transfer of non-controlling interests in non-banking entities from common equity tier 1 – – (719) –
Closing additional tier 1 capital 130 – 3 418 920
Closing tier 1 capital 1 317 1 434 32 942 32 395
Opening tier 2 capital 556 590 9 213 10 319
New tier 2 capital issues – – 1 985 1 360
Redeemed capital – – (1 283) (1 283)
Collective impairment allowances – – 60 60
Other, including regulatory adjustments and transitional arrangements (21) – 278 270
Closing tier 2 capital 535 590 10 253 10 726
Closing total regulatory capital 1 852 2 024 43 195 43 121
* Where: IBP is Investec Bank plc consolidated and IBL is Investec Bank Limited. The information for Investec plc includes the information for IBP. The information for Investec Limited includes the information for IBL.
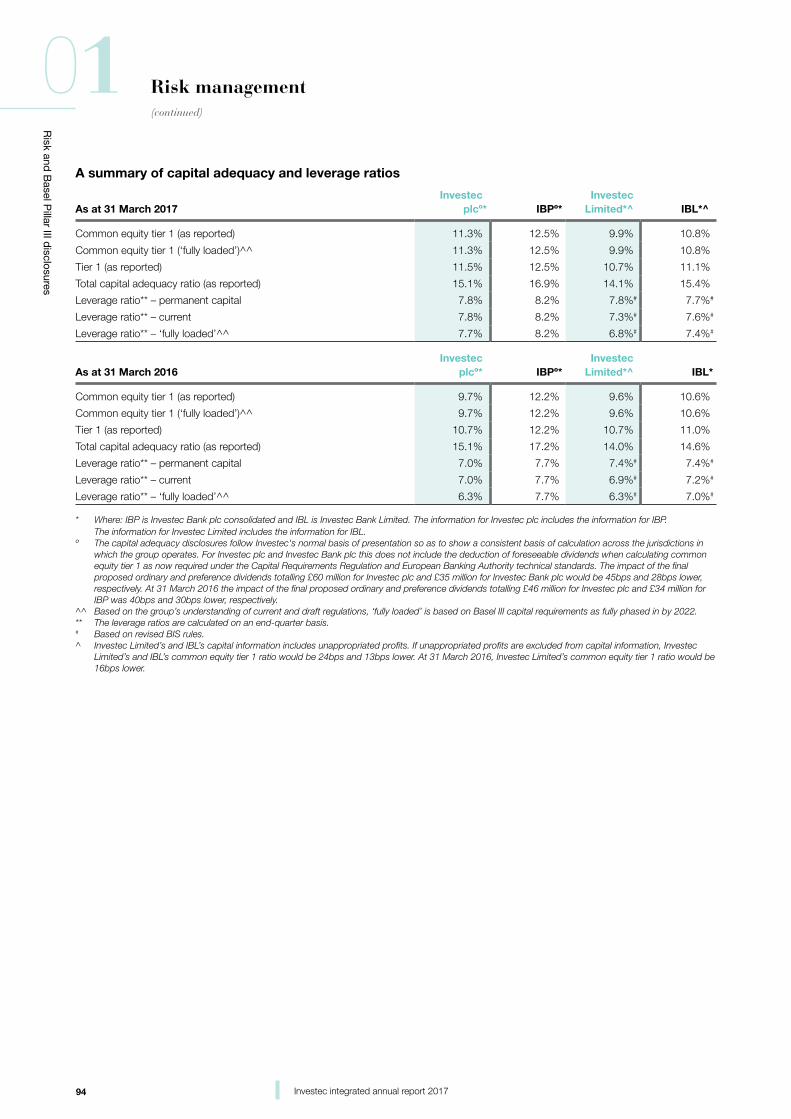
94 Investec integrated annual report 2017
Risk and
Basel P
illar III disclosures
01 Risk management(continued)
A summary of capital adequacy and leverage ratios
As at 31 March 2017Investec
plcº* IBPº*Investec
Limited*^ IBL*^
Common equity tier 1 (as reported) 11.3% 12.5% 9.9% 10.8%
Common equity tier 1 (‘fully loaded’)^^ 11.3% 12.5% 9.9% 10.8%
Tier 1 (as reported) 11.5% 12.5% 10.7% 11.1%
Total capital adequacy ratio (as reported) 15.1% 16.9% 14.1% 15.4%
Leverage ratio** – permanent capital 7.8% 8.2% 7.8%# 7.7%#
Leverage ratio** – current 7.8% 8.2% 7.3%# 7.6%#
Leverage ratio** – ‘fully loaded’^^ 7.7% 8.2% 6.8%# 7.4%#
As at 31 March 2016Investec
plcº* IBPº*Investec
Limited*^ IBL*
Common equity tier 1 (as reported) 9.7% 12.2% 9.6% 10.6%
Common equity tier 1 (‘fully loaded’)^^ 9.7% 12.2% 9.6% 10.6%
Tier 1 (as reported) 10.7% 12.2% 10.7% 11.0%
Total capital adequacy ratio (as reported) 15.1% 17.2% 14.0% 14.6%
Leverage ratio** – permanent capital 7.0% 7.7% 7.4%# 7.4%#
Leverage ratio** – current 7.0% 7.7% 6.9%# 7.2%#
Leverage ratio** – ‘fully loaded’^^ 6.3% 7.7% 6.3%# 7.0%#
* Where: IBP is Investec Bank plc consolidated and IBL is Investec Bank Limited. The information for Investec plc includes the information for IBP. The information for Investec Limited includes the information for IBL.
º The capital adequacy disclosures follow Investec's normal basis of presentation so as to show a consistent basis of calculation across the jurisdictions in which the group operates. For Investec plc and Investec Bank plc this does not include the deduction of foreseeable dividends when calculating common equity tier 1 as now required under the Capital Requirements Regulation and European Banking Authority technical standards. The impact of the final proposed ordinary and preference dividends totalling £60 million for Investec plc and £35 million for Investec Bank plc would be 45bps and 28bps lower, respectively. At 31 March 2016 the impact of the final proposed ordinary and preference dividends totalling £46 million for Investec plc and £34 million for IBP was 40bps and 30bps lower, respectively.
^^ Based on the group’s understanding of current and draft regulations, ‘fully loaded’ is based on Basel III capital requirements as fully phased in by 2022.** The leverage ratios are calculated on an end-quarter basis.# Based on revised BIS rules.^ Investec Limited’s and IBL’s capital information includes unappropriated profits. If unappropriated profits are excluded from capital information, Investec
Limited’s and IBL’s common equity tier 1 ratio would be 24bps and 13bps lower. At 31 March 2016, Investec Limited’s common equity tier 1 ratio would be 16bps lower.
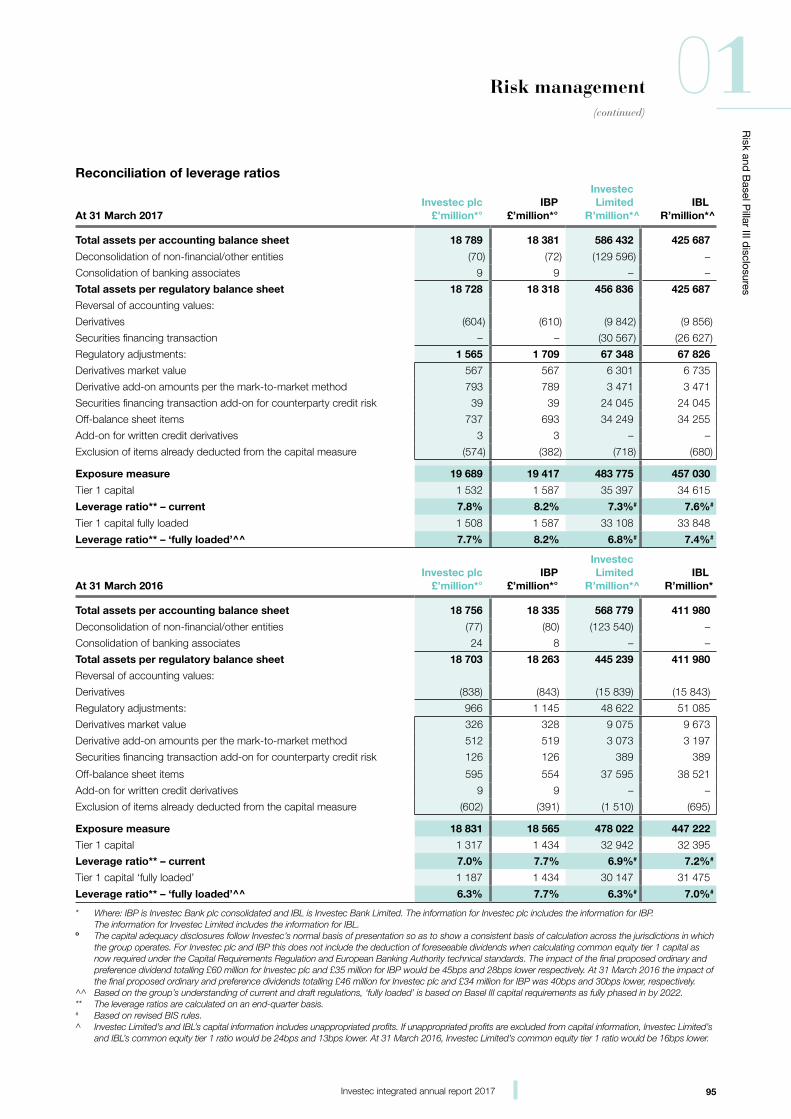
95Investec integrated annual report 2017
Risk and
Basel P
illar III disclosures
01Risk management(continued)
Reconciliation of leverage ratios
At 31 March 2017Investec plc
£’million*°IBP
£’million*°
Investec Limited
R’million*^IBL
R’million*^
Total assets per accounting balance sheet 18 789 18 381 586 432 425 687
Deconsolidation of non-financial/other entities (70) (72) (129 596) –
Consolidation of banking associates 9 9 – –
Total assets per regulatory balance sheet 18 728 18 318 456 836 425 687
Reversal of accounting values:
Derivatives (604) (610) (9 842) (9 856)
Securities financing transaction – – (30 567) (26 627)
Regulatory adjustments: 1 565 1 709 67 348 67 826
Derivatives market value 567 567 6 301 6 735
Derivative add-on amounts per the mark-to-market method 793 789 3 471 3 471
Securities financing transaction add-on for counterparty credit risk 39 39 24 045 24 045
Off-balance sheet items 737 693 34 249 34 255
Add-on for written credit derivatives 3 3 – –
Exclusion of items already deducted from the capital measure (574) (382) (718) (680)
Exposure measure 19 689 19 417 483 775 457 030
Tier 1 capital 1 532 1 587 35 397 34 615
Leverage ratio** – current 7.8% 8.2% 7.3%# 7.6%#
Tier 1 capital fully loaded 1 508 1 587 33 108 33 848
Leverage ratio** – ‘fully loaded’^^ 7.7% 8.2% 6.8%# 7.4%#
At 31 March 2016Investec plc
£’million*°IBP
£’million*°
Investec Limited
R’million*^IBL
R’million*
Total assets per accounting balance sheet 18 756 18 335 568 779 411 980
Deconsolidation of non-financial/other entities (77) (80) (123 540) –
Consolidation of banking associates 24 8 – –
Total assets per regulatory balance sheet 18 703 18 263 445 239 411 980
Reversal of accounting values:
Derivatives (838) (843) (15 839) (15 843)
Regulatory adjustments: 966 1 145 48 622 51 085
Derivatives market value 326 328 9 075 9 673
Derivative add-on amounts per the mark-to-market method 512 519 3 073 3 197
Securities financing transaction add-on for counterparty credit risk 126 126 389 389
Off-balance sheet items 595 554 37 595 38 521
Add-on for written credit derivatives 9 9 – –
Exclusion of items already deducted from the capital measure (602) (391) (1 510) (695)
Exposure measure 18 831 18 565 478 022 447 222
Tier 1 capital 1 317 1 434 32 942 32 395
Leverage ratio** – current 7.0% 7.7% 6.9%# 7.2%#
Tier 1 capital ‘fully loaded’ 1 187 1 434 30 147 31 475
Leverage ratio** – ‘fully loaded’^^ 6.3% 7.7% 6.3%# 7.0%#
* Where: IBP is Investec Bank plc consolidated and IBL is Investec Bank Limited. The information for Investec plc includes the information for IBP. The information for Investec Limited includes the information for IBL.
º The capital adequacy disclosures follow Investec’s normal basis of presentation so as to show a consistent basis of calculation across the jurisdictions in which the group operates. For Investec plc and IBP this does not include the deduction of foreseeable dividends when calculating common equity tier 1 capital as now required under the Capital Requirements Regulation and European Banking Authority technical standards. The impact of the final proposed ordinary and preference dividend totalling £60 million for Investec plc and £35 million for IBP would be 45bps and 28bps lower respectively. At 31 March 2016 the impact of the final proposed ordinary and preference dividends totalling £46 million for Investec plc and £34 million for IBP was 40bps and 30bps lower, respectively.
^^ Based on the group’s understanding of current and draft regulations, ‘fully loaded’ is based on Basel III capital requirements as fully phased in by 2022.** The leverage ratios are calculated on an end-quarter basis.# Based on revised BIS rules.^ Investec Limited’s and IBL’s capital information includes unappropriated profits. If unappropriated profits are excluded from capital information, Investec Limited’s
and IBL’s common equity tier 1 ratio would be 24bps and 13bps lower. At 31 March 2016, Investec Limited’s common equity tier 1 ratio would be 16bps lower.
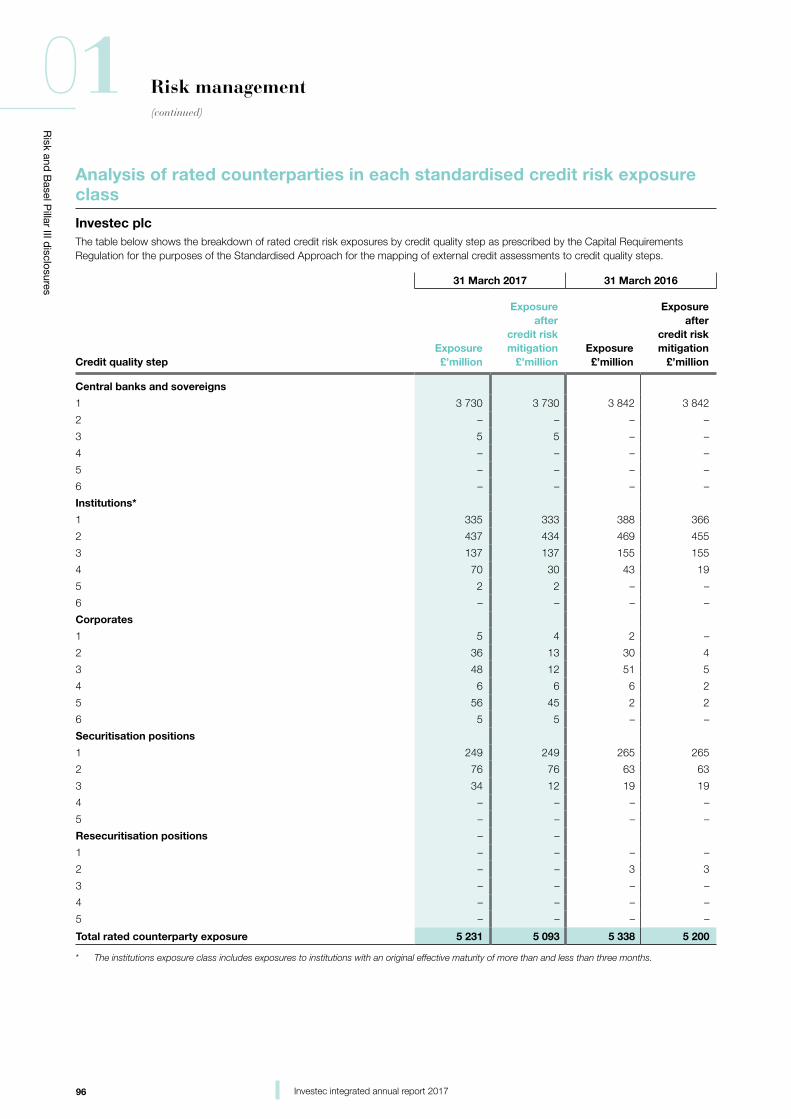
96 Investec integrated annual report 2017
Risk and
Basel P
illar III disclosures
01 Risk management(continued)
Analysis of rated counterparties in each standardised credit risk exposure class
Investec plcThe table below shows the breakdown of rated credit risk exposures by credit quality step as prescribed by the Capital Requirements Regulation for the purposes of the Standardised Approach for the mapping of external credit assessments to credit quality steps.
31 March 2017 31 March 2016
Credit quality stepExposure£’million
Exposure after
credit risk mitigation
£’million Exposure£’million
Exposure after
credit risk mitigation
£’million
Central banks and sovereigns
1 3 730 3 730 3 842 3 842
2 – – – –
3 5 5 – –
4 – – – –
5 – – – –
6 – – – –
Institutions*
1 335 333 388 366
2 437 434 469 455
3 137 137 155 155
4 70 30 43 19
5 2 2 – –
6 – – – –
Corporates
1 5 4 2 –
2 36 13 30 4
3 48 12 51 5
4 6 6 6 2
5 56 45 2 2
6 5 5 – –
Securitisation positions
1 249 249 265 265
2 76 76 63 63
3 34 12 19 19
4 – – – –
5 – – – –
Resecuritisation positions – –
1 – – – –
2 – – 3 3
3 – – – –
4 – – – –
5 – – – –
Total rated counterparty exposure 5 231 5 093 5 338 5 200
* The institutions exposure class includes exposures to institutions with an original effective maturity of more than and less than three months.
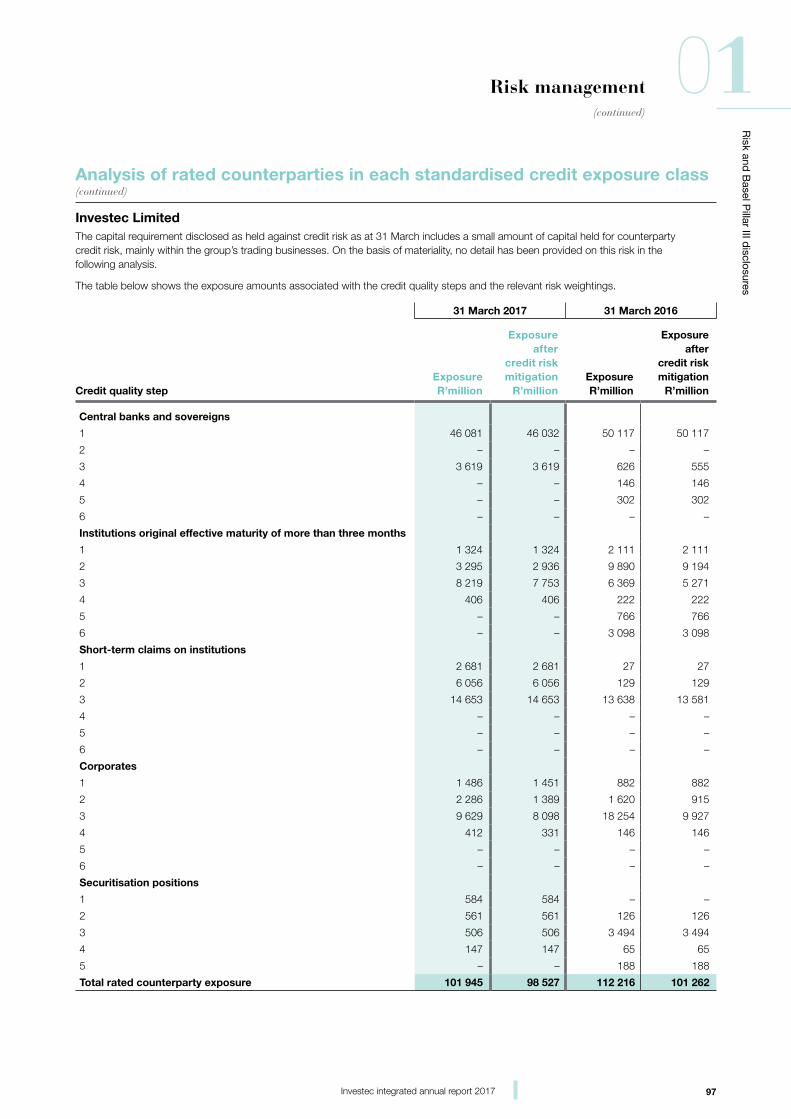
97Investec integrated annual report 2017
Risk and
Basel P
illar III disclosures
01Risk management(continued)
Analysis of rated counterparties in each standardised credit exposure class (continued)
Investec LimitedThe capital requirement disclosed as held against credit risk as at 31 March includes a small amount of capital held for counterparty credit risk, mainly within the group’s trading businesses. On the basis of materiality, no detail has been provided on this risk in the following analysis.
The table below shows the exposure amounts associated with the credit quality steps and the relevant risk weightings.
Credit quality step
31 March 2017 31 March 2016
ExposureR’million
Exposure after
credit risk mitigation
R’million ExposureR’million
Exposure after
credit risk mitigation
R’million
Central banks and sovereigns
1 46 081 46 032 50 117 50 117
2 – – – –
3 3 619 3 619 626 555
4 – – 146 146
5 – – 302 302
6 – – – –
Institutions original effective maturity of more than three months
1 1 324 1 324 2 111 2 111
2 3 295 2 936 9 890 9 194
3 8 219 7 753 6 369 5 271
4 406 406 222 222
5 – – 766 766
6 – – 3 098 3 098
Short-term claims on institutions
1 2 681 2 681 27 27
2 6 056 6 056 129 129
3 14 653 14 653 13 638 13 581
4 – – – –
5 – – – –
6 – – – –
Corporates
1 1 486 1 451 882 882
2 2 286 1 389 1 620 915
3 9 629 8 098 18 254 9 927
4 412 331 146 146
5 – – – –
6 – – – –
Securitisation positions
1 584 584 – –
2 561 561 126 126
3 506 506 3 494 3 494
4 147 147 65 65
5 – – 188 188
Total rated counterparty exposure 101 945 98 527 112 216 101 262
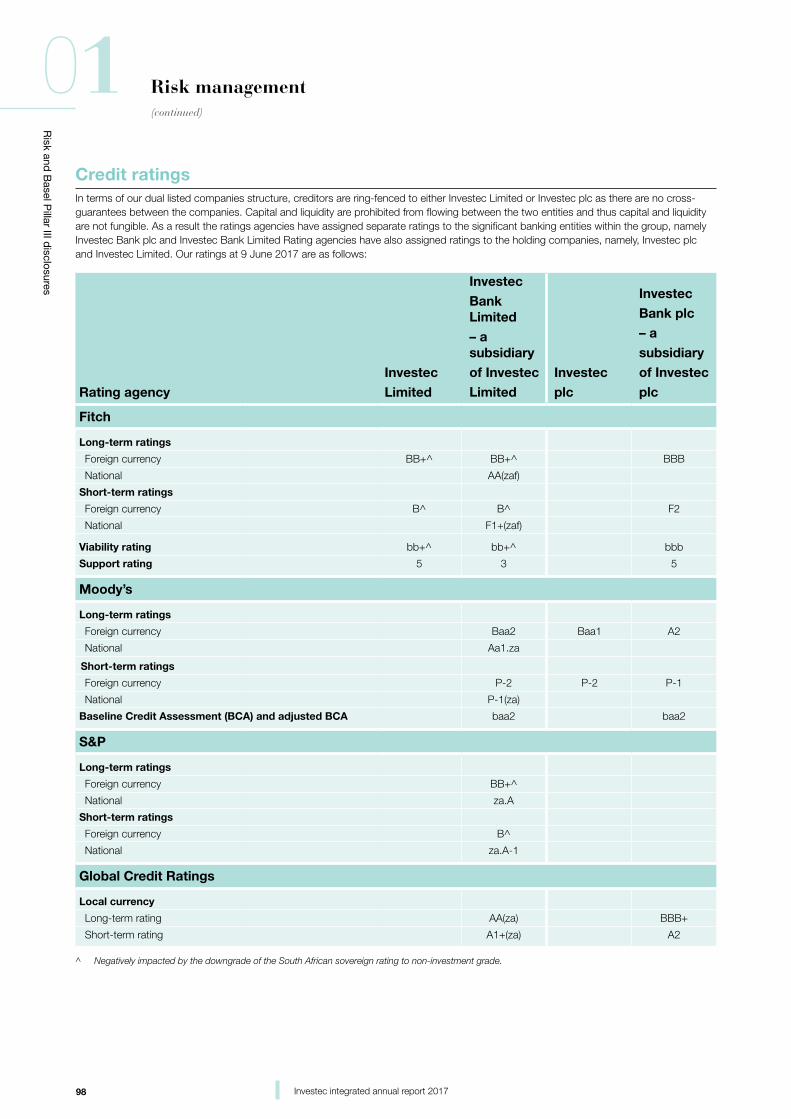
98 Investec integrated annual report 2017
Risk and
Basel P
illar III disclosures
01 Risk management(continued)
Credit ratingsIn terms of our dual listed companies structure, creditors are ring-fenced to either Investec Limited or Investec plc as there are no cross-guarantees between the companies. Capital and liquidity are prohibited from flowing between the two entities and thus capital and liquidity are not fungible. As a result the ratings agencies have assigned separate ratings to the significant banking entities within the group, namely Investec Bank plc and Investec Bank Limited Rating agencies have also assigned ratings to the holding companies, namely, Investec plc and Investec Limited. Our ratings at 9 June 2017 are as follows:
Rating agencyInvestecLimited
Investec Bank Limited – a subsidiaryof InvestecLimited
Investec plc
Investec Bank plc – a subsidiaryof Investec plc
Fitch
Long-term ratings
Foreign currency BB+^ BB+^ BBB
National AA(zaf)
Short-term ratings
Foreign currency B^ B^ F2
National F1+(zaf)
Viability rating bb+^ bb+^ bbb
Support rating 5 3 5
Moody’s
Long-term ratings
Foreign currency Baa2 Baa1 A2
National Aa1.za
Short-term ratings
Foreign currency P-2 P-2 P-1
National P-1(za)
Baseline Credit Assessment (BCA) and adjusted BCA baa2 baa2
S&P
Long-term ratings
Foreign currency BB+^
National za.A
Short-term ratings
Foreign currency B^
National za.A-1
Global Credit Ratings
Local currency
Long-term rating AA(za) BBB+
Short-term rating A1+(za) A2
^ Negatively impacted by the downgrade of the South African sovereign rating to non-investment grade.
99Investec integrated annual report 2017
Risk and
Basel P
illar III disclosures
01Internal Audit
As a result of the regulatory responsibilities arising from the DLC structure, there are two group Internal Audit departments located in London and Johannesburg, responsible for Investec plc and Investec Limited respectively. Investec Bank plc’s (Irish branch) has its own Internal Audit function reporting into Investec plc Internal Audit. In combination, the functions cover all the geographies in which Investec operates. These functions use a global risk-based methodology and cooperate technically and operationally.
The heads of Internal Audit report at each audit committee meeting and have a direct reporting line to the chairman of the audit committee as well as the appropriate chief executive officers. They operate independently of executive management, but have regular access to the local chief executive officers and to business unit executives. The heads of Internal Audit are responsible for coordinating internal audit efforts to ensure coverage is global and departmental skills are leveraged to maximise efficiency. For administrative purposes, the heads of internal audit also report to the global head of corporate governance and compliance. The functions comply with the International Standards for the Professional Practice of Internal Auditing, and are subject to an independent Quality Assurance Review (QAR) at appropriate intervals. The most recent independent QAR benchmarked the functions against the July 2013 publication by the Chartered Institute for Internal Auditors entitled Effective Internal Audit in the Financial Services Sector. The results were communicated to the audit committees in March 2014 and to the respective regulators. A QAR follow-up review was completed and results issued to the audit committees in January 2015 as well as to the respective regulators.
Annually, Internal Audit conducts a formal risk assessment of the entire business from which a comprehensive risk-based audit plan is derived. The assessment and programme are validated by executive management and approved by the responsible audit committee. Very high risk businesses and processes are audited at least every 12 months, with other areas covered at regular intervals based on their risk profile. There is an ongoing focus on identifying fraud risk as well as auditing technology risks given Investec’s dependence on IT systems.
Internal Audit also liaises with the external auditors and other assurance providers to enhance efficiencies in terms of integrated assurance. The annual plan is reviewed regularly to ensure it remains relevant and responsive, given changes in the operating environment. The audit committee approves any changes to the plan.
Significant control weaknesses are reported, in terms of an escalation protocol, to the local assurance forums, where remediation procedures and progress are considered and monitored in detail by management. The audit committee receives a report on significant issues and actions taken by management to enhance related controls. An update on the status of previously raised issues is provided by Internal Audit to each audit committee. If there are concerns in relation to overdue issues, these will be escalated to the executive risk review forum to expedite resolution.
Internal Audit proactively reviews its practices and resources for adequacy and appropriateness to meet an increasingly demanding corporate governance and regulatory environment, including the requirements of King IV in South Africa. The audit teams comprise well-qualified, experienced staff to ensure that the function has the competence to match Investec’s diverse requirements. Where specific specialist skills or additional resources are required, these are obtained from third parties. Internal Audit resources are subject to review by the respective audit committees.
Internal Audit’s activity is governed by an internal audit charter which is approved by the group audit committees and is reviewed annually. The charter defines the purpose, authority and responsibilities of the function

100 Investec integrated annual report 2017
Risk and
Basel P
illar III disclosures
01 Compliance
Regulatory change continues to be a key challenge in the financial sector with global political events adding to uncertainty as to the shape of financial services regulation going forward.
Global regulators remain focused on countering market abuse with heightened scrutiny and regulatory attention in this area. Accordingly, the Market Abuse Regulation (MAR) took effect across the EU on 3 July 2016 in connection with this topic.
This year, global regulators have continued to focus on promoting stability and resilience in financial markets, with sustained emphasis on recovery and resolution plans and structural reforms to the banking sector as well as customer and market conduct related reforms.
Investec remains focused on complying with the highest levels of compliance in relation to regulatory requirements and integrity in each of our jurisdictions. Our culture is central to our compliance framework and is supported by robust policies, processes and talented professionals who ensure that the interests of our customers and shareholders remain at the forefront of everything we do.
Investec plc – year in reviewConduct riskThe FCA has continued to focus on advancing its three operational objectives: securing an appropriate degree of protection for consumers; protecting and enhancing the integrity of the UK financial system; and promoting effective competition in the interest of consumers. The FCA’s aim is to ensure that clients’ interests are at the forefront of firms’ agendas and that their needs are placed at the heart of the firms’ strategy. Firms are also expected to behave appropriately in the wholesale markets in which they operate with a view to conduct risk considerations.
The Investec board, along with senior management are ultimately responsible for Investec’s conduct risk strategy. Investec has continued to focus over the period on delivering good customer outcomes and effectively managing conduct risk throughout our business. This has included continued and ongoing investment in and enhancement of the conduct risk and compliance frameworks in place throughout the group.
Senior managers and certified persons regimeDuring the period Investec Bank plc successfully implemented the core
components of the Senior Managers Regime which came into force on 7 March 2016. From 7 March 2017 the Conduct Rules will be applied to banking sector staff who are not within the Senior Managers or Certification Regime. This regime establishes a new regulatory framework for individuals working in the UK banking sector. The incoming regime consists of three key components:
• A new Senior Managers Regime which will clarify lines of responsibility, and enhance the regulators’ ability to hold senior individuals in banks accountable and require banks to regularly vet their senior managers for fitness and propriety;
• A Certification Regime requiring firms to assess fitness and propriety of staff in positions where the decisions they make could pose significant harm to the bank or any of its customers; and
• A new set of Conduct Rules, which take the form of brief statements of high level principles setting out the standards of behaviour for bank employees.
Investec Bank plc has successfully implemented the core components of the regime which came into force on 7 March 2016.
Consumer protectionThe FCA has continued to pursue its consumer protection objective. Over the period this has included issuing of significant fines and performing continued strategic reviews into areas such as: product design and sales practises, provision of advice, treatment of customers who suffered unauthorised transactions and product and service suitability.
Wholesale marketsThe FCA continues a proactive and assertive approach in identifying and addressing risks arising from firm’s conduct in the wholesale markets.
This has included an increasingly intensive approach to supervisory activities and thematic reviews as well as several high profile referrals to enforcement.
Wholesale markets have also been the focus of significant regulatory reform over the past 12 months. The most significant proposed reforms have included the finalisation of the incoming Markets in Financial Instruments Directive (MIFID II) which is due to be implemented by January 2018 and MAR.
The MIFID II reform package will form a revised framework governing the requirements applicable to investment
firms, trading venues, data reporting service providers and third-country firms providing investment services or activities in the EU. These reforms will drive change across Investec Bank plc, Investec Asset Management and Investec Wealth & Investment. Investec remains on course for implementation by January 2018.
Material reforms also continue to take effect in the OTC markets as a result of the EU’s Market Infrastructure Regulations (EMIR).
Financial crimeFinancial crime continues to be a regulatory focus with regulators globally encouraging firms to adopt a dynamic approach to the management of risk and to increase efforts around systems and controls to combat both money laundering and bribery and corruption. In 2016 the FCA published ‘Our future mission’ in which it states ‘we see financial crime as a risk to the wider economy and market integrity’. The FCA Business Plan 2016/17 also highlights financial crime and anti-money laundering as one of the seven priorities for the regulator.
Tax reporting (FATCA/CRS)The Foreign Account Tax Compliance Act (FATCA) aims to promote cross-border tax compliance by implementing an international standard for the automatic exchange of tax information relating to US investors. The provisions call on tax authorities all over the world to obtain detailed account information from financial institutions relating to US investors and exchange that information automatically with the United States Internal Revenue Service on an annual basis.
The OECD has recently taken further steps to improve global cross-border tax compliance by releasing the Common Reporting Standard (CRS). The CRS is a set of global standards for the annual exchange of financial information by financial institutions pertaining to customers, to the tax authorities of the jurisdictions in which those customers are resident for tax purposes. CRS took effect on 1 January 2016 in the UK, with reporting commencing from 2017.
Investec plc is currently compliant with its obligations.
Investec Limited – year in reviewChanges to the regulatory landscape in South AfricaThe South African financial sector regulatory landscape has been under review for the last few years. A new regulatory structure is developing, and existing legislation is also
101Investec integrated annual report 2017
Risk and
Basel P
illar III disclosures
01Compliance
being amended. The conduct of financial institutions is currently regulated under various pieces of legislation, and by various regulators, these will change under the new regulatory structure set out below.
Conduct risk and consumer protectionThe draft Financial Sector Regulation Bill (Twin Peaks) is at an advanced stage of the Parliamentary process. The National Assembly voted in favour of the Bill at the end of March 2017, before referring the Bill back to the National Assembly. The Bill is expected to be promulgated before the end of the second quarter of 2017, and will result in affected business areas being regulated by the Prudential Authority and the Financial Sector Conduct Authority. The next phase of the regulatory reform will encompass the drafting of the Conduct of Financial Institutions Act (CoFI) and the related conduct standards, which will eventually replace existing consumer protection legislation within the jurisdiction of the Financial Services Board (FSB).
The Financial Advisory and Intermediary Services Act (FAIS) continues to be enforced, with added emphasis on Treating Customers Fairly. This includes the Retail Distribution Review and proposed amendments to FAIS Fit and Proper requirements and Compliance reporting. The Customer and Market Conduct Committee (CMCC) established for Investec Limited as part of the conduct risk framework and chaired by the group CEO, continues to ensure that Investec Limited maintains a client-focused and fair outcomes-based culture. Conduct risk forums across affected legal entities ensure that identified gaps are addressed and business readiness for implementation of new regulatory requirements is assured. Substantial progress has been made in this regard, and the work is ongoing and will remain a focus area.
The SARB conducted an industry-wide review of Foreign Exchange Trading Operations in 2015. The review focused predominantly on market conduct and related governance and controls in respect of Foreign Exchange Trading activity. Post the review and the interrogation of electronic communications of traders for a specific period in 2012, there were no adverse findings reported to the business by the SARB. The FX review conducted by the SARB was an industry initiative which culminated into the SARB Code of Conduct for the South African OTC Markets. Investec Corporate and Institutional Banking has subsequently implemented a Financial Markets Code of Conduct and Bloomberg Vault as a comprehensive tool
for the monitoring of traders’ chat rooms or communications.
The members of the Information Regulator have been appointed by the President on recommendation of the National Assembly with effect from 1 December 2016 for a period of five years. The Information Regulator held its inaugural meeting on 1 December 2016 to commence with its duties and functions including to monitor and enforce compliance with the Protection of Personal Information Act (PoPI) as well as the Promotion of Access to Information Act (PAIA). The Regulator has confirmed that a number of committees have been established for the proper performance of its functions and it is in the process of drafting the Regulations. While only sections relating to the establishment of the Information Regulator and drafting of the regulations are effective, the remaining sections of the Act will be effective once the Regulator is fully operational. Work continues internally in order to meet our obligations in terms of data protection and information management.
Financial crimeFinancial crime continues to be a regulatory focus with amendments to governing legislation proposed for promulgation in early 2017. The South African Treasury Department is under pressure to correct and implement deficiencies in the countries AML CFT regime, identified by the Financial Action Task Force (FATF) during their mutual evaluation review in 2014.
These amendments will change the Anti-Money Laundering and Combatting of Financing of Terrorism (AML CFT) regulatory framework from a rules-based to a risk-based approach, allowing accountable institutions to determine their own risk appetite in relation to client identification and verification. Further changes include the identification and verification of Ultimate Beneficial Ownership structures (UBO), widening the current Political Exposed Person’s definition and extending the reporting obligations to all cross border transactions in or out of the Republic of South Africa. Additionally the Financial Action Task Force Recommendation 16 requires all banks to screen full originator and beneficiary details effective June 2017. These changes are aimed at aligning both FATF global standards to country specific requirements which are a key focus area for South Africa in 2017.
The South African Electronic Funds Transfer (EFT) Clearing system currently does not make provision for capturing of full originator and beneficiary information which necessitated two industry initiatives namely
the Modernisation of Credits and SADC EFT Projects to align payment platforms on an industry-wide basis. Investec is participating as a member bank to ensure that compliance requirements can be met in the shortest possible timeframe.
In response to the 2015 SARB Anti-Money Laundering review and sanction, Investec has subsequently focused on further strengthening the control environment, in order to enhance the current systems, processes and resources, to ensure the complete capturing of customer and related party information and to meet the regulatory reporting obligations.
Regulatory scrutiny continues and Investec is applying ongoing focus to ensure that adequate systems processes and human capital is available to continually strengthen its control environment in order to meet its regulatory obligations.
Tax reporting (FATCA/CRS)South Africa and Mauritius have intergovernmental agreements in place with the USA and each have enacted local law/regulation to implement FATCA locally. This allows South Africa and Mauritius to be treated as participating countries. This means that financial institutions in these countries report information annually on US clients (or non-compliant clients) to the South African Revenue Services and the local Mauritian authority respectively. These authorities in turn exchange information with the USA which reciprocates with similar information (on South African and Mauritian tax residents respectively who hold financial accounts in the US). Both South Africa and Mauritius are in the process of preparing their 3rd annual FATCA reports.
With South Africa being an ‘early adopter’ of the OECD’s Common Reporting Standard (CRS), (the global version of FATCA), these requirements became effective in South Africa on 1 March 2016. South Africa has also opted for the wider approach’ which means all South African reporting financial institutions are required to collect tax-related information on all clients, rather than only in respect of the 55 countries which have currently opted into CRS. Consistent with the FATCA reporting regime, CRS reportable information is submitted to SARS annually. SARS then exchanges this information with relevant countries in return for reciprocal information on South Africans with financial accounts in those countries. South Africa is in the process of preparing its 1st annual CRS report.
Mauritius has indicated that it will opt into CRS reporting from 2018.
(continued)

102 Investec integrated annual report 2017
Risk and
Basel P
illar III disclosures
01 Definitions
Adjusted shareholders’ equityRefer to calculation on page 64 in volume one
Cost to income ratio Operating costs divided by operating income (net of depreciation on leased assets). Depreciation on operating leased assets has been netted off against operating income
Core loans and advancesNet loans and advances to customers plus net own originated securitised assets
Refer to calculation on page 35
Dividend coverAdjusted earnings per ordinary share before goodwill and non-operating items divided by dividends per ordinary share
Earnings attributable to ordinary shareholders before goodwill, acquired intangibles and non-operating items (i.e. adjusted earnings)Refer to page 59 in volume three
Adjusted earnings per ordinary share before goodwill, acquired intangibles and non-operating itemsRefer to page 59 in volume three
Effective operational tax rateTax on profit on ordinary activities (excluding non-operating items) divided by
operating profit
Market capitalisationTotal number of shares in issue (including Investec plc and Investec Limited) multiplied by the closing share price of Investec plc on the London Stock Exchange
Net tangible asset value per share Refer to calculation on page 62 in volume one
Non-operating items Reflects profits and/or losses on termination, restructuring or disposal of group operations and acquisitions made
Operating profit Operating income less administrative expenses, impairments for bad and doubtful debts and depreciation of tangible fixed assets. This amount is before goodwill, acquired intangibles and non-operating items
Operating profit per employeeRefer to calculation on page 68 in volume one
Recurring income Net interest income plus net annuity fees and commissions expressed as a percentage of total operating income
Return on average adjusted shareholders’ equity Refer to calculation on page 64 in volume one
Return on average adjusted tangible shareholders’ equity Refer to calculation on page 64 in volume one
Return on risk-weighted assets Adjusted earnings divided by average risk-weighted assets
Risk-weighted assets Is calculated as the sum of risk-weighted assets for Investec plc and Investec Limited (converted into Pounds Sterling) as reflected on page 90
Staff compensation to operating income ratio All employee-related costs expressed as a percentage of operating income
Third party assets under administration Includes third party assets under administration managed by the Wealth & Investment, Asset Management and Property businesses
Total capital resourcesIncludes shareholders’ equity, subordinated liabilities and non-controlling interests
Total equity Total shareholders’ equity including non-controlling interests
Weighted number of ordinary shares in issueThe number of ordinary shares in issue at the beginning of the year increased by shares issued during the year, weighted on a time basis for the period during which they have participated in the income of the group less treasury shares. Refer to calculation on page 59 in volume three

103Investec integrated annual report 2017
Risk and
Basel P
illar III disclosures
01Notes

104 Investec integrated annual report 2017
Risk and
Basel P
illar III disclosures
01 Notes


Specialist Banking Asset Management Wealth & Investment
Investec strategic report incorporating governance, sustainability and the renumeration report
V.2
AR
| 2017
2017
Annual Report
Investec risk and BaselPillar III disclosures reportVolume 2