Embed Size (px)
Citation preview

Specialist Banking
Investec Bank Lim
ited group and company annual financial statem
ents A
R | 2017
2017
Investec Bank Limited Basel Pillar IIIannual disclosure report
Disclosure Report

1Investec Bank Limited Basel Pillar III disclosure report 2017
About this report
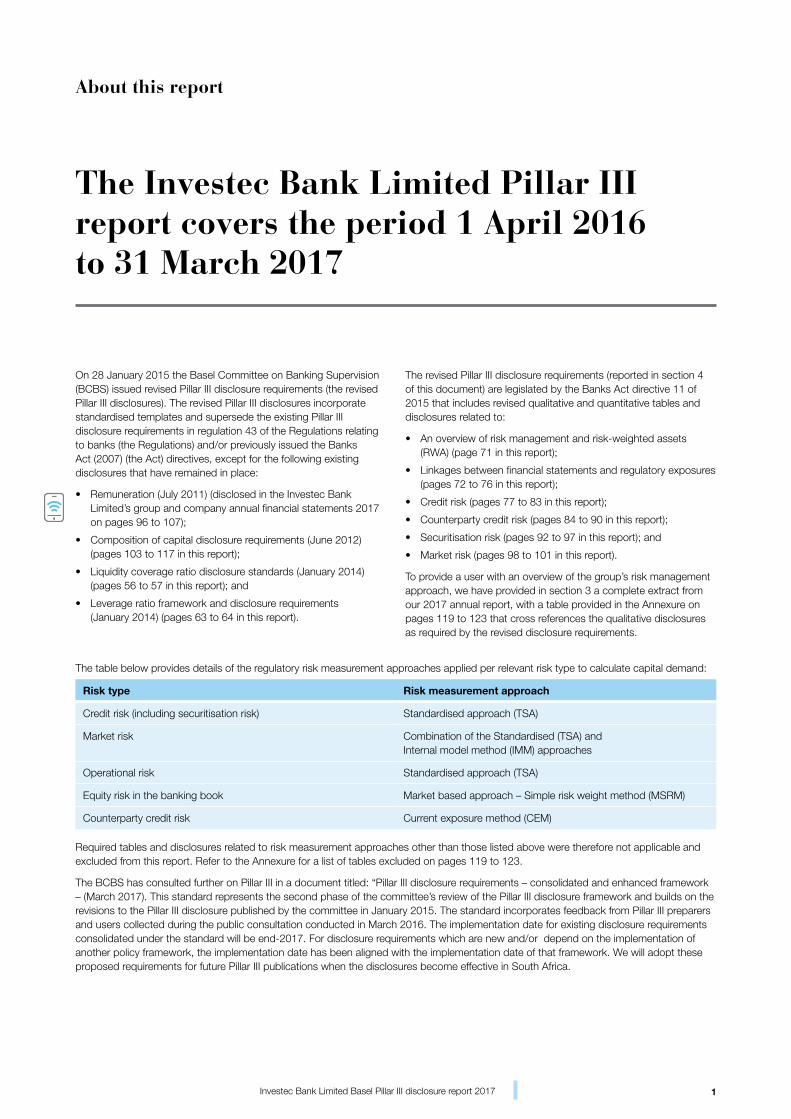
The table below provides details of the regulatory risk measurement approaches applied per relevant risk type to calculate capital demand:
Risk type Risk measurement approach
Credit risk (including securitisation risk) Standardised approach (TSA)
Market risk Combination of the Standardised (TSA) and Internal model method (IMM) approaches
Operational risk Standardised approach (TSA)
Equity risk in the banking book Market based approach – Simple risk weight method (MSRM)
Counterparty credit risk Current exposure method (CEM)
Required tables and disclosures related to risk measurement approaches other than those listed above were therefore not applicable and excluded from this report. Refer to the Annexure for a list of tables excluded on pages 119 to 123.
The BCBS has consulted further on Pillar III in a document titled: “Pillar III disclosure requirements – consolidated and enhanced framework – (March 2017). This standard represents the second phase of the committee’s review of the Pillar III disclosure framework and builds on the revisions to the Pillar III disclosure published by the committee in January 2015. The standard incorporates feedback from Pillar III preparers and users collected during the public consultation conducted in March 2016. The implementation date for existing disclosure requirements consolidated under the standard will be end-2017. For disclosure requirements which are new and/or depend on the implementation of another policy framework, the implementation date has been aligned with the implementation date of that framework. We will adopt these proposed requirements for future Pillar III publications when the disclosures become effective in South Africa.
On 28 January 2015 the Basel Committee on Banking Supervision (BCBS) issued revised Pillar III disclosure requirements (the revised Pillar III disclosures). The revised Pillar III disclosures incorporate standardised templates and supersede the existing Pillar III disclosure requirements in regulation 43 of the Regulations relating to banks (the Regulations) and/or previously issued the Banks Act (2007) (the Act) directives, except for the following existing disclosures that have remained in place:
• Remuneration (July 2011) (disclosed in the Investec Bank Limited’s group and company annual financial statements 2017 on pages 96 to 107);
• Composition of capital disclosure requirements (June 2012) (pages 103 to 117 in this report);
• Liquidity coverage ratio disclosure standards (January 2014) (pages 56 to 57 in this report); and
• Leverage ratio framework and disclosure requirements (January 2014) (pages 63 to 64 in this report).
The Investec Bank Limited Pillar III report covers the period 1 April 2016 to 31 March 2017
The revised Pillar III disclosure requirements (reported in section 4 of this document) are legislated by the Banks Act directive 11 of 2015 that includes revised qualitative and quantitative tables and disclosures related to:
• An overview of risk management and risk-weighted assets (RWA) (page 71 in this report);
• Linkages between financial statements and regulatory exposures (pages 72 to 76 in this report);
• Credit risk (pages 77 to 83 in this report);
• Counterparty credit risk (pages 84 to 90 in this report);
• Securitisation risk (pages 92 to 97 in this report); and
• Market risk (pages 98 to 101 in this report).
To provide a user with an overview of the group’s risk management approach, we have provided in section 3 a complete extract from our 2017 annual report, with a table provided in the Annexure on pages 119 to 123 that cross references the qualitative disclosures as required by the revised disclosure requirements.

2 Investec Bank Limited Basel Pillar III disclosure report 2017
Cross reference tools
1 2 3
Page references
Refers readers to information elsewhere in this report
Website
Indicates that additional information is available on our website: www.investec.com
Audited information
Denotes information in the risk and remuneration reports that forms part of the group’s audited financial statements
3Investec Bank Limited Basel Pillar III disclosure report 2017
Abbreviations
In the sections that follow, the following abbreviations are used on numerous occasions:
ABCP Asset-backed commercial programme
ALCO Asset and liability committee
Anet Represent the adjusted add-on for all contracts subject to the bilateral netting contractBCBS Basel Committee on Banking Supervision
BIS Bank for International Settlements
BoE Bank of England
BOM Bank of Mauritius
BRCC Board risk and capital committee
CCF Credit conversion factor
CCP Central counterparties
CCR Counterparty credit risk
CEM Current exposure method approach related to OTC exposures
CLF Credit liquidity facility
CLN Credit-linked notes
CRM Credit risk mitigation
CVA Credit valuation adjustment
DSIB Domestically significant important bank
E* E star is the amount to which the capital requirements (RW%) are applied to. It is the net credit equivalent amount, after having applied CRM techniques and credit conversion factors (CCF%)
EAD Exposure at default
ECAI Eligible credit assessment institution
ECB European Central Bank
ERRF Executive risk review forum
FCA Financial Conduct Authority
GRCC Group risk and capital committee
HQLA High-quality liquid asset
IBM Investec Bank Mauritius
IRB Internal ratings-based approach
Investec/the group Investec Limited Group (INL)
IMA Internal model approach
ISDA International Swaps and Derivatives Association document that outlines the terms applied to a derivatives transaction between two parties
LCR Liquidity coverage ratio
OTC Over-the-counter derivative exposures
PFE Potential future exposure add-on for OTC derivative exposures
PONV Point of non-viability
Pillar IIB Idiosyncratic risk capital add-on
RW% Risk weight is the factor applied to E* to determine capital requirements demand
RWA Risk-weighted assets
SA-CCR Standardised approach for measuring exposure at default for OTC exposures
SARB South African Reserve Bank
SFT Security financing transactions
SOE State-owned enterprise
The bank Investec Bank Limited Group (IBL)
The Banks Act Banks Act, 1990 (Act No. 94 of 1990) (as amended)
The Regulations Regulations relating to South African banks (12 December 2012)
TSA The standardised approach
VaR Value at risk
4 Investec Bank Limited Basel Pillar III disclosure report 2017
Contents
01 Board-approved disclosure policy 7
02 Independent auditors’ review report 9
03 Risk management
Group risk management objectives 11
Philosophy and approach to risk management 11
Overall summary of the year in review from a risk perspective 11
Group risk appetite 14
An overview of our principal risks 15
Risk management framework, committees and forums 15
Credit and counterparty risk management 16
Investment risk in the banking book 39
Securitisation/structured credit activity exposures 41
Market risk in the trading book 43
Balance sheet risk management 46
Liquidity risk 47
Operational risk 58
Business continuity management 60
Recovery and resolution planning 62
Reputational and strategic risk 62
Legal risk management 62
Conduct risk 63
Capital management and allocation 63
04 Revised quantitative standardised tables and templates
OV1: Overview of RWA 71
LI1: Differences between accounting and regulatory scopes of consolidation and mapping of financial statements with regulatory risk categories 72
LI2: Main sources of differences between regulatory exposure amounts and carrying values in financial statements 76
CR1: Credit quality of assets 77CR2: Changes in stock of defaulted loans and debt securities 78CR3: Credit risk mitigation techniques – overview 79CR4: Standardised approach – credit risk exposure and credit risk mitigation
(CRM) effects 80CR5: Standardised approach – exposures by asset classes and risk weights 82CCR1: Analysis of counterparty credit risk (CCR) exposure by approach 84
5Investec Bank Limited Basel Pillar III disclosure report 2017
01 Board-approved disclosure policy 7
02 Independent auditors’ review report 9
03 Risk management
Group risk management objectives 11
Philosophy and approach to risk management 11
Overall summary of the year in review from a risk perspective 11
Group risk appetite 14
An overview of our principal risks 15
Risk management framework, committees and forums 15
Credit and counterparty risk management 16
Investment risk in the banking book 39
Securitisation/structured credit activity exposures 41
Market risk in the trading book 43
Balance sheet risk management 46
Liquidity risk 47
Operational risk 58
Business continuity management 60
Recovery and resolution planning 62
Reputational and strategic risk 62
Legal risk management 62
Conduct risk 63
Capital management and allocation 63
04 Revised quantitative standardised tables and templates
OV1: Overview of RWA 71
LI1: Differences between accounting and regulatory scopes of consolidation and mapping of financial statements with regulatory risk categories 72
LI2: Main sources of differences between regulatory exposure amounts and carrying values in financial statements 76
CR1: Credit quality of assets 77CR2: Changes in stock of defaulted loans and debt securities 78CR3: Credit risk mitigation techniques – overview 79CR4: Standardised approach – credit risk exposure and credit risk mitigation
(CRM) effects 80CR5: Standardised approach – exposures by asset classes and risk weights 82CCR1: Analysis of counterparty credit risk (CCR) exposure by approach 84
04Revised quantitative standardised tables and templates (continued)
CCR2: Credit valuation adjustment (CVA) capital charge 85
CCR3: Standardised approach of CCR exposures by regulatory portfolio and risk weights 86CCR5: Composition of collateral for CCR exposure 88CCR6: Credit derivatives exposures 89CCR8: Exposures to credit counterparties 90SEC1: Securitisation exposures in the banking book 92SEC3: Securitisation exposures in the banking book and associated capital
requirements – bank acting as originator or as sponsor 94SEC4: Securitisation exposures in the banking book and associated capital
requirements – bank acting as investor 96MR1: Market risk under standardised approach 98MR2: RWA flow statements of market risk exposures under an IMA 99
MR3: IMA values for trading portfolios 100
05 Composition of capital disclosure requirements
Basel III common disclosure template 103
Main features disclosure template 106
06 Annexures 119

01 Board-approved disclosure policy
7
Board
-app
roved d
isclosure policy
01
Investec Bank Limited Basel Pillar III disclosure report 2017
Board-approved disclosure policy
The board of directors (the board) of Investec Bank Limited recognises that effective communication is integral in building stakeholder value and is committed to providing meaningful, transparent, timely and accurate financial and non-financial information to primary stakeholders. The purpose is to help these stakeholders make meaningful assessments and informed investment decisions about Investec Bank Limited and its subsidiaries.
Investec endeavours to:
• present a balanced and understandable assessment of its position by addressing material matters of significant interest and concern;
• highlight the key risks to which it considers itself exposed and its responses to minimise the impact of the risks; and
• show a balance between the positive and negative aspects of the group’s activities, in order to achieve a comprehensive and fair account of its performance.
The board appreciates the importance of ensuring an appropriate balance in meeting the diverse needs and expectations of all the group’s stakeholders and building lasting relationships with them. Investec has developed a framework to ensure that it complies with all relevant public disclosure obligations and to uphold the board’s communication and disclosure philosophy.
The Investor Relations division (IR) is responsible for working with the other divisions in the organisation to ensure that the group meets its various annual, interim and quarterly public reporting/disclosure requirements. IR has a detailed log of all these various disclosure requirements in terms of the Banks Act or other public reporting requirements and due dates for when such disclosures are required to be made public. This log is reviewed on an annual basis.
All public announcements and releases, annual, interim and quarterly disclosures are reviewed and approved by the board and/or appropriate senior management prior to their release. The reports go through a rigorous review and sign-off process by the board, executives, management, internal and external audit.
On an annual basis, members of IR, company secretarial, finance, the executive, board and board sub-committees (where applicable) will assess the appropriateness of all information that is publicly disclosed.
The Pillar III disclosures provided are in line with the requirements of the Basel Committee on Banking Supervision’s standards on revised Pillar III disclosure requirements. These disclosures comprise certain Pillar III disclosures of Investec Bank Limited and its banking subsidiaries on a consolidated basis as required in terms of regulation 43 of the Regulations and/or issued Banks Act directives. The disclosures contained in this report have been reviewed by the external auditors, EY and KPMG. The external auditors have issued an unmodified review conclusion on this report.
The board is satisfied that:
• the information provided in this report was subject to the same level of internal review and internal control processes as the information provided for financial reporting purposes; and
• disclosures in this report have been prepared in accordance with the board-agreed internal control processes related to public disclosures.
David FriedlandChairman of the group board risk and capital committee
30 June 2017

02 Independent auditors’ review report
9Investec Bank Limited Basel Pillar III disclosure report 2017
Indep
endent aud
itors’ review rep
ort
02Independent auditors’ review report
To the directors of Investec Bank LimitedWe have reviewed the Basel Pillar III disclosure report of Investec Bank Limited at and for the year ended 31 March 2017, and the related narrative commentary that supplements the quantitative information provided in this report, as set out on pages 11 to 117 of the Investec Bank Limited Basel Pillar III disclosure report.
Directors’ responsibility for the Basel Pillar 3 disclosureThe directors are responsible for the preparation of the Basel Pillar III disclosure report in accordance with Directive 11/2015 issued in terms of section 6(6) of the Banks Act 94 which makes reference to the Revised Pillar III Disclosure Requirements issued by the Basel Committee on Banking Supervision, and for such internal control as the directors determine is necessary to enable the preparation of the Basel Pillar III disclosure report that are free from material misstatement, whether due to fraud or error. The directors are also responsible for disclosing all interpretations made and judgments applied in the preparation of the Basel Pillar III disclosure report.
Auditors’ responsibilityOur responsibility is to report on the Basel Pillar III disclosure report and to express a conclusion on the disclosure report based on our review. We conducted our review in accordance with International Standard on Review Engagements (“ISRE”) 2410, which applies to a review of historical financial information performed by the independent auditors of the entity.
ISRE 2410 requires us to conclude whether anything has come to our attention that causes us to believe that the Basel Pillar III disclosure report is not prepared, in all material respects, in accordance with the Revised Pillar III Disclosure Requirements issued by the Basel Committee on Banking Supervision. This standard also requires us to comply with relevant ethical requirements.
A review of the Basel Pillar III disclosure report in accordance with ISRE 2410 is a limited assurance engagement. A review includes performing procedures, primarily consisting of making inquiries of management and others within the entity, as appropriate, and applying analytical procedures, and evaluating the evidence obtained.
The procedures performed in a review are substantially less than those performed in an audit conducted in accordance with International Standards on Auditing. Accordingly, we do not express an audit opinion on the Basel Pillar III disclosure report.
ConclusionBased on our review, nothing has come to our attention that causes us to believe that the Basel Pillar III disclosure report of Investec Bank Limited at and for the year ended 31 March 2017 is not prepared, in all material respects, in accordance with the Directive 11/2015 issued in terms of section 6(6) of the Banks Act 94 which makes reference to the Revised Pillar III Disclosure Requirements issued by the Basel Committee on Banking Supervision.
Chief executive: Ajen SitaA full list of directors’ names is available on the websiteA member firm of Ernst & Young Global LimitedCo. Reg. No. 2005/002308/21, VAT reg.no. 4280230949
Policy board Chief executive: TH Hoole
Executive directors: N Dlomu, M Letsitsi, SL Louw, NKS Malaba, M Oddy, M Saloojee, CAT Smit
Other directors: ZH de Beer, LP Fourie, N Fubu, AH Jaffer (chairman of the board), FA Karreem, ME Magondo, AMS Mokgabudi, GM Pickering, JN Pierce, T Rossouw, GCC Smith
The company’s principal place of business is at KPMG Crescent, 85 Empire Road, Parktown, where a list of the directors’ names is available for inspection.
Registration number 1999/021543/21
Ernst & Young Inc.
102 Rivonia RoadSandton, 2146Private Bag X14Sandton, 2146South Africa
Tel: +27 11 772 3000Fax: +27 11 772 4000Docex 123 RandburgWebsite www.ey.com/za
KPMG Inc
KPMG Crescent85 Empire Road, Parktown, 2193Private Bag 9, Parkview, 2122, South Africa
Telephone +27 (0)11 647 7111Fax +27 (0)11 647 8000Docex 472 Johannesburg
Ernst &Young Inc.Registered AuditorPer Farouk MohideenChartered Accountant (SA)Registered AuditorDirector102 Rivonia RoadSandtonPrivate Bag X14Sandton 2196Johannesburg30 June 2017
KPMG Inc.Registered AuditorPer Peter MacDonaldChartered Accountant (SA)Registered AuditorDirectorKPMG Crescent85 Empire RoadParktown2193Johannesburg30 June 2017

03 Risk management
11
Risk m
anagement
03
Investec Bank Limited Basel Pillar III disclosure report 2017
Risk management
03 Risk management
Group Risk Management objectives are to:• Ensure adherence to our risk
management culture
• Ensure the business operates within the board-approved risk appetite
• Support the long-term sustainability of the group by providing an established, independent framework for identifying, evaluating, monitoring and mitigating risk
• Set, approve and monitor adherence to risk parameters and limits across the group and ensure they are implemented and adhered to consistently
• Aggregate and monitor our exposure across risk classes
• Coordinate risk management activities across the organisation, covering all legal entities and jurisdictions
• Give the boards reasonable assurance that the risks we are exposed to are identified and appropriately managed and controlled
• Run appropriate risk committees, as mandated by the board.
Qualitative and selected quantitative disclosures related to riskThe following risk management section is an extract from the published financial statements of Investec Limited and is the basis in which the group analyses risk tolerance/appetite in relation to its main activities and all significant risks.
Information provided in this section of the Pillar III report incorporates risk disclosures in line with the requirements of IFRS 7, disclosures on capital as required by IAS 1 and existing Pillar III disclosures as required by regulation 43 of the Regulations.
Quantitative risk disclosures, as required by the revised Pillar III disclosure templates, are disclosed in section 4. Qualitative disclosures are disclosed separately from the quantitative disclosures, as it provides the most meaningful basis in which the group analyses risk in relation to its main activities and all significant risks.
Refer to pages 119 to 123 for the map of required qualitative disclosures and the relevant page reference in this document of where the disclosures can be found.
Philosophy and approach to risk managementOur comprehensive risk management process involves identifying, quantifying, managing and mitigating the risks associated with each of our businesses.
Risk awareness, control and compliance are embedded in all our day-to-day activities. As fundamental to our values, we have a strong and embedded risk and capital management culture.
We monitor and control risk exposure through independent credit, market, liquidity, operational, legal risk, internal audit and compliance teams. This approach is core to assuming a tolerable risk and reward profile, helping us to pursue controlled growth across our business.
Group Risk Management operates within an integrated geographical and divisional structure, in line with our management approach, ensuring that the appropriate processes are used to address all risks across the group.
Risk Management units are locally responsive yet globally aware. This helps to ensure that all initiatives and businesses operate within our defined risk parameters and objectives, continually seeking new ways to enhance techniques.
We believe that the risk management systems and processes we have in place are adequate to support our strategy and allow the group to operate within its risk appetite tolerance.
Overall summary of the year in review from a risk perspectiveExecutive management is intimately involved in ensuring stringent management of risk, liquidity, capital and conduct. We continue to seek to achieve an appropriate balance between risk and reward in our business, taking cognisance of all stakeholders’ interests.
Although the operating environment continues to present challenges and political uncertainty, the bank was able to maintain sound asset performance and risk metrics throughout the year in review. We remained within of our risk appetite limits/targets across various risk disciplines, with only a few exceptions that were noted and approved by the board.
Our risk appetite framework as set out on page 14 continues to be assessed in light of prevailing market conditions and group strategy.
Credit riskOur credit exposures are to a select target market comprising high-income and high net worth individuals, established corporates, and medium-sized enterprises. Our risk appetite continues to favour lower risk, income-based lending, with exposures well collateralised and credit risk taken over a short to medium term.
These target clients have remained active during the financial year, and have displayed a level of resilience, seeking out opportunities despite the volatility in the markets.
Our core loan book remains well diversified with commercial rent producing property loans comprising approximately 14% of the book, other lending collateralised by property 3%, high net worth and private client lending 49% and corporate lending 34% (with most industry concentrations well below 5%). Our
12
Risk m
anagement
03(continued)
Investec Bank Limited Basel Pillar III disclosure report 2017
Risk management
focus over the past few years to realign and rebalance our portfolios in line with our risk appetite framework is reflected in the relative changes in asset classes on our balance sheet, showing an increase in private client and corporate and other lending, and a reduction in lending collateralised by property as a proportion of our book.
Net core loans and advances grew by 8.5% to R233 billion at 31 March 2017 with residential owner-occupied, private client lending and corporate portfolios representing the majority of the growth for the financial year in review.
We reported an increase in the level of impairments taken, but remain comfortable with the overall performance of the book, as the credit loss ratio amounts to 0.29%. We reported a moderate increase in defaults which was attributable to a few clients who experienced financial difficulty. We did not however, experience ‘stress’ across the portfolio as these defaults were in unrelated sectors. Increases in interest rates over the past two years have had little impact on the performance of our book, as our target market is less sensitive to the moderate interest rate moves incurred to date. The group has minimal exposure to the agriculture sector in South Africa, and our overall on and off-balance sheet exposure to mining and resources amounts to 3% of our credit and counterparty exposures. Given the weaker growth outlook in South Africa, it is likely that defaults could increase further, although we would still expect our credit loss ratio to remain within our long-term average trend of 30bps to 40bps.
Investment riskWith the backing of external strategic investors, we believe that the IEP Group is better positioned to deliver value and grow. Overall, we remain comfortable with the performance of the major portion of our equity investment portfolios which comprise 3.2% of total assets.
Traded market riskProprietary market risk within our trading portfolio remains modest with value at risk and stress testing scenarios remaining at prudent levels. Potential losses that could arise in our trading book portfolio when stress tested under extreme market conditions (i.e. per extreme value theory) amount to less than 0.1% of total operating income.
We continue to manage a very low level of market risk with 95% one-day VaR at R4.1 million at 31 March 2017. Investec
remains focused on facilitating the near-term demand of our clients and the trading desks benefited from the volatility in the markets during the year. All trading areas have kept market risk exposures at low levels throughout the year.
Balance sheet and liquidity riskWe maintained a strong liquidity position and continued to hold high levels of surplus liquid assets. During the past financial year the liquidity risk profile of the balance sheet has improved. Our total customer deposits grew by 8.5% from R280 billion to R303 billion at 31 March 2017. Our Private Bank and Cash Investments fund raising channels grew deposits grew by 13% to R124 billion over the financial year. Over the same period the wholesale channels remained flat at R179 billion. This included several successful senior unsecured bond issues totalling R4.6 billion. As a result we decreased our reliance on wholesale funding from 60.7% to 59.1% over the financial year.
The impact on our liquidity ratios was positive. The three month average LCR for Investec Bank Limited solo increased from 117.3% to 130.0% which is well above the minimum level of 80% required. By January 2019 the LCR minimum requirement moves to 100% and we remain confident of our ability to comfortably meet and exceed this requirement whilst continuing to meet planned asset growth targets. The NSFR will also have to exceed 100% by January 2018. We are well positioned to meet this regulatory liquidity measure as currently our ratios exceed this requirement.
Capital managementInvestec has continued to maintain a sound balance sheet with a low gearing ratio of 11.6 times and a core loans to equity ratio of 6.6 times. Our current leverage ratio is 7.6%.
We have always held capital well in excess of regulatory requirements and we intend to perpetuate this philosophy. We meet our current internal targets for total capital adequacy and for our common equity tier 1 ratio to be in excess of 10%. Capital continued to grow and we are comfortable that credit growth is in line with our risk appetite framework and supported by sound risk metrics.
We have applied to the SARB for approval of our advanced internal ratings approach (AIRB). Subject to the SARB approval we expect to implement AIRB in 2018 for the purpose of calculating credit risk regulatory capital.
Through the preparation process for the application, Investec has enhanced a number of rating systems and risk quantification models. Since AIRB was operationalised, we have seen significant benefits from using these rating systems in the management of credit risk and the quantification of internal capital. In addition, we are expecting a positive impact on capital ratios in applying this approach.
We believe that a common equity tier 1 ratio in excess of 10% is appropriate for our business, given our sound leverage ratios and we will continue to build our business in a manner that maintains this target.
Conduct, operational and reputational riskWe continue to spend much time and effort focusing on operational, reputational, conduct, recovery and resolution risks. Our customer and market conduct committee continues to ensure that Investec maintains a client-focused and fair outcomes-based culture.
Financial and cybercrime remain high priorities, and Investec continually aims to strengthen its systems and controls in order to meet its regulatory obligations to combat money laundering, bribery and corruption.
Investec’s stress testing framework is well embedded in its operations and is designed to identify and regularly test the bank’s key ‘vulnerabilities under stress’. A fundamental part of the stress testing process is a full and comprehensive analysis of all the group’s material business activities, incorporating views from risk, the business and the executive – a process called the ‘bottom-up’ analysis. Resulting from the ‘bottom-up’ analysis, the Investec-specific stress scenarios are designed to specifically test the unique attributes of the group’s portfolio. The key is to understand the potential threats to our sustainability and profitability and thus a number of risk scenarios have been developed and assessed. These Investec specific stress scenarios form an integral part of our capital planning process. The stress testing process also informs the risk appetite review process and the management of risk appetite limits and is a key risk management tool of the group. This process allows the group to identify underlying risks and manage them accordingly.
Eighteen banks, including Investec Limited, have been cited on allegations of collusion in relation to foreign exchange. Despite seeking further details of what the precise allegations are against us, we have not
13
Risk m
anagement
03(continued)
Investec Bank Limited Basel Pillar III disclosure report 2017
Risk management
yet received the relevant information. The Competition Commission’s case against Investec Limited is confined to the alleged conduct of a single trader. This particular trader dealt with interbank clients. Revenue from forex trading activities has averaged below 1% of the South African bank’s total revenues over the past 10 years. At Investec, sound corporate governance is embedded in our values, culture, processes, functions and organisational structure. Our values require, inter alia, that employees behave with integrity and treat customers fairly. Investec does not tolerate any behaviour in contravention of its value system, the law or regulatory requirements including the Competition Act, the FX Market Code of Conduct or the applicable internal Investec policies. Investec actively monitors compliance with
these requirements including compliance with the relevant South African Reserve Bank Code of Conduct with respect to, inter alia, conducting over-the-counter and FX transactions.
Following the recent South African government cabinet reshuffle and change of Finance Minister, S&P downgraded South Africa’s sovereign foreign currency credit rating by two notches to BB+ with a negative outlook and the local currency rating was lowered by one notch to BBB- with a negative outlook. Fitch downgraded South Africa’s foreign currency and local currency ratings to BB+ with a stable outlook. Moody’s announced that South Africa had been placed on review for a downgrade and they are still in a window period to announce a decision. Following
the sovereign downgrade, the larger local banks together with Investec Bank Limited’s long-term foreign currency ratings were also downgraded and are now Baa2 from Moody’s and BB+ from Fitch and S&P.
The board, through the group’s various risk and capital committees, continued to assess the impact of its principal risks and the abovementioned stress scenarios on the business. The board has concluded that the bank has robust systems and processes in place to manage these risks, and that while under a severe stress scenario business activity would be subdued, the bank would continue to maintain adequate liquidity and capital balances to support the continued operation of the bank.
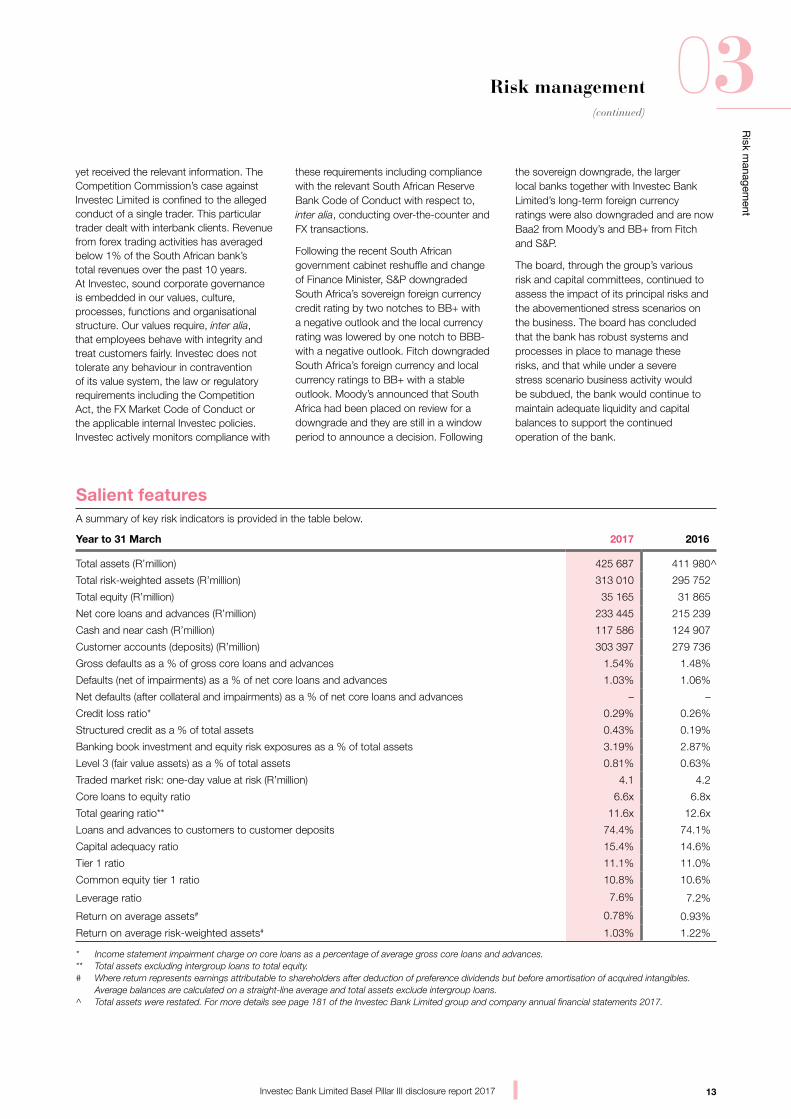
Salient featuresA summary of key risk indicators is provided in the table below.
Year to 31 March 2017 2016
Total assets (R’million) 425 687 411 980^
Total risk-weighted assets (R’million) 313 010 295 752
Total equity (R’million) 35 165 31 865
Net core loans and advances (R’million) 233 445 215 239
Cash and near cash (R’million) 117 586 124 907
Customer accounts (deposits) (R’million) 303 397 279 736
Gross defaults as a % of gross core loans and advances 1.54% 1.48%
Defaults (net of impairments) as a % of net core loans and advances 1.03% 1.06%
Net defaults (after collateral and impairments) as a % of net core loans and advances – –
Credit loss ratio* 0.29% 0.26%
Structured credit as a % of total assets 0.43% 0.19%
Banking book investment and equity risk exposures as a % of total assets 3.19% 2.87%
Level 3 (fair value assets) as a % of total assets 0.81% 0.63%
Traded market risk: one-day value at risk (R’million) 4.1 4.2
Core loans to equity ratio 6.6x 6.8x
Total gearing ratio** 11.6x 12.6x
Loans and advances to customers to customer deposits 74.4% 74.1%
Capital adequacy ratio 15.4% 14.6%
Tier 1 ratio 11.1% 11.0%
Common equity tier 1 ratio 10.8% 10.6%
Leverage ratio 7.6% 7.2%
Return on average assets# 0.78% 0.93%
Return on average risk-weighted assets# 1.03% 1.22%
* Income statement impairment charge on core loans as a percentage of average gross core loans and advances.** Total assets excluding intergroup loans to total equity.# Where return represents earnings attributable to shareholders after deduction of preference dividends but before amortisation of acquired intangibles.
Average balances are calculated on a straight-line average and total assets exclude intergroup loans.^ Total assets were restated. For more details see page 181 of the Investec Bank Limited group and company annual financial statements 2017.
14
Risk m
anagement
03(continued)
Investec Bank Limited Basel Pillar III disclosure report 2017
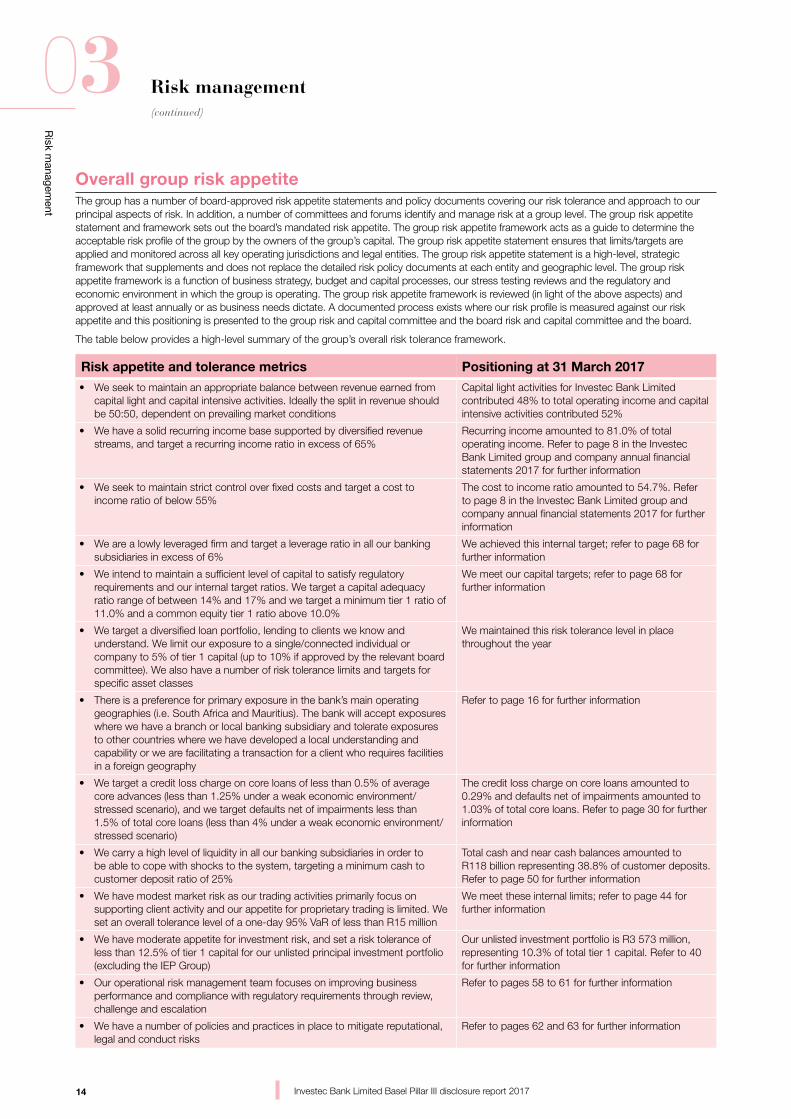
Overall group risk appetiteThe group has a number of board-approved risk appetite statements and policy documents covering our risk tolerance and approach to our principal aspects of risk. In addition, a number of committees and forums identify and manage risk at a group level. The group risk appetite statement and framework sets out the board’s mandated risk appetite. The group risk appetite framework acts as a guide to determine the acceptable risk profile of the group by the owners of the group’s capital. The group risk appetite statement ensures that limits/targets are applied and monitored across all key operating jurisdictions and legal entities. The group risk appetite statement is a high-level, strategic framework that supplements and does not replace the detailed risk policy documents at each entity and geographic level. The group risk appetite framework is a function of business strategy, budget and capital processes, our stress testing reviews and the regulatory and economic environment in which the group is operating. The group risk appetite framework is reviewed (in light of the above aspects) and approved at least annually or as business needs dictate. A documented process exists where our risk profile is measured against our risk appetite and this positioning is presented to the group risk and capital committee and the board risk and capital committee and the board.
The table below provides a high-level summary of the group’s overall risk tolerance framework.
Risk appetite and tolerance metrics Positioning at 31 March 2017
• We seek to maintain an appropriate balance between revenue earned from capital light and capital intensive activities. Ideally the split in revenue should be 50:50, dependent on prevailing market conditions
Capital light activities for Investec Bank Limited contributed 48% to total operating income and capital intensive activities contributed 52%
• We have a solid recurring income base supported by diversified revenue streams, and target a recurring income ratio in excess of 65%
Recurring income amounted to 81.0% of total operating income. Refer to page 8 in the Investec Bank Limited group and company annual financial statements 2017 for further information
• We seek to maintain strict control over fixed costs and target a cost to income ratio of below 55%
The cost to income ratio amounted to 54.7%. Refer to page 8 in the Investec Bank Limited group and company annual financial statements 2017 for further information
• We are a lowly leveraged firm and target a leverage ratio in all our banking subsidiaries in excess of 6%
We achieved this internal target; refer to page 68 for further information
• We intend to maintain a sufficient level of capital to satisfy regulatory requirements and our internal target ratios. We target a capital adequacy ratio range of between 14% and 17% and we target a minimum tier 1 ratio of 11.0% and a common equity tier 1 ratio above 10.0%
We meet our capital targets; refer to page 68 for further information
• We target a diversified loan portfolio, lending to clients we know and understand. We limit our exposure to a single/connected individual or company to 5% of tier 1 capital (up to 10% if approved by the relevant board committee). We also have a number of risk tolerance limits and targets for specific asset classes
We maintained this risk tolerance level in place throughout the year
• There is a preference for primary exposure in the bank’s main operating geographies (i.e. South Africa and Mauritius). The bank will accept exposures where we have a branch or local banking subsidiary and tolerate exposures to other countries where we have developed a local understanding and capability or we are facilitating a transaction for a client who requires facilities in a foreign geography
Refer to page 16 for further information
• We target a credit loss charge on core loans of less than 0.5% of average core advances (less than 1.25% under a weak economic environment/stressed scenario), and we target defaults net of impairments less than 1.5% of total core loans (less than 4% under a weak economic environment/stressed scenario)
The credit loss charge on core loans amounted to 0.29% and defaults net of impairments amounted to 1.03% of total core loans. Refer to page 30 for further information
• We carry a high level of liquidity in all our banking subsidiaries in order to be able to cope with shocks to the system, targeting a minimum cash to customer deposit ratio of 25%
Total cash and near cash balances amounted to R118 billion representing 38.8% of customer deposits. Refer to page 50 for further information
• We have modest market risk as our trading activities primarily focus on supporting client activity and our appetite for proprietary trading is limited. We set an overall tolerance level of a one-day 95% VaR of less than R15 million
We meet these internal limits; refer to page 44 for further information
• We have moderate appetite for investment risk, and set a risk tolerance of less than 12.5% of tier 1 capital for our unlisted principal investment portfolio (excluding the IEP Group)
Our unlisted investment portfolio is R3 573 million, representing 10.3% of total tier 1 capital. Refer to 40 for further information
• Our operational risk management team focuses on improving business performance and compliance with regulatory requirements through review, challenge and escalation
Refer to pages 58 to 61 for further information
• We have a number of policies and practices in place to mitigate reputational, legal and conduct risks
Refer to pages 62 and 63 for further information
Risk management
15
Risk m
anagement
03(continued)
Investec Bank Limited Basel Pillar III disclosure report 2017
Risk management
An overview of our principal risksIn our daily business activities, the group enters into a number of risks that could have the potential to affect our business operations or financial performance and prospects.
These principal risks have been highlighted on page 16 of the Investec Bank Limited group and company annual financial statements 2017.
The sections that follow provide information on a number of these risk areas and how the group manages these risks.
Additional risks and uncertainties that are currently considered immaterial and not included in this report may in the future impact our business operations and financial performance.
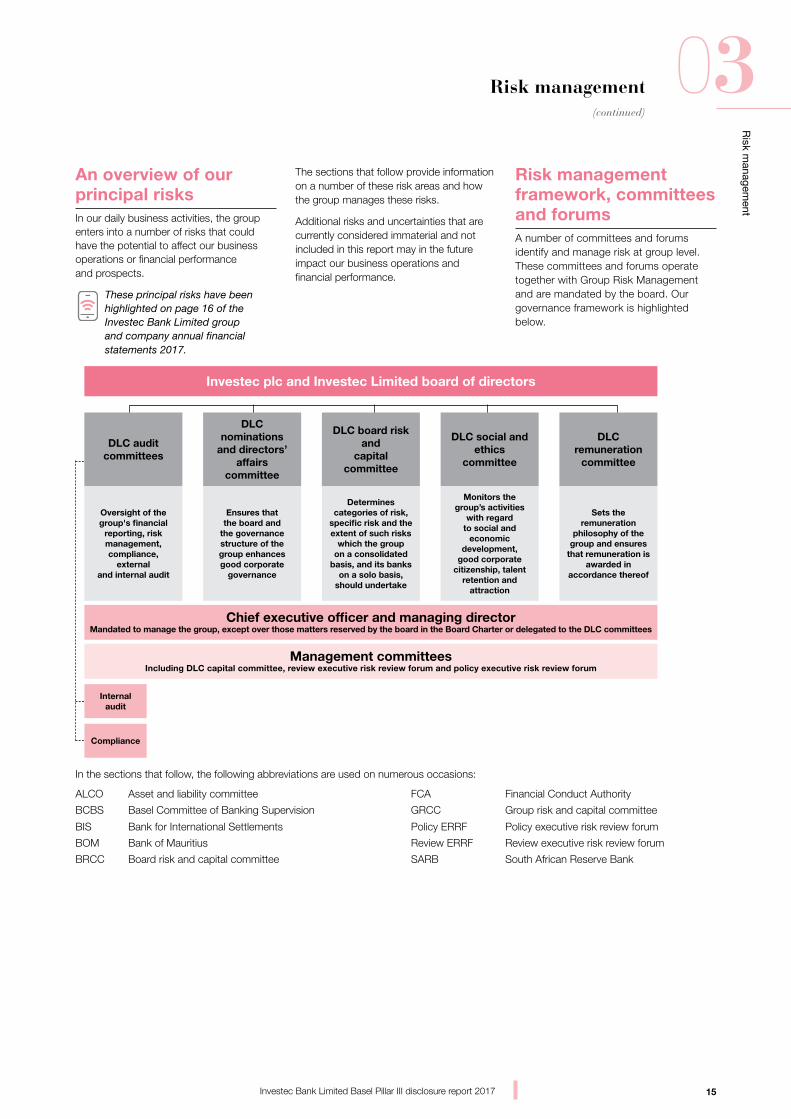
Risk management framework, committees and forumsA number of committees and forums identify and manage risk at group level. These committees and forums operate together with Group Risk Management and are mandated by the board. Our governance framework is highlighted below.
In the sections that follow, the following abbreviations are used on numerous occasions:
ALCO Asset and liability committee FCA Financial Conduct Authority
BCBS Basel Committee of Banking Supervision GRCC Group risk and capital committee
BIS Bank for International Settlements Policy ERRF Policy executive risk review forum
BOM Bank of Mauritius Review ERRF Review executive risk review forum
BRCC Board risk and capital committee SARB South African Reserve Bank
Compliance
Internalaudit
Investec plc and Investec Limited board of directors
DLC audit committees
DLC nominations
and directors’ affairs
committee
DLC board risk and
capital committee
DLC social and ethics
committee
DLC remuneration
committee
Oversight of thegroup's financial
reporting, riskmanagement,compliance,
externaland internal audit
Ensures that the board and
the governance structure of the group enhances good corporate
governance
Determines categories of risk,
specific risk and the extent of such risks
which the group on a consolidated
basis, and its banks on a solo basis,
should undertake
Monitors the group’s activities
with regard to social and
economic development,
good corporate citizenship, talent
retention and attraction
Sets the remuneration
philosophy of thegroup and ensures
that remuneration isawarded in
accordance thereof
Chief executive officer and managing director Mandated to manage the group, except over those matters reserved by the board in the Board Charter or delegated to the DLC committees
Management committees Including DLC capital committee, review executive risk review forum and policy executive risk review forum
16
Risk m
anagement
03(continued)
Investec Bank Limited Basel Pillar III disclosure report 2017
Credit and counterparty risk management
Credit and counterparty risk description Credit and counterparty risk is defined as the risk arising from an obligor’s (typically a client or counterparty) failure to meet the terms of any agreement. Credit and counterparty risk arises when funds are extended, committed, invested, or otherwise exposed through contractual agreements, whether reflected on- or off-balance sheet.
Credit and counterparty risk arises primarily from three types of transactions:
• Lending transactions through loans and advances to clients and counterparties creates the risk that an obligor will be unable or unwilling to repay capital and/or interest on loans and advances granted to them. This category includes bank placements, where we have placed funds with other financial institutions
• Issuer risk on financial instruments where payments due from the issuer of a financial instrument may not be received
• Trading transactions, giving rise to settlement and replacement risk (collectively counterparty risk):
– Settlement risk is the risk that the settlement of a transaction does not take place as expected, with one party effecting required settlements as they fall due but not receiving the performance to which they are entitled
– Replacement risk is the risk following defaults by the original counterparty resulting in the contract holder having to enter into a replacement contract with a second counterparty in order to fulfil the transaction.
The relevant credit committees within Investec will also consider wrong-way risk at the time of granting credit limits to each counterparty. In the banking book environment, wrong-way risk occurs where the value of collateral to secure a transaction, or guarantor, is positively correlated with the probability of default of the borrower or counterparty. For counterparty credit risk resulting from transactions in traded products (such as
OTC derivatives), wrong-way risk is defined as exposure to a counterparty that is adversely correlated with the credit quality of that counterparty. It arises when default risk and credit exposure increase together.
Credit and counterparty risk may also arise in other ways and it is the role of the global risk management functions and the various independent credit committees to identify risks falling outside these definitions.
Credit and counterparty risk governance structure To manage, measure, monitor and mitigate credit and counterparty risk, independent credit committees exist in each geography where we assume credit risk. These committees operate under board-approved delegated limits, policies and procedures. There is a high level of executive involvement and non-executive review and oversight in the credit decision-making forums. It is our policy that all centralised credit committees are comprised of voting members who are independent of the originating business unit. All decisions to enter into a transaction are based on unanimous consent.
In addition to the group credit committee, the following processes assist in managing, measuring and monitoring credit and counterparty risk:
• Day-to-day arrears management and regular arrears reporting ensure that individual positions and any potential trends are dealt with in a timely manner
• Watchlist committees, which review the management of distressed loans, potential problem loans and exposures in arrears that require additional attention and supervision
• Corporate watchlist forum, which reviews and manages exposures that may potentially become distressed as a result of changes in the economic environment or adverse share price movements, or that are vulnerable to volatile exchange rate or interest rate movements or idiosyncratic financial distress
• Arrears, default and recoveries forum which specifically reviews and manages distressed loans and potentially distressed loans for private clients. This forum also reviews and monitors counterparties who have been granted forbearance measures.
Credit and counterparty risk appetiteThere is a preference for primary exposure in the bank’s main operating geography (i.e. South Africa). The bank will accept exposures where we have a branch or local banking subsidiary and tolerate exposures to other countries where we have a developed and local understanding and capability or we are facilitating a transaction for a client who requires facilities in a foreign geography.
Our assessment of our clients and counterparties includes consideration of their character and integrity, core competencies, track record and financial strength. A strong emphasis is placed on the historic and ongoing stability of income and cash flow streams generated by the clients. Our primary assessment method is therefore the ability of the client to meet their payment obligations.
We have little appetite for unsecured debt and require good quality collateral in support of obligations (refer to page 38 for further information).
Target clients include high net worth and/or high-income individuals, professionally qualified individuals, established corporates, small and medium enterprises, financial institutions and sovereigns. Corporates must have scale and relevance in their market, an experienced management team, able board members, strong earnings and cash flow.
We are client-centric in our approach and originate loans with the intent of holding these assets to maturity, thereby developing a ‘hands-on’ and long-standing relationship.
Interbank lending is largely reserved for those banks and institutions in the group’s core geographies of activity which are systemic and highly rated. Direct exposures to cyclical industries and start-up ventures are generally avoided.
Country riskCountry risk refers to the risk of lending to a counterparty operating in a particular country or the risk inherent in sovereign exposure i.e. the risk of exposure to loss caused by events in other countries. Country risk covers all
Risk management
17
Risk m
anagement
03(continued)
Investec Bank Limited Basel Pillar III disclosure report 2017
Risk management
forms of lending or investment activity whether to/with individuals, corporates, banks or governments. This can include geopolitical risks, transfer and convertibility risks, and the impact on the borrower’s credit profile due to local economic and political conditions.
To mitigate country risk, there is a preference for primary exposure in the group’s main operating geographies. The group will accept exposures where we have a branch or local banking subsidiary, and tolerate exposures to other countries where we are facilitating a transaction for a client who requires facilities in a foreign geography and where we have developed a local understanding and capability.
Investec’s credit risk appetite with regard to country risk is characterised by the following principles:
• Preference is to have exposure only to politically stable jurisdictions that we understand and have preferably operated in before
• There is no specific appetite for exposures outside of the group’s pre-existing core geographies or target markets
• The legal environment should be tested, have legal precedent in line with OECD standards and have good corporate governance
• In certain cases, country risk can be mitigated by taking out political risk insurance with suitable counterparties, where deemed necessary and where considered economic.
While we do not have a separate country risk committee, the relevant credit committees as well as investment committees and Policy ERRF will consider, analyse and assess the appropriate limits to be recorded when required, to assume exposure to foreign jurisdictions.
Concentration risk Concentration risk is when large exposures exist to a single client or counterparty, group of connected counterparties, or to a particular geography, asset class or industry. An example of this would be where a number of counterparties are affected by similar economic, legal, regulatory or other factors that could mean their ability to meet contractual obligations are correlated.
Concentration risk can also exist where portfolio loan maturities are clustered to single periods in time. Loan maturities are monitored on a portfolio and a transaction
level by Group Risk Management, Group Lending Operations as well as the originating business units.
Credit and counterparty risk is always assessed with reference to the aggregate exposure to a single counterparty or group of related parties to manage concentration risk.
Risk appetite The board has set a group risk appetite limit framework which regulates the maximum exposures we would be comfortable to tolerate in order to diversify and mitigate risk. This limit framework is monitored on an ongoing basis and reported to the GRCC and BRCC on a regular basis. Should there be any breaches to limits, or where exposures are nearing limits, these exceptions are specifically highlighted for attention, and any remedial actions are agreed.
Corporate responsibility considerationsInvestec has a holistic approach to corporate responsibility, which runs beyond recognising our own footprint on the environment and includes our many corporate social investment activities and our funding and investing activities. This is not merely for business reasons, but based on a broader responsibility to our environment and society. Accordingly, corporate responsibility risk considerations are considered by the business credit committee and investment committee when making lending or investment decisions. There is also oversight by the social and ethics committee (board committee) on social and environmental issues. In particular the following factors are taken into account when a transaction might be approved or declined based on the outcome of the corporate responsibility considerations:
• Environmental considerations (including animal welfare and climate – related impacts)
• Social considerations (including Human Rights)
• Macro-economic considerations.
Refer to our corporate responsibility report on our website.
Management and measurement of credit and counterparty risk Fundamental principles employed in the management of credit and counterparty risk are:
• A clear definition of our target market
• A quantitative and qualitative assessment of the creditworthiness of our counterparties
• Analysis of risks, including concentration risk (concentration risk considerations include asset class, industry, counterparty and geographical concentration)
• Decisions are made with reference to risk appetite limits
• Prudential limits
• Regular monitoring and review of existing and potential exposures once facilities have been approved
• A high level of executive involvement in decision-making with non-executive review and oversight.
Regular reporting of credit and counterparty risk exposures within our operating units is made to management, the executives and the board at the GRCC and BRCC. The board regularly reviews and approves the appetite for credit and counterparty risk, which is documented in risk appetite statements and policy documents. This is implemented and reviewed by Group Credit.
Despite strict adherence to the above principles, increased default risk may arise from unforeseen circumstances particularly in times of extreme market volatility and weak economic conditions.
A large proportion of the bank’s portfolio is not rated by external rating agencies. We place reliance upon internal consideration of counterparties and borrowers, and use ratings prepared externally where available as support in our decision-making process. Within the credit approval process, internal and external ratings are included in the assessment of the client quality.
The group applies the standardised approach for calculating capital requirements in the assessment of its credit and counterparty exposures. The group’s banking subsidiaries conduct their mapping of credit and counterparty exposures in accordance with the mapping procedures specified by the Central Bank,
18
Risk m
anagement
03(continued)
Investec Bank Limited Basel Pillar III disclosure report 2017
in the respective geographies in which the group operates.
Exposures are classified to reflect the bank’s risk appetite and strategy. In our Pillar III disclosure, exposures are classified according to the Basel asset classes which include sovereign, bank, corporate, retail, equity, securitisation and specialised lending (which is further categorised into project finance; commodities finance; high volatility commercial real estate; and income-producing commercial real estate).
S&P, Moody’s and Global Credit Ratings have been nominated as eligible External Credit Assessment institutions (ECAIs) for the purposes of determining external credit ratings. The following elections have been made:
• In relation to sovereigns and securitisations, Moody’s, S&P and Global Credit Ratings have been selected by Investec as eligible ECAIs
• In relation to banks, corporates and debt securities, Moody’s and S&P are recognised as eligible ECAIs
• If two assessments are available, the more conservative will apply
• Where there are three or more credit ratings with different risk weightings, the credit ratings corresponding to the two lowest ratings should be referred to and the higher of those two ratings should be applied.
Internal credit rating models continue to be developed to cover all material asset classes. The advanced internal ratings approach (AIRB) is subject to supervisory approval to adopt the approach for our credit portfolio. Application for approval was submitted to the SARB in August 2016. Subject to formal approval from the SARB it is expected that the bank will implement AIRB by 2018 in the calculation of credit risk regulatory capital.
Through the preparation process for the application Investec has enhanced a number of its rating systems and risk quantification models. Since AIRB was operationalised we have seen significant benefits from using these rating systems in the quantification, management of credit risk and usage for internal capital. In addition we are expecting a positive impact on capital ratios.
Stress testing and portfolio managementInvestec has embedded its stress testing framework which is a repeatable stress
testing process, designed to identify and regularly test the bank’s key ‘vulnerabilities under stress’.
Investec-specific stress scenarios are designed to specifically test the unique attributes of the bank’s portfolio.
These Investec-specific stress scenarios form an integral part of our capital planning process. This process allows the bank to identify underlying risks and manage them accordingly.
Notwithstanding the form of the stress testing process, the framework should not impede the group from being able to be flexible and perform ad hoc stress tests, which by their nature need to be completed on request and in response to emerging risk issues.
Credit and counterparty risk – nature of activitiesCredit and counterparty risk is assumed through a range of client-driven lending activities to private and corporate clients and other counterparties, such as financial institutions and sovereigns. These activities are diversified across a number of business activities.
Lending collateralised by propertyClient quality and expertise are at the core of our credit philosophy. Our exposure to the property market is well diversified with strong bias towards prime locations for residential exposure and focus on tenant quality for commercial assets. Debt service cover ratios are a key consideration in the lending process supported by reasonable loan to security value ratios.
We provide senior debt and other funding for property transactions, with a strong preference for income producing assets supported by an experienced sponsor providing a material level of cash equity investment into the asset.
An analysis of the lending collateralised by property portfolio and asset quality information is provided on pages 36 to 37.
Private client activitiesOur private banking activities target high net worth individuals, active wealthy entrepreneurs, high-income professionals, newly qualified professionals with high-income earning potential, self-employed entrepreneurs, owner managers in small to mid-cap corporates and sophisticated investors.
Lending products are tailored to meet the requirements of our clients. Central to our credit philosophy is ensuring the sustainability of cash flow and income throughout the cycle. As such, the client base has been defined to include high net worth clients (who, through diversification of income streams, will reduce income volatility) and individuals with a profession which has historically supported a high and sustainable income stream irrespective of the stage in the economic cycle.
Credit risk arises from the following activities:
• Personal Banking delivers products to enable target clients to create and manage their wealth. This includes private client mortgages, transactional banking, high net worth lending, offshore banking and foreign exchange
• Residential Mortgages provides mortgage loan facilities for high-income professionals and high net worth individuals tailored to their individual needs
• Specialised Lending provides tailored credit facilities to high net worth individuals and their controlled entities
• Portfolio Lending provides loans to high net worth clients against their investment portfolio, typically managed by Investec Wealth & Investment.
An analysis of the private client loan portfolio and asset quality information is provided on pages 36 to 37.
Corporate client activities
We focus on traditional client-driven corporate lending activities, in addition to customer flow related treasury and trading execution services.
Within the corporate lending businesses, credit risk can arise from corporate loans, acquisition finance, asset finance, power and infrastructure finance, asset-based lending, fund finance and resource finance. We also undertake debt origination activities for corporate clients.
The Credit Risk Management functions approve specific credit and counterparty limits that govern the maximum credit exposure to each individual counterparty. In addition, further risk management limits exist through industry and country limits to manage concentration risk. The credit appetite for each counterparty
Risk management
19
Risk m
anagement
03(continued)
Investec Bank Limited Basel Pillar III disclosure report 2017
Risk management
is based on the financial strength of the principal borrower, its business model and market positioning, the underlying cash flow to the transaction, the substance and track record of management, and the security package. Political risk insurance, and other insurance is taken where they are deemed appropriate.
Investec has limited appetite for unsecured credit risk and facilities are typically secured on the assets of the underlying borrower as well as shares in the borrower.
A summary of the nature of the lending and/or credit risk assumed within some of the key areas within our corporate lending business is provided below:
• Corporate Loans: provides senior secured loans to mid-to-large cap companies. Credit risk is assessed against debt serviceability based upon robust cash generation of the business based on both historical and forecast information. We typically act as transaction lead or arranger, and have a close relationship with management and sponsors
• Corporate Debt Securities: these are tradable corporate debt instruments, based on acceptable credit fundamentals typically with a medium-term hold strategy where the underlying risk is to South African corporates. This is a highly diversified, granular portfolio that is robust, and spread across a variety of geographies and industries
• Acquisition Finance: provides debt funding to proven management teams and sponsors, running small to mid-cap sized companies. Credit risk is assessed against debt serviceability based upon robust cash generation of the business based on both historical and forecast information. This will be based on historic and forecast information. We typically lend on a bilateral basis and benefit from a close relationship with management and sponsors
• Asset Based Lending: provides working capital and secured corporate loans to mid-caps. These loans are secured by the assets of the business, for example, the accounts receivable, inventory and, plant and machinery. In common with our corporate lending activities, strong emphasis is placed on supporting companies with scale and relevance in their industry, stability of cash flow, and experienced management
• Fund Finance: provides debt facilities to asset managers and fund vehicles, principally in private equity. The geographical focus is in South Africa where the bank can support experienced asset managers and their funds which show strong, long-term value creation and good custodianship of investors’ money. Debt facilities to fund vehicles are secured against undrawn limited partner commitments and/or the funds underlying assets. Fund manager loans are structured against committed fund management cash flows, the managers’ investment stake in their own funds and when required managers’ personal guarantees
• Small Ticket Asset Finance: provides funding to small and medium-sized corporates to support asset purchases and other business requirements. The portfolio is highly diversified by industry and number of clients and is secured against the asset being financed and is a direct obligation of the company
• Large Ticket Asset Finance: provides the finance and structuring expertise for aircraft and larger lease assets, the majority of which are senior secured loans with a combination of corporate, cash flow and asset-backed collateral against the exposure
• Power and Infrastructure Finance: arranges and provides typically long-term financing for infrastructure assets, in particular renewable and traditional power projects as well as transportation assets, against contracted future cash flows of the project(s) from well-established and financially sound off-take counterparties. There is a requirement for a strong upfront equity contribution from an experienced sponsor
• Resource finance: provides structured hedging solutions mainly within the mining sectors. The underlying commodities are mainly precious and base metals and coal. Our clients in this sector are established mining companies which are typically domiciled and publicly listed in South Africa as well as other countries where we are facilitating a transaction for a client who requires facilities in a foreign geography. All facilities are secured by the borrower’s assets and repaid from mining cash flows. We have reduced our appetite in this sector, particularly for small to mid-cap mining companies
• Structured Credit: these are bonds secured against a pool of assets, mainly UK and European residential mortgages. The bonds are typically investment grade rated, which benefit from a high-level of credit subordination and can withstand a significant level of portfolio defaults
• Treasury Placements: the treasury function, as part of the daily management of the bank’s liquidity, places funds with central banks and other commercial banks and financial institutions. These transactions are typically short term (less than one month) money market placements or secured repurchase agreements. These market counterparties are mainly investment grade rated entities that occupy dominant and systemic positions in their domestic banking markets and internationally
• Customer trading activities to facilitate client lending and hedging: our customer trading portfolio consists of derivative contracts in interest rates, foreign exchange, commodities, credit derivatives and equities that are entered into, to facilitate a client’s hedging requirements. The counterparties to such transactions are typically corporates, in particular where they have an exposure to foreign exchange due to operating in sectors that include imports and exports of goods and services. These positions are marked to market, typically with daily margin calls to mitigate credit exposure in the event of counterparty default.
An analysis of the corporate client loan portfolio and asset quality information is provided on pages 36 to 37.
20
Risk m
anagement
03(continued)
Investec Bank Limited Basel Pillar III disclosure report 2017
Asset quality analysis – credit risk classification and provisioning policy
It is a policy requirement overseen by Credit Risk Management that each operating division makes provision for specific impairments and calculates the appropriate level of portfolio impairments. This is in accordance with established group guidelines and in conjunction with the watchlist committee process. In the annual financial statements, credit losses and impairments are reported in accordance with International Financial Reporting Standards (IFRS).
Regulatory and economic capital classification
IFRS impairment treatment Arrears, default and recoveries classification category
Description
Performing assets
For assets which form part of a homogeneous portfolio, a portfolio impairment is required which recognises asset impairments that have not been individually identified.
The portfolio impairment takes into account past events and does not cover impairments to exposures arising out of uncertain future events.
By definition, this impairment is only calculated for credit exposures which are managed on a portfolio basis and only for assets where a loss trigger event has occurred.
Past due An account is considered to be past due when it is greater than zero and less than or equal to 60 days past due the contractual/credit agreed payment due date. Management however is not concerned and there is confidence in the counterparty’s ability to repay the past due obligations.
Special mention The counterparty is placed in special mention when that counterparty is considered to be experiencing difficulties that may threaten the counterparty’s ability to fulfil its credit obligation to the group (i.e. watchlist committee is concerned) for the following reasons:
• Covenant breaches
• There is a slowdown in the counterparty’s business activity
• An adverse trend in operations that signals a potential weakness in the financial strength of the counterparty
• Restructured credit exposures until appropriate watchlist committee decides otherwise.
Ultimate loss is not expected, but may occur if adverse conditions persist.
Reporting categories:
• Credit exposures overdue 1 – 60 days
• Credit exposures overdue 61 – 90 days.
Risk management
21
Risk m
anagement
03(continued)
Investec Bank Limited Basel Pillar III disclosure report 2017
Risk management
Asset quality analysis – credit risk classification and provisioning policy (continued)
Regulatory and economic capital classification
IFRS impairment treatment Arrears, default and recoveries classification category
Description
Assets in default (non-performing assets)
Specific impairments are evaluated on a case-by-case basis where objective evidence of impairment has arisen. In determining specific impairments, the following factors are considered:• Capability of the client to generate
sufficient cash flow to service debt obligations and the ongoing viability of the client’s business
• Likely dividend or amount recoverable on liquidation or bankruptcy or business rescue
• Nature and extent of claims by other creditors
• Amount and timing of expected cash flows
• Realisable value of security held (or other credit mitigants)
• Ability of the client to make payments in the foreign currency, for foreign currency-denominated accounts.
Sub-standard The counterparty is placed in sub-standard when the credit exposure reflects an underlying, well defined weakness that may lead to probable loss if not corrected:• The risk that such credit exposure may
become an impaired asset is probable,• The bank is relying, to a large extent, on
available collateral, or• The primary sources of repayment are
insufficient to service the remaining contractual principal and interest amounts, and the bank has to rely on secondary sources for repayment. These secondary sources may include collateral, the sale of a fixed asset, refinancing and further capital.
Credit exposures overdue for more than 90 days will at a minimum be included in ‘sub-standard’ (or a lower quality category).
Doubtful The counterparty is placed in doubtful when the credit exposure is considered to be impaired, but not yet considered a final loss due to some pending factors such as a merger, new financing or capital injection which may strengthen the quality of the relevant exposure.
Loss A counterparty is placed in the loss category when:• The credit exposure is considered to be
uncollectible once all efforts, such as realisation of collateral and institution of legal proceedings, have been exhausted, or
• Assets in this category are expected to be written off in the short term since the likelihood of future economic benefits resulting from such assets are remote.
Where a transaction is supported by a mortgage or charge over property, the primary credit risk is still taken on the borrower. For property-backed lending such as residential mortgages, the following characteristics of the property are considered: the type of property; its location; and the ease with which the property could be re-let and/or resold. Where the property is secured by lease agreements, the credit committee prefers not to lend for a term beyond the maximum term of the lease. Commercial real estate generally takes the form of good quality property often underpinned by strong third party leases. Residential property
Credit risk mitigation Credit risk mitigation techniques can be defined as all methods by which Investec seeks to decrease the credit risk associated with an exposure. Investec considers credit risk mitigation techniques as part of the credit assessment of a potential client or business proposal and not as a separate consideration of mitigation of risk. Credit risk mitigants can include any collateral item over which the bank has a charge over assets, netting and margining agreements, covenants, or terms and conditions imposed on a borrower with the aim of reducing the credit risk inherent to that transaction.
As Investec has a limited appetite for unsecured debt, the credit risk mitigation technique most commonly used is the taking of collateral, with a strong preference for tangible assets. Collateral is assessed with reference to the sustainability of value and the likelihood of realisation. Acceptable collateral generally exhibits characteristics that allow for it to be easily identified and appropriately valued and ultimately allowing Investec to recover any outstanding exposures.
An analysis of collateral is provided on page 38.
22
Risk m
anagement
03(continued)
Investec Bank Limited Basel Pillar III disclosure report 2017
Risk management
is also generally of a high quality and based in desirable locations. Residential and commercial property valuations will continue to form part of our ongoing focus on collateral assessment. It is our policy to obtain a formal valuation of every commercial property offered as collateral for a lending facility before advancing funds. Residential properties are valued by desktop valuation and/or approved valuers, where appropriate.
In addition, the relevant credit committee normally requires a suretyship or guarantee in support of a transaction in our private client business. Other common forms of collateral in the retail asset class are motor vehicles, cash and share portfolios. Primary collateral in private client lending transactions can also include a high net worth individual’s share/investment portfolio. This is typically in the form of a diversified pool of equity, fixed income, managed funds and cash. Often these portfolios are managed by Investec Wealth & Investment. Lending against investment portfolios is typically geared at conservative loan-to-value ratios after considering the quality, diversification, risk profile and liquidity of the portfolio.
Our corporate, government and institutional clients provide a range of collateral including cash, corporate assets, debtors (accounts receivable), trading stock, debt securities (bonds), listed and unlisted shares and guarantees.
The majority of credit mitigation techniques linked to trading activity is in the form of netting agreements and daily margining. The primary market standard legal documents that govern this include the International Swaps and Derivatives Association Master Agreements (ISDA), Global Master Securities Lending Agreement (GMSLA) and Global Master Repurchase Agreement (GMRA). In addition to having ISDA documentation in place with market and trading counterparties in over-the-counter (OTC) derivatives, a Credit Support Annex (CSA) ensures that mark-to-market credit exposure is mitigated daily through the calculation and placement/receiving of cash collateral. Where netting agreements have been signed, the enforceability is supported by external legal opinion within the legal jurisdiction of the agreement.
Set-off has been applied between assets subject to credit risk and related liabilities in the annual financial statements where:
• A legally enforceable right to set-off exists
• There is the intention to settle the asset and liability on a net basis, or to realise the asset and settle the liability simultaneously.
In addition to the above accounting set-off criteria, banking regulators impose the following additional criteria:
• Debit and credit balances relate to the same obligor/counterparty
• Debit and credit balances are denominated in the same currency and have identical maturities
• Exposures subject to set-off are risk-managed on a net basis
• Market practice considerations.
For this reason there will be instances where credit and counterparty exposures are displayed on a net basis in these annual financial statements but reported on a gross basis to regulators.
Further information on credit derivatives is provided on page 46.
Investec endeavours to implement robust processes to minimise the possibility of legal and/or operational risk through good quality tangible collateral. The legal risk function in Investec ensures the enforceability of credit risk mitigants within the laws applicable to the jurisdictions in which Investec operates. When assessing the potential concentration risk in its credit portfolio, consideration is given to the types of collateral and credit protection that form part of the portfolio.
For regulatory reporting purposes, exposures may be reduced by eligible collateral. Under the standardised approach credit risk mitigation can be achieved through either funded or unfunded credit protection. Where unfunded credit protection is relied upon for mitigation purposes, the exposure to the borrower is substituted with an exposure to the protection provider, after applying a ‘haircut’ to the value of the collateral due to currency and/or maturity mismatches between the original exposure and the collateral provided. Unfunded credit protection includes eligible guarantees and credit derivatives. Where we rely on funded protection in the form of financial collateral, the value of collateral is adjusted using the financial collateral comprehensive method. This method applies supervisory volatility adjustments to the value of the collateral, and includes the currency and maturity haircuts discussed above.
Credit and counterparty risk year in reviewThe financial year in review has seen a combination of trends and factors impacting on the credit quality and assessment of credit and counterparty risk.
Further information is provided on pages 12 to 20 of Investec Bank Limited group and company annual financial statements 2017.
The current macro-economic environment remains challenging and volatile with competitive pressure on margins. We have maintained a conservative lending approach. Our lending appetite is based on a client-centric approach with a strong focus on client cash flows underpinned by tangible collateral.
Core loans and advances grew by 8.5% to R233 billion with residential owner-occupied, private client lending and corporate portfolios representing the majority of the growth for the financial year in review.
Default loans (net of impairments) as a percentage of core loans and advances amounted to 1.03% with absolute levels of defaults increasing moderately over the year in relation to a few clients who experienced financial difficulty.
The credit loss ratio increased to 0.29% from 0.26% as a result of an increase in the impairment charge.
Lending collateralised by property The majority of the property assets are commercial investment properties and are located in South Africa. This portfolio decreased by 1% during the year. Loans to value remain conservative and transactions are generally supported by strong cash flows. We follow a client-centric approach, backing counterparties with strong balance sheets and requisite expertise.
Private client activitiesWe have seen continued growth in our private client portfolio and client base as we actively focus on increasing our positioning in this space.
Our high net worth client portfolio and residential mortgage book growth in particular has been encouraging with a total increase of 13.1% over the year. Growth in both of these areas has been achieved with strong adherence to our conservative lending appetite.
Corporate client activitiesWe grew our corporate book by 7.3% as a result of increased lending activity by our mid-to-large corporate clients across a number of sectors. Our book remains well diversified across sectors.
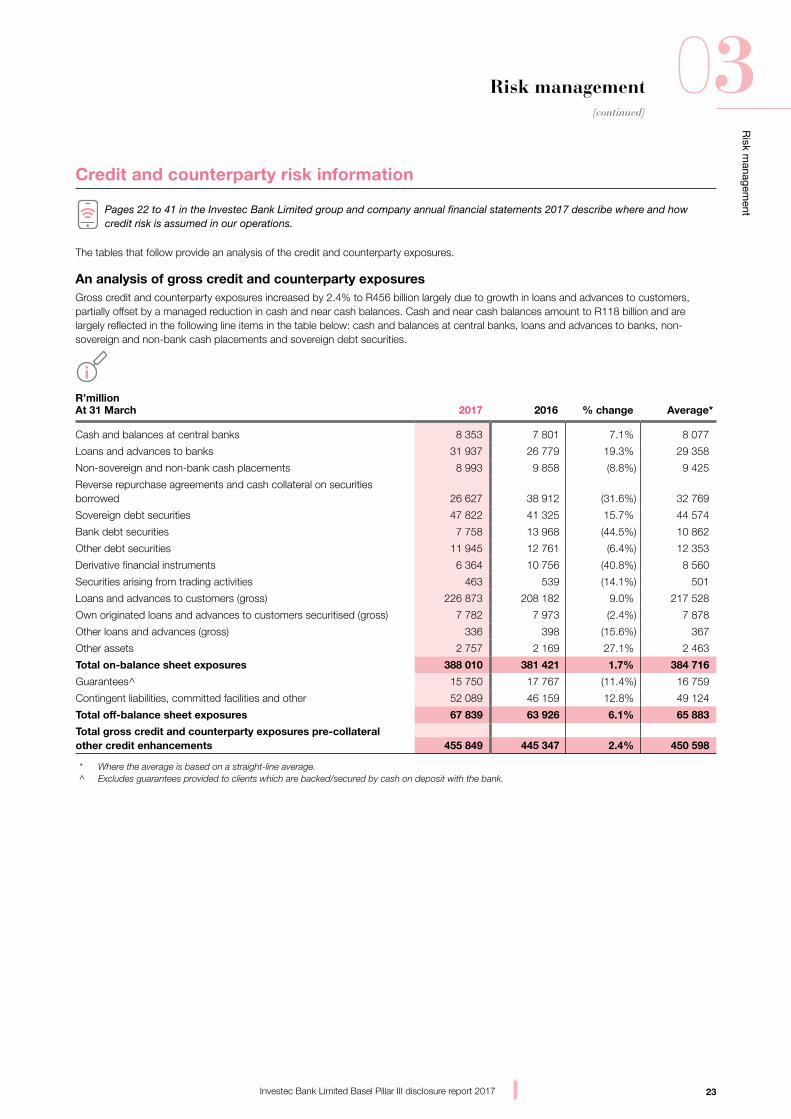
23
Risk m
anagement
03(continued)
Investec Bank Limited Basel Pillar III disclosure report 2017
Risk management
Credit and counterparty risk information
Pages 22 to 41 in the Investec Bank Limited group and company annual financial statements 2017 describe where and how credit risk is assumed in our operations.
The tables that follow provide an analysis of the credit and counterparty exposures.
An analysis of gross credit and counterparty exposuresGross credit and counterparty exposures increased by 2.4% to R456 billion largely due to growth in loans and advances to customers, partially offset by a managed reduction in cash and near cash balances. Cash and near cash balances amount to R118 billion and are largely reflected in the following line items in the table below: cash and balances at central banks, loans and advances to banks, non-sovereign and non-bank cash placements and sovereign debt securities.
R’millionAt 31 March 2017 2016 % change Average*
Cash and balances at central banks 8 353 7 801 7.1% 8 077
Loans and advances to banks 31 937 26 779 19.3% 29 358
Non-sovereign and non-bank cash placements 8 993 9 858 (8.8%) 9 425
Reverse repurchase agreements and cash collateral on securities borrowed 26 627 38 912 (31.6%) 32 769
Sovereign debt securities 47 822 41 325 15.7% 44 574
Bank debt securities 7 758 13 968 (44.5%) 10 862
Other debt securities 11 945 12 761 (6.4%) 12 353
Derivative financial instruments 6 364 10 756 (40.8%) 8 560
Securities arising from trading activities 463 539 (14.1%) 501
Loans and advances to customers (gross) 226 873 208 182 9.0% 217 528
Own originated loans and advances to customers securitised (gross) 7 782 7 973 (2.4%) 7 878
Other loans and advances (gross) 336 398 (15.6%) 367
Other assets 2 757 2 169 27.1% 2 463
Total on-balance sheet exposures 388 010 381 421 1.7% 384 716
Guarantees^ 15 750 17 767 (11.4%) 16 759
Contingent liabilities, committed facilities and other 52 089 46 159 12.8% 49 124
Total off-balance sheet exposures 67 839 63 926 6.1% 65 883
Total gross credit and counterparty exposures pre-collateralother credit enhancements 455 849 445 347 2.4% 450 598
* Where the average is based on a straight-line average. ^ Excludes guarantees provided to clients which are backed/secured by cash on deposit with the bank.
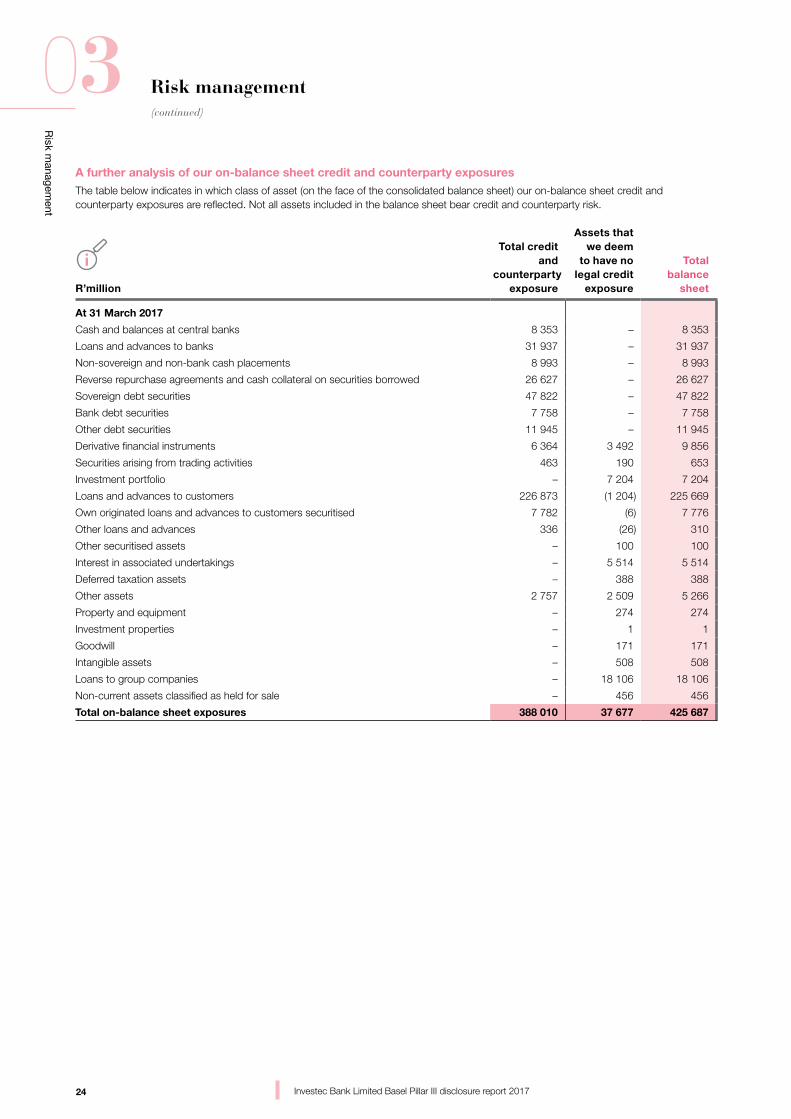
24
Risk m
anagement
03(continued)
Investec Bank Limited Basel Pillar III disclosure report 2017
Risk management
A further analysis of our on-balance sheet credit and counterparty exposuresThe table below indicates in which class of asset (on the face of the consolidated balance sheet) our on-balance sheet credit and counterparty exposures are reflected. Not all assets included in the balance sheet bear credit and counterparty risk.
R’million
Total credit and
counterparty exposure
Assets that we deem
to have no legal credit
exposure
Total balance
sheet
At 31 March 2017
Cash and balances at central banks 8 353 – 8 353
Loans and advances to banks 31 937 – 31 937
Non-sovereign and non-bank cash placements 8 993 – 8 993
Reverse repurchase agreements and cash collateral on securities borrowed 26 627 – 26 627
Sovereign debt securities 47 822 – 47 822
Bank debt securities 7 758 – 7 758
Other debt securities 11 945 – 11 945
Derivative financial instruments 6 364 3 492 9 856
Securities arising from trading activities 463 190 653
Investment portfolio – 7 204 7 204
Loans and advances to customers 226 873 (1 204) 225 669
Own originated loans and advances to customers securitised 7 782 (6) 7 776
Other loans and advances 336 (26) 310
Other securitised assets – 100 100
Interest in associated undertakings – 5 514 5 514
Deferred taxation assets – 388 388
Other assets 2 757 2 509 5 266
Property and equipment – 274 274
Investment properties – 1 1
Goodwill – 171 171
Intangible assets – 508 508
Loans to group companies – 18 106 18 106
Non-current assets classified as held for sale – 456 456
Total on-balance sheet exposures 388 010 37 677 425 687
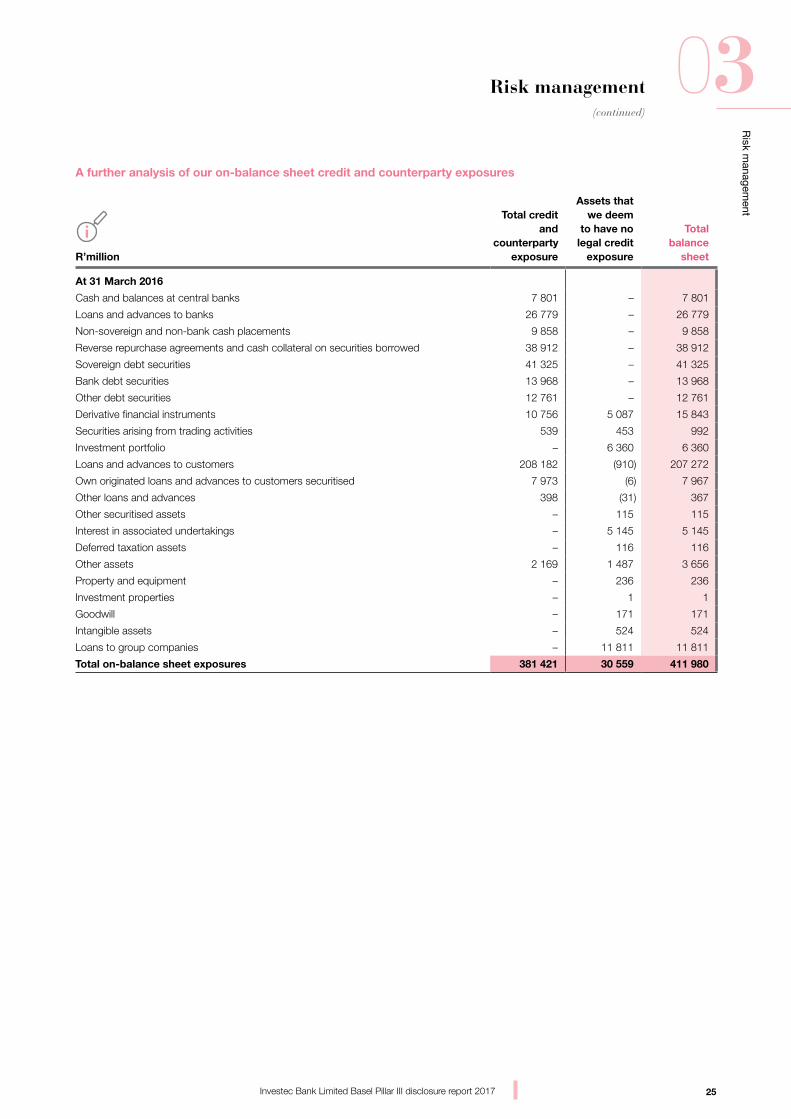
25
Risk m
anagement
03(continued)
Investec Bank Limited Basel Pillar III disclosure report 2017
Risk management
A further analysis of our on-balance sheet credit and counterparty exposures
R’million
Total credit and
counterparty exposure
Assets that we deem
to have no legal credit
exposure
Total balance
sheet
At 31 March 2016
Cash and balances at central banks 7 801 – 7 801
Loans and advances to banks 26 779 – 26 779
Non-sovereign and non-bank cash placements 9 858 – 9 858
Reverse repurchase agreements and cash collateral on securities borrowed 38 912 – 38 912
Sovereign debt securities 41 325 – 41 325
Bank debt securities 13 968 – 13 968
Other debt securities 12 761 – 12 761
Derivative financial instruments 10 756 5 087 15 843
Securities arising from trading activities 539 453 992
Investment portfolio – 6 360 6 360
Loans and advances to customers 208 182 (910) 207 272
Own originated loans and advances to customers securitised 7 973 (6) 7 967
Other loans and advances 398 (31) 367
Other securitised assets – 115 115
Interest in associated undertakings – 5 145 5 145
Deferred taxation assets – 116 116
Other assets 2 169 1 487 3 656
Property and equipment – 236 236
Investment properties – 1 1
Goodwill – 171 171
Intangible assets – 524 524
Loans to group companies – 11 811 11 811
Total on-balance sheet exposures 381 421 30 559 411 980
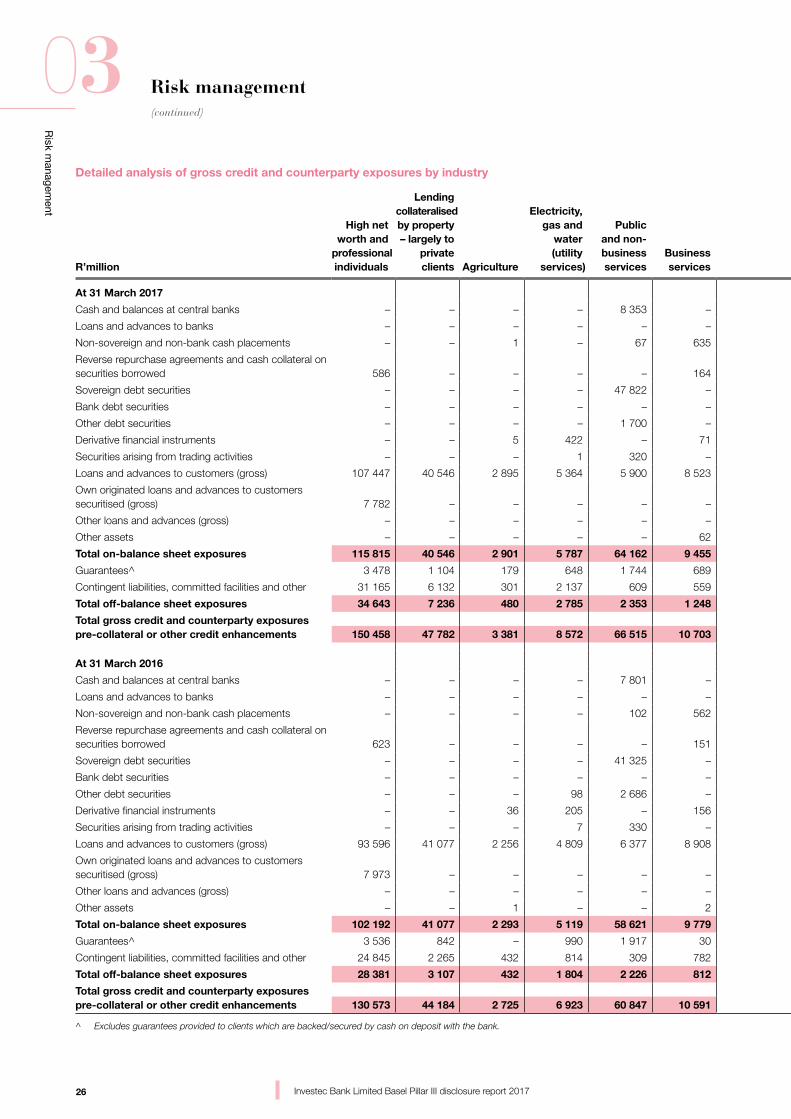
26
Risk m
anagement
03(continued)
Investec Bank Limited Basel Pillar III disclosure report 2017
Risk management
Detailed analysis of gross credit and counterparty exposures by industry
R’million
High networth and
professional individuals
Lendingcollateralisedby property – largely to
privateclients Agriculture
Electricity, gas and
water (utility
services)
Public and non-business services
Business services
Finance and
insurance
Retailers and
whole-salers
Manufac-turing and commerce
Construc-tion
Corporatecommer-
cial realestate
Otherresidentialmortgages
Mining and
resources
Leisure, entertain-ment and
tourism TransportCommuni-
cation Total
At 31 March 2017
Cash and balances at central banks – – – – 8 353 – – – – – – – – – – – 8 353
Loans and advances to banks – – – – – – 31 937 – – – – – – – – – 31 937
Non-sovereign and non-bank cash placements – – 1 – 67 635 2 130 1 561 2 504 247 201 – 758 – 553 336 8 993
Reverse repurchase agreements and cash collateral on securities borrowed 586 – – – – 164 25 051 – 785 – – – – – – 41 26 627
Sovereign debt securities – – – – 47 822 – – – – – – – – – – – 47 822
Bank debt securities – – – – – – 7 758 – – – – – – – – – 7 758
Other debt securities – – – – 1 700 – 3 162 – 1 555 – 708 – 2 383 – – 2 437 11 945
Derivative financial instruments – – 5 422 – 71 5 065 128 123 3 323 – 138 37 14 35 6 364
Securities arising from trading activities – – – 1 320 – – 38 – – – – – 33 – 71 463
Loans and advances to customers (gross) 107 447 40 546 2 895 5 364 5 900 8 523 17 640 2 814 11 457 3 953 5 760 – 3 249 1 512 4 010 5 803 226 873
Own originated loans and advances to customers securitised (gross) 7 782 – – – – – – – – – – – – – – – 7 782
Other loans and advances (gross) – – – – – – – – – – – 336 – – – – 336
Other assets – – – – – 62 673 1 470 236 268 – – – 40 – 8 2 757
Total on-balance sheet exposures 115 815 40 546 2 901 5 787 64 162 9 455 93 416 6 011 16 660 4 471 6 992 336 6 528 1 622 4 577 8 731 388 010
Guarantees^ 3 478 1 104 179 648 1 744 689 3 769 989 985 94 86 – 1 702 125 64 94 15 750
Contingent liabilities, committed facilities and other 31 165 6 132 301 2 137 609 559 2 984 1 810 858 538 303 – 3 088 68 1 117 420 52 089
Total off-balance sheet exposures 34 643 7 236 480 2 785 2 353 1 248 6 753 2 799 1 843 632 389 – 4 790 193 1 181 514 67 839
Total gross credit and counterparty exposurespre-collateral or other credit enhancements 150 458 47 782 3 381 8 572 66 515 10 703 100 169 8 810 18 503 5 103 7 381 336 11 318 1 815 5 758 9 245 455 849
At 31 March 2016
Cash and balances at central banks – – – – 7 801 – – – – – – – – – – – 7 801
Loans and advances to banks – – – – – – 26 779 – – – – – – – – – 26 779
Non-sovereign and non-bank cash placements – – – – 102 562 3 337 1 781 1 469 211 – – 1 581 – 312 503 9 858
Reverse repurchase agreements and cash collateral on securities borrowed 623 – – – – 151 37 389 – 675 – – – – – 74 – 38 912
Sovereign debt securities – – – – 41 325 – – – – – – – – – – – 41 325
Bank debt securities – – – – – – 13 968 – – – – – – – – – 13 968
Other debt securities – – – 98 2 686 – 3 137 – 658 – – – 2 509 – – 3 673 12 761
Derivative financial instruments – – 36 205 – 156 8 876 252 203 – 676 – 159 21 83 89 10 756
Securities arising from trading activities – – – 7 330 – 83 – 16 – – – – – 103 – 539
Loans and advances to customers (gross) 93 596 41 077 2 256 4 809 6 377 8 908 11 977 2 378 10 128 3 424 6 251 – 4 682 1 819 4 071 6 429 208 182
Own originated loans and advances to customers securitised (gross) 7 973 – – – – – – – – – – – – – – – 7 973
Other loans and advances (gross) – – – – – – – – – – – 398 – – – – 398
Other assets – – 1 – – 2 484 1 556 92 3 – – – 20 – 11 2 169
Total on-balance sheet exposures 102 192 41 077 2 293 5 119 58 621 9 779 106 030 5 967 13 241 3 638 6 927 398 8 931 1 860 4 643 10 705 381 421
Guarantees^ 3 536 842 – 990 1 917 30 8 168 62 136 – 11 – 1 822 – 65 188 17 767
Contingent liabilities, committed facilities and other 24 845 2 265 432 814 309 782 5 924 1 664 1 142 222 100 – 4 514 3 2 208 935 46 159
Total off-balance sheet exposures 28 381 3 107 432 1 804 2 226 812 14 092 1 726 1 278 222 111 – 6 336 3 2 273 1 123 63 926
Total gross credit and counterparty exposurespre-collateral or other credit enhancements 130 573 44 184 2 725 6 923 60 847 10 591 120 122 7 693 14 519 3 860 7 038 398 15 267 1 863 6 916 11 828 445 347
^ Excludes guarantees provided to clients which are backed/secured by cash on deposit with the bank.
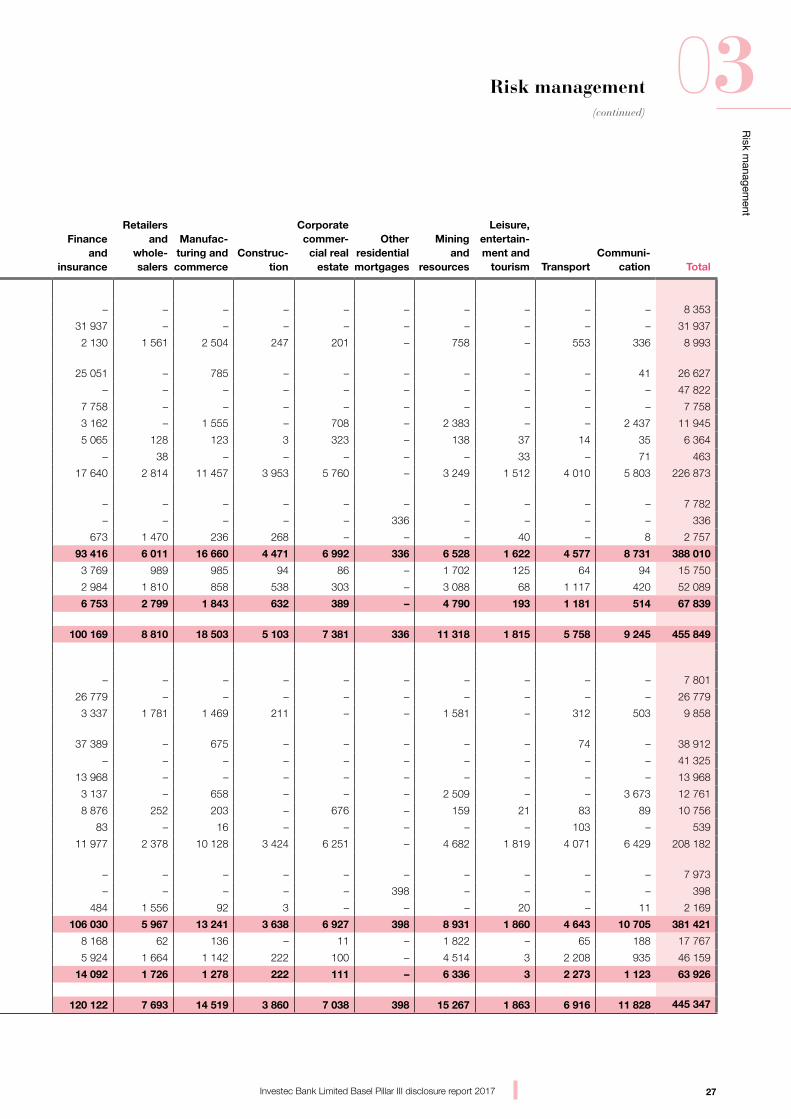
27
Risk m
anagement
03(continued)
Investec Bank Limited Basel Pillar III disclosure report 2017
Risk management
Detailed analysis of gross credit and counterparty exposures by industry
R’million
High networth and
professional individuals
Lendingcollateralisedby property – largely to
privateclients Agriculture
Electricity, gas and
water (utility
services)
Public and non-business services
Business services
Finance and
insurance
Retailers and
whole-salers
Manufac-turing and commerce
Construc-tion
Corporatecommer-
cial realestate
Otherresidentialmortgages
Mining and
resources
Leisure, entertain-ment and
tourism TransportCommuni-
cation Total
At 31 March 2017
Cash and balances at central banks – – – – 8 353 – – – – – – – – – – – 8 353
Loans and advances to banks – – – – – – 31 937 – – – – – – – – – 31 937
Non-sovereign and non-bank cash placements – – 1 – 67 635 2 130 1 561 2 504 247 201 – 758 – 553 336 8 993
Reverse repurchase agreements and cash collateral on securities borrowed 586 – – – – 164 25 051 – 785 – – – – – – 41 26 627
Sovereign debt securities – – – – 47 822 – – – – – – – – – – – 47 822
Bank debt securities – – – – – – 7 758 – – – – – – – – – 7 758
Other debt securities – – – – 1 700 – 3 162 – 1 555 – 708 – 2 383 – – 2 437 11 945
Derivative financial instruments – – 5 422 – 71 5 065 128 123 3 323 – 138 37 14 35 6 364
Securities arising from trading activities – – – 1 320 – – 38 – – – – – 33 – 71 463
Loans and advances to customers (gross) 107 447 40 546 2 895 5 364 5 900 8 523 17 640 2 814 11 457 3 953 5 760 – 3 249 1 512 4 010 5 803 226 873
Own originated loans and advances to customers securitised (gross) 7 782 – – – – – – – – – – – – – – – 7 782
Other loans and advances (gross) – – – – – – – – – – – 336 – – – – 336
Other assets – – – – – 62 673 1 470 236 268 – – – 40 – 8 2 757
Total on-balance sheet exposures 115 815 40 546 2 901 5 787 64 162 9 455 93 416 6 011 16 660 4 471 6 992 336 6 528 1 622 4 577 8 731 388 010
Guarantees^ 3 478 1 104 179 648 1 744 689 3 769 989 985 94 86 – 1 702 125 64 94 15 750
Contingent liabilities, committed facilities and other 31 165 6 132 301 2 137 609 559 2 984 1 810 858 538 303 – 3 088 68 1 117 420 52 089
Total off-balance sheet exposures 34 643 7 236 480 2 785 2 353 1 248 6 753 2 799 1 843 632 389 – 4 790 193 1 181 514 67 839
Total gross credit and counterparty exposurespre-collateral or other credit enhancements 150 458 47 782 3 381 8 572 66 515 10 703 100 169 8 810 18 503 5 103 7 381 336 11 318 1 815 5 758 9 245 455 849
At 31 March 2016
Cash and balances at central banks – – – – 7 801 – – – – – – – – – – – 7 801
Loans and advances to banks – – – – – – 26 779 – – – – – – – – – 26 779
Non-sovereign and non-bank cash placements – – – – 102 562 3 337 1 781 1 469 211 – – 1 581 – 312 503 9 858
Reverse repurchase agreements and cash collateral on securities borrowed 623 – – – – 151 37 389 – 675 – – – – – 74 – 38 912
Sovereign debt securities – – – – 41 325 – – – – – – – – – – – 41 325
Bank debt securities – – – – – – 13 968 – – – – – – – – – 13 968
Other debt securities – – – 98 2 686 – 3 137 – 658 – – – 2 509 – – 3 673 12 761
Derivative financial instruments – – 36 205 – 156 8 876 252 203 – 676 – 159 21 83 89 10 756
Securities arising from trading activities – – – 7 330 – 83 – 16 – – – – – 103 – 539
Loans and advances to customers (gross) 93 596 41 077 2 256 4 809 6 377 8 908 11 977 2 378 10 128 3 424 6 251 – 4 682 1 819 4 071 6 429 208 182
Own originated loans and advances to customers securitised (gross) 7 973 – – – – – – – – – – – – – – – 7 973
Other loans and advances (gross) – – – – – – – – – – – 398 – – – – 398
Other assets – – 1 – – 2 484 1 556 92 3 – – – 20 – 11 2 169
Total on-balance sheet exposures 102 192 41 077 2 293 5 119 58 621 9 779 106 030 5 967 13 241 3 638 6 927 398 8 931 1 860 4 643 10 705 381 421
Guarantees^ 3 536 842 – 990 1 917 30 8 168 62 136 – 11 – 1 822 – 65 188 17 767
Contingent liabilities, committed facilities and other 24 845 2 265 432 814 309 782 5 924 1 664 1 142 222 100 – 4 514 3 2 208 935 46 159
Total off-balance sheet exposures 28 381 3 107 432 1 804 2 226 812 14 092 1 726 1 278 222 111 – 6 336 3 2 273 1 123 63 926
Total gross credit and counterparty exposurespre-collateral or other credit enhancements 130 573 44 184 2 725 6 923 60 847 10 591 120 122 7 693 14 519 3 860 7 038 398 15 267 1 863 6 916 11 828 445 347
^ Excludes guarantees provided to clients which are backed/secured by cash on deposit with the bank.
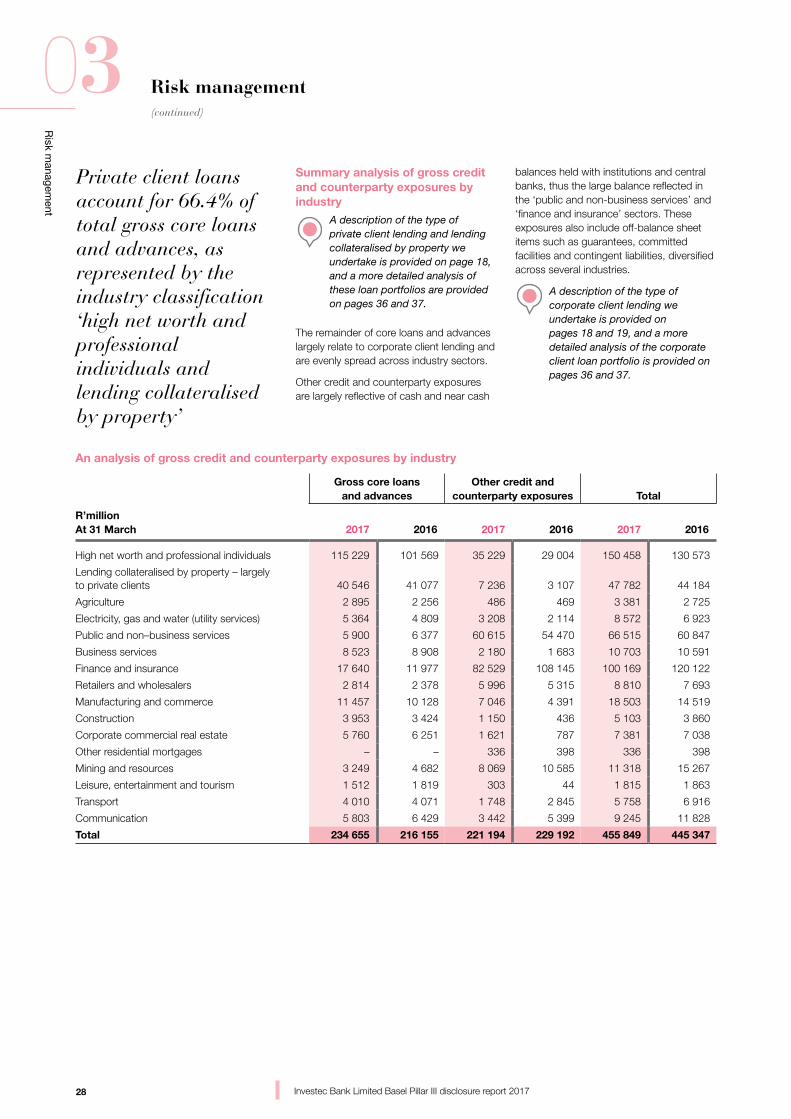
28
Risk m
anagement
03(continued)
Investec Bank Limited Basel Pillar III disclosure report 2017
Risk management
Summary analysis of gross credit and counterparty exposures by industry
A description of the type of private client lending and lending collateralised by property we undertake is provided on page 18, and a more detailed analysis of these loan portfolios are provided on pages 36 and 37.
The remainder of core loans and advances largely relate to corporate client lending and are evenly spread across industry sectors.
Other credit and counterparty exposures are largely reflective of cash and near cash
Private client loans account for 66.4% of total gross core loans and advances, as represented by the industry classification ‘high net worth and professional individuals and lending collateralised by property’
An analysis of gross credit and counterparty exposures by industry
Gross core loans and advances
Other credit and counterparty exposures Total
R’million At 31 March 2017 2016 2017 2016 2017 2016
High net worth and professional individuals 115 229 101 569 35 229 29 004 150 458 130 573
Lending collateralised by property – largely to private clients 40 546 41 077 7 236 3 107 47 782 44 184
Agriculture 2 895 2 256 486 469 3 381 2 725
Electricity, gas and water (utility services) 5 364 4 809 3 208 2 114 8 572 6 923
Public and non–business services 5 900 6 377 60 615 54 470 66 515 60 847
Business services 8 523 8 908 2 180 1 683 10 703 10 591
Finance and insurance 17 640 11 977 82 529 108 145 100 169 120 122
Retailers and wholesalers 2 814 2 378 5 996 5 315 8 810 7 693
Manufacturing and commerce 11 457 10 128 7 046 4 391 18 503 14 519
Construction 3 953 3 424 1 150 436 5 103 3 860
Corporate commercial real estate 5 760 6 251 1 621 787 7 381 7 038
Other residential mortgages – – 336 398 336 398
Mining and resources 3 249 4 682 8 069 10 585 11 318 15 267
Leisure, entertainment and tourism 1 512 1 819 303 44 1 815 1 863
Transport 4 010 4 071 1 748 2 845 5 758 6 916
Communication 5 803 6 429 3 442 5 399 9 245 11 828
Total 234 655 216 155 221 194 229 192 455 849 445 347
balances held with institutions and central banks, thus the large balance reflected in the ‘public and non-business services’ and ‘finance and insurance’ sectors. These exposures also include off-balance sheet items such as guarantees, committed facilities and contingent liabilities, diversified across several industries.
A description of the type of corporate client lending we undertake is provided on pages 18 and 19, and a more detailed analysis of the corporate client loan portfolio is provided on pages 36 and 37.
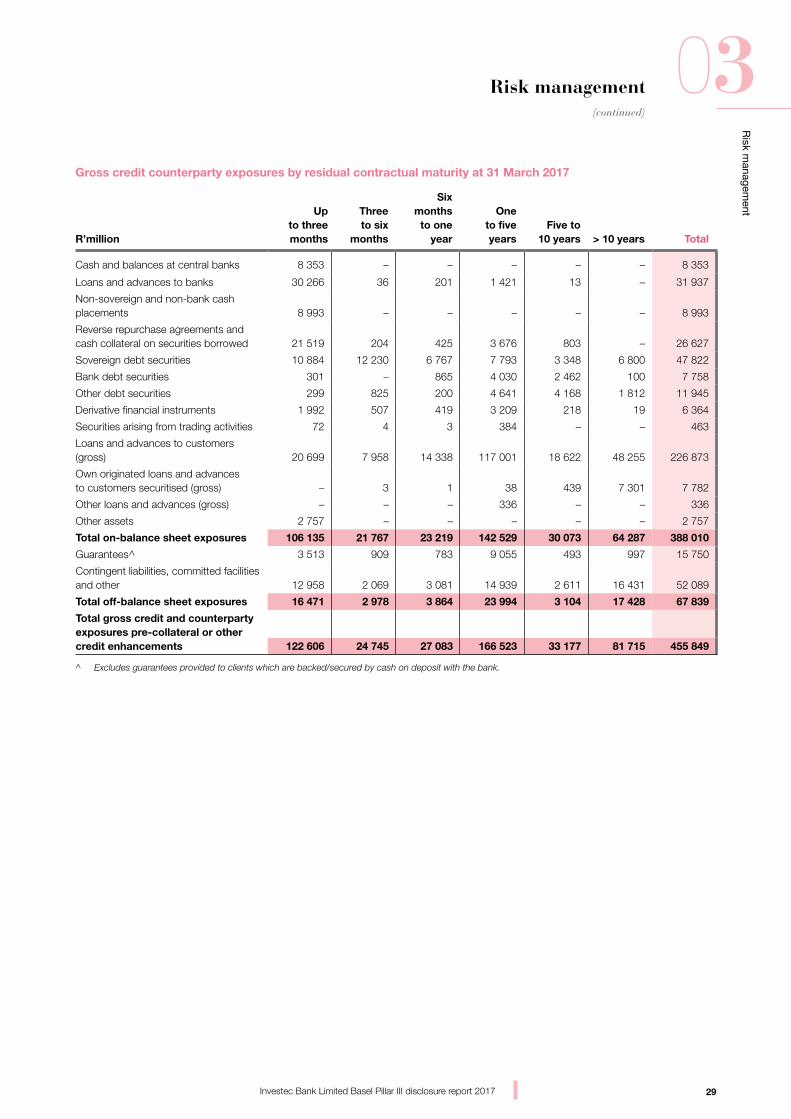
29
Risk m
anagement
03(continued)
Investec Bank Limited Basel Pillar III disclosure report 2017
Risk management
Gross credit counterparty exposures by residual contractual maturity at 31 March 2017
R’million
Up to three months
Three to six
months
Six months
to one year
One to five
yearsFive to
10 years > 10 years Total
Cash and balances at central banks 8 353 – – – – – 8 353
Loans and advances to banks 30 266 36 201 1 421 13 – 31 937
Non-sovereign and non-bank cash placements 8 993 – – – – – 8 993
Reverse repurchase agreements and cash collateral on securities borrowed 21 519 204 425 3 676 803 – 26 627
Sovereign debt securities 10 884 12 230 6 767 7 793 3 348 6 800 47 822
Bank debt securities 301 – 865 4 030 2 462 100 7 758
Other debt securities 299 825 200 4 641 4 168 1 812 11 945
Derivative financial instruments 1 992 507 419 3 209 218 19 6 364
Securities arising from trading activities 72 4 3 384 – – 463
Loans and advances to customers (gross) 20 699 7 958 14 338 117 001 18 622 48 255 226 873
Own originated loans and advances to customers securitised (gross) – 3 1 38 439 7 301 7 782
Other loans and advances (gross) – – – 336 – – 336
Other assets 2 757 – – – – – 2 757
Total on-balance sheet exposures 106 135 21 767 23 219 142 529 30 073 64 287 388 010
Guarantees^ 3 513 909 783 9 055 493 997 15 750
Contingent liabilities, committed facilities and other 12 958 2 069 3 081 14 939 2 611 16 431 52 089
Total off-balance sheet exposures 16 471 2 978 3 864 23 994 3 104 17 428 67 839
Total gross credit and counterparty exposures pre-collateral or othercredit enhancements 122 606 24 745 27 083 166 523 33 177 81 715 455 849
^ Excludes guarantees provided to clients which are backed/secured by cash on deposit with the bank.
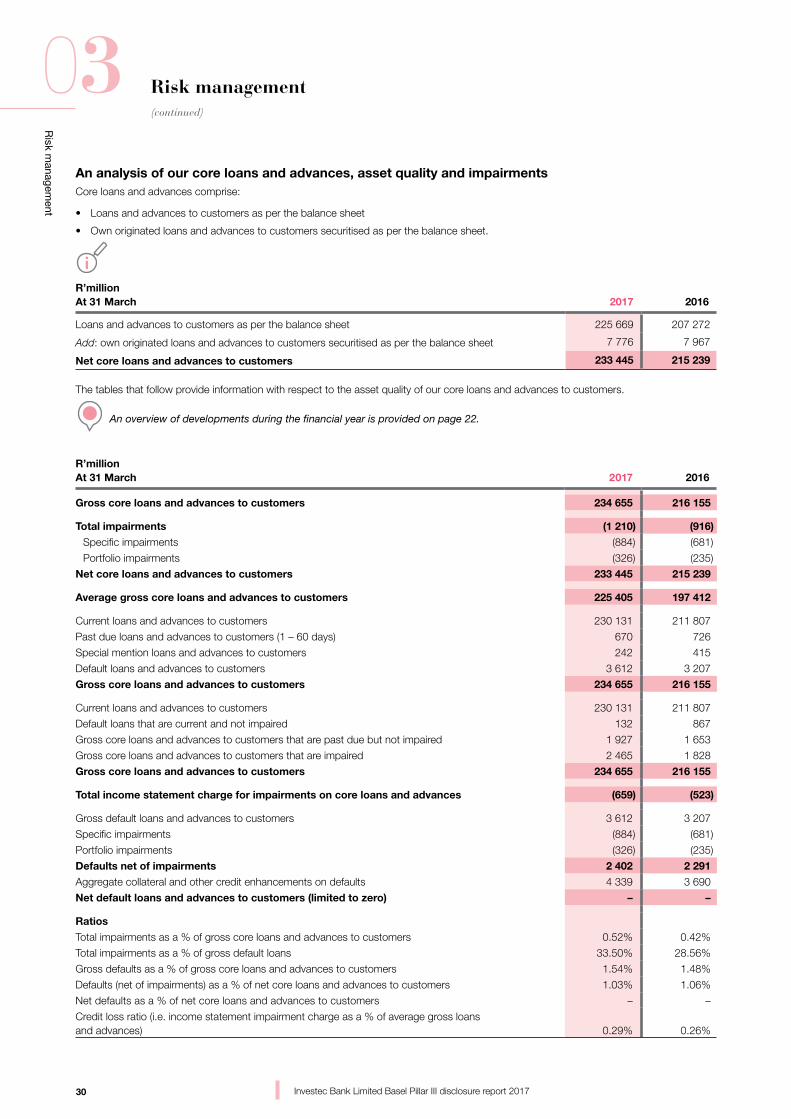
30
Risk m
anagement
03(continued)
Investec Bank Limited Basel Pillar III disclosure report 2017
Risk management
An analysis of our core loans and advances, asset quality and impairmentsCore loans and advances comprise:
• Loans and advances to customers as per the balance sheet
• Own originated loans and advances to customers securitised as per the balance sheet.
R’million At 31 March 2017 2016
Loans and advances to customers as per the balance sheet 225 669 207 272
Add: own originated loans and advances to customers securitised as per the balance sheet 7 776 7 967
Net core loans and advances to customers 233 445 215 239
The tables that follow provide information with respect to the asset quality of our core loans and advances to customers.
An overview of developments during the financial year is provided on page 22.
R’million At 31 March 2017 2016
Gross core loans and advances to customers 234 655 216 155
Total impairments (1 210) (916)
Specific impairments (884) (681)
Portfolio impairments (326) (235)
Net core loans and advances to customers 233 445 215 239
Average gross core loans and advances to customers 225 405 197 412
Current loans and advances to customers 230 131 211 807
Past due loans and advances to customers (1 – 60 days) 670 726
Special mention loans and advances to customers 242 415
Default loans and advances to customers 3 612 3 207
Gross core loans and advances to customers 234 655 216 155
Current loans and advances to customers 230 131 211 807
Default loans that are current and not impaired 132 867
Gross core loans and advances to customers that are past due but not impaired 1 927 1 653
Gross core loans and advances to customers that are impaired 2 465 1 828
Gross core loans and advances to customers 234 655 216 155
Total income statement charge for impairments on core loans and advances (659) (523)
Gross default loans and advances to customers 3 612 3 207
Specific impairments (884) (681)
Portfolio impairments (326) (235)
Defaults net of impairments 2 402 2 291
Aggregate collateral and other credit enhancements on defaults 4 339 3 690
Net default loans and advances to customers (limited to zero) – –
Ratios
Total impairments as a % of gross core loans and advances to customers 0.52% 0.42%
Total impairments as a % of gross default loans 33.50% 28.56%
Gross defaults as a % of gross core loans and advances to customers 1.54% 1.48%
Defaults (net of impairments) as a % of net core loans and advances to customers 1.03% 1.06%
Net defaults as a % of net core loans and advances to customers – –
Credit loss ratio (i.e. income statement impairment charge as a % of average gross loans and advances) 0.29% 0.26%
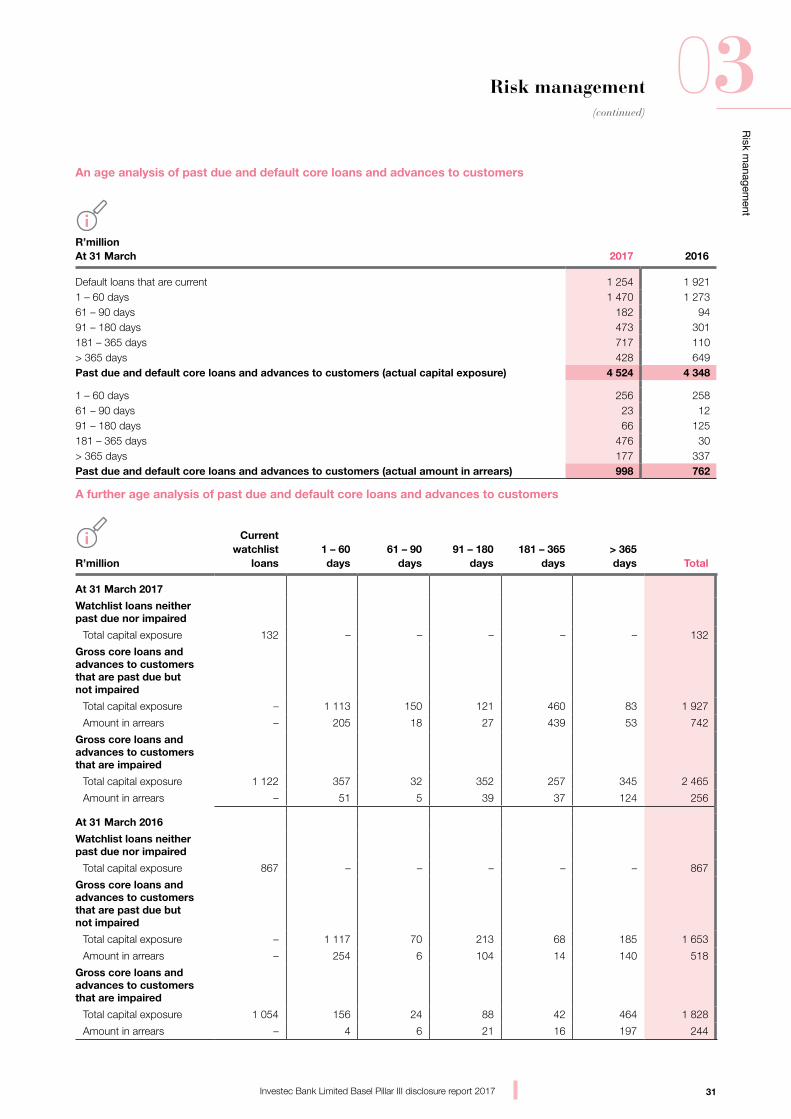
31
Risk m
anagement
03(continued)
Investec Bank Limited Basel Pillar III disclosure report 2017
Risk management
An age analysis of past due and default core loans and advances to customers
R’million At 31 March 2017 2016
Default loans that are current 1 254 1 921 1 – 60 days 1 470 1 273 61 – 90 days 182 94 91 – 180 days 473 301 181 – 365 days 717 110 > 365 days 428 649 Past due and default core loans and advances to customers (actual capital exposure) 4 524 4 348
1 – 60 days 256 258 61 – 90 days 23 12 91 – 180 days 66 125 181 – 365 days 476 30 > 365 days 177 337 Past due and default core loans and advances to customers (actual amount in arrears) 998 762
A further age analysis of past due and default core loans and advances to customers
R’million
Current watchlist
loans1 – 60 days
61 – 90 days
91 – 180 days
181 – 365 days
> 365 days Total
At 31 March 2017
Watchlist loans neither past due nor impaired
Total capital exposure 132 – – – – – 132
Gross core loans and advances to customers that are past due but not impaired
Total capital exposure – 1 113 150 121 460 83 1 927
Amount in arrears – 205 18 27 439 53 742
Gross core loans and advances to customers that are impaired
Total capital exposure 1 122 357 32 352 257 345 2 465
Amount in arrears – 51 5 39 37 124 256
At 31 March 2016
Watchlist loans neither past due nor impaired
Total capital exposure 867 – – – – – 867
Gross core loans and advances to customers that are past due but not impaired
Total capital exposure – 1 117 70 213 68 185 1 653
Amount in arrears – 254 6 104 14 140 518
Gross core loans and advances to customers that are impaired
Total capital exposure 1 054 156 24 88 42 464 1 828
Amount in arrears – 4 6 21 16 197 244
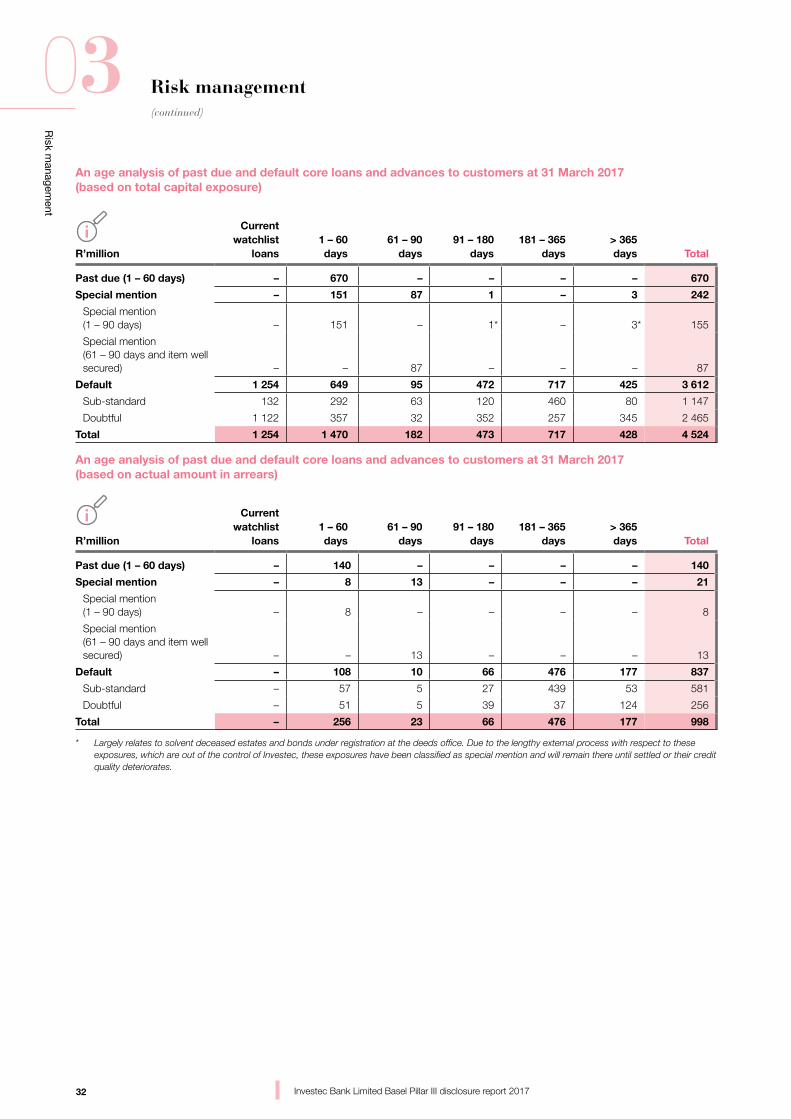
32
Risk m
anagement
03(continued)
Investec Bank Limited Basel Pillar III disclosure report 2017
Risk management
An age analysis of past due and default core loans and advances to customers at 31 March 2017 (based on total capital exposure)
R’million
Current watchlist
loans1 – 60 days
61 – 90 days
91 – 180 days
181 – 365 days
> 365 days Total
Past due (1 – 60 days) – 670 – – – – 670
Special mention – 151 87 1 – 3 242
Special mention (1 – 90 days) – 151 – 1* – 3* 155
Special mention (61 – 90 days and item well secured) – – 87 – – – 87
Default 1 254 649 95 472 717 425 3 612
Sub-standard 132 292 63 120 460 80 1 147
Doubtful 1 122 357 32 352 257 345 2 465
Total 1 254 1 470 182 473 717 428 4 524
An age analysis of past due and default core loans and advances to customers at 31 March 2017 (based on actual amount in arrears)
R’million
Current watchlist
loans1 – 60 days
61 – 90 days
91 – 180 days
181 – 365 days
> 365 days Total
Past due (1 – 60 days) – 140 – – – – 140
Special mention – 8 13 – – – 21
Special mention (1 – 90 days) – 8 – – – – 8
Special mention (61 – 90 days and item well secured) – – 13 – – – 13
Default – 108 10 66 476 177 837
Sub-standard – 57 5 27 439 53 581
Doubtful – 51 5 39 37 124 256
Total – 256 23 66 476 177 998
* Largely relates to solvent deceased estates and bonds under registration at the deeds office. Due to the lengthy external process with respect to these exposures, which are out of the control of Investec, these exposures have been classified as special mention and will remain there until settled or their credit quality deteriorates.
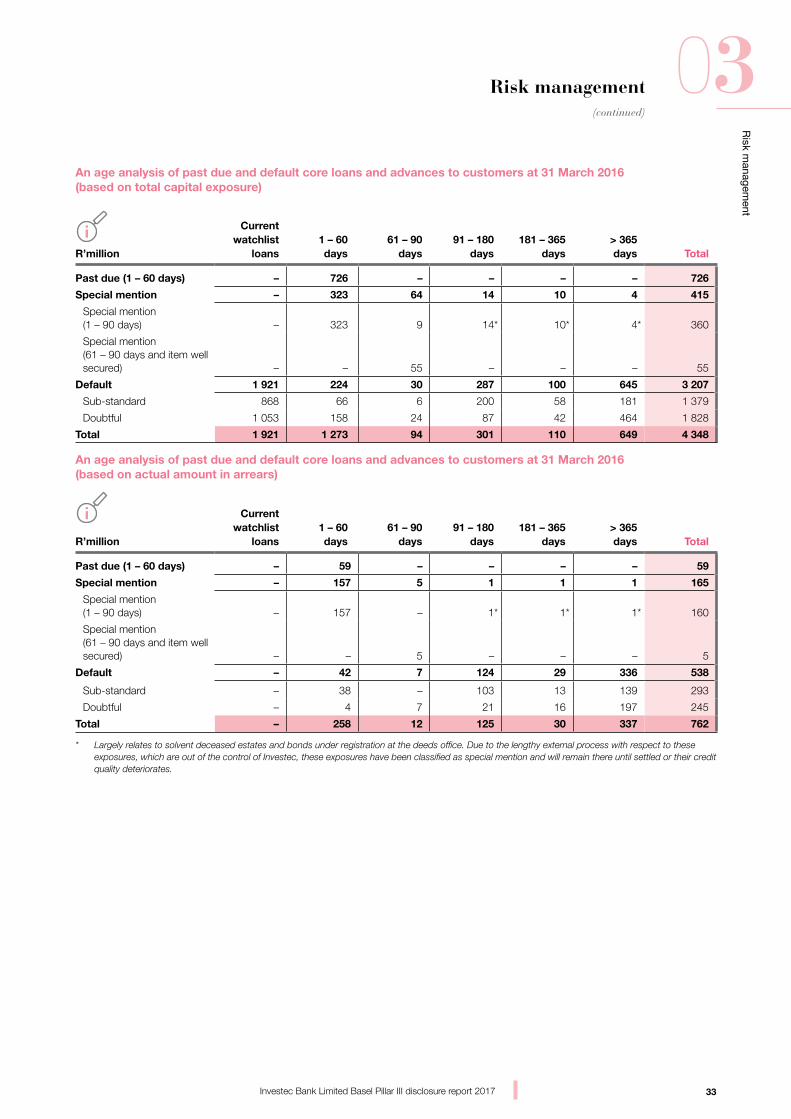
33
Risk m
anagement
03(continued)
Investec Bank Limited Basel Pillar III disclosure report 2017
Risk management
An age analysis of past due and default core loans and advances to customers at 31 March 2016 (based on total capital exposure)
R’million
Current watchlist
loans1 – 60 days
61 – 90 days
91 – 180 days
181 – 365 days
> 365 days Total
Past due (1 – 60 days) – 726 – – – – 726
Special mention – 323 64 14 10 4 415
Special mention (1 – 90 days) – 323 9 14* 10* 4* 360
Special mention (61 – 90 days and item well secured) – – 55 – – – 55
Default 1 921 224 30 287 100 645 3 207
Sub-standard 868 66 6 200 58 181 1 379
Doubtful 1 053 158 24 87 42 464 1 828
Total 1 921 1 273 94 301 110 649 4 348
An age analysis of past due and default core loans and advances to customers at 31 March 2016 (based on actual amount in arrears)
R’million
Current watchlist
loans1 – 60 days
61 – 90 days
91 – 180 days
181 – 365 days
> 365 days Total
Past due (1 – 60 days) – 59 – – – – 59
Special mention – 157 5 1 1 1 165
Special mention (1 – 90 days) – 157 – 1* 1* 1* 160
Special mention (61 – 90 days and item well secured) – – 5 – – – 5
Default – 42 7 124 29 336 538
Sub-standard – 38 – 103 13 139 293
Doubtful – 4 7 21 16 197 245
Total – 258 12 125 30 337 762
* Largely relates to solvent deceased estates and bonds under registration at the deeds office. Due to the lengthy external process with respect to these exposures, which are out of the control of Investec, these exposures have been classified as special mention and will remain there until settled or their credit quality deteriorates.
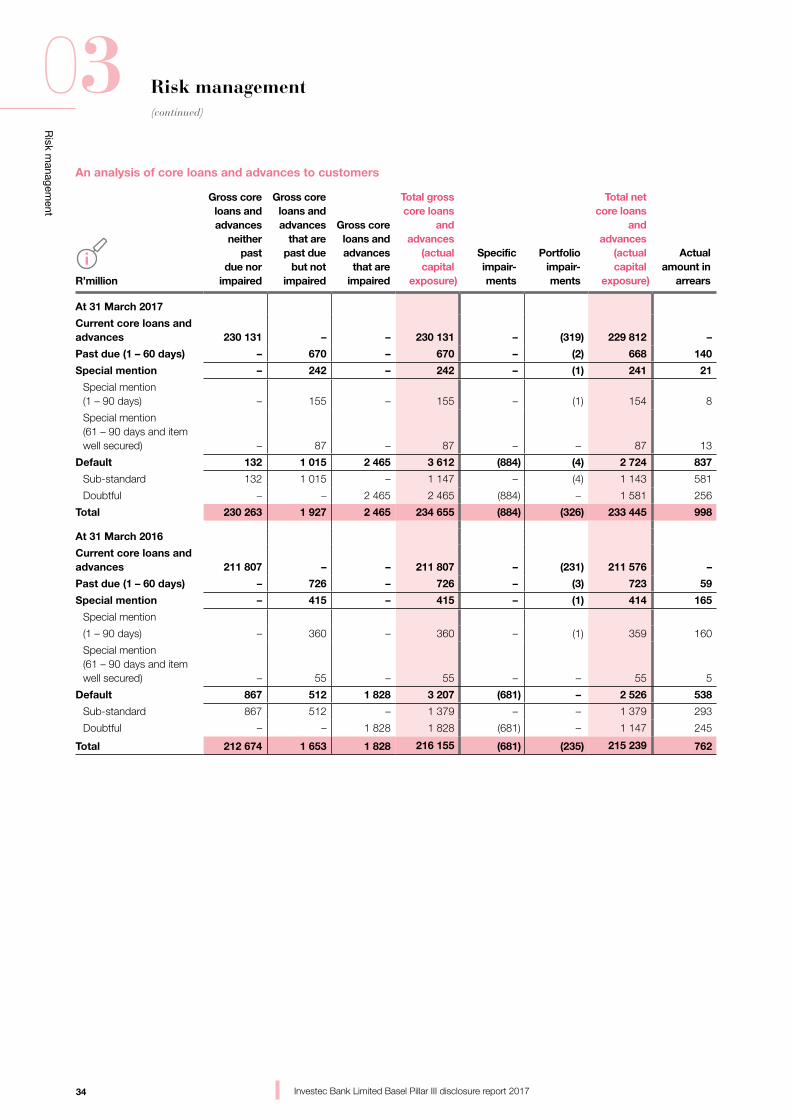
34
Risk m
anagement
03(continued)
Investec Bank Limited Basel Pillar III disclosure report 2017
Risk management
An analysis of core loans and advances to customers
R’million
Gross core loans and advances
neither past
due nor impaired
Gross core loans and advances
that are past due
but not impaired
Gross core loans and advances
that are impaired
Total gross core loans
and advances
(actual capital
exposure)
Specific impair-
ments
Portfolio impair-
ments
Total net core loans
and advances
(actual capital
exposure)
Actual amount in
arrears
At 31 March 2017
Current core loans and advances 230 131 – – 230 131 – (319) 229 812 –
Past due (1 – 60 days) – 670 – 670 – (2) 668 140
Special mention – 242 – 242 – (1) 241 21
Special mention (1 – 90 days) – 155 – 155 – (1) 154 8
Special mention (61 – 90 days and item well secured) – 87 – 87 – – 87 13
Default 132 1 015 2 465 3 612 (884) (4) 2 724 837
Sub-standard 132 1 015 – 1 147 – (4) 1 143 581
Doubtful – – 2 465 2 465 (884) – 1 581 256
Total 230 263 1 927 2 465 234 655 (884) (326) 233 445 998
At 31 March 2016
Current core loans and advances 211 807 – – 211 807 – (231) 211 576 –
Past due (1 – 60 days) – 726 – 726 – (3) 723 59
Special mention – 415 – 415 – (1) 414 165
Special mention
(1 – 90 days) – 360 – 360 – (1) 359 160
Special mention (61 – 90 days and item well secured) – 55 – 55 – – 55 5
Default 867 512 1 828 3 207 (681) – 2 526 538
Sub-standard 867 512 – 1 379 – – 1 379 293
Doubtful – – 1 828 1 828 (681) – 1 147 245
Total 212 674 1 653 1 828 216 155 (681) (235) 215 239 762
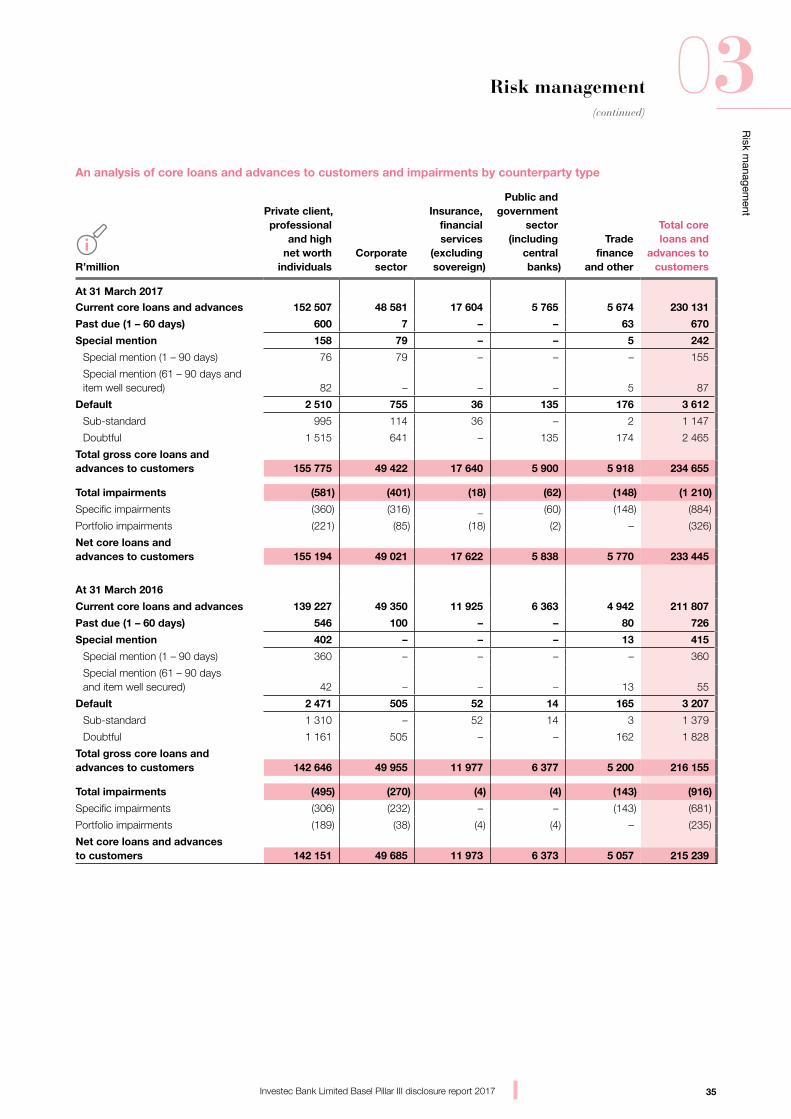
35
Risk m
anagement
03(continued)
Investec Bank Limited Basel Pillar III disclosure report 2017
Risk management
An analysis of core loans and advances to customers and impairments by counterparty type
R’million
Private client, professional
and high net worth
individualsCorporate
sector
Insurance, financial services
(excluding sovereign)
Public and government
sector (including
central banks)
Trade finance
and other
Total core loans and
advances to customers
At 31 March 2017
Current core loans and advances 152 507 48 581 17 604 5 765 5 674 230 131
Past due (1 – 60 days) 600 7 – – 63 670
Special mention 158 79 – – 5 242
Special mention (1 – 90 days) 76 79 – – – 155
Special mention (61 – 90 days and item well secured) 82 – – – 5 87
Default 2 510 755 36 135 176 3 612
Sub-standard 995 114 36 – 2 1 147
Doubtful 1 515 641 – 135 174 2 465
Total gross core loans andadvances to customers 155 775 49 422 17 640 5 900 5 918 234 655
Total impairments (581) (401) (18) (62) (148) (1 210)
Specific impairments (360) (316) _ (60) (148) (884)
Portfolio impairments (221) (85) (18) (2) – (326)
Net core loans and advances to customers 155 194 49 021 17 622 5 838 5 770 233 445
At 31 March 2016
Current core loans and advances 139 227 49 350 11 925 6 363 4 942 211 807
Past due (1 – 60 days) 546 100 – – 80 726
Special mention 402 – – – 13 415
Special mention (1 – 90 days) 360 – – – – 360
Special mention (61 – 90 days and item well secured) 42 – – – 13 55
Default 2 471 505 52 14 165 3 207
Sub-standard 1 310 – 52 14 3 1 379
Doubtful 1 161 505 – – 162 1 828
Total gross core loans andadvances to customers 142 646 49 955 11 977 6 377 5 200 216 155
Total impairments (495) (270) (4) (4) (143) (916)
Specific impairments (306) (232) – – (143) (681)
Portfolio impairments (189) (38) (4) (4) – (235)
Net core loans and advancesto customers 142 151 49 685 11 973 6 373 5 057 215 239
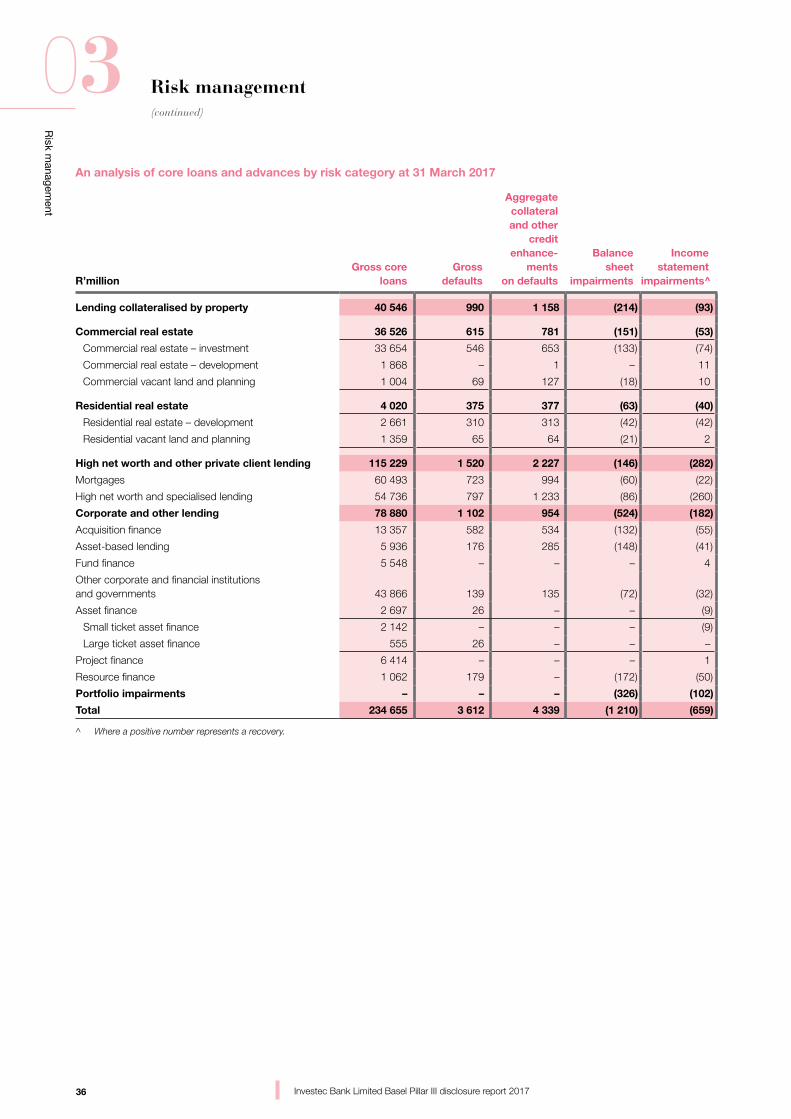
36
Risk m
anagement
03(continued)
Investec Bank Limited Basel Pillar III disclosure report 2017
Risk management
An analysis of core loans and advances by risk category at 31 March 2017
R’millionGross core
loansGross
defaults
Aggregate collateral and other
credit enhance-
ments on defaults
Balancesheet
impairments
Income statement
impairments^
Lending collateralised by property 40 546 990 1 158 (214) (93)
Commercial real estate 36 526 615 781 (151) (53)
Commercial real estate – investment 33 654 546 653 (133) (74)
Commercial real estate – development 1 868 – 1 – 11
Commercial vacant land and planning 1 004 69 127 (18) 10
Residential real estate 4 020 375 377 (63) (40)
Residential real estate – development 2 661 310 313 (42) (42)
Residential vacant land and planning 1 359 65 64 (21) 2
High net worth and other private client lending 115 229 1 520 2 227 (146) (282)
Mortgages 60 493 723 994 (60) (22)
High net worth and specialised lending 54 736 797 1 233 (86) (260)
Corporate and other lending 78 880 1 102 954 (524) (182)
Acquisition finance 13 357 582 534 (132) (55)
Asset-based lending 5 936 176 285 (148) (41)
Fund finance 5 548 – – – 4
Other corporate and financial institutions and governments 43 866 139 135 (72) (32)
Asset finance 2 697 26 – – (9)
Small ticket asset finance 2 142 – – – (9)
Large ticket asset finance 555 26 – – –
Project finance 6 414 – – – 1
Resource finance 1 062 179 – (172) (50)
Portfolio impairments – – – (326) (102)
Total 234 655 3 612 4 339 (1 210) (659)
^ Where a positive number represents a recovery.
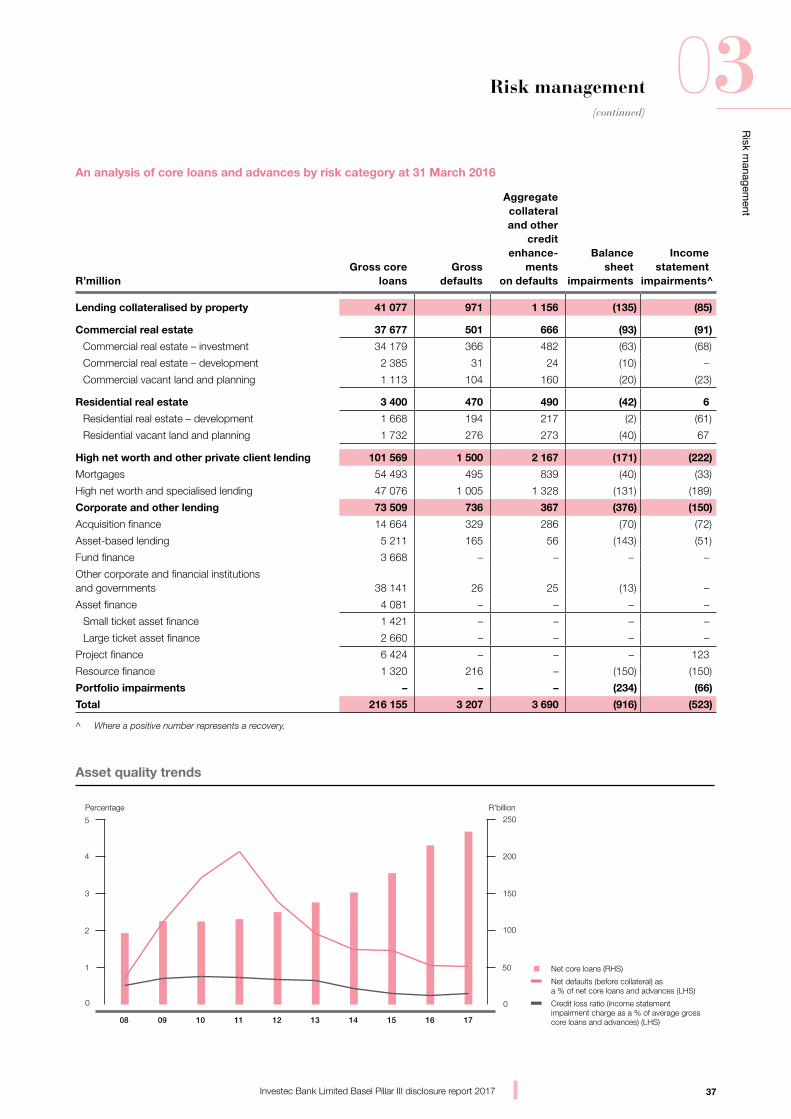
37
Risk m
anagement
03(continued)
Investec Bank Limited Basel Pillar III disclosure report 2017
Risk management
An analysis of core loans and advances by risk category at 31 March 2016
R’millionGross core
loansGross
defaults
Aggregate collateral and other
credit enhance-
ments on defaults
Balancesheet
impairments
Income statement
impairments^
Lending collateralised by property 41 077 971 1 156 (135) (85)
Commercial real estate 37 677 501 666 (93) (91)
Commercial real estate – investment 34 179 366 482 (63) (68)
Commercial real estate – development 2 385 31 24 (10) –
Commercial vacant land and planning 1 113 104 160 (20) (23)
Residential real estate 3 400 470 490 (42) 6
Residential real estate – development 1 668 194 217 (2) (61)
Residential vacant land and planning 1 732 276 273 (40) 67
High net worth and other private client lending 101 569 1 500 2 167 (171) (222)
Mortgages 54 493 495 839 (40) (33)
High net worth and specialised lending 47 076 1 005 1 328 (131) (189)
Corporate and other lending 73 509 736 367 (376) (150)
Acquisition finance 14 664 329 286 (70) (72)
Asset-based lending 5 211 165 56 (143) (51)
Fund finance 3 668 – – – –
Other corporate and financial institutions and governments 38 141 26 25 (13) –
Asset finance 4 081 – – – –
Small ticket asset finance 1 421 – – – –
Large ticket asset finance 2 660 – – – –
Project finance 6 424 – – – 123
Resource finance 1 320 216 – (150) (150)
Portfolio impairments – – – (234) (66)
Total 216 155 3 207 3 690 (916) (523)
^ Where a positive number represents a recovery.
Percentage
0
50
100
150
200
250
17
0
1
2
3
4
5
R’billion
Net core loans (RHS)
Net defaults (before collateral) as a % of net core loans and advances (LHS)
Credit loss ratio (income statement impairment charge as a % of average gross core loans and advances) (LHS)
Asset quality trends
1514131211100908 16
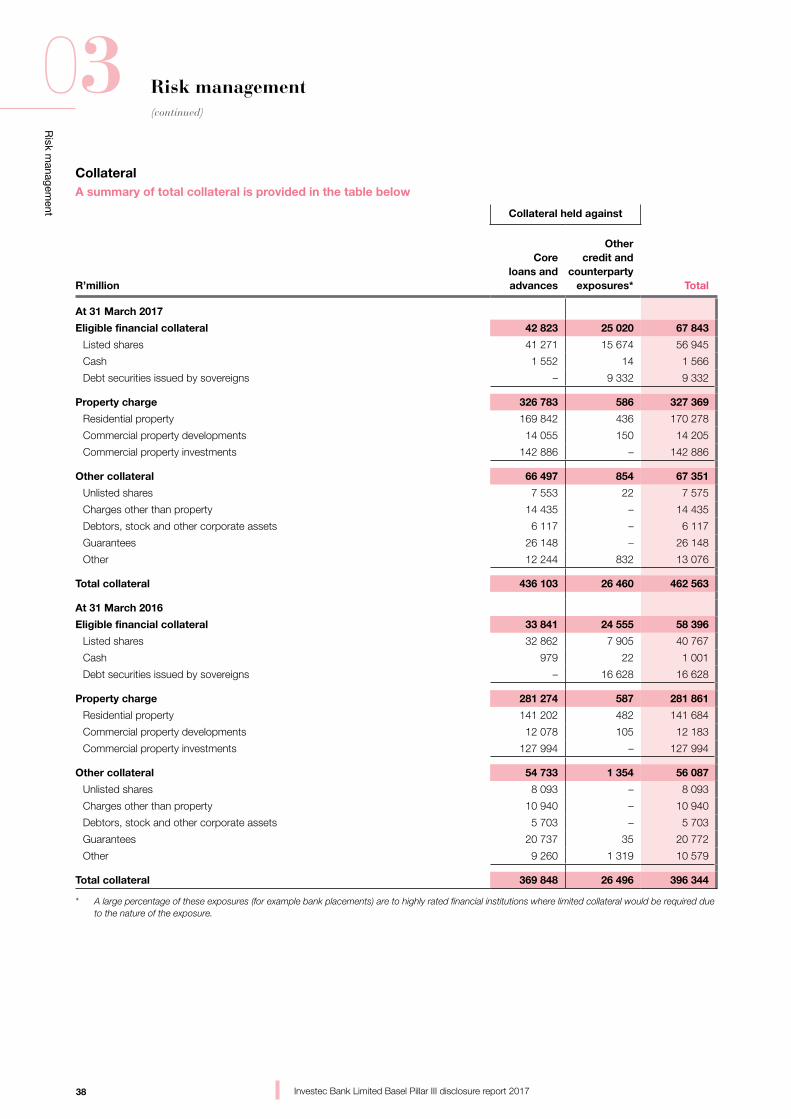
38
Risk m
anagement
03(continued)
Investec Bank Limited Basel Pillar III disclosure report 2017
Risk management
CollateralA summary of total collateral is provided in the table below
Collateral held against
R’million
Core loans and advances
Other credit and
counterparty exposures* Total
At 31 March 2017
Eligible financial collateral 42 823 25 020 67 843
Listed shares 41 271 15 674 56 945
Cash 1 552 14 1 566
Debt securities issued by sovereigns – 9 332 9 332
Property charge 326 783 586 327 369
Residential property 169 842 436 170 278
Commercial property developments 14 055 150 14 205
Commercial property investments 142 886 – 142 886
Other collateral 66 497 854 67 351
Unlisted shares 7 553 22 7 575
Charges other than property 14 435 – 14 435
Debtors, stock and other corporate assets 6 117 – 6 117
Guarantees 26 148 – 26 148
Other 12 244 832 13 076
Total collateral 436 103 26 460 462 563
At 31 March 2016
Eligible financial collateral 33 841 24 555 58 396
Listed shares 32 862 7 905 40 767
Cash 979 22 1 001
Debt securities issued by sovereigns – 16 628 16 628
Property charge 281 274 587 281 861
Residential property 141 202 482 141 684
Commercial property developments 12 078 105 12 183
Commercial property investments 127 994 – 127 994
Other collateral 54 733 1 354 56 087
Unlisted shares 8 093 – 8 093
Charges other than property 10 940 – 10 940
Debtors, stock and other corporate assets 5 703 – 5 703
Guarantees 20 737 35 20 772
Other 9 260 1 319 10 579
Total collateral 369 848 26 496 396 344
* A large percentage of these exposures (for example bank placements) are to highly rated financial institutions where limited collateral would be required due to the nature of the exposure.
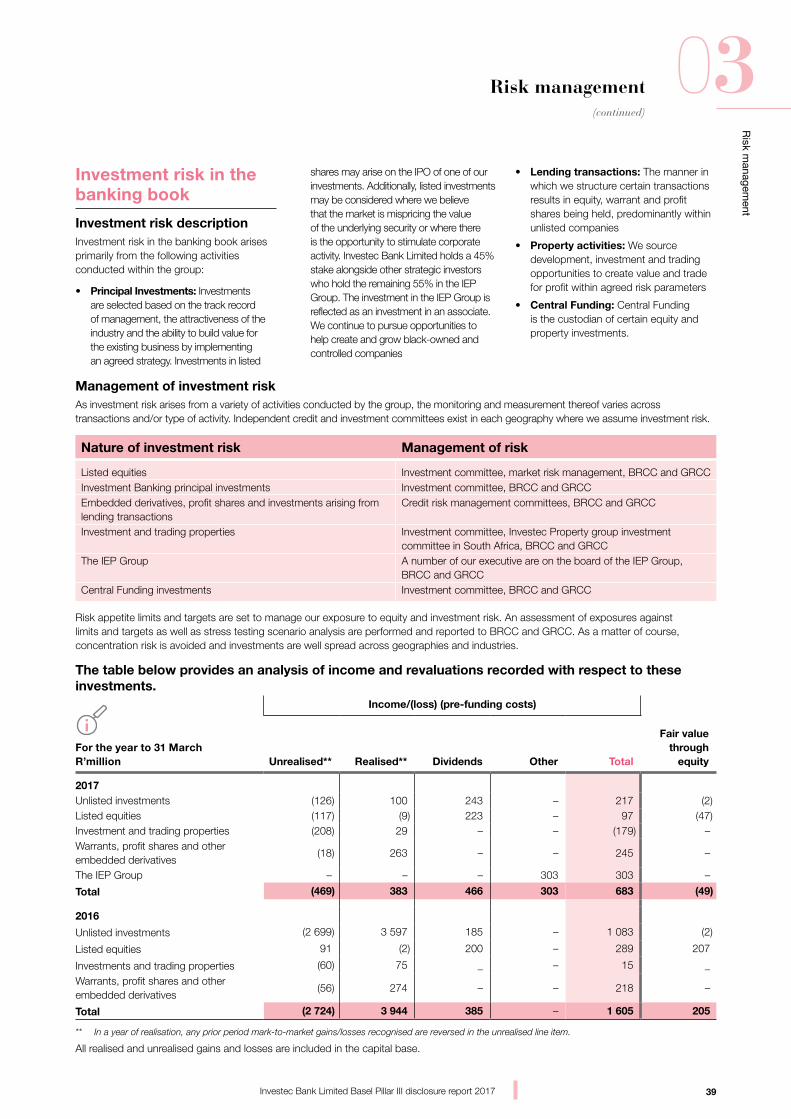
39
Risk m
anagement
03(continued)
Investec Bank Limited Basel Pillar III disclosure report 2017
Risk management
shares may arise on the IPO of one of our investments. Additionally, listed investments may be considered where we believe that the market is mispricing the value of the underlying security or where there is the opportunity to stimulate corporate activity. Investec Bank Limited holds a 45% stake alongside other strategic investors who hold the remaining 55% in the IEP Group. The investment in the IEP Group is reflected as an investment in an associate. We continue to pursue opportunities to help create and grow black-owned and controlled companies
Management of investment riskAs investment risk arises from a variety of activities conducted by the group, the monitoring and measurement thereof varies across transactions and/or type of activity. Independent credit and investment committees exist in each geography where we assume investment risk.
Nature of investment risk Management of risk
Listed equities Investment committee, market risk management, BRCC and GRCCInvestment Banking principal investments Investment committee, BRCC and GRCCEmbedded derivatives, profit shares and investments arising from lending transactions
Credit risk management committees, BRCC and GRCC
Investment and trading properties Investment committee, Investec Property group investment committee in South Africa, BRCC and GRCC
The IEP Group A number of our executive are on the board of the IEP Group, BRCC and GRCC
Central Funding investments Investment committee, BRCC and GRCC
Risk appetite limits and targets are set to manage our exposure to equity and investment risk. An assessment of exposures against limits and targets as well as stress testing scenario analysis are performed and reported to BRCC and GRCC. As a matter of course, concentration risk is avoided and investments are well spread across geographies and industries.
The table below provides an analysis of income and revaluations recorded with respect to these investments.
For the year to 31 March R’million
Income/(loss) (pre-funding costs)
Unrealised** Realised** Dividends Other Total
Fair value through
equity
2017Unlisted investments (126) 100 243 – 217 (2)Listed equities (117) (9) 223 – 97 (47)Investment and trading properties (208) 29 – – (179) –Warrants, profit shares and other embedded derivatives
(18) 263 – – 245 –
The IEP Group – – – 303 303 –
Total (469) 383 466 303 683 (49)
2016
Unlisted investments (2 699) 3 597 185 – 1 083 (2)
Listed equities 91 (2) 200 – 289 207
Investments and trading properties (60) 75 _ – 15 _
Warrants, profit shares and other embedded derivatives
(56) 274 – – 218 –
Total (2 724) 3 944 385 – 1 605 205
** In a year of realisation, any prior period mark-to-market gains/losses recognised are reversed in the unrealised line item.
All realised and unrealised gains and losses are included in the capital base.
Investment risk in the banking book
Investment risk descriptionInvestment risk in the banking book arises primarily from the following activities conducted within the group:
• Principal Investments: Investments are selected based on the track record of management, the attractiveness of the industry and the ability to build value for the existing business by implementing an agreed strategy. Investments in listed
• Lending transactions: The manner in which we structure certain transactions results in equity, warrant and profit shares being held, predominantly within unlisted companies
• Property activities: We source development, investment and trading opportunities to create value and trade for profit within agreed risk parameters
• Central Funding: Central Funding is the custodian of certain equity and property investments.
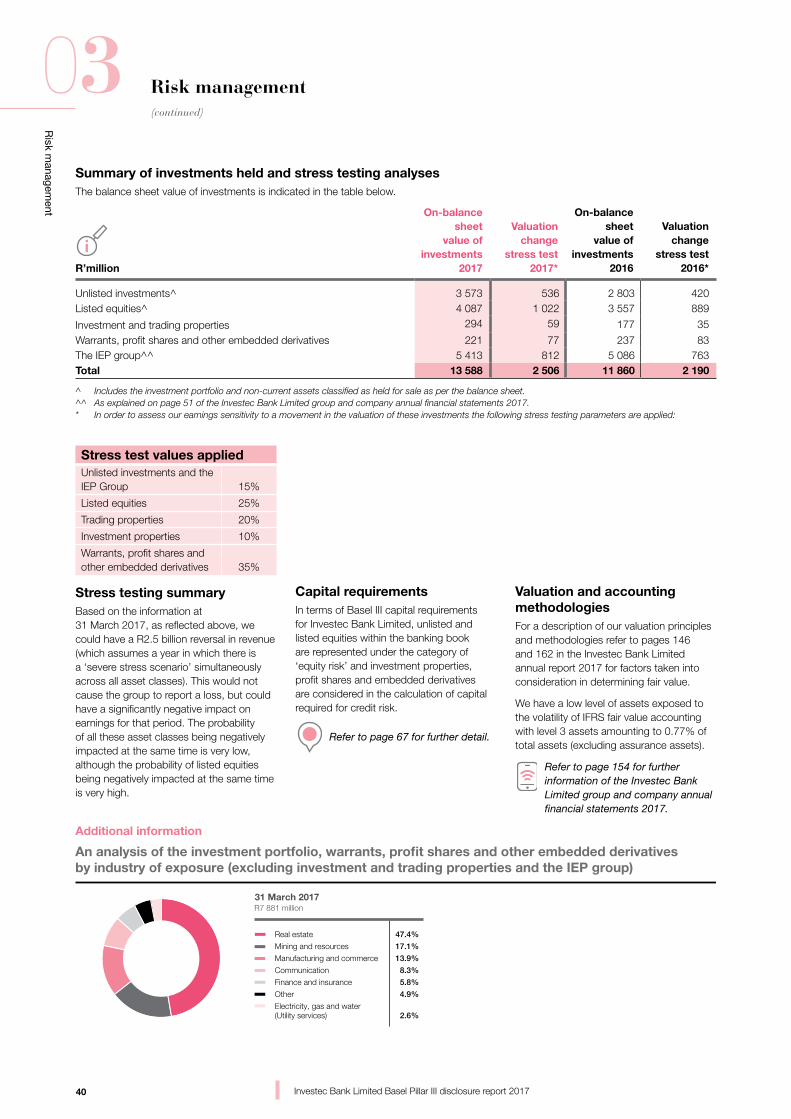
40
Risk m
anagement
03(continued)
Investec Bank Limited Basel Pillar III disclosure report 2017
Risk management
Summary of investments held and stress testing analysesThe balance sheet value of investments is indicated in the table below.
R’million
On-balance sheet
value of investments
2017
Valuation change
stress test2017*
On-balance sheet
value of investments
2016
Valuation change
stress test2016*
Unlisted investments^ 3 573 536 2 803 420Listed equities^ 4 087 1 022 3 557 889
Investment and trading properties 294 59 177 35
Warrants, profit shares and other embedded derivatives 221 77 237 83The IEP group^^ 5 413 812 5 086 763Total 13 588 2 506 11 860 2 190
^ Includes the investment portfolio and non-current assets classified as held for sale as per the balance sheet.^^ As explained on page 51 of the Investec Bank Limited group and company annual financial statements 2017.* In order to assess our earnings sensitivity to a movement in the valuation of these investments the following stress testing parameters are applied:
Additional information
An analysis of the investment portfolio, warrants, pro�t shares and other embedded derivatives by industry of exposure (excluding investment and trading properties and the IEP group)
R7 881 million
47.4%
17.1%
13.9%
8.3%
5.8%
4.9%
2.6%
31 March 2017
Real estate
Mining and resources
Manufacturing and commerce
Communication
Finance and insurance
Other
Electricity, gas and water (Utility services)
Stress test values appliedUnlisted investments and the IEP Group 15%
Listed equities 25%
Trading properties 20%
Investment properties 10%
Warrants, profit shares and other embedded derivatives 35%
Stress testing summaryBased on the information at 31 March 2017, as reflected above, we could have a R2.5 billion reversal in revenue (which assumes a year in which there is a ‘severe stress scenario’ simultaneously across all asset classes). This would not cause the group to report a loss, but could have a significantly negative impact on earnings for that period. The probability of all these asset classes being negatively impacted at the same time is very low, although the probability of listed equities being negatively impacted at the same time is very high.
Capital requirementsIn terms of Basel III capital requirements for Investec Bank Limited, unlisted and listed equities within the banking book are represented under the category of ‘equity risk’ and investment properties, profit shares and embedded derivatives are considered in the calculation of capital required for credit risk.
Refer to page 67 for further detail.
Valuation and accounting methodologiesFor a description of our valuation principles and methodologies refer to pages 146 and 162 in the Investec Bank Limited annual report 2017 for factors taken into consideration in determining fair value.
We have a low level of assets exposed to the volatility of IFRS fair value accounting with level 3 assets amounting to 0.77% of total assets (excluding assurance assets).
Refer to page 154 for further information of the Investec Bank Limited group and company annual financial statements 2017.
41
Risk m
anagement
03(continued)
Investec Bank Limited Basel Pillar III disclosure report 2017
Risk management
There is a clean-up call option than can be exercised at 10% of original notes issued. The margin on the notes increases at pre-specified intervals and coincides with the originator call option dates.
We have also sought out select opportunities in the credit/debt markets and traded in and purchased structured credit. These have largely been rated UK and European residential mortgage-backed securities (RMBS), totalling R0.9 billion at 31 March 2017 (31 March 2016: R0.8 billion) and unrated South African RMBS, totalling R0.9 billion at 31 March 2017 (31 March 2016: nil).
We determine regulatory capital requirements for securitised credit exposures based on specific regulatory rule sets which, at maximum, carry a risk weight of 1 250%. This is capped to the capital requirement had the bank been exposed to the entire portfolio. The group has no resecuritisation exposures.
Accounting policies
Refer to page 127 and 128 in the Investec Bank Limited group and company annual financial statements 2017.
We have securitised assets originated by our Private Client business. The primary motivations for the securitisation of these assets are to:
• Provide an alternative source of funding
• Act as a mechanism to transfer risk
• Leverage returns through the retention of equity tranches in low default rate portfolios
• Create a potential committed liquidity facility asset.
Total assets that have been originated and securitised by the Private Client division amount to R7.8 billion at 31 March 2017 (31 March 2016: R8.0 billion) and consist of residential mortgages (R7.8 billion). Within these securitisation vehicles loans greater than 90 days in arrears amounted to R11.9 million.
Further details of the various securitisation vehicles are highlighted below:
• Fox Street 2: R0.9 billion notes of the original R1.5 billion are still in issue. R247 million of the notes are held internally
• Fox Street 3: R1.4 billion notes of the original R2.0 billion are still in issue. All notes are held internally
• Fox Street 4: R2.6 billion notes of the original R3.7 billion are still in issue. All notes are held internally
• Fox Street 5: R2.6 billion notes of the original R2.9 billion are still in issue. All notes are held internally.
Securitisation/structured credit activities exposures
OverviewThe bank’s definition of securitisation/structured credit activities (as explained below) is wider than the definition as applied for regulatory capital purposes, which largely focuses on those securitisations in which the group has achieved significant risk transfer. We, however, believe that the information provided below is meaningful in that it groups all these related activities in order for a reviewer to obtain a fuller picture of the activities that we have conducted in this space. Some of the information provided below overlaps with the group’s credit and counterparty exposure information.
Refer to page 36 for the balance sheet and credit risk classification in the Investec Bank Limited group and company annual financial statements 2017.
Investec Bank Limited engages in transactions that involve the use of both special purpose entities and asset securitisation structures. Securitisation represents a relatively modest proportion of our current funding profile, but provides additional flexibility and a source of liquidity. Investec Bank Limited does not depend on special purpose vehicles for funding in its normal course of business. These entities form part of the consolidated group balance sheet as reported.
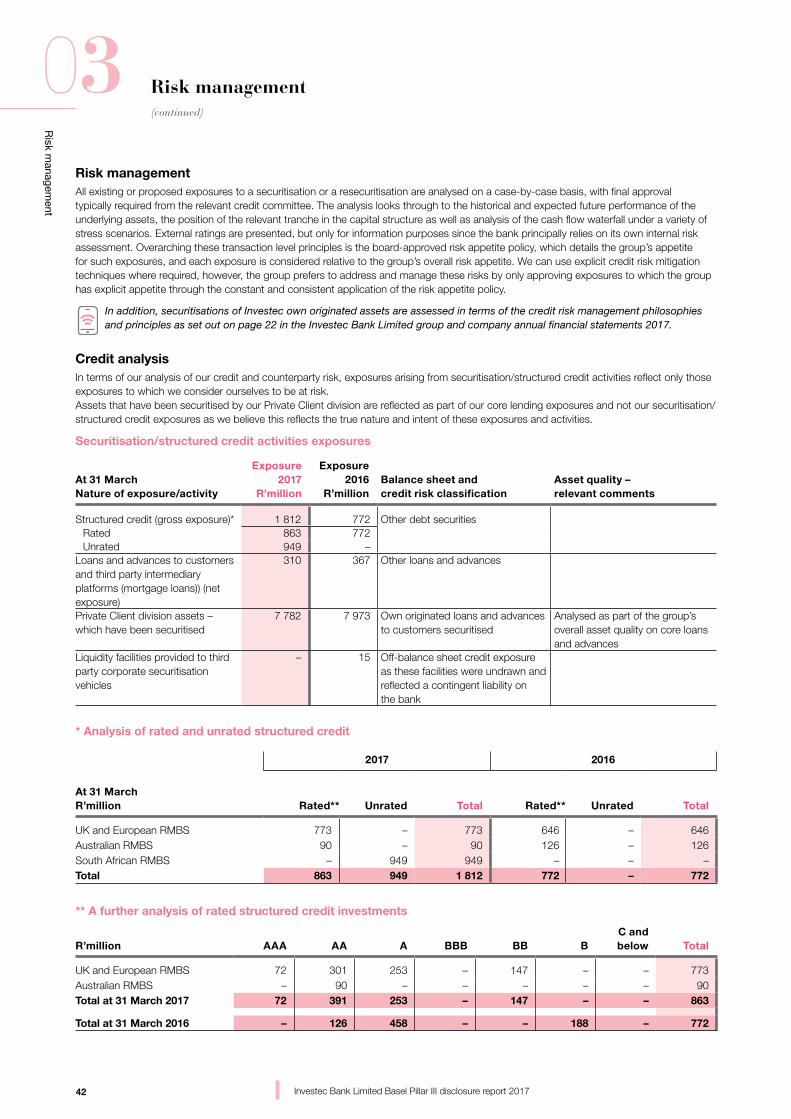
42
Risk m
anagement
03(continued)
Investec Bank Limited Basel Pillar III disclosure report 2017
Risk management
Risk managementAll existing or proposed exposures to a securitisation or a resecuritisation are analysed on a case-by-case basis, with final approval typically required from the relevant credit committee. The analysis looks through to the historical and expected future performance of the underlying assets, the position of the relevant tranche in the capital structure as well as analysis of the cash flow waterfall under a variety of stress scenarios. External ratings are presented, but only for information purposes since the bank principally relies on its own internal risk assessment. Overarching these transaction level principles is the board-approved risk appetite policy, which details the group’s appetite for such exposures, and each exposure is considered relative to the group’s overall risk appetite. We can use explicit credit risk mitigation techniques where required, however, the group prefers to address and manage these risks by only approving exposures to which the group has explicit appetite through the constant and consistent application of the risk appetite policy.
In addition, securitisations of Investec own originated assets are assessed in terms of the credit risk management philosophies and principles as set out on page 22 in the Investec Bank Limited group and company annual financial statements 2017.
Credit analysisIn terms of our analysis of our credit and counterparty risk, exposures arising from securitisation/structured credit activities reflect only those exposures to which we consider ourselves to be at risk. Assets that have been securitised by our Private Client division are reflected as part of our core lending exposures and not our securitisation/structured credit exposures as we believe this reflects the true nature and intent of these exposures and activities.
Securitisation/structured credit activities exposures
At 31 March Nature of exposure/activity
Exposure 2017
R’million
Exposure2016
R’millionBalance sheet and credit risk classification
Asset quality – relevant comments
Structured credit (gross exposure)* 1 812 772 Other debt securitiesRated 863 772 Unrated 949 –
Loans and advances to customers and third party intermediary platforms (mortgage loans)) (net exposure)
310 367 Other loans and advances
Private Client division assets – which have been securitised
7 782 7 973 Own originated loans and advances to customers securitised
Analysed as part of the group’s overall asset quality on core loans and advances
Liquidity facilities provided to third party corporate securitisation vehicles
– 15 Off-balance sheet credit exposure as these facilities were undrawn and reflected a contingent liability on the bank
* Analysis of rated and unrated structured credit
2017 2016
At 31 MarchR’million Rated** Unrated Total Rated** Unrated Total
UK and European RMBS 773 – 773 646 – 646 Australian RMBS 90 – 90 126 – 126 South African RMBS – 949 949 – – –Total 863 949 1 812 772 – 772
** A further analysis of rated structured credit investments
R’million AAA AA A BBB BB B C andbelow Total
UK and European RMBS 72 301 253 – 147 – – 773Australian RMBS – 90 – – – – – 90Total at 31 March 2017 72 391 253 – 147 – – 863
Total at 31 March 2016 – 126 458 – – 188 – 772
43
Risk m
anagement
03(continued)
Investec Bank Limited Basel Pillar III disclosure report 2017
Risk management
Market risk in the trading book
Traded market risk description Traded market risk is the risk that the value of a portfolio of instruments changes as a result of changes in underlying market risk factors such as interest rates, equity prices, commodity prices, exchange rates and volatilities. The market risk management team identifies, quantifies and manages this risk in accordance with Basel standards and policies determined by the board.
The focus of our trading activities is primarily on supporting client activity. Our strategic intent is that proprietary trading should be limited and that trading should be conducted largely to facilitate clients in deal execution. Within our trading activities, we act as principal with clients or the market. Market risk, therefore, exists where we have taken on principal positions resulting from market making, underwriting, investments and limited proprietary trading in the foreign exchange, capital and money markets. The focus of these businesses is primarily on supporting client activity.
Traded market risk governance structure To manage, measure and mitigate market risk, we have independent market risk management teams in each geography where we assume market risk. Local limits have been set to keep potential losses within acceptable risk tolerance levels.
A global market risk forum, mandated by the various boards of directors, manages the market risks in accordance with pre-approved principles and policies. Risk limits are reviewed and set at the global market risk forum and ratified at Review ERRF in accordance with the risk appetite defined by the board. The appropriateness of limits is continually assessed with limits reviewed at least annually, in the event of a significant market event or at the discretion of senior management.
Management and measurement of traded market riskMarket risk management teams review the market risks in the trading books. Detailed risk reports are produced daily for each trading desk and for the aggregate risk of the trading books.
These reports are distributed to management and traders. There is a formal process for management recognition and authorisation for any risk excesses incurred. The production of risk reports allows for the monitoring of all positions in the trading book against prescribed limits. Limits are set at trading desk level with aggregate risk across all desks also monitored against overall market risk appetite limits. Trading limits are generally tiered, taking into account liquidity and the inherent risks of traded instruments. Valuation models for new instruments or products are independently validated by market risk before trading can commence. Each traded instrument undergoes various stresses to assess potential losses.
Measurement techniques used to quantify market risk arising from our trading activities include sensitivity analysis, value at risk (VaR), stressed VaR (sVaR), expected shortfall (ES) and extreme value theory (EVT). Stress testing and scenario analysis are used to simulate extreme conditions to supplement these core measures.
VaR numbers are monitored daily at the 95% and 99% confidence intervals, with limits set at the 95% confidence interval. ESs are also monitored daily at the 95% and 99% levels as is the worst case loss in the VaR distribution. Scenario analysis considers the impact of a significant market event on our current trading portfolios. Scenario analysis is done at least once a week and is included in the data presented to Review ERRF.
The accuracy of the VaR model as a predictor of potential loss is continuously monitored through backtesting. This involves comparing the hypothetical (clean) trading revenues arising from the previous day’s closing positions with the one-day VaR calculated for the previous day on these same positions. If the revenue is negative and exceeds the one-day VaR, a backtesting exception is considered to have occurred. Over time we expect the average rate of observed backtesting exceptions to be consistent with the percentile of the VaR statistic being tested.
We have internal model approval from the SARB for general market risk for all trading desks with the exception of credit trading and therefore trading capital is calculated as a function of the 99% 10-day VaR as well as the 99% 10-day sVaR together with standardised specific risk capital for issuer
risk. Backtesting results and a detailed stress-testing pack are submitted to the regulator on a monthly basis.
The table on the following page contains the 95% one-day VaR figures for the trading businesses and the graphs that follow show the result of backtesting the total daily 99% one-day VaR against profit and loss figures for our trading activities over the reporting period. Based on these graphs, we can gauge the accuracy of the VaR figures, i.e. 99% of the time, the total trading activities are not expected to lose more than the 99% one-day VaR.
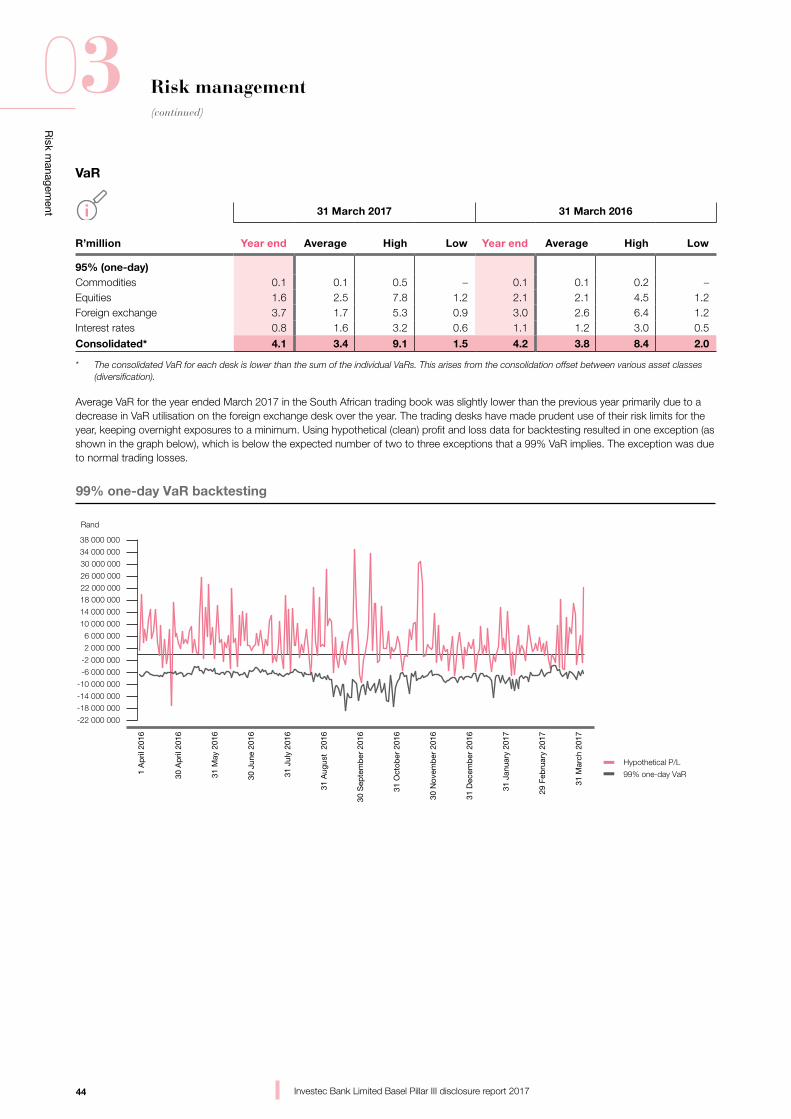
44
Risk m
anagement
03(continued)
Investec Bank Limited Basel Pillar III disclosure report 2017
Risk management
VaR
31 March 2017 31 March 2016
R’million Year end Average High Low Year end Average High Low
95% (one-day)Commodities 0.1 0.1 0.5 – 0.1 0.1 0.2 –Equities 1.6 2.5 7.8 1.2 2.1 2.1 4.5 1.2Foreign exchange 3.7 1.7 5.3 0.9 3.0 2.6 6.4 1.2Interest rates 0.8 1.6 3.2 0.6 1.1 1.2 3.0 0.5
Consolidated* 4.1 3.4 9.1 1.5 4.2 3.8 8.4 2.0
* The consolidated VaR for each desk is lower than the sum of the individual VaRs. This arises from the consolidation offset between various asset classes (diversification).
Average VaR for the year ended March 2017 in the South African trading book was slightly lower than the previous year primarily due to a decrease in VaR utilisation on the foreign exchange desk over the year. The trading desks have made prudent use of their risk limits for the year, keeping overnight exposures to a minimum. Using hypothetical (clean) profit and loss data for backtesting resulted in one exception (as shown in the graph below), which is below the expected number of two to three exceptions that a 99% VaR implies. The exception was due to normal trading losses.
Hypothetical P/L
99% one-day VaR
Rand
-22 000 000
-18 000 000
-14 000 000
-10 000 000
-6 000 000
-2 000 000
2 000 000
6 000 000
10 000 000
14 000 000
18 000 000
22 000 000
26 000 000
30 000 000
34 000 000
38 000 000
30 A
pril
201
6
1 A
pril
201
6
31 M
ay 2
016
30 J
une
2016
31 J
uly
2016
31 A
ugus
t 2
016
30 S
epte
mb
er 2
016
31 O
ctob
er 2
016
30 N
ovem
ber
201
6
31 D
ecem
ber
201
6
31 J
anua
ry 2
017
29 F
ebru
ary
2017
31 M
arch
201
7
99% one-day VaR backtesting
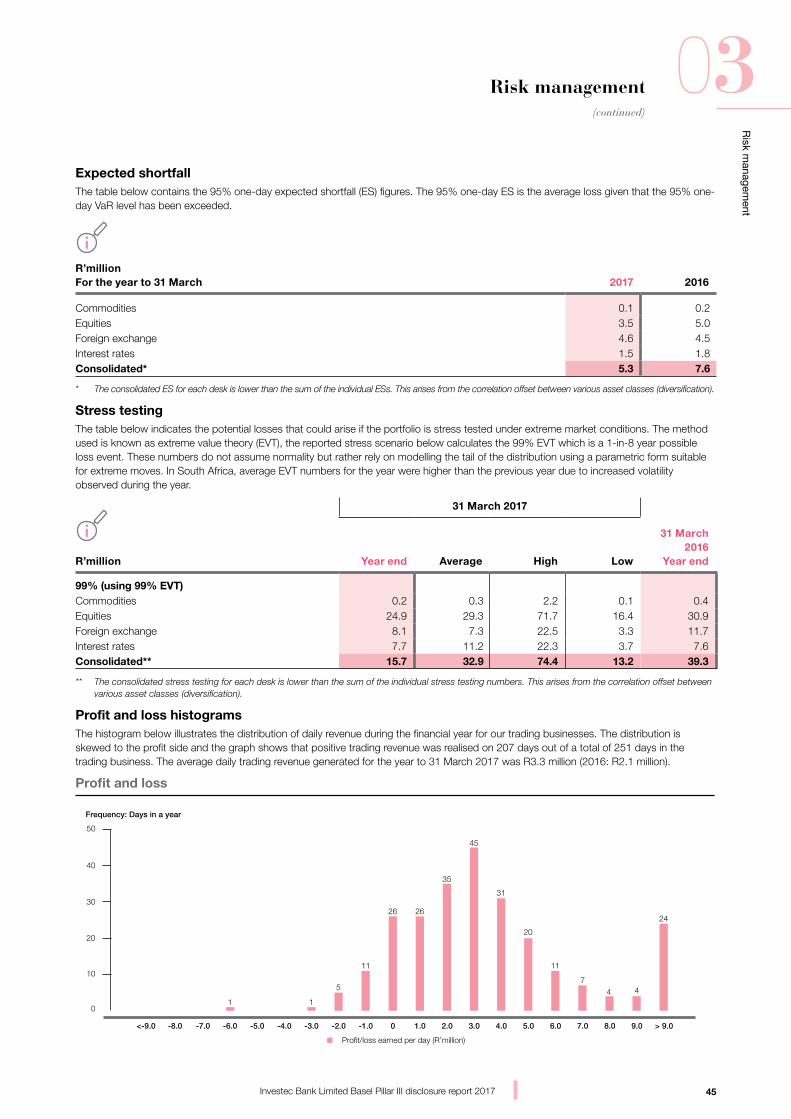
45
Risk m
anagement
03(continued)
Investec Bank Limited Basel Pillar III disclosure report 2017
Risk management
Expected shortfallThe table below contains the 95% one-day expected shortfall (ES) figures. The 95% one-day ES is the average loss given that the 95% one-day VaR level has been exceeded.
R’million For the year to 31 March 2017 2016
Commodities 0.1 0.2Equities 3.5 5.0Foreign exchange 4.6 4.5Interest rates 1.5 1.8Consolidated* 5.3 7.6
* The consolidated ES for each desk is lower than the sum of the individual ESs. This arises from the correlation offset between various asset classes (diversification).
Stress testingThe table below indicates the potential losses that could arise if the portfolio is stress tested under extreme market conditions. The method used is known as extreme value theory (EVT), the reported stress scenario below calculates the 99% EVT which is a 1-in-8 year possible loss event. These numbers do not assume normality but rather rely on modelling the tail of the distribution using a parametric form suitable for extreme moves. In South Africa, average EVT numbers for the year were higher than the previous year due to increased volatility observed during the year.
31 March 2017
R’million Year end Average High Low
31 March 2016
Year end
99% (using 99% EVT)Commodities 0.2 0.3 2.2 0.1 0.4Equities 24.9 29.3 71.7 16.4 30.9Foreign exchange 8.1 7.3 22.5 3.3 11.7Interest rates 7.7 11.2 22.3 3.7 7.6Consolidated** 15.7 32.9 74.4 13.2 39.3
** The consolidated stress testing for each desk is lower than the sum of the individual stress testing numbers. This arises from the correlation offset between various asset classes (diversification).
Profit and loss histogramsThe histogram below illustrates the distribution of daily revenue during the financial year for our trading businesses. The distribution is skewed to the profit side and the graph shows that positive trading revenue was realised on 207 days out of a total of 251 days in the trading business. The average daily trading revenue generated for the year to 31 March 2017 was R3.3 million (2016: R2.1 million).
Frequency: Days in a year
<-9.0 -8.0 -7.0 -6.0 -5.0 -4.0 -3.0 -2.0 -1.0 0 1.0 2.0 3.0 4.0 5.0 6.0 7.0 8.0 9.0 > 9.0
0
10
20
30
40
50
Profit/loss earned per day (R’million)
1 1
5
11
26 26
35
45
31
20
11
4 47
24
Pro�t and loss
46
Risk m
anagement
03(continued)
Investec Bank Limited Basel Pillar III disclosure report 2017
Risk management
Traded market risk mitigationThe market risk management team has a reporting line that is separate from the trading function, thereby ensuring independent oversight. The risk management software is fully integrated with source trading systems, allowing valuation in risk and trading systems to be fully aligned. All valuation models are subject to independent validation, ensuring models used for valuation and risk are validated independently of the front office.
Risk limits are set according to guidelines set out in our risk appetite policy and are set on a statistical and non-statistical basis. Statistical limits include VaR and ES. Full revaluation historical simulation VaR is used over a two-year historical period based on an unweighted time series. Every risk factor is exposed to daily moves with proxies only used when no or limited price history is available, and the resultant one-day VaR is scaled up to a 10-day VaR using the square root of time rule for regulatory purposes. Daily moves are based on both absolute and relative returns as appropriate for the different types of risk factors. Time series data used to calculate these moves is updated on at least a monthly basis. Stressed VaR is calculated in the same way based on a one-year historical period of extreme volatility. The current sVaR period used is mid-2008 to mid-2009, which relates to high levels of volatility experienced during the financial crisis in all markets in which the business holds trading positions.
Non-statistical limits include limits on risk exposure to individual products, transaction tenors, notionals, liquidity, tenor buckets and sensitivities. Current market conditions are taken into account when setting and reviewing these limits.
Risk software is fully integrated with trading systems, while independence is maintained through independent validation of all models and market data used for valuation.
Traded market risk year in reviewTrading conditions have been volatile. The increased volatility has also been impacted by unusual local factors, in particular, political policy uncertainty. The trading desks have benefited from this volatility. All trading areas have kept market risk exposures at low levels throughout the year, with minimal overnight risk taken.
of liquidity risk and non-trading interest rate risk within a board-approved risk appetite.
The size, materiality, complexity, maturity and depth of the market as well as access to stable funds are all inputs considered when establishing the liquidity and non-trading interest rate risk appetite for each geographic region. Specific statutory requirements may further dictate special policies to be adopted in a region.
Detailed policies cover both domestic and foreign currency funds and set out sources and amounts of funds necessary to ensure the continuation of our operations without undue interruption. We aim to match-fund in currencies, where it is practical and efficient to do so and hedge any residual currency exchange risk arising from deposit and loan banking activities.
In terms of regulatory requirements and the group’s liquidity policy, Investec plc (and its subsidiaries) are ring-fenced from Investec Limited (and its subsidiaries) (and vice versa) and both legal entities are therefore required to be self-funded.
The ALCOs comprise the group risk director, the head of balance sheet risk, the head of risk, the head of corporate and institutional banking activities, head of private banking distribution channels, economists, the treasurer, divisional heads, and the balance sheet risk management team. The ALCOs formally meet on a monthly basis to review the exposures that lie within the balance sheet together with market conditions, and decide on strategies to mitigate any undesirable liquidity risk and non-trading interest rate risk. The Central Treasury function within each region is mandated to holistically manage the liquidity mismatch and non-trading interest rate risk arising from our asset and liability portfolios on a day-to-day basis.
The treasurers are required to exercise tight control of funding, liquidity, concentration and non-trading interest rate risk within parameters defined by the board-approved risk appetite policy. Non-trading interest rate risk and asset funding requirements are transferred from the originating business to the treasury function.
The central treasury, by core geography, directs pricing for all deposit products, establishes and maintains access to stable funds with the appropriate tenor and pricing characteristics, and manages liquid securities and collateral, thus providing
Market risk – derivatives
We enter into various derivatives contracts, largely on the back of customer flow for hedging foreign exchange, commodity, equity and interest rate exposures and to a small extent as principal for trading purposes. These include financial futures, options, swaps and forward rate agreements. The risks associated with derivative instruments are monitored in the same manner as for the underlying instruments. Risks are also measured across the product range to take into account possible correlations.
Information showing our derivative trading portfolio over the reporting period on the basis of the notional principal and the fair value of all derivatives can be found on pages 170 and 171 in the Investec Bank Limited group and company annual financial statements 2017.
The notional principal indicates our activity in the derivatives market and represents the aggregate size of total outstanding contracts at year end. The fair value of a derivative financial instrument represents the present value of the positive or negative cash flows which would have occurred had we closed out the rights and obligations arising from that instrument in an orderly market transaction at year end. Both these amounts reflect only derivatives exposure and exclude the value of the physical financial instruments used to hedge these positions.
Balance sheet risk management
Balance sheet risk descriptionBalance sheet risk encompasses the financial risks relating to our asset and liability portfolios, comprising market liquidity, funding, concentration, encumbrance and non-trading interest rate risk.
Balance sheet risk governance structure and risk mitigationUnder delegated authority of the board, the group has established asset and liability management committees (ALCOs) within each core geography in which it operates, using regional expertise and local market access as appropriate. The ALCOs are mandated to ensure independent supervision
47
Risk m
anagement
03(continued)
Investec Bank Limited Basel Pillar III disclosure report 2017
Risk management
prudential management and a flexible response to volatile market conditions. The Central Treasury functions are the sole interface to the market for both cash and derivative transactions.
We maintain an internal funds transfer pricing system based on prevailing market rates. Our funds transfer pricing system charges the businesses the price of short-term and long-term liquidity taking into account the behavioural duration of the asset. The costs and risks of liquidity are clearly and transparently attributed to business lines and are understood by business line management, thereby ensuring that price of liquidity is integrated into business level decision-making and drives the appropriate mix of sources and uses of funds.
The balance sheet risk management team, in their respective geographies based within Group Risk Management, independently identify, quantify and monitor risks, providing daily independent governance and oversight of the treasury activities and the execution of the bank’s policy, continuously assessing the risks while taking changes in market conditions into account. In carrying out its duties, the balance sheet risk management team monitors historical liquidity trends, tracks prospective on- and off-balance sheet liquidity obligations, identifies and measures internal and external liquidity warning signals which permit early detection of potential liquidity concerns through daily liquidity reporting, and further perform scenario analysis which quantifies our exposure, thus providing a comprehensive and consistent governance framework. The balance sheet risk management team proactively identifies proposed regulatory developments, best risk practice, and measures adopted in the broader market, and implements changes to the bank’s risk management and governance framework where relevant.
Scenario modelling and rigorous daily liquidity stress tests are designed to measure and manage the liquidity position such that payment obligations can be met under a wide range of company-specific and market-driven stress scenarios. These assume the rate and timing of deposit withdrawals and drawdowns on lending facilities are varied, and the ability to access funding and to generate funds from asset portfolios is restricted.
liquidity risk on both a current and forward looking basis. The system is reconciled to the bank’s general ledger and audited by Internal and External Audit thereby ensuring integrity of the process.
Daily, weekly and monthly reports are independently produced highlighting bank activity, exposures and key measures against thresholds and limits and are distributed to management, ALCO, the Central Treasury function, Review ERRF, GRCC, BRCC as well as board summarised reports for board meetings.
Statutory reports are submitted to the relevant regulators in each jurisdiction within which we operate.
Liquidity risk Liquidity risk descriptionLiquidity risk refers to the possibility that, despite being solvent, we have insufficient capacity to fund increases in assets, or are unable to meet our payment obligations as they fall due, without incurring unacceptable losses. This includes repaying depositors or maturing wholesale debt. This risk is inherent in all banking operations and can be impacted by a range of institution-specific and market-wide events.
Liquidity risk is further broken down into:• Funding liquidity: this relates to the risk
that the bank will be unable to meet current and/or future cash flow or collateral requirements in the normal course of business, without adversely affecting its financial position or its reputation
• Market liquidity: this relates to the risk that the bank may be unable to trade in specific markets or that it may only be able to do so with difficulty due to market disruptions or a lack of market liquidity.
Sources of liquidity risk include:• Unforeseen withdrawals of deposits
• Restricted access to new funding with appropriate maturity and interest rate characteristics
• Inability to liquidate a marketable asset in a timely manner with minimal risk of capital loss
• Unpredicted customer non-payment of loan obligations
• A sudden increased demand for loans in the absence of corresponding funding inflows of appropriate maturity.
The parameters used in the scenarios are reviewed regularly, taking into account changes in the business environments and input from business units. The objective is to analyse the possible impact of an economic event risk on cash flow, liquidity, profitability and solvency position, so as to maintain sufficient liquidity, in an acute stress, to continue to operate for a minimum period as detailed in the board-approved risk appetite.
We further carry out reverse stress tests to identify business model vulnerabilities which tests ‘tail risks’ that can be missed in normal stress tests. The group has calculated the severity of stress required to breach the liquidity requirements. This scenario is considered highly unlikely given the group’s strong liquidity position, as it requires an extreme withdrawal of deposits combined with the inability to take any management actions to breach liquidity minima that threatens Investec’s liquidity position.
The integrated balance sheet risk management framework is based on similar methodologies to those contemplated under the Basel Committee on Banking Supervision’s (BCBS) ‘International framework for liquidity risk measurement, standards and monitoring’ and is compliant with the ‘principles for sound liquidity risk management and supervision’ as well as ‘principles for management and supervision of interest rate risk in the banking book’.
Each banking entity within the group maintains a contingency funding plan designed to protect depositors, creditors and shareholders and maintain market confidence during adverse liquidity conditions and pave the way for the group to emerge from a potential funding crisis with the best possible reputation and financial condition for continuing operations. The liquidity contingency plans outline extensive early warning indicators, clear lines of communication, and decisive crisis response strategies.
There is a regular audit of the Balance Sheet Risk Management function, the frequency of which is determined by the independent audit committees.
The group operates an industry-recognised third party risk modelling system in addition to custom-built management information systems designed to measure and monitor
48
Risk m
anagement
03(continued)
Investec Bank Limited Basel Pillar III disclosure report 2017
Risk management
Management and measurement of liquidity riskMaturity transformation performed by banks is a crucial part of financial intermediation that contributes to efficient resource allocation and credit creation.
Cohesive liquidity management is vital for protecting our depositors, preserving market confidence, safeguarding our reputation and ensuring sustainable growth with established funding sources. Through active liquidity management, we seek to preserve stable, reliable and cost-effective sources of funding. As such, the group considers ongoing access to appropriate liquidity for all its operations to be of paramount importance, and our core liquidity philosophy is reflected in day-to-day practices which encompass the following robust and comprehensive set of policies and procedures for assessing, measuring and controlling the liquidity risk:
• The group complies with the BCBS principles for sound liquidity risk management and supervision
• Our liquidity management processes encompass principles set out by the regulatory authorities in each jurisdiction, namely the SARB and BOM
• The risk appetite is clearly defined by the board and each geographic entity must have its own board-approved policies with respect to liquidity risk management
• We maintain a liquidity buffer in the form of unencumbered cash, government or rated securities (typically eligible for repurchase with the central bank), and near cash well in excess of the statutory requirements as protection against unexpected disruptions in cash flows
• Funding is diversified with respect to currency, term, product, client type and counterparty to ensure a satisfactory overall funding mix
• We monitor and evaluate each banking entity’s maturity ladder and funding gap (cash flow maturity mismatch) on a ‘liquidation’, ‘going concern’ and ‘stress’ basis
• Basel standards for liquidity measurement:
– Liquidity Coverage Ratio (LCR)
– Net Stable Funding Ratio (NSFR)
• Stress scenarios based on statistical historical analysis, documented experience and prudent judgement
• Quantification of a ‘survival horizon’ under stress conditions. The survival horizon is the number of business days it takes before the bank’s cash position turns negative
• Other key funding and balance sheet ratios
• Monitoring and analysing market trends and the external environment.
This ensures the smooth management of the day-to-day liquidity position within conservative parameters and further validates that we are able to generate sufficient liquidity to withstand short-term liquidity stress or market disruptions in the event of either a firm-specific or general market contingent event.
We maintain a funding structure with stable customer deposits and long-term wholesale funding well in excess of illiquid assets. We target a diversified funding base, avoiding undue concentrations by investor type, maturity, market source, instrument and currency. This validates our ability to generate funding from a broad range of sources in a variety of geographic locations, which enhances financial flexibility and limits dependence on any one source so as to ensure a satisfactory overall funding mix to support loan growth.
We acknowledge the importance of our private client base as the principal source of stable and well diversified funding for Investec’s risk assets. We continue to develop products to attract and service the investment needs of our Private Bank client base. We also have a number of innovative retail deposit initiatives within our Private Banking division and these continued to experience strong inflows during the financial year. Customer deposits have continued to grow during the year and our customers display a strong ‘stickiness’
• The balance sheet risk management team independently monitors key daily funding metrics and liquidity ratios to assess potential risks to the liquidity position, which further act as early warning indicators of potential normal market disruption
• The maintenance of sustainable prudent liquidity resources takes precedence over profitability
• The group maintains adequate contingency funding plans designed to protect depositors, creditors and shareholders and maintain market confidence during adverse liquidity conditions.
Our liquidity risk management reflects evolving best practice standards in light of the challenging environment. Liquidity risk management encompasses the ongoing management of structural, tactical day-to-day and contingent stress liquidity.
Management uses assumptions-based planning and scenario modelling that considers market conditions, prevailing interest rates and projected balance sheet growth, to estimate future funding and liquidity needs while taking the desired nature and profile of liabilities into account. These metrics are used to develop our funding strategy and measure and manage the execution thereof. The funding plan details the proportion of our external assets which are funded by customer liabilities, unsecured wholesale debt, equity and loan capital, thus maintaining an appropriate mix of structural and term funding, resulting in strong balance sheet liquidity ratios.
We measure liquidity risk by quantifying and calculating various liquidity risk metrics and ratios to assess potential risks to the liquidity position. Metrics and ratios include:
• Local regulatory requirements
• Contractual run-off based actual cash flows with no modelling adjustment
• ‘Business as usual’ normal environment where we apply rollover and reinvestment assumptions under benign market conditions
49
Risk m
anagement
03(continued)
Investec Bank Limited Basel Pillar III disclosure report 2017
Risk management
and willingness to reinvest in our suite of savings, term and notice products.
Entities within the group actively participate in global financial markets and our relationship is continuously enhanced through regular investor presentations internationally. Entities are only allowed to have funding exposure to wholesale markets where they can demonstrate that the market is sufficiently deep and liquid, and then only relative to the size and complexity of their business. We have instituted various offshore syndicated loan programmes to broaden and diversify term funding in supplementary markets and currencies, enhancing the proven capacity to borrow in the money markets. The group remains committed to increasing its core deposits and accessing domestic and foreign capital markets when appropriate. Decisions on the timing and tenor of accessing these markets are based on relative costs, general market conditions, prospective views of balance sheet growth and a targeted liquidity profile.
The group’s ability to access funding at cost-effective levels is influenced by maintaining or improving the entity’s credit rating. A reduction in these ratings could have an adverse effect on the group’s funding costs, and access to wholesale term funding. Credit ratings are dependent on multiple factors, including operating environment, business model, strategy, capital adequacy levels, quality of earnings, risk appetite and exposure, and control framework.
We hold a liquidity buffer in the form of cash, unencumbered high quality liquid assets (typically in the form of government or rated securities eligible for repurchase with the central bank), and near cash, well in excess of the statutory requirements as protection against unexpected disruptions in cash flows. These portfolios are managed within board approved targets, and apart from acting as a buffer under going concern conditions, also form an integral part of the broader liquidity generation strategy. Investec remains a net liquidity provider to the interbank market, placing significantly more funds with other banks than our short-term interbank borrowings. We do not rely on interbank deposits to fund term lending.
The bank uses secured transactions to manage short-term cash and collateral needs. Details of assets pledged through repurchase activity and collateral pledges are reported by line item of the balance sheet on which they are reflected on page 167. Related liabilities are also reported.
On page 167 of the Investec Bank Limited group and company annual financial statements 2017 we disclose further details of assets that have been received as collateral under reverse repurchase agreements and securities borrowing transactions where the assets are allowed to be resold or pledged.
From 1 April 2016 to 31 March 2017 average cash and near cash balances over the period amounted to R125 billion.
We are currently unaware of any circumstances that could significantly detract from our ability to raise funding appropriate to our needs.
The liquidity contingency plans outline extensive early warning indicators, clear lines of communication and decisive crisis response strategies. Early warning indicators span both bank-specific and systemic crises. Rapid response strategies address:
• action plans
• roles and responsibilities
• composition of decision-making bodies involved in liquidity crisis management
• internal and external communications including public relations
• sources of liquidity
• avenues available to access additional liquidity
• supplementary information requirements required to manage liquidity during such an event.
This plan helps to ensure that cash flow estimates and commitments can be met in the event of general market disruption or adverse bank-specific events, while minimising detrimental long-term implications for the business.
Asset encumbranceAn asset is defined as encumbered if it has been pledged as collateral against an existing liability and, as a result, is no longer available to the group to secure funding, satisfy collateral needs or be sold to reduce the funding requirement. An asset is therefore categorised as unencumbered if it has not been pledged against an existing liability.
The bank utilises securitisation in order to raise external term funding as part of its diversified liability base. Securitisation notes issued are also retained by the group which are available to provide a pool of collateral eligible to support central bank liquidity facilities.
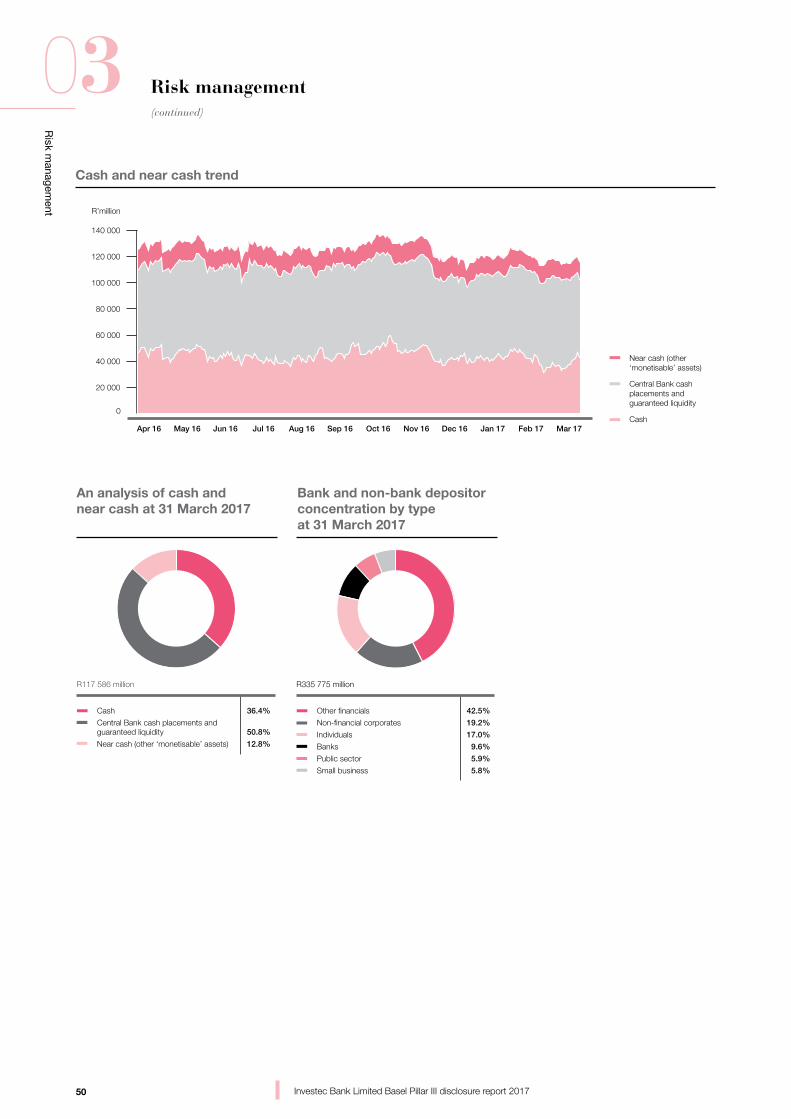
50
Risk m
anagement
03(continued)
Investec Bank Limited Basel Pillar III disclosure report 2017
Risk management
R’million
0
20 000
40 000
60 000
80 000
100 000
120 000
140 000
Apr 16 May 16 Jun 16 Jul 16 Aug 16 Sep 16 Oct 16 Nov 16 Dec 16 Jan 17 Feb 17 Mar 17
Near cash (other ‘monetisable’ assets)
Central Bank cash placements and guaranteed liquidity
Cash
Cash and near cash trend
An analysis of cash and near cash at 31 March 2017
Bank and non-bank depositor concentration by type at 31 March 2017
R117 586 million
36.4%
50.8%
12.8%
Cash
Central Bank cash placements and guaranteed liquidity
Near cash (other ‘monetisable’ assets)
R335 775 million
42.5%
19.2%
17.0%
9.6%
5.9%
5.8%
Other financials
Non-financial corporates
Individuals
Banks
Public sector
Small business
51
Risk m
anagement
03(continued)
Investec Bank Limited Basel Pillar III disclosure report 2017
Risk management
The liquidity position of the bank remained sound with total cash and near cash balances amounting to R118 billion
Liquidity mismatchThe table that follows show our contractual liquidity mismatch across our business.
The table will not agree directly to the balances disclosed in the balance sheet since the tables incorporate cash flows on a contractual, undiscounted basis based on the earliest date on which the group can be required to pay.
The tables reflect that loans and advances to customers are financed by stable funding sources.
With respect to the contractual liquidity mismatch:
• No assumptions are made except as mentioned below, and we record all assets and liabilities with the underlying contractual maturity as determined by the cash flow profile for each deal
• As an integral part of the broader liquidity generation strategy, we maintain a liquidity buffer in the form of unencumbered cash, government, or rated securities and near cash against both expected and unexpected cash flows
• The actual contractual profile of the assets in the liquidity buffer is of little consequence, as practically the bank would meet any unexpected net cash outflows by repo’ing or selling these securities. We have:
– set the time horizon to ‘on demand’ to monetise our statutory liquid assets for which liquidity is guaranteed by the central bank;
– set the time horizon to one month to monetise our cash and near cash portfolio of ‘available-for-sale’ discretionary treasury assets, where there are deep secondary markets for this elective asset class; and
– reported the ‘contractual’ profile by way of a note to the tables.
With respect to the behavioural liquidity mismatch:
• Behavioural liquidity mismatch tends to display a high probability, low severity liquidity position. Many retail deposits, which are included within customer accounts, are repayable on demand or at short notice on a contractual basis. In practice, these instruments form a stable base for the group’s operations and liquidity needs because of the broad base of customers. To this end, behavioural profiling is applied to liabilities with an undefined maturity, as the contractual repayments of many customer accounts are on demand or at short notice but expected cash flows vary significantly from contractual maturity. An internal analysis model is used, based on statistical research of the historical series of products. This is used to identify significant additional sources of structural liquidity in the form of core deposits that exhibit stable behaviour. In addition, reinvestment behaviour, with profile and attrition based on history, is applied to term deposits in the normal course of business.
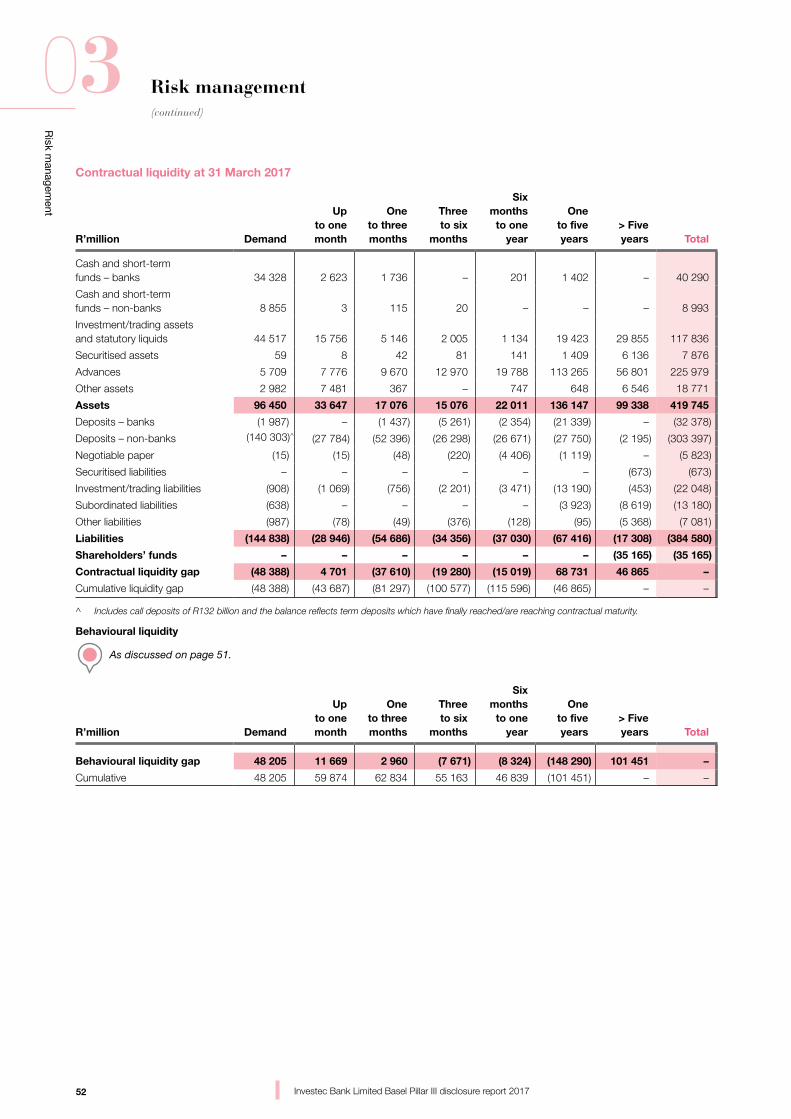
52
Risk m
anagement
03(continued)
Investec Bank Limited Basel Pillar III disclosure report 2017
Risk management
Contractual liquidity at 31 March 2017
R’million Demand
Up to one
month
One to three months
Three to six
months
Six months to one
year
One to five years
> Five years Total
Cash and short-term funds – banks 34 328 2 623 1 736 – 201 1 402 – 40 290
Cash and short-term funds – non-banks 8 855 3 115 20 – – – 8 993
Investment/trading assets and statutory liquids 44 517 15 756 5 146 2 005 1 134 19 423 29 855 117 836
Securitised assets 59 8 42 81 141 1 409 6 136 7 876
Advances 5 709 7 776 9 670 12 970 19 788 113 265 56 801 225 979
Other assets 2 982 7 481 367 – 747 648 6 546 18 771
Assets 96 450 33 647 17 076 15 076 22 011 136 147 99 338 419 745
Deposits – banks (1 987) – (1 437) (5 261) (2 354) (21 339) – (32 378)
Deposits – non-banks (140 303)^ (27 784) (52 396) (26 298) (26 671) (27 750) (2 195) (303 397)
Negotiable paper (15) (15) (48) (220) (4 406) (1 119) – (5 823)
Securitised liabilities – – – – – – (673) (673)
Investment/trading liabilities (908) (1 069) (756) (2 201) (3 471) (13 190) (453) (22 048)
Subordinated liabilities (638) – – – – (3 923) (8 619) (13 180)
Other liabilities (987) (78) (49) (376) (128) (95) (5 368) (7 081)
Liabilities (144 838) (28 946) (54 686) (34 356) (37 030) (67 416) (17 308) (384 580)
Shareholders’ funds – – – – – – (35 165) (35 165)
Contractual liquidity gap (48 388) 4 701 (37 610) (19 280) (15 019) 68 731 46 865 –
Cumulative liquidity gap (48 388) (43 687) (81 297) (100 577) (115 596) (46 865) – –
^ Includes call deposits of R132 billion and the balance reflects term deposits which have finally reached/are reaching contractual maturity.
Behavioural liquidity
As discussed on page 51.
R’million Demand
Up to one
month
One to three months
Three to six
months
Six months to one
year
One to five years
> Five years Total
Behavioural liquidity gap 48 205 11 669 2 960 (7 671) (8 324) (148 290) 101 451 –
Cumulative 48 205 59 874 62 834 55 163 46 839 (101 451) – –
53
Risk m
anagement
03(continued)
Investec Bank Limited Basel Pillar III disclosure report 2017
Risk management
The group has committed itself to implementation of the BCBS guidelines for liquidity risk measurement standards and the enhanced regulatory framework to be established
Balance sheet risk year in review• Investec maintained its strong liquidity
position and continued to hold high levels of surplus liquid assets
• We sustained strong term funding in demanding market conditions while focusing on lowering the weighted average cost of funding
• Our liquidity risk management process remains robust and comprehensive.
During the past financial year the liquidity risk profile of the balance sheet has improved. Investec grew its total customer deposits by 8.5% from R280 billion to R303 billion at 31 March 2017. Our Private Bank and Cash Investments fund raising channels grew deposits by 13% to R124 billion over the financial year. Over the same period the wholesale channels remained flat at R179 billion. This included several successful senior unsecured bond issues totalling R4.6 billion. As a result Investec decreased its reliance on wholesale funding from 60.7% to 59.1% over the financial year.
The impact on our liquidity ratios was positive. The three month average LCR for Investec Bank solo increased from 117.3% to 130.0% which is well above the minimum level of 80% required. By January 2019 the LCR minimum requirement moves to 100% and we remain confident of our ability to comfortably exceed this requirement whilst continuing to meet planned asset growth targets. The NSFR will also have to exceed 100% by January 2018. We are well positioned to meet this regulatory liquidity measure as currently our ratios exceed this requirement.
Three and five year term foreign currency loan deals totalling US$835 million were concluded this financial year. Our USD funding augments our cash and near cash balances, with core loans remaining fully funded by domestic deposits.
In order to improve our return on assets, lower yielding cash and near cash balances have been deliberately paired back ending the financial year at R118 billion.
In conclusion we remain well positioned to meet the challenges that heightened political instability may bring in the new financial year.
Regulatory considerations – balance sheet riskIn response to the global financial crisis, national and supranational regulators have introduced changes to laws and regulations designed to both strengthen and harmonise global capital and liquidity standards to ensure a strong financial sector and global economy.
Two key liquidity measures were defined:
• The liquidity coverage ratio (LCR) is designed to promote short-term resilience of one-month liquidity profile, by ensuring that banks have sufficient high quality liquid assets to meet potential outflows in a stressed environment. The BCBS published the final calibration of the LCR in January 2013. The LCR ratio is being phased in from 2015 to 2019
• The net stable funding ratio (NSFR) is designed to capture structural issues over a longer time horizon by requiring banks to have a sustainable maturity structure of assets and liabilities. The BCBS published the final document on the NSFR in October 2014. The NSFR is expected to be introduced in 2018.
Investec already exceeds minimum requirements of these standards (see LCR shown above) as a result of efforts to reshape our liquidity and funding profile where deemed necessary.
South Africa, a member of the G20, has adopted the published BCBS guidelines for ‘liquidity risk measurement standards and monitoring’.
However, there are certain shortcomings and constraints in the South African environment and the banking sector in South Africa is characterised by certain structural features such as:
• A low discretionary savings rate and a higher degree of contractual savings that are captured by institutions such as pension funds, provident funds and providers of asset management services
• There is currently no ‘deposit protection scheme’ in South Africa. However, the regulators plan to incorporate a deposit protection scheme within the broader amendments to the recovery and resolution framework
• South Africa has an insufficient supply of level 1 assets in domestic currency to meet the aggregate demand.
Nevertheless, there are various regulatory and economic barriers that prevent liquidity from flowing out of the domestic economy. Namely, South Africa has exchange control that limits capital flows, along with prudential requirements on financial corporates.
A positive consequence of the above is that the Rand funding that the South African banks use is contained within the financial system and therefore the Rand is unlikely to be drained by currency withdrawal from off-shore sources, or placements in offshore accounts.
To address this systemic challenge, the SARB exercised national discretion and has announced:
• The introduction of a committed liquidity facility (CLF) whereby South African banks can apply to the Reserve Bank for the CLF against eligible collateral for a prescribed commitment fee. The CLF is limited to 40% of net outflows under the LCR. Investec Bank Limited used the CLF offered by the SARB, as a buffer, to augment the LCR by approximately 10% until December 2016, and 5% to the end of the financial year. Investec Bank Limited exceeds the minimum requirement for the LCR in March 2017
• A change to available stable funding factor as applied to less than six months term deposits from the financial sector. The change recognises 35% of less than six months financial sector deposits which has the impact of reducing the amount of greater than six months term deposits required by local banks to meet the NSFR.
Notwithstanding the above constraints, the bank is fully compliant with the LCR and, NSFR liquidity ratios, having embedded these ratios into our processes.
Non-trading interest rate risk descriptionNon-trading interest rate risk, otherwise known as interest rate risk in the banking book, arises from the impact on net interest-earnings and economic value of equity of adverse movements in interest rates.
54
Risk m
anagement
03(continued)
Investec Bank Limited Basel Pillar III disclosure report 2017
Risk management
Sources of interest rate risk include:
• Repricing risk: arises from the timing differences in the fixed rate maturity and floating rate repricing of bank assets, liabilities and off-balance sheet derivative positions. This affects the interest rate margin realised between lending income and borrowing costs when applied to our rate sensitive portfolios
• Yield curve risk: repricing mismatches also expose the bank to changes in the slope and shape of the yield curve
• Basis risk: arises from imperfect correlation in the adjustments of the rates earned and paid on different instruments with otherwise similar repricing characteristics
• Embedded option risk: arises from optional elements embedded in items where the bank or its customers can alter the level and timing of their cash flows
• Endowment risk: refers to the interest rate risk exposure arising from the net differential between interest rate insensitive assets, interest rate insensitive liabilities and capital.
The above sources of interest rate risk affect the interest rate margin realised between lending income and borrowing costs, when applied to our rate sensitive asset and liability portfolios, which has a direct effect on future net interest income and the economic value of equity.
Management and measurement of non-trading interest rate riskNon-trading interest rate risk in the banking book is an inherent consequence of conducting banking activities, and arises from the provision of retail and wholesale (non-trading) banking products and services. The group considers the management of banking margin of importance, and our core non-trading interest rate risk philosophy is reflected in day-to-day practices.
The aim of non-trading interest rate risk management is to protect and enhance net interest income and economic value of equity in accordance with the board-approved risk appetite, and to ensure a high degree of stability of the net interest margin over an interest rate cycle. Non-trading interest rate risk is measured and analysed by utilising standard tools of traditional interest rate repricing mismatch and NPV sensitivity to changes in interest rate risk factors:
• Income metrics capture the change in accruals expected over a specified
time horizon in response to a change in interest rates
• Economic value metrics capture all future cash flows in order to calculate the bank’s net worth and therefore can highlight risks beyond the short-term earnings time horizon.
These metrics are used to assess and to communicate to senior management the financial impact of possible future interest rate scenarios, covering (i) interest rate expectations and perceived risks to the central view (ii) standard shocks to levels and shapes of interest rates and yield curves (iii) historically-based yield curve changes.
The repricing gap provides a basic representation of the balance sheet, with the sensitivity of earnings to changes to interest rates calculated off the repricing gap. This allows for the detection of interest rate risk by concentration of repricing buckets. Net interest income sensitivity measures the change in accruals expected over the specified horizon in response to a shift in the yield curve, while economic value sensitivity and stress testing to macro-economic movement or changes to the yield curve measures the interest risk implicit change in net worth as a result of a change in interest rates on the current values of financial assets and liabilities. Economic value measures have the advantage that all future cash flows are considered and therefore can highlight risk beyond the earnings horizon.
Each geographic entity has its own board-approved non-trading interest rate risk policy and risk appetite, which is clearly defined in relation to both income risk and economic value risk. The policy dictates that long-term (>1 year) non-trading interest rate risk is materially eliminated. Where natural hedges between banking book items do not suffice to reduce the exposure within defined limits, interest rate swaps are used to transform fixed rate assets and liabilities into variable rate items.
Operationally, daily management of interest rate risk is centralised within the Central Treasury of each geographic entity and is subject to local independent risk and ALCO review. Non-trading interest rate risk is transferred within predefined guidelines from the originating business to the Central Treasury function and aggregated or netted providing Central Treasury with a holistic view of the residual exposure. Central Treasury then implements appropriate balance sheet strategies to achieve a cost-effective source of funding and mitigates
any residual undesirable risk where possible, by changing the duration of the banking group’s discretionary liquid asset portfolio, or through derivative transactions which transfer the risk into the trading books within the Corporate and Institutional Banking division to be traded with the external market. The Central Treasury mandate allows for a tactical response to market opportunities which may arise during changing interest rate cycles. Any resultant interest rate position is managed under the market risk limits.
Together with the business, the treasurer develops strategies regarding changes in the volume, composition, pricing and interest rate characteristics of assets and liabilities to mitigate the interest rate risk and ensure a high degree of net interest margin stability over an interest rate cycle. These are presented, debated and challenged in the liability product and pricing forum and ALCO.
Balance Sheet Risk Management independently monitors various interest rate risk metrics to changes in interest rate risk factors, detailing the sources of interest rate exposure.
We are exposed to automatic optionality risk for those lending products where the bank applies a minimum lending rate. This is an income protection mechanism allowing for upward potential and no downside risk. We are not materially exposed to behavioural embedded option risk, as contract breakage penalties on fixed-rate items specifically cover this risk, while early termination of variable rate contracts has negligible impact on interest rate risk.
Investec has a relatively small endowment risk due to paying market rates on all deposits, compared to banks with significant low or non-interest-bearing current and cheque accounts. Endowment risk due to free funding, comprising mainly ordinary share capital and reserves, is managed passively, with the focus on measuring and monitoring. The endowment risk is included within our non-trading interest rate risk measures.
The group complies with the BCBS framework which is currently in force for assessing banking book (non-trading) interest rate risk, and is in the process of enhancing its existing framework to adhere to the new BCBS principles which come into effect in 2018.
Internal capital is allocated for non-trading interest rate risk.
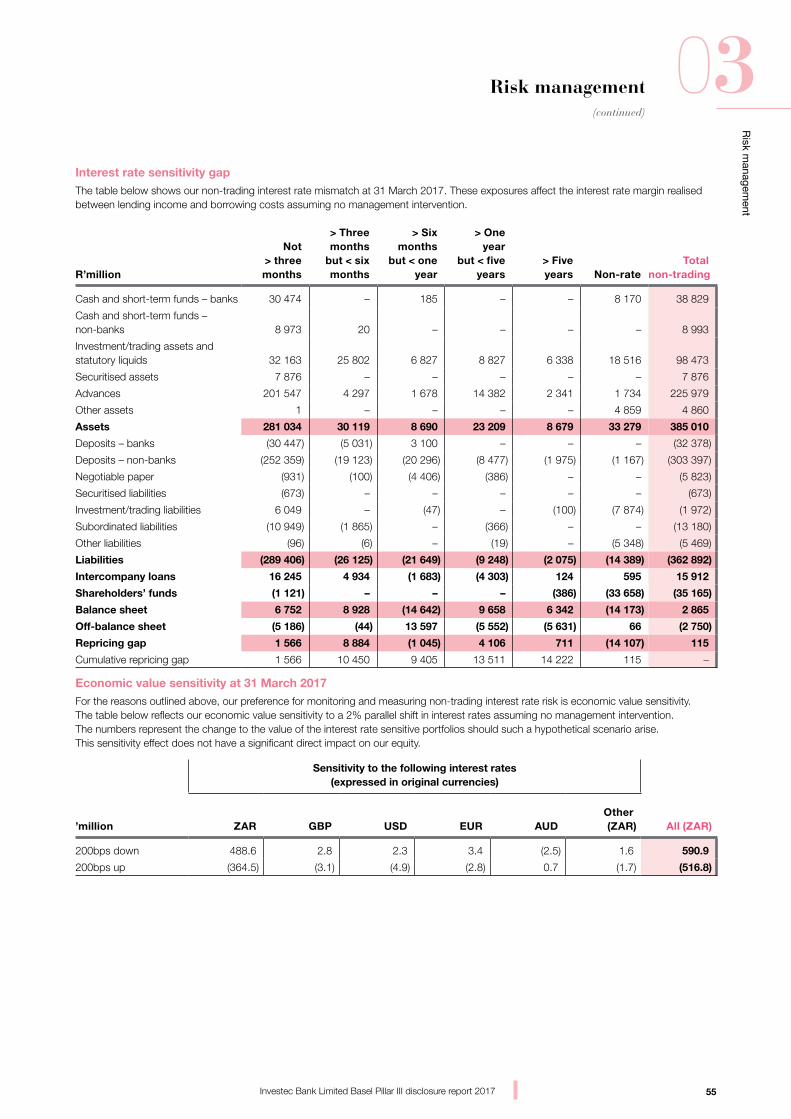
55
Risk m
anagement
03(continued)
Investec Bank Limited Basel Pillar III disclosure report 2017
Risk management
Interest rate sensitivity gapThe table below shows our non-trading interest rate mismatch at 31 March 2017. These exposures affect the interest rate margin realised between lending income and borrowing costs assuming no management intervention.
R’million
Not > three months
> Three months
but < six months
> Six months
but < one year
> One year
but < five years
> Five years Non-rate
Totalnon-trading
Cash and short-term funds – banks 30 474 – 185 – – 8 170 38 829
Cash and short-term funds – non-banks 8 973 20 – – – – 8 993
Investment/trading assets and statutory liquids 32 163 25 802 6 827 8 827 6 338 18 516 98 473
Securitised assets 7 876 – – – – – 7 876
Advances 201 547 4 297 1 678 14 382 2 341 1 734 225 979
Other assets 1 – – – – 4 859 4 860
Assets 281 034 30 119 8 690 23 209 8 679 33 279 385 010
Deposits – banks (30 447) (5 031) 3 100 – – – (32 378)
Deposits – non-banks (252 359) (19 123) (20 296) (8 477) (1 975) (1 167) (303 397)
Negotiable paper (931) (100) (4 406) (386) – – (5 823)
Securitised liabilities (673) – – – – – (673)
Investment/trading liabilities 6 049 – (47) – (100) (7 874) (1 972)
Subordinated liabilities (10 949) (1 865) – (366) – – (13 180)
Other liabilities (96) (6) – (19) – (5 348) (5 469)
Liabilities (289 406) (26 125) (21 649) (9 248) (2 075) (14 389) (362 892)
Intercompany loans 16 245 4 934 (1 683) (4 303) 124 595 15 912
Shareholders’ funds (1 121) – – – (386) (33 658) (35 165)
Balance sheet 6 752 8 928 (14 642) 9 658 6 342 (14 173) 2 865
Off-balance sheet (5 186) (44) 13 597 (5 552) (5 631) 66 (2 750)
Repricing gap 1 566 8 884 (1 045) 4 106 711 (14 107) 115
Cumulative repricing gap 1 566 10 450 9 405 13 511 14 222 115 –
Economic value sensitivity at 31 March 2017For the reasons outlined above, our preference for monitoring and measuring non-trading interest rate risk is economic value sensitivity. The table below reflects our economic value sensitivity to a 2% parallel shift in interest rates assuming no management intervention. The numbers represent the change to the value of the interest rate sensitive portfolios should such a hypothetical scenario arise. This sensitivity effect does not have a significant direct impact on our equity.
Sensitivity to the following interest rates (expressed in original currencies)
’million ZAR GBP USD EUR AUDOther(ZAR) All (ZAR)
200bps down 488.6 2.8 2.3 3.4 (2.5) 1.6 590.9
200bps up (364.5) (3.1) (4.9) (2.8) 0.7 (1.7) (516.8)
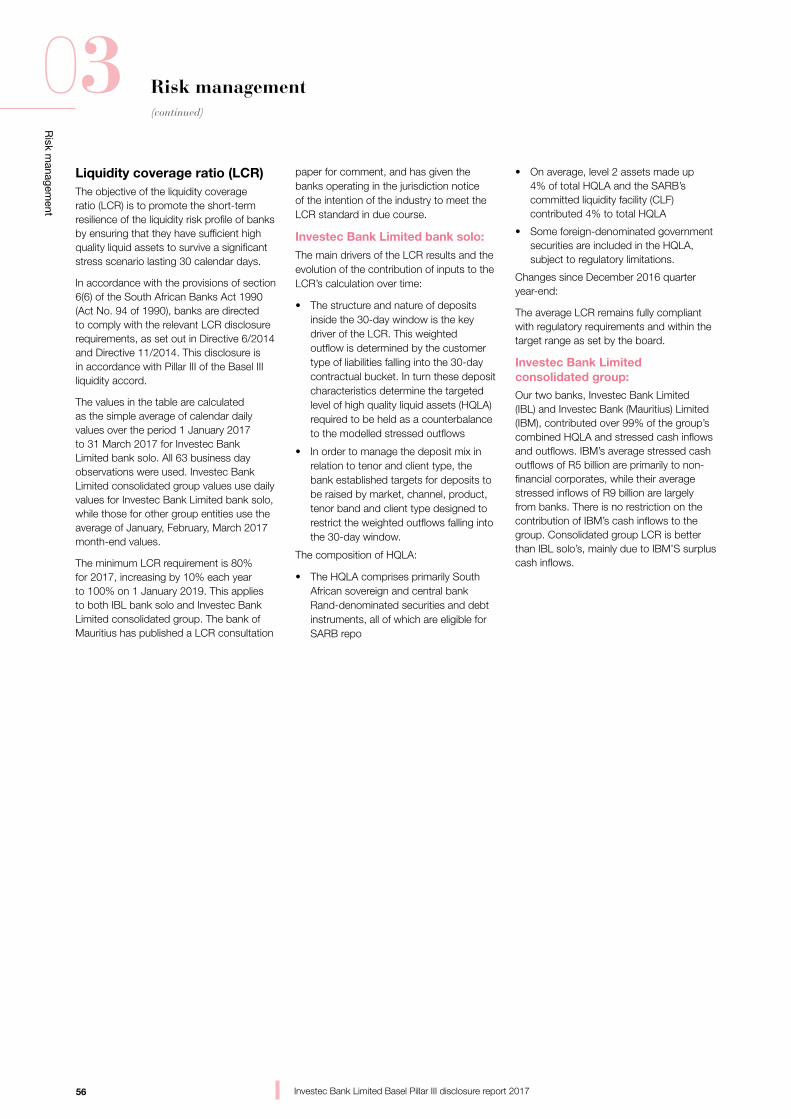
56
Risk m
anagement
03(continued)
Investec Bank Limited Basel Pillar III disclosure report 2017
Risk management
Liquidity coverage ratio (LCR)The objective of the liquidity coverage ratio (LCR) is to promote the short-term resilience of the liquidity risk profile of banks by ensuring that they have sufficient high quality liquid assets to survive a significant stress scenario lasting 30 calendar days.
In accordance with the provisions of section 6(6) of the South African Banks Act 1990 (Act No. 94 of 1990), banks are directed to comply with the relevant LCR disclosure requirements, as set out in Directive 6/2014 and Directive 11/2014. This disclosure is in accordance with Pillar III of the Basel III liquidity accord.
The values in the table are calculated as the simple average of calendar daily values over the period 1 January 2017 to 31 March 2017 for Investec Bank Limited bank solo. All 63 business day observations were used. Investec Bank Limited consolidated group values use daily values for Investec Bank Limited bank solo, while those for other group entities use the average of January, February, March 2017 month-end values.
The minimum LCR requirement is 80% for 2017, increasing by 10% each year to 100% on 1 January 2019. This applies to both IBL bank solo and Investec Bank Limited consolidated group. The bank of Mauritius has published a LCR consultation
paper for comment, and has given the banks operating in the jurisdiction notice of the intention of the industry to meet the LCR standard in due course.
Investec Bank Limited bank solo:
The main drivers of the LCR results and the evolution of the contribution of inputs to the LCR’s calculation over time:
• The structure and nature of deposits inside the 30-day window is the key driver of the LCR. This weighted outflow is determined by the customer type of liabilities falling into the 30-day contractual bucket. In turn these deposit characteristics determine the targeted level of high quality liquid assets (HQLA) required to be held as a counterbalance to the modelled stressed outflows
• In order to manage the deposit mix in relation to tenor and client type, the bank established targets for deposits to be raised by market, channel, product, tenor band and client type designed to restrict the weighted outflows falling into the 30-day window.
The composition of HQLA:
• The HQLA comprises primarily South African sovereign and central bank Rand-denominated securities and debt instruments, all of which are eligible for SARB repo
• On average, level 2 assets made up 4% of total HQLA and the SARB’s committed liquidity facility (CLF) contributed 4% to total HQLA
• Some foreign-denominated government securities are included in the HQLA, subject to regulatory limitations.
Changes since December 2016 quarter year-end:
The average LCR remains fully compliant with regulatory requirements and within the target range as set by the board.
Investec Bank Limited consolidated group:Our two banks, Investec Bank Limited (IBL) and Investec Bank (Mauritius) Limited (IBM), contributed over 99% of the group’s combined HQLA and stressed cash inflows and outflows. IBM’s average stressed cash outflows of R5 billion are primarily to non-financial corporates, while their average stressed inflows of R9 billion are largely from banks. There is no restriction on the contribution of IBM’s cash inflows to the group. Consolidated group LCR is better than IBL solo’s, mainly due to IBM’S surplus cash inflows.
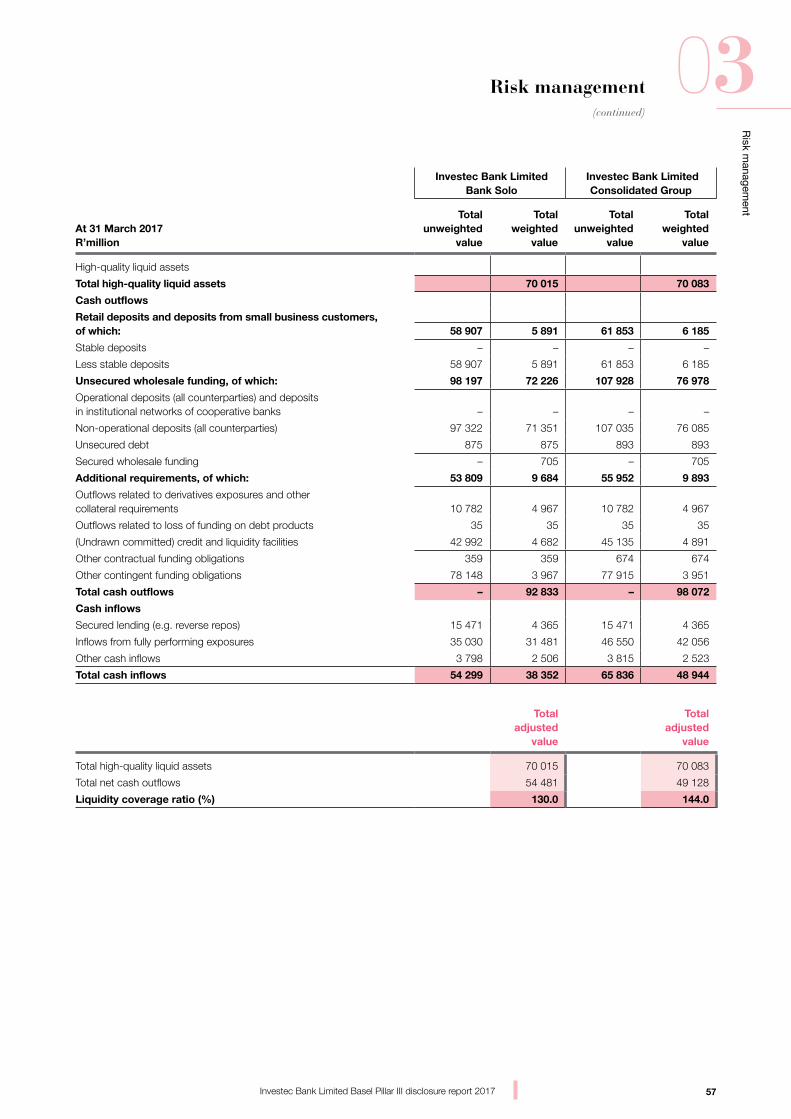
57
Risk m
anagement
03(continued)
Investec Bank Limited Basel Pillar III disclosure report 2017
Risk management
Investec Bank Limited Bank Solo
Investec Bank Limited Consolidated Group
At 31 March 2017 R’million
Total unweighted
value
Total weighted
value
Total unweighted
value
Total weighted
value
High-quality liquid assets
Total high-quality liquid assets 70 015 70 083
Cash outflows
Retail deposits and deposits from small business customers,of which: 58 907 5 891 61 853 6 185
Stable deposits – – – –
Less stable deposits 58 907 5 891 61 853 6 185
Unsecured wholesale funding, of which: 98 197 72 226 107 928 76 978
Operational deposits (all counterparties) and deposits in institutional networks of cooperative banks – – – –
Non-operational deposits (all counterparties) 97 322 71 351 107 035 76 085
Unsecured debt 875 875 893 893
Secured wholesale funding – 705 – 705
Additional requirements, of which: 53 809 9 684 55 952 9 893
Outflows related to derivatives exposures and other collateral requirements 10 782 4 967 10 782 4 967
Outflows related to loss of funding on debt products 35 35 35 35
(Undrawn committed) credit and liquidity facilities 42 992 4 682 45 135 4 891
Other contractual funding obligations 359 359 674 674
Other contingent funding obligations 78 148 3 967 77 915 3 951
Total cash outflows – 92 833 – 98 072
Cash inflows
Secured lending (e.g. reverse repos) 15 471 4 365 15 471 4 365
Inflows from fully performing exposures 35 030 31 481 46 550 42 056
Other cash inflows 3 798 2 506 3 815 2 523
Total cash inflows 54 299 38 352 65 836 48 944
Total adjusted
value
Total adjusted
value
Total high-quality liquid assets 70 015 70 083
Total net cash outflows 54 481 49 128
Liquidity coverage ratio (%) 130.0 144.0
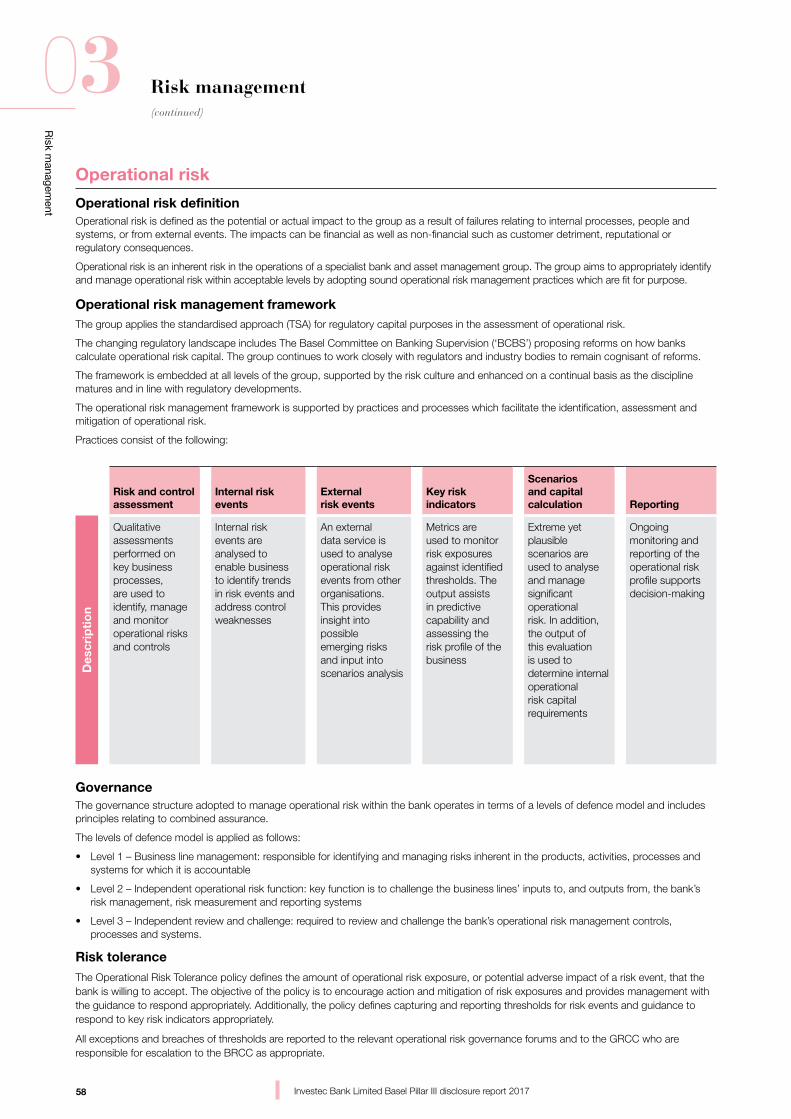
58
Risk m
anagement
03(continued)
Investec Bank Limited Basel Pillar III disclosure report 2017
Risk management
Operational risk
Operational risk definitionOperational risk is defined as the potential or actual impact to the group as a result of failures relating to internal processes, people and systems, or from external events. The impacts can be financial as well as non-financial such as customer detriment, reputational or regulatory consequences.
Operational risk is an inherent risk in the operations of a specialist bank and asset management group. The group aims to appropriately identify and manage operational risk within acceptable levels by adopting sound operational risk management practices which are fit for purpose.
Operational risk management frameworkThe group applies the standardised approach (TSA) for regulatory capital purposes in the assessment of operational risk.
The changing regulatory landscape includes The Basel Committee on Banking Supervision (‘BCBS’) proposing reforms on how banks calculate operational risk capital. The group continues to work closely with regulators and industry bodies to remain cognisant of reforms.
The framework is embedded at all levels of the group, supported by the risk culture and enhanced on a continual basis as the discipline matures and in line with regulatory developments.
The operational risk management framework is supported by practices and processes which facilitate the identification, assessment and mitigation of operational risk.
Practices consist of the following:
Risk and control assessment
Internal risk events
External risk events
Key risk indicators
Scenarios and capital calculation Reporting
Des
crip
tio
n
Qualitative assessments performed on key business processes, are used to identify, manage and monitor operational risks and controls
Internal risk events are analysed to enable business to identify trends in risk events and address control weaknesses
An external data service is used to analyse operational risk events from other organisations. This provides insight into possible emerging risks and input into scenarios analysis
Metrics are used to monitor risk exposures against identified thresholds. The output assists in predictive capability and assessing the risk profile of the business
Extreme yet plausible scenarios are used to analyse and manage significant operational risk. In addition, the output of this evaluation is used to determine internal operational risk capital requirements
Ongoing monitoring and reporting of the operational risk profile supports decision-making
GovernanceThe governance structure adopted to manage operational risk within the bank operates in terms of a levels of defence model and includes principles relating to combined assurance.
The levels of defence model is applied as follows:
• Level 1 – Business line management: responsible for identifying and managing risks inherent in the products, activities, processes and systems for which it is accountable
• Level 2 – Independent operational risk function: key function is to challenge the business lines’ inputs to, and outputs from, the bank’s risk management, risk measurement and reporting systems
• Level 3 – Independent review and challenge: required to review and challenge the bank’s operational risk management controls, processes and systems.
Risk tolerance The Operational Risk Tolerance policy defines the amount of operational risk exposure, or potential adverse impact of a risk event, that the bank is willing to accept. The objective of the policy is to encourage action and mitigation of risk exposures and provides management with the guidance to respond appropriately. Additionally, the policy defines capturing and reporting thresholds for risk events and guidance to respond to key risk indicators appropriately.
All exceptions and breaches of thresholds are reported to the relevant operational risk governance forums and to the GRCC who are responsible for escalation to the BRCC as appropriate.
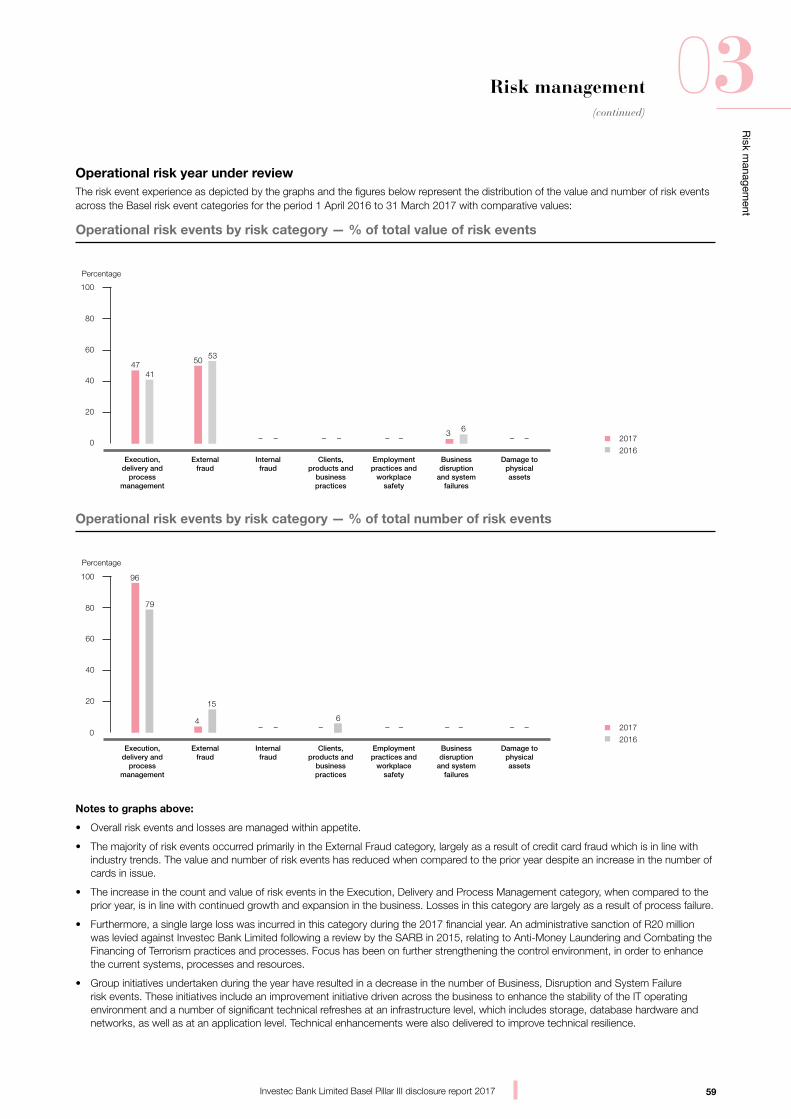
59
Risk m
anagement
03(continued)
Investec Bank Limited Basel Pillar III disclosure report 2017
Risk management
Operational risk year under reviewThe risk event experience as depicted by the graphs and the figures below represent the distribution of the value and number of risk events across the Basel risk event categories for the period 1 April 2016 to 31 March 2017 with comparative values:
Percentage
0
20
40
60
80
100
2017
2016Execution,
delivery and process
management
External fraud
Internal fraud
Clients, products and
business practices
Employment practices and
workplace safety
Business disruption
and system failures
Damage to physical assets
47 50
41
53
3 6
Operational risk events by risk category — % of total value of risk events
− −− − − −− −
Percentage
0
20
40
60
80
100
Execution, delivery and
process management
External fraud
Internal fraud
Clients, products and
business practices
Employment practices and
workplace safety
Business disruption
and system failures
Damage to physical assets
79
96
15
6− −− − −
4− − −
Operational risk events by risk category — % of total number of risk events
− 2017
2016
Notes to graphs above:
• Overall risk events and losses are managed within appetite.
• The majority of risk events occurred primarily in the External Fraud category, largely as a result of credit card fraud which is in line with industry trends. The value and number of risk events has reduced when compared to the prior year despite an increase in the number of cards in issue.
• The increase in the count and value of risk events in the Execution, Delivery and Process Management category, when compared to the prior year, is in line with continued growth and expansion in the business. Losses in this category are largely as a result of process failure.
• Furthermore, a single large loss was incurred in this category during the 2017 financial year. An administrative sanction of R20 million was levied against Investec Bank Limited following a review by the SARB in 2015, relating to Anti-Money Laundering and Combating the Financing of Terrorism practices and processes. Focus has been on further strengthening the control environment, in order to enhance the current systems, processes and resources.
• Group initiatives undertaken during the year have resulted in a decrease in the number of Business, Disruption and System Failure risk events. These initiatives include an improvement initiative driven across the business to enhance the stability of the IT operating environment and a number of significant technical refreshes at an infrastructure level, which includes storage, database hardware and networks, as well as at an application level. Technical enhancements were also delivered to improve technical resilience.
60
Risk m
anagement
03(continued)
Investec Bank Limited Basel Pillar III disclosure report 2017
Risk management
Looking forwardKey operational risk considerations for the year ahead
Definition of risk Mitigation approach and priority for 2017/2018
Business continuity
Risk associated with disruptive incidents which can impact premises, staff, equipment, systems, and key business processes
• Enhance the global business continuity management capability through a team of dedicated resources and a thorough governance process
• Respond to disruptions to maintain continuity by relocating impacted business to alternate processing sites and the use of high availability technology solutions
• Incorporate resilience into business operations to lessen the impact of disruptions
• Conduct ongoing verification of recovery strategies to ensure they are effective and appropriate
• Participate in industry-wide discussions to keep abreast of regulatory developments and collaboratively minimise systemic continuity risks
Cybersecurity
Risk associated with cyberattacks which can result in fraud, data theft, cyber terrorism, espionage, or disrupt client-facing services
• Maintain a risk-based and adaptive cybersecurity strategy to ensure the group is adequately protected against advanced cyberattacks
• Continuous improvement of prediction, prevention, detection and response capabilities
• Security testing of IT systems to ensure they are secure both by design and as they evolve
• Establish an effective and globally coordinated security incident response process
• Build robust cyber resilience to be able to anticipate, withstand, and recover from cyber events
Financial crime
Risk associated with fraud, bribery, corruption, theft, money laundering, terrorist financing, tax evasion, forgery and integrity misconduct by staff, clients, suppliers and other stakeholders
• Targeted training for specific risk roles, regular campaigns to all employees to raise awareness of financial crime risk and associated policies and encourage escalation
• Operate an Integrity Line which allows employees to make disclosures including regulatory breaches, allegations of bribery, fraud and corruption, and non-compliance with policies
• Proactive strategy for the effective prevention, detection and investigation of all financial crime types which includes business and client risk assessments
• Continuous monitoring of adherence to financial crime prevention policies and embedding of practices which comply with regulations, industry guidance and best practice
• Research and review of external and industry events through engagement with relevant industry bodies and external partners
Information security
Risk associated with the protection of information assets against unauthorised access, use, disclosure, modification or destruction
• Identify high-value information assets based on confidentiality and business criticality
• Implement strong security controls to protect information against compromise
• Manage access to systems and data in support of least-privilege and segregation of duty principles
• Establish effective security monitoring to identify and swiftly respond to suspicious activity
• Align practices and controls with the rapidly changing legal and regulatory privacy requirements
61
Risk m
anagement
03(continued)
Investec Bank Limited Basel Pillar III disclosure report 2017
Risk management
Definition of risk Mitigation approach and priority for 2017/2018
Outsourcing
Risk associated with the use of a service provider to perform on a continuing basis a business activity which could be undertaken by the group
• Governance structures are in place to approve outsource arrangements
• Framework and policies support ongoing management and monitoring of outsource providers
• Outsource arrangements are managed in accordance with regulatory requirements which includes the suitability of the outsource provider to perform services
• Continuous assessment of the strategic decision to outsource including the appropriateness of the outsource provider
Process failure
Risk associated with inadequate internal processes, including human errors and control failures within the business. This includes process origination, execution and operations
• Proactive assessment relating to new products and projects to implement adequate and effective controls including the management of change
• Continuous automation of processes
• Segregation of incompatible duties and appropriate authorisation controls
• Causal analysis is used to identify weaknesses in controls following the occurrence of risk events
• Risk and performance indicators are used to monitor the effectiveness of controls across business units
• Thematic reviews across business units to ensure consistent and efficient application of controls
Regulatory and compliance
Risk associated with identification, implementation and monitoring of compliance with regulations
• Align regulatory and compliance approach to reflect new regulatory landscapes particularly change of regulatory structures
• Manage business impact and implementation challenges as a result of significant volumes of statutory and regulatory changes and developments
• Ensuring existing monitoring remains focused appropriately as areas of conduct and regulatory risk develop
• Group Compliance and Group Legal assist in the management of regulatory and compliance risk
• Identification and adherence to legal and regulatory requirements
Technology
Risk associated with the reliance on technology to support business processes and client services
• Align architecture across the group to reduce technical complexity and leverage common functions and processes
• Enhance operational processes to better control IT changes and manage IT incidents, in order to minimise business impact
• Drive automation and proactive monitoring of the technology environment to reduce human error whilst enhancing visibility
• Implement infrastructure upgrades and legacy application replacements to improve technology capacity, scalability and resilience
• Perform continuous risk management to proactively address control gaps in IT people, processes or systems
• Maintain and test IT recovery capabilities to withstand system failures and safeguard against service disruptions
62
Risk m
anagement
03(continued)
Investec Bank Limited Basel Pillar III disclosure report 2017
Risk management
InsuranceThe group maintains adequate insurance to cover key insurable risks. The insurance process and requirements are managed by the group insurance risk manager. Regular interaction between Group Operational Risk Management and Group Insurance Risk Management ensures that there is an exchange of information in order to enhance the mitigation of operational risk.
Recovery and resolution planningThe purpose of the recovery plan is to document how the board and management will recover from extreme financial stress to avoid liquidity and capital difficulties in Investec Limited. The plans are reviewed and approved by the board on an annual basis.
The recovery plan for Investec Limited:
• Integrates with existing contingency planning
• Analyses the potential for severe stress in the group
• Identifies roles and responsibilities
• Identifies early warning indicators and trigger levels
• Analyses how the group could be affected by the stresses under various scenarios
• Includes potential recovery actions available to the board and management to respond to the situation, including immediate, intermediate and strategic actions
• Assesses how the group might recover as a result of these actions to avoid resolution.
Financial Stability Board member countries are required to have recovery and resolution plans in place for all systemically significant financial institutions. The SARB has adopted this requirement and has to date required South African domestically significant banking institutions to develop recovery plans. Guidance issued by the Financial Stability Board and the SARB has been incorporated into Investec’s recovery plan.
The SARB has continued to focus on finalising the recovery plans for the local
banks and together with the South African Treasury are considering legislation to adopt a resolution framework. We will be subject to this legislation once it is adopted.
Reputational and strategic riskReputational risk is damage to our reputation, name or brand. Reputational risk is often associated with strategic decisions made by the board and also arises as a result of other risks manifesting and not being mitigated.
The group aspires to maintain an excellent reputation for entrepreneurship, strong risk management discipline, a client-centric approach and an ability to be flexible and innovative. The group recognises the serious consequences of any adverse publicity or damage to reputation, whatever the underlying cause.
We have various policies and practices to mitigate reputational risk, including strong values that are regularly and proactively reinforced. We also subscribe to sound corporate governance practices, which require that activities, processes and decisions are based on carefully considered principles. We are aware of the impact of practices that may result in a breakdown of trust and confidence in the organisation. The group’s policies and practices are regularly reinforced through transparent communication, accurate reporting, continuous group culture and values assessment, internal audit and regulatory compliance review, and risk management practices. Strategic and reputational risk is mitigated as much as possible through these detailed processes and governance/escalation procedures from business units to the board, and from regular, clear communication with shareholders, customers and all stakeholders. In addition, Investec’s policy is to avoid any transaction, service or association which may bring with it the risk of potential damage to our reputation. Transaction approval governance structures such as credit, engagement and new product committees have therefore been tasked with this responsibility in relation to all new business undertaken. A disclosure and public communications policy has also been approved by the board.
Legal risk managementLegal risk is the risk of loss resulting from any of our rights not being fully enforceable or from our obligations not being properly performed. This includes our rights and obligations under contracts entered into with counterparties. Such risk is especially applicable where the counterparty defaults and the relevant documentation may not give rise to the rights and remedies anticipated when the transaction was entered into.
Our objective is to identify, manage, monitor and mitigate legal risks throughout the group. We seek to actively mitigate these risks by identifying them, setting minimum standards for their management and allocating clear responsibility for such management to legal risk managers, as well as ensuring compliance through proactive monitoring.
The scope of our activities is continuously reviewed and includes the following areas:
• Relationship contracts
• Legislation/governance
• Litigation
• Corporate events
• Incident or crisis management
• Ongoing quality control.
The legal risk policy is implemented through:
• Identification and ongoing review of areas where legal risk is found to be present
• Allocation of responsibility for the development of procedures for management and mitigation of these risks
• Installation of appropriate segregation of duties, so that legal documentation is reviewed and executed with the appropriate level of independence from the persons involved in proposing or promoting the transaction
• Ongoing examination of the inter-relationship between legal risk and other areas of risk management, so as to ensure that there are no ‘gaps’ in the risk management process
• Establishing minimum standards for mitigating and controlling each risk. This is the nature and extent of work to be undertaken by our internal and external legal resources
63
Risk m
anagement
03(continued)
Investec Bank Limited Basel Pillar III disclosure report 2017
Risk management
• Establishing procedures to monitor compliance, taking into account the required minimum standards
• Establishing legal risk forums (bringing together the various legal risk managers) to ensure we keep abreast of developments and changes in the nature and extent of our activities, and to benchmark our processes against best practice.
Overall responsibility for this policy rests with the board. The board delegates responsibility for implementation of the policy to the global head of legal risk. The global head assigns responsibility for controlling these risks to the managers of appropriate departments and focused units throughout the group.
A legal risk forum is constituted in each significant legal entity within the group. Each forum meets at least half-yearly and more frequently where business needs dictate, and is chaired by the global head of legal risk or an appointed deputy.
Conduct risk The South African financial sector regulatory landscape has been under review for the last few years. A new regulatory structure is developing, and existing legislation is also being amended. Although the conduct of financial institutions is currently regulated under various pieces of legislation, and by various regulators, this will change under the new regulatory structure. The resultant strategic and operational impact is expected to last for at least the next five years.
Capital management and allocation
Regulatory capital – Investec Bank Limited Current regulatory frameworkInvestec Bank Limited is supervised for capital purposes by the SARB on a consolidated basis.
Investec Bank Limited has been calculating capital resources and requirements at a group level using the Basel III framework, as implemented in South Africa by the SARB, in accordance with the Bank’s Act and all related regulations.
Investec Bank Limited currently uses the standardised approach to calculate its credit and counterparty credit risk and operational risk capital requirements. Capital requirements for equity risk is calculated using the internal ratings-based (IRB) approach by applying the simple risk-weight method. The market risk capital requirement is measured using an internal risk management model, approved by the SARB.
Various subsidiaries of Investec Bank Limited are subject to additional regulation covering various activities or implemented by local regulators in other jurisdictions. For capital management purposes, it is the prevailing rules applied to the consolidated Investec Bank Limited group that are monitored most closely. Nevertheless, where capital is a relevant consideration, management within each regulated entity pays close attention to prevailing local regulatory rules as determined by their respective regulators. Management of each regulated entity, with the support of the group’s capital management functions, ensures that capital remains prudently above minimum requirements at all times.
Capital targetsOver recent years, capital adequacy standards for banks have been raised as part of attempts to increase the stability and resilience of the global banking sector. Investec Bank Limited has always held capital well in excess of regulatory requirements and the group continues to remain well capitalised. Accordingly, we are targeting a minimum common equity tier 1 capital ratio of above 10%, a tier 1 capital ratio of above 11% and a total capital adequacy ratio target in the range of 14% to 17%. These targets are continuously assessed for appropriateness.
The DLC capital committee is responsible for ensuring that the impact of any regulatory change is analysed, understood, prepared and planned for. To allow the committee to carry out this function the group’s regulatory and capital management teams closely monitor regulatory developments and regularly present to the committee on the latest developments and proposals. As part of any assessment the committee is provided with analysis setting out the group’s capital adequacy position, taking into account the most up-to-date interpretation of the rule changes.
In addition, regular sessions with the board are held to ensure that members are kept up to date with the most salient changes to ensure the impact on the group and its subsidiaries is monitored and understood.
Management of leverageAt present Investec Bank Limited calculates and reports its leverage ratio based on the latest SARB regulations. The leverage ratio is a non-risk-based measure intended to prevent excessive build up of leverage and mitigate the risks associated with deleveraging during periods of market uncertainty. The reporting of the leverage ratio in South Africa has been mandatory since 1 January 2013 as part of an exercise to monitor South African banks’ readiness to comply with the minimum standard of 4% from 1 January 2018. Following guidance from the SARB, Investec applies the rules as outlined in the most recent BCBS publication.
Leverage ratio targetInvestec is currently targeting a leverage ratio above 6%.
Capital managementPhilosophy and approachBoth the Investec Limited and Investec plc groups operate an approach to capital management that utilises both regulatory capital, as appropriate to that jurisdiction, and internal capital, which is an internal risk-based assessment of capital requirements. Capital management primarily relates to management of the interaction of both, with the emphasis on regulatory capital for managing portfolio level capital sufficiency and on internal capital for ensuring that returns are appropriate given the level of risk taken at an individual transaction or business unit level.
The determination of target capital is driven by our risk profile, strategy and risk appetite, taking into account regulatory and market factors applicable to the group. At the most fundamental level, we seek to balance our capital consumption between prudent capitalisation in the context of the group’s risk profile and optimisation of shareholder returns.
Our internal capital framework is designed to manage and achieve this balance.
The internal capital framework is based on the group’s risk identification, review
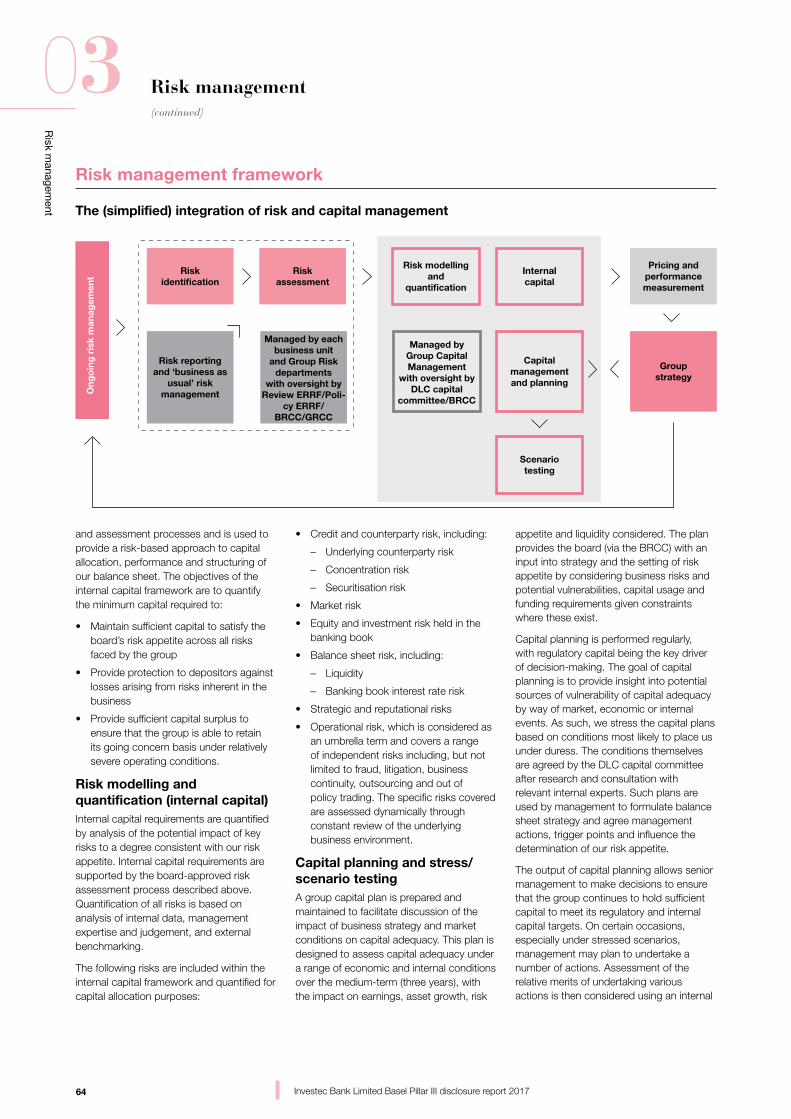
64
Risk m
anagement
03(continued)
Investec Bank Limited Basel Pillar III disclosure report 2017
Risk management
and assessment processes and is used to provide a risk-based approach to capital allocation, performance and structuring of our balance sheet. The objectives of the internal capital framework are to quantify the minimum capital required to:
• Maintain sufficient capital to satisfy the board’s risk appetite across all risks faced by the group
• Provide protection to depositors against losses arising from risks inherent in the business
• Provide sufficient capital surplus to ensure that the group is able to retain its going concern basis under relatively severe operating conditions.
Risk modelling and quantification (internal capital)Internal capital requirements are quantified by analysis of the potential impact of key risks to a degree consistent with our risk appetite. Internal capital requirements are supported by the board-approved risk assessment process described above. Quantification of all risks is based on analysis of internal data, management expertise and judgement, and external benchmarking.
The following risks are included within the internal capital framework and quantified for capital allocation purposes:
• Credit and counterparty risk, including:
– Underlying counterparty risk
– Concentration risk
– Securitisation risk
• Market risk
• Equity and investment risk held in the banking book
• Balance sheet risk, including:
– Liquidity
– Banking book interest rate risk
• Strategic and reputational risks
• Operational risk, which is considered as an umbrella term and covers a range of independent risks including, but not limited to fraud, litigation, business continuity, outsourcing and out of policy trading. The specific risks covered are assessed dynamically through constant review of the underlying business environment.
Capital planning and stress/scenario testingA group capital plan is prepared and maintained to facilitate discussion of the impact of business strategy and market conditions on capital adequacy. This plan is designed to assess capital adequacy under a range of economic and internal conditions over the medium-term (three years), with the impact on earnings, asset growth, risk
appetite and liquidity considered. The plan provides the board (via the BRCC) with an input into strategy and the setting of risk appetite by considering business risks and potential vulnerabilities, capital usage and funding requirements given constraints where these exist.
Capital planning is performed regularly, with regulatory capital being the key driver of decision-making. The goal of capital planning is to provide insight into potential sources of vulnerability of capital adequacy by way of market, economic or internal events. As such, we stress the capital plans based on conditions most likely to place us under duress. The conditions themselves are agreed by the DLC capital committee after research and consultation with relevant internal experts. Such plans are used by management to formulate balance sheet strategy and agree management actions, trigger points and influence the determination of our risk appetite.
The output of capital planning allows senior management to make decisions to ensure that the group continues to hold sufficient capital to meet its regulatory and internal capital targets. On certain occasions, especially under stressed scenarios, management may plan to undertake a number of actions. Assessment of the relative merits of undertaking various actions is then considered using an internal
Risk management framework
The (simplified) integration of risk and capital management
Risk reportingand ‘business as
usual’ riskmanagement
Risk modellingand
quantification
Capitalmanagementand planning
Scenariotesting
Internal capital
Riskassessment
Riskidentification
Ong
oin
g r
isk
man
agem
ent
Groupstrategy
Pricing andperformancemeasurement
Managed by eachbusiness unit
and Group Riskdepartments
with oversight by Review ERRF/Poli-
cy ERRF/BRCC/GRCC
Managed by Group Capital Management
with oversight byDLC capital
committee/BRCC
65
Risk m
anagement
03(continued)
Investec Bank Limited Basel Pillar III disclosure report 2017
Risk management
view of relative returns across portfolios which are themselves based on internal assessments of risk and capital.
Our capital plans are designed to allow senior management and the board to review:
• Changes to capital demand caused by implementation of agreed strategic objectives, including the creation or acquisition of new businesses, or as a result of the manifestation of one or more of the risks to which we are potentially susceptible
• The impact on profitability of current and future strategies
• Required changes to the capital structure
• The impact of implementing a proposed dividend strategy
• The impact of alternate market or operating conditions on any of the above.
At a minimum level, each capital plan assesses the impact on our capital adequacy over expected case, upturn and downturn scenarios. On the basis of the results of this analysis, the DLC capital committee and the BRCC are presented with the potential variability in capital adequacy and are responsible, in consultation with the board, for consideration of the appropriate response.
Pricing and performance measurementThe use of internal capital as an allocation tool means that all transactions are considered in the context of their contribution to return on risk-adjusted capital. This ensures that expected returns are sufficient after taking recognition of the inherent risk generated for a given transaction. This approach allows us to embed risk and capital discipline at the level of deal initiation. Using expectations of risk-based returns as the basis for pricing and deal acceptance ensures that risk management retains a key role in ensuring that the portfolio is appropriately managed for that risk.
In addition to pricing, returns on internal capital are monitored and relative performance is assessed on this basis.
Assessment of performance in this way is a fundamental consideration used in setting strategy and risk appetite as well as rewarding performance.
These processes have been embedded across the business with the process designed to ensure that risk and capital management form the basis for key decisions, at both a group and at a transactional level. Responsibility for oversight for each of these processes ultimately falls to the BRCC.
Regulatory capital and requirementsRegulatory capital is divided into three main categories, namely common equity tier 1, tier 1 and tier 2 capital as follows:
• Common equity tier 1 capital comprises shareholders’ equity and related eligible non-controlling interests after giving effect to deductions for disallowed items (for example, goodwill and intangible assets) and other adjustments
• Additional tier 1 capital includes qualifying capital instrument, that are capable of being fully and permanently written down or converted into common equity tier 1 capital at the point of non-viability of the firm and other additional tier 1 instruments, which no longer qualify as additional tier 1 capital and are subject to grandfathering provisions and related eligible non-controlling interests
• Tier 2 capital comprises qualifying subordinated debt and related eligible non-controlling interests and other tier 2 instruments, which no longer qualify as tier 2 capital and are subject to grandfathering provisions.
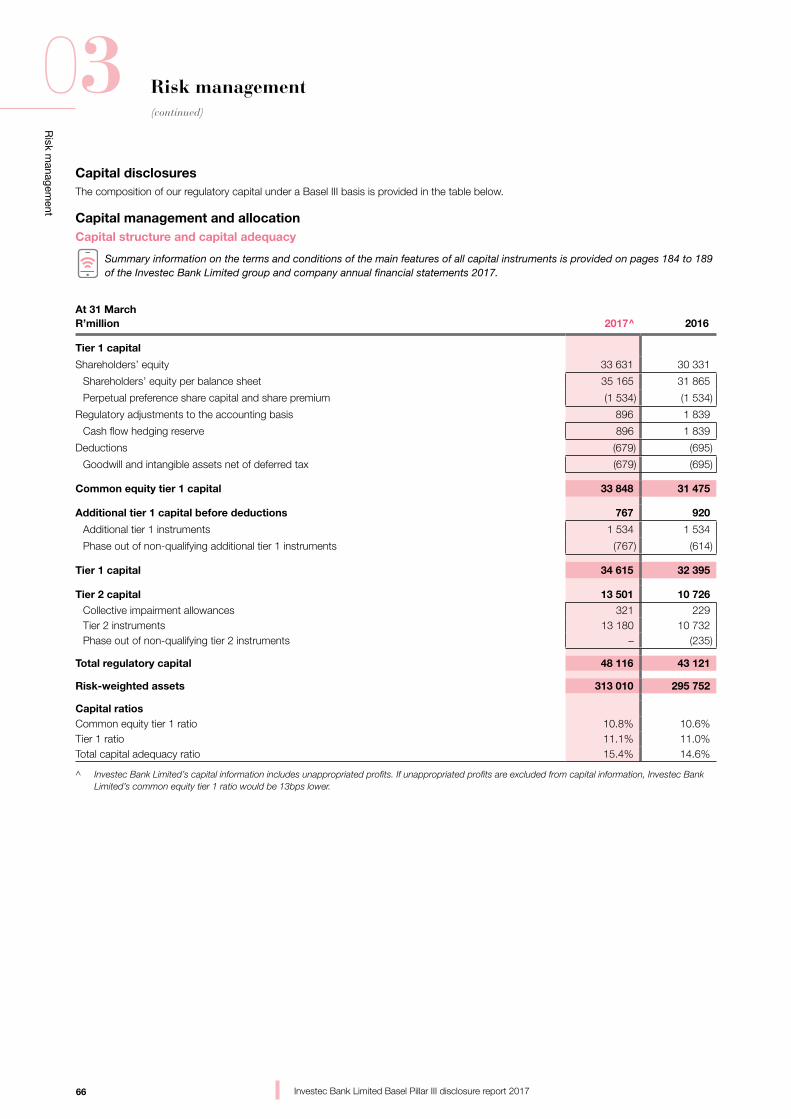
66
Risk m
anagement
03(continued)
Investec Bank Limited Basel Pillar III disclosure report 2017
Risk management
Capital disclosuresThe composition of our regulatory capital under a Basel III basis is provided in the table below.
Capital management and allocationCapital structure and capital adequacy
Summary information on the terms and conditions of the main features of all capital instruments is provided on pages 184 to 189 of the Investec Bank Limited group and company annual financial statements 2017.
At 31 MarchR’million 2017^ 2016
Tier 1 capital
Shareholders’ equity 33 631 30 331
Shareholders’ equity per balance sheet 35 165 31 865
Perpetual preference share capital and share premium (1 534) (1 534)
Regulatory adjustments to the accounting basis 896 1 839
Cash flow hedging reserve 896 1 839
Deductions (679) (695)
Goodwill and intangible assets net of deferred tax (679) (695)
Common equity tier 1 capital 33 848 31 475
Additional tier 1 capital before deductions 767 920
Additional tier 1 instruments 1 534 1 534
Phase out of non-qualifying additional tier 1 instruments (767) (614)
Tier 1 capital 34 615 32 395
Tier 2 capital 13 501 10 726
Collective impairment allowances 321 229Tier 2 instruments 13 180 10 732Phase out of non-qualifying tier 2 instruments – (235)
Total regulatory capital 48 116 43 121
Risk-weighted assets 313 010 295 752
Capital ratiosCommon equity tier 1 ratio 10.8% 10.6%Tier 1 ratio 11.1% 11.0%Total capital adequacy ratio 15.4% 14.6%
^ Investec Bank Limited’s capital information includes unappropriated profits. If unappropriated profits are excluded from capital information, Investec Bank Limited’s common equity tier 1 ratio would be 13bps lower.
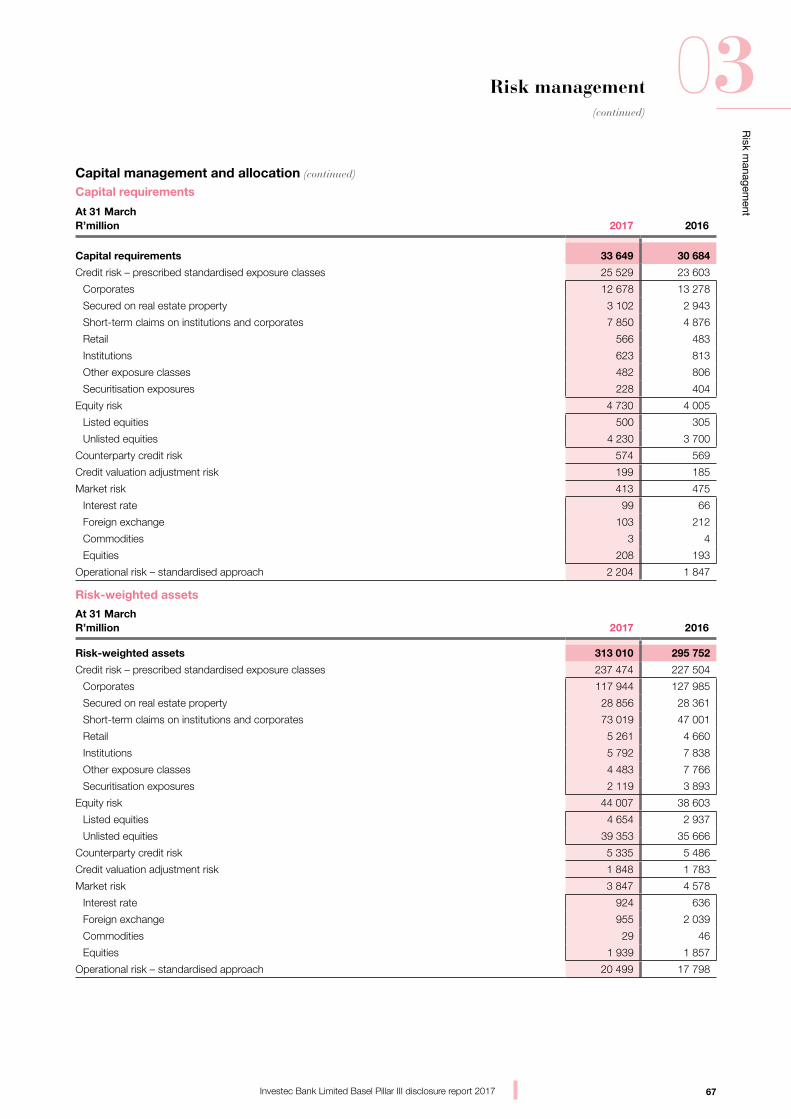
67
Risk m
anagement
03(continued)
Investec Bank Limited Basel Pillar III disclosure report 2017
Risk management
Capital management and allocation (continued)
Capital requirements
At 31 MarchR’million 2017 2016
Capital requirements 33 649 30 684
Credit risk – prescribed standardised exposure classes 25 529 23 603
Corporates 12 678 13 278
Secured on real estate property 3 102 2 943
Short-term claims on institutions and corporates 7 850 4 876
Retail 566 483
Institutions 623 813
Other exposure classes 482 806
Securitisation exposures 228 404
Equity risk 4 730 4 005
Listed equities 500 305
Unlisted equities 4 230 3 700
Counterparty credit risk 574 569
Credit valuation adjustment risk 199 185
Market risk 413 475
Interest rate 99 66
Foreign exchange 103 212
Commodities 3 4
Equities 208 193
Operational risk – standardised approach 2 204 1 847
Risk-weighted assets
At 31 MarchR’million 2017 2016
Risk-weighted assets 313 010 295 752
Credit risk – prescribed standardised exposure classes 237 474 227 504
Corporates 117 944 127 985
Secured on real estate property 28 856 28 361
Short-term claims on institutions and corporates 73 019 47 001
Retail 5 261 4 660
Institutions 5 792 7 838
Other exposure classes 4 483 7 766
Securitisation exposures 2 119 3 893
Equity risk 44 007 38 603
Listed equities 4 654 2 937
Unlisted equities 39 353 35 666
Counterparty credit risk 5 335 5 486
Credit valuation adjustment risk 1 848 1 783
Market risk 3 847 4 578
Interest rate 924 636
Foreign exchange 955 2 039
Commodities 29 46
Equities 1 939 1 857
Operational risk – standardised approach 20 499 17 798
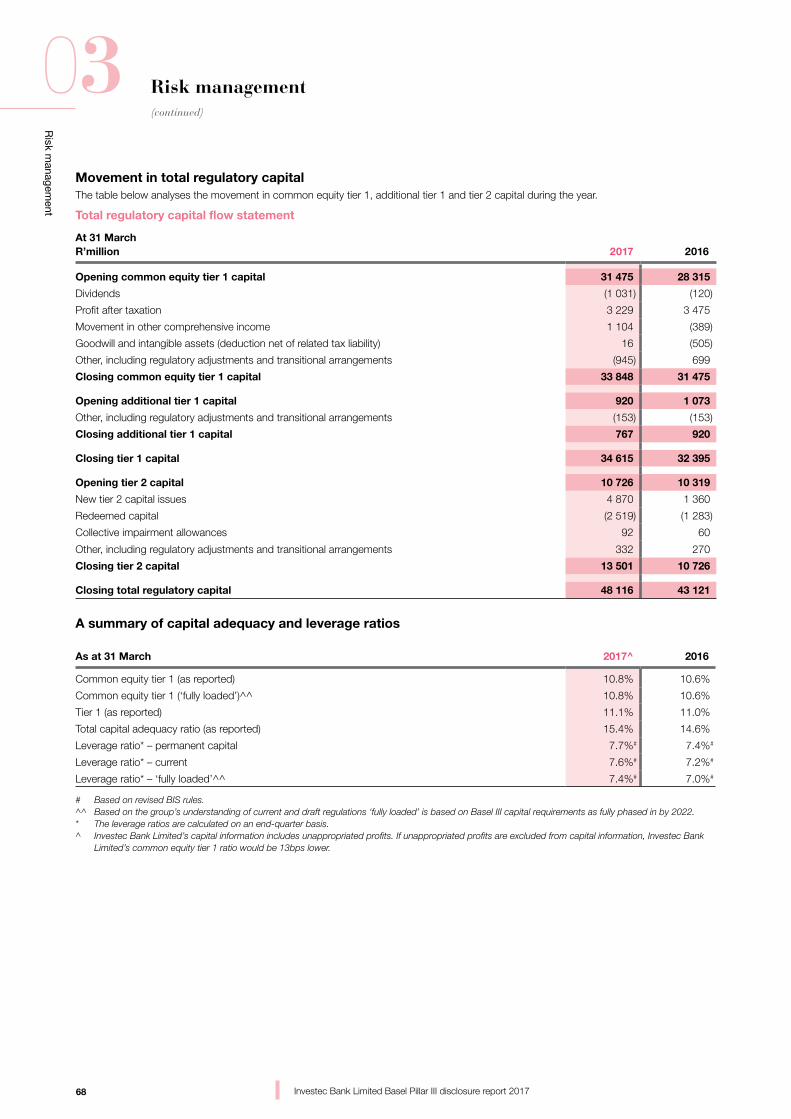
68
Risk m
anagement
03(continued)
Investec Bank Limited Basel Pillar III disclosure report 2017
Risk management
Movement in total regulatory capitalThe table below analyses the movement in common equity tier 1, additional tier 1 and tier 2 capital during the year.
Total regulatory capital flow statement
At 31 MarchR’million 2017 2016
Opening common equity tier 1 capital 31 475 28 315
Dividends (1 031) (120)
Profit after taxation 3 229 3 475
Movement in other comprehensive income 1 104 (389)
Goodwill and intangible assets (deduction net of related tax liability) 16 (505)
Other, including regulatory adjustments and transitional arrangements (945) 699
Closing common equity tier 1 capital 33 848 31 475
Opening additional tier 1 capital 920 1 073
Other, including regulatory adjustments and transitional arrangements (153) (153)
Closing additional tier 1 capital 767 920
Closing tier 1 capital 34 615 32 395
Opening tier 2 capital 10 726 10 319
New tier 2 capital issues 4 870 1 360
Redeemed capital (2 519) (1 283)
Collective impairment allowances 92 60
Other, including regulatory adjustments and transitional arrangements 332 270
Closing tier 2 capital 13 501 10 726
Closing total regulatory capital 48 116 43 121
A summary of capital adequacy and leverage ratios
As at 31 March 2017^ 2016
Common equity tier 1 (as reported) 10.8% 10.6%
Common equity tier 1 (‘fully loaded’)^^ 10.8% 10.6%
Tier 1 (as reported) 11.1% 11.0%
Total capital adequacy ratio (as reported) 15.4% 14.6%
Leverage ratio* – permanent capital 7.7%# 7.4%#
Leverage ratio* – current 7.6%# 7.2%#
Leverage ratio* – ‘fully loaded’^^ 7.4%# 7.0%#
# Based on revised BIS rules. ^^ Based on the group’s understanding of current and draft regulations ‘fully loaded’ is based on Basel III capital requirements as fully phased in by 2022.* The leverage ratios are calculated on an end-quarter basis.^ Investec Bank Limited’s capital information includes unappropriated profits. If unappropriated profits are excluded from capital information, Investec Bank
Limited’s common equity tier 1 ratio would be 13bps lower.
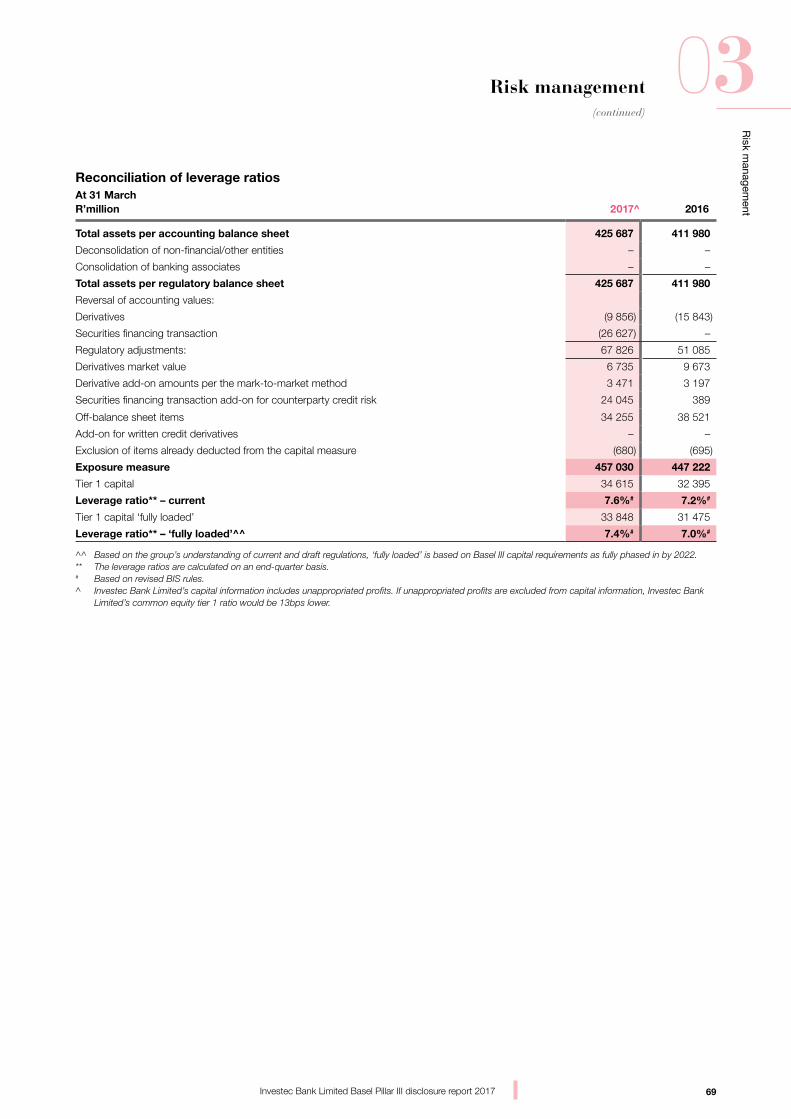
69
Risk m
anagement
03(continued)
Investec Bank Limited Basel Pillar III disclosure report 2017
Risk management
Reconciliation of leverage ratiosAt 31 MarchR’million 2017^ 2016
Total assets per accounting balance sheet 425 687 411 980
Deconsolidation of non-financial/other entities – –
Consolidation of banking associates – –
Total assets per regulatory balance sheet 425 687 411 980
Reversal of accounting values:
Derivatives (9 856) (15 843)
Securities financing transaction (26 627) –
Regulatory adjustments: 67 826 51 085
Derivatives market value 6 735 9 673
Derivative add-on amounts per the mark-to-market method 3 471 3 197
Securities financing transaction add-on for counterparty credit risk 24 045 389
Off-balance sheet items 34 255 38 521
Add-on for written credit derivatives – –
Exclusion of items already deducted from the capital measure (680) (695)
Exposure measure 457 030 447 222
Tier 1 capital 34 615 32 395
Leverage ratio** – current 7.6%# 7.2%#
Tier 1 capital ‘fully loaded’ 33 848 31 475
Leverage ratio** – ‘fully loaded’^^ 7.4%# 7.0%#
^^ Based on the group’s understanding of current and draft regulations, ‘fully loaded’ is based on Basel III capital requirements as fully phased in by 2022.** The leverage ratios are calculated on an end-quarter basis.# Based on revised BIS rules.^ Investec Bank Limited’s capital information includes unappropriated profits. If unappropriated profits are excluded from capital information, Investec Bank
Limited’s common equity tier 1 ratio would be 13bps lower.

Revised quantitative standardised tables and templates
04
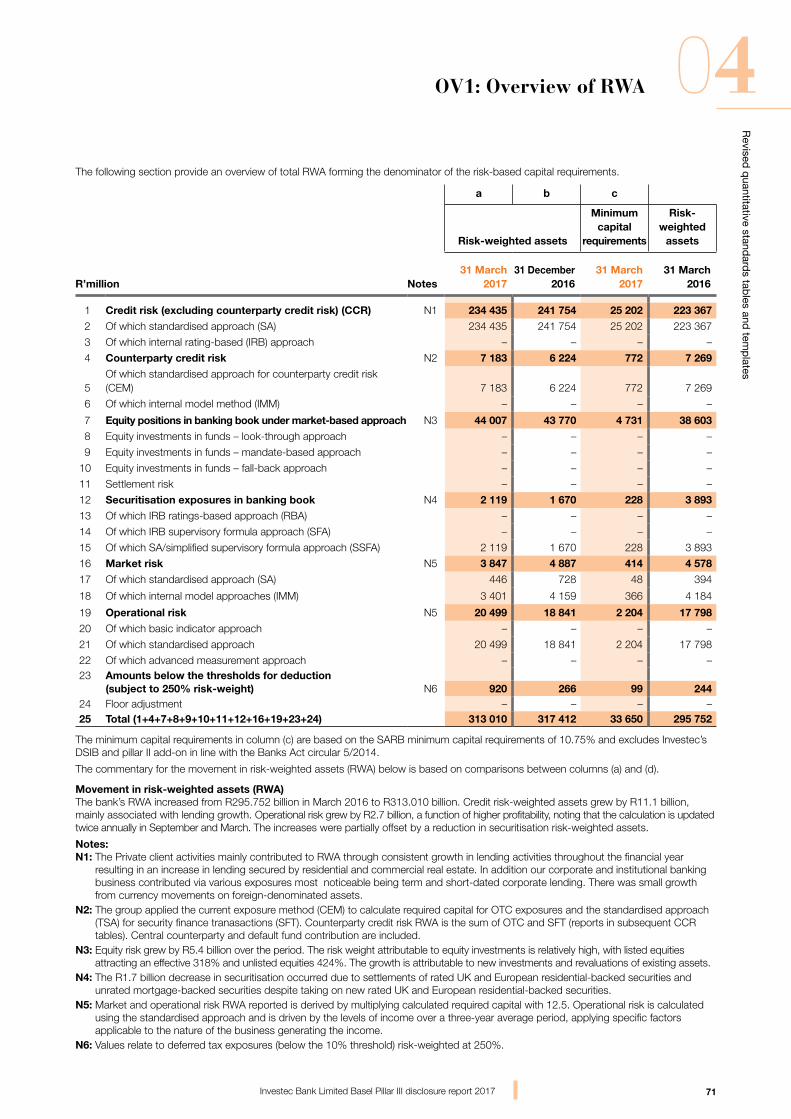
71
Revised
quantitative stand
ards tab
les and tem
plates
04
Investec Bank Limited Basel Pillar III disclosure report 2017
OV1: Overview of RWA
Revised quantitative standardised tables and templates
04
The following section provide an overview of total RWA forming the denominator of the risk-based capital requirements.
a b c
Risk-weighted assets
Minimum capital
requirements
Risk-weighted
assets
R’million Notes31 March
201731 December
201631 March
201731 March
2016
1 Credit risk (excluding counterparty credit risk) (CCR) N1 234 435 241 754 25 202 223 367
2 Of which standardised approach (SA) 234 435 241 754 25 202 223 367
3 Of which internal rating-based (IRB) approach – – – –
4 Counterparty credit risk N2 7 183 6 224 772 7 269
5Of which standardised approach for counterparty credit risk (CEM) 7 183 6 224 772 7 269
6 Of which internal model method (IMM) – – – –
7 Equity positions in banking book under market-based approach N3 44 007 43 770 4 731 38 603
8 Equity investments in funds – look-through approach – – – –
9 Equity investments in funds – mandate-based approach – – – –
10 Equity investments in funds – fall-back approach – – – –
11 Settlement risk – – – –
12 Securitisation exposures in banking book N4 2 119 1 670 228 3 893
13 Of which IRB ratings-based approach (RBA) – – – –
14 Of which IRB supervisory formula approach (SFA) – – – –
15 Of which SA/simplified supervisory formula approach (SSFA) 2 119 1 670 228 3 893
16 Market risk N5 3 847 4 887 414 4 578
17 Of which standardised approach (SA) 446 728 48 394
18 Of which internal model approaches (IMM) 3 401 4 159 366 4 184
19 Operational risk N5 20 499 18 841 2 204 17 798
20 Of which basic indicator approach – – – –
21 Of which standardised approach 20 499 18 841 2 204 17 798
22 Of which advanced measurement approach – – – – 23 Amounts below the thresholds for deduction
(subject to 250% risk-weight) N6 920 266 99 244 24 Floor adjustment – – – – 25 Total (1+4+7+8+9+10+11+12+16+19+23+24) 313 010 317 412 33 650 295 752
The minimum capital requirements in column (c) are based on the SARB minimum capital requirements of 10.75% and excludes Investec’s DSIB and pillar II add-on in line with the Banks Act circular 5/2014.
The commentary for the movement in risk-weighted assets (RWA) below is based on comparisons between columns (a) and (d).
Movement in risk-weighted assets (RWA)The bank’s RWA increased from R295.752 billion in March 2016 to R313.010 billion. Credit risk-weighted assets grew by R11.1 billion, mainly associated with lending growth. Operational risk grew by R2.7 billion, a function of higher profitability, noting that the calculation is updated twice annually in September and March. The increases were partially offset by a reduction in securitisation risk-weighted assets.
Notes:N1: The Private client activities mainly contributed to RWA through consistent growth in lending activities throughout the financial year
resulting in an increase in lending secured by residential and commercial real estate. In addition our corporate and institutional banking business contributed via various exposures most noticeable being term and short-dated corporate lending. There was small growth from currency movements on foreign-denominated assets.
N2: The group applied the current exposure method (CEM) to calculate required capital for OTC exposures and the standardised approach (TSA) for security finance tranasactions (SFT). Counterparty credit risk RWA is the sum of OTC and SFT (reports in subsequent CCR tables). Central counterparty and default fund contribution are included.
N3: Equity risk grew by R5.4 billion over the period. The risk weight attributable to equity investments is relatively high, with listed equities attracting an effective 318% and unlisted equities 424%. The growth is attributable to new investments and revaluations of existing assets.
N4: The R1.7 billion decrease in securitisation occurred due to settlements of rated UK and European residential-backed securities and unrated mortgage-backed securities despite taking on new rated UK and European residential-backed securities.
N5: Market and operational risk RWA reported is derived by multiplying calculated required capital with 12.5. Operational risk is calculated using the standardised approach and is driven by the levels of income over a three-year average period, applying specific factors applicable to the nature of the business generating the income.
N6: Values relate to deferred tax exposures (below the 10% threshold) risk-weighted at 250%.
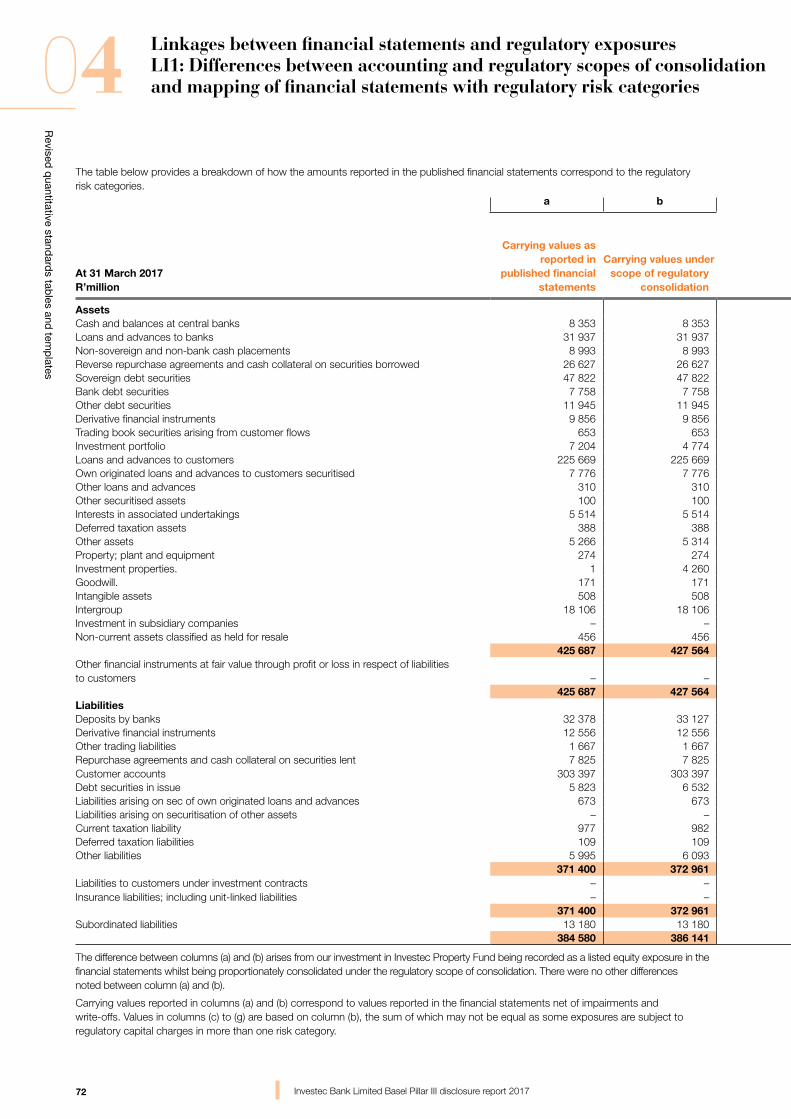
72
Revised
quantitative stand
ards tab
les and tem
plates
04
Investec Bank Limited Basel Pillar III disclosure report 2017
Linkages between financial statements and regulatory exposuresLI1: Differences between accounting and regulatory scopes of consolidation and mapping of financial statements with regulatory risk categories
The table below provides a breakdown of how the amounts reported in the published financial statements correspond to the regulatory risk categories.
a b c d e f g
At 31 March 2017R’million
Carrying values of items
Carrying values as reported in
published financial statements
Carrying values under scope of regulatory
consolidation
Subject to credit risk
framework
Subject to counterparty
credit risk framework
Subject to the
securitisation framework
Subject to the
market risk framework
Not subject to capital requirements or
subject to deductionfrom capital
AssetsCash and balances at central banks 8 353 8 353 8 353 – – – –Loans and advances to banks 31 937 31 937 31 937 – – 1 460 –Non-sovereign and non-bank cash placements 8 993 8 993 8 993 – – – –Reverse repurchase agreements and cash collateral on securities borrowed 26 627 26 627 5 074 21 514 – 6 429 –Sovereign debt securities 47 822 47 822 47 822 – – – –Bank debt securities 7 758 7 758 7 252 – 505 – –Other debt securities 11 945 11 945 10 198 – 2 217 – –Derivative financial instruments 9 856 9 856 – 12 942 – 9 987 –Trading book securities arising from customer flows 653 653 392 – – 653 –Investment portfolio 7 204 4 774 4 774 – – – –Loans and advances to customers 225 669 225 669 225 669 – 154 – –Own originated loans and advances to customers securitised 7 776 7 776 6 824 – 959 – –Other loans and advances 310 310 310 – – – –Other securitised assets 100 100 – – – – –Interests in associated undertakings 5 514 5 514 5 514 – – – –Deferred taxation assets 388 388 388 – – – –Other assets 5 266 5 314 5 314 – – 1 065 –Property; plant and equipment 274 274 274 – – – –Investment properties. 1 4 260 4 260 – – – –Goodwill. 171 171 – – – – 171Intangible assets 508 508 – – – – 508Intergroup 18 106 18 106 18 106 – – 1 498 –Investment in subsidiary companies – – – –Non-current assets classified as held for resale 456 456 456 – – – –
425 687 427 564 391 910 34 456 3 835 21 092 679Other financial instruments at fair value through profit or loss in respect of liabilities to customers – – – – – – –
425 687 427 564 391 910 34 456 3 835 21 092 679 LiabilitiesDeposits by banks 32 378 33 127 – – – – –Derivative financial instruments 12 556 12 556 – 12 556 – 16 909 –Other trading liabilities 1 667 1 667 – – – 1 667 –Repurchase agreements and cash collateral on securities lent 7 825 7 825 – 7 825 – 1 018 –Customer accounts 303 397 303 397 – – – – –Debt securities in issue 5 823 6 532 – – – – –Liabilities arising on sec of own originated loans and advances 673 673 – – – – –Liabilities arising on securitisation of other assets – – – – – – –Current taxation liability 977 982 – – – – –Deferred taxation liabilities 109 109 – – – – –Other liabilities 5 995 6 093 – – – 1 312 –
371 400 372 961 – 20 381 – 20 906 –Liabilities to customers under investment contracts – – – – – – –Insurance liabilities; including unit-linked liabilities – – – – – – –
371 400 372 961 – 20 381 – 20 906 –Subordinated liabilities 13 180 13 180 – – – – –
384 580 386 141 – 20 381 – 20 906 –
The difference between columns (a) and (b) arises from our investment in Investec Property Fund being recorded as a listed equity exposure in the financial statements whilst being proportionately consolidated under the regulatory scope of consolidation. There were no other differences noted between column (a) and (b).
Carrying values reported in columns (a) and (b) correspond to values reported in the financial statements net of impairments and write-offs. Values in columns (c) to (g) are based on column (b), the sum of which may not be equal as some exposures are subject to regulatory capital charges in more than one risk category.
Exposures subject to the counterparty credit risk (CCR) framework in column (d) include exposures in the banking and trading books in line with regulatory requirements. CCR exposures in the trading book also attract market risk requirements and are included in both columns (d) and (f).
All exposures in our trading book were disclosed as being subject to the market risk framework. Column (f) exposures represent trading book exposures compared to columns (a) and (b) representing net balance sheet banking and trading exposures.
Intangible assets and goodwill are deducted from regulatory capital and reserve funds.
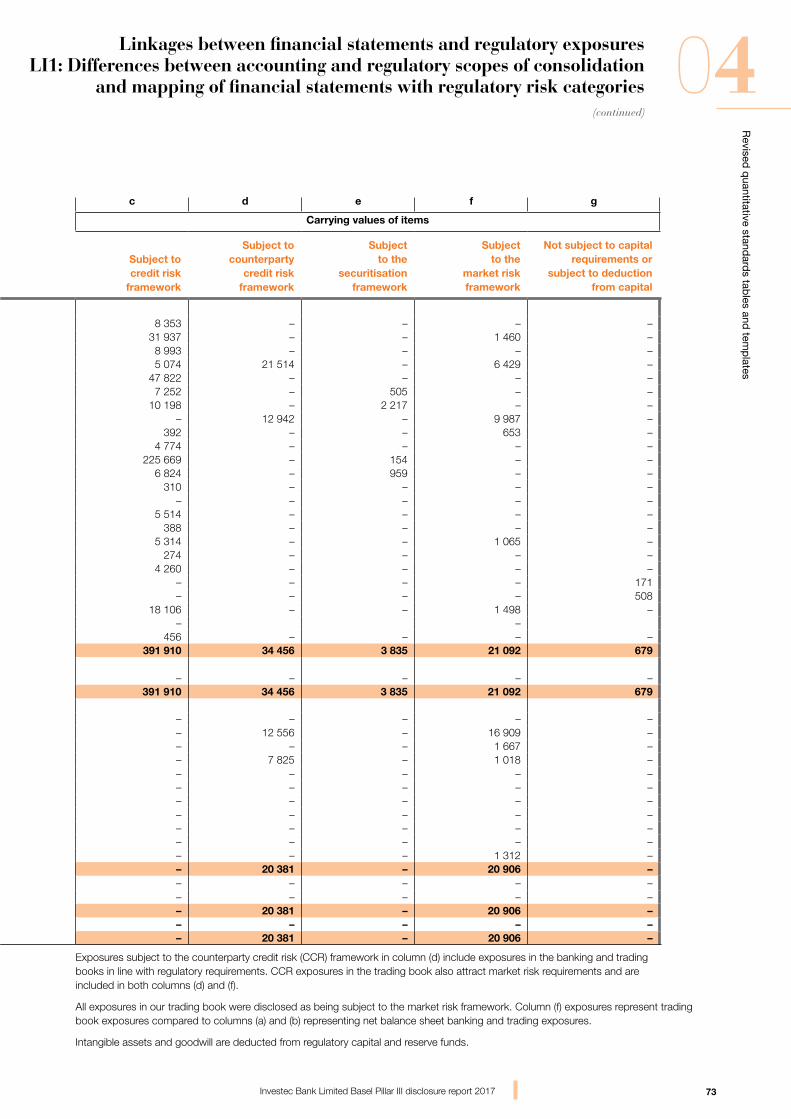
73
Revised
quantitative stand
ards tab
les and tem
plates
04(continued)
Investec Bank Limited Basel Pillar III disclosure report 2017
Linkages between financial statements and regulatory exposuresLI1: Differences between accounting and regulatory scopes of consolidation
and mapping of financial statements with regulatory risk categories
The table below provides a breakdown of how the amounts reported in the published financial statements correspond to the regulatory risk categories.
a b c d e f g
At 31 March 2017R’million
Carrying values of items
Carrying values as reported in
published financial statements
Carrying values under scope of regulatory
consolidation
Subject to credit risk
framework
Subject to counterparty
credit risk framework
Subject to the
securitisation framework
Subject to the
market risk framework
Not subject to capital requirements or
subject to deductionfrom capital
AssetsCash and balances at central banks 8 353 8 353 8 353 – – – –Loans and advances to banks 31 937 31 937 31 937 – – 1 460 –Non-sovereign and non-bank cash placements 8 993 8 993 8 993 – – – –Reverse repurchase agreements and cash collateral on securities borrowed 26 627 26 627 5 074 21 514 – 6 429 –Sovereign debt securities 47 822 47 822 47 822 – – – –Bank debt securities 7 758 7 758 7 252 – 505 – –Other debt securities 11 945 11 945 10 198 – 2 217 – –Derivative financial instruments 9 856 9 856 – 12 942 – 9 987 –Trading book securities arising from customer flows 653 653 392 – – 653 –Investment portfolio 7 204 4 774 4 774 – – – –Loans and advances to customers 225 669 225 669 225 669 – 154 – –Own originated loans and advances to customers securitised 7 776 7 776 6 824 – 959 – –Other loans and advances 310 310 310 – – – –Other securitised assets 100 100 – – – – –Interests in associated undertakings 5 514 5 514 5 514 – – – –Deferred taxation assets 388 388 388 – – – –Other assets 5 266 5 314 5 314 – – 1 065 –Property; plant and equipment 274 274 274 – – – –Investment properties. 1 4 260 4 260 – – – –Goodwill. 171 171 – – – – 171Intangible assets 508 508 – – – – 508Intergroup 18 106 18 106 18 106 – – 1 498 –Investment in subsidiary companies – – – –Non-current assets classified as held for resale 456 456 456 – – – –
425 687 427 564 391 910 34 456 3 835 21 092 679Other financial instruments at fair value through profit or loss in respect of liabilities to customers – – – – – – –
425 687 427 564 391 910 34 456 3 835 21 092 679 LiabilitiesDeposits by banks 32 378 33 127 – – – – –Derivative financial instruments 12 556 12 556 – 12 556 – 16 909 –Other trading liabilities 1 667 1 667 – – – 1 667 –Repurchase agreements and cash collateral on securities lent 7 825 7 825 – 7 825 – 1 018 –Customer accounts 303 397 303 397 – – – – –Debt securities in issue 5 823 6 532 – – – – –Liabilities arising on sec of own originated loans and advances 673 673 – – – – –Liabilities arising on securitisation of other assets – – – – – – –Current taxation liability 977 982 – – – – –Deferred taxation liabilities 109 109 – – – – –Other liabilities 5 995 6 093 – – – 1 312 –
371 400 372 961 – 20 381 – 20 906 –Liabilities to customers under investment contracts – – – – – – –Insurance liabilities; including unit-linked liabilities – – – – – – –
371 400 372 961 – 20 381 – 20 906 –Subordinated liabilities 13 180 13 180 – – – – –
384 580 386 141 – 20 381 – 20 906 –
The difference between columns (a) and (b) arises from our investment in Investec Property Fund being recorded as a listed equity exposure in the financial statements whilst being proportionately consolidated under the regulatory scope of consolidation. There were no other differences noted between column (a) and (b).
Carrying values reported in columns (a) and (b) correspond to values reported in the financial statements net of impairments and write-offs. Values in columns (c) to (g) are based on column (b), the sum of which may not be equal as some exposures are subject to regulatory capital charges in more than one risk category.
Exposures subject to the counterparty credit risk (CCR) framework in column (d) include exposures in the banking and trading books in line with regulatory requirements. CCR exposures in the trading book also attract market risk requirements and are included in both columns (d) and (f).
All exposures in our trading book were disclosed as being subject to the market risk framework. Column (f) exposures represent trading book exposures compared to columns (a) and (b) representing net balance sheet banking and trading exposures.
Intangible assets and goodwill are deducted from regulatory capital and reserve funds.
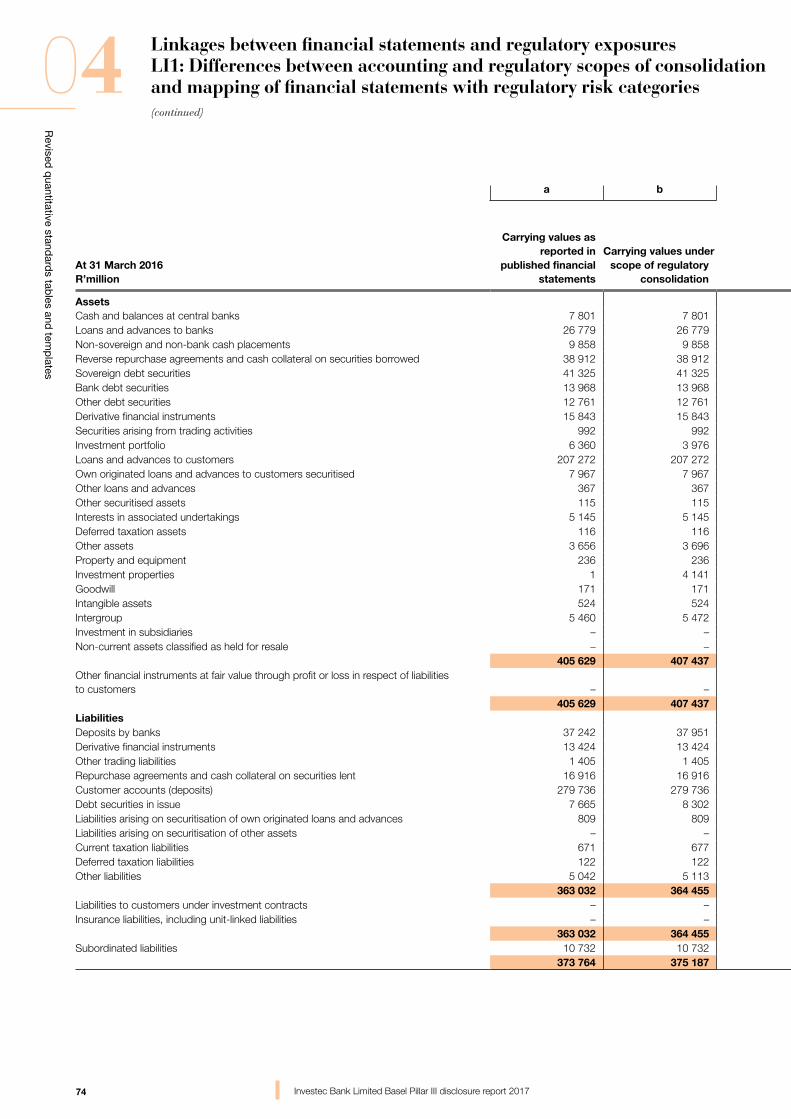
74
Revised
quantitative stand
ards tab
les and tem
plates
04(continued)
Investec Bank Limited Basel Pillar III disclosure report 2017
Linkages between financial statements and regulatory exposuresLI1: Differences between accounting and regulatory scopes of consolidation and mapping of financial statements with regulatory risk categories(continued)
a b c d e f g
At 31 March 2016R’million
Carrying values of items
Carrying values as reported in
published financial statements
Carrying values under scope of regulatory
consolidation
Subject to credit risk
framework
Subject to counterparty
credit risk framework
Subject to the
securitisation framework
Subject to the
market risk framework
Not subject to capital requirements or
subject to deductionfrom capital
AssetsCash and balances at central banks 7 801 7 801 7 801 – – – –Loans and advances to banks 26 779 26 779 26 779 – – 3 335 –Non-sovereign and non-bank cash placements 9 858 9 858 9 858 – – – –Reverse repurchase agreements and cash collateral on securities borrowed 38 912 38 912 5 467 33 445 – 7 655 –Sovereign debt securities 41 325 41 325 41 325 – – – –Bank debt securities 13 968 13 968 13 968 – – – –Other debt securities 12 761 12 761 9 204 – 3 557 – –Derivative financial instruments 15 843 15 843 – 15 843 – 17 053 –Securities arising from trading activities 992 992 – – – 992 –Investment portfolio 6 360 3 976 3 976 – – – –Loans and advances to customers 207 272 207 272 207 066 – 206 – –Own originated loans and advances to customers securitised 7 967 7 967 6 758 – 1 209 – –Other loans and advances 367 367 367 – – – –Other securitised assets 115 115 – 115 – –Interests in associated undertakings 5 145 5 145 5 145 – – – –Deferred taxation assets 116 116 116 – – – –Other assets 3 656 3 696 3 696 – – – –Property and equipment 236 236 236 – – – –Investment properties 1 4 141 4 141 – – – –Goodwill 171 171 – – – – 171 Intangible assets 524 524 – – – – 524 Intergroup 5 460 5 472 5 472 – – 89 –Investment in subsidiaries – – – – – – –Non-current assets classified as held for resale – – – – – – –
405 629 407 437 351 375 49 288 5 087 29 124 695 Other financial instruments at fair value through profit or loss in respect of liabilities to customers – – – – – – –
405 629 407 437 351 375 49 288 5 087 29 124 695 LiabilitiesDeposits by banks 37 242 37 951 – – – 20 –Derivative financial instruments 13 424 13 424 – 13 424 – 26 091 –Other trading liabilities 1 405 1 405 – – – 1 405 –Repurchase agreements and cash collateral on securities lent 16 916 16 916 – 16 916 – 1 553 –Customer accounts (deposits) 279 736 279 736 – – – – –Debt securities in issue 7 665 8 302 – – – – –Liabilities arising on securitisation of own originated loans and advances 809 809 – – 809 – –Liabilities arising on securitisation of other assets – – – – – – –Current taxation liabilities 671 677 – – – – –Deferred taxation liabilities 122 122 – – – – –Other liabilities 5 042 5 113 – – – – –
363 032 364 455 – 30 340 809 29 069 –Liabilities to customers under investment contracts – – – – – – –Insurance liabilities, including unit-linked liabilities – – – – – – –
363 032 364 455 – 30 340 809 29 069 –Subordinated liabilities 10 732 10 732 – – – – –
373 764 375 187 – 30 340 809 29 069 –
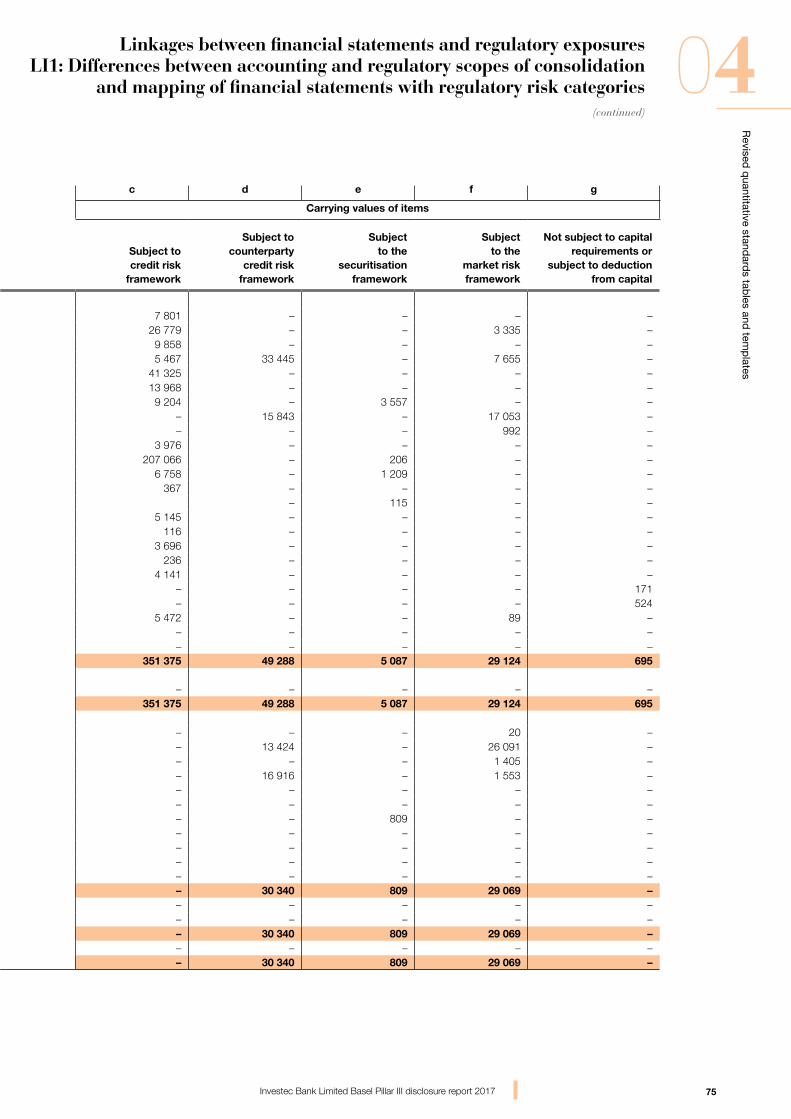
75
Revised
quantitative stand
ards tab
les and tem
plates
04(continued)
Investec Bank Limited Basel Pillar III disclosure report 2017
Linkages between financial statements and regulatory exposuresLI1: Differences between accounting and regulatory scopes of consolidation
and mapping of financial statements with regulatory risk categories
a b c d e f g
At 31 March 2016R’million
Carrying values of items
Carrying values as reported in
published financial statements
Carrying values under scope of regulatory
consolidation
Subject to credit risk
framework
Subject to counterparty
credit risk framework
Subject to the
securitisation framework
Subject to the
market risk framework
Not subject to capital requirements or
subject to deductionfrom capital
AssetsCash and balances at central banks 7 801 7 801 7 801 – – – –Loans and advances to banks 26 779 26 779 26 779 – – 3 335 –Non-sovereign and non-bank cash placements 9 858 9 858 9 858 – – – –Reverse repurchase agreements and cash collateral on securities borrowed 38 912 38 912 5 467 33 445 – 7 655 –Sovereign debt securities 41 325 41 325 41 325 – – – –Bank debt securities 13 968 13 968 13 968 – – – –Other debt securities 12 761 12 761 9 204 – 3 557 – –Derivative financial instruments 15 843 15 843 – 15 843 – 17 053 –Securities arising from trading activities 992 992 – – – 992 –Investment portfolio 6 360 3 976 3 976 – – – –Loans and advances to customers 207 272 207 272 207 066 – 206 – –Own originated loans and advances to customers securitised 7 967 7 967 6 758 – 1 209 – –Other loans and advances 367 367 367 – – – –Other securitised assets 115 115 – 115 – –Interests in associated undertakings 5 145 5 145 5 145 – – – –Deferred taxation assets 116 116 116 – – – –Other assets 3 656 3 696 3 696 – – – –Property and equipment 236 236 236 – – – –Investment properties 1 4 141 4 141 – – – –Goodwill 171 171 – – – – 171 Intangible assets 524 524 – – – – 524 Intergroup 5 460 5 472 5 472 – – 89 –Investment in subsidiaries – – – – – – –Non-current assets classified as held for resale – – – – – – –
405 629 407 437 351 375 49 288 5 087 29 124 695 Other financial instruments at fair value through profit or loss in respect of liabilities to customers – – – – – – –
405 629 407 437 351 375 49 288 5 087 29 124 695 LiabilitiesDeposits by banks 37 242 37 951 – – – 20 –Derivative financial instruments 13 424 13 424 – 13 424 – 26 091 –Other trading liabilities 1 405 1 405 – – – 1 405 –Repurchase agreements and cash collateral on securities lent 16 916 16 916 – 16 916 – 1 553 –Customer accounts (deposits) 279 736 279 736 – – – – –Debt securities in issue 7 665 8 302 – – – – –Liabilities arising on securitisation of own originated loans and advances 809 809 – – 809 – –Liabilities arising on securitisation of other assets – – – – – – –Current taxation liabilities 671 677 – – – – –Deferred taxation liabilities 122 122 – – – – –Other liabilities 5 042 5 113 – – – – –
363 032 364 455 – 30 340 809 29 069 –Liabilities to customers under investment contracts – – – – – – –Insurance liabilities, including unit-linked liabilities – – – – – – –
363 032 364 455 – 30 340 809 29 069 –Subordinated liabilities 10 732 10 732 – – – – –
373 764 375 187 – 30 340 809 29 069 –
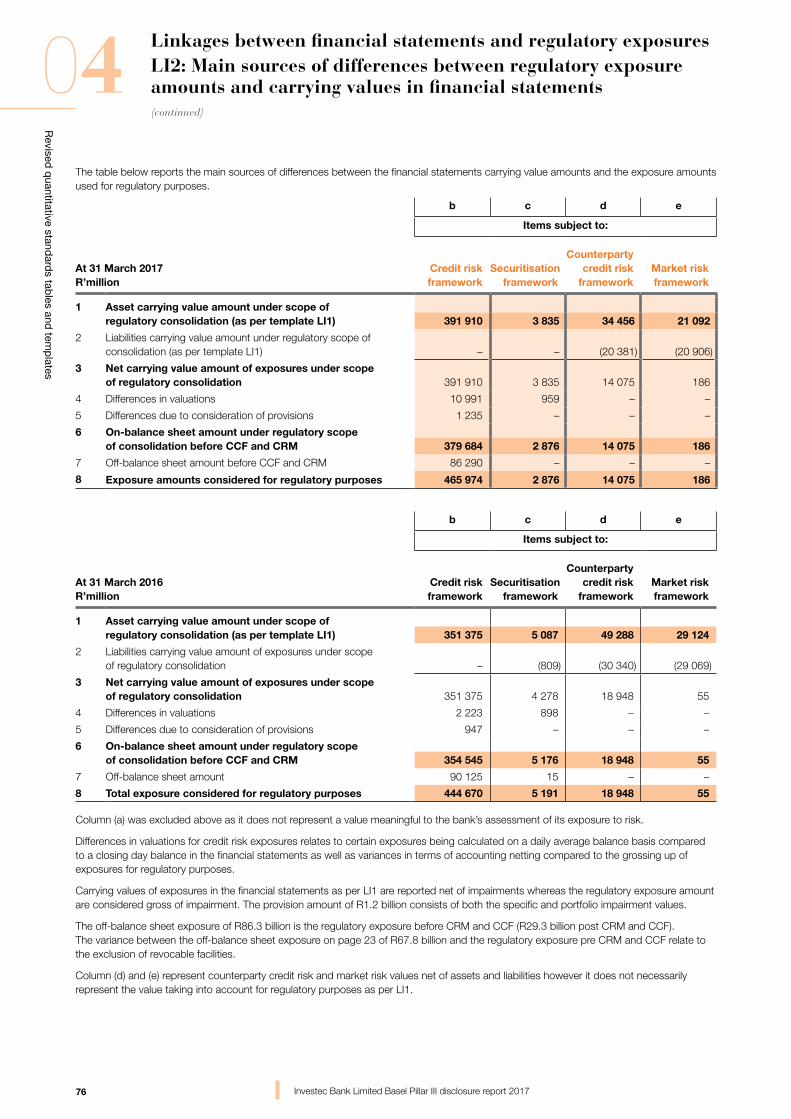
76
Revised
quantitative stand
ards tab
les and tem
plates
04
Investec Bank Limited Basel Pillar III disclosure report 2017
Linkages between financial statements and regulatory exposuresLI2: Main sources of differences between regulatory exposure amounts and carrying values in financial statements
The table below reports the main sources of differences between the financial statements carrying value amounts and the exposure amounts used for regulatory purposes.
b c d e
Items subject to:
At 31 March 2017R’million
Credit risk framework
Securitisation framework
Counterparty credit risk
frameworkMarket risk framework
1 Asset carrying value amount under scope ofregulatory consolidation (as per template LI1) 391 910 3 835 34 456 21 092
2 Liabilities carrying value amount under regulatory scope of consolidation (as per template LI1) – – (20 381) (20 906)
3 Net carrying value amount of exposures under scope of regulatory consolidation 391 910 3 835 14 075 186
4 Differences in valuations 10 991 959 – –
5 Differences due to consideration of provisions 1 235 – – –
6 On-balance sheet amount under regulatory scopeof consolidation before CCF and CRM 379 684 2 876 14 075 186
7 Off-balance sheet amount before CCF and CRM 86 290 – – –
8 Exposure amounts considered for regulatory purposes 465 974 2 876 14 075 186
b c d e
Items subject to:
At 31 March 2016R’million
Credit risk framework
Securitisation framework
Counterparty credit risk
frameworkMarket risk framework
1 Asset carrying value amount under scope ofregulatory consolidation (as per template LI1) 351 375 5 087 49 288 29 124
2 Liabilities carrying value amount of exposures under scope of regulatory consolidation – (809) (30 340) (29 069)
3 Net carrying value amount of exposures under scope of regulatory consolidation 351 375 4 278 18 948 55
4 Differences in valuations 2 223 898 – –
5 Differences due to consideration of provisions 947 – – –
6 On-balance sheet amount under regulatory scopeof consolidation before CCF and CRM 354 545 5 176 18 948 55
7 Off-balance sheet amount 90 125 15 – –
8 Total exposure considered for regulatory purposes 444 670 5 191 18 948 55
Column (a) was excluded above as it does not represent a value meaningful to the bank’s assessment of its exposure to risk.
Differences in valuations for credit risk exposures relates to certain exposures being calculated on a daily average balance basis compared to a closing day balance in the financial statements as well as variances in terms of accounting netting compared to the grossing up of exposures for regulatory purposes.
Carrying values of exposures in the financial statements as per LI1 are reported net of impairments whereas the regulatory exposure amount are considered gross of impairment. The provision amount of R1.2 billion consists of both the specific and portfolio impairment values.
The off-balance sheet exposure of R86.3 billion is the regulatory exposure before CRM and CCF (R29.3 billion post CRM and CCF). The variance between the off-balance sheet exposure on page 23 of R67.8 billion and the regulatory exposure pre CRM and CCF relate to the exclusion of revocable facilities.
Column (d) and (e) represent counterparty credit risk and market risk values net of assets and liabilities however it does not necessarily represent the value taking into account for regulatory purposes as per LI1.
(continued)
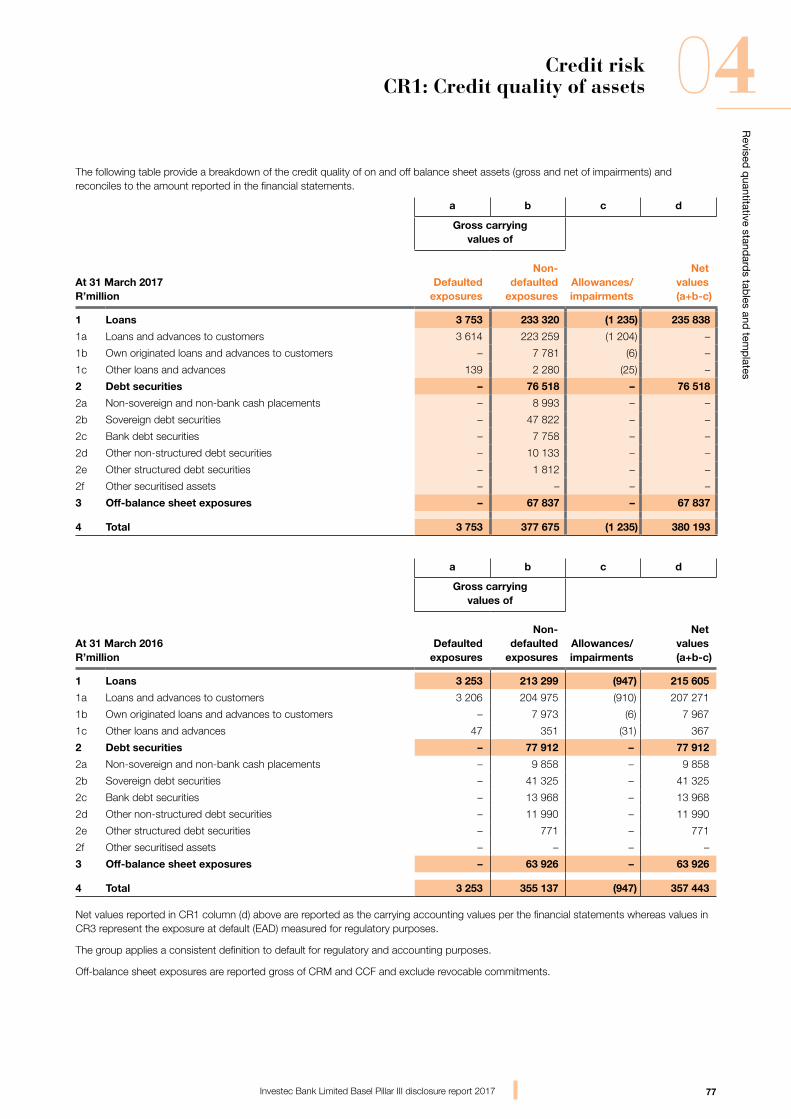
77
Revised
quantitative stand
ards tab
les and tem
plates
04
Investec Bank Limited Basel Pillar III disclosure report 2017
Credit riskCR1: Credit quality of assets
The following table provide a breakdown of the credit quality of on and off balance sheet assets (gross and net of impairments) and reconciles to the amount reported in the financial statements.
a b c d
Gross carrying values of
At 31 March 2017R’million
Defaulted exposures
Non-defaulted
exposuresAllowances/impairments
Net values (a+b-c)
1 Loans 3 753 233 320 (1 235) 235 838
1a Loans and advances to customers 3 614 223 259 (1 204) –
1b Own originated loans and advances to customers – 7 781 (6) –
1c Other loans and advances 139 2 280 (25) –
2 Debt securities – 76 518 – 76 518
2a Non-sovereign and non-bank cash placements – 8 993 – –
2b Sovereign debt securities – 47 822 – –
2c Bank debt securities – 7 758 – –
2d Other non-structured debt securities – 10 133 – –
2e Other structured debt securities – 1 812 – –
2f Other securitised assets – – – –
3 Off-balance sheet exposures – 67 837 – 67 837
4 Total 3 753 377 675 (1 235) 380 193
a b c d
Gross carrying values of
At 31 March 2016R’million
Defaulted exposures
Non-defaulted
exposuresAllowances/impairments
Net values (a+b-c)
1 Loans 3 253 213 299 (947) 215 605
1a Loans and advances to customers 3 206 204 975 (910) 207 271
1b Own originated loans and advances to customers – 7 973 (6) 7 967
1c Other loans and advances 47 351 (31) 367
2 Debt securities – 77 912 – 77 912
2a Non-sovereign and non-bank cash placements – 9 858 – 9 858
2b Sovereign debt securities – 41 325 – 41 325
2c Bank debt securities – 13 968 – 13 968
2d Other non-structured debt securities – 11 990 – 11 990
2e Other structured debt securities – 771 – 771
2f Other securitised assets – – – –
3 Off-balance sheet exposures – 63 926 – 63 926
4 Total 3 253 355 137 (947) 357 443
Net values reported in CR1 column (d) above are reported as the carrying accounting values per the financial statements whereas values in CR3 represent the exposure at default (EAD) measured for regulatory purposes.
The group applies a consistent definition to default for regulatory and accounting purposes.
Off-balance sheet exposures are reported gross of CRM and CCF and exclude revocable commitments.
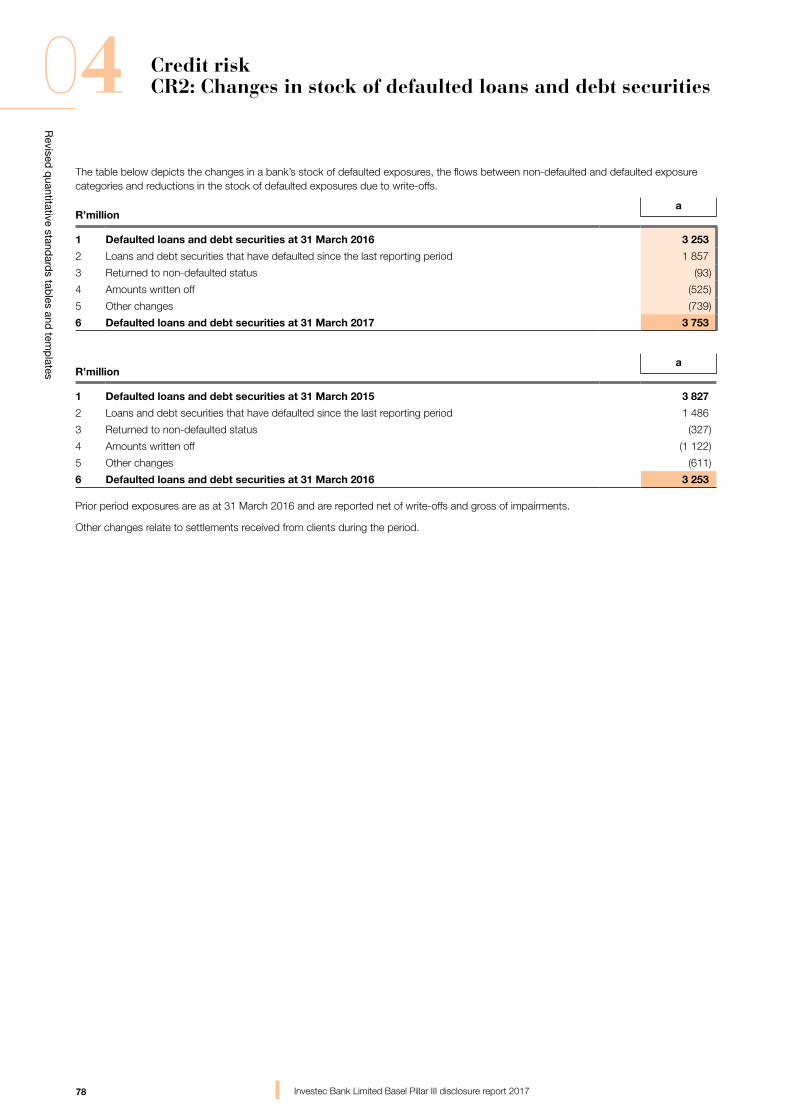
78
Revised
quantitative stand
ards tab
les and tem
plates
04
Investec Bank Limited Basel Pillar III disclosure report 2017
Credit riskCR2: Changes in stock of defaulted loans and debt securities
The table below depicts the changes in a bank’s stock of defaulted exposures, the flows between non-defaulted and defaulted exposure categories and reductions in the stock of defaulted exposures due to write-offs.
R’milliona
1 Defaulted loans and debt securities at 31 March 2016 3 253
2 Loans and debt securities that have defaulted since the last reporting period 1 857
3 Returned to non-defaulted status (93)
4 Amounts written off (525)
5 Other changes (739)
6 Defaulted loans and debt securities at 31 March 2017 3 753
R’milliona
1 Defaulted loans and debt securities at 31 March 2015 3 827
2 Loans and debt securities that have defaulted since the last reporting period 1 486
3 Returned to non-defaulted status (327)
4 Amounts written off (1 122)
5 Other changes (611)
6 Defaulted loans and debt securities at 31 March 2016 3 253
Prior period exposures are as at 31 March 2016 and are reported net of write-offs and gross of impairments.
Other changes relate to settlements received from clients during the period.
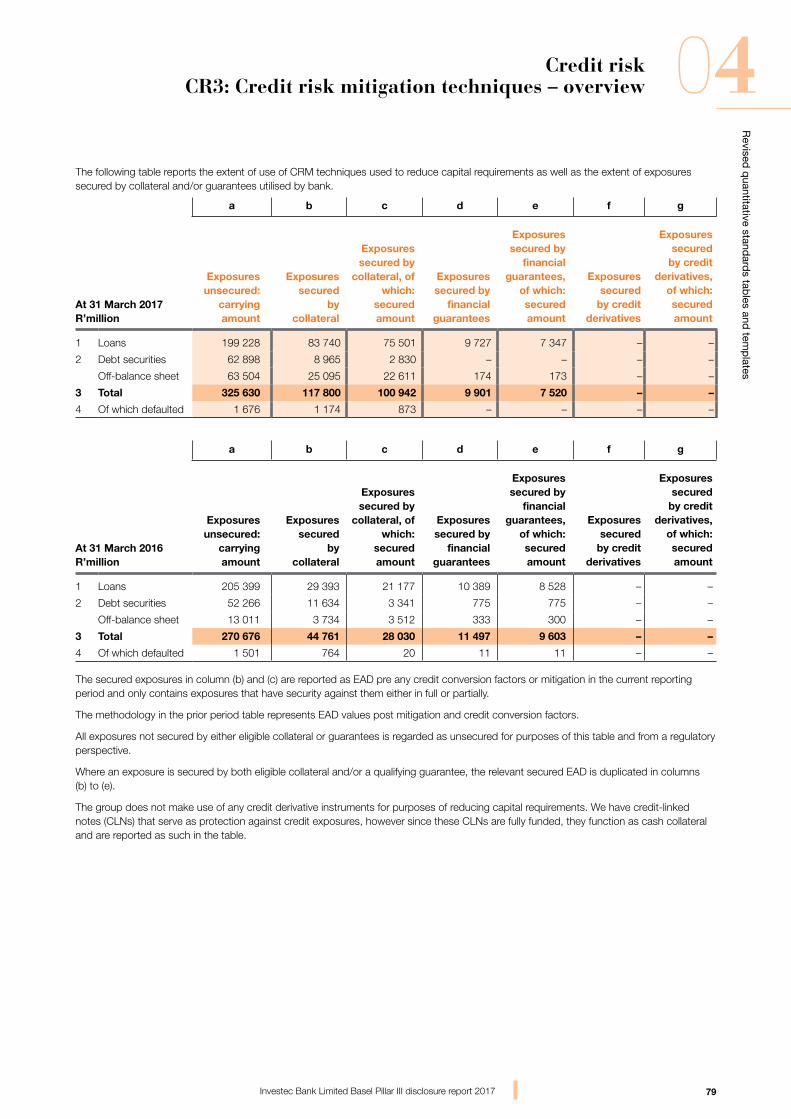
79
Revised
quantitative stand
ards tab
les and tem
plates
04
Investec Bank Limited Basel Pillar III disclosure report 2017
Credit riskCR3: Credit risk mitigation techniques – overview
The following table reports the extent of use of CRM techniques used to reduce capital requirements as well as the extent of exposures secured by collateral and/or guarantees utilised by bank.
a b c d e f g
At 31 March 2017R’million
Exposures unsecured:
carrying amount
Exposures secured
by collateral
Exposures secured by
collateral, of which:
secured amount
Exposures secured by
financial guarantees
Exposures secured by
financial guarantees,
of which: secured amount
Exposures secured
by credit derivatives
Exposures secured
by credit derivatives,
of which: secured amount
1 Loans 199 228 83 740 75 501 9 727 7 347 – –
2 Debt securities 62 898 8 965 2 830 – – – –
Off-balance sheet 63 504 25 095 22 611 174 173 – –
3 Total 325 630 117 800 100 942 9 901 7 520 – –
4 Of which defaulted 1 676 1 174 873 – – – –
a b c d e f g
At 31 March 2016R’million
Exposures unsecured:
carrying amount
Exposures secured
by collateral
Exposures secured by
collateral, of which:
secured amount
Exposures secured by
financial guarantees
Exposures secured by
financial guarantees,
of which: secured amount
Exposures secured
by credit derivatives
Exposures secured
by credit derivatives,
of which: secured amount
1 Loans 205 399 29 393 21 177 10 389 8 528 – –
2 Debt securities 52 266 11 634 3 341 775 775 – –
Off-balance sheet 13 011 3 734 3 512 333 300 – –
3 Total 270 676 44 761 28 030 11 497 9 603 – –
4 Of which defaulted 1 501 764 20 11 11 – –
The secured exposures in column (b) and (c) are reported as EAD pre any credit conversion factors or mitigation in the current reporting period and only contains exposures that have security against them either in full or partially.
The methodology in the prior period table represents EAD values post mitigation and credit conversion factors.
All exposures not secured by either eligible collateral or guarantees is regarded as unsecured for purposes of this table and from a regulatory perspective.
Where an exposure is secured by both eligible collateral and/or a qualifying guarantee, the relevant secured EAD is duplicated in columns (b) to (e).
The group does not make use of any credit derivative instruments for purposes of reducing capital requirements. We have credit-linked notes (CLNs) that serve as protection against credit exposures, however since these CLNs are fully funded, they function as cash collateral and are reported as such in the table.
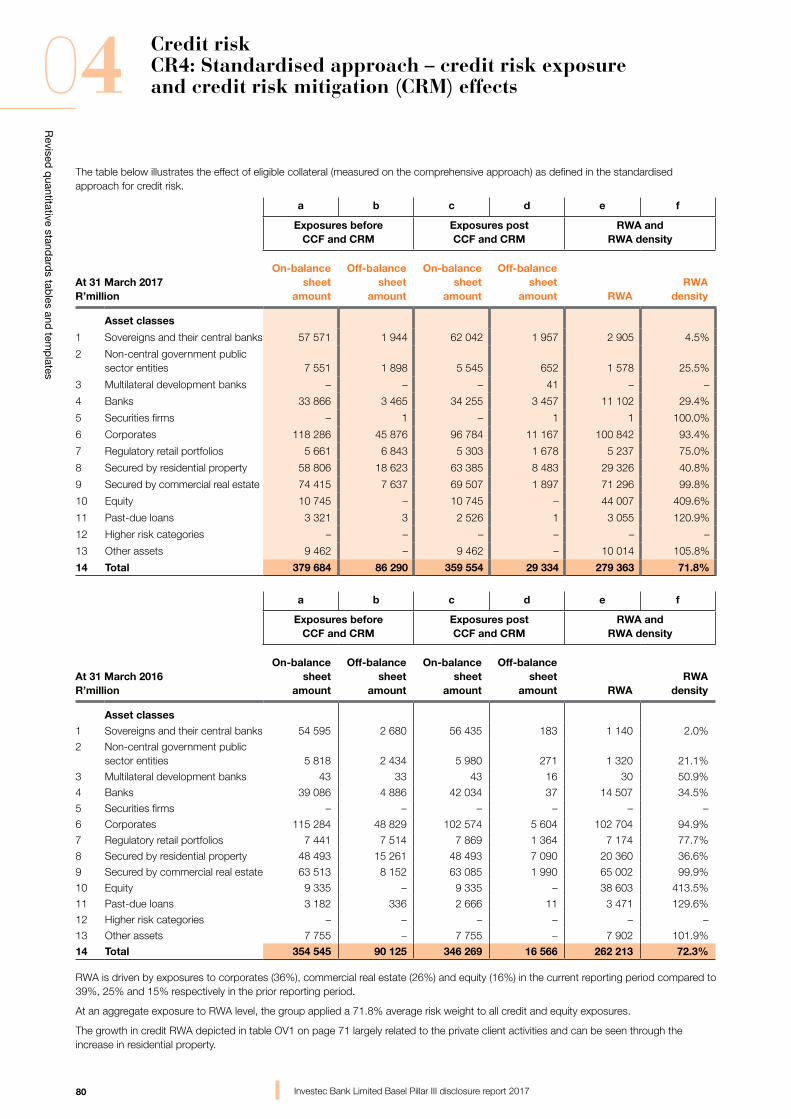
80
Revised
quantitative stand
ards tab
les and tem
plates
04
Investec Bank Limited Basel Pillar III disclosure report 2017
Credit riskCR4: Standardised approach – credit risk exposure and credit risk mitigation (CRM) effects
The table below illustrates the effect of eligible collateral (measured on the comprehensive approach) as defined in the standardised approach for credit risk.
a b c d e f
Exposures before CCF and CRM
Exposures post CCF and CRM
RWA and RWA density
At 31 March 2017R’million
On-balance sheet
amount
Off-balance sheet
amount
On-balance sheet
amount
Off-balance sheet
amount RWARWA
density
Asset classes
1 Sovereigns and their central banks 57 571 1 944 62 042 1 957 2 905 4.5%
2 Non-central government public sector entities 7 551 1 898 5 545 652 1 578 25.5%
3 Multilateral development banks – – – 41 – –
4 Banks 33 866 3 465 34 255 3 457 11 102 29.4%
5 Securities firms – 1 – 1 1 100.0%
6 Corporates 118 286 45 876 96 784 11 167 100 842 93.4%
7 Regulatory retail portfolios 5 661 6 843 5 303 1 678 5 237 75.0%
8 Secured by residential property 58 806 18 623 63 385 8 483 29 326 40.8%
9 Secured by commercial real estate 74 415 7 637 69 507 1 897 71 296 99.8%
10 Equity 10 745 – 10 745 – 44 007 409.6%
11 Past-due loans 3 321 3 2 526 1 3 055 120.9%
12 Higher risk categories – – – – – –
13 Other assets 9 462 – 9 462 – 10 014 105.8%
14 Total 379 684 86 290 359 554 29 334 279 363 71.8%
a b c d e f
Exposures before CCF and CRM
Exposures post CCF and CRM
RWA and RWA density
At 31 March 2016R’million
On-balance sheet
amount
Off-balance sheet
amount
On-balance sheet
amount
Off-balance sheet
amount RWARWA
density
Asset classes
1 Sovereigns and their central banks 54 595 2 680 56 435 183 1 140 2.0%
2 Non-central government public sector entities 5 818 2 434 5 980 271 1 320 21.1%
3 Multilateral development banks 43 33 43 16 30 50.9%
4 Banks 39 086 4 886 42 034 37 14 507 34.5%
5 Securities firms – – – – – –
6 Corporates 115 284 48 829 102 574 5 604 102 704 94.9%
7 Regulatory retail portfolios 7 441 7 514 7 869 1 364 7 174 77.7%
8 Secured by residential property 48 493 15 261 48 493 7 090 20 360 36.6%
9 Secured by commercial real estate 63 513 8 152 63 085 1 990 65 002 99.9%
10 Equity 9 335 – 9 335 – 38 603 413.5%
11 Past-due loans 3 182 336 2 666 11 3 471 129.6%
12 Higher risk categories – – – – – –
13 Other assets 7 755 – 7 755 – 7 902 101.9%
14 Total 354 545 90 125 346 269 16 566 262 213 72.3%
RWA is driven by exposures to corporates (36%), commercial real estate (26%) and equity (16%) in the current reporting period compared to 39%, 25% and 15% respectively in the prior reporting period.
At an aggregate exposure to RWA level, the group applied a 71.8% average risk weight to all credit and equity exposures.
The growth in credit RWA depicted in table OV1 on page 71 largely related to the private client activities and can be seen through the increase in residential property.

81
Revised
quantitative stand
ards tab
les and tem
plates
04(continued)
Investec Bank Limited Basel Pillar III disclosure report 2017
Credit riskCR4: Standardised approach – credit risk exposure
and credit risk mitigation (CRM) effects
The following is further relevant to the table:
The carrying value of exposures considered for credit risk of R391 billion in LI1 compared to the R388 billion on page 23 are largely as a result of the different classification of exposures between equity, derivative and securitisation risk assessed from an internal risk management perspective compared to a regulatory classification in LI2 of R379.6 billion.
Past due assets are disclosed separately independent of asset class.
RWA density provides a synthetic metric on riskiness of each portfolio and is derived by dividing RWA in column (e) with the sum of columns (c) and (d).
Equity exposures are calculated based on the market based approach (simple risk weight method) after the application of a 1.06 scaling factor as required by SARB. Listed equity are risk-weighted at 318% and unlisted equity at 424%.
The on-balance sheet exposures in column (a) are reported gross of impairment, CCF and CRM. Off-balance sheet exposures in column (b) include revocable facilities.
Credit exposure post-CCF and post-CRM in columns (c) and (d) are the amounts to which risk-weighted assets are applied to.
Past due loans reported follows the same definition of default as applied in table CR1 but includes revocable facilities and average balances where relevant as measured under the regulations.
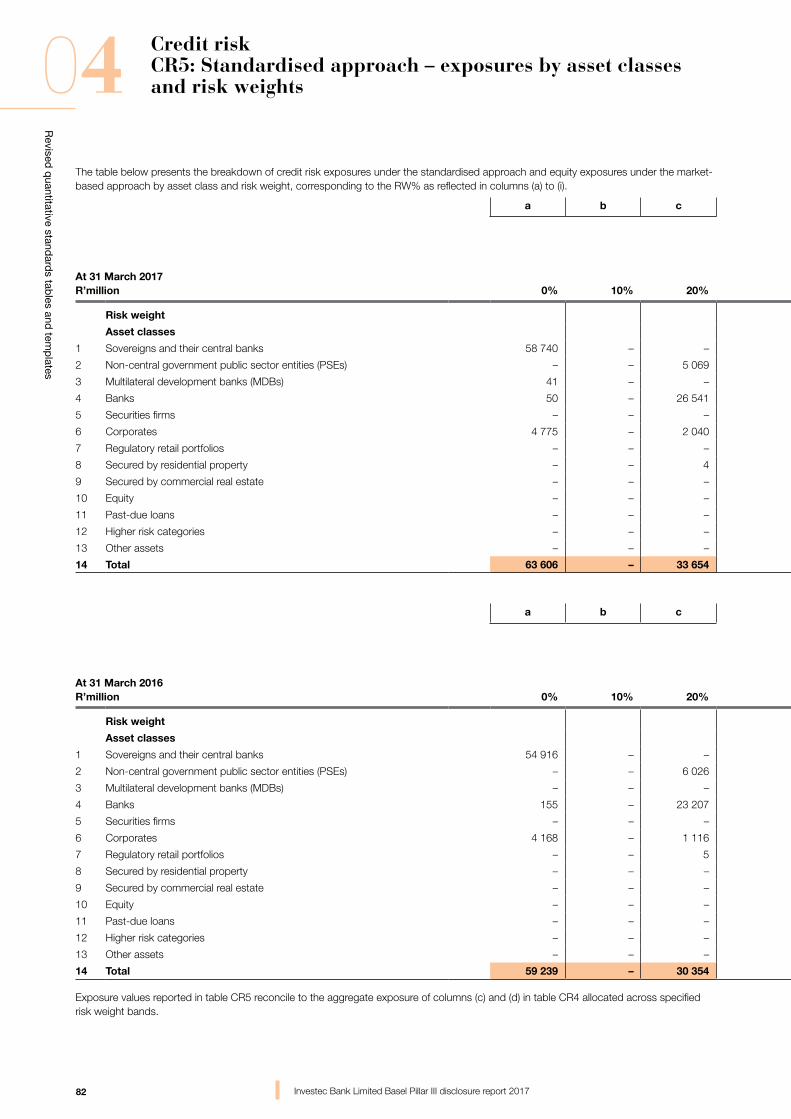
82
Revised
quantitative stand
ards tab
les and tem
plates
04
Investec Bank Limited Basel Pillar III disclosure report 2017
Credit riskCR5: Standardised approach – exposures by asset classes and risk weights
The table below presents the breakdown of credit risk exposures under the standardised approach and equity exposures under the market- based approach by asset class and risk weight, corresponding to the RW% as reflected in columns (a) to (i).
a b c d e f g h i j
At 31 March 2017R’million 0% 10% 20% 35% 50% 75% 100% 150% Others
Total creditexposures
amount (postCCF and
post CRM)
Risk weight
Asset classes
1 Sovereigns and their central banks 58 740 – – – 4 708 – 551 – – 63 999
2 Non-central government public sector entities (PSEs) – – 5 069 – 1 128 – – – – 6 197
3 Multilateral development banks (MDBs) 41 – – – – – – – – 41
4 Banks 50 – 26 541 – 10 654 – 467 – – 37 712
5 Securities firms – – – – – – 1 – – 1
6 Corporates 4 775 – 2 040 – 1 389 86 99 634 27 – 107 951
7 Regulatory retail portfolios – – – 1 – 6 980 – – – 6 981
8 Secured by residential property – – 4 64 432 – 2 628 4 804 – – 71 868
9 Secured by commercial real estate – – – – – 431 70 973 – – 71 404
10 Equity – – – – – – – – 10 745 10 745
11 Past-due loans – – – – 253 1 963 1 310 – 2 527
12 Higher risk categories – – – – – – – – – –
13 Other assets – – – – – – 9 094 – 368 9 462
14 Total 63 606 – 33 654 64 433 18 132 10 126 186 487 1 337 11 113 388 888
a b c d e f g h i j
At 31 March 2016R’million 0% 10% 20% 35% 50% 75% 100% 150% Others
Total creditexposures
amount (postCCF and
post CRM)
Risk weight
Asset classes
1 Sovereigns and their central banks 54 916 – – – 1 122 – 580 – – 56 618
2 Non-central government public sector entities (PSEs) – – 6 026 – 220 – 5 – – 6 251
3 Multilateral development banks (MDBs) – – – – 59 – – – – 59
4 Banks 155 – 23 207 – 17 686 – 1 023 – – 42 071
5 Securities firms – – – – – – – – – –
6 Corporates 4 168 – 1 116 – 867 – 102 027 – – 108 178
7 Regulatory retail portfolios – – 5 – – 8 221 1 007 – – 9 233
8 Secured by residential property – – – 53 317 – 2 266 – – – 55 583
9 Secured by commercial real estate – – – – 146 – 64 929 – – 65 075
10 Equity – – – – – – – – 9 335 9 335
11 Past-due loans – – – – 124 – 841 1 712 – 2 677
12 Higher risk categories – – – – – – – – – –
13 Other assets – – – – – – 7 657 – 98 7 755
14 Total 59 239 – 30 354 53 317 20 224 10 487 178 068 1 712 9 433 362 835
Exposure values reported in table CR5 reconcile to the aggregate exposure of columns (c) and (d) in table CR4 allocated across specified risk weight bands.
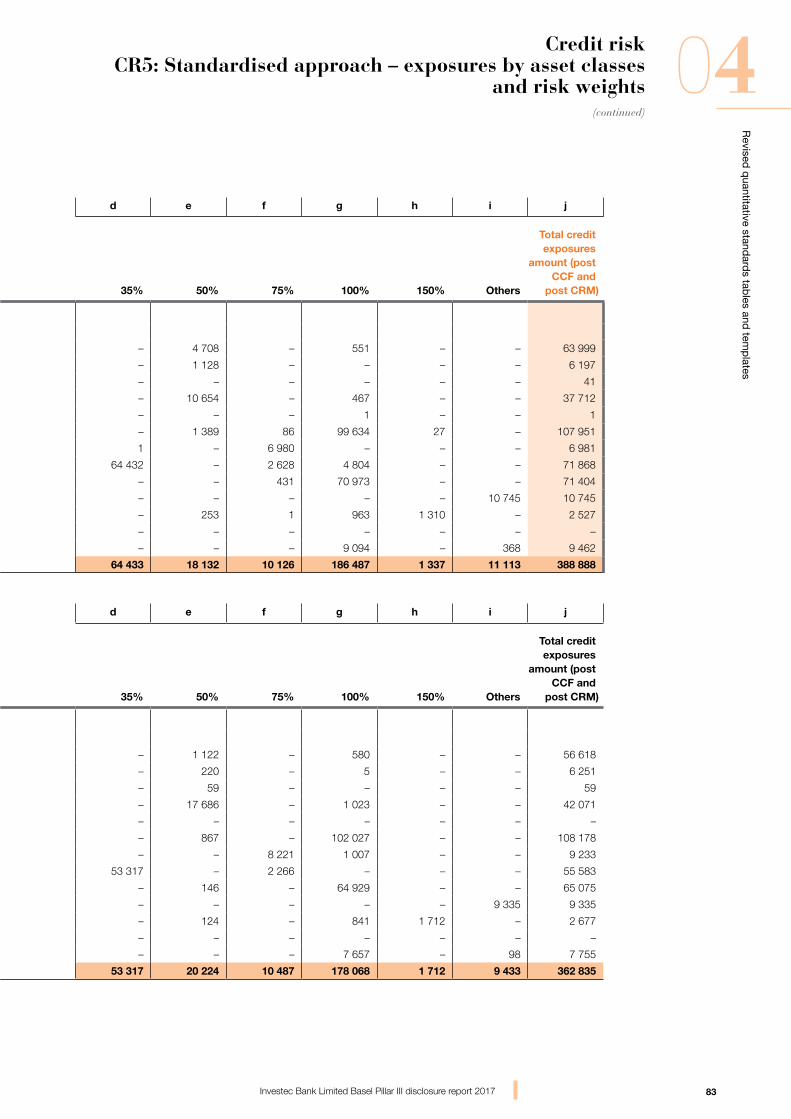
83
Revised
quantitative stand
ards tab
les and tem
plates
04(continued)
Investec Bank Limited Basel Pillar III disclosure report 2017
Credit riskCR5: Standardised approach – exposures by asset classes
and risk weights
The table below presents the breakdown of credit risk exposures under the standardised approach and equity exposures under the market- based approach by asset class and risk weight, corresponding to the RW% as reflected in columns (a) to (i).
a b c d e f g h i j
At 31 March 2017R’million 0% 10% 20% 35% 50% 75% 100% 150% Others
Total creditexposures
amount (postCCF and
post CRM)
Risk weight
Asset classes
1 Sovereigns and their central banks 58 740 – – – 4 708 – 551 – – 63 999
2 Non-central government public sector entities (PSEs) – – 5 069 – 1 128 – – – – 6 197
3 Multilateral development banks (MDBs) 41 – – – – – – – – 41
4 Banks 50 – 26 541 – 10 654 – 467 – – 37 712
5 Securities firms – – – – – – 1 – – 1
6 Corporates 4 775 – 2 040 – 1 389 86 99 634 27 – 107 951
7 Regulatory retail portfolios – – – 1 – 6 980 – – – 6 981
8 Secured by residential property – – 4 64 432 – 2 628 4 804 – – 71 868
9 Secured by commercial real estate – – – – – 431 70 973 – – 71 404
10 Equity – – – – – – – – 10 745 10 745
11 Past-due loans – – – – 253 1 963 1 310 – 2 527
12 Higher risk categories – – – – – – – – – –
13 Other assets – – – – – – 9 094 – 368 9 462
14 Total 63 606 – 33 654 64 433 18 132 10 126 186 487 1 337 11 113 388 888
a b c d e f g h i j
At 31 March 2016R’million 0% 10% 20% 35% 50% 75% 100% 150% Others
Total creditexposures
amount (postCCF and
post CRM)
Risk weight
Asset classes
1 Sovereigns and their central banks 54 916 – – – 1 122 – 580 – – 56 618
2 Non-central government public sector entities (PSEs) – – 6 026 – 220 – 5 – – 6 251
3 Multilateral development banks (MDBs) – – – – 59 – – – – 59
4 Banks 155 – 23 207 – 17 686 – 1 023 – – 42 071
5 Securities firms – – – – – – – – – –
6 Corporates 4 168 – 1 116 – 867 – 102 027 – – 108 178
7 Regulatory retail portfolios – – 5 – – 8 221 1 007 – – 9 233
8 Secured by residential property – – – 53 317 – 2 266 – – – 55 583
9 Secured by commercial real estate – – – – 146 – 64 929 – – 65 075
10 Equity – – – – – – – – 9 335 9 335
11 Past-due loans – – – – 124 – 841 1 712 – 2 677
12 Higher risk categories – – – – – – – – – –
13 Other assets – – – – – – 7 657 – 98 7 755
14 Total 59 239 – 30 354 53 317 20 224 10 487 178 068 1 712 9 433 362 835
Exposure values reported in table CR5 reconcile to the aggregate exposure of columns (c) and (d) in table CR4 allocated across specified risk weight bands.
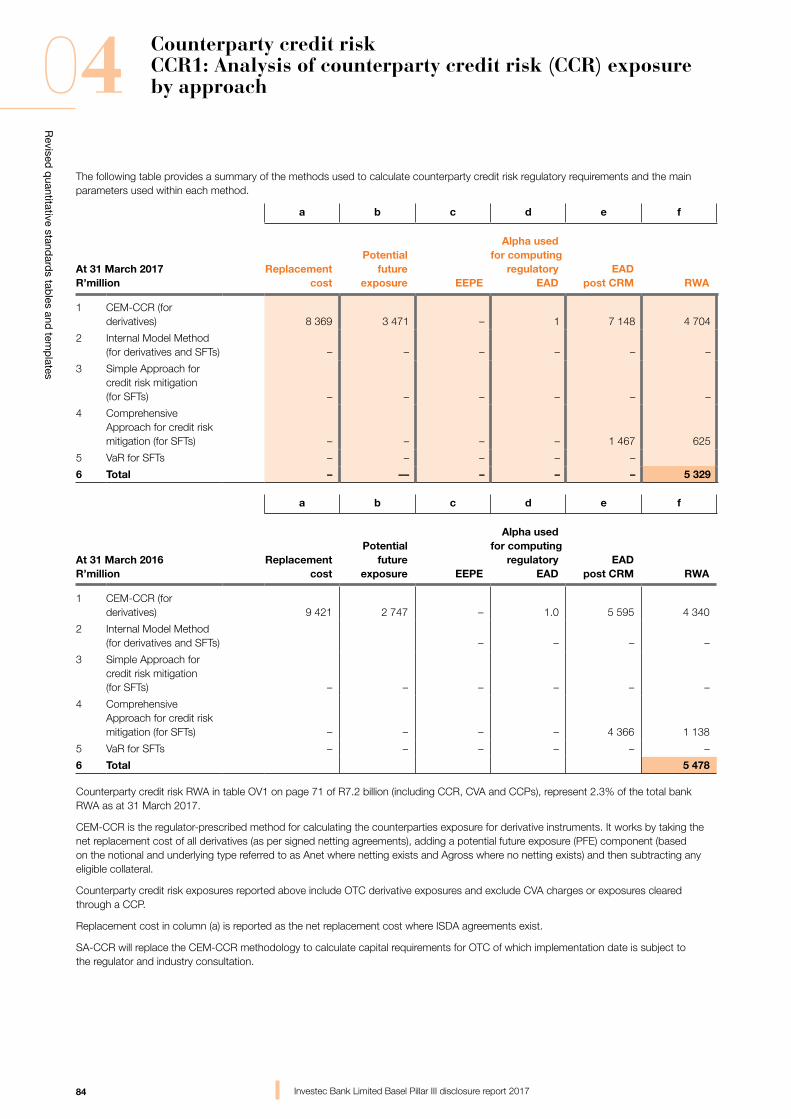
84
Revised
quantitative stand
ards tab
les and tem
plates
04
Investec Bank Limited Basel Pillar III disclosure report 2017
Counterparty credit riskCCR1: Analysis of counterparty credit risk (CCR) exposure by approach
The following table provides a summary of the methods used to calculate counterparty credit risk regulatory requirements and the main parameters used within each method.
a b c d e f
At 31 March 2017R’million
Replacementcost
Potentialfuture
exposure EEPE
Alpha usedfor computing
regulatoryEAD
EADpost CRM RWA
1 CEM-CCR (for derivatives) 8 369 3 471 – 1 7 148 4 704
2 Internal Model Method (for derivatives and SFTs) – – – – – –
3 Simple Approach for credit risk mitigation (for SFTs) – – – – – –
4 Comprehensive Approach for credit risk mitigation (for SFTs) – – – – 1 467 625
5 VaR for SFTs – – – – –
6 Total – –– – – – 5 329
a b c d e f
At 31 March 2016R’million
Replacementcost
Potentialfuture
exposure EEPE
Alpha usedfor computing
regulatoryEAD
EADpost CRM RWA
1 CEM-CCR (for derivatives) 9 421 2 747 – 1.0 5 595 4 340
2 Internal Model Method (for derivatives and SFTs) – – – –
3 Simple Approach for credit risk mitigation (for SFTs) – – – – – –
4 Comprehensive Approach for credit risk mitigation (for SFTs) – – – – 4 366 1 138
5 VaR for SFTs – – – – – –
6 Total 5 478
Counterparty credit risk RWA in table OV1 on page 71 of R7.2 billion (including CCR, CVA and CCPs), represent 2.3% of the total bank RWA as at 31 March 2017.
CEM-CCR is the regulator-prescribed method for calculating the counterparties exposure for derivative instruments. It works by taking the net replacement cost of all derivatives (as per signed netting agreements), adding a potential future exposure (PFE) component (based on the notional and underlying type referred to as Anet where netting exists and Agross where no netting exists) and then subtracting any eligible collateral.
Counterparty credit risk exposures reported above include OTC derivative exposures and exclude CVA charges or exposures cleared through a CCP.
Replacement cost in column (a) is reported as the net replacement cost where ISDA agreements exist.
SA-CCR will replace the CEM-CCR methodology to calculate capital requirements for OTC of which implementation date is subject to the regulator and industry consultation.
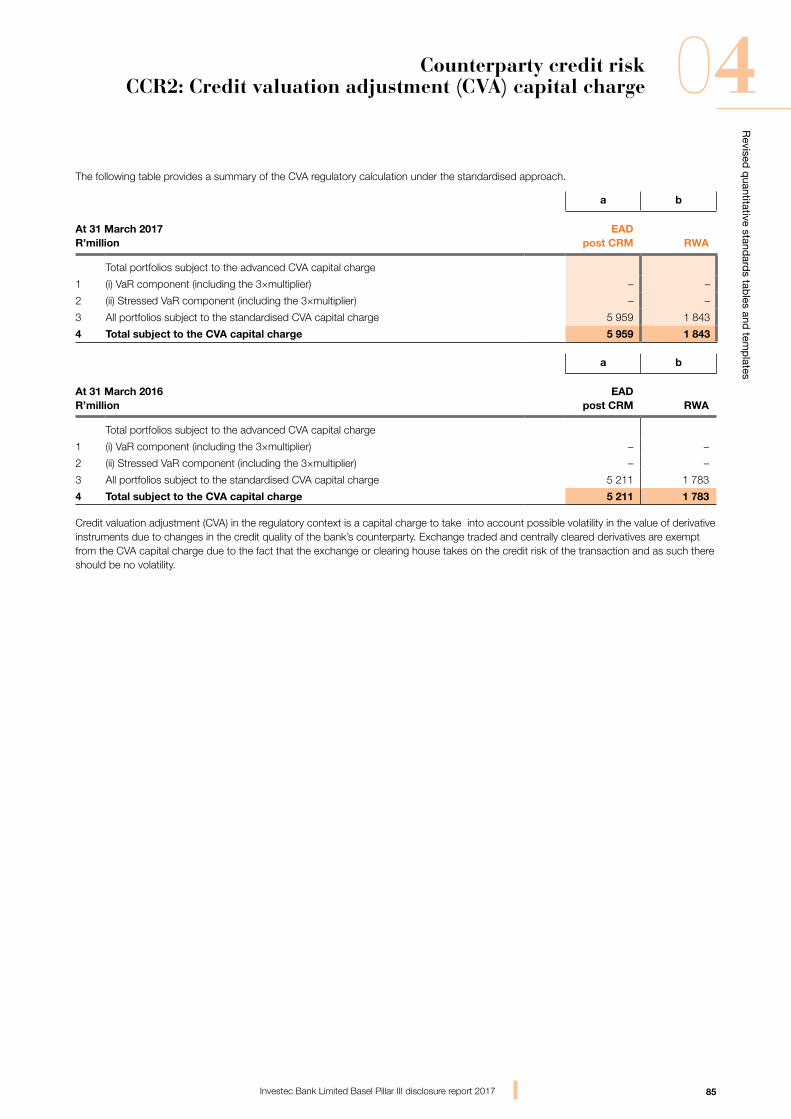
85
Revised
quantitative stand
ards tab
les and tem
plates
04
Investec Bank Limited Basel Pillar III disclosure report 2017
Counterparty credit riskCCR2: Credit valuation adjustment (CVA) capital charge
The following table provides a summary of the CVA regulatory calculation under the standardised approach.
a b
At 31 March 2017R’million
EADpost CRM RWA
Total portfolios subject to the advanced CVA capital charge
1 (i) VaR component (including the 3×multiplier) – –
2 (ii) Stressed VaR component (including the 3×multiplier) – –
3 All portfolios subject to the standardised CVA capital charge 5 959 1 843
4 Total subject to the CVA capital charge 5 959 1 843
a b
At 31 March 2016R’million
EADpost CRM RWA
Total portfolios subject to the advanced CVA capital charge
1 (i) VaR component (including the 3×multiplier) – –
2 (ii) Stressed VaR component (including the 3×multiplier) – –
3 All portfolios subject to the standardised CVA capital charge 5 211 1 783
4 Total subject to the CVA capital charge 5 211 1 783
Credit valuation adjustment (CVA) in the regulatory context is a capital charge to take into account possible volatility in the value of derivative instruments due to changes in the credit quality of the bank’s counterparty. Exchange traded and centrally cleared derivatives are exempt from the CVA capital charge due to the fact that the exchange or clearing house takes on the credit risk of the transaction and as such there should be no volatility.
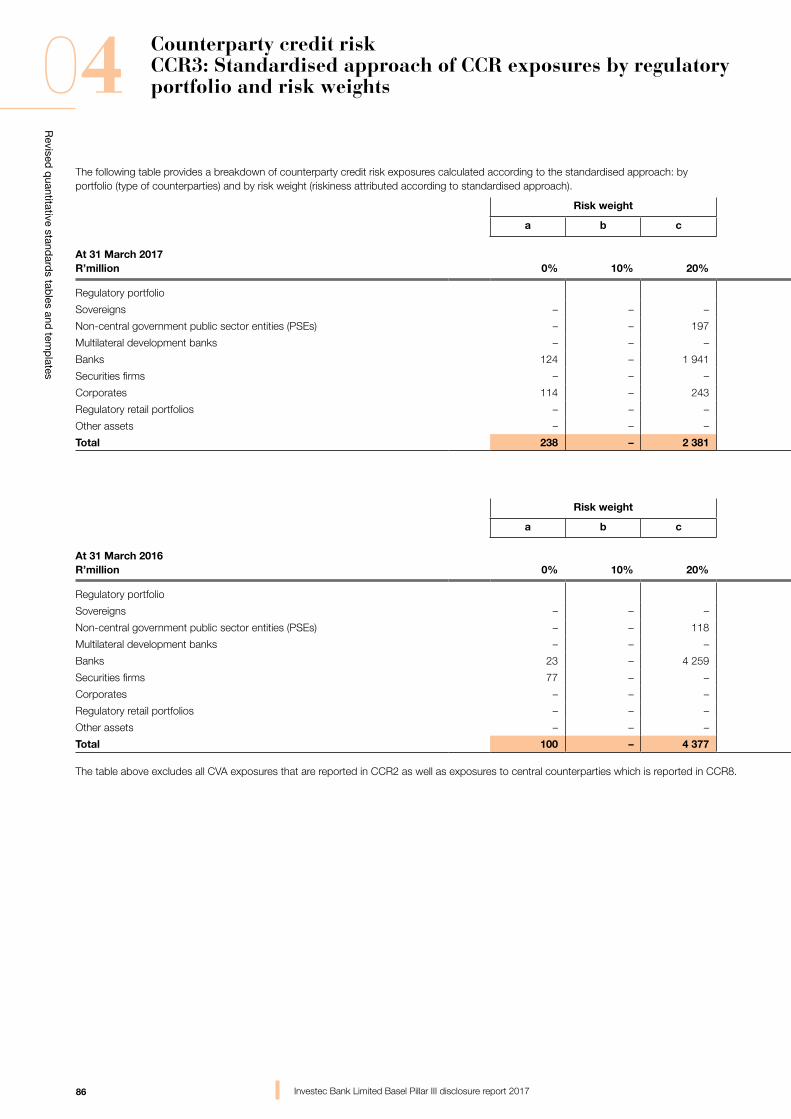
86
Revised
quantitative stand
ards tab
les and tem
plates
04
Investec Bank Limited Basel Pillar III disclosure report 2017
Counterparty credit riskCCR3: Standardised approach of CCR exposures by regulatory portfolio and risk weights
The following table provides a breakdown of counterparty credit risk exposures calculated according to the standardised approach: by portfolio (type of counterparties) and by risk weight (riskiness attributed according to standardised approach).
Risk weight Risk weight
a b c d e f g h i
At 31 March 2017R’million 0% 10% 20% 50% 75% 100% 150% Others
Total creditexposure
Regulatory portfolio
Sovereigns – – – 40 – – – – 40
Non-central government public sector entities (PSEs) – – 197 57 – – – – 254
Multilateral development banks – – – – – – – – –
Banks 124 – 1 941 2 047 – – – – 4 112
Securities firms – – – – – – – – –
Corporates 114 – 243 144 – 3 705 – – 4 206
Regulatory retail portfolios – – – – 4 – – – 4
Other assets – – – – – – – – –
Total 238 – 2 381 2 288 4 3 705 – – 8 616
Risk weight Risk weight
a b c d e f g h i
At 31 March 2016R’million 0% 10% 20% 50% 75% 100% 150% Others
Total creditexposure
Regulatory portfolio
Sovereigns – – – – – – – – –
Non-central government public sector entities (PSEs) – – 118 – – – – – 118
Multilateral development banks – – – – – – – –
Banks 23 – 4 259 1 727 – – – – 6 009
Securities firms 77 – – 9 – – – – 86
Corporates – – – 25 – 3 722 – – 3 747
Regulatory retail portfolios – – – – – – – – –
Other assets – – – – – – – – –
Total 100 – 4 377 1 761 – 3 722 – – 9 960
The table above excludes all CVA exposures that are reported in CCR2 as well as exposures to central counterparties which is reported in CCR8.
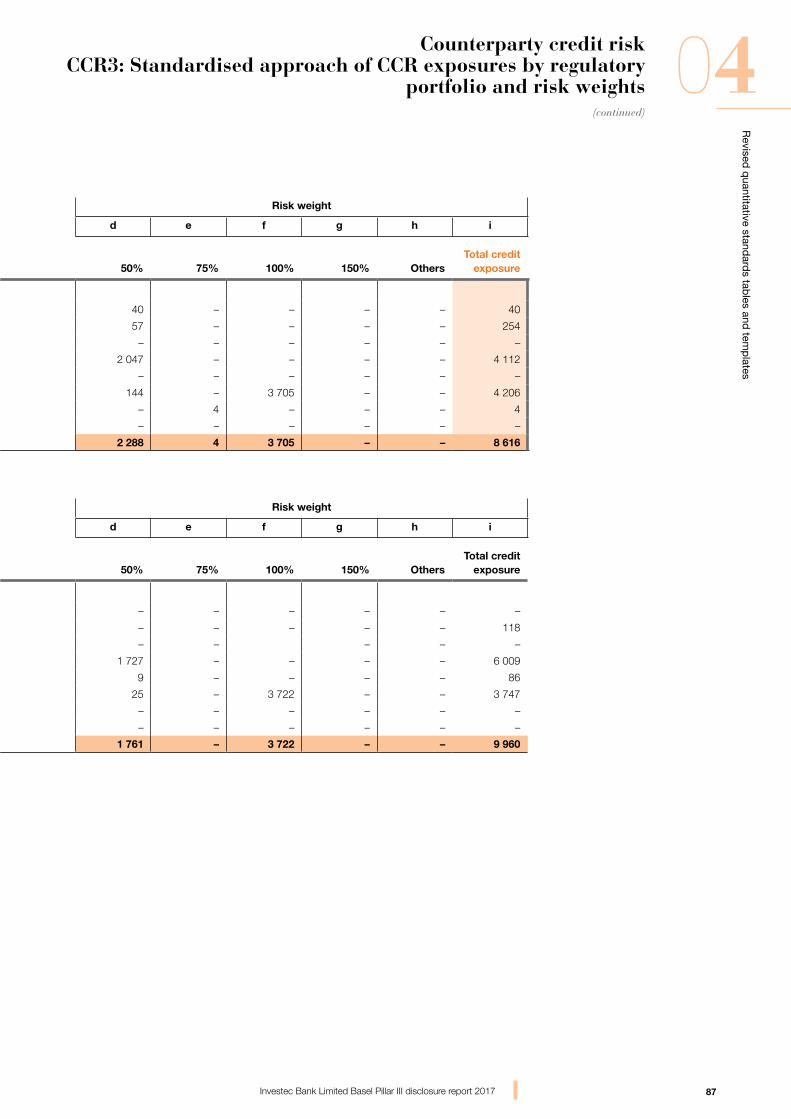
87
Revised
quantitative stand
ards tab
les and tem
plates
04
Investec Bank Limited Basel Pillar III disclosure report 2017
Counterparty credit riskCCR3: Standardised approach of CCR exposures by regulatory
portfolio and risk weights
The following table provides a breakdown of counterparty credit risk exposures calculated according to the standardised approach: by portfolio (type of counterparties) and by risk weight (riskiness attributed according to standardised approach).
Risk weight Risk weight
a b c d e f g h i
At 31 March 2017R’million 0% 10% 20% 50% 75% 100% 150% Others
Total creditexposure
Regulatory portfolio
Sovereigns – – – 40 – – – – 40
Non-central government public sector entities (PSEs) – – 197 57 – – – – 254
Multilateral development banks – – – – – – – – –
Banks 124 – 1 941 2 047 – – – – 4 112
Securities firms – – – – – – – – –
Corporates 114 – 243 144 – 3 705 – – 4 206
Regulatory retail portfolios – – – – 4 – – – 4
Other assets – – – – – – – – –
Total 238 – 2 381 2 288 4 3 705 – – 8 616
Risk weight Risk weight
a b c d e f g h i
At 31 March 2016R’million 0% 10% 20% 50% 75% 100% 150% Others
Total creditexposure
Regulatory portfolio
Sovereigns – – – – – – – – –
Non-central government public sector entities (PSEs) – – 118 – – – – – 118
Multilateral development banks – – – – – – – –
Banks 23 – 4 259 1 727 – – – – 6 009
Securities firms 77 – – 9 – – – – 86
Corporates – – – 25 – 3 722 – – 3 747
Regulatory retail portfolios – – – – – – – – –
Other assets – – – – – – – – –
Total 100 – 4 377 1 761 – 3 722 – – 9 960
The table above excludes all CVA exposures that are reported in CCR2 as well as exposures to central counterparties which is reported in CCR8.
(continued)
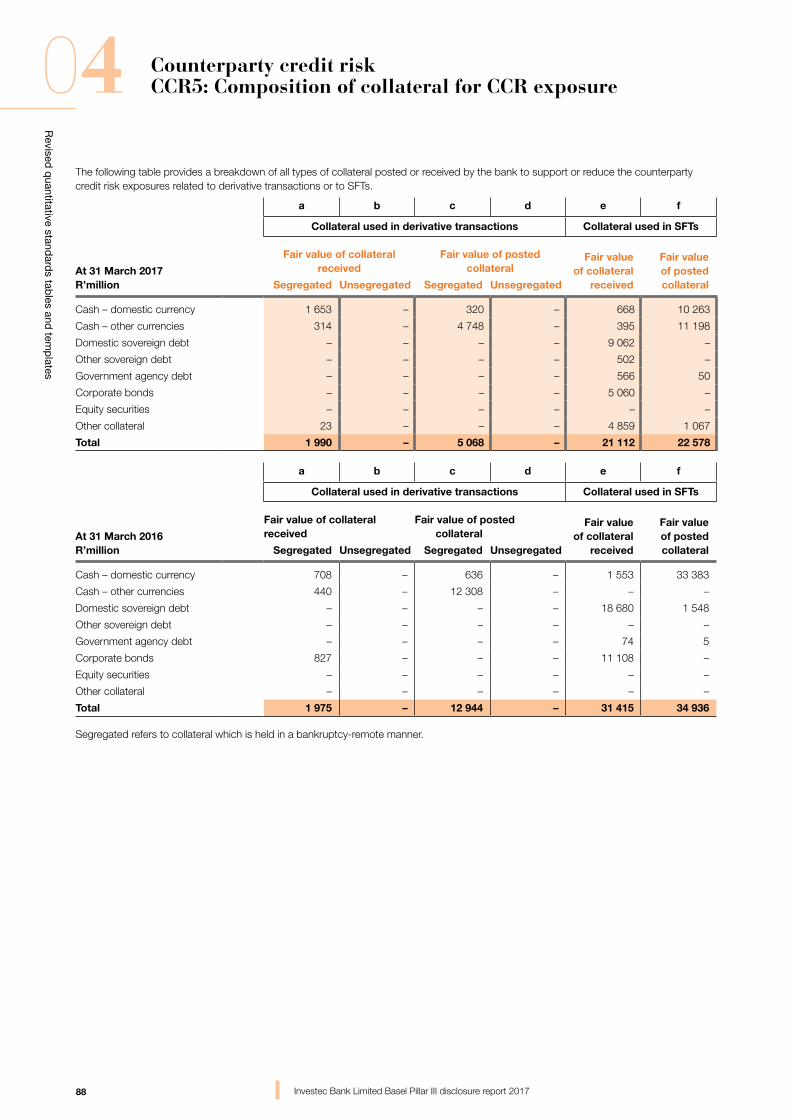
88
Revised
quantitative stand
ards tab
les and tem
plates
04
Investec Bank Limited Basel Pillar III disclosure report 2017
Counterparty credit riskCCR5: Composition of collateral for CCR exposure
The following table provides a breakdown of all types of collateral posted or received by the bank to support or reduce the counterparty credit risk exposures related to derivative transactions or to SFTs.
a b c d e f
Collateral used in derivative transactions Collateral used in SFTs
At 31 March 2017R’million
Fair value of collateral received
Fair value of postedcollateral
Fair valueof collateral
received
Fair valueof postedcollateralSegregated Unsegregated Segregated Unsegregated
Cash – domestic currency 1 653 – 320 – 668 10 263
Cash – other currencies 314 – 4 748 – 395 11 198
Domestic sovereign debt – – – – 9 062 –
Other sovereign debt – – – – 502 –
Government agency debt – – – – 566 50
Corporate bonds – – – – 5 060 –
Equity securities – – – – – –
Other collateral 23 – – – 4 859 1 067
Total 1 990 – 5 068 – 21 112 22 578
a b c d e f
Collateral used in derivative transactions Collateral used in SFTs
At 31 March 2016R’million
Fair value of collateral received
Fair value of postedcollateral
Fair valueof collateral
received
Fair valueof postedcollateralSegregated Unsegregated Segregated Unsegregated
Cash – domestic currency 708 – 636 – 1 553 33 383
Cash – other currencies 440 – 12 308 – – –
Domestic sovereign debt – – – – 18 680 1 548
Other sovereign debt – – – – – –
Government agency debt – – – – 74 5
Corporate bonds 827 – – – 11 108 –
Equity securities – – – – – –
Other collateral – – – – – –
Total 1 975 – 12 944 – 31 415 34 936
Segregated refers to collateral which is held in a bankruptcy-remote manner.
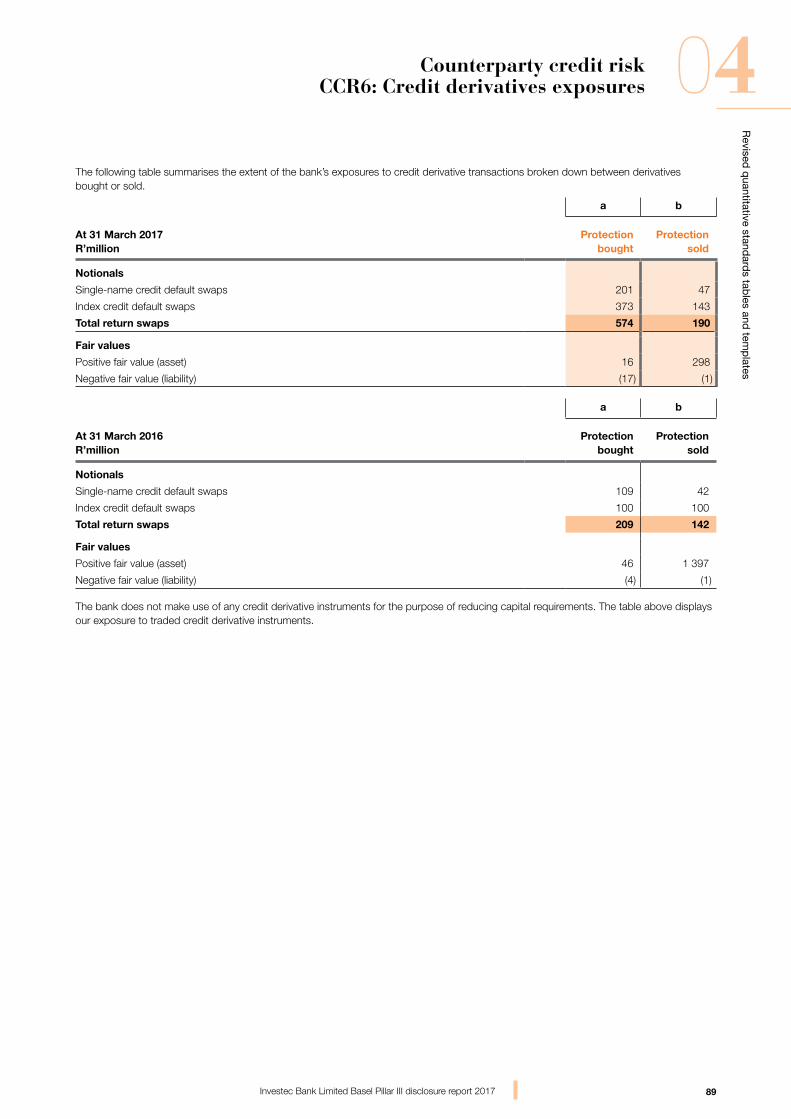
89
Revised
quantitative stand
ards tab
les and tem
plates
04
Investec Bank Limited Basel Pillar III disclosure report 2017
Counterparty credit riskCCR6: Credit derivatives exposures
The following table summarises the extent of the bank’s exposures to credit derivative transactions broken down between derivatives bought or sold.
a b
At 31 March 2017R’million
Protectionbought
Protectionsold
Notionals
Single-name credit default swaps 201 47
Index credit default swaps 373 143
Total return swaps 574 190
Fair values
Positive fair value (asset) 16 298
Negative fair value (liability) (17) (1)
a b
At 31 March 2016R’million
Protectionbought
Protectionsold
Notionals
Single-name credit default swaps 109 42
Index credit default swaps 100 100
Total return swaps 209 142
Fair values
Positive fair value (asset) 46 1 397
Negative fair value (liability) (4) (1)
The bank does not make use of any credit derivative instruments for the purpose of reducing capital requirements. The table above displays our exposure to traded credit derivative instruments.
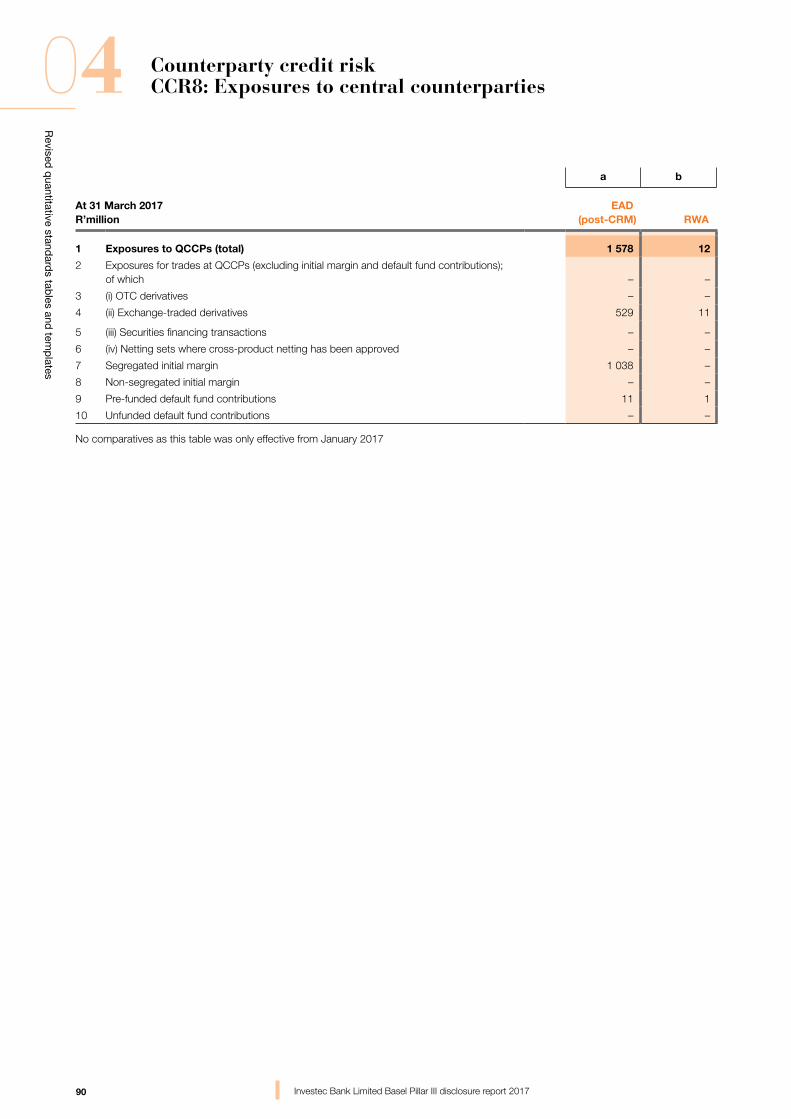
90
Revised
quantitative stand
ards tab
les and tem
plates
04
Investec Bank Limited Basel Pillar III disclosure report 2017
Counterparty credit riskCCR8: Exposures to central counterparties
a b
At 31 March 2017R’million
EAD (post-CRM) RWA
1 Exposures to QCCPs (total) 1 578 12
2 Exposures for trades at QCCPs (excluding initial margin and default fund contributions); of which – –
3 (i) OTC derivatives – –
4 (ii) Exchange-traded derivatives 529 11
5 (iii) Securities financing transactions – –
6 (iv) Netting sets where cross-product netting has been approved – –
7 Segregated initial margin 1 038 –
8 Non-segregated initial margin – –
9 Pre-funded default fund contributions 11 1
10 Unfunded default fund contributions – –
No comparatives as this table was only effective from January 2017

91
Revised
quantitative stand
ards tab
les and tem
plates
04
Investec Bank Limited Basel Pillar III disclosure report 2017
Intentionally left blank
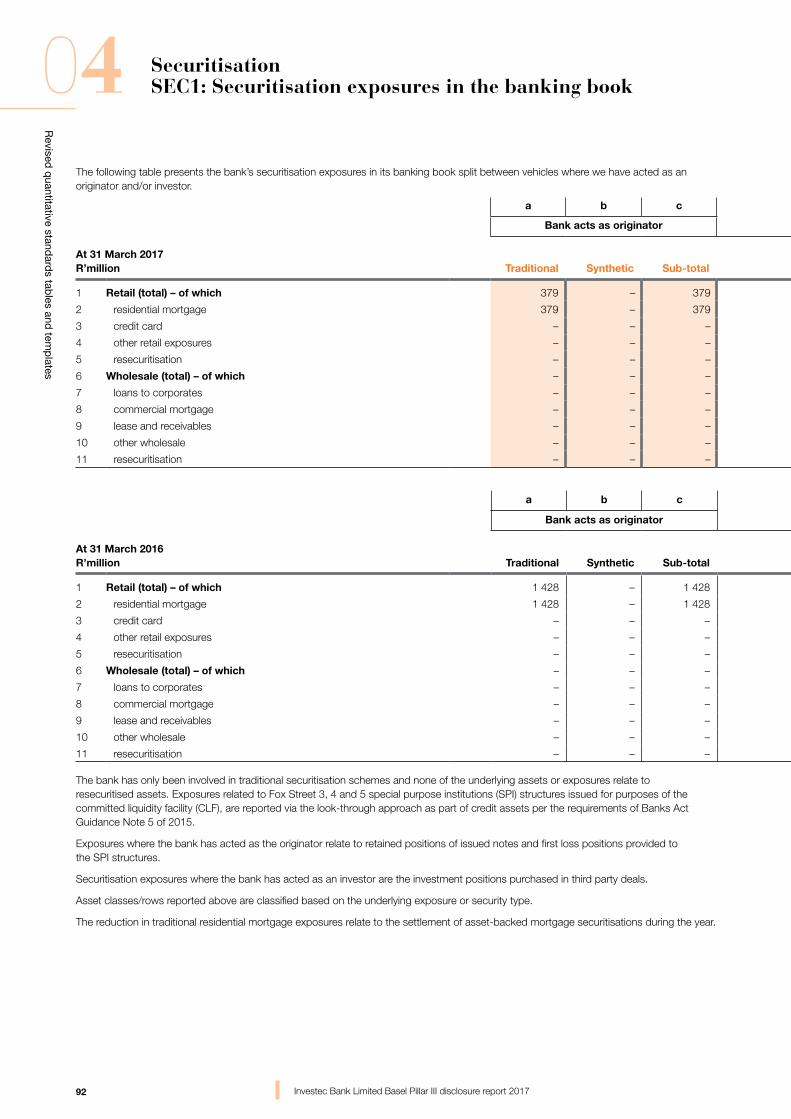
92
Revised
quantitative stand
ards tab
les and tem
plates
04
Investec Bank Limited Basel Pillar III disclosure report 2017
SecuritisationSEC1: Securitisation exposures in the banking book
The following table presents the bank’s securitisation exposures in its banking book split between vehicles where we have acted as an originator and/or investor.
a b c e f g i j k
Bank acts as originator Bank acts as sponsor Bank acts as investor
At 31 March 2017R’million Traditional Synthetic Sub-total Traditional Synthetic Sub-total Traditional Synthetic Sub-total
1 Retail (total) – of which 379 – 379 – – – 2 472 – 2 472
2 residential mortgage 379 – 379 – – – 2 472 – 2 472
3 credit card – – – – – – – – –
4 other retail exposures – – – – – – – – –
5 resecuritisation – – – – – – – – –
6 Wholesale (total) – of which – – – – – – 25 – 25
7 loans to corporates – – – – – – 25 – 25
8 commercial mortgage – – – – – – – - –
9 lease and receivables – – – – – – – – –
10 other wholesale – – – – - – – – –
11 resecuritisation – – – – – – – - –
a b c e f g i j k
Bank acts as originator Bank acts as sponsor Bank acts as investor
At 31 March 2016R’million Traditional Synthetic Sub-total Traditional Synthetic Sub-total Traditional Synthetic Sub-total
1 Retail (total) – of which 1 428 – 1 428 – – – 2 576 – 2 576
2 residential mortgage 1 428 – 1 428 – – – 2 576 – 2 576
3 credit card – – – – – – – – –
4 other retail exposures – – – – – – – – –
5 resecuritisation – – – – – – – – –
6 Wholesale (total) – of which – – – – – – 1 187 – 1 187
7 loans to corporates – – – – – – 1 187 – 1 187
8 commercial mortgage – – – – – – – – –
9 lease and receivables – – – – – – – – –
10 other wholesale – – – – – – – – –
11 resecuritisation – – – – – – – – –
The bank has only been involved in traditional securitisation schemes and none of the underlying assets or exposures relate to resecuritised assets. Exposures related to Fox Street 3, 4 and 5 special purpose institutions (SPI) structures issued for purposes of the committed liquidity facility (CLF), are reported via the look-through approach as part of credit assets per the requirements of Banks Act Guidance Note 5 of 2015.
Exposures where the bank has acted as the originator relate to retained positions of issued notes and first loss positions provided to the SPI structures.
Securitisation exposures where the bank has acted as an investor are the investment positions purchased in third party deals.
Asset classes/rows reported above are classified based on the underlying exposure or security type.
The reduction in traditional residential mortgage exposures relate to the settlement of asset-backed mortgage securitisations during the year.
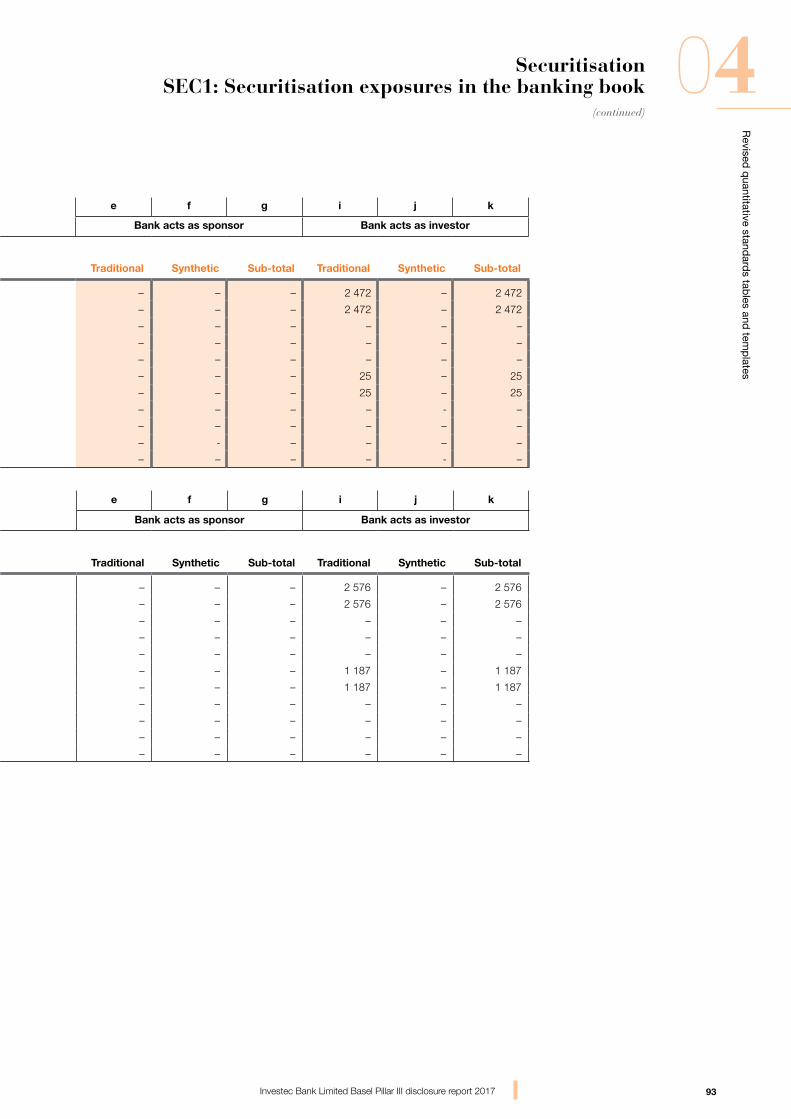
93
Revised
quantitative stand
ards tab
les and tem
plates
04(continued)
Investec Bank Limited Basel Pillar III disclosure report 2017
SecuritisationSEC1: Securitisation exposures in the banking book
The following table presents the bank’s securitisation exposures in its banking book split between vehicles where we have acted as an originator and/or investor.
a b c e f g i j k
Bank acts as originator Bank acts as sponsor Bank acts as investor
At 31 March 2017R’million Traditional Synthetic Sub-total Traditional Synthetic Sub-total Traditional Synthetic Sub-total
1 Retail (total) – of which 379 – 379 – – – 2 472 – 2 472
2 residential mortgage 379 – 379 – – – 2 472 – 2 472
3 credit card – – – – – – – – –
4 other retail exposures – – – – – – – – –
5 resecuritisation – – – – – – – – –
6 Wholesale (total) – of which – – – – – – 25 – 25
7 loans to corporates – – – – – – 25 – 25
8 commercial mortgage – – – – – – – - –
9 lease and receivables – – – – – – – – –
10 other wholesale – – – – - – – – –
11 resecuritisation – – – – – – – - –
a b c e f g i j k
Bank acts as originator Bank acts as sponsor Bank acts as investor
At 31 March 2016R’million Traditional Synthetic Sub-total Traditional Synthetic Sub-total Traditional Synthetic Sub-total
1 Retail (total) – of which 1 428 – 1 428 – – – 2 576 – 2 576
2 residential mortgage 1 428 – 1 428 – – – 2 576 – 2 576
3 credit card – – – – – – – – –
4 other retail exposures – – – – – – – – –
5 resecuritisation – – – – – – – – –
6 Wholesale (total) – of which – – – – – – 1 187 – 1 187
7 loans to corporates – – – – – – 1 187 – 1 187
8 commercial mortgage – – – – – – – – –
9 lease and receivables – – – – – – – – –
10 other wholesale – – – – – – – – –
11 resecuritisation – – – – – – – – –
The bank has only been involved in traditional securitisation schemes and none of the underlying assets or exposures relate to resecuritised assets. Exposures related to Fox Street 3, 4 and 5 special purpose institutions (SPI) structures issued for purposes of the committed liquidity facility (CLF), are reported via the look-through approach as part of credit assets per the requirements of Banks Act Guidance Note 5 of 2015.
Exposures where the bank has acted as the originator relate to retained positions of issued notes and first loss positions provided to the SPI structures.
Securitisation exposures where the bank has acted as an investor are the investment positions purchased in third party deals.
Asset classes/rows reported above are classified based on the underlying exposure or security type.
The reduction in traditional residential mortgage exposures relate to the settlement of asset-backed mortgage securitisations during the year.
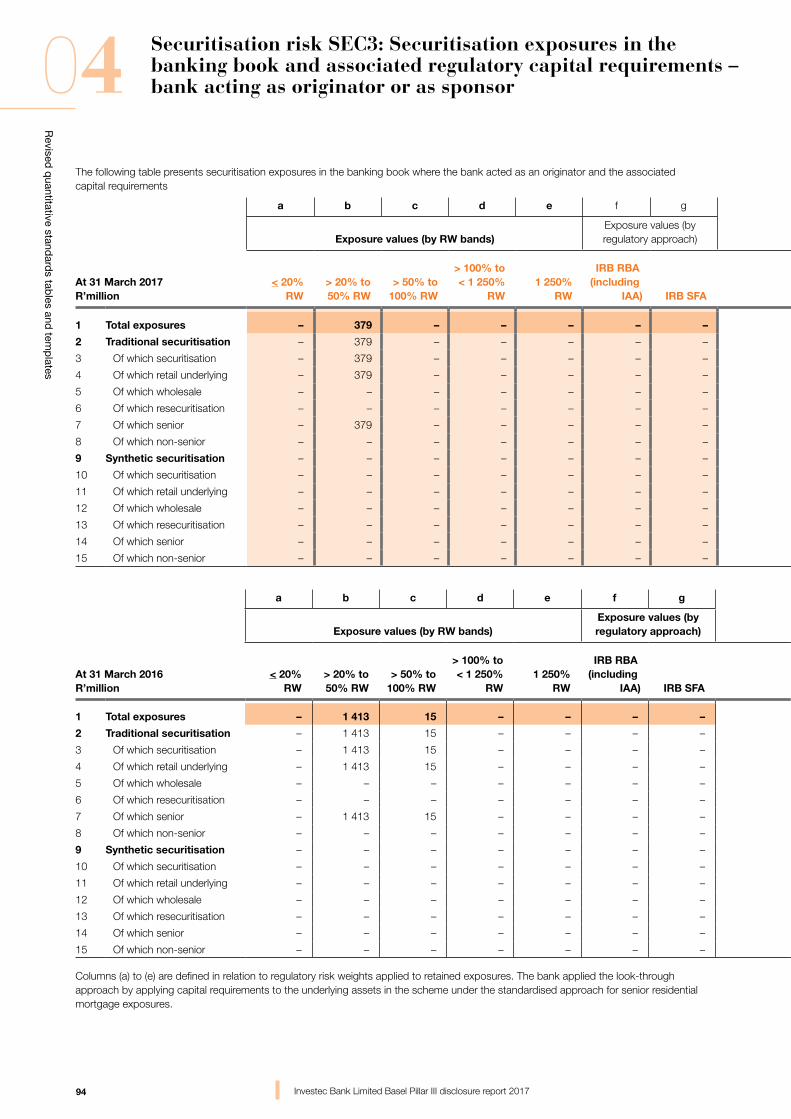
94
Revised
quantitative stand
ards tab
les and tem
plates
04
Investec Bank Limited Basel Pillar III disclosure report 2017
Securitisation risk SEC3: Securitisation exposures in the banking book and associated regulatory capital requirements – bank acting as originator or as sponsor
The following table presents securitisation exposures in the banking book where the bank acted as an originator and the associated capital requirements
a b c d e f g h i j k l m n o p q
Exposure values (by RW bands)Exposure values (by regulatory approach)
Exposure values (by regulatory approach) RWA (by regulatory approach) Capital charge after cap
At 31 March 2017R’million
< 20%RW
> 20% to50% RW
> 50% to100% RW
> 100% to< 1 250%
RW1 250%
RW
IRB RBA(including
IAA) IRB SFA SA/SSFA 1 250%
IRB RBA(including
IAA) IRB SFA SA/SSFA 1 250%
IRB RBA(including
IAA) IRB SFA SA/SSFA 1 250%
1 Total exposures – 379 – – – – – 379 – – – 444 – – – 48 –
2 Traditional securitisation – 379 – – – – – 379 – – – 444 – – – 48 –
3 Of which securitisation – 379 – – – – – 379 – – – 444 – – – 48 –
4 Of which retail underlying – 379 – – – – – 379 – – – 444 – – – 48 –
5 Of which wholesale – – – – – – – – – – – – – – – – –
6 Of which resecuritisation – – – – – – – – – – – – – – – – –
7 Of which senior – 379 – – – – – 379 – – – 444 – – – 48 –
8 Of which non-senior – – – – – – – – – – – – – – – – –
9 Synthetic securitisation – – – – – – – – – – – – – – – – –
10 Of which securitisation – – – – – – – – – – – – – – – – –
11 Of which retail underlying – – – – – – – – – – – – - – – – –
12 Of which wholesale – – – – – – – – – – – – – – – – –
13 Of which resecuritisation – – – – – – – – – – – – – – – – –
14 Of which senior – – – – – – – – – – – – – – – – –
15 Of which non-senior – – – – – – – - – – - – – – – – –
a b c d e f g h i j k l m n o p q
Exposure values (by RW bands)Exposure values (by regulatory approach)
Exposure values (by regulatory approach) RWA (by regulatory approach) Capital charge after cap
At 31 March 2016R’million
< 20%RW
> 20% to50% RW
> 50% to100% RW
> 100% to< 1 250%
RW1 250%
RW
IRB RBA(including
IAA) IRB SFA SA/SSFA 1 250%
IRB RBA(including
IAA) IRB SFA SA/SSFA 1 250%
IRB RBA(including
IAA) IRB SFA SA/SSFA 1 250%
1 Total exposures – 1 413 15 – – – – 1 428 – – – 621 – – – 64 –
2 Traditional securitisation – 1 413 15 – – – – 1 428 – – – 621 – – – 64 –
3 Of which securitisation – 1 413 15 – – – – 1 428 – – – 621 – – – 64 –
4 Of which retail underlying – 1 413 15 – – – – 1 428 – – – 621 – – – 64 –
5 Of which wholesale – – – – – – – – – – – – – – – – –
6 Of which resecuritisation – – – – – – – – – – – – – – – – –
7 Of which senior – 1 413 15 – – – – 1 428 – – – 621 – – – 64 –
8 Of which non-senior – – – – – – – – – – – – – – – – –
9 Synthetic securitisation – – – – – – – – – – – – – – – – –
10 Of which securitisation – – – – – – – – – – – – – – – – –
11 Of which retail underlying – – – – – – – – – – – – – – – – –
12 Of which wholesale – – – – – – – – – – – – – – – – –
13 Of which resecuritisation – – – – – – – – – – – – – – – – –
14 Of which senior – – – – – – – – – – – – – – – – –
15 Of which non-senior – – – – – – – – – – – – – – – – –
Columns (a) to (e) are defined in relation to regulatory risk weights applied to retained exposures. The bank applied the look-through approach by applying capital requirements to the underlying assets in the scheme under the standardised approach for senior residential mortgage exposures.
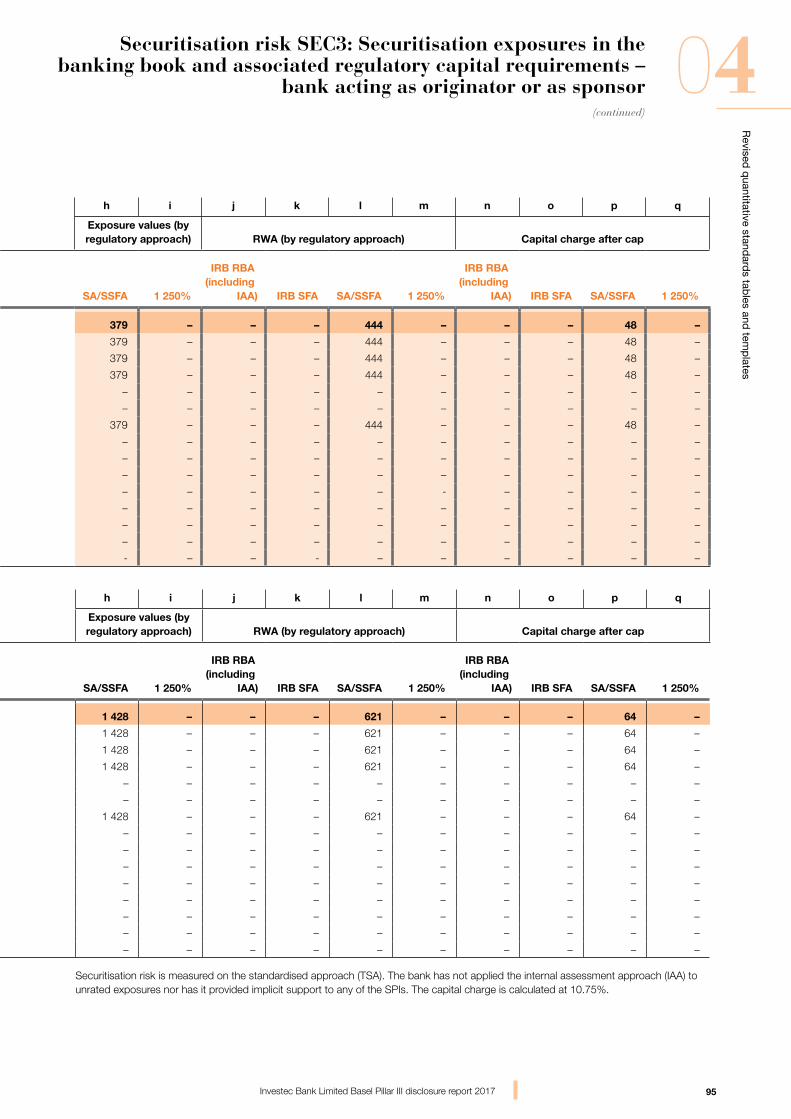
95
Revised
quantitative stand
ards tab
les and tem
plates
04
Investec Bank Limited Basel Pillar III disclosure report 2017
Securitisation risk SEC3: Securitisation exposures in the banking book and associated regulatory capital requirements –
bank acting as originator or as sponsor
The following table presents securitisation exposures in the banking book where the bank acted as an originator and the associated capital requirements
a b c d e f g h i j k l m n o p q
Exposure values (by RW bands)Exposure values (by regulatory approach)
Exposure values (by regulatory approach) RWA (by regulatory approach) Capital charge after cap
At 31 March 2017R’million
< 20%RW
> 20% to50% RW
> 50% to100% RW
> 100% to< 1 250%
RW1 250%
RW
IRB RBA(including
IAA) IRB SFA SA/SSFA 1 250%
IRB RBA(including
IAA) IRB SFA SA/SSFA 1 250%
IRB RBA(including
IAA) IRB SFA SA/SSFA 1 250%
1 Total exposures – 379 – – – – – 379 – – – 444 – – – 48 –
2 Traditional securitisation – 379 – – – – – 379 – – – 444 – – – 48 –
3 Of which securitisation – 379 – – – – – 379 – – – 444 – – – 48 –
4 Of which retail underlying – 379 – – – – – 379 – – – 444 – – – 48 –
5 Of which wholesale – – – – – – – – – – – – – – – – –
6 Of which resecuritisation – – – – – – – – – – – – – – – – –
7 Of which senior – 379 – – – – – 379 – – – 444 – – – 48 –
8 Of which non-senior – – – – – – – – – – – – – – – – –
9 Synthetic securitisation – – – – – – – – – – – – – – – – –
10 Of which securitisation – – – – – – – – – – – – – – – – –
11 Of which retail underlying – – – – – – – – – – – – - – – – –
12 Of which wholesale – – – – – – – – – – – – – – – – –
13 Of which resecuritisation – – – – – – – – – – – – – – – – –
14 Of which senior – – – – – – – – – – – – – – – – –
15 Of which non-senior – – – – – – – - – – - – – – – – –
a b c d e f g h i j k l m n o p q
Exposure values (by RW bands)Exposure values (by regulatory approach)
Exposure values (by regulatory approach) RWA (by regulatory approach) Capital charge after cap
At 31 March 2016R’million
< 20%RW
> 20% to50% RW
> 50% to100% RW
> 100% to< 1 250%
RW1 250%
RW
IRB RBA(including
IAA) IRB SFA SA/SSFA 1 250%
IRB RBA(including
IAA) IRB SFA SA/SSFA 1 250%
IRB RBA(including
IAA) IRB SFA SA/SSFA 1 250%
1 Total exposures – 1 413 15 – – – – 1 428 – – – 621 – – – 64 –
2 Traditional securitisation – 1 413 15 – – – – 1 428 – – – 621 – – – 64 –
3 Of which securitisation – 1 413 15 – – – – 1 428 – – – 621 – – – 64 –
4 Of which retail underlying – 1 413 15 – – – – 1 428 – – – 621 – – – 64 –
5 Of which wholesale – – – – – – – – – – – – – – – – –
6 Of which resecuritisation – – – – – – – – – – – – – – – – –
7 Of which senior – 1 413 15 – – – – 1 428 – – – 621 – – – 64 –
8 Of which non-senior – – – – – – – – – – – – – – – – –
9 Synthetic securitisation – – – – – – – – – – – – – – – – –
10 Of which securitisation – – – – – – – – – – – – – – – – –
11 Of which retail underlying – – – – – – – – – – – – – – – – –
12 Of which wholesale – – – – – – – – – – – – – – – – –
13 Of which resecuritisation – – – – – – – – – – – – – – – – –
14 Of which senior – – – – – – – – – – – – – – – – –
15 Of which non-senior – – – – – – – – – – – – – – – – –
Columns (a) to (e) are defined in relation to regulatory risk weights applied to retained exposures. The bank applied the look-through approach by applying capital requirements to the underlying assets in the scheme under the standardised approach for senior residential mortgage exposures.
Securitisation risk is measured on the standardised approach (TSA). The bank has not applied the internal assessment approach (IAA) to unrated exposures nor has it provided implicit support to any of the SPIs. The capital charge is calculated at 10.75%.
(continued)
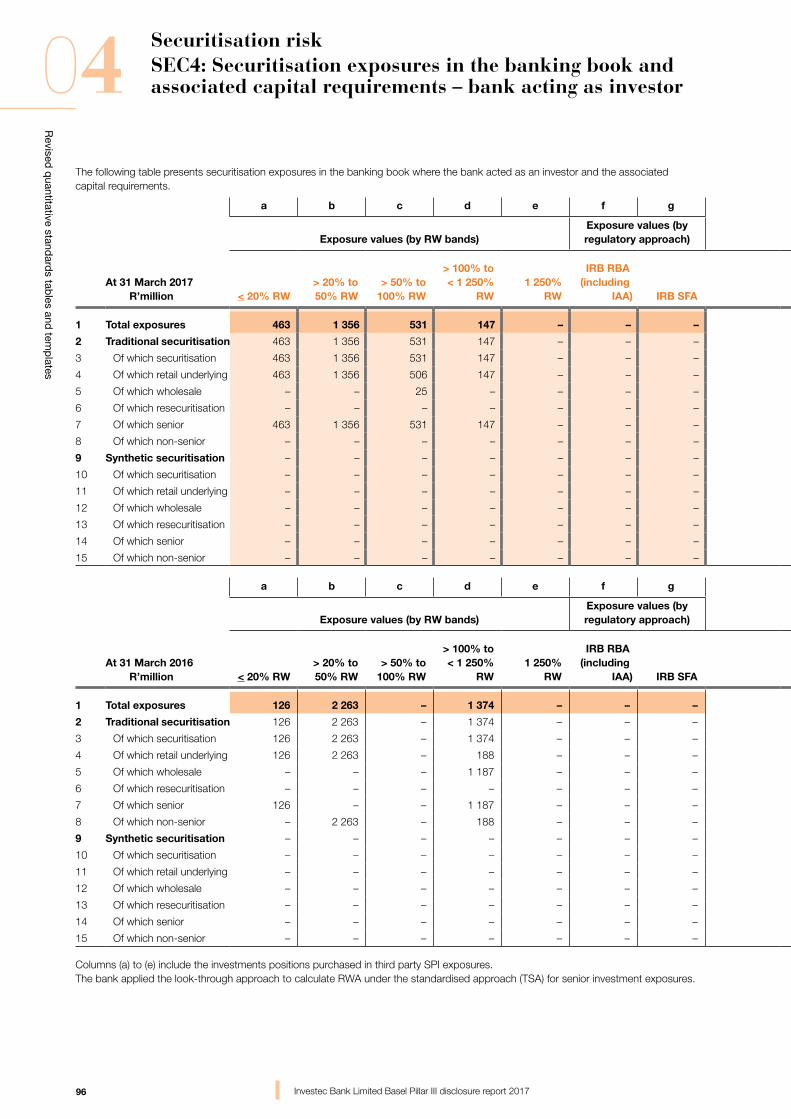
96
Revised
quantitative stand
ards tab
les and tem
plates
04
Investec Bank Limited Basel Pillar III disclosure report 2017
Securitisation riskSEC4: Securitisation exposures in the banking book and associated capital requirements – bank acting as investor
The following table presents securitisation exposures in the banking book where the bank acted as an investor and the associated capital requirements.
a b c d e f g h i j k l m n o p q
At 31 March 2017R’million
Exposure values (by RW bands)Exposure values (by regulatory approach)
Exposure values (by regulatory approach) RWA (by regulatory approach) Capital charge after cap
< 20% RW> 20% to50% RW
> 50% to100% RW
> 100% to< 1 250%
RW1 250%
RW
IRB RBA(including
IAA) IRB SFA SA/SSFA 1 250%
IRB RBA(including
IAA) IRB SFA SA/SSFA 1 250%
IRB RBA(including
IAA) IRB SFA SA/SSFA 1 250%
1 Total exposures 463 1 356 531 147 – – – 2 497 – – – 1 675 – – – 180 –
2 Traditional securitisation 463 1 356 531 147 – – – 2 497 – – – 1 675 – – – 180 –
3 Of which securitisation 463 1 356 531 147 – – – 2 497 – – – 1 675 – – – 180 –
4 Of which retail underlying 463 1 356 506 147 – – – 2 472 – – – 1 650 – – – 177 –
5 Of which wholesale – – 25 – – – – 25 – – – 25 – – – 3 –
6 Of which resecuritisation – – – – – – – – – – – – – – – – –
7 Of which senior 463 1 356 531 147 – – – 2 497 – – – – – – – – –
8 Of which non-senior – – – – – – – – – – – – – – – – –
9 Synthetic securitisation – – – – – – – – – – – – – – – – –
10 Of which securitisation – – – – – – – – – – – – – – – – –
11 Of which retail underlying – – – – – – – – – – – – – – – – –
12 Of which wholesale – – – – – – – – – – – – – – – – –
13 Of which resecuritisation – – – – – – – – – – – – – – – – –
14 Of which senior – – – – – – – – – – – – – – – – –
15 Of which non-senior – – – – – – – – – –– – – – – – – –
a b c d e f g h i j k l m n o p q
At 31 March 2016R’million
Exposure values (by RW bands)Exposure values (by regulatory approach)
Exposure values (by regulatory approach) RWA (by regulatory approach) Capital charge after cap
< 20% RW> 20% to50% RW
> 50% to100% RW
> 100% to< 1 250%
RW1 250%
RW
IRB RBA(including
IAA) IRB SFA SA/SSFA 1 250%
IRB RBA(including
IAA) IRB SFA SA/SSFA 1 250%
IRB RBA(including
IAA) IRB SFA SA/SSFA 1 250%
1 Total exposures 126 2 263 – 1 374 – – – 3 763 – – – 3 273 – – – 340 –
2 Traditional securitisation 126 2 263 – 1 374 – – – 3 763 – – – 3 273 – – – 340 –
3 Of which securitisation 126 2 263 – 1 374 – – – 3 763 – – – 3 273 – – – 340 –
4 Of which retail underlying 126 2 263 – 188 – – – 2 576 – – – 1 813 – – – 188 –
5 Of which wholesale – – – 1 187 – – – 1 187 – – – 1 459 – – – 151 –
6 Of which resecuritisation – – – – – – – – – – – – – – – – –
7 Of which senior 126 – – 1 187 – – – 1 312 – – – 1 485 – – – 154 –
8 Of which non-senior – 2 263 – 188 – – – 2 451 – – – 1 788 – – – 186 –
9 Synthetic securitisation – – – – – – – – – – – – – – – – –
10 Of which securitisation – – – – – – – – – – – – – – – – –
11 Of which retail underlying – – – – – – – – – – – – – – – – –
12 Of which wholesale – – – – – – – – – – – – – – – – –
13 Of which resecuritisation – – – – – – – – – – – – – – – – –
14 Of which senior – – – – – – – – – – – – – – – – –
15 Of which non-senior – – – – – – – – – – – – – – – – –
Columns (a) to (e) include the investments positions purchased in third party SPI exposures. The bank applied the look-through approach to calculate RWA under the standardised approach (TSA) for senior investment exposures.
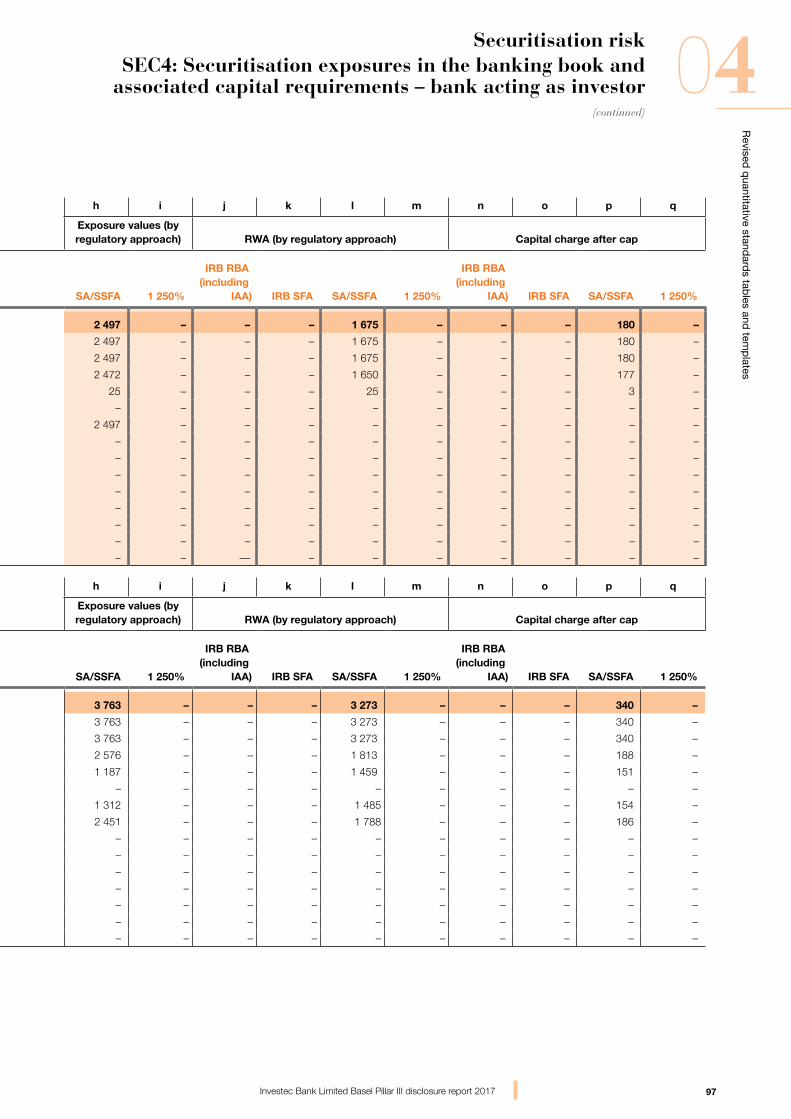
97
Revised
quantitative stand
ards tab
les and tem
plates
04
Investec Bank Limited Basel Pillar III disclosure report 2017
Securitisation riskSEC4: Securitisation exposures in the banking book and
associated capital requirements – bank acting as investor
The following table presents securitisation exposures in the banking book where the bank acted as an investor and the associated capital requirements.
a b c d e f g h i j k l m n o p q
At 31 March 2017R’million
Exposure values (by RW bands)Exposure values (by regulatory approach)
Exposure values (by regulatory approach) RWA (by regulatory approach) Capital charge after cap
< 20% RW> 20% to50% RW
> 50% to100% RW
> 100% to< 1 250%
RW1 250%
RW
IRB RBA(including
IAA) IRB SFA SA/SSFA 1 250%
IRB RBA(including
IAA) IRB SFA SA/SSFA 1 250%
IRB RBA(including
IAA) IRB SFA SA/SSFA 1 250%
1 Total exposures 463 1 356 531 147 – – – 2 497 – – – 1 675 – – – 180 –
2 Traditional securitisation 463 1 356 531 147 – – – 2 497 – – – 1 675 – – – 180 –
3 Of which securitisation 463 1 356 531 147 – – – 2 497 – – – 1 675 – – – 180 –
4 Of which retail underlying 463 1 356 506 147 – – – 2 472 – – – 1 650 – – – 177 –
5 Of which wholesale – – 25 – – – – 25 – – – 25 – – – 3 –
6 Of which resecuritisation – – – – – – – – – – – – – – – – –
7 Of which senior 463 1 356 531 147 – – – 2 497 – – – – – – – – –
8 Of which non-senior – – – – – – – – – – – – – – – – –
9 Synthetic securitisation – – – – – – – – – – – – – – – – –
10 Of which securitisation – – – – – – – – – – – – – – – – –
11 Of which retail underlying – – – – – – – – – – – – – – – – –
12 Of which wholesale – – – – – – – – – – – – – – – – –
13 Of which resecuritisation – – – – – – – – – – – – – – – – –
14 Of which senior – – – – – – – – – – – – – – – – –
15 Of which non-senior – – – – – – – – – –– – – – – – – –
a b c d e f g h i j k l m n o p q
At 31 March 2016R’million
Exposure values (by RW bands)Exposure values (by regulatory approach)
Exposure values (by regulatory approach) RWA (by regulatory approach) Capital charge after cap
< 20% RW> 20% to50% RW
> 50% to100% RW
> 100% to< 1 250%
RW1 250%
RW
IRB RBA(including
IAA) IRB SFA SA/SSFA 1 250%
IRB RBA(including
IAA) IRB SFA SA/SSFA 1 250%
IRB RBA(including
IAA) IRB SFA SA/SSFA 1 250%
1 Total exposures 126 2 263 – 1 374 – – – 3 763 – – – 3 273 – – – 340 –
2 Traditional securitisation 126 2 263 – 1 374 – – – 3 763 – – – 3 273 – – – 340 –
3 Of which securitisation 126 2 263 – 1 374 – – – 3 763 – – – 3 273 – – – 340 –
4 Of which retail underlying 126 2 263 – 188 – – – 2 576 – – – 1 813 – – – 188 –
5 Of which wholesale – – – 1 187 – – – 1 187 – – – 1 459 – – – 151 –
6 Of which resecuritisation – – – – – – – – – – – – – – – – –
7 Of which senior 126 – – 1 187 – – – 1 312 – – – 1 485 – – – 154 –
8 Of which non-senior – 2 263 – 188 – – – 2 451 – – – 1 788 – – – 186 –
9 Synthetic securitisation – – – – – – – – – – – – – – – – –
10 Of which securitisation – – – – – – – – – – – – – – – – –
11 Of which retail underlying – – – – – – – – – – – – – – – – –
12 Of which wholesale – – – – – – – – – – – – – – – – –
13 Of which resecuritisation – – – – – – – – – – – – – – – – –
14 Of which senior – – – – – – – – – – – – – – – – –
15 Of which non-senior – – – – – – – – – – – – – – – – –
Columns (a) to (e) include the investments positions purchased in third party SPI exposures. The bank applied the look-through approach to calculate RWA under the standardised approach (TSA) for senior investment exposures.
(continued)
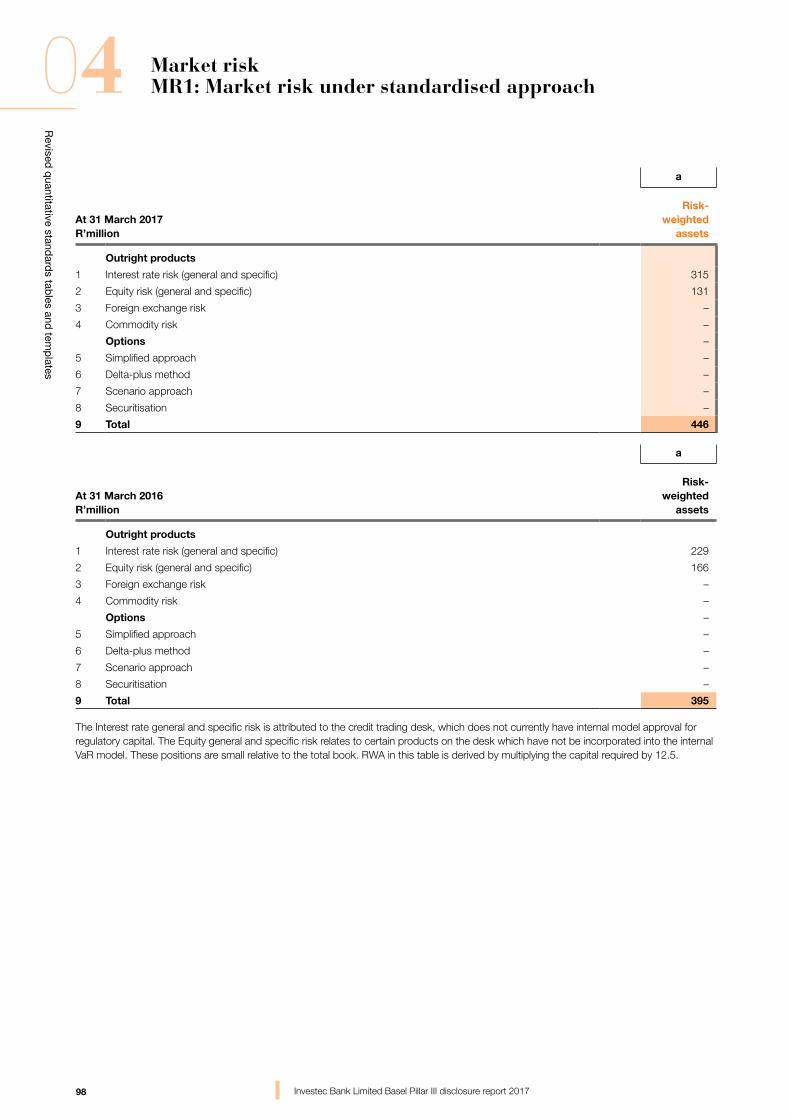
98
Revised
quantitative stand
ards tab
les and tem
plates
04
Investec Bank Limited Basel Pillar III disclosure report 2017
Market riskMR1: Market risk under standardised approach
a
At 31 March 2017R’million
Risk- weighted
assets
Outright products
1 Interest rate risk (general and specific) 315
2 Equity risk (general and specific) 131
3 Foreign exchange risk –
4 Commodity risk –
Options –
5 Simplified approach –
6 Delta-plus method –
7 Scenario approach –
8 Securitisation –
9 Total 446
a
At 31 March 2016R’million
Risk- weighted
assets
Outright products
1 Interest rate risk (general and specific) 229
2 Equity risk (general and specific) 166
3 Foreign exchange risk –
4 Commodity risk –
Options –
5 Simplified approach –
6 Delta-plus method –
7 Scenario approach –
8 Securitisation –
9 Total 395
The Interest rate general and specific risk is attributed to the credit trading desk, which does not currently have internal model approval for regulatory capital. The Equity general and specific risk relates to certain products on the desk which have not be incorporated into the internal VaR model. These positions are small relative to the total book. RWA in this table is derived by multiplying the capital required by 12.5.
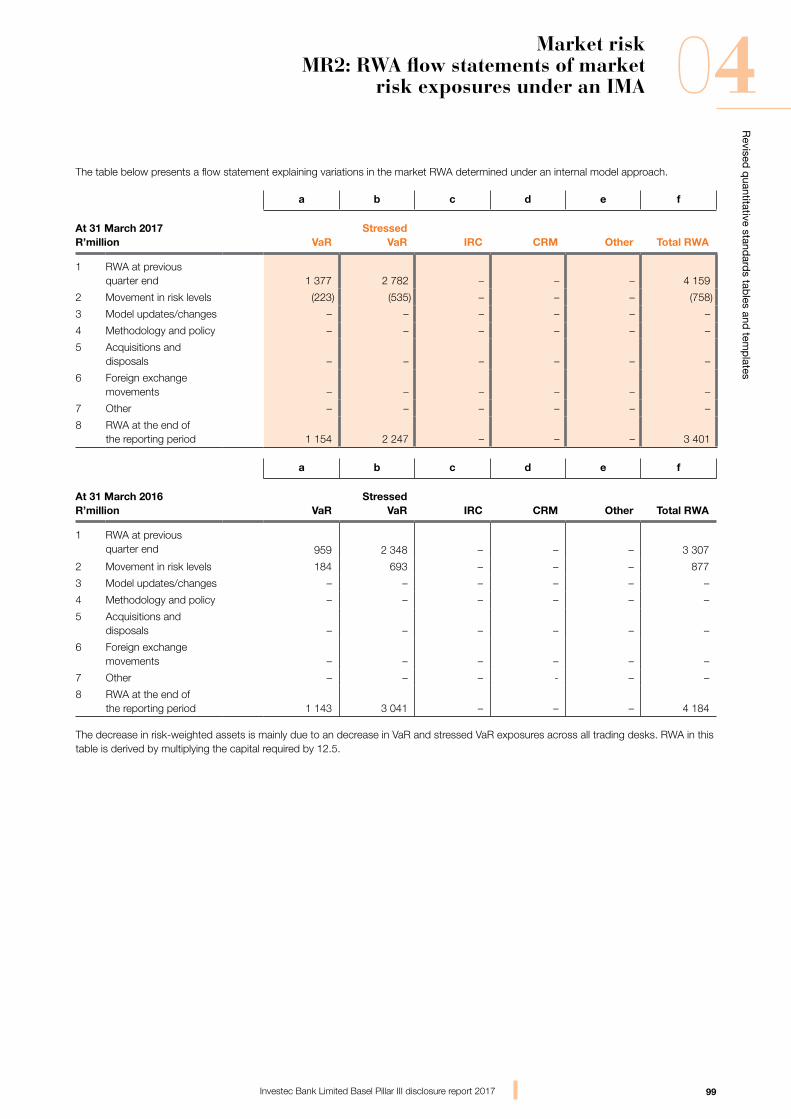
99
Revised
quantitative stand
ards tab
les and tem
plates
04
Investec Bank Limited Basel Pillar III disclosure report 2017
Market riskMR2: RWA flow statements of market
risk exposures under an IMA
The table below presents a flow statement explaining variations in the market RWA determined under an internal model approach.
a b c d e f
At 31 March 2017R’million VaR
StressedVaR IRC CRM Other Total RWA
1 RWA at previous quarter end 1 377 2 782 – – – 4 159
2 Movement in risk levels (223) (535) – – – (758)
3 Model updates/changes – – – – – –
4 Methodology and policy – – – – – –
5 Acquisitions and disposals – – – – – –
6 Foreign exchange movements – – – – – –
7 Other – – – – – –
8 RWA at the end of the reporting period 1 154 2 247 – – – 3 401
a b c d e f
At 31 March 2016R’million VaR
StressedVaR IRC CRM Other Total RWA
1 RWA at previous quarter end 959 2 348 – – – 3 307
2 Movement in risk levels 184 693 – – – 877
3 Model updates/changes – – – – – –
4 Methodology and policy – – – – – –
5 Acquisitions and disposals – – – – – –
6 Foreign exchange movements – – – – – –
7 Other – – – - – –
8 RWA at the end of the reporting period 1 143 3 041 – – – 4 184
The decrease in risk-weighted assets is mainly due to an decrease in VaR and stressed VaR exposures across all trading desks. RWA in this table is derived by multiplying the capital required by 12.5.
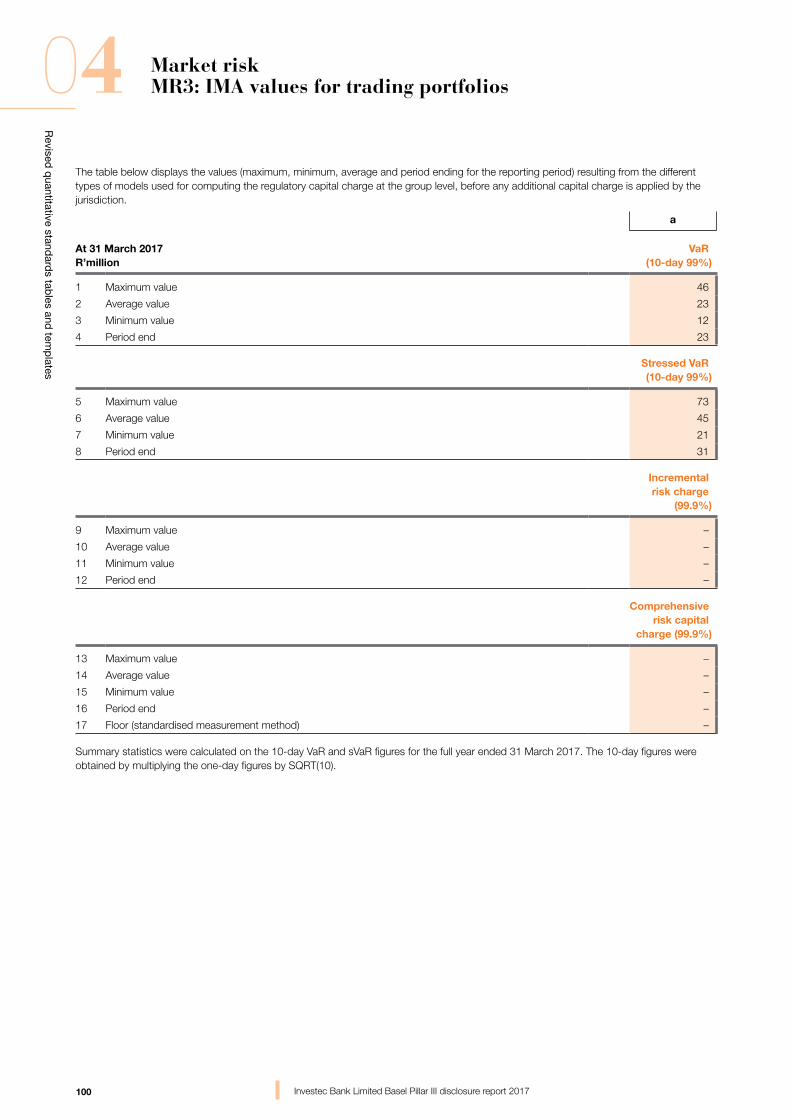
100
Revised
quantitative stand
ards tab
les and tem
plates
04
Investec Bank Limited Basel Pillar III disclosure report 2017
Market riskMR3: IMA values for trading portfolios
The table below displays the values (maximum, minimum, average and period ending for the reporting period) resulting from the different types of models used for computing the regulatory capital charge at the group level, before any additional capital charge is applied by the jurisdiction.
a
At 31 March 2017R’million
VaR(10-day 99%)
1 Maximum value 46
2 Average value 23
3 Minimum value 12
4 Period end 23
Stressed VaR(10-day 99%)
5 Maximum value 73
6 Average value 45
7 Minimum value 21
8 Period end 31
Incrementalrisk charge
(99.9%)
9 Maximum value –
10 Average value –
11 Minimum value –
12 Period end –
Comprehensiverisk capital
charge (99.9%)
13 Maximum value –
14 Average value –
15 Minimum value –
16 Period end –
17 Floor (standardised measurement method) –
Summary statistics were calculated on the 10-day VaR and sVaR figures for the full year ended 31 March 2017. The 10-day figures were obtained by multiplying the one-day figures by SQRT(10).
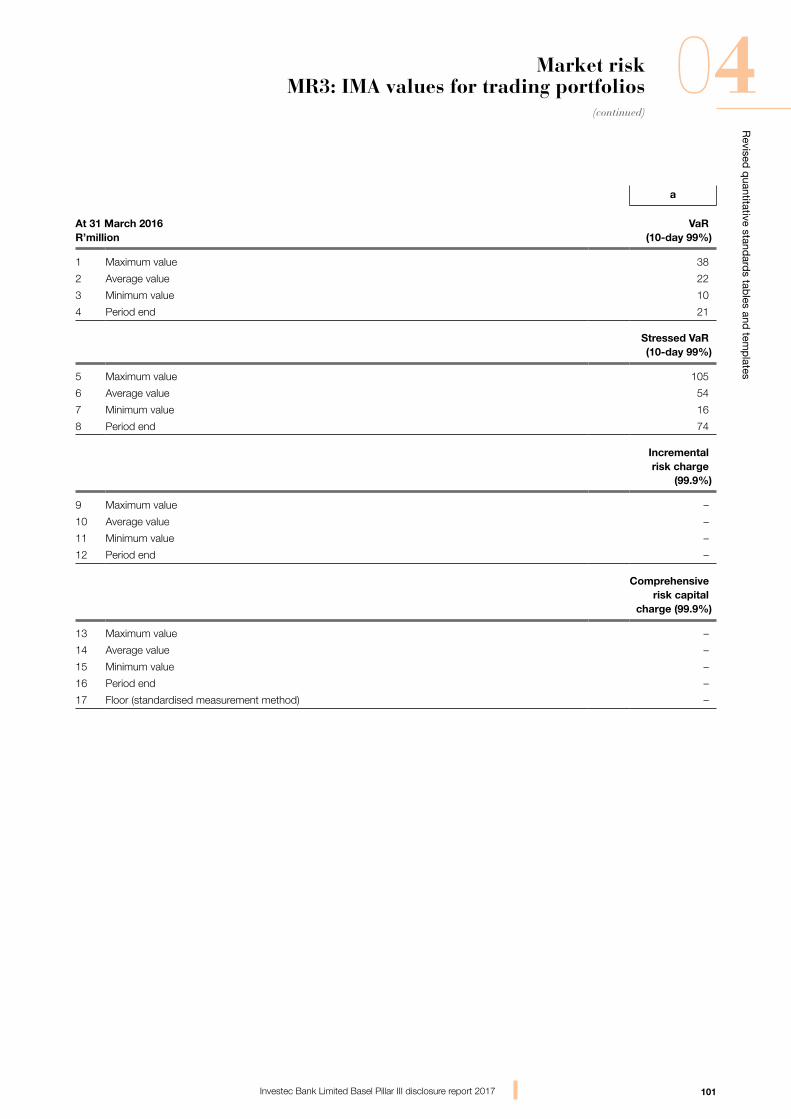
101
Revised
quantitative stand
ards tab
les and tem
plates
04(continued)
Investec Bank Limited Basel Pillar III disclosure report 2017
Market riskMR3: IMA values for trading portfolios
a
At 31 March 2016R’million
VaR(10-day 99%)
1 Maximum value 38
2 Average value 22
3 Minimum value 10
4 Period end 21
Stressed VaR(10-day 99%)
5 Maximum value 105
6 Average value 54
7 Minimum value 16
8 Period end 74
Incrementalrisk charge
(99.9%)
9 Maximum value –
10 Average value –
11 Minimum value –
12 Period end –
Comprehensiverisk capital
charge (99.9%)
13 Maximum value –
14 Average value –
15 Minimum value –
16 Period end –
17 Floor (standardised measurement method) –
05 Composition of capital disclosure requirements
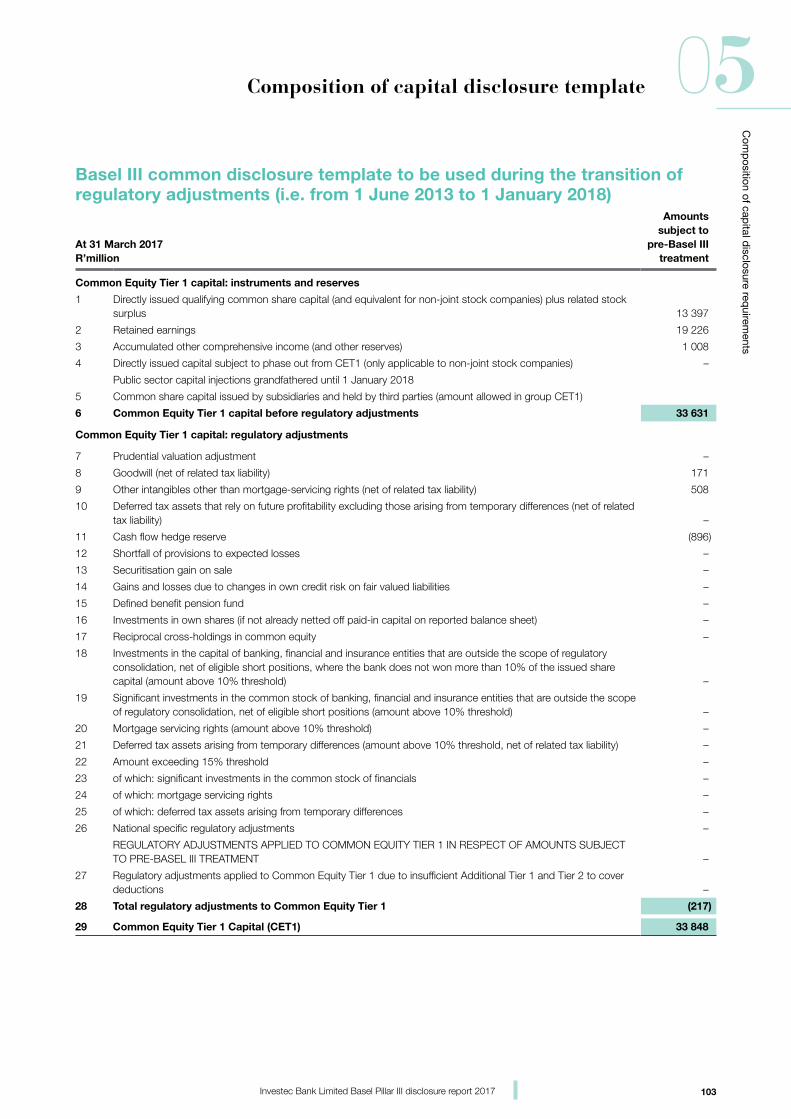
103
Com
position of cap
ital disclosure req
uirements
05
Investec Bank Limited Basel Pillar III disclosure report 2017
Composition of capital disclosure template
05 Composition of capital disclosure requirements
Basel III common disclosure template to be used during the transition of regulatory adjustments (i.e. from 1 June 2013 to 1 January 2018)
At 31 March 2017R’million
Amounts subject to
pre-Basel III treatment
Common Equity Tier 1 capital: instruments and reserves
1 Directly issued qualifying common share capital (and equivalent for non-joint stock companies) plus related stock surplus 13 397
2 Retained earnings 19 226
3 Accumulated other comprehensive income (and other reserves) 1 008
4 Directly issued capital subject to phase out from CET1 (only applicable to non-joint stock companies) –
Public sector capital injections grandfathered until 1 January 2018
5 Common share capital issued by subsidiaries and held by third parties (amount allowed in group CET1)
6 Common Equity Tier 1 capital before regulatory adjustments 33 631
Common Equity Tier 1 capital: regulatory adjustments
7 Prudential valuation adjustment –
8 Goodwill (net of related tax liability) 171
9 Other intangibles other than mortgage-servicing rights (net of related tax liability) 508
10 Deferred tax assets that rely on future profitability excluding those arising from temporary differences (net of related tax liability) –
11 Cash flow hedge reserve (896)
12 Shortfall of provisions to expected losses –
13 Securitisation gain on sale –
14 Gains and losses due to changes in own credit risk on fair valued liabilities –
15 Defined benefit pension fund –
16 Investments in own shares (if not already netted off paid-in capital on reported balance sheet) –
17 Reciprocal cross-holdings in common equity –
18 Investments in the capital of banking, financial and insurance entities that are outside the scope of regulatory consolidation, net of eligible short positions, where the bank does not won more than 10% of the issued share capital (amount above 10% threshold) –
19 Significant investments in the common stock of banking, financial and insurance entities that are outside the scope of regulatory consolidation, net of eligible short positions (amount above 10% threshold) –
20 Mortgage servicing rights (amount above 10% threshold) –
21 Deferred tax assets arising from temporary differences (amount above 10% threshold, net of related tax liability) –
22 Amount exceeding 15% threshold –
23 of which: significant investments in the common stock of financials –
24 of which: mortgage servicing rights –
25 of which: deferred tax assets arising from temporary differences –
26 National specific regulatory adjustments –
REGULATORY ADJUSTMENTS APPLIED TO COMMON EQUITY TIER 1 IN RESPECT OF AMOUNTS SUBJECT TO PRE-BASEL III TREATMENT –
27 Regulatory adjustments applied to Common Equity Tier 1 due to insufficient Additional Tier 1 and Tier 2 to cover deductions –
28 Total regulatory adjustments to Common Equity Tier 1 (217)
29 Common Equity Tier 1 Capital (CET1) 33 848
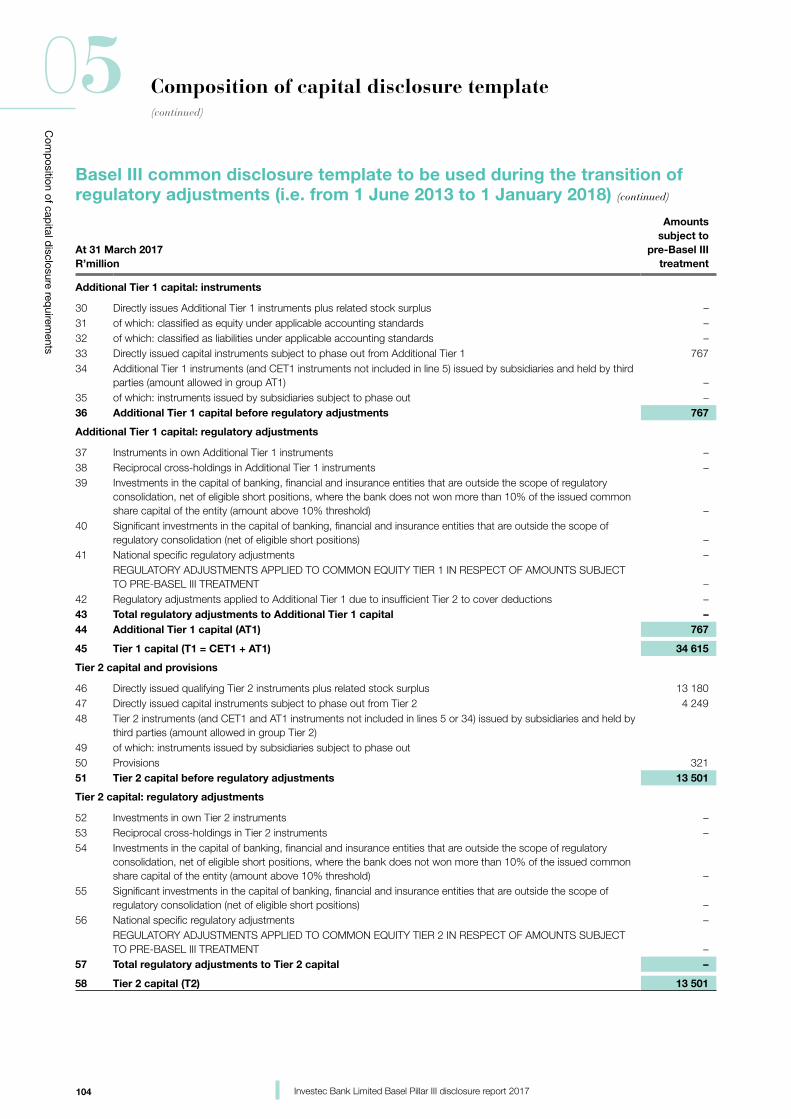
104
Com
position of cap
ital disclosure req
uirements
05(continued)
Investec Bank Limited Basel Pillar III disclosure report 2017
Composition of capital disclosure template
At 31 March 2017R’million
Amounts subject to
pre-Basel III treatment
Additional Tier 1 capital: instruments
30 Directly issues Additional Tier 1 instruments plus related stock surplus –31 of which: classified as equity under applicable accounting standards –32 of which: classified as liabilities under applicable accounting standards –33 Directly issued capital instruments subject to phase out from Additional Tier 1 767 34 Additional Tier 1 instruments (and CET1 instruments not included in line 5) issued by subsidiaries and held by third
parties (amount allowed in group AT1) –35 of which: instruments issued by subsidiaries subject to phase out –36 Additional Tier 1 capital before regulatory adjustments 767
Additional Tier 1 capital: regulatory adjustments
37 Instruments in own Additional Tier 1 instruments –38 Reciprocal cross-holdings in Additional Tier 1 instruments –39 Investments in the capital of banking, financial and insurance entities that are outside the scope of regulatory
consolidation, net of eligible short positions, where the bank does not won more than 10% of the issued common share capital of the entity (amount above 10% threshold) –
40 Significant investments in the capital of banking, financial and insurance entities that are outside the scope of regulatory consolidation (net of eligible short positions) –
41 National specific regulatory adjustments –REGULATORY ADJUSTMENTS APPLIED TO COMMON EQUITY TIER 1 IN RESPECT OF AMOUNTS SUBJECT TO PRE-BASEL III TREATMENT –
42 Regulatory adjustments applied to Additional Tier 1 due to insufficient Tier 2 to cover deductions –43 Total regulatory adjustments to Additional Tier 1 capital –44 Additional Tier 1 capital (AT1) 767
45 Tier 1 capital (T1 = CET1 + AT1) 34 615
Tier 2 capital and provisions
46 Directly issued qualifying Tier 2 instruments plus related stock surplus 13 18047 Directly issued capital instruments subject to phase out from Tier 2 4 249 48 Tier 2 instruments (and CET1 and AT1 instruments not included in lines 5 or 34) issued by subsidiaries and held by
third parties (amount allowed in group Tier 2)49 of which: instruments issued by subsidiaries subject to phase out50 Provisions 321 51 Tier 2 capital before regulatory adjustments 13 501
Tier 2 capital: regulatory adjustments
52 Investments in own Tier 2 instruments –53 Reciprocal cross-holdings in Tier 2 instruments –54 Investments in the capital of banking, financial and insurance entities that are outside the scope of regulatory
consolidation, net of eligible short positions, where the bank does not won more than 10% of the issued common share capital of the entity (amount above 10% threshold) –
55 Significant investments in the capital of banking, financial and insurance entities that are outside the scope of regulatory consolidation (net of eligible short positions) –
56 National specific regulatory adjustments –REGULATORY ADJUSTMENTS APPLIED TO COMMON EQUITY TIER 2 IN RESPECT OF AMOUNTS SUBJECT TO PRE-BASEL III TREATMENT –
57 Total regulatory adjustments to Tier 2 capital –
58 Tier 2 capital (T2) 13 501
Basel III common disclosure template to be used during the transition of regulatory adjustments (i.e. from 1 June 2013 to 1 January 2018) (continued)
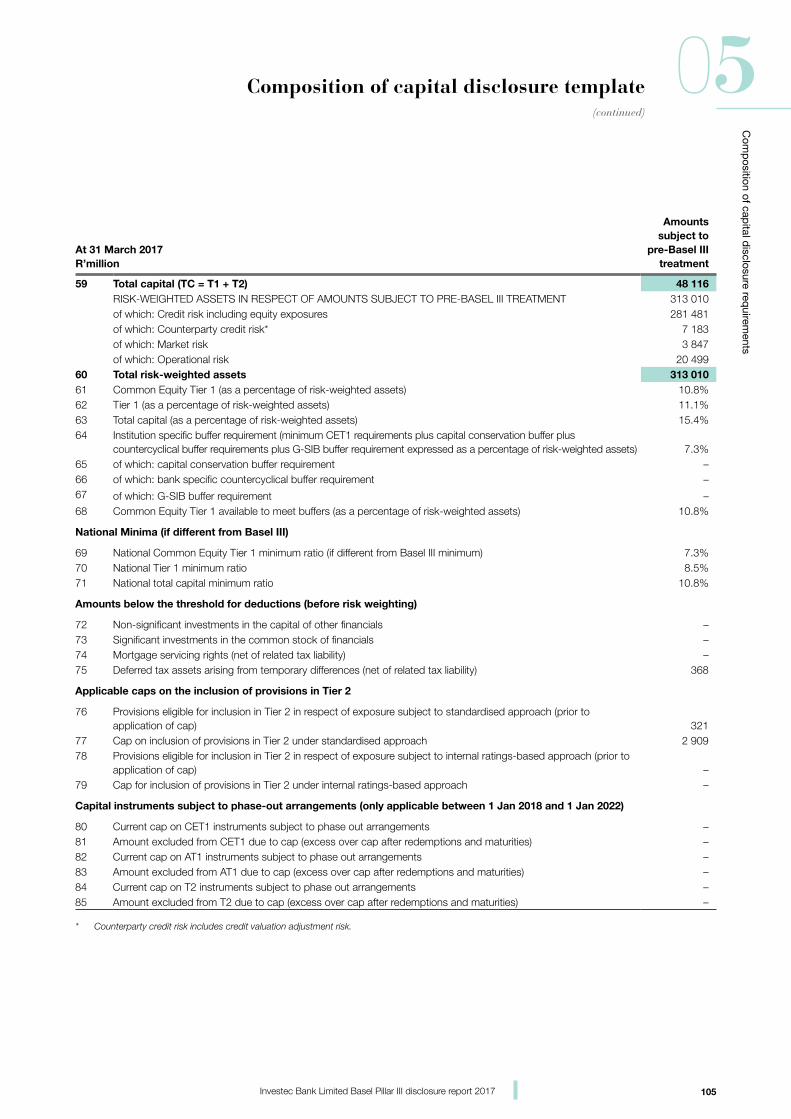
105
Com
position of cap
ital disclosure req
uirements
05(continued)
Investec Bank Limited Basel Pillar III disclosure report 2017
Composition of capital disclosure template
At 31 March 2017R’million
Amounts subject to
pre-Basel III treatment
59 Total capital (TC = T1 + T2) 48 116 RISK-WEIGHTED ASSETS IN RESPECT OF AMOUNTS SUBJECT TO PRE-BASEL III TREATMENT 313 010 of which: Credit risk including equity exposures 281 481of which: Counterparty credit risk* 7 183 of which: Market risk 3 847 of which: Operational risk 20 499
60 Total risk-weighted assets 313 010 61 Common Equity Tier 1 (as a percentage of risk-weighted assets) 10.8%62 Tier 1 (as a percentage of risk-weighted assets) 11.1%63 Total capital (as a percentage of risk-weighted assets) 15.4%64 Institution specific buffer requirement (minimum CET1 requirements plus capital conservation buffer plus
countercyclical buffer requirements plus G-SIB buffer requirement expressed as a percentage of risk-weighted assets) 7.3%65 of which: capital conservation buffer requirement –66 of which: bank specific countercyclical buffer requirement –67 of which: G-SIB buffer requirement –68 Common Equity Tier 1 available to meet buffers (as a percentage of risk-weighted assets) 10.8%
National Minima (if different from Basel III)
69 National Common Equity Tier 1 minimum ratio (if different from Basel III minimum) 7.3%70 National Tier 1 minimum ratio 8.5%71 National total capital minimum ratio 10.8%
Amounts below the threshold for deductions (before risk weighting)
72 Non-significant investments in the capital of other financials –73 Significant investments in the common stock of financials –74 Mortgage servicing rights (net of related tax liability) –75 Deferred tax assets arising from temporary differences (net of related tax liability) 368
Applicable caps on the inclusion of provisions in Tier 2
76 Provisions eligible for inclusion in Tier 2 in respect of exposure subject to standardised approach (prior to application of cap) 321
77 Cap on inclusion of provisions in Tier 2 under standardised approach 2 909 78 Provisions eligible for inclusion in Tier 2 in respect of exposure subject to internal ratings-based approach (prior to
application of cap) –79 Cap for inclusion of provisions in Tier 2 under internal ratings-based approach –
Capital instruments subject to phase-out arrangements (only applicable between 1 Jan 2018 and 1 Jan 2022)
80 Current cap on CET1 instruments subject to phase out arrangements –81 Amount excluded from CET1 due to cap (excess over cap after redemptions and maturities) –82 Current cap on AT1 instruments subject to phase out arrangements –83 Amount excluded from AT1 due to cap (excess over cap after redemptions and maturities) –84 Current cap on T2 instruments subject to phase out arrangements –85 Amount excluded from T2 due to cap (excess over cap after redemptions and maturities) –
* Counterparty credit risk includes credit valuation adjustment risk.
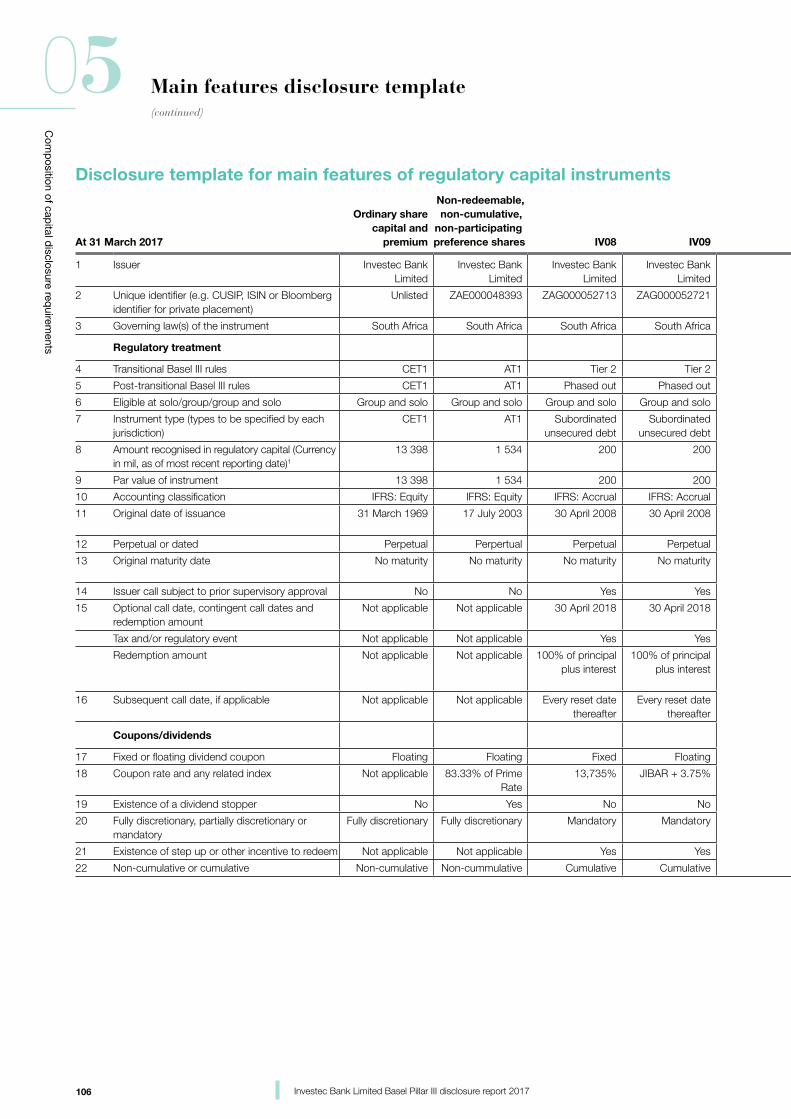
106
Com
position of cap
ital disclosure req
uirements
05(continued)
Investec Bank Limited Basel Pillar III disclosure report 2017
Main features disclosure template
Disclosure template for main features of regulatory capital instruments
At 31 March 2017
Ordinary share capital and
premium
Non-redeemable, non-cumulative,
non-participating preference shares IV08 IV09 IV015 IV019 IV019A IV022 IV023
1 Issuer Investec Bank Limited
Investec Bank Limited
Investec Bank Limited
Investec Bank Limited
Investec Bank Limited
Investec Bank Limited
Investec Bank Limited
Investec Bank Limited
Investec Bank Limited
2 Unique identifier (e.g. CUSIP, ISIN or Bloomberg identifier for private placement)
Unlisted ZAE000048393 ZAG000052713 ZAG000052721 ZAG000080755 ZAG000094442 ZAG000095779 ZAG000094434 ZAG000097064
3 Governing law(s) of the instrument South Africa South Africa South Africa South Africa South Africa South Africa South Africa South Africa South Africa
Regulatory treatment
4 Transitional Basel III rules CET1 AT1 Tier 2 Tier 2 Tier 2 Tier 2 Tier 2 Tier 2 Tier 2
5 Post-transitional Basel III rules CET1 AT1 Phased out Phased out Phased out Tier 2 Tier 2 Phased out Phased out
6 Eligible at solo/group/group and solo Group and solo Group and solo Group and solo Group and solo Group and solo Group and solo Group and solo Group and solo Group and solo
7 Instrument type (types to be specified by each jurisdiction)
CET1 AT1 Subordinated unsecured debt
Subordinated unsecured debt
Subordinated unsecured debt
Subordinated debt Subordinated debt Subordinated debt Subordinated debt
8 Amount recognised in regulatory capital (Currency in mil, as of most recent reporting date)1
13 398 1 534 200 200 601 103 364 638 860
9 Par value of instrument 13 398 1 534 200 200 601 64 230 638 860
10 Accounting classification IFRS: Equity IFRS: Equity IFRS: Accrual IFRS: Accrual IFRS: Accrual IFRS: Accrual IFRS: Accrual IFRS: Accrual IFRS: Accrual
11 Original date of issuance 31 March 1969 17 July 2003 30 April 2008 30 April 2008 20 September 2010
2 April 2012 28 May 2012 2 April 2012 11 July 2012
12 Perpetual or dated Perpetual Perpertual Perpetual Perpetual Dated Dated Dated Dated Dated
13 Original maturity date No maturity No maturity No maturity No maturity 20 September 2022
31 March 2028 31 March 2028 2 April 2022 11 July 2022
14 Issuer call subject to prior supervisory approval No No Yes Yes Yes Yes Yes Yes Yes
15 Optional call date, contingent call dates and redemption amount
Not applicable Not applicable 30 April 2018 30 April 2018 20 September 2017
31 March 2023 3 April 2023 2 April 2017 11 July 2017
Tax and/or regulatory event Not applicable Not applicable Yes Yes Yes Yes Yes Yes Yes
Redemption amount Not applicable Not applicable 100% of principal plus interest
100% of principal plus interest
100% of principal plus interest
inflation adjusted 100% of principal
and interest
inflation adjusted 100% of principal
and interest
100% of principal plus interest
100% of principal plus interest
16 Subsequent call date, if applicable Not applicable Not applicable Every reset date thereafter
Every reset date thereafter
Every reset date thereafter
Every reset date thereafter
Every reset date thereafter
Every reset date thereafter
Every reset date thereafter
Coupons/dividends
17 Fixed or floating dividend coupon Floating Floating Fixed Floating Floating Floating Floating Floating Floating
18 Coupon rate and any related index Not applicable 83.33% of Prime Rate
13,735% JIBAR + 3.75% JIBAR + 2.65% CPI-linked: 2.60% CPI-linked: 2.60% JIBAR + 2.5% JIBAR + 2.5%
19 Existence of a dividend stopper No Yes No No No No No No No
20 Fully discretionary, partially discretionary or mandatory
Fully discretionary Fully discretionary Mandatory Mandatory Mandatory Mandatory Mandatory Mandatory Mandatory
21 Existence of step up or other incentive to redeem Not applicable Not applicable Yes Yes Yes No No No No
22 Non-cumulative or cumulative Non-cumulative Non-cummulative Cumulative Cumulative Cumulative Cumulative Cumulative Cumulative Cumulative
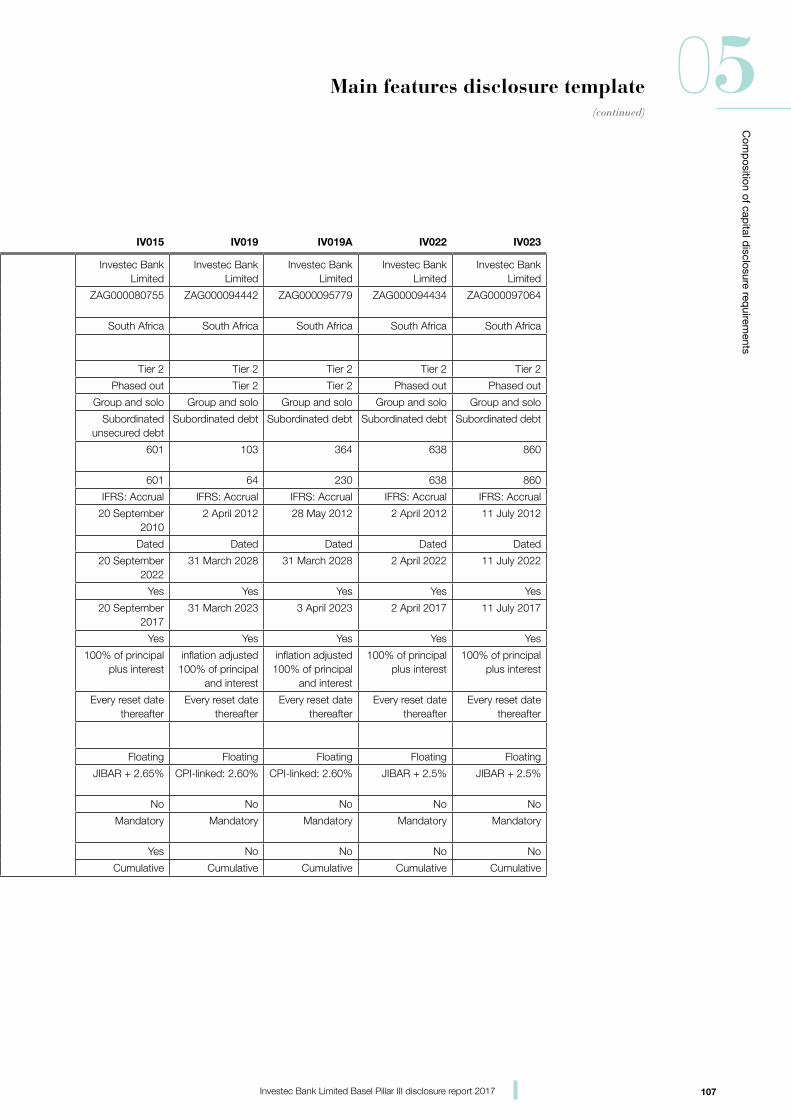
107
Com
position of cap
ital disclosure req
uirements
05(continued)
Investec Bank Limited Basel Pillar III disclosure report 2017
Main features disclosure template
Disclosure template for main features of regulatory capital instruments
At 31 March 2017
Ordinary share capital and
premium
Non-redeemable, non-cumulative,
non-participating preference shares IV08 IV09 IV015 IV019 IV019A IV022 IV023
1 Issuer Investec Bank Limited
Investec Bank Limited
Investec Bank Limited
Investec Bank Limited
Investec Bank Limited
Investec Bank Limited
Investec Bank Limited
Investec Bank Limited
Investec Bank Limited
2 Unique identifier (e.g. CUSIP, ISIN or Bloomberg identifier for private placement)
Unlisted ZAE000048393 ZAG000052713 ZAG000052721 ZAG000080755 ZAG000094442 ZAG000095779 ZAG000094434 ZAG000097064
3 Governing law(s) of the instrument South Africa South Africa South Africa South Africa South Africa South Africa South Africa South Africa South Africa
Regulatory treatment
4 Transitional Basel III rules CET1 AT1 Tier 2 Tier 2 Tier 2 Tier 2 Tier 2 Tier 2 Tier 2
5 Post-transitional Basel III rules CET1 AT1 Phased out Phased out Phased out Tier 2 Tier 2 Phased out Phased out
6 Eligible at solo/group/group and solo Group and solo Group and solo Group and solo Group and solo Group and solo Group and solo Group and solo Group and solo Group and solo
7 Instrument type (types to be specified by each jurisdiction)
CET1 AT1 Subordinated unsecured debt
Subordinated unsecured debt
Subordinated unsecured debt
Subordinated debt Subordinated debt Subordinated debt Subordinated debt
8 Amount recognised in regulatory capital (Currency in mil, as of most recent reporting date)1
13 398 1 534 200 200 601 103 364 638 860
9 Par value of instrument 13 398 1 534 200 200 601 64 230 638 860
10 Accounting classification IFRS: Equity IFRS: Equity IFRS: Accrual IFRS: Accrual IFRS: Accrual IFRS: Accrual IFRS: Accrual IFRS: Accrual IFRS: Accrual
11 Original date of issuance 31 March 1969 17 July 2003 30 April 2008 30 April 2008 20 September 2010
2 April 2012 28 May 2012 2 April 2012 11 July 2012
12 Perpetual or dated Perpetual Perpertual Perpetual Perpetual Dated Dated Dated Dated Dated
13 Original maturity date No maturity No maturity No maturity No maturity 20 September 2022
31 March 2028 31 March 2028 2 April 2022 11 July 2022
14 Issuer call subject to prior supervisory approval No No Yes Yes Yes Yes Yes Yes Yes
15 Optional call date, contingent call dates and redemption amount
Not applicable Not applicable 30 April 2018 30 April 2018 20 September 2017
31 March 2023 3 April 2023 2 April 2017 11 July 2017
Tax and/or regulatory event Not applicable Not applicable Yes Yes Yes Yes Yes Yes Yes
Redemption amount Not applicable Not applicable 100% of principal plus interest
100% of principal plus interest
100% of principal plus interest
inflation adjusted 100% of principal
and interest
inflation adjusted 100% of principal
and interest
100% of principal plus interest
100% of principal plus interest
16 Subsequent call date, if applicable Not applicable Not applicable Every reset date thereafter
Every reset date thereafter
Every reset date thereafter
Every reset date thereafter
Every reset date thereafter
Every reset date thereafter
Every reset date thereafter
Coupons/dividends
17 Fixed or floating dividend coupon Floating Floating Fixed Floating Floating Floating Floating Floating Floating
18 Coupon rate and any related index Not applicable 83.33% of Prime Rate
13,735% JIBAR + 3.75% JIBAR + 2.65% CPI-linked: 2.60% CPI-linked: 2.60% JIBAR + 2.5% JIBAR + 2.5%
19 Existence of a dividend stopper No Yes No No No No No No No
20 Fully discretionary, partially discretionary or mandatory
Fully discretionary Fully discretionary Mandatory Mandatory Mandatory Mandatory Mandatory Mandatory Mandatory
21 Existence of step up or other incentive to redeem Not applicable Not applicable Yes Yes Yes No No No No
22 Non-cumulative or cumulative Non-cumulative Non-cummulative Cumulative Cumulative Cumulative Cumulative Cumulative Cumulative Cumulative
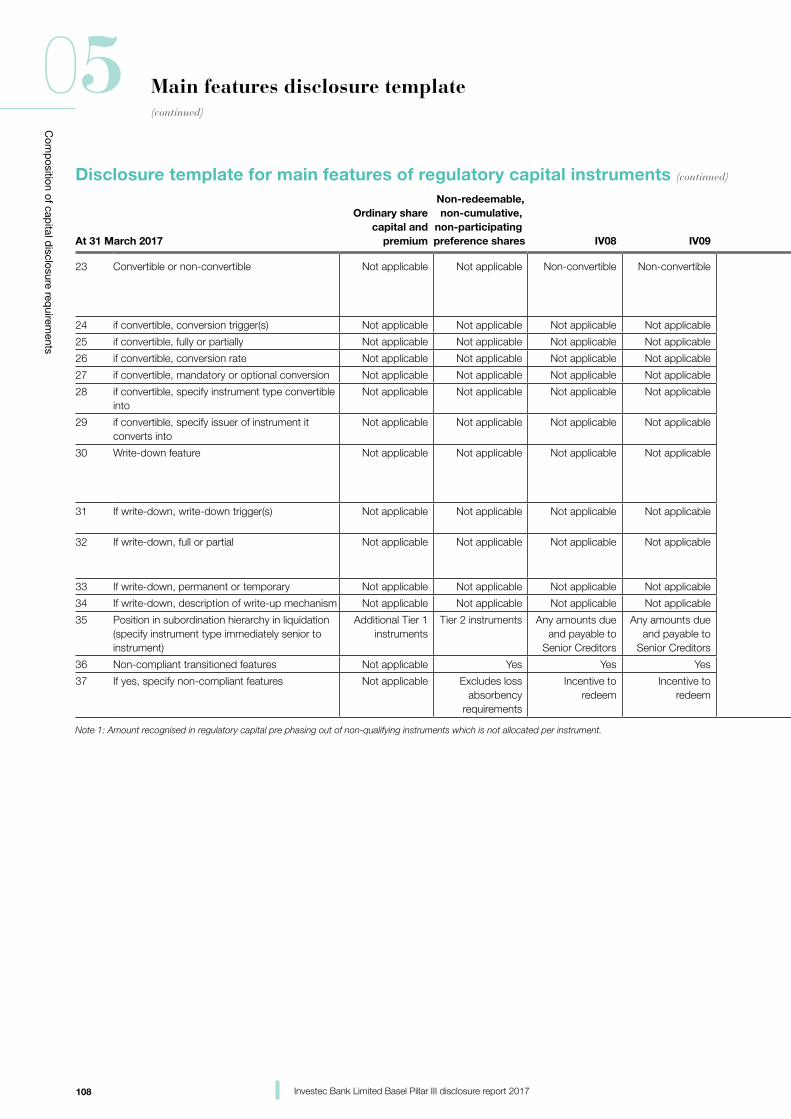
108
Com
position of cap
ital disclosure req
uirements
05(continued)
Investec Bank Limited Basel Pillar III disclosure report 2017
Main features disclosure template
Disclosure template for main features of regulatory capital instruments (continued)
At 31 March 2017
Ordinary share capital and
premium
Non-redeemable, non-cumulative,
non-participating preference shares IV08 IV09 IV015 IV019 IV019A IV022 IV023
23 Convertible or non-convertible Not applicable Not applicable Non-convertible Non-convertible Non-convertible Convertible or write-off as per
regulation, at option of regulator
Convertible or write-off as per
regulation, at option of regulator
Non-convertible Non-convertible
24 if convertible, conversion trigger(s) Not applicable Not applicable Not applicable Not applicable Not applicable Not applicable Not applicable Not applicable Not applicable
25 if convertible, fully or partially Not applicable Not applicable Not applicable Not applicable Not applicable Not applicable Not applicable Not applicable Not applicable
26 if convertible, conversion rate Not applicable Not applicable Not applicable Not applicable Not applicable Not applicable Not applicable Not applicable Not applicable
27 if convertible, mandatory or optional conversion Not applicable Not applicable Not applicable Not applicable Not applicable Not applicable Not applicable Not applicable Not applicable
28 if convertible, specify instrument type convertible into
Not applicable Not applicable Not applicable Not applicable Not applicable Not applicable Not applicable Not applicable Not applicable
29 if convertible, specify issuer of instrument it converts into
Not applicable Not applicable Not applicable Not applicable Not applicable Not applicable Not applicable Not applicable Not applicable
30 Write-down feature Not applicable Not applicable Not applicable Not applicable Not applicable Partial or full write-off as per
regulation, at option of regulator
Partial or full write-off as per
regulation, at option of regulator
Not applicable Not applicable
31 If write-down, write-down trigger(s) Not applicable Not applicable Not applicable Not applicable Not applicable PONV as defined by regulator
PONV as defined by regulator
Not applicable Not applicable
32 If write-down, full or partial Not applicable Not applicable Not applicable Not applicable Not applicable Partial or full, as deemed required
by regulator
Partial or full, as deemed required
by regulator
Not applicable Not applicable
33 If write-down, permanent or temporary Not applicable Not applicable Not applicable Not applicable Not applicable Not applicable Not applicable Not applicable Not applicable
34 If write-down, description of write-up mechanism Not applicable Not applicable Not applicable Not applicable Not applicable Not applicable Not applicable Not applicable Not applicable
35 Position in subordination hierarchy in liquidation (specify instrument type immediately senior to instrument)
Additional Tier 1 instruments
Tier 2 instruments Any amounts due and payable to
Senior Creditors
Any amounts due and payable to
Senior Creditors
Any amounts due and payable to
Senior Creditors
Any amounts due and payable to
Senior Creditors
Any amounts due and payable to
Senior Creditors
Any amounts due and payable to
Senior Creditors
Any amounts due and payable to
Senior Creditors
36 Non-compliant transitioned features Not applicable Yes Yes Yes Yes No No Yes Yes
37 If yes, specify non-compliant features Not applicable Excludes loss absorbency
requirements
Incentive to redeem
Incentive to redeem
Incentive to redeem
Not applicable Not applicable No PONV in contract
No PONV in contract
Note 1: Amount recognised in regulatory capital pre phasing out of non-qualifying instruments which is not allocated per instrument.
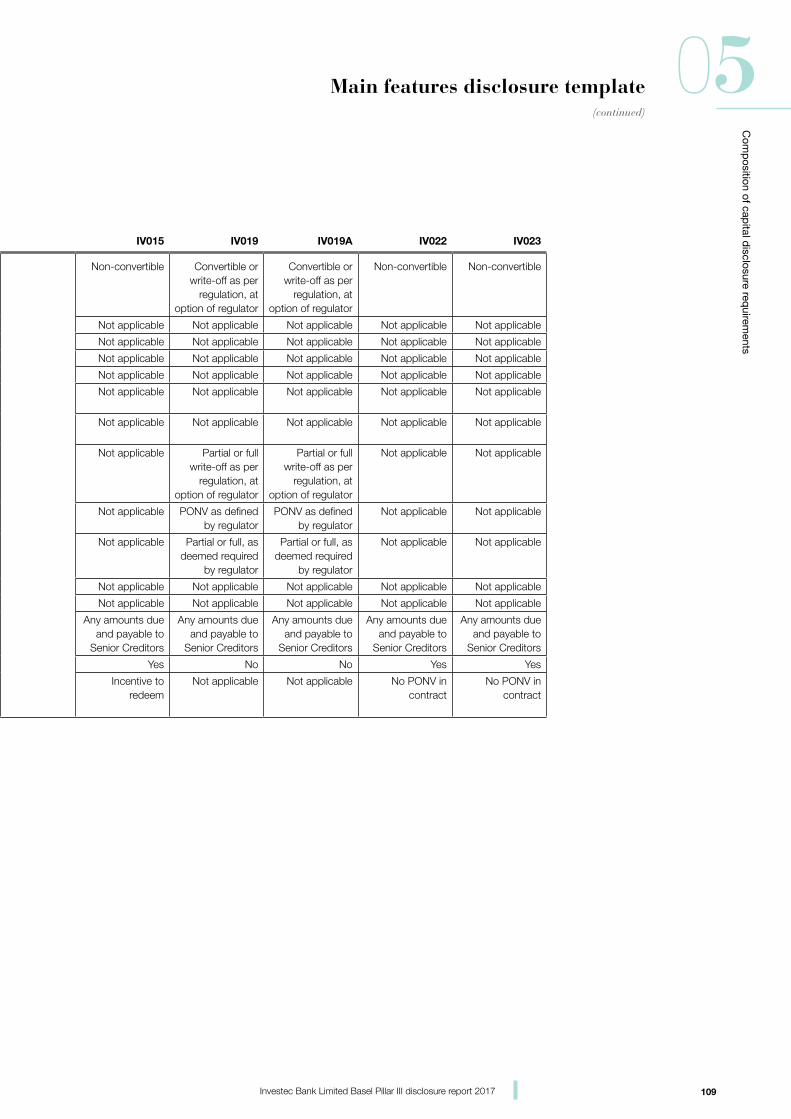
109
Com
position of cap
ital disclosure req
uirements
05(continued)
Investec Bank Limited Basel Pillar III disclosure report 2017
Main features disclosure template
At 31 March 2017
Ordinary share capital and
premium
Non-redeemable, non-cumulative,
non-participating preference shares IV08 IV09 IV015 IV019 IV019A IV022 IV023
23 Convertible or non-convertible Not applicable Not applicable Non-convertible Non-convertible Non-convertible Convertible or write-off as per
regulation, at option of regulator
Convertible or write-off as per
regulation, at option of regulator
Non-convertible Non-convertible
24 if convertible, conversion trigger(s) Not applicable Not applicable Not applicable Not applicable Not applicable Not applicable Not applicable Not applicable Not applicable
25 if convertible, fully or partially Not applicable Not applicable Not applicable Not applicable Not applicable Not applicable Not applicable Not applicable Not applicable
26 if convertible, conversion rate Not applicable Not applicable Not applicable Not applicable Not applicable Not applicable Not applicable Not applicable Not applicable
27 if convertible, mandatory or optional conversion Not applicable Not applicable Not applicable Not applicable Not applicable Not applicable Not applicable Not applicable Not applicable
28 if convertible, specify instrument type convertible into
Not applicable Not applicable Not applicable Not applicable Not applicable Not applicable Not applicable Not applicable Not applicable
29 if convertible, specify issuer of instrument it converts into
Not applicable Not applicable Not applicable Not applicable Not applicable Not applicable Not applicable Not applicable Not applicable
30 Write-down feature Not applicable Not applicable Not applicable Not applicable Not applicable Partial or full write-off as per
regulation, at option of regulator
Partial or full write-off as per
regulation, at option of regulator
Not applicable Not applicable
31 If write-down, write-down trigger(s) Not applicable Not applicable Not applicable Not applicable Not applicable PONV as defined by regulator
PONV as defined by regulator
Not applicable Not applicable
32 If write-down, full or partial Not applicable Not applicable Not applicable Not applicable Not applicable Partial or full, as deemed required
by regulator
Partial or full, as deemed required
by regulator
Not applicable Not applicable
33 If write-down, permanent or temporary Not applicable Not applicable Not applicable Not applicable Not applicable Not applicable Not applicable Not applicable Not applicable
34 If write-down, description of write-up mechanism Not applicable Not applicable Not applicable Not applicable Not applicable Not applicable Not applicable Not applicable Not applicable
35 Position in subordination hierarchy in liquidation (specify instrument type immediately senior to instrument)
Additional Tier 1 instruments
Tier 2 instruments Any amounts due and payable to
Senior Creditors
Any amounts due and payable to
Senior Creditors
Any amounts due and payable to
Senior Creditors
Any amounts due and payable to
Senior Creditors
Any amounts due and payable to
Senior Creditors
Any amounts due and payable to
Senior Creditors
Any amounts due and payable to
Senior Creditors
36 Non-compliant transitioned features Not applicable Yes Yes Yes Yes No No Yes Yes
37 If yes, specify non-compliant features Not applicable Excludes loss absorbency
requirements
Incentive to redeem
Incentive to redeem
Incentive to redeem
Not applicable Not applicable No PONV in contract
No PONV in contract
Note 1: Amount recognised in regulatory capital pre phasing out of non-qualifying instruments which is not allocated per instrument.
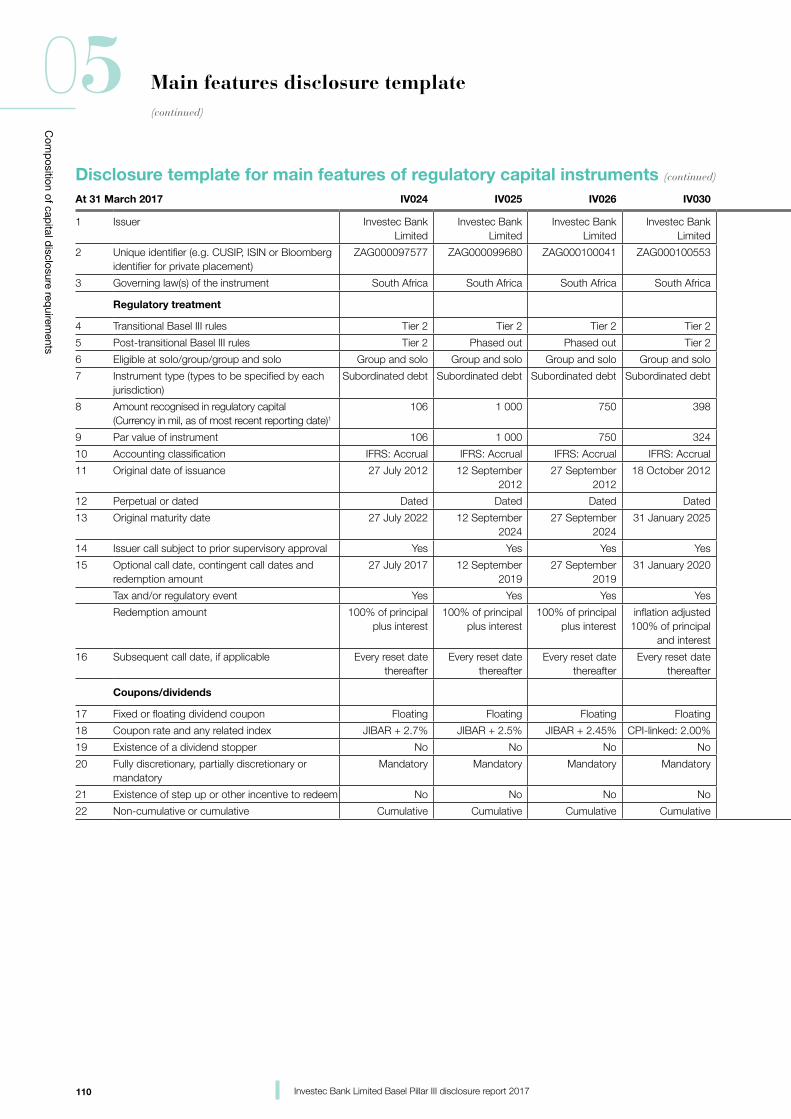
110
Com
position of cap
ital disclosure req
uirements
05(continued)
Investec Bank Limited Basel Pillar III disclosure report 2017
Disclosure template for main features of regulatory capital instruments (continued)
Main features disclosure template
At 31 March 2017 IV024 IV025 IV026 IV030 IV030A IV031 IV032 IV033 IV034 IV035
1 Issuer Investec Bank Limited
Investec Bank Limited
Investec Bank Limited
Investec Bank Limited
Investec Bank Limited
Investec Bank Limited
Investec Bank Limited
Investec Bank Limited
Investec Bank Limited
Investec Bank Limited
2 Unique identifier (e.g. CUSIP, ISIN or Bloomberg identifier for private placement)
ZAG000097577 ZAG000099680 ZAG000100041 ZAG000100553 ZAG000100884 ZAG000103722 ZAG000108051 ZAG00013342 ZAG000133430 ZAG000134610
3 Governing law(s) of the instrument South Africa South Africa South Africa South Africa South Africa South Africa South Africa South Africa South Africa South Africa
Regulatory treatment
4 Transitional Basel III rules Tier 2 Tier 2 Tier 2 Tier 2 Tier 2 Tier 2 Tier 2 Tier 2 Tier 2 Tier 2
5 Post-transitional Basel III rules Tier 2 Phased out Phased out Tier 2 Tier 2 Tier 2 Tier 2 Tier 2 Tier 2 Tier 2
6 Eligible at solo/group/group and solo Group and solo Group and solo Group and solo Group and solo Group and solo Group and solo Group and solo Group and solo Group and solo Group and solo
7 Instrument type (types to be specified by each jurisdiction)
Subordinated debt Subordinated debt Subordinated debt Subordinated debt Subordinated debt Subordinated debt Subordinated debt Subordinated debt Subordinated debt Subordinated debt
8 Amount recognised in regulatory capital (Currency in mil, as of most recent reporting date)1
106 1 000 750 398 420 500 810 159 101 1 468
9 Par value of instrument 106 1 000 750 324 350 500 810 159 101 1 468
10 Accounting classification IFRS: Accrual IFRS: Accrual IFRS: Accrual IFRS: Accrual IFRS: Accrual IFRS: Accrual IFRS: Accrual IFRS: Accrual IFRS: Accrual IFRS: Accrual
11 Original date of issuance 27 July 2012 12 September 2012
27 September 2012
18 October 2012 26 October 2012 11 March 2013 14 August 2013 11 February 2016 11 February 2016 17 March 2016
12 Perpetual or dated Dated Dated Dated Dated Dated Dated Dated Dated Dated Dated
13 Original maturity date 27 July 2022 12 September 2024
27 September 2024
31 January 2025 31 January 2025 11 March 2025 14 August 2023 11 February 2026 11 February 2026 7 April 2027
14 Issuer call subject to prior supervisory approval Yes Yes Yes Yes Yes Yes Yes Yes Yes Yes
15 Optional call date, contingent call dates and redemption amount
27 July 2017 12 September 2019
27 September 2019
31 January 2020 31 January 2020 11 March 2020 14 August 2018 11 February 2021 11 February 2021 7 April 2022
Tax and/or regulatory event Yes Yes Yes Yes Yes Yes Yes Yes Yes Yes
Redemption amount 100% of principal plus interest
100% of principal plus interest
100% of principal plus interest
inflation adjusted 100% of principal
and interest
inflation adjusted 100% of principal
and interest
100% of principal and interest
100% of principal and interest
100% of principal and interest
100% of principal and interest
100% of principal and interest
16 Subsequent call date, if applicable Every reset date thereafter
Every reset date thereafter
Every reset date thereafter
Every reset date thereafter
Every reset date thereafter
Every reset date thereafter
Every reset date thereafter
Every reset date thereafter
Every reset date thereafter
Every reset date thereafter
Coupons/dividends
17 Fixed or floating dividend coupon Floating Floating Floating Floating Floating Floating Floating Floating Fixed Floating
18 Coupon rate and any related index JIBAR + 2.7% JIBAR + 2.5% JIBAR + 2.45% CPI-linked: 2.00% CPI-linked: 2.00% JIBAR + 2.95% JIBAR + 2.95% JIBAR + 4.25% 12,47% JIBAR + 4.65%
19 Existence of a dividend stopper No No No No No No No No No No
20 Fully discretionary, partially discretionary or mandatory
Mandatory Mandatory Mandatory Mandatory Mandatory Mandatory Mandatory Mandatory Mandatory Mandatory
21 Existence of step up or other incentive to redeem No No No No No No No No No No
22 Non-cumulative or cumulative Cumulative Cumulative Cumulative Cumulative Cumulative Cumulative Cumulative Cumulative Cumulative Cumulative
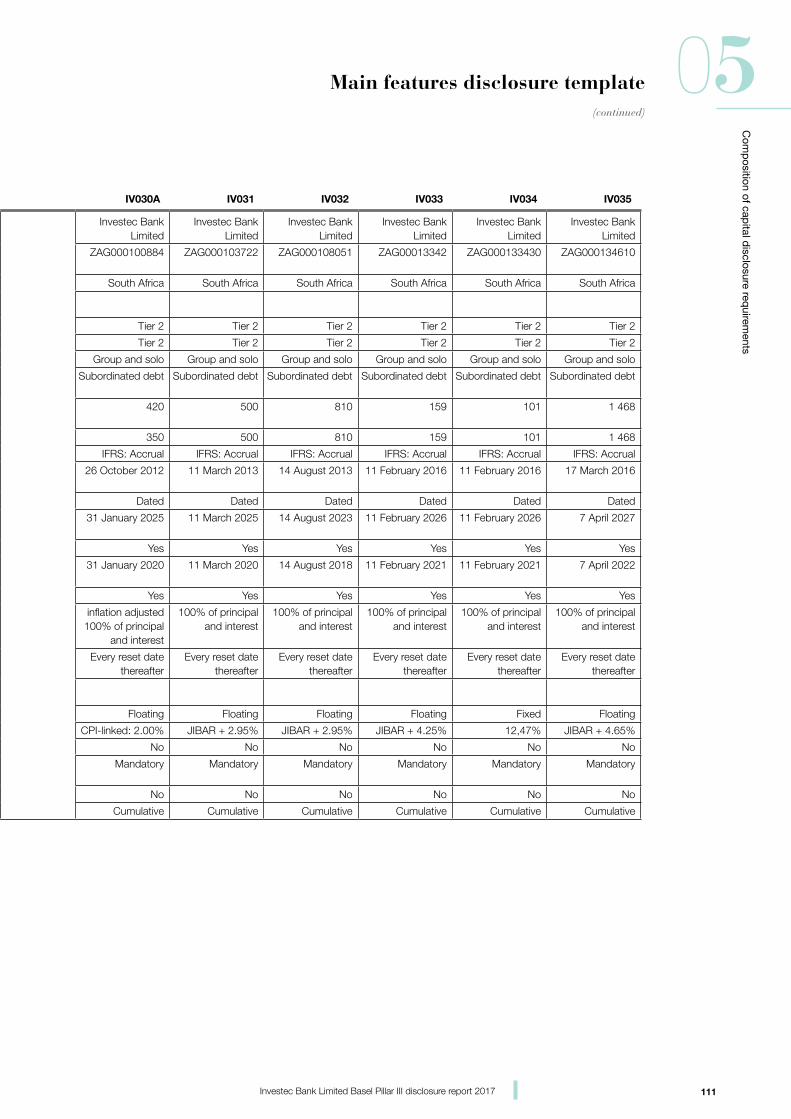
111
Com
position of cap
ital disclosure req
uirements
05(continued)
Investec Bank Limited Basel Pillar III disclosure report 2017
Main features disclosure template
At 31 March 2017 IV024 IV025 IV026 IV030 IV030A IV031 IV032 IV033 IV034 IV035
1 Issuer Investec Bank Limited
Investec Bank Limited
Investec Bank Limited
Investec Bank Limited
Investec Bank Limited
Investec Bank Limited
Investec Bank Limited
Investec Bank Limited
Investec Bank Limited
Investec Bank Limited
2 Unique identifier (e.g. CUSIP, ISIN or Bloomberg identifier for private placement)
ZAG000097577 ZAG000099680 ZAG000100041 ZAG000100553 ZAG000100884 ZAG000103722 ZAG000108051 ZAG00013342 ZAG000133430 ZAG000134610
3 Governing law(s) of the instrument South Africa South Africa South Africa South Africa South Africa South Africa South Africa South Africa South Africa South Africa
Regulatory treatment
4 Transitional Basel III rules Tier 2 Tier 2 Tier 2 Tier 2 Tier 2 Tier 2 Tier 2 Tier 2 Tier 2 Tier 2
5 Post-transitional Basel III rules Tier 2 Phased out Phased out Tier 2 Tier 2 Tier 2 Tier 2 Tier 2 Tier 2 Tier 2
6 Eligible at solo/group/group and solo Group and solo Group and solo Group and solo Group and solo Group and solo Group and solo Group and solo Group and solo Group and solo Group and solo
7 Instrument type (types to be specified by each jurisdiction)
Subordinated debt Subordinated debt Subordinated debt Subordinated debt Subordinated debt Subordinated debt Subordinated debt Subordinated debt Subordinated debt Subordinated debt
8 Amount recognised in regulatory capital (Currency in mil, as of most recent reporting date)1
106 1 000 750 398 420 500 810 159 101 1 468
9 Par value of instrument 106 1 000 750 324 350 500 810 159 101 1 468
10 Accounting classification IFRS: Accrual IFRS: Accrual IFRS: Accrual IFRS: Accrual IFRS: Accrual IFRS: Accrual IFRS: Accrual IFRS: Accrual IFRS: Accrual IFRS: Accrual
11 Original date of issuance 27 July 2012 12 September 2012
27 September 2012
18 October 2012 26 October 2012 11 March 2013 14 August 2013 11 February 2016 11 February 2016 17 March 2016
12 Perpetual or dated Dated Dated Dated Dated Dated Dated Dated Dated Dated Dated
13 Original maturity date 27 July 2022 12 September 2024
27 September 2024
31 January 2025 31 January 2025 11 March 2025 14 August 2023 11 February 2026 11 February 2026 7 April 2027
14 Issuer call subject to prior supervisory approval Yes Yes Yes Yes Yes Yes Yes Yes Yes Yes
15 Optional call date, contingent call dates and redemption amount
27 July 2017 12 September 2019
27 September 2019
31 January 2020 31 January 2020 11 March 2020 14 August 2018 11 February 2021 11 February 2021 7 April 2022
Tax and/or regulatory event Yes Yes Yes Yes Yes Yes Yes Yes Yes Yes
Redemption amount 100% of principal plus interest
100% of principal plus interest
100% of principal plus interest
inflation adjusted 100% of principal
and interest
inflation adjusted 100% of principal
and interest
100% of principal and interest
100% of principal and interest
100% of principal and interest
100% of principal and interest
100% of principal and interest
16 Subsequent call date, if applicable Every reset date thereafter
Every reset date thereafter
Every reset date thereafter
Every reset date thereafter
Every reset date thereafter
Every reset date thereafter
Every reset date thereafter
Every reset date thereafter
Every reset date thereafter
Every reset date thereafter
Coupons/dividends
17 Fixed or floating dividend coupon Floating Floating Floating Floating Floating Floating Floating Floating Fixed Floating
18 Coupon rate and any related index JIBAR + 2.7% JIBAR + 2.5% JIBAR + 2.45% CPI-linked: 2.00% CPI-linked: 2.00% JIBAR + 2.95% JIBAR + 2.95% JIBAR + 4.25% 12,47% JIBAR + 4.65%
19 Existence of a dividend stopper No No No No No No No No No No
20 Fully discretionary, partially discretionary or mandatory
Mandatory Mandatory Mandatory Mandatory Mandatory Mandatory Mandatory Mandatory Mandatory Mandatory
21 Existence of step up or other incentive to redeem No No No No No No No No No No
22 Non-cumulative or cumulative Cumulative Cumulative Cumulative Cumulative Cumulative Cumulative Cumulative Cumulative Cumulative Cumulative
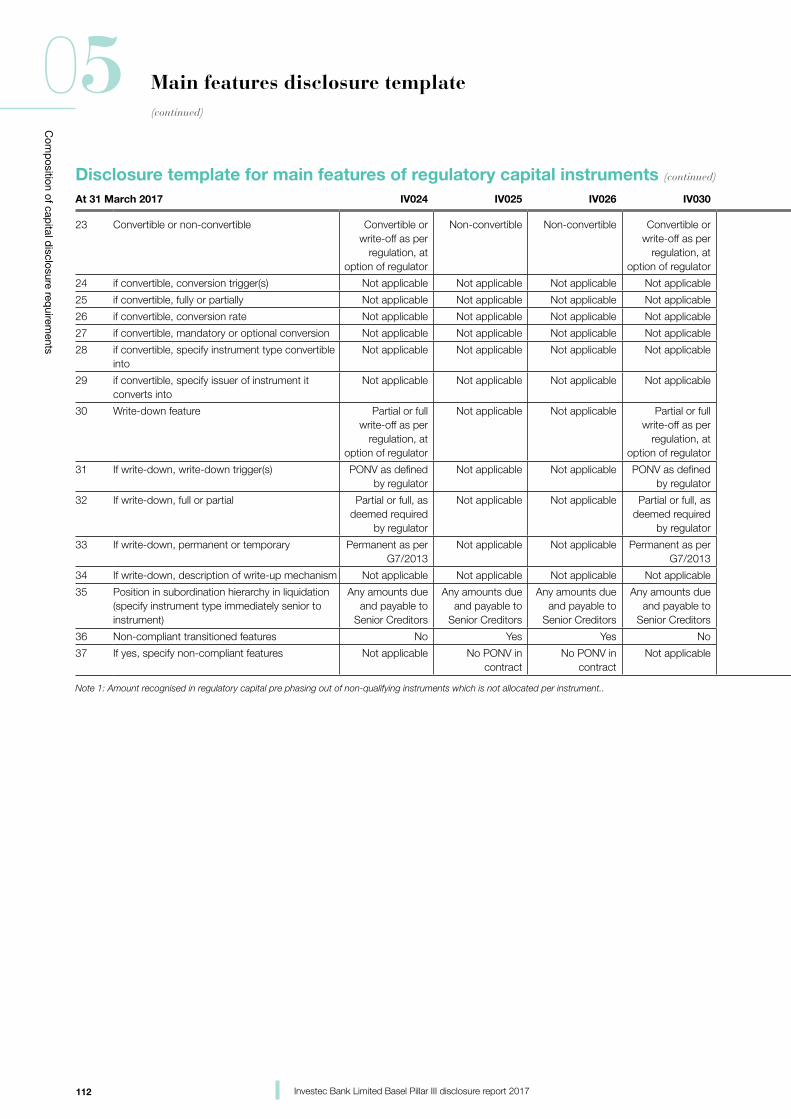
112
Com
position of cap
ital disclosure req
uirements
05(continued)
Investec Bank Limited Basel Pillar III disclosure report 2017
Disclosure template for main features of regulatory capital instruments (continued)
Main features disclosure template
At 31 March 2017 IV024 IV025 IV026 IV030 IV030A IV031 IV032 IV033 IV034 IV035
23 Convertible or non-convertible Convertible or write-off as per
regulation, at option of regulator
Non-convertible Non-convertible Convertible or write-off as per
regulation, at option of regulator
Convertible or write-off as per
regulation, at option of regulator
Convertible or write-off as per
regulation, at option of regulator
Convertible or write-off as per
regulation, at option of regulator
Convertible or write-off as per
regulation, at option of regulator
Convertible or write-off as per
regulation, at option of regulator
Convertible or write-off as per
regulation, at option of regulator
24 if convertible, conversion trigger(s) Not applicable Not applicable Not applicable Not applicable Not applicable Not applicable Not applicable Not applicable Not applicable Not applicable
25 if convertible, fully or partially Not applicable Not applicable Not applicable Not applicable Not applicable Not applicable Not applicable Not applicable Not applicable Not applicable
26 if convertible, conversion rate Not applicable Not applicable Not applicable Not applicable Not applicable Not applicable Not applicable Not applicable Not applicable Not applicable
27 if convertible, mandatory or optional conversion Not applicable Not applicable Not applicable Not applicable Not applicable Not applicable Not applicable Not applicable Not applicable Not applicable
28 if convertible, specify instrument type convertible into
Not applicable Not applicable Not applicable Not applicable Not applicable Not applicable Not applicable Not applicable Not applicable Not applicable
29 if convertible, specify issuer of instrument it converts into
Not applicable Not applicable Not applicable Not applicable Not applicable Not applicable Not applicable Not applicable Not applicable Not applicable
30 Write-down feature Partial or full write-off as per
regulation, at option of regulator
Not applicable Not applicable Partial or full write-off as per
regulation, at option of regulator
Partial or full write-off as per
regulation, at option of regulator
Partial or full write-off as per
regulation, at option of regulator
Partial or full write-off as per
regulation, at option of regulator
Partial or full write-off as per
regulation, at option of regulator
Partial or full write-off as per
regulation, at option of regulator
Partial or full write-off as per
regulation, at option of regulator
31 If write-down, write-down trigger(s) PONV as defined by regulator
Not applicable Not applicable PONV as defined by regulator
PONV as defined by regulator
PONV as defined by regulator
PONV as defined by regulator
PONV as defined by regulator
PONV as defined by regulator
PONV as defined by regulator
32 If write-down, full or partial Partial or full, as deemed required
by regulator
Not applicable Not applicable Partial or full, as deemed required
by regulator
Partial or full, as deemed required
by regulator
Partial or full, as deemed required
by regulator
Partial or full, as deemed required
by regulator
Partial or full, as deemed required
by regulator
Partial or full, as deemed required
by regulator
Partial or full, as deemed required
by regulator
33 If write-down, permanent or temporary Permanent as per G7/2013
Not applicable Not applicable Permanent as per G7/2013
Permanent as per G7/2013
Permanent as per G7/2013
Permanent as per G7/2013
Permanent as per G7/2013
Permanent as per G7/2013
Permanent as per G7/2013
34 If write-down, description of write-up mechanism Not applicable Not applicable Not applicable Not applicable Not applicable Not applicable Not applicable Not applicable Not applicable Not applicable
35 Position in subordination hierarchy in liquidation (specify instrument type immediately senior to instrument)
Any amounts due and payable to
Senior Creditors
Any amounts due and payable to
Senior Creditors
Any amounts due and payable to
Senior Creditors
Any amounts due and payable to
Senior Creditors
Any amounts due and payable to
Senior Creditors
Any amounts due and payable to
Senior Creditors
Any amounts due and payable to
Senior Creditors
Any amounts due and payable to
Senior Creditors
Any amounts due and payable to
Senior Creditors
Any amounts due and payable to
Senior Creditors
36 Non-compliant transitioned features No Yes Yes No No No No No No No
37 If yes, specify non-compliant features Not applicable No PONV in contract
No PONV in contract
Not applicable Not applicable Not applicable Not applicable Not applicable Not applicable Not applicable
Note 1: Amount recognised in regulatory capital pre phasing out of non-qualifying instruments which is not allocated per instrument. .

113
Com
position of cap
ital disclosure req
uirements
05(continued)
Investec Bank Limited Basel Pillar III disclosure report 2017
Main features disclosure template
At 31 March 2017 IV024 IV025 IV026 IV030 IV030A IV031 IV032 IV033 IV034 IV035
23 Convertible or non-convertible Convertible or write-off as per
regulation, at option of regulator
Non-convertible Non-convertible Convertible or write-off as per
regulation, at option of regulator
Convertible or write-off as per
regulation, at option of regulator
Convertible or write-off as per
regulation, at option of regulator
Convertible or write-off as per
regulation, at option of regulator
Convertible or write-off as per
regulation, at option of regulator
Convertible or write-off as per
regulation, at option of regulator
Convertible or write-off as per
regulation, at option of regulator
24 if convertible, conversion trigger(s) Not applicable Not applicable Not applicable Not applicable Not applicable Not applicable Not applicable Not applicable Not applicable Not applicable
25 if convertible, fully or partially Not applicable Not applicable Not applicable Not applicable Not applicable Not applicable Not applicable Not applicable Not applicable Not applicable
26 if convertible, conversion rate Not applicable Not applicable Not applicable Not applicable Not applicable Not applicable Not applicable Not applicable Not applicable Not applicable
27 if convertible, mandatory or optional conversion Not applicable Not applicable Not applicable Not applicable Not applicable Not applicable Not applicable Not applicable Not applicable Not applicable
28 if convertible, specify instrument type convertible into
Not applicable Not applicable Not applicable Not applicable Not applicable Not applicable Not applicable Not applicable Not applicable Not applicable
29 if convertible, specify issuer of instrument it converts into
Not applicable Not applicable Not applicable Not applicable Not applicable Not applicable Not applicable Not applicable Not applicable Not applicable
30 Write-down feature Partial or full write-off as per
regulation, at option of regulator
Not applicable Not applicable Partial or full write-off as per
regulation, at option of regulator
Partial or full write-off as per
regulation, at option of regulator
Partial or full write-off as per
regulation, at option of regulator
Partial or full write-off as per
regulation, at option of regulator
Partial or full write-off as per
regulation, at option of regulator
Partial or full write-off as per
regulation, at option of regulator
Partial or full write-off as per
regulation, at option of regulator
31 If write-down, write-down trigger(s) PONV as defined by regulator
Not applicable Not applicable PONV as defined by regulator
PONV as defined by regulator
PONV as defined by regulator
PONV as defined by regulator
PONV as defined by regulator
PONV as defined by regulator
PONV as defined by regulator
32 If write-down, full or partial Partial or full, as deemed required
by regulator
Not applicable Not applicable Partial or full, as deemed required
by regulator
Partial or full, as deemed required
by regulator
Partial or full, as deemed required
by regulator
Partial or full, as deemed required
by regulator
Partial or full, as deemed required
by regulator
Partial or full, as deemed required
by regulator
Partial or full, as deemed required
by regulator
33 If write-down, permanent or temporary Permanent as per G7/2013
Not applicable Not applicable Permanent as per G7/2013
Permanent as per G7/2013
Permanent as per G7/2013
Permanent as per G7/2013
Permanent as per G7/2013
Permanent as per G7/2013
Permanent as per G7/2013
34 If write-down, description of write-up mechanism Not applicable Not applicable Not applicable Not applicable Not applicable Not applicable Not applicable Not applicable Not applicable Not applicable
35 Position in subordination hierarchy in liquidation (specify instrument type immediately senior to instrument)
Any amounts due and payable to
Senior Creditors
Any amounts due and payable to
Senior Creditors
Any amounts due and payable to
Senior Creditors
Any amounts due and payable to
Senior Creditors
Any amounts due and payable to
Senior Creditors
Any amounts due and payable to
Senior Creditors
Any amounts due and payable to
Senior Creditors
Any amounts due and payable to
Senior Creditors
Any amounts due and payable to
Senior Creditors
Any amounts due and payable to
Senior Creditors
36 Non-compliant transitioned features No Yes Yes No No No No No No No
37 If yes, specify non-compliant features Not applicable No PONV in contract
No PONV in contract
Not applicable Not applicable Not applicable Not applicable Not applicable Not applicable Not applicable
Note 1: Amount recognised in regulatory capital pre phasing out of non-qualifying instruments which is not allocated per instrument. .
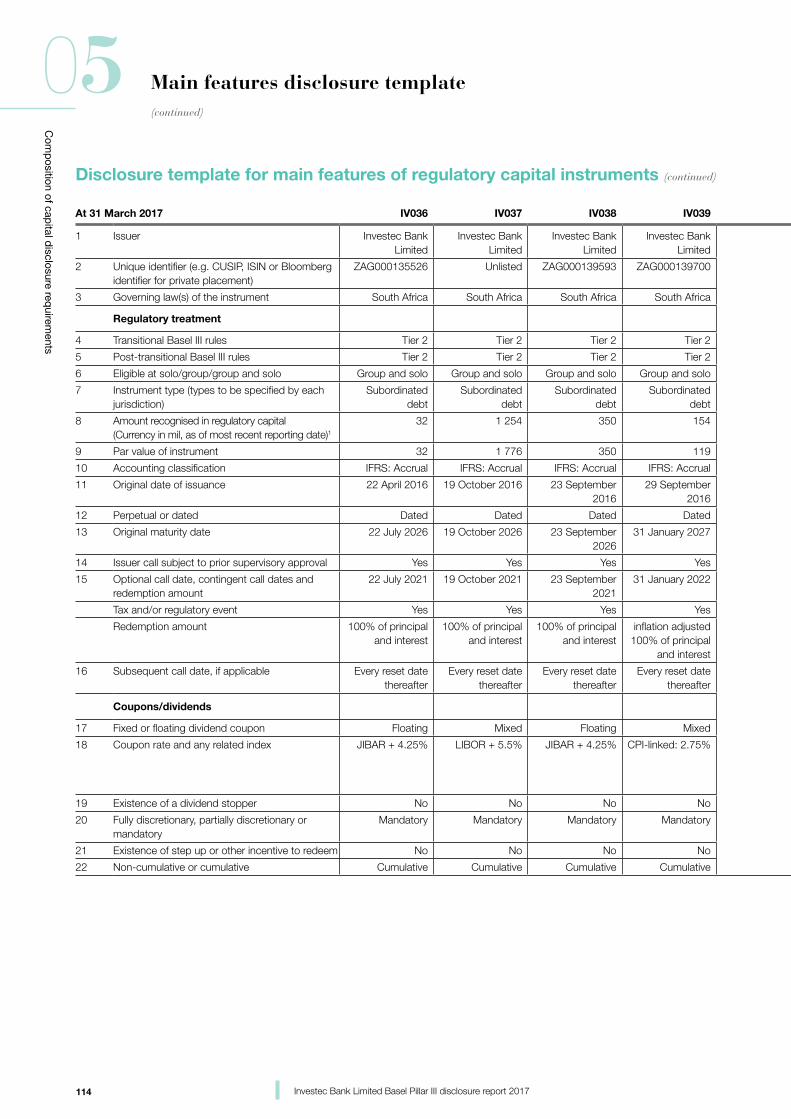
114
Com
position of cap
ital disclosure req
uirements
05(continued)
Investec Bank Limited Basel Pillar III disclosure report 2017
Disclosure template for main features of regulatory capital instruments (continued)
Main features disclosure template
At 31 March 2017 IV036 IV037 IV038 IV039 IV040 IV041 IV042 IV043 IV044 IV045
1 Issuer Investec Bank Limited
Investec Bank Limited
Investec Bank Limited
Investec Bank Limited
Investec Bank Limited
Investec Bank Limited
Investec Bank Limited
Investec Bank Limited
Investec Bank Limited
Investec Bank Limited
2 Unique identifier (e.g. CUSIP, ISIN or Bloomberg identifier for private placement)
ZAG000135526 Unlisted ZAG000139593 ZAG000139700 ZAG000139718 ZAG000139726 ZAG000140708 ZAG000140765 ZAG000141797 ZAG000141805
3 Governing law(s) of the instrument South Africa South Africa South Africa South Africa South Africa South Africa South Africa South Africa South Africa South Africa
Regulatory treatment
4 Transitional Basel III rules Tier 2 Tier 2 Tier 2 Tier 2 Tier 2 Tier 2 Tier 2 Tier 2 Tier 2 Tier 2
5 Post-transitional Basel III rules Tier 2 Tier 2 Tier 2 Tier 2 Tier 2 Tier 2 Tier 2 Tier 2 Tier 2 Tier 2
6 Eligible at solo/group/group and solo Group and solo Group and solo Group and solo Group and solo Group and solo Group and solo Group and solo Group and solo Group and solo Group and solo
7 Instrument type (types to be specified by each jurisdiction)
Subordinated debt
Subordinated debt
Subordinated debt
Subordinated debt
Subordinated debt
Subordinated debt
Subordinated debt
Subordinated debt
Subordinated debt
Subordinated debt
8 Amount recognised in regulatory capital (Currency in mil, as of most recent reporting date)1
32 1 254 350 154 589 190 50 150 240 1 492
9 Par value of instrument 32 1 776 350 119 589 190 50 150 240 1 160
10 Accounting classification IFRS: Accrual IFRS: Accrual IFRS: Accrual IFRS: Accrual IFRS: Accrual IFRS: Accrual IFRS: Accrual IFRS: Accrual IFRS: Accrual IFRS: Accrual
11 Original date of issuance 22 April 2016 19 October 2016 23 September 2016
29 September 2016
29 September 2016
29 September 2016
18 November 2016
21 November 2016
31 January 2017 31 January 2017
12 Perpetual or dated Dated Dated Dated Dated Dated Dated Dated Dated Dated Dated
13 Original maturity date 22 July 2026 19 October 2026 23 September 2026
31 January 2027 29 September 2026
29 September 2026
18 November 2026
21 November 2026
31 January 2027 31 January 2027
14 Issuer call subject to prior supervisory approval Yes Yes Yes Yes Yes Yes Yes Yes Yes Yes
15 Optional call date, contingent call dates and redemption amount
22 July 2021 19 October 2021 23 September 2021
31 January 2022 29 September 2021
29 September 2021
18 November 2021
21 November 2021
31 January 2022 31 January 2022
Tax and/or regulatory event Yes Yes Yes Yes Yes Yes Yes Yes Yes Yes
Redemption amount 100% of principal and interest
100% of principal and interest
100% of principal and interest
inflation adjusted 100% of principal
and interest
100% of principal and interest
100% of principal and interest
100% of principal and interest
100% of principal and interest
100% of principal and interest
inflation adjusted 100% of principal
and interest
16 Subsequent call date, if applicable Every reset date thereafter
Every reset date thereafter
Every reset date thereafter
Every reset date thereafter
Every reset date thereafter
Every reset date thereafter
Every reset date thereafter
Every reset date thereafter
Every reset date thereafter
Every reset date thereafter
Coupons/dividends
17 Fixed or floating dividend coupon Floating Mixed Floating Mixed Floating Mixed Floating Mixed Floating Mixed
18 Coupon rate and any related index JIBAR + 4.25% LIBOR + 5.5% JIBAR + 4.25% CPI-linked: 2.75% J + 4.25% 11,97% J + 4.25% 12.50% up to call date
J + 4.25% after call date
J + 4.15% CPI-linked: 2.75%
19 Existence of a dividend stopper No No No No No No No No No No
20 Fully discretionary, partially discretionary or mandatory
Mandatory Mandatory Mandatory Mandatory Mandatory Mandatory Mandatory Mandatory Mandatory Mandatory
21 Existence of step up or other incentive to redeem No No No No No No No No No No
22 Non-cumulative or cumulative Cumulative Cumulative Cumulative Cumulative Cumulative Cumulative Cumulative Cumulative Cumulative Cumulative
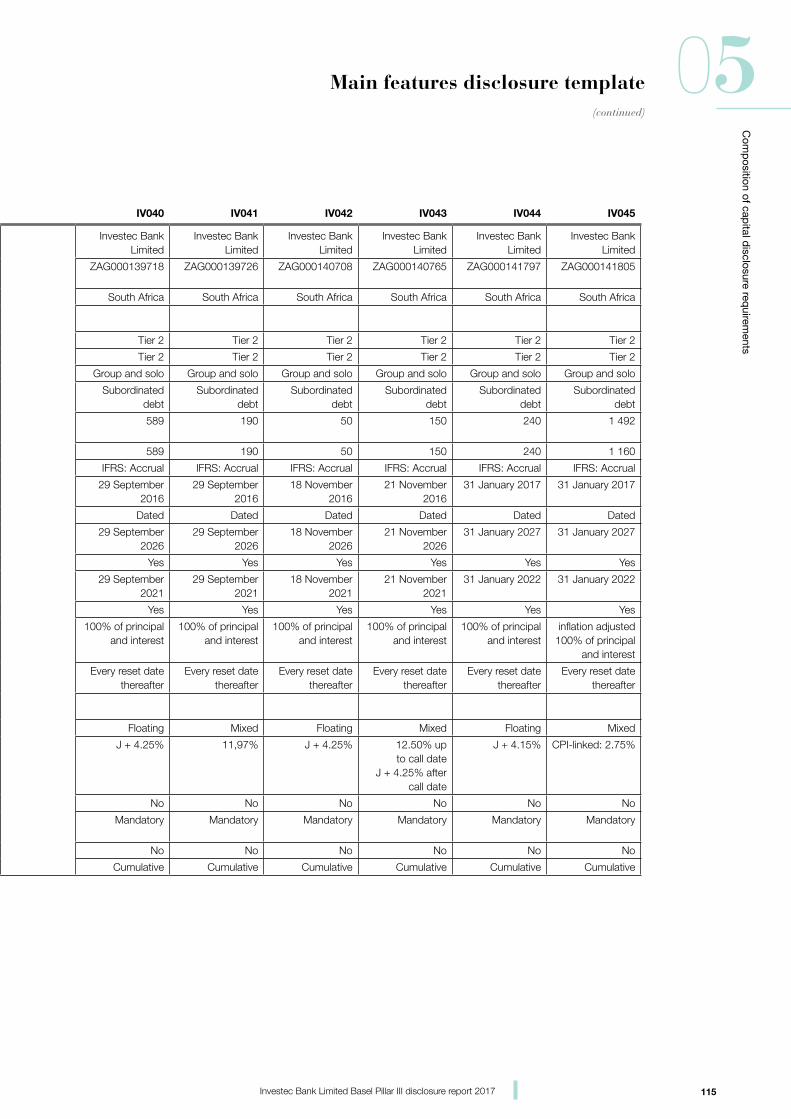
115
Com
position of cap
ital disclosure req
uirements
05(continued)
Investec Bank Limited Basel Pillar III disclosure report 2017
Main features disclosure template
Disclosure template for main features of regulatory capital instruments (continued)
At 31 March 2017 IV036 IV037 IV038 IV039 IV040 IV041 IV042 IV043 IV044 IV045
1 Issuer Investec Bank Limited
Investec Bank Limited
Investec Bank Limited
Investec Bank Limited
Investec Bank Limited
Investec Bank Limited
Investec Bank Limited
Investec Bank Limited
Investec Bank Limited
Investec Bank Limited
2 Unique identifier (e.g. CUSIP, ISIN or Bloomberg identifier for private placement)
ZAG000135526 Unlisted ZAG000139593 ZAG000139700 ZAG000139718 ZAG000139726 ZAG000140708 ZAG000140765 ZAG000141797 ZAG000141805
3 Governing law(s) of the instrument South Africa South Africa South Africa South Africa South Africa South Africa South Africa South Africa South Africa South Africa
Regulatory treatment
4 Transitional Basel III rules Tier 2 Tier 2 Tier 2 Tier 2 Tier 2 Tier 2 Tier 2 Tier 2 Tier 2 Tier 2
5 Post-transitional Basel III rules Tier 2 Tier 2 Tier 2 Tier 2 Tier 2 Tier 2 Tier 2 Tier 2 Tier 2 Tier 2
6 Eligible at solo/group/group and solo Group and solo Group and solo Group and solo Group and solo Group and solo Group and solo Group and solo Group and solo Group and solo Group and solo
7 Instrument type (types to be specified by each jurisdiction)
Subordinated debt
Subordinated debt
Subordinated debt
Subordinated debt
Subordinated debt
Subordinated debt
Subordinated debt
Subordinated debt
Subordinated debt
Subordinated debt
8 Amount recognised in regulatory capital (Currency in mil, as of most recent reporting date)1
32 1 254 350 154 589 190 50 150 240 1 492
9 Par value of instrument 32 1 776 350 119 589 190 50 150 240 1 160
10 Accounting classification IFRS: Accrual IFRS: Accrual IFRS: Accrual IFRS: Accrual IFRS: Accrual IFRS: Accrual IFRS: Accrual IFRS: Accrual IFRS: Accrual IFRS: Accrual
11 Original date of issuance 22 April 2016 19 October 2016 23 September 2016
29 September 2016
29 September 2016
29 September 2016
18 November 2016
21 November 2016
31 January 2017 31 January 2017
12 Perpetual or dated Dated Dated Dated Dated Dated Dated Dated Dated Dated Dated
13 Original maturity date 22 July 2026 19 October 2026 23 September 2026
31 January 2027 29 September 2026
29 September 2026
18 November 2026
21 November 2026
31 January 2027 31 January 2027
14 Issuer call subject to prior supervisory approval Yes Yes Yes Yes Yes Yes Yes Yes Yes Yes
15 Optional call date, contingent call dates and redemption amount
22 July 2021 19 October 2021 23 September 2021
31 January 2022 29 September 2021
29 September 2021
18 November 2021
21 November 2021
31 January 2022 31 January 2022
Tax and/or regulatory event Yes Yes Yes Yes Yes Yes Yes Yes Yes Yes
Redemption amount 100% of principal and interest
100% of principal and interest
100% of principal and interest
inflation adjusted 100% of principal
and interest
100% of principal and interest
100% of principal and interest
100% of principal and interest
100% of principal and interest
100% of principal and interest
inflation adjusted 100% of principal
and interest
16 Subsequent call date, if applicable Every reset date thereafter
Every reset date thereafter
Every reset date thereafter
Every reset date thereafter
Every reset date thereafter
Every reset date thereafter
Every reset date thereafter
Every reset date thereafter
Every reset date thereafter
Every reset date thereafter
Coupons/dividends
17 Fixed or floating dividend coupon Floating Mixed Floating Mixed Floating Mixed Floating Mixed Floating Mixed
18 Coupon rate and any related index JIBAR + 4.25% LIBOR + 5.5% JIBAR + 4.25% CPI-linked: 2.75% J + 4.25% 11,97% J + 4.25% 12.50% up to call date
J + 4.25% after call date
J + 4.15% CPI-linked: 2.75%
19 Existence of a dividend stopper No No No No No No No No No No
20 Fully discretionary, partially discretionary or mandatory
Mandatory Mandatory Mandatory Mandatory Mandatory Mandatory Mandatory Mandatory Mandatory Mandatory
21 Existence of step up or other incentive to redeem No No No No No No No No No No
22 Non-cumulative or cumulative Cumulative Cumulative Cumulative Cumulative Cumulative Cumulative Cumulative Cumulative Cumulative Cumulative
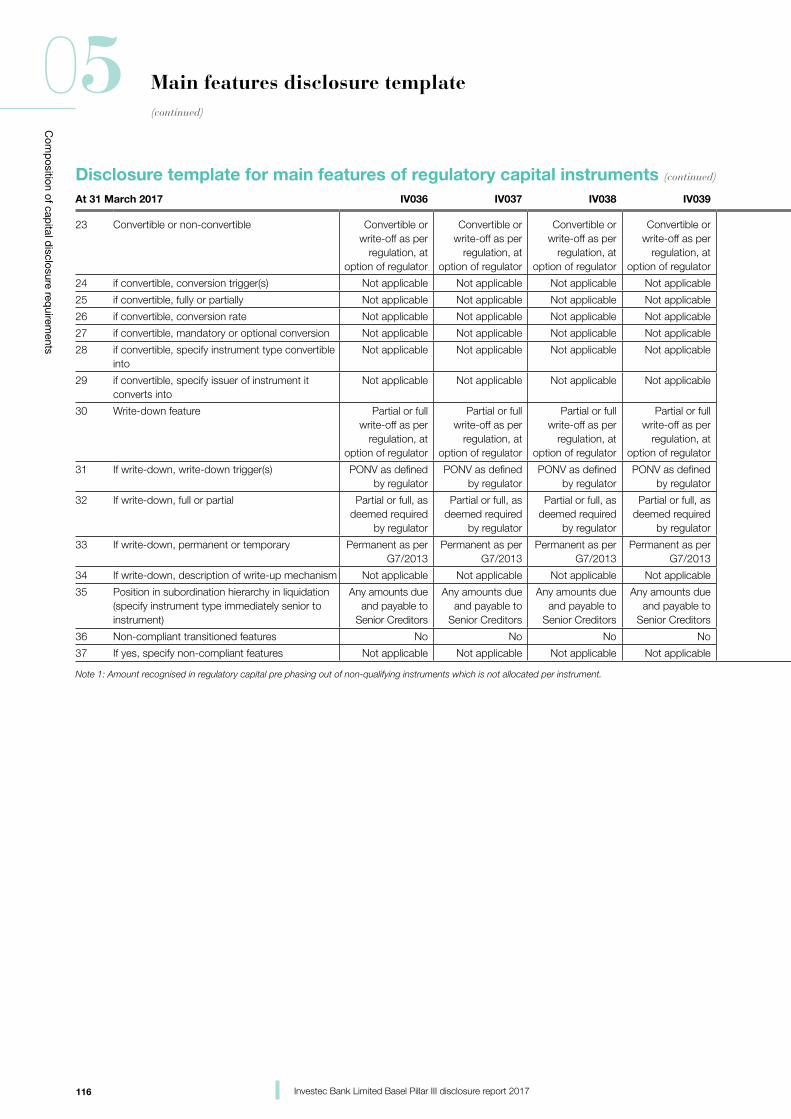
116
Com
position of cap
ital disclosure req
uirements
05(continued)
Investec Bank Limited Basel Pillar III disclosure report 2017
Disclosure template for main features of regulatory capital instruments (continued)
Main features disclosure template
At 31 March 2017 IV036 IV037 IV038 IV039 IV040 IV041 IV042 IV043 IV044 IV045
23 Convertible or non-convertible Convertible or write-off as per
regulation, at option of regulator
Convertible or write-off as per
regulation, at option of regulator
Convertible or write-off as per
regulation, at option of regulator
Convertible or write-off as per
regulation, at option of regulator
Convertible or write-off as per
regulation, at option of regulator
Convertible or write-off as per
regulation, at option of regulator
Convertible or write-off as per
regulation, at option of regulator
Convertible or write-off as per
regulation, at option of regulator
Convertible or write-off as per
regulation, at option of regulator
Convertible or write-off as per
regulation, at option of regulator
24 if convertible, conversion trigger(s) Not applicable Not applicable Not applicable Not applicable Not applicable Not applicable Not applicable Not applicable Not applicable Not applicable
25 if convertible, fully or partially Not applicable Not applicable Not applicable Not applicable Not applicable Not applicable Not applicable Not applicable Not applicable Not applicable
26 if convertible, conversion rate Not applicable Not applicable Not applicable Not applicable Not applicable Not applicable Not applicable Not applicable Not applicable Not applicable
27 if convertible, mandatory or optional conversion Not applicable Not applicable Not applicable Not applicable Not applicable Not applicable Not applicable Not applicable Not applicable Not applicable
28 if convertible, specify instrument type convertible into
Not applicable Not applicable Not applicable Not applicable Not applicable Not applicable Not applicable Not applicable Not applicable Not applicable
29 if convertible, specify issuer of instrument it converts into
Not applicable Not applicable Not applicable Not applicable Not applicable Not applicable Not applicable Not applicable Not applicable Not applicable
30 Write-down feature Partial or full write-off as per
regulation, at option of regulator
Partial or full write-off as per
regulation, at option of regulator
Partial or full write-off as per
regulation, at option of regulator
Partial or full write-off as per
regulation, at option of regulator
Partial or full write-off as per
regulation, at option of regulator
Partial or full write-off as per
regulation, at option of regulator
Partial or full write-off as per
regulation, at option of regulator
Partial or full write-off as per
regulation, at option of regulator
Partial or full write-off as per
regulation, at option of regulator
Partial or full write-off as per
regulation, at option of regulator
31 If write-down, write-down trigger(s) PONV as defined by regulator
PONV as defined by regulator
PONV as defined by regulator
PONV as defined by regulator
PONV as defined by regulator
PONV as defined by regulator
PONV as defined by regulator
PONV as defined by regulator
PONV as defined by regulator
PONV as defined by regulator
32 If write-down, full or partial Partial or full, as deemed required
by regulator
Partial or full, as deemed required
by regulator
Partial or full, as deemed required
by regulator
Partial or full, as deemed required
by regulator
Partial or full, as deemed required
by regulator
Partial or full, as deemed required
by regulator
Partial or full, as deemed required
by regulator
Partial or full, as deemed required
by regulator
Partial or full, as deemed required
by regulator
Partial or full, as deemed required
by regulator
33 If write-down, permanent or temporary Permanent as per G7/2013
Permanent as per G7/2013
Permanent as per G7/2013
Permanent as per G7/2013
Permanent as per G7/2013
Permanent as per G7/2013
Permanent as per G7/2013
Permanent as per G7/2013
Permanent as per G7/2013
Permanent as per G7/2013
34 If write-down, description of write-up mechanism Not applicable Not applicable Not applicable Not applicable Not applicable Not applicable Not applicable Not applicable Not applicable Not applicable
35 Position in subordination hierarchy in liquidation (specify instrument type immediately senior to instrument)
Any amounts due and payable to
Senior Creditors
Any amounts due and payable to
Senior Creditors
Any amounts due and payable to
Senior Creditors
Any amounts due and payable to
Senior Creditors
Any amounts due and payable to
Senior Creditors
Any amounts due and payable to
Senior Creditors
Any amounts due and payable to
Senior Creditors
Any amounts due and payable to
Senior Creditors
Any amounts due and payable to
Senior Creditors
Any amounts due and payable to
Senior Creditors
36 Non-compliant transitioned features No No No No No No No No No No
37 If yes, specify non-compliant features Not applicable Not applicable Not applicable Not applicable Not applicable Not applicable Not applicable Not applicable Not applicable Not applicable
Note 1: Amount recognised in regulatory capital pre phasing out of non-qualifying instruments which is not allocated per instrument.
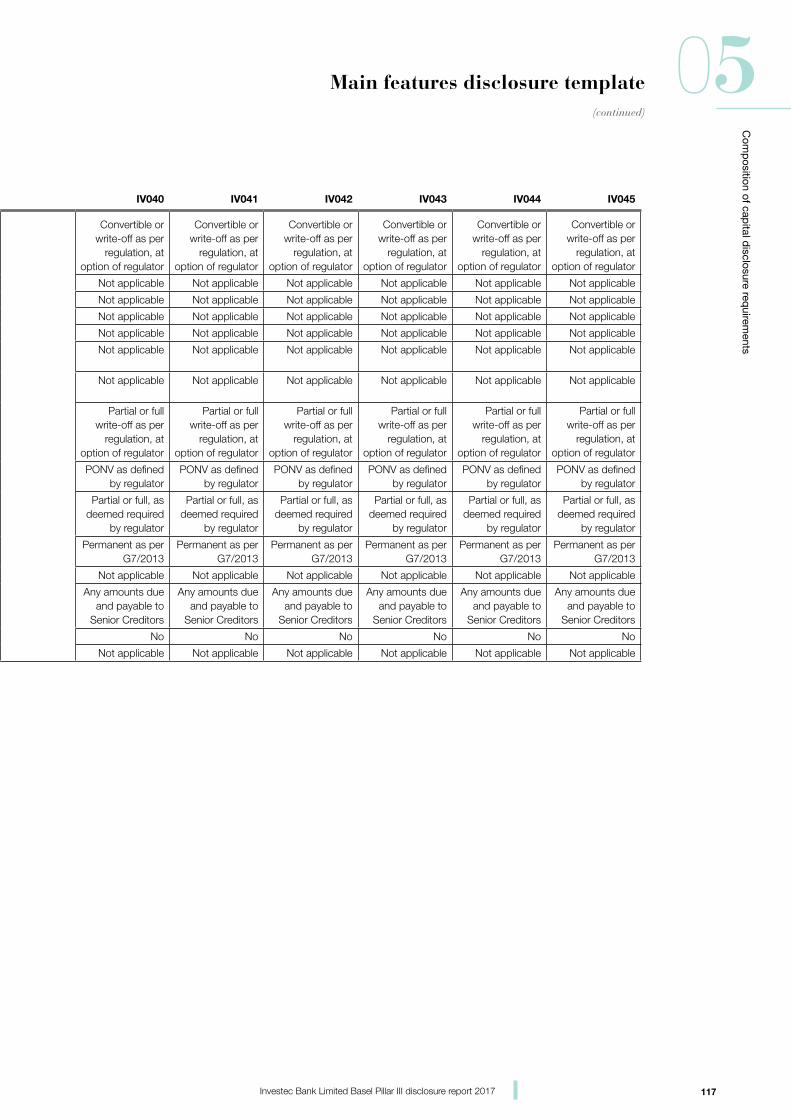
117
Com
position of cap
ital disclosure req
uirements
05(continued)
Investec Bank Limited Basel Pillar III disclosure report 2017
Disclosure template for main features of regulatory capital instruments (continued)
Main features disclosure template
At 31 March 2017 IV036 IV037 IV038 IV039 IV040 IV041 IV042 IV043 IV044 IV045
23 Convertible or non-convertible Convertible or write-off as per
regulation, at option of regulator
Convertible or write-off as per
regulation, at option of regulator
Convertible or write-off as per
regulation, at option of regulator
Convertible or write-off as per
regulation, at option of regulator
Convertible or write-off as per
regulation, at option of regulator
Convertible or write-off as per
regulation, at option of regulator
Convertible or write-off as per
regulation, at option of regulator
Convertible or write-off as per
regulation, at option of regulator
Convertible or write-off as per
regulation, at option of regulator
Convertible or write-off as per
regulation, at option of regulator
24 if convertible, conversion trigger(s) Not applicable Not applicable Not applicable Not applicable Not applicable Not applicable Not applicable Not applicable Not applicable Not applicable
25 if convertible, fully or partially Not applicable Not applicable Not applicable Not applicable Not applicable Not applicable Not applicable Not applicable Not applicable Not applicable
26 if convertible, conversion rate Not applicable Not applicable Not applicable Not applicable Not applicable Not applicable Not applicable Not applicable Not applicable Not applicable
27 if convertible, mandatory or optional conversion Not applicable Not applicable Not applicable Not applicable Not applicable Not applicable Not applicable Not applicable Not applicable Not applicable
28 if convertible, specify instrument type convertible into
Not applicable Not applicable Not applicable Not applicable Not applicable Not applicable Not applicable Not applicable Not applicable Not applicable
29 if convertible, specify issuer of instrument it converts into
Not applicable Not applicable Not applicable Not applicable Not applicable Not applicable Not applicable Not applicable Not applicable Not applicable
30 Write-down feature Partial or full write-off as per
regulation, at option of regulator
Partial or full write-off as per
regulation, at option of regulator
Partial or full write-off as per
regulation, at option of regulator
Partial or full write-off as per
regulation, at option of regulator
Partial or full write-off as per
regulation, at option of regulator
Partial or full write-off as per
regulation, at option of regulator
Partial or full write-off as per
regulation, at option of regulator
Partial or full write-off as per
regulation, at option of regulator
Partial or full write-off as per
regulation, at option of regulator
Partial or full write-off as per
regulation, at option of regulator
31 If write-down, write-down trigger(s) PONV as defined by regulator
PONV as defined by regulator
PONV as defined by regulator
PONV as defined by regulator
PONV as defined by regulator
PONV as defined by regulator
PONV as defined by regulator
PONV as defined by regulator
PONV as defined by regulator
PONV as defined by regulator
32 If write-down, full or partial Partial or full, as deemed required
by regulator
Partial or full, as deemed required
by regulator
Partial or full, as deemed required
by regulator
Partial or full, as deemed required
by regulator
Partial or full, as deemed required
by regulator
Partial or full, as deemed required
by regulator
Partial or full, as deemed required
by regulator
Partial or full, as deemed required
by regulator
Partial or full, as deemed required
by regulator
Partial or full, as deemed required
by regulator
33 If write-down, permanent or temporary Permanent as per G7/2013
Permanent as per G7/2013
Permanent as per G7/2013
Permanent as per G7/2013
Permanent as per G7/2013
Permanent as per G7/2013
Permanent as per G7/2013
Permanent as per G7/2013
Permanent as per G7/2013
Permanent as per G7/2013
34 If write-down, description of write-up mechanism Not applicable Not applicable Not applicable Not applicable Not applicable Not applicable Not applicable Not applicable Not applicable Not applicable
35 Position in subordination hierarchy in liquidation (specify instrument type immediately senior to instrument)
Any amounts due and payable to
Senior Creditors
Any amounts due and payable to
Senior Creditors
Any amounts due and payable to
Senior Creditors
Any amounts due and payable to
Senior Creditors
Any amounts due and payable to
Senior Creditors
Any amounts due and payable to
Senior Creditors
Any amounts due and payable to
Senior Creditors
Any amounts due and payable to
Senior Creditors
Any amounts due and payable to
Senior Creditors
Any amounts due and payable to
Senior Creditors
36 Non-compliant transitioned features No No No No No No No No No No
37 If yes, specify non-compliant features Not applicable Not applicable Not applicable Not applicable Not applicable Not applicable Not applicable Not applicable Not applicable Not applicable
Note 1: Amount recognised in regulatory capital pre phasing out of non-qualifying instruments which is not allocated per instrument.

06 Annexure
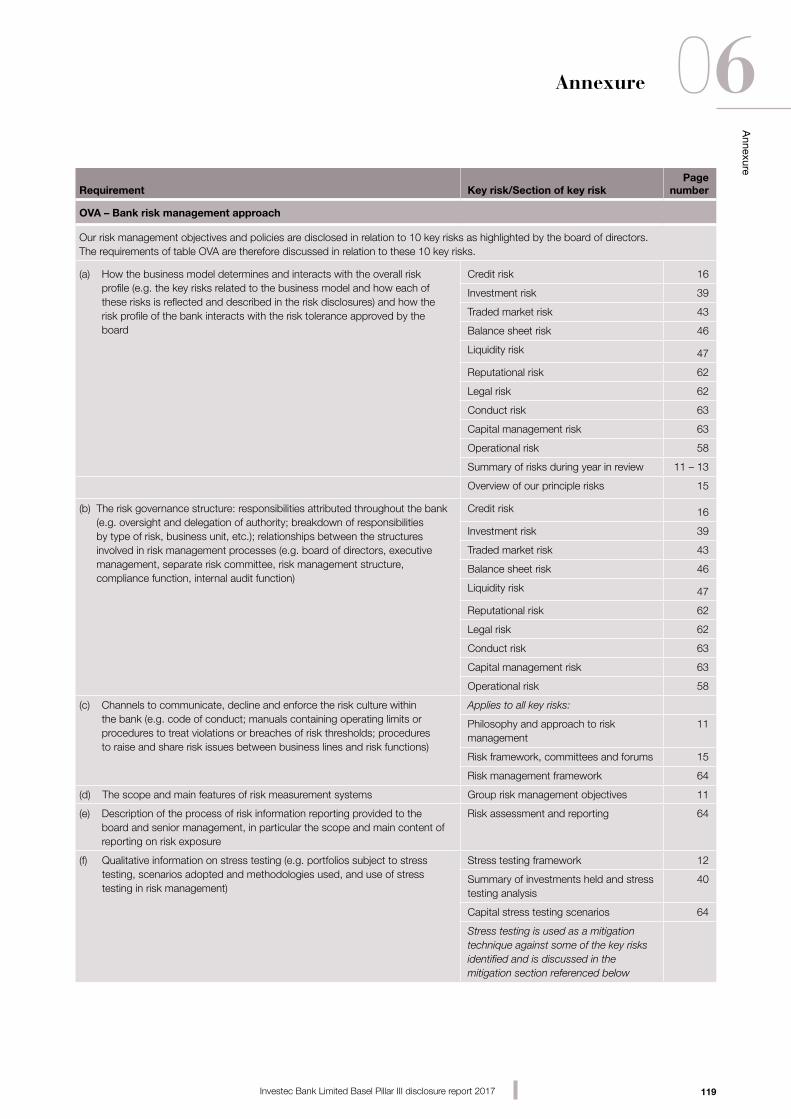
119
Annexure
06
Investec Bank Limited Basel Pillar III disclosure report 2017
Annexure
Requirement Key risk/Section of key riskPage
number
OVA – Bank risk management approach
Our risk management objectives and policies are disclosed in relation to 10 key risks as highlighted by the board of directors. The requirements of table OVA are therefore discussed in relation to these 10 key risks.
(a) How the business model determines and interacts with the overall risk profile (e.g. the key risks related to the business model and how each of these risks is reflected and described in the risk disclosures) and how the risk profile of the bank interacts with the risk tolerance approved by the board
Credit risk 16
Investment risk 39
Traded market risk 43
Balance sheet risk 46
Liquidity risk 47
Reputational risk 62
Legal risk 62
Conduct risk 63
Capital management risk 63
Operational risk 58
Summary of risks during year in review 11 – 13
Overview of our principle risks 15
(b) The risk governance structure: responsibilities attributed throughout the bank (e.g. oversight and delegation of authority; breakdown of responsibilities by type of risk, business unit, etc.); relationships between the structures involved in risk management processes (e.g. board of directors, executive management, separate risk committee, risk management structure, compliance function, internal audit function)
Credit risk 16
Investment risk 39
Traded market risk 43
Balance sheet risk 46
Liquidity risk 47
Reputational risk 62
Legal risk 62
Conduct risk 63
Capital management risk 63
Operational risk 58
(c) Channels to communicate, decline and enforce the risk culture within the bank (e.g. code of conduct; manuals containing operating limits or procedures to treat violations or breaches of risk thresholds; procedures to raise and share risk issues between business lines and risk functions)
Applies to all key risks:
Philosophy and approach to risk management
11
Risk framework, committees and forums 15
Risk management framework 64
(d) The scope and main features of risk measurement systems Group risk management objectives 11
(e) Description of the process of risk information reporting provided to the board and senior management, in particular the scope and main content of reporting on risk exposure
Risk assessment and reporting 64
(f) Qualitative information on stress testing (e.g. portfolios subject to stress testing, scenarios adopted and methodologies used, and use of stress testing in risk management)
Stress testing framework 12
Summary of investments held and stress testing analysis
40
Capital stress testing scenarios 64
Stress testing is used as a mitigation technique against some of the key risks identified and is discussed in the mitigation section referenced below
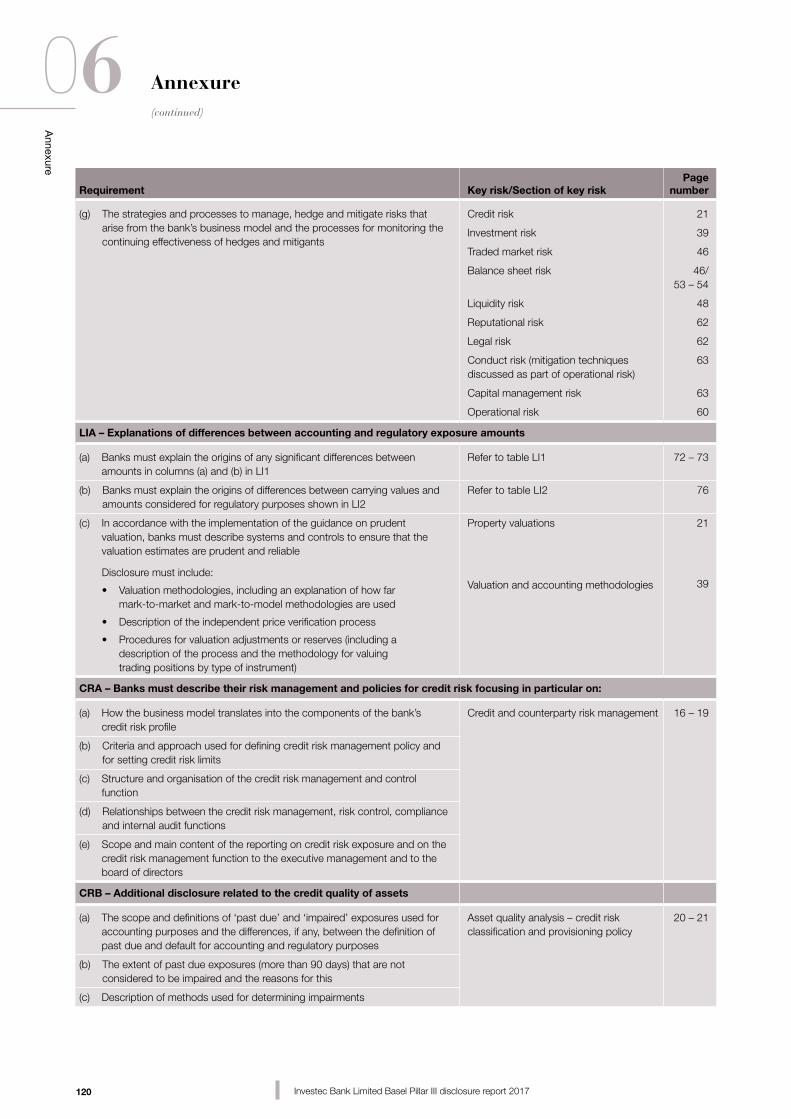
120
Annexure
06(continued)
Investec Bank Limited Basel Pillar III disclosure report 2017
Requirement Key risk/Section of key riskPage
number
(g) The strategies and processes to manage, hedge and mitigate risks that arise from the bank’s business model and the processes for monitoring the continuing effectiveness of hedges and mitigants
Credit risk 21
Investment risk 39
Traded market risk 46
Balance sheet risk 46/ 53 – 54
Liquidity risk 48
Reputational risk 62
Legal risk 62
Conduct risk (mitigation techniques discussed as part of operational risk)
63
Capital management risk 63
Operational risk 60
LIA – Explanations of differences between accounting and regulatory exposure amounts
(a) Banks must explain the origins of any significant differences between amounts in columns (a) and (b) in LI1
Refer to table LI1 72 – 73
(b) Banks must explain the origins of differences between carrying values and amounts considered for regulatory purposes shown in LI2
Refer to table LI2 76
(c) In accordance with the implementation of the guidance on prudent valuation, banks must describe systems and controls to ensure that the valuation estimates are prudent and reliable
Disclosure must include:
•Valuationmethodologies,includinganexplanationofhowfar mark-to-market and mark-to-model methodologies are used
•Descriptionoftheindependentpriceverificationprocess
•Proceduresforvaluationadjustmentsorreserves(includingadescription of the process and the methodology for valuing trading positions by type of instrument)
Property valuations
Valuation and accounting methodologies
21
39
CRA – Banks must describe their risk management and policies for credit risk focusing in particular on:
(a) How the business model translates into the components of the bank’s credit risk profile
Credit and counterparty risk management 16 – 19
(b) Criteria and approach used for defining credit risk management policy and for setting credit risk limits
(c) Structure and organisation of the credit risk management and control function
(d) Relationships between the credit risk management, risk control, compliance and internal audit functions
(e) Scope and main content of the reporting on credit risk exposure and on the credit risk management function to the executive management and to the board of directors
CRB – Additional disclosure related to the credit quality of assets
(a) The scope and definitions of ‘past due’ and ‘impaired’ exposures used for accounting purposes and the differences, if any, between the definition of past due and default for accounting and regulatory purposes
Asset quality analysis – credit risk classification and provisioning policy
20 – 21
(b) The extent of past due exposures (more than 90 days) that are not considered to be impaired and the reasons for this
(c) Description of methods used for determining impairments
Annexure
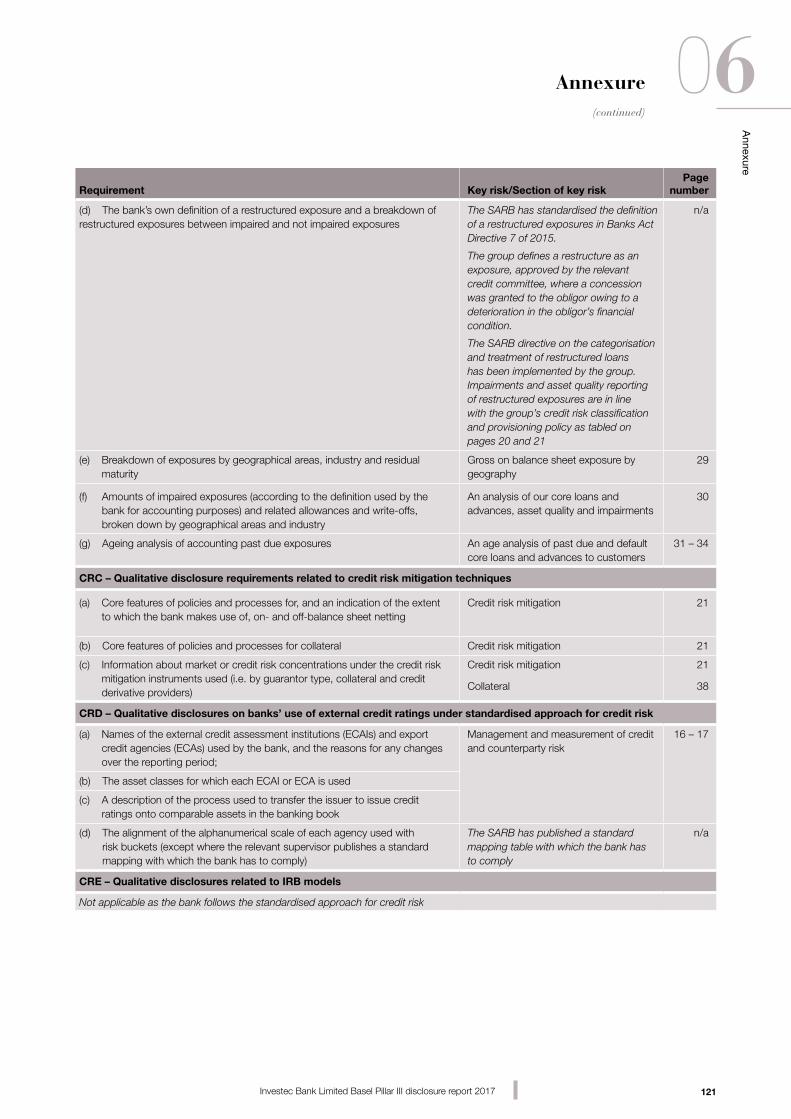
121
Annexure
06(continued)
Investec Bank Limited Basel Pillar III disclosure report 2017
Annexure
Requirement Key risk/Section of key riskPage
number
(d) The bank’s own definition of a restructured exposure and a breakdown of restructured exposures between impaired and not impaired exposures
The SARB has standardised the definition of a restructured exposures in Banks Act Directive 7 of 2015.
The group defines a restructure as an exposure, approved by the relevant credit committee, where a concession was granted to the obligor owing to a deterioration in the obligor’s financial condition.
The SARB directive on the categorisation and treatment of restructured loans has been implemented by the group. Impairments and asset quality reporting of restructured exposures are in line with the group’s credit risk classification and provisioning policy as tabled on pages 20 and 21
n/a
(e) Breakdown of exposures by geographical areas, industry and residual maturity
Gross on balance sheet exposure by geography
29
(f) Amounts of impaired exposures (according to the definition used by the bank for accounting purposes) and related allowances and write-offs, broken down by geographical areas and industry
An analysis of our core loans and advances, asset quality and impairments
30
(g) Ageing analysis of accounting past due exposures An age analysis of past due and default core loans and advances to customers
31 – 34
CRC – Qualitative disclosure requirements related to credit risk mitigation techniques
(a) Core features of policies and processes for, and an indication of the extent to which the bank makes use of, on- and off-balance sheet netting
Credit risk mitigation 21
(b) Core features of policies and processes for collateral Credit risk mitigation 21
(c) Information about market or credit risk concentrations under the credit risk mitigation instruments used (i.e. by guarantor type, collateral and credit derivative providers)
Credit risk mitigation
Collateral
21
38
CRD – Qualitative disclosures on banks’ use of external credit ratings under standardised approach for credit risk
(a) Names of the external credit assessment institutions (ECAIs) and export credit agencies (ECAs) used by the bank, and the reasons for any changes over the reporting period;
Management and measurement of credit and counterparty risk
16 – 17
(b) The asset classes for which each ECAI or ECA is used
(c) A description of the process used to transfer the issuer to issue credit ratings onto comparable assets in the banking book
(d) The alignment of the alphanumerical scale of each agency used with risk buckets (except where the relevant supervisor publishes a standard mapping with which the bank has to comply)
The SARB has published a standard mapping table with which the bank has to comply
n/a
CRE – Qualitative disclosures related to IRB models
Not applicable as the bank follows the standardised approach for credit risk
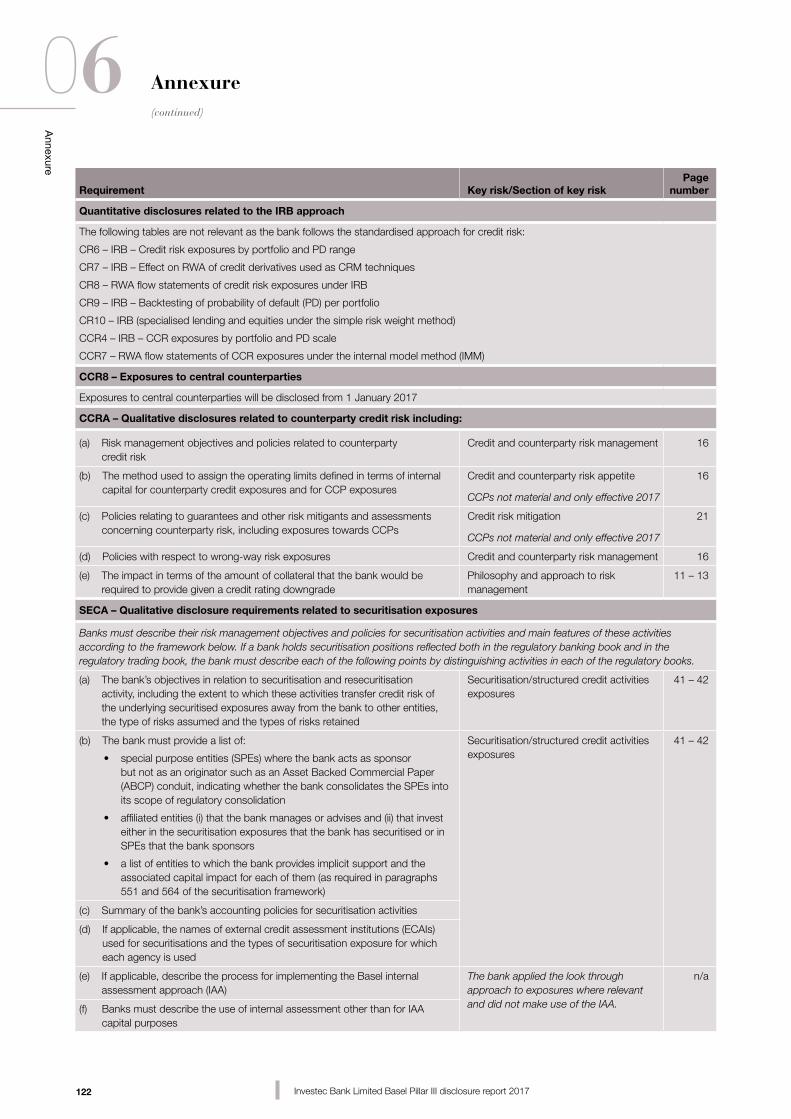
122
Annexure
06(continued)
Investec Bank Limited Basel Pillar III disclosure report 2017
Requirement Key risk/Section of key riskPage
number
Quantitative disclosures related to the IRB approach
The following tables are not relevant as the bank follows the standardised approach for credit risk:
CR6 – IRB – Credit risk exposures by portfolio and PD range
CR7 – IRB – Effect on RWA of credit derivatives used as CRM techniques
CR8 – RWA flow statements of credit risk exposures under IRB
CR9 – IRB – Backtesting of probability of default (PD) per portfolio
CR10 – IRB (specialised lending and equities under the simple risk weight method)
CCR4 – IRB – CCR exposures by portfolio and PD scale
CCR7 – RWA flow statements of CCR exposures under the internal model method (IMM)
CCR8 – Exposures to central counterparties
Exposures to central counterparties will be disclosed from 1 January 2017
CCRA – Qualitative disclosures related to counterparty credit risk including:
(a) Risk management objectives and policies related to counterparty credit risk
Credit and counterparty risk management 16
(b) The method used to assign the operating limits defined in terms of internal capital for counterparty credit exposures and for CCP exposures
Credit and counterparty risk appetite
CCPs not material and only effective 2017
16
(c) Policies relating to guarantees and other risk mitigants and assessments concerning counterparty risk, including exposures towards CCPs
Credit risk mitigation
CCPs not material and only effective 2017
21
(d) Policies with respect to wrong-way risk exposures Credit and counterparty risk management 16
(e) The impact in terms of the amount of collateral that the bank would be required to provide given a credit rating downgrade
Philosophy and approach to risk management
11 – 13
SECA – Qualitative disclosure requirements related to securitisation exposures
Banks must describe their risk management objectives and policies for securitisation activities and main features of these activities according to the framework below. If a bank holds securitisation positions reflected both in the regulatory banking book and in the regulatory trading book, the bank must describe each of the following points by distinguishing activities in each of the regulatory books.
(a) The bank’s objectives in relation to securitisation and resecuritisation activity, including the extent to which these activities transfer credit risk of the underlying securitised exposures away from the bank to other entities, the type of risks assumed and the types of risks retained
Securitisation/structured credit activities exposures
41 – 42
(b) The bank must provide a list of:
•specialpurposeentities(SPEs)wherethebankactsassponsor but not as an originator such as an Asset Backed Commercial Paper (ABCP) conduit, indicating whether the bank consolidates the SPEs into its scope of regulatory consolidation
•affiliatedentities(i)thatthebankmanagesoradvisesand(ii)thatinvesteither in the securitisation exposures that the bank has securitised or in SPEs that the bank sponsors
•alistofentitiestowhichthebankprovidesimplicitsupportandtheassociated capital impact for each of them (as required in paragraphs 551 and 564 of the securitisation framework)
Securitisation/structured credit activities exposures
41 – 42
(c) Summary of the bank’s accounting policies for securitisation activities
(d) If applicable, the names of external credit assessment institutions (ECAIs) used for securitisations and the types of securitisation exposure for which each agency is used
(e) If applicable, describe the process for implementing the Basel internal assessment approach (IAA)
The bank applied the look through approach to exposures where relevant and did not make use of the IAA.
n/a
(f) Banks must describe the use of internal assessment other than for IAA capital purposes
Annexure
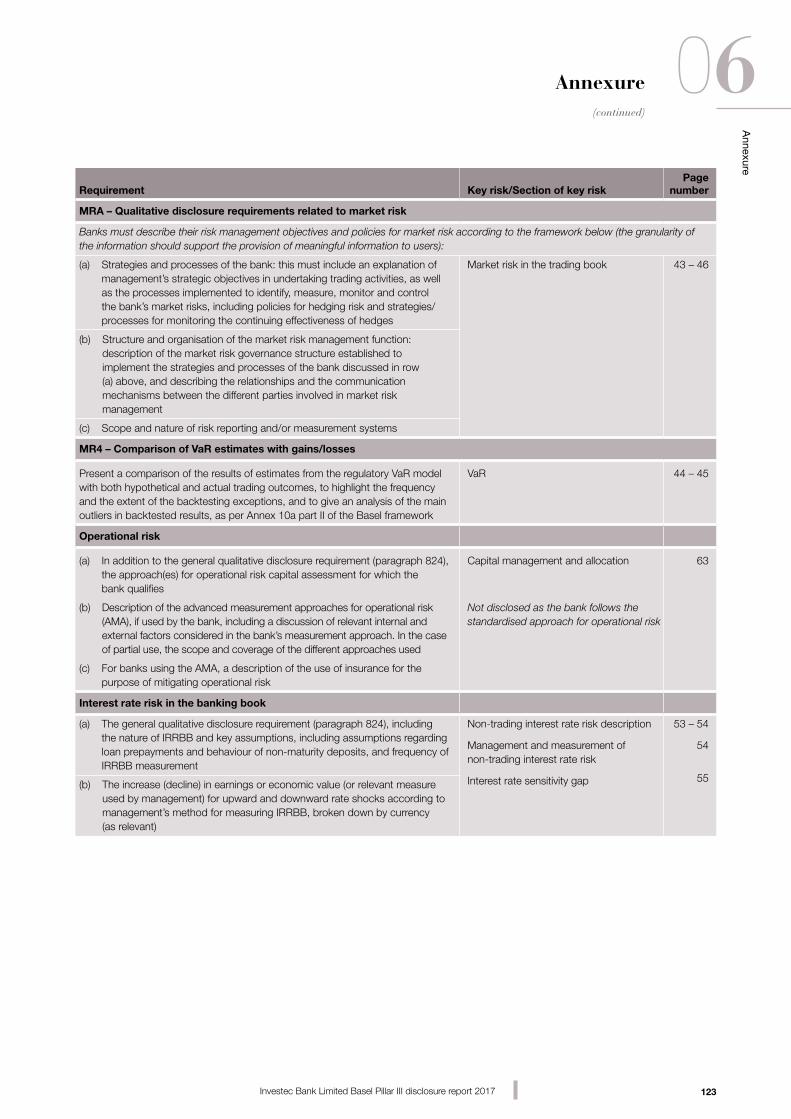
123
Annexure
06(continued)
Investec Bank Limited Basel Pillar III disclosure report 2017
Annexure
Requirement Key risk/Section of key riskPage
number
MRA – Qualitative disclosure requirements related to market risk
Banks must describe their risk management objectives and policies for market risk according to the framework below (the granularity of the information should support the provision of meaningful information to users):
(a) Strategies and processes of the bank: this must include an explanation of management’s strategic objectives in undertaking trading activities, as well as the processes implemented to identify, measure, monitor and control the bank’s market risks, including policies for hedging risk and strategies/processes for monitoring the continuing effectiveness of hedges
Market risk in the trading book 43 – 46
(b) Structure and organisation of the market risk management function: description of the market risk governance structure established to implement the strategies and processes of the bank discussed in row (a) above, and describing the relationships and the communication mechanisms between the different parties involved in market risk management
(c) Scope and nature of risk reporting and/or measurement systems
MR4 – Comparison of VaR estimates with gains/losses
Present a comparison of the results of estimates from the regulatory VaR model with both hypothetical and actual trading outcomes, to highlight the frequency and the extent of the backtesting exceptions, and to give an analysis of the main outliers in backtested results, as per Annex 10a part II of the Basel framework
VaR 44 – 45
Operational risk
(a) In addition to the general qualitative disclosure requirement (paragraph 824), the approach(es) for operational risk capital assessment for which the bank qualifies
Capital management and allocation 63
(b) Description of the advanced measurement approaches for operational risk (AMA), if used by the bank, including a discussion of relevant internal and external factors considered in the bank’s measurement approach. In the case of partial use, the scope and coverage of the different approaches used
Not disclosed as the bank follows the standardised approach for operational risk
(c) For banks using the AMA, a description of the use of insurance for the purpose of mitigating operational risk
Interest rate risk in the banking book
(a) The general qualitative disclosure requirement (paragraph 824), including the nature of IRRBB and key assumptions, including assumptions regarding loan prepayments and behaviour of non-maturity deposits, and frequency of IRRBB measurement
Non-trading interest rate risk description
Management and measurement of non-trading interest rate risk
Interest rate sensitivity gap
53 – 54
54
55(b) The increase (decline) in earnings or economic value (or relevant measure
used by management) for upward and downward rate shocks according to management’s method for measuring IRRBB, broken down by currency (as relevant)

2016Investec sustainability report
Specialist Banking Asset Management Wealth & Investment
2016SUSTAINABILITY REPORT