Embed Size (px)
DESCRIPTION
Annual Report Jessica Howarth ACG 2021-080. Executive Summary. Tiffany & Co. experienced a modest growth in sales and earnings during 2002. http://www.shareholder.com/tiffany/annual.cfm. Part A. Introduction. CEO: Michael J. Kowalski Home Office: 727 5 th Ave, NYC - PowerPoint PPT Presentation
Citation preview
Annual Annual ReportReport
Jessica HowarthJessica Howarth
ACG 2021-080ACG 2021-080
Executive SummaryExecutive Summary Tiffany & Co. experienced a modest Tiffany & Co. experienced a modest
growth in sales and earnings during 2002.growth in sales and earnings during 2002. http://www.shareholder.com/tiffany/http://www.shareholder.com/tiffany/
annual.cfmannual.cfm
Part A. IntroductionPart A. Introduction CEO: Michael J. KowalskiCEO: Michael J. Kowalski Home Office: 727 5Home Office: 727 5thth Ave, NYC Ave, NYC Recent end of Fiscal Year: January 31, 2002Recent end of Fiscal Year: January 31, 2002 Products: fine jewelry (80% of fiscal 2002 Products: fine jewelry (80% of fiscal 2002
sales), timepieces, sterling silverware, sales), timepieces, sterling silverware, china, crystal, stationary, fragranceschina, crystal, stationary, fragrances
Areas of Business: US 59%, Japan 26%, Areas of Business: US 59%, Japan 26%, other Asia-Pacific 6%, Europe 5%, other 4% other Asia-Pacific 6%, Europe 5%, other 4% (percentages based on net sales for 2002)(percentages based on net sales for 2002)
Part A. Audit ReportPart A. Audit Report Independent Auditors:Independent Auditors:
PricewaterhouseCoopers PricewaterhouseCoopers LLPLLP
The independent auditors The independent auditors for Tiffany & Co. state that for Tiffany & Co. state that all financial information has all financial information has been presented fairly and is been presented fairly and is in conformity with generally in conformity with generally accepted accounting accepted accounting principles in the US. principles in the US.
Part A. Stock Market Part A. Stock Market InformationInformation
Most recent price of stock: $39.64Most recent price of stock: $39.64 12 month trading range: $19.40-$41.0012 month trading range: $19.40-$41.00 Dividend per Share: $.16Dividend per Share: $.16 Date of Information: January 31, 2002Date of Information: January 31, 2002 In my opinion, it would be best for stockholders In my opinion, it would be best for stockholders
to sell their stock because at $39.64 per share, to sell their stock because at $39.64 per share, the stock is only $.36 away from its 12 month the stock is only $.36 away from its 12 month high. The value of the stock is more likely to high. The value of the stock is more likely to decrease than increase any substantial decrease than increase any substantial amount.amount.
Part B. Industry Situation Part B. Industry Situation and Company Plansand Company Plans
The Company Profile lists four key growth strategiesThe Company Profile lists four key growth strategies::
1) expand channels of distribution in important markets around the 1) expand channels of distribution in important markets around the worldworld2) compliment existing products with active product development 2) compliment existing products with active product development programsprograms3) enhance customer awareness of product design, quality, and 3) enhance customer awareness of product design, quality, and value offered by Tiffany’s through its marketing programsvalue offered by Tiffany’s through its marketing programs4) provide customer service that ensures a superior shopping 4) provide customer service that ensures a superior shopping experienceexperience
The Letter to the Stockholders states that the future of The Letter to the Stockholders states that the future of Tiffany’s continues to base its confidence in its “proven, Tiffany’s continues to base its confidence in its “proven, disciplined approach to long-term development.” During disciplined approach to long-term development.” During 2002, Tiffany & Co. strengthened its infrastructure and 2002, Tiffany & Co. strengthened its infrastructure and building capacity that will enable it to support future building capacity that will enable it to support future growth.growth.
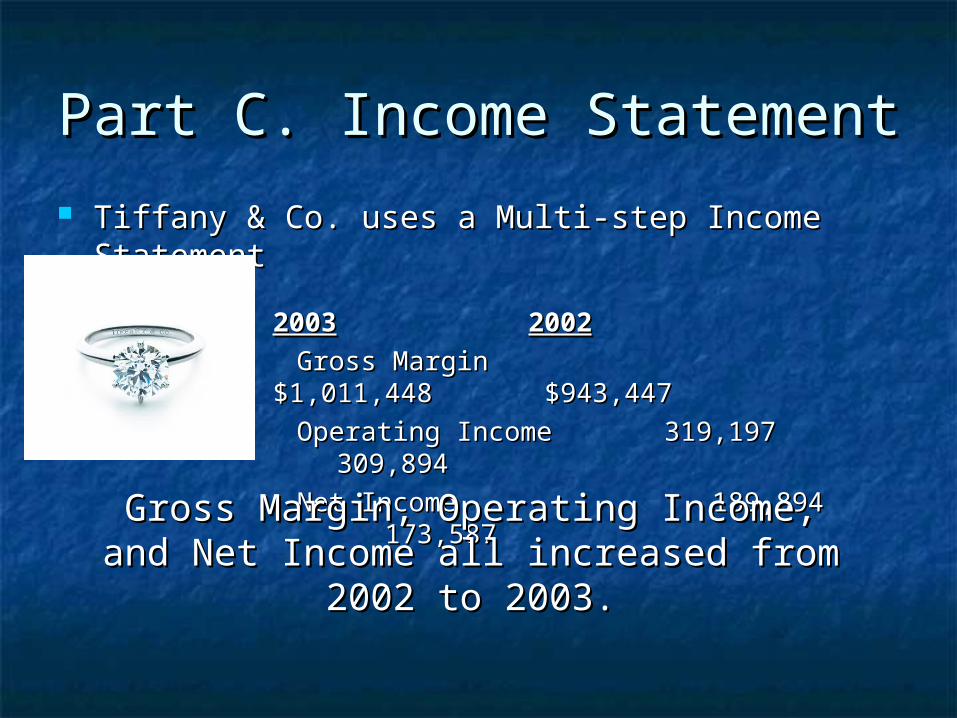
Part C. Income StatementPart C. Income Statement
Tiffany & Co. uses a Multi-step Income Tiffany & Co. uses a Multi-step Income StatementStatement
20032003 20022002
Gross MarginGross Margin $1,011,448 $1,011,448 $943,447$943,447
Operating Income 319,197 Operating Income 319,197 309,894309,894
Net Income 189,894 Net Income 189,894 173,587173,587Gross Margin, Operating Income, and Net Gross Margin, Operating Income, and Net
Income all increased from 2002 to 2003.Income all increased from 2002 to 2003.
Part C. Balance SheetPart C. Balance Sheet Assets = Liabilities + Stockholders Assets = Liabilities + Stockholders
EquityEquity 2003 $1,923,586 = 715,537 + 1,208,0492003 $1,923,586 = 715,537 + 1,208,049 2002 $1,631,074 = 594,129 + 1,036,9452002 $1,631,074 = 594,129 + 1,036,945
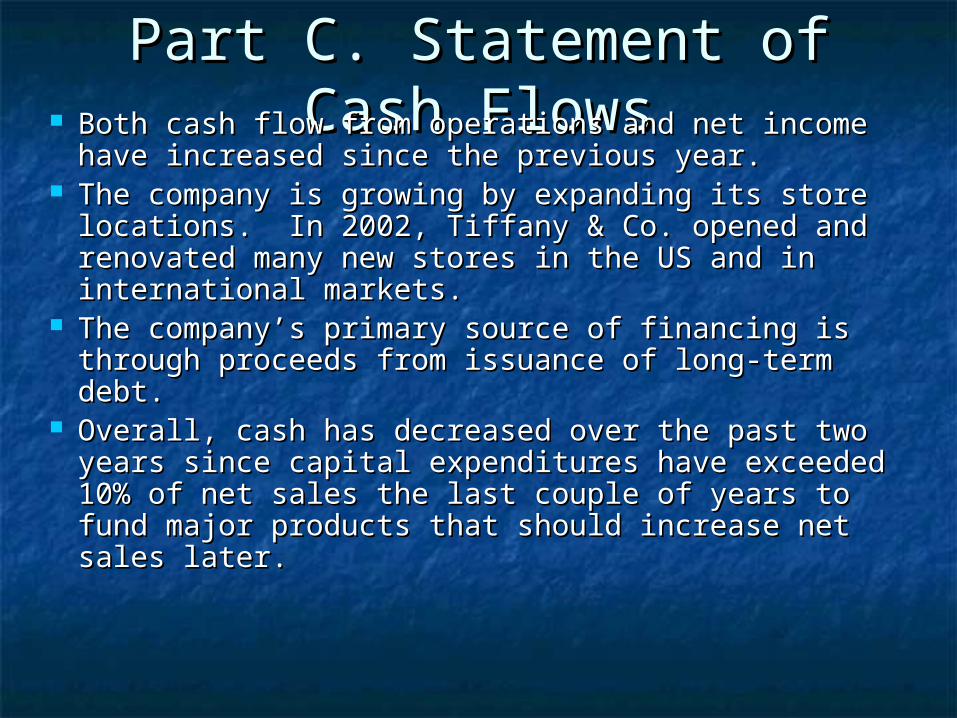
Part C. Statement of Cash Part C. Statement of Cash FlowsFlows Both cash flow from operations and net income Both cash flow from operations and net income
have increased since the previous year.have increased since the previous year. The company is growing by expanding its store The company is growing by expanding its store
locations. In 2002, Tiffany & Co. opened and locations. In 2002, Tiffany & Co. opened and renovated many new stores in the US and in renovated many new stores in the US and in international markets. international markets.
The company’s primary source of financing is The company’s primary source of financing is through proceeds from issuance of long-term debt. through proceeds from issuance of long-term debt.
Overall, cash has decreased over the past two years Overall, cash has decreased over the past two years since capital expenditures have exceeded 10% of since capital expenditures have exceeded 10% of net sales the last couple of years to fund major net sales the last couple of years to fund major products that should increase net sales later.products that should increase net sales later.
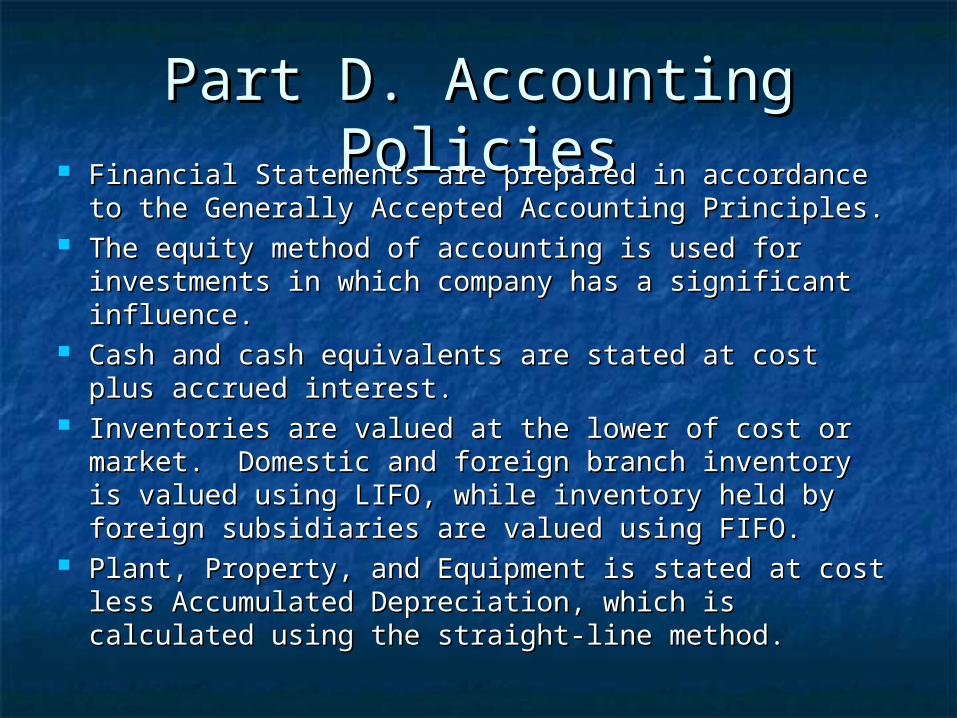
Part D. Accounting PoliciesPart D. Accounting Policies Financial Statements are prepared in accordance to Financial Statements are prepared in accordance to
the Generally Accepted Accounting Principles.the Generally Accepted Accounting Principles. The equity method of accounting is used for The equity method of accounting is used for
investments in which company has a significant investments in which company has a significant influence.influence.
Cash and cash equivalents are stated at cost plus Cash and cash equivalents are stated at cost plus accrued interest.accrued interest.
Inventories are valued at the lower of cost or Inventories are valued at the lower of cost or market. Domestic and foreign branch inventory is market. Domestic and foreign branch inventory is valued using LIFO, while inventory held by foreign valued using LIFO, while inventory held by foreign subsidiaries are valued using FIFO.subsidiaries are valued using FIFO.
Plant, Property, and Equipment is stated at cost Plant, Property, and Equipment is stated at cost less Accumulated Depreciation, which is calculated less Accumulated Depreciation, which is calculated using the straight-line method.using the straight-line method.
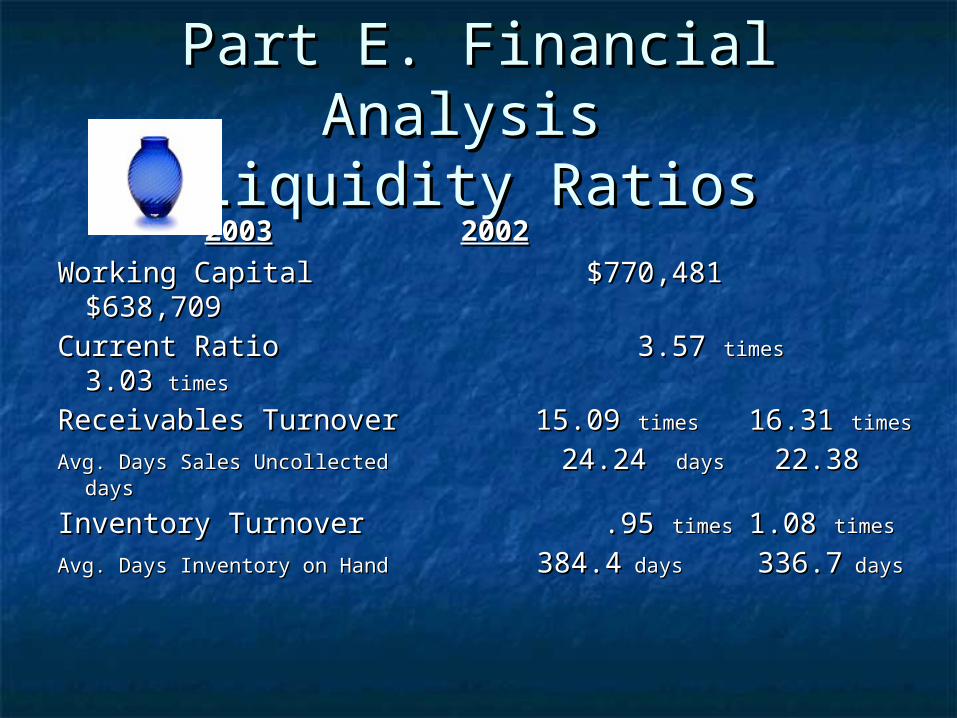
Part E. Financial Analysis Part E. Financial Analysis Liquidity RatiosLiquidity Ratios
20032003 20022002
Working Capital $770,481 $638,709Working Capital $770,481 $638,709Current Ratio 3.57 Current Ratio 3.57 timestimes 3.033.03 timestimes
Receivables Turnover 15.09 Receivables Turnover 15.09 times times 16.31 16.31 timestimes
Avg. Days Sales Uncollected Avg. Days Sales Uncollected 24.24 24.24 days days 22.3822.38 days days
Inventory Turnover .95 Inventory Turnover .95 timestimes 1.08 1.08 timestimes
Avg. Days Inventory on Hand Avg. Days Inventory on Hand 384.4384.4 days days 336.7336.7 days days
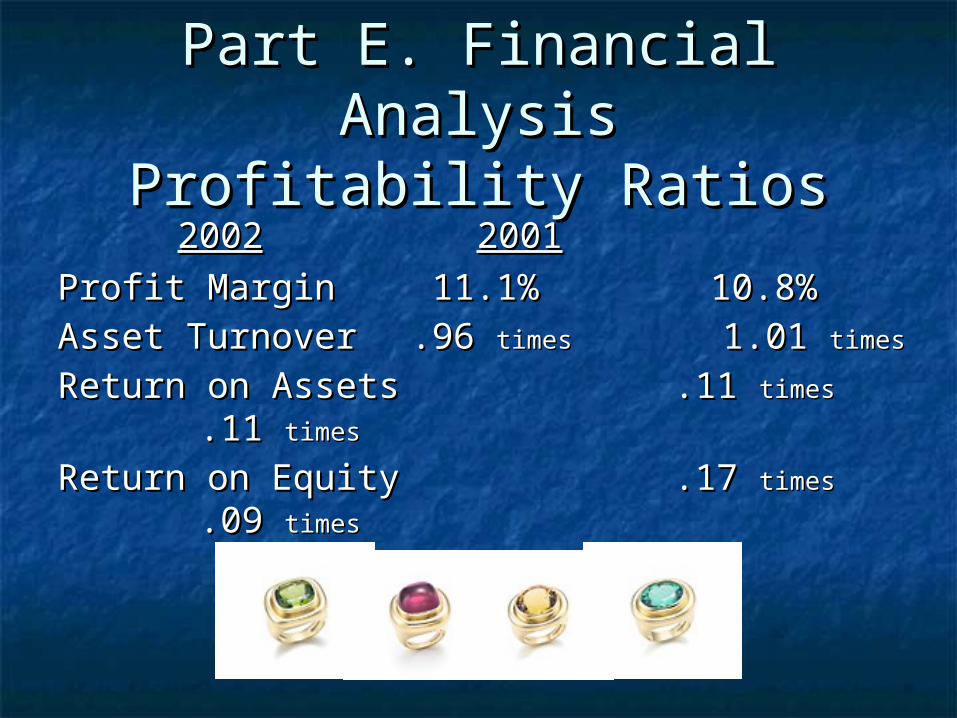
Part E. Financial AnalysisPart E. Financial AnalysisProfitability RatiosProfitability Ratios
20022002 20012001
Profit MarginProfit Margin 11.1% 10.8% 11.1% 10.8%Asset TurnoverAsset Turnover .96 .96 timestimes 1.01 1.01 timestimes
Return on AssetsReturn on Assets .11 .11 timestimes .11 .11 timestimes
Return on EquityReturn on Equity .17 .17 timestimes .09 .09 timestimes
Part E. Financial AnalysisPart E. Financial AnalysisSolvency RatiosSolvency Ratios
Debt to EquityDebt to Equity
20032003 20022002 .25 .25 timestimes .30 .30 timestimes
Part E. Financial AnalysisPart E. Financial AnalysisMarket Strength RatiosMarket Strength Ratios
20022002 20012001
Price/earnings per share 30.97 Price/earnings per share 30.97 timestimes 23.22 23.22 timestimes
Dividend YieldDividend Yield .4% .6% .4% .6%