Embed Size (px)
Citation preview

FR Y-6OMB Number 7100-0297 Approval expires November 30, 2019 Page 1 of 2
Board of Governors of the Federal Reserve System
Annual Report of Holding Companies—FR Y-6
Report at the close of business as of the end of fiscal yearThis Report is required by law: Section 5(c)(1)(A) of the BankHolding Company Act (12 U.S.C. § 1844(c)(1)(A)); sections 8(a)and 13(a) of the International Banking Act (12 U.S.C. §§ 3106(a)and 3108(a)); sections 11(a)(1), 25, and 25A of the FederalReserve Act (12 U.S.C. §§ 248(a)(1), 602, and 611a); and sec-tions 113, 165, 312, 618, and 809 of the Dodd-Frank Act (12 U.S.C.§§ 5361, 5365, 5412, 1850a(c)(1), and 5468(b)(1)). Return to theappropriate Federal Reserve Bank the original and the number ofcopies specified.
This report form is to be filed by all top-tier bank holding compa-nies, top-tier savings and loan holding companies, and U.S. inter-mediate holding companies organized under U.S. law, and byany foreign banking organization that does not meet the require-ments of and is not treated as a qualifying foreign banking orga-nization under Section 211.23 of Regulation K (12 C.F.R. §211.23). (See page one of the general instructions for more detailof who must file.) The Federal Reserve may not conduct or spon-sor, and an organization (or a person) is not required to respondto, an information collection unless it displays a currently validOMB control number.
NOTE: The Annual Report of Holding Companies must be signed byone director of the top-tier holding company. This individual shouldalso be a senior official of the top-tier holding company. In the eventthat the top-tier holding company does not have an individual who isa senior official and is also a director, the chairman of the board mustsign the report. If the holding company is an ESOP/ESOT formed asa corporation or is an LLC, see the General Instructions for theauthorized individual who must sign the report.I,
Name of the Holding Company Director and Official
Title of the Holding Company Director and Official
attest that the Annual Report of Holding Companies (includingthe supporting attachments) for this report date has been pre-pared in conformance with the instructions issued by the FederalReserve System and are true and correct to the best of myknowledge and belief.With respect to information regarding individuals contained in thisreport, the Reporter certifies that it has the authority to provide thisinformation to the Federal Reserve. The Reporter also certifiesthat it has the authority, on behalf of each individual, to consent orobject to public release of information regarding that individual.The Federal Reserve may assume, in the absence of a request forconfidential treatment submitted in accordance with the Board's"Rules Regarding Availability of Information," 12 C.F.R. Part 261,that the Reporter and individual consent to public release of alldetails in the report concerning that individual.
Signature of Holding Company Director and Official
Date of Signature
Date of Report (top-tier holding company's fiscal year-end):
Month / Day / Year
Reporter's Name, Street, and Mailing Address
Legal Title of Holding Company
(Mailing Address of the Holding Company) Street / P.O. Box
City State Zip Code
Physical Location (if different from mailing address)
Person to whom questions about this report should be directed:
Name Title
Area Code / Phone Number / Extension
Area Code / FAX Number
E-mail Address
Address (URL) for the Holding Company's web page
Reporter's Legal Entity Identifier (LEI) (20-Character LEI Code)
For holding companies not registered with the SEC–Indicate status of Annual Report to Shareholders:
is included with the FR Y-6 reportwill be sent under separate coveris not prepared
For Federal Reserve Bank Use Only
RSSD IDC.I.
In accordance with the General Instructions for this report(check only one),
a letter justifying this request is being provided along with the report . . . . . . . . . . . . . . . . . . . . . . . . . . . . . . . . . . . . . . . . . . . . . . . . . . . . . . . .
0=No
1=Yes
1.
a letter justifying this request has been provided separately . . .2.
NOTE: Information for which confidential treatment is being requestedmust be provided separately and labeledas "confidential."
Is confidential treatment requested for any portion of this report submission? .. . . . . . . . . . . . . . . . . . . . . . . . . . . . . . . . . . .
Public reporting burden for this information collection is estimated to vary from 1.3 to 101 hours per response, with an average of 5.50 hours per response, including time to gather andmaintain data in the required form and to review instructions and complete the information collection. Send comments regarding this burden estimate or any other aspect of this collection ofinformation, including suggestions for reducing this burden to: Secretary, Board of Governors of the Federal Reserve System, 20th and C Streets, NW, Washington, DC 20551, and to theOffice of Management and Budget, Paperwork Reduction Project (7100-0297), Washington, DC 20503. 03/2018
A. C. Evans, Jr.
President/CEO
December 31, 2018
FNB Company
P O Box 671
Livingston TX 77351
2121 US Hwy 190 W
Danielle Marsh VP/CFO First National Bank
936-328-5581
936-328-5497
N/A
LEI: None
0
2/21/2019

FINANCIAL STATEMENTS WITH INDEPENDENT AUDITORS' REPORT
FNB COMPANY AND SUBSIDIARIES
Livingston, Texas
December 31, 2018 and 2017

C O N T E N T S Independent Auditors' Report .................................................................................................................. 3 Consolidated Balance Sheets .................................................................................................................. 4 Consolidated Statements of Income ........................................................................................................ 5 Consolidated Statements of Comprehensive Income ............................................................................... 6 Consolidated Statements of Changes in Stockholders' Equity ................................................................. 7 Consolidated Statements of Cash Flows .................................................................................................. 8 Notes to Financial Statements ................................................................................................................. 9 Independent Auditors' Report on Supplementary Information .............................................................. 33 Consolidating Balance Sheet - Current Year ................................................................................... 35 Consolidating Balance Sheet - Prior Year ................................................................................... 37 Consolidating Statement of Income - Current Year ..................................................................... 39 Consolidating Statement of Income - Prior Year ......................................................................... 41 Consolidating Balance Sheet (Subsidiaries) - Current Year......................................................... 45 Consolidating Balance Sheet (Subsidiaries) - Prior Year ............................................................. 47 Consolidating Statement of Income (Subsidiaries) - Current Year ............................................... 49 Consolidating Statement of Income (Subsidiaries) - Prior Year ................................................... 51

3
INDEPENDENT AUDITORS' REPORT Board of Directors FNB Company and Subsidiaries Livingston, Texas We have audited the accompanying consolidated financial statements of FNB Company and Subsidiaries (an S corporation), which comprise the consolidated balance sheets as of December 31, 2018 and 2017, and the related consolidated statements of income, comprehensive income, changes in stockholders' equity, and cash flows for the years then ended, and the related notes to the consolidated financial statements.
Management's Responsibility for the Financial Statements
Management is responsible for the preparation and fair presentation of these consolidated financial statements in accordance with accounting principles generally accepted in the United States of America; this includes the design, implementation, and maintenance of internal control relevant to the preparation and fair presentation of consolidated financial statements that are free from material misstatement, whether due to fraud or error.
Auditors' Responsibility
Our responsibility is to express an opinion on these consolidated financial statements based on our audits. We conducted our audits in accordance with auditing standards generally accepted in the United States of America. Those standards require that we plan and perform the audit to obtain reasonable assurance about whether the consolidated financial statements are free from material misstatement.
An audit involves performing procedures to obtain audit evidence about the amounts and disclosures in the consolidated financial statements. The procedures selected depend on the auditors' judgment, including the assessment of the risks of material misstatement of the consolidated financial statements, whether due to fraud or error. In making those risk assessments, the auditor considers internal control relevant to the entity's preparation and fair presentation of the consolidated financial statements in order to design audit procedures that are appropriate in the circumstances, but not for the purpose of expressing an opinion on the effectiveness of the entity's internal control. Accordingly, we express no such opinion. An audit also includes evaluating the appropriateness of accounting policies used and the reasonableness of significant accounting estimates made by management, as well as evaluating the overall presentation of the consolidated financial statements.
We believe that the audit evidence we have obtained is sufficient and appropriate to provide a basis for our audit opinion.
Opinion
In our opinion, the consolidated financial statements referred to above present fairly, in all material respects, the consolidated financial position of FNB Company and Subsidiaries as of December 31, 2018 and 2017, and the consolidated results of its operations and its cash flows for the years then ended in accordance with accounting principles generally accepted in the United States of America. ____________________________________ CERTIFIED PUBLIC ACCOUNTANTS Lufkin, Texas February 16, 2019

4
FNB COMPANY AND SUBSIDIARIES CONSOLIDATED BALANCE SHEETS
December 31, 2018 and 2017
2018 2017 ASSETS Cash on hand and in banks $ 4 744 591 $ 4 497 848 Interest bearing demand accounts in banks 16 959 649 13 213 573 CASH AND CASH EQUIVALENTS 21 704 240 17 711 421 Interest-bearing time deposits in banks 66 451 020 69 436 000 Securities available for sale – at fair value 149 849 593 156 727 876 Securities held-to-maturity 1 914 795 1 937 187 Restricted equity securities 583 820 571 520 Loans, net of allowance for loan losses of $2,191,551 in 2018 and $2,145,687 in 2017 123 133 810 121 021 481 Bank premises and equipment, net 8 610 838 8 791 247 Accrued interest receivable 1 417 431 1 494 819 Goodwill, net 3 031 499 3 031 499 Other real estate owned 52 103 90 000 Other assets 1 038 917 1 049 903 TOTAL ASSETS $ 377 788 066 $ 381 862 953 LIABILITIES AND STOCKHOLDERS' EQUITY Liabilities: Deposits: Noninterest-bearing deposits $ 147 936 890 $ 136 237 620 Interest-bearing deposits 176 127 589 192 299 633 TOTAL DEPOSITS 324 064 479 328 537 253 Accrued interest and other liabilities 1 346 046 1 152 390 TOTAL LIABILITIES 325 410 525 329 689 643 Stockholders' Equity: Common stock, $1 par value; 5,000,000 shares authorized; 130,028 issued, 128,368 and 128,498 outstanding 130 028 130 028 Surplus 21 401 004 21 401 004 Retained earnings 35 123 268 32 860 055 Treasury stock (1,660 and 1,530 shares at cost) (482 225) (435 938) Accumulated other comprehensive income (loss) (3 794 534) (1 781 839) TOTAL STOCKHOLDERS' EQUITY 52 377 541 52 173 310 TOTAL LIABILITIES AND STOCKHOLDERS' EQUITY $ 377 788 066 $ 381 862 953
The accompanying notes are an integral part of these financial statements.

5
FNB COMPANY AND SUBSIDIARIES CONSOLIDATED STATEMENTS OF INCOME
For the Years Ended December 31, 2018 and 2017
2018 2017 Interest Income: Interest and fees on loans $ 6 518 240 $ 6 224 701 Interest on Investment Securities: Taxable 2 585 133 2 179 662 Exempt from Federal income tax 732 906 1 089 678 Interest on deposits in banks 1 534 368 1 167 528 TOTAL INTEREST INCOME 11 370 647 10 661 569 Interest expense on deposits 464 944 442 102 Interest on Federal funds purchased 454 1 018 NET INTEREST INCOME 10 905 249 10 218 449 Provision for loan losses 240 000 240 000 NET INTEREST INCOME AFTER PROVISION FOR LOAN LOSSES 10 665 249 9 978 449 Other Income: Service charges on deposit accounts 1 870 896 1 909 860 Other service charges and fees 1 761 807 1 741 283 Insurance commissions 714 735 639 906 Brokerage commissions (net) 2 020 143 1 755 992 Gain/(loss) other 28 050 (1 130) Other income 47 655 50 858 TOTAL OTHER INCOME 6 443 286 6 096 769 Other Expenses: Salaries and employee benefits 6 699 667 6 365 471 Occupancy, insurance and equipment expense 1 447 021 1 427 688 ATM processing 791 771 737 766 Deposit insurance expense 120 000 159 995 Data processing 887 930 831 786 Directors fees 175 633 185 819 Postage and freight 136 533 134 066 Printing and office supplies 229 266 216 107 Legal and professional services 257 853 248 716 Telephone 105 041 111 764 Marketing 100 859 90 665 Other operating expenses 932 650 937 596 TOTAL OTHER EXPENSES 11 884 224 11 447 439 NET INCOME $ 5 224 311 $ 4 627 779
The accompanying notes are an integral part of these financial statements.

6
FNB COMPANY AND SUBSIDIARIES CONSOLIDATED STATEMENTS OF COMPREHENSIVE INCOME
For the Years Ended December 31, 2018 and 2017
2018 2017 Net income $ 5 224 311 $ 4 627 779 Other Comprehensive Income: Unrealized gains (losses) on available for sale securities arising during the period (2 012 695) 122 553 TOTAL OTHER COMPREHENSIVE INCOME (2 012 695) 122 553 COMPREHENSIVE INCOME $ 3 211 616 $ 4 750 332
The accompanying notes are an integral part of these financial statements.

7
FNB COMPANY AND SUBSIDIARIES CONSOLIDATED STATEMENTS OF CHANGES IN STOCKHOLDERS' EQUITY
For the Years Ended December 31, 2018 and 2017
ACCUMULATED COMMON STOCK CAPITAL RETAINED TREASURY COMPREHENSIVE TOTAL SHARES AMOUNT SURPLUS EARNINGS STOCK INCOME/(LOSS) EQUITY Balance, December 31, 2016 130 028 $ 130 028 $ 21 401 004 $ 30 879 335 $ (435 938) $ (1 904 392) $ 50 070 037 Net income - - - 4 627 779 - - 4 627 779 Other comprehensive loss - - - - - 122 553 122 553 Cash distributions - - - (2 647 059) - - (2 647 059) Balance, December 31, 2017 130 028 130 028 21 401 004 32 860 055 (435 938) (1 781 839) 52 173 310 Net income - - - 5 224 311 - - 5 224 311 Purchase of treasury stock - - - - (46 287) - (46 287) Sale of treasury stock - - - - - (2 012 695) (2 012 695) Cash distributions - - - (2 961 098) - - (2 961 098) Balance, December 31, 2018 130 028 $ 130 028 $ 21 401 004 $ 35 123 268 $ (482 225) $ (3 794 534) $ 52 377 541
The accompanying notes are an integral part of these financial statements.
8
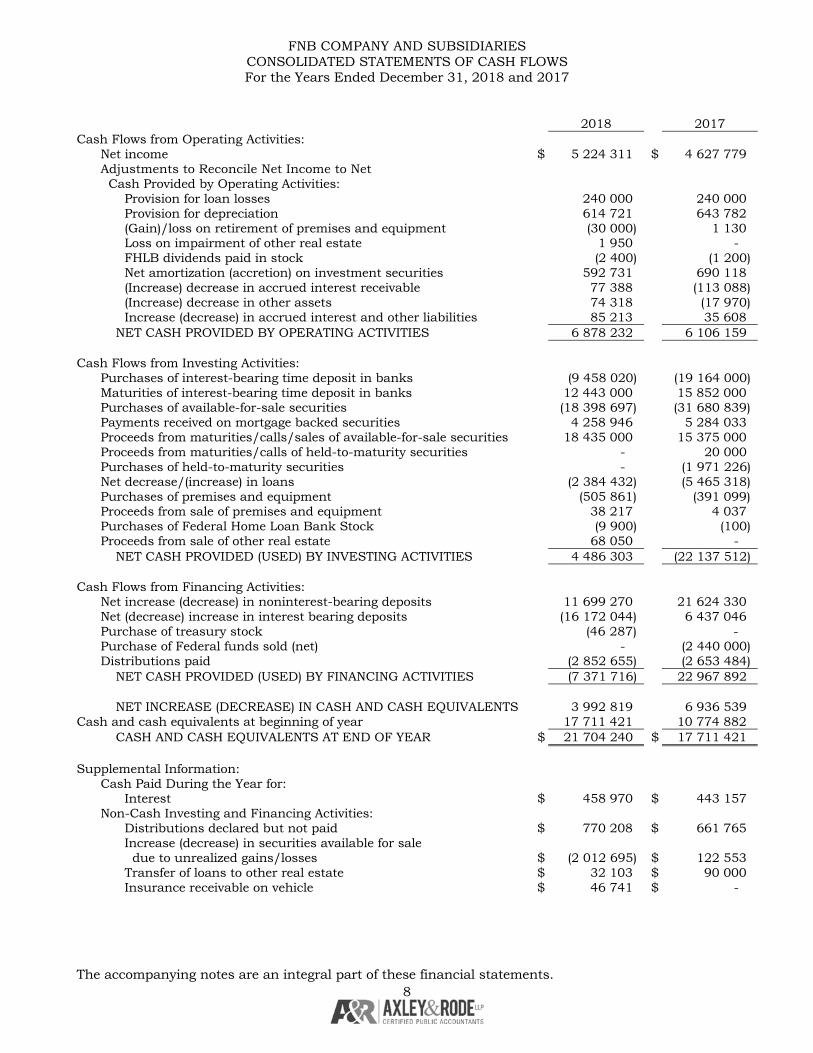
FNB COMPANY AND SUBSIDIARIES CONSOLIDATED STATEMENTS OF CASH FLOWS For the Years Ended December 31, 2018 and 2017
2018 2017 Cash Flows from Operating Activities: Net income $ 5 224 311 $ 4 627 779 Adjustments to Reconcile Net Income to Net Cash Provided by Operating Activities: Provision for loan losses 240 000 240 000 Provision for depreciation 614 721 643 782 (Gain)/loss on retirement of premises and equipment (30 000) 1 130 Loss on impairment of other real estate 1 950 - FHLB dividends paid in stock (2 400) (1 200) Net amortization (accretion) on investment securities 592 731 690 118 (Increase) decrease in accrued interest receivable 77 388 (113 088) (Increase) decrease in other assets 74 318 (17 970) Increase (decrease) in accrued interest and other liabilities 85 213 35 608 NET CASH PROVIDED BY OPERATING ACTIVITIES 6 878 232 6 106 159 Cash Flows from Investing Activities: Purchases of interest-bearing time deposit in banks (9 458 020) (19 164 000) Maturities of interest-bearing time deposit in banks 12 443 000 15 852 000 Purchases of available-for-sale securities (18 398 697) (31 680 839) Payments received on mortgage backed securities 4 258 946 5 284 033 Proceeds from maturities/calls/sales of available-for-sale securities 18 435 000 15 375 000 Proceeds from maturities/calls of held-to-maturity securities - 20 000 Purchases of held-to-maturity securities - (1 971 226) Net decrease/(increase) in loans (2 384 432) (5 465 318) Purchases of premises and equipment (505 861) (391 099) Proceeds from sale of premises and equipment 38 217 4 037 Purchases of Federal Home Loan Bank Stock (9 900) (100) Proceeds from sale of other real estate 68 050 - NET CASH PROVIDED (USED) BY INVESTING ACTIVITIES 4 486 303 (22 137 512) Cash Flows from Financing Activities: Net increase (decrease) in noninterest-bearing deposits 11 699 270 21 624 330 Net (decrease) increase in interest bearing deposits (16 172 044) 6 437 046 Purchase of treasury stock (46 287) - Purchase of Federal funds sold (net) - (2 440 000) Distributions paid (2 852 655) (2 653 484) NET CASH PROVIDED (USED) BY FINANCING ACTIVITIES (7 371 716) 22 967 892 NET INCREASE (DECREASE) IN CASH AND CASH EQUIVALENTS 3 992 819 6 936 539 Cash and cash equivalents at beginning of year 17 711 421 10 774 882 CASH AND CASH EQUIVALENTS AT END OF YEAR $ 21 704 240 $ 17 711 421 Supplemental Information: Cash Paid During the Year for: Interest $ 458 970 $ 443 157 Non-Cash Investing and Financing Activities: Distributions declared but not paid $ 770 208 $ 661 765 Increase (decrease) in securities available for sale due to unrealized gains/losses $ (2 012 695) $ 122 553 Transfer of loans to other real estate $ 32 103 $ 90 000 Insurance receivable on vehicle $ 46 741 $ -
The accompanying notes are an integral part of these financial statements.

9
FNB COMPANY AND SUBSIDIARIES NOTES TO FINANCIAL STATEMENTS
NOTE 1 - NATURE OF OPERATIONS AND SIGNIFICANT ACCOUNTING POLICIES Nature of Operations:
FNB Company (the "Company"), is a holding company that owns all of the capital stock of The First National Bank of Livingston (the "Bank"). The Bank owns all the capital stock of Church Street Financial, ("Church") and Polk County Title Company, Inc., ("Polk") (Note 15) and is the sole member of FNB Brokerage Services, LLC (“Brokerage”). "Bank", "Church", "Polk" and “Brokerage” are referred to as the subsidiaries in these statements. The Bank's main office is located in Livingston, Texas with branches located in Livingston, Texas, and Onalaska, Texas. The Bank represents approximately 90% of the total gross revenues on the consolidated statements of income at December 31, 2018 and 2017.
The Company provides a variety of financial services to individuals and corporate customers through its subsidiaries in Polk County, Texas. The subsidiary Bank's primary deposit products are demand deposits and certificates of deposit. Its primary lending products are consumer, commercial, real estate and single family residential loans. Church provides investment services through its location in Livingston Texas.
Additionally, the Bank maintains correspondent banking relationships and transacts daily federal fund sales on an unsecured basis with regional correspondent banks. Note 2 discusses the types of securities in which the Bank invests. Note 3 discusses the types of lending in which the Bank engages. The Bank does not have any significant concentrations to any one industry or customer.
The accounting and reporting policies of the Company and its subsidiaries conform significantly to accounting principles generally accepted in the United States of American (GAAP) and practices within the banking industry. The following is a description of the more significant of those policies.
Principles of Consolidation:
The consolidated financial statements include the accounts of the Company and its wholly-owned subsidiaries. All significant intercompany accounts and transactions have been eliminated.
Use of Estimates:
The preparation of financial statements in conformity with generally accepted accounting principles requires management to make estimates and assumptions that affect the reported amounts of assets and liabilities and disclosure of contingent assets and liabilities at the date of the financial statements and the reported amounts of revenues and expenses during the reporting period. Actual results could differ from those estimates.
Material estimates that are particularly susceptible to significant change relate to the determination of the fair value of securities available for sale, the allowance for losses on loans and the valuation of other real estate owned. In connection with the determination of the allowances for losses on loans and valuation of other real estate owned, management may obtain independent appraisals.
While management uses available information to recognize losses on loans and other real estate owned, future additions to the allowances may be necessary based on changes in local economic conditions, other risk characteristics applicable to portfolio segments or borrowers' circumstances. In addition, regulatory agencies, as an integral part of their examination process, periodically review the Bank's allowances for losses on loans and foreclosed real estate. Such agencies may require the Bank to recognize additions to the allowances based on their judgments about information available to them at the time of their examination.
As a result of the changes inherent in the estimation process, management's estimate of the fair value of securities available for sale, the allowance for losses on loans and the valuation of other real estate owned may change in the near term.
Cash and Cash Equivalents:
Cash and cash equivalents, for purposes of the statement of cash flows, include cash and due from banks, Federal funds sold and certain investment securities and interest bearing deposits in banks with original maturities of three months or less.

10
FNB COMPANY AND SUBSIDIARIES NOTES TO FINANCIAL STATEMENTS - CONTINUED
NOTE 1 - NATURE OF OPERATIONS AND SIGNIFICANT ACCOUNTING POLICIES - CONTINUED
Investment Securities:
Securities classified as held-to-maturity are those debt securities the Company has both the intent and ability to hold to maturity regardless of changes in market conditions, liquidity needs or changes in general economic conditions. These securities are carried at cost, adjusted for amortization of premium and accretion of discount, computed using the interest method, over their contractual lives.
Securities classified as available-for-sale are equity securities with readily determinable fair values and those debt securities that the Company intends to hold for an indefinite period of time but not necessarily to maturity. Any decision to sell a security classified as available-for-sale would be based on various factors, including significant movement in interest rates, changes in the maturity mix of the Company's assets and liabilities, liquidity needs, regulatory capital considerations, and other similar factors. These securities are carried at estimated fair value based on information provided by a third party pricing service with an unrealized gains or losses excluded from net income and reported in accumulated other comprehensive income (loss), which is reported as a separate component of stockholders' equity.
Dividend and interest income, including amortization of premium and accretion of discount arising at acquisition, from all categories of investment securities are included in interest income in the consolidated statements of income.
Gains and losses realized on sales of investments securities, determined using the adjusted cost basis of the specific securities sold, are included in noninterest income in the consolidated statements of income. Additionally, declines in the estimated fair value of individual investment securities below their cost that are other-than-temporary are reflected as realized losses in the statements of income. Factors affecting the determination of whether an other-than-temporary impairment has occurred include, among other things, (i) the length of time and extent to which the fair value has been less than cost, (ii) the financial condition and near term prospects of the issuer, (iii) that the Company does not intend to sell these securities, and (iv) it is more likely than not that the Company will not be required to sell before a period of time sufficient to allow for any anticipated recovery in fair value.
Restricted stock consists of stock from the Federal Reserve Bank, Texas Independent Bank and the Federal Home Loan Bank, which are restricted as to their marketability. Because no ready market exists for these investments and they have no quoted market value, the Bank's investment in these stocks are carried at cost. The Bank is required to maintain certain stock balances in the Federal Reserve Bank and the Federal Home Loan Bank.
Loans:
Loans are carried at the amount of unpaid principal, reduced by the undisbursed portion of construction loans (construction loans in process), unearned discount and an allowance for loan losses. The major loan portfolio segments include Commercial, Real Estate, Installment, Overdrafts, Consumer and Other. Within these categories, loans are secured most significantly by real estate, but are also secured by account receivables, inventory, income producing commercial properties, personal properties such as vehicles and boats and other items of property, plant and equipment. A small segment of consumer loans are unsecured.
Interest on loans is calculated by using the simple interest method on the daily balances of the principal amounts outstanding. The recognition of income on a loan is discontinued, and previously accrued interest is reversed when, in the opinion of management, it is probable that the borrower will be unable to meet payments as they become due. This generally occurs when the loan becomes 90 days delinquent, but may occur sooner should borrower circumstance dictate.
11
FNB COMPANY AND SUBSIDIARIES NOTES TO FINANCIAL STATEMENTS - CONTINUED
NOTE 1 - NATURE OF OPERATIONS AND SIGNIFICANT ACCOUNTING POLICIES - CONTINUED All interest accrued but not collected for loans that are placed on nonaccrual or charged off is reversed against interest income. The interest on these loans is accounted for on the cash-basis or cost-recovery method, until qualifying for return to accrual. Loans are returned to accrual status when all the principal and interest amounts contractually due are brought current and future payments are reasonably assured. Loan origination and commitment fees are recognized as income when received. Direct loan origination costs are expensed when paid. Financial Accounting Standards Board Codification Section 310.20 Non-Refundable Fees and Costs requires the net effect of loan origination and commitment fees and certain direct loan origination costs to be deferred and recognized over the life of the related loan as an adjustment of yield. FNB Company and Subsidiaries do not feel the application of this standard would have a material effect on the Bank's financial position or results of operations. Allowance for Loan Losses: The allowance for loan losses is established as losses are estimated to have occurred through a provision for loan losses charged to earnings. Loan losses are charged against the allowance when management believes the uncollectability of a loan balance is confirmed. Subsequent recoveries, if any, are credited to the allowance. The allowance is based on two basic principles of accounting: (i) FASB ASC 450, Contingencies, which requires that losses be accrued when they are probable of occurring and estimable and (ii) FASB ASC 310, Receivables, which requires that losses or impaired loans be accrued based on the differences between the loan balance and either the value of collateral, if such loans are considered to be collateral dependent and in the process of collection, or the present value of future cash flows, or the loan's value as observable in the secondary market. A loan is considered impaired when, based on current information and events, the Company has concerns about the ability to collect the scheduled payments of principal or interest when due according to the contractual terms of the loan agreement. Factors considered by management in determining impairment include payment status, collateral value and the probability of collecting scheduled principal and interest payments when due. Loans that experience insignificant payment delays and payment shortfalls generally are not classified as impaired. Management determines the significance of payment delays and payment shortfalls on a case-by-case basis, taking into consideration all the circumstances surrounding the loan and borrower, including the length of delay, the reasons for the delay, the borrower's prior payment record, and the amount of the shortfall in relation to the principal and interest owned. The Company's allowance for loan losses has three basic components: the specific allowance, the formula allowance and the pooled allowance. Each of these components is determined based upon estimates that can and do change when the actual events occur. As a result of the uncertainties inherent in the estimation process, management's estimate of loan losses and the related allowance could change in the near term. The specific allowance component is used to individually establish an allowance for loans identified for impairment testing. When impairment is identified, a specific reserve may be established based on the Company's calculation of the estimated loss embedded in the individual loan. Impairment testing includes consideration of the borrower's overall financial condition, resources and payment record, support available form financial guarantors and the fair value of collateral. These factors are combined to estimate the probability and severity of inherent losses. Large groups of smaller balance, homogeneous loans are collectively evaluated for impairment. Accordingly, the Company does not separately evaluate individual consumer and residential loans for impairment.

12
FNB COMPANY AND SUBSIDIARIES NOTES TO FINANCIAL STATEMENTS - CONTINUED
NOTE 1 - NATURE OF OPERATONS AND SIGNIFICANT ACCOUNTING POLICIES - CONTINUED The formula allowance component is used for estimating the loss on internally risk rated loans exclusive of those identified as impaired. The loans meeting the Company's internal criteria for classification, such as special mention, substandard, doubtful and loss, as well as specifically identified impaired loans, are segregated from performing loans within the portfolio. These internally classified loans are then grouped by loan type (commercial, real estate, installment, overdrafts, and consumer and other). Each loan type is assigned an allowance factor based on management's estimate of the associated risk, complexity, and size of the individual loans within the particular loan category. Classified loans are assigned higher allowance factor than non-classified loans due to management's concerns regarding collectability or management's knowledge of particular elements surrounding the borrower. Allowance factors increase with the worsening of the internal risk rating. The pooled formula component is used to estimate the losses inherent in the pools of non-classified loans. These loans are then also segregated by loan type and allowance factors are assigned by management based on delinquencies, loss history, trends in volume and terms of loans, effects of changes in lending policy, the experience and depth of management, national and local economic trends, concentration of credit, results of the loan review system and the effect of external factors (i.e. competition and regulatory requirements). Allowance factors and overall size of the allowance may change from period to period based on management's assessment of the above-described factors and the relative weights given to each factor. In addition, various regulatory agencies periodically review the allowance for loan losses. These agencies may require the Bank to make additions to the allowance for loan losses based on their judgements of collectability based on information available to them at the time of their examination. Management considers loans impaired when, based on current information, it is probable that the Company will not collect all principal and interest payments according to contractual terms. Loans are evaluated for impairment in accordance with the Company's portfolio monitoring and ongoing risk assessment procedures. Management considers the financial condition of the borrower, cash flow of the borrower, payment status of the loan, and the value of the collateral, if any, securing the loan. Generally, impaired loans do not include large groups of smaller balance homogenous loans such as residential real estate and consumer type loans which are evaluated collectively for impairment and are generally placed on nonaccrual when loan becomes 90 days past due as to principal or interest. Loans specifically reviewed for impairment are not considered impaired during periods of "minimal delay" in payment (90 or less) provided eventual collection of all amounts due is expected. The impairment of a loan is measured based on the present value of expected future cash flows, discounted at the loan's effective interest rate, or the fair value of the collateral if repayment is expected to be provided solely by the collateral. In appropriate circumstances, interest income on impaired loans may be recognized on a cash basis. The Company's charge-off policy states after all collection efforts have been exhausted and the loan is deemed to be a loss, it will be charged to the Company's established allowance for loan losses. Consumer loans subject to the Uniform Retail Credit Classification are charged off as follows: (a) closed end loans are charged-off no later than 120 days after becoming delinquent, (b) consumer loans to borrowers who subsequently declare bankruptcy, where the Company is an unsecured creditor, are charged-off within 60 days of receipt of notification from the bankruptcy court, (c) fraudulent loans are charged-off within 90 days of discovery and (d) death of borrower will cause a charge-off to be incurred at such time an actual loss is determined. All other types of loans are generally evaluated for loss potential at the 90th day past due threshold, and any loss is recognized no later than the 120th day past due threshold; each loss is evaluated on its specific facts regarding the appropriate timing to recognized loss.

13
FNB COMPANY AND SUBSIDIARIES NOTES TO FINANCIAL STATEMENTS - CONTINUED
NOTE 1 - NATURE OF OPERATIONS AND SIGNIFICANT ACCOUNTING POLICIES - CONTINUED
Other Real Estate Owned and Other Assets Acquired in Settlement of Loans:
Other real estate owned and other assets acquired in settlement of loans are recorded at the lesser of the balance of the loan or at estimated fair value less cost of sale, at the date acquired, plus capital improvements made thereafter to facilitate sale. Adjustments are made to reflect declines, if any, in fair values below the recorded amounts at the date of foreclosure and charged to the allowance for losses on loans. Declines in value subsequent to repossession are charged to a loss provision which is included in other expenses on the consolidated statements of income. Costs of holding real estate and other assets acquired in settlement of loans are reflected in income currently. Gains on sales of such assets are taken into income based on the buyer's initial and continuing investment in the property and reflected as part of other income on the consolidated statements of income. Other assets acquired in settlement of loans consist primarily of reacquired personal property.
During 2017, one property (and related improvements) was acquired through foreclosure. The property had an approximate book value of $112,200. Subsequent to repossession, the valuation of the property declined to $90,000. The $22,200 reduction in valuation was charged against the allowance for loan and lease losses reserve. The property was sold during 2018 for approximately $88,000.
During the years ended December 31, 2018 and 2017, investments in mortgage loans secured by residential real estate properties where formal foreclosure procedures were in process totaled $-0- and $-0-, respectively.
Insignificant amounts of other assets acquired in settlement of loans were repossessed during 2018 and 2017.
Bank Premises and Equipment:
Bank premises and equipment are stated at cost less accumulated depreciation. The provision for depreciation is computed using the straight-line method based on estimated useful lives of the assets. Expenditures for improvements, which extend the life of an asset, are capitalized and depreciated over asset's remaining useful life. Gains or losses realized on the disposition of properties and equipment are reflected in the statements of income. Expenditures for repairs and maintenance are charged to operating expenses as incurred.
Off-Balance Sheet Financial Instruments:
In the ordinary course of business the Bank has entered into off-balance sheet financial instruments consisting of commitments to extend credit, standby letters of credit and overdraft lines of credit. Such financial instruments are recorded in the financial statements when they are funded and at that time become subject to management's evaluation related to collectability.
Self-Insurance:
The Company is primarily self-insured for costs related to employee health care benefits, of which a portion is paid by the employees. Liabilities associated with these risks are estimated in part by considering historical claims experience and other assumptions. The Company has purchased stop loss coverage to limit exposure to claims. At December 31, 2018 and 2017, the Company had recorded approximately $71,000 and $24,000, respectively, as an accrual for this liability.
The assumptions underlying the ultimate costs of existing claim losses are unpredictable, which can affect the liability recorded for such claims. Although the Company's estimates of liabilities incurred do not anticipate significant changes in historical trends for these variables, any changes could have a significant impact on future claim costs and current recorded liabilities.

14
FNB COMPANY AND SUBSIDIARIES NOTES TO FINANCIAL STATEMENTS - CONTINUED
NOTE 1 - NATURE OF OPERATIONS AND SIGNIFICANT ACCOUNTING POLICIES - CONTINUED
Income Taxes:
Effective January 1, 2010, the Company elected to become a subchapter S corporation. Under subchapter S guidelines, all federal taxable income is attributable to the Company shareholders individually.
The Company is required to pay tax to the State of Texas based on gross margin (as defined). This tax has been deemed an income tax by the Financial Accounting Standards Board and consequently requires accrual in the year the taxable gross margin is earned. For the years presented, the Consolidated Statements of Income reflects approximately $10,000 and $11,000 as state income tax expense (benefit) included in "Other Operating Expenses".
Sales Taxes:
Sales and use taxes and other such pass through state taxes are not recorded in the consolidated statements of income, but are instead collected and remitted through a liability account.
Goodwill:
The Company does not amortize goodwill, but instead, evaluates goodwill for impairment at least annually and adjusts accordingly in accordance with GAAP. The Company does not believe any impairment of goodwill exists at December 31, 2018, based on its evaluation.
Brokerage Commissions:
Brokerage commissions paid to Bank from its broker-dealer are net of various fees (see Note 15).
Fair Values of Financial Instruments:
The Company follows the guidance of FASB ASC 825, Financial Instruments, and FASB ASC 820, Fair Value Measurement. This guidance permits entities to measure many financial instruments and certain other items at fair value. The objective is to improve financial reporting by providing entities with the opportunity to mitigate volatility in reported earnings caused by measuring related assets and liabilities differently without having to apply complex hedge accounting provisions. This guidance clarifies the fair value is an exit price, representing the amount that would be received to sell an asset or paid to transfer a liability in an orderly transaction between market participants. Under this guidance, fair value measurements are not adjusted for transaction costs. This guidance established a fair value hierarchy that prioritizes the inputs to valuation techniques used to measure fair value. The hierarchy gives the highest priority to unadjusted quoted prices in active markets for identical assets or liabilities (Level 1 measurements) and lowest priority to unobservable inputs (Level 3 measurements).
Comprehensive Income:
Accounting principles generally require that recognized revenue, expenses, gains and losses be included in net income. Although certain changes in assets and liabilities, such as unrealized gains and losses on available-for-sale securities, are reported as a separate component of the equity section of the balance sheet, such items, along with net income, are components of comprehensive income.
Uncertain Tax Positions:
FASB Codification Section 740 requires recognition, measurement and disclosure of uncertain tax positions. The Company currently accounts for uncertain tax positions based on the estimated likelihood of assessment and has determined that no tax positions (for interest, penalties or otherwise) require an accrual based on current standards of accounting. The Company is generally no longer subject to Federal tax examinations for tax years before 2015.

15
FNB COMPANY AND SUBSIDIARIES NOTES TO FINANCIAL STATEMENTS - CONTINUED
NOTE 1 - NATURE OF OPERATIONS AND SIGNIFICANT ACCOUNTING POLICIES - CONTINUED
Advertising:
The Company expenses all advertising costs as incurred. These are included on the Consolidated Statements of Income as marketing expenses.
Reclassifications:
Certain reclassifications have been made to the prior period's financial statements in order to conform to the classifications used for the current year. These reclassifications had no effect on the capital, net income or net cash flows of the Bank.
Subsequent Events:
Management has evaluated subsequent events through February 16, 2019, the date the financial statements were available to be issued.
New Authoritative Accounting Guidance:
The Financial Accounting Standards Board (the FASB) issued Accounting Standards Update (ASU) 201-01, Financial Instruments - Overall (Subtopic 825-10): Recognition and Measurement of Financial Assets and Financial Liabilities. The amendments in this Update make targeted improvements to GAAP as follows: (1) Requires equity investments to be measured at fair value with changes in fair value recognized in net income. (2) Simplify the impairment assessment of equity investments without readily determinable fair values by requiring a qualitative assessment to identify impairment. When a qualitative assessment indicates that impairment exists, an entity is required to measure the investment at fair value. (3) Eliminate the requirement for public business entities to disclose the method(s) and significant assumptions used to estimate the fair value that is required to be disclosed for financial instruments measured at amortized cost on the balance sheets. (4) Require public business entities to use the exit price notion when measuring fair value of financial instruments for disclosure purposes. (5) Clarify that an entity should evaluate the need for a valuation allowance on a deferred tax asset related to available-for-sale securities in combination with the entity's other deferred tax assets. This ASU will be effective for financial institutions other than public business entities for fiscal years beginning after December 15, 2018, and interim periods within fiscal years beginning after December 15, 2019. The Company does not expect the guidance to have a material impact on its financial statements.
The FASB issued ASU 2016-13, Financial Instruments - Credit Losses (Topic 326): Measurement of Credit Losses on Financial Instruments. Current GAAP requires and incurred loss methodology for recognizing credit losses that delays recognition until it is probable a loss has been incurred. Users of financial statements expressed concern that current GAAP restricts the ability to record credit losses that are expected, but do not yet meet the probable threshold. The main objective of the ASU is to provide financial statement users with more decision-useful information about the expected credit losses on financial instruments and other commitments to extend credit held by reporting entity at each reporting date. To achieve this objective, the amendments in this Update replace the incurred loss impairment methodology in current GAAP with methodology that reflects expected credit losses and requires consideration of a broader range of reasonable and supportable information to inform credit loss estimates. This ASU will be effective for financial institutions other than public entities for fiscal years beginning after December 15, 2020, and interim periods within fiscal years beginning after December 15, 2021. At this time, the Company has not determined the impact on its financial statements.

16
FNB COMPANY AND SUBSIDIARIES NOTES TO FINANCIAL STATEMENTS - CONTINUED
NOTE 1 - NATURE OF OPERATIONS AND SIGNIFICANT ACCOUNTING POLICIES - CONTINUED The FASB issued ASU 2016-15, Statement of Cash Flows (Topic 230): Classification of Certain Cash Receipts and Cash Payments, which made the following changes that may affect the Company: (1) Debt Prepayment or Debt Extinguishment Costs: Cash payments for debt prepayment or debt extinguishment costs should be classified as cash flows from financing activities. (2) Proceeds from Settlement of Bank-Owned Life Insurance Policies: Cash proceeds received from the settlement of bank-owned life insurance policies should be classified as cash flows from investing activities. The cash payments for premiums on bank-owned policies may be classified as cash flows for investing activities, operating activities, or a combination of investing and operating. The amendments in the ASU will be effective for entities other than public business entities for fiscal years beginning after December 15, 2018, and interim periods within fiscal years beginning after December 15, 2019. The Company does not expect the guidance to have a material impact on its financial statements. NOTE 2 - INVESTMENT SECURITIES The carrying amount of investment securities as shown in the consolidated balance sheets of the Company and their fair values at December 31, 2018 and 2017, were as follows:
GROSS GROSS AMORTIZED UNREALIZED UNREALIZED FAIR COST GAIN LOSSES VALUE Securities Available for Sale: December 31, 2018: U.S. agency securities $ 105 055 285 $ 11 984 $ (2 946 737) $ 102 120 532 State and municipal securities 30 816 510 171 247 (467 523) 30 520 234 Residential mortgage backed securities 16 788 331 45 454 (592 745) 16 241 040 Other securities 984 000 - (16 213) 967 787 $ 153 644 126 $ 228 685 $ (4 023 218) $ 149 849 593 December 31, 2017: U.S. agency securities $ 92 534 293 $ 2 720 $ (1 571 735) $ 90 965 278 State and municipal securities 44 758 826 371 873 (365 026) 44 765 673 Residential mortgage backed securities 21 216 595 139 979 (359 649) 20 996 925 $ 158 509 714 $ 514 572 $ (2 296 410) $ 156 727 876
GROSS GROSS AMORTIZED UNREALIZED UNREALIZED FAIR COST GAIN LOSSES VALUE Held-to-Maturity: December 31, 2018: State and municipal securities $ 1 914 795 $ 320 $ (39 650) $ 1 875 465 $ 1 914 795 $ 320 $ (39 650) $ 1 875 465 Held-to-Maturity: December 31, 2017: State and municipal securities $ 1 937 187 $ 3 200 $ (30 964) $ 1 909 423 $ 1 937 187 $ 3 200 $ (30 964) $ 1 909 423
No securities were sold in either period presented. The carrying amount and fair value of investment securities at December 31, 2018, by contractual maturity, are shown below. Expected maturities will differ from contractual maturities because borrowers may have the right to call or prepay obligations with or without call or prepayment penalties.

17
FNB COMPANY AND SUBSIDIARIES NOTES TO FINANCIAL STATEMENTS - CONTINUED
NOTE 2 - INVESTMENT SECURITIES - CONTINUED The scheduled maturities of debt securities at December 31, 2018, were as follows: AVAILABLE-FOR-SALE HELD-TO-MATURITY SECURITIES SECURITIES AMORTIZED FAIR AMORTIZED FAIR COST VALUE COST VALUE Due in one year or less $ 12 265 840 $ 12 212 431 $ 245 801 $ 245 572 Due from one to five years 68 870 901 66 826 048 1 073 502 1 058 114 Due from five to ten years 55 082 252 53 942 293 595 492 571 779 Over ten years 636 802 627 782 - - Mortgage-backed securities 16 788 331 16 241 039 - - $ 153 644 126 $ 149 849 593 $ 1 914 795 $ 1 875 465
Investment securities with a fair value of approximately $42,510,000 and $35,392,000 at December 31, 2018 and 2017, respectively, were pledged to secure public deposits and for other purposes required or permitted by law. Information pertaining to securities with gross unrealized losses at December 31, 2018 and 2017, aggregated by investment category and length of time that individual securities have been in a continuous loss position follows:
LESS THAN 12 MONTHS 12 MONTHS OR GREATER TOTAL FAIR UNREALIZED FAIR UNREALIZED FAIR UNREALIZED Description of Securities: VALUE LOSSES VALUE LOSSES VALUE LOSSES December 31, 2018 Available-for-Sale Securities: U.S. Agency Securities $ 10 467 936 $ (31 735) $ 85 141 374 $ (2 915 002) $ 95 609 310 $ (2 946 737) State and municipal $ 1 187 244 $ (3 284) $ 22 769 690 $ (464 239) $ 23 956 934 $ (467 523) Mortgage-backed securities $ 688 489 $ (6 694) $ 13 208 374 $ (586 051) $ 13 896 863 $ (592 745) Other securities $ 967 787 $ (16 213) $ - $ - $ 967 787 $ (16 213) Held-to-Maturity Securities: State and municipal $ 254 205 $ (533) $ 1 354 133 $ (39 117) $ 1 608 338 $ (39 650) December 31, 2017 Available-for-Sale Securities: U.S. Agency Securities $ 28 611 223 $ (173 796) $ 57 352 962 $ (1 397 939) $ 85 964 185 $ (1 571 735) State and municipal $ 13 375 504 $ (98 156) $ 13 441 425 $ (266 870) $ 26 816 929 $ (365 026) Mortgage-backed securities $ 6 263 923 $ (57 867) $ 10 542 434 $ (301 782) $ 16 806 357 $ (359 649) Held-to-Maturity Securities: State and municipal $ 1 377 248 $ (30 964) $ - $ - $ 1 377 248 $ (30 964)
Management evaluates securities for other-than-temporary impairment on a periodic basis. Consideration is given to (1) the length of time and the extent to which the fair value has been less than cost, (2) the financial condition and near-term prospects of the issuer, and (3) the intent and ability of the Company to retain its investment in the issuer for a period of time sufficient to allow for any anticipated recovery in fair value.
Debt securities with unrealized losses have depreciated 2.90% and 1.75% from the Company's amortized cost basis at December 31, 2018 and 2017, respectively. These securities are guaranteed by the U.S. Government, agencies thereof or municipalities. These unrealized losses relate principally to current interest rates for similar types of securities. In analyzing an issuer's financial condition, management considers whether the securities are issued by the Federal government or its agencies, whether downgrades by bond rating agencies have occurred, and the results of reviews of the issuer's financial condition. As management has the ability to hold debt securities until maturity, or for the foreseeable future if classified as available-for-sale, no declines are deemed to be other-than-temporary.

18
FNB COMPANY AND SUBSIDIARIES NOTES TO FINANCIAL STATEMENTS - CONTINUED
NOTE 3 - LOANS AND ALLOWANCE FOR LOAN LOSSES
The Company's goal is to mitigate risk from an unforeseen threat to the loan portfolio as a result of an economic downturn or other negative influences. Plans that aid in mitigating these potential risks in managing the loan portfolio include: enforcing loan policies and procedures, evaluating the borrower's business plan through the loan term, identifying and monitoring primary and alternative sources of repayment, and obtaining adequate collateral to mitigate loss in the event of liquidation. Specific reserves are established based on credit and/or collateral risks on an individual loan basis. A risk rating system is used to estimate potential loss exposure and to provide a measuring system for setting general and specific reserve allocations.
As of December 31, 2018, the real estate loan portfolio constituted 79% of the total loan portfolio. This can be broken down further into the following categories: 54.78% residential real estate, 16.93% commercial real estate, and 7.66% land development loans, as a percentage of total loans.
The Company's construction and land development loans are secured by real property where the loans funds will be used to acquire land and to construct or improve appropriately zoned real property for the creation of income producing or owner occupied commercial properties. Borrowers are generally required to put equity into the project at levels determined by the loan committee and usually are underwritten with a maximum term of 24 months.
Commercial real estate loans are secured by improved real property which is generating income in the normal course of business. Debt service coverage, assuming stabilized occupancy, must be satisfied to support a permanent loan. The debt service coverage ratio is ordinarily at 1.20 to 1.00. These loans are generally underwritten with a term not greater than 20 years or the remaining useful life of the property, whichever is lower.
Residential real estate loans are secured by improved real property of the borrower and are underwritten with terms up to 30 years.
The Company also makes commercial and industrial loans for a variety of purposes, which include working capital, equipment and account receivable financing. This category represents 10% of the loan portfolio at December 31, 2018. Loans in this category generally carry a variable interest rate. Commercial loans meet reasonable underwriting standards, including appropriate collateral and cash flow necessary to support debt service. Personal guarantees are generally required, but may be limited.
Outstanding Loans:
The tables below present an aged analysis of the Bank's loan portfolio by major loan classification as of December 31, 2018 and December 31, 2017.
0-59 60-89 GREATER DAYS DAYS THAN BALANCE PAST PAST 90 DAYS TOTAL DECEMBER 31, DUE DUE PAST DUE PAST DUE CURRENT 2018 Commercial $ 742 534 $ 20 912 $ - $ 763 446 $ 11 106 485 $ 11 869 931 Real estate 2 970 685 25 326 - 2 996 011 97 672 416 100 668 427 Installment - - - - - - Overdrafts - - - - 274 114 274 114 Consumer and other 760 413 114 261 - 874 674 13 079 344 13 954 018 $ 4 473 632 $ 160 499 $ - $ 4 634 131 $ 122 132 359 126 766 490 Construction loans in process (1 441 129) 125 325 361 Allowance for loan losses (2 191 551) $ 123 133 810

19
FNB COMPANY AND SUBSIDIARIES NOTES TO FINANCIAL STATEMENTS - CONTINUED
NOTE 3 - LOANS AND ALLOWANCE FOR LOAN LOSSES - CONTINUED
0-59 60-89 GREATER DAYS DAYS THAN BALANCE PAST PAST 90 DAYS TOTAL DECEMBER 31, DUE DUE PAST DUE PAST DUE CURRENT 2017 Commercial $ 311 289 $ - $ - $ 311 289 $ 11 451 630 $ 11 762 919 Real estate 2 617 530 8 188 - 2 625 718 96 911 904 99 537 622 Installment - - - - - - Overdrafts - - - - 279 371 279 371 Consumer and other 985 726 22 182 913 1 008 821 13 856 282 14 865 103 $ 3 914 545 $ 30 370 $ 913 $ 3 945 828 $ 122 499 187 126 445 015 Construction loans in process (3 277 847) 123 167 168 Allowance for loan losses (2 145 687) $ 121 021 481
Nonaccrual Loans:
The table below includes the Bank's nonaccrual loans, including nonperforming trouble debt restructures and loans past due 90 days, or more at December 31, 2018 and 2017.
ACCRUING PAST DUE NONACCRUAL LOANS 90 DAYS OR MORE DECEMBER 31, DECEMBER 31, 2018 2017 2018 2017 Commercial $ 207 373 $ 94 751 $ - $ - Real estate 336 649 319 669 - - Consumer 28 783 54 793 - - TOTAL $ 572 805 $ 469 213 $ - $ -
The difference between interest income that would have been recorded under the original terms of such loans and that which was recorded is not significant to these financial statements.
Real estate loans consist of residential (79% in 2018 and 78% in 2017) and commercial (21% in 2018 and 22% in 2017). All past due real estate loans are in the residential category at December 31, 2018 and 2017.
Credit Quality Indicators:
The Bank monitors credit quality within its major loan classifications. The results of this classification process is a factor in the risk characteristics used in establishing the allowance for loan losses. These loans are evaluated and internally classified by the Bank as pass, special mention, substandard, doubtful or loss.
Pass - An asset classified pass is one that does not possess any weaknesses by management sufficient to warrant a more adverse classification.
Special Mention - A special mention asset has potential weaknesses that deserve management's close attention. If left uncorrected, these potential weaknesses may result in deterioration of the repayment prospects for the asset or in the institution's credit position at some future date. Special mention assets are not adversely classified and do not expose an institution to sufficient risk to warrant adverse classification.
Substandard - A substandard asset is inadequately protected by the current sound worth and paying capacity of the obligor or of the collateral pledged, if any. Assets so classified must have a well-defined weakness, or weaknesses, that jeopardize the liquidation of the debt. They are characterized by the distinct possibility that the bank will sustain some loss if the deficiencies are not corrected.

20
FNB COMPANY AND SUBSIDIARIES NOTES TO FINANCIAL STATEMENTS - CONTINUED
NOTE 3 - LOANS AND ALLOWANCE FOR LOAN LOSSES - CONTINUED
Doubtful - An asset classified doubtful has all the weaknesses inherent in one classified substandard with the added characteristic that the weaknesses make collection or liquidation in full, on the basis of currently existing facts, conditions, and values, highly questionable and improbable.
Loss - Assets classified loss are considered uncollectible and of such little value that their continuance as bankable assets is not warranted. This classification does not mean that the asset has absolutely no recovery or salvage value, but rather that it is not practical or desirable to defer writing off this basically worthless asset even though partial recovery may be effected in the future. Amounts classified as loss are generally charged off to the allowance for loan losses upon such classification.
The remaining loans are classified as pass. The following presents the Bank's loan classification as of December 31, 2018 and 2017 by its major loan classifications.
2018 SPECIAL PASS MENTION SUBSTANDARD DOUBTFUL LOSS TOTAL Commercial $ 11 541 800 $ - $ 328 131 $ - $ - $ 11 869 931 Real estate 96 819 375 78 772 2 329 151 - - 99 227 298 Installment - - - - - - Overdrafts 274 114 - - - - 274 114 Consumer and other 13 498 227 - 454 811 980 - 13 954 018 TOTAL $ 122 133 516 $ 78 772 $ 3 112 093 $ 980 $ - $ 125 325 361
2017 SPECIAL PASS MENTION SUBSTANDARD DOUBTFUL LOSS TOTAL Commercial $ 11 114 807 $ - $ 561 043 $ 87 069 $ - $ 11 762 919 Real estate 93 922 904 21 828 2 229 336 85 707 - 96 259 775 Installment - - - - - - Overdrafts 279 371 - - - - 279 371 Consumer and other 14 360 215 5 724 481 003 18 161 - 14 865 103 TOTAL $ 119 677 297 $ 27 552 $ 3 271 382 $ 190 937 $ - $ 123 167 168
Allowance for Credit Loss:
The detail below reflects the changes in the allowance for loan losses by the Bank's major loan classifications for the years ended December 31, 2018 and 2017:
COM- REAL OVER- CONSUMER UN- MERCIAL ESTATE DRAFTS AND OTHER ALLOCATED TOTAL ALLOWANCE FOR LOAN LOSSES DECEMBER 31, 2016 $ 175 314 $ 1 083 633 $ 97 338 $ 374 868 $ 417 193 $ 2 148 346 Loans charged off (18 825) (22 200) (145 432) (111 454) - (297 911) Recoveries of loans previously charged off - - 41 628 13 624 - 55 252 NET CHARGE OFFS (18 825) (22 200) (103 804) (97 830) - (242 659) Provision for loan and lease losses 67 029 204 484 132 239 85 425 (249 177) 240 000 ALLOWANCE FOR LOAN LOSSES DECEMBER 31, 2017 223 518 1 265 917 125 773 362 463 168 016 2 145 687 Loans charged off (3 893) - (145 055) (97 869) - (246 817) Recoveries of loans previously charged off - - 36 762 15 919 - 52 681 NET CHARGE OFFS (3 893) - (108 293) (81 950) - (194 136) Provision for loan and lease losses 5 658 (27 095) 126 548 40 374 94 515 240 000 ALLOWANCE FOR LOAN LOSSES DECEMBER 31, 2018 $ 225 283 $ 1 238 822 $ 144 028 $ 320 887 $ 262 531 $ 2 191 551

21
FNB COMPANY AND SUBSIDIARIES NOTES TO FINANCIAL STATEMENTS - CONTINUED
NOTE 3 - LOANS AND ALLOWANCE FOR LOAN LOSSES - CONTINUED
The table below represents the allowance and the carrying value of outstanding loans and leases by portfolio segment at December 31, 2018 and 2017:
COM- REAL INSTALL- CONSUMER OVER-
DECEMBER 31, 2018 MERCIAL ESTATE MENT AND OTHER DRAFTS TOTAL
Impaired Loans and Trouble
Debt Restructurings:
Allowance for loans and
lease losses $ 63 852 $ 38 172 $ - $ 64 133 $ - $ 166 157
Unpaid principal balance $ 204 784 $ 486 080 $ - $ 198 308 $ - $ 889 172
Allowance as a percentage
of unpaid principal balance 31.18% 7.85% - % 32.34% - % 18.69%
Collectively Evaluated for
Impairment:
Allowance for loans and
lease losses $ 161 431 $ 1 200 650 $ - $ 256 754 $ 144 028 $ 1 762 863
Unpaid principal balance $ 11 665 147 $ 98 741 218 $ - $ 13 755 710 $ 274 114 $ 124 436 189
Allowance as a percentage
of unpaid principal balance 1.38% 1.22% - % 1.87% 52.54% 1.42%
Total:
Allowance for loans and
lease losses $ 225 283 $ 1 238 822 $ - $ 320 887 $ 144 028 $ 1 929 020
Unallocated portion 262 531
Total allowance 2 191 551
Unpaid principal balance $ 11 869 931 $ 99 227 298 $ - $ 13 954 018 $ 274 114 $ 125 325 361
Allowance as a percentage
of unpaid principal balance 1.90% 1.25% - % 2.30% 52.54% 1.75%
COM- REAL INSTALL- CONSUMER OVER-
DECEMBER 31, 2017 MERCIAL ESTATE MENT AND OTHER DRAFTS TOTAL
Impaired Loans and Trouble
Debt Restructurings:
Allowance for loans and
lease losses $ 64 719 $ 91 548 $ - $ 105 297 $ - $ 261 564
Unpaid principal balance $ 163 895 $ 714 272 $ - $ 228 422 $ - $ 1 106 589
Allowance as a percentage
of unpaid principal balance 39.49% 12.82% - % 46.10% - % 23.64%
Collectively Evaluated for
Impairment:
Allowance for loans and
lease losses $ 158 799 $ 1 174 369 $ - $ 257 166 $ 125 773 $ 1 716 107
Unpaid principal balance $ 11 599 024 $ 95 545 503 $ - $ 14 636 681 $ 279 371 $ 122 060 579
Allowance as a percentage
of unpaid principal balance 1.37% 1.23% - % 1.76% 45.02% 1.41%
Total:
Allowance for loans and
lease losses $ 223 518 $ 1 265 917 $ - $ 362 463 $ 125 773 $ 1 977 671
Unallocated portion 168 016
Total Allowance 2 145 687
Unpaid principal balance $ 11 762 919 $ 96 259 775 $ - $ 14 865 103 $ 279 371 $ 123 167 168
Allowance as a percentage
of unpaid principal balance 1.90% 1.32% - % 2.44% 45.02% 1.74%

22
FNB COMPANY AND SUBSIDIARIES NOTES TO FINANCIAL STATEMENTS - CONTINUED
NOTE 3 - LOANS AND ALLOWANCE FOR LOAN LOSSES - CONTINUED
Impaired Loans and Trouble Debt Restructurings:
A loan is considered impaired when, based on current information and events, it is probable that the Bank will be unable to collect all amounts due from the borrower in accordance with the contractual terms of the loan. Information on impaired loans for the years ended December 31, 2018 and 2017 are as follows:
DECEMBER 31, 2018 UNPAID AVERAGE PRINCIPAL CARRYING RELATED CARRYING BALANCE VALUE ALLOWANCE AMOUNT With no Related Allowance Recorded: Commercial $ - $ - $ - $ - Real estate 192 957 192 957 - 181 558 Consumer and other 12 864 12 864 - 20 363 TOTAL 205 821 205 821 - 201 921 With an Allowance Recorded: Commercial 204 784 140 932 63 852 120 054 Real estate 293 123 254 951 38 172 353 758 Consumer and other 185 444 121 311 64 133 108 288 TOTAL 683 351 517 194 166 157 582 100 Total: Commercial 204 784 140 932 63 852 120 054 Real estate 486 080 447 908 38 172 535 316 Consumer and other 198 308 134 175 64 133 128 651 TOTAL $ 889 172 $ 723 015 $ 166 157 $ 784 021
DECEMBER 31, 2017 UNPAID AVERAGE PRINCIPAL CARRYING RELATED CARRYING BALANCE VALUE ALLOWANCE AMOUNT With no Related Allowance Recorded: Commercial $ - $ - $ - $ - Real estate 170 158 170 158 - 130 658 Consumer and other 27 861 27 861 - 32 049 TOTAL 198 019 198 019 - 162 707 With an Allowance Recorded: Commercial 163 895 99 176 64 719 97 088 Real estate 544 113 452 565 91 548 378 728 Consumer and other 200 561 95 264 105 297 109 758 TOTAL 908 569 647 005 261 564 585 574 Total: Commercial 163 895 99 176 64 719 97 088 Real estate 714 271 622 723 91 548 509 386 Consumer and other 228 422 123 125 105 297 141 807 TOTAL $ 1 106 588 $ 845 024 $ 261 564 $ 748 281
Income recognized during the periods presented related to impaired loans is not considered significant for separate disclosure.
The Bank is not committed to lend additional funds to debtors whose loans have been modified.
The aggregate amount of loans owed to the Bank by employees, directors and executive officers of the Bank and its subsidiaries and directors, executive officers and principal holders of the Company and their related entities totaled approximately $5,081,000 and $4,137,000 at December 31, 2018 and 2017, respectively. Activity during the years presented for these loans are approximately as follows:
2018 2017 Balance, beginning of year $ 4 137 000 $ 4 154 000 Advances 2 154 000 1 857 000 Repayments (1 258 000) (2 119 000) Additions - Hires with existing loans 70 000 279 000 Reductions - No longer employed (22 000) (34 000) BALANCE END OF YEAR $ 5 081 000 $ 4 137 000

23
FNB COMPANY AND SUBSIDIARIES NOTES TO FINANCIAL STATEMENTS - CONTINUED
NOTE 4 - BANK PREMISES AND EQUIPMENT Major classifications of these assets as of December 31 are summarized as follows:
USEFUL LIVES 2018 2017 IN YEARS Land $ 2 959 635 $ 2 959 635 - Building and improvements 9 716 994 9 558 495 5-40 Furniture and equipment 2 750 319 2 851 719 3-10 Computer software 542 092 455 162 3-5 Automobiles 135 508 115 936 3-4 Equipment in process 37 027 70 434 TOTAL COST 16 169 836 16 011 381 Accumulated depreciation (7 558 998) (7 220 134) NET BOOK VALUE $ 8 610 838 $ 8 791 247
Depreciation expense amounted to $614,721 and $643,782 in 2018 and 2017, respectively and is included as a component of occupancy and equipment expense on the consolidated statements of income. NOTE 5 - DEPOSITS Certificates of deposits and other time deposits issued in denominations that meet or exceed FDIC insurance limit of $250,000 or more totaled approximately $2,848,000 and $3,636,000 at December 31, 2018 and 2017, respectively, and are included in interest-bearing deposits in the consolidated balance sheet. Certificates of deposit and other time deposits maturing in years ending December 31, are as follows:
2019 $ 34 122 805 2020 2 488 035 2021 1 889 359 2022 1 058 907 2023 1 172 892 Thereafter - TOTAL $ 40 731 998
Deposits due to directors, officers, significant shareholders and their affiliates approximated $10,824,000 and $9,705,000 at December 31, 2018 and 2017, respectively. Overdraft demand deposits of $274,114 and $279,371 respectively have been classified as loans in the accompanying financial statements. NOTE 6 - LINE OF CREDIT The Bank has two lines of credit to purchase Federal funds in the amount of $11,000,000 unsecured and $9,000,000 secured by certain investment securities that expires upon cancellation. The Bank had $-0- and $-0- of Federal funds purchased drawn at December 31, 2018 and 2017, respectively.

24
FNB COMPANY AND SUBSIDIARIES NOTES TO FINANCIAL STATEMENTS - CONTINUED
NOTE 7 - RETIREMENT PLANS
The Company sponsors a 401(k) Retirement Plan ("Plan") for the Company and its subsidiaries, which is in effect for substantially all full-time employees (if they elect to be covered). The Company, at its discretion, may match a portion of each employee's contribution. The Company, at its discretion, may make an additional contribution as of each December 31. Contributions to the plan amounted to approximately $416,000 and $398,000 for 2018 and 2017, respectively and are included in salaries and employee benefits on the consolidated statements of income.
NOTE 8 - FINANCIAL INSTRUMENTS
The Company is a party to financial instruments with off-balance-sheet risk in the normal course of business to meet the financing needs of its customers and to reduce its own exposure to fluctuations in interest rates. These financial instruments include commitments to extend credit and standby letters of credit. Those instruments involve, to varying degrees, elements of credit and interest rate risk in excess of the amount recognized in the consolidated balance sheets. The contract or notional amounts of those instruments reflect the extent of involvement the Company has in particular classes of financial instruments.
The Company's exposure to credit loss in the event of nonperformance by the other party to the financial instrument for commitments to extend credit and standby letters of credit is represented by the contractual notional amount of those instruments. The Company uses the same credit policies in making commitments and conditional obligations as it does for on-balance-sheet instruments.
The Company had financial instruments whose contract or notional amounts represent credit risk of approximately the following:
DECEMBER 31, 2018 2017 Commitments to extend credit $ 4 465 000 $ 2 350 000 Standby letters of credit $ 74 000 $ 573 000 Overdraft lines of credit (unfunded) $ 5 582 000 $ 5 777 000 Unfunded portion of construction loans $ 1 441 000 $ 3 278 000
Commitments to extend credit are agreements to lend to a customer as long as there is no violation of any condition established in the contract. Commitments generally have fixed expiration dates or other termination clauses, are generally variable rate in nature and may require payment of a fee. Since many of the commitments are expected to expire without being drawn upon, the total commitment amounts do not necessarily represent future cash requirements. The Company evaluates each customer's creditworthiness on a case-by-case basis. The amount of collateral obtained, if it is deemed necessary by the Company upon extension of credit, is based on management's credit evaluation of the counterparty. Collateral held varies, but may include real estate; accounts receivable; inventory; property, plant, and equipment; and income-producing commercial properties. Of the commitments to extend credit, approximately $22,000 and $151,000 were to related party borrowers at December 31, 2018 and 2017, respectively.
Standby letters of credit are conditional commitments issued by the Company to guarantee the performance of a customer to a third party. Those guarantees are primarily issued to support public and private borrowing arrangements. Standby letters of credit generally have fixed expiration dates and may require payment of a fee. The credit risk involved in issuing letters of credit is essentially the same as that involved in extending loan facilities to customers. Collateral held for the standby letters of credit primarily consists of certificates of deposit.
Overdraft lines of credit represent amounts available for deposit customers to overdraft deposit accounts. Outstanding overdrafts as of December 31, 2018 and 2017 were approximately $274,000 and $279,000, respectively. Of these outstanding overdrafts, approximately $133,000 and $188,000 were amounts drawn on overdraft lines of credit as of December 31, 2018 and 2017.

25
FNB COMPANY AND SUBSIDIARIES NOTES TO FINANCIAL STATEMENTS - CONTINUED
NOTE 8 - FINANCIAL INSTRUMENTS - CONTINUED
FASB ASC 820, Fair Value Measurement, clarifies that fair value is an exit price, representing the amount that would be received to sell an asset or paid to transfer a liability in an orderly transaction between market participants. Under this guidance, fair value measurement are not adjusted for transaction costs. This guidance establishes a fair value hierarchy that prioritizes the inputs to valuation techniques used to measure fair value. The hierarchy gives the highest priority to unadjusted quoted prices in active markets for identical assets or liabilities (Level 1 measurements) and the lowest priority to unobservable inputs (Level 3 measurements). The three levels of the fair value hierarchy under this guidance are described below:
Level 1 - Valuations for assets and liabilities traded in active exchange markets. Valuations are obtained from readily available pricing sources for market transactions involving identical assets or liabilities.
Level 2 - Valuations for assets or liabilities traded in less active dealer or broker markets. Valuations are obtained from third party pricing services for identical or comparable asset or liabilities which use observable inputs other than Level 1 prices, such as quoted prices from similar assets or liabilities; quoted prices in active markets that are not active; or other inputs that are observable or can be corroborated by observable market data for substantially the full term of the assets or liabilities.
Level 3 - Unobservable inputs that are supported by little or no market activity and that are significant to the fair value of the assets or liabilities.
Fair values of assets and liabilities are presented on the consolidated balances sheets measured on a recurring basis at December 31, 2018 and 2017 are as follows:
FAIR VALUE MEASUREMENTS AT REPORTING DATE USING QUOTED PRICES IN ACTIVE MARKETS FOR SIGNIFICANT IDENTICAL OTHER SIGNIFICANT ASSETS/ OBSERVABLE UNOBSERVABLE FAIR LIABILITIES INPUTS INPUTS VALUE (LEVEL 1) (LEVEL 2) (LEVEL 3)
December 31, 2018 Available-for-Sale Securities: U. S. agency securities $ 102 120 532 $ - $ 102 120 532 $ - State and municipal securities 30 520 234 - 30 520 234 - Residential mortgage backed securities 16 241 040 - 16 241 040 - Other securities 967 787 - 967 787 - $ 149 849 593 $ - $ 149 849 593 $ -
FAIR VALUE MEASUREMENTS AT REPORTING DATE USING QUOTED PRICES IN ACTIVE MARKETS FOR SIGNIFICANT IDENTICAL OTHER SIGNIFICANT ASSETS/ OBSERVABLE UNOBSERVABLE FAIR LIABILITIES INPUTS INPUTS VALUE (LEVEL 1) (LEVEL 2) (LEVEL 3)
December 31, 2017 Available-for-Sale Securities: U. S. agency securities $ 90 965 278 $ - $ 90 965 278 $ - State and municipal securities 44 765 673 - 44 765 673 - Residential mortgage backed securities 20 996 925 - 20 996 925 - $ 156 727 876 $ - $ 156 727 876 $ -

26
FNB COMPANY AND SUBSIDIARIES NOTES TO FINANCIAL STATEMENTS - CONTINUED
NOTE 8 - FINANCIAL INSTRUMENTS - CONTINUED Fair value of available for sale securities is based on discounted cash flow analysis based on observable inputs reflective of Level 2 inputs. These inputs include market quotes for similar instruments, current market yields and offering sheets. The following tables set forth the Company's financial assets and liabilities that were accounted for or disclosed at fair value on a nonrecurring basis as of December 31, 2018 and 2017: FAIR VALUE MEASUREMENTS USING QUOTED PRICES IN ACTIVE SIGNIFICANT MARKETS FOR OTHER SIGNIFICANT IDENTICAL OBSERVABLE UNOBSERVABLE DECEMBER 31, ASSETS INPUTS INPUTS 2018 (LEVEL 1) (LEVEL 2) (LEVEL 3) Impaired Loans: Commercial $ 204 784 $ - $ - $ 204 784 Real estate 486 080 - - 486 080 Consumer 198 308 - - 198 308 TOTAL IMPAIRED LOANS $ 889 172 $ - $ - $ 889 172 Other Real Estate Owned: Residential real estate $ 52 103 $ - $ - $ 52 103 TOTAL OTHER REAL ESTATE OWNED $ 52 103 $ - $ - $ 52 103 Goodwill $ 3 031 499 $ - $ - $ 3 031 499
FAIR VALUE MEASUREMENTS USING QUOTED PRICES IN ACTIVE SIGNIFICANT MARKETS FOR OTHER SIGNIFICANT IDENTICAL OBSERVABLE UNOBSERVABLE DECEMBER 31, ASSETS INPUTS INPUTS 2017 (LEVEL 1) (LEVEL 2) (LEVEL 3) Impaired Loans: Commercial $ 163 895 $ - $ - $ 163 895 Real estate 714 272 - - 714 272 Consumer 228 422 - - 228 422 TOTAL IMPAIRED LOANS $ 1 106 589 $ - $ - $ 1 106 589 Other Real Estate Owned: Residential real estate $ 90 000 $ - $ - $ 90 000 TOTAL OTHER REAL ESTATE OWNED $ 90 000 $ - $ - $ 90 000 Goodwill $ 3 031 499 $ - $ - $ 3 031 499

27
FNB COMPANY AND SUBSIDIARIES NOTES TO FINANCIAL STATEMENTS - CONTINUED
NOTE 8 - FINANCIAL INSTRUMENTS - CONTINUED Certain financial assets and financial liabilities are measured at fair value on a nonrecurring basis; that is, the instruments are not measured at fair value on an ongoing basis but are subject to fair value adjustments in certain circumstances. Financial assets and liabilities measured at fair value on nonrecurring basis include the following:
Goodwill Fair market value of goodwill is determined on a nonrecurring basis in order to determine if any impairment exists. In order to estimate the fair value of goodwill the Company uses inputs such as values of similar entities. Impaired Loans Certain impaired loans are reported at fair value of underlying collateral if repayment is expected solely from the collateral. The impaired loans are reported at fair value through a specific valuation allowance allocation of the allowance for possible loan losses. Collateral values are estimated using Level 2 inputs based on observable market data or Level 3 inputs based on customized discounting criteria. Other Real Estate Owned OREO acquired by foreclosure is recorded at the fair value of the property, less any selling costs, as applicable, at the time of foreclosure. If necessary, carrying amounts are reduced to reflect this value through charges to the allowance for possible credit losses upon foreclosure. Subsequent to foreclosure, real estate is carried at the lower of its new cost basis or fair value, less estimated costs to sell. OREO is fair valued under Level 3 at the lower of cost or fair value based on property appraisals less estimated costs, which include both observable and unobservable inputs, at the time of transfer and as appropriate thereafter.
In accordance with the disclosure requirements of FASB ASC 825, Financial Instruments, the estimated fair values of the Company's financial instruments are as follows:
FAIR VALUE MEASUREMENTS AT REPORTING DATE USING QUOTED PRICES IN ACTIVE MARKETS FOR SIGNIFICANT IDENTICAL OTHER SIGNIFICANT ASSETS/ OBSERVABLE UNOBSERVABLE CARRYING FAIR LIABILITIES INPUTS INPUTS
DECEMBER 31, 2018 AMOUNT VALUE (LEVEL 1) (LEVEL 2) (LEVEL 3) Cash and due from banks $ 21 704 240 $ 21 704 240 $ 21 704 240 $ - $ - Interest bearing time deposits in banks $ 66 451 020 $ 65 213 326 $ - $ 65 213 326 $ - Securities available-for-sale $ 149 849 593 $ 149 849 593 $ - $ 149 849 593 $ - Securities held-to-maturity $ 1 914 795 $ 1 875 465 $ - $ 1 875 465 $ - Restricted equity securities $ 583 820 $ N/A $ - $ - $ - Loans receivable $ 123 133 810 $ 121 788 861 $ - $ - $ 121 788 861 Accrued interest receivable $ 1 417 431 $ 1 417 431 $ 1 417 431 $ - $ - Financial Liabilities: Deposit liabilities $ 324 064 479 $ 303 318 564 $ - $ - $ 303 318 564 Accrued interest payable $ 23 068 $ 23 068 $ 23 068 $ - $ -

28
FNB COMPANY AND SUBSIDIARIES NOTES TO FINANCIAL STATEMENTS - CONTINUED
NOTE 8 - FINANCIAL INSTRUMENTS - CONTINUED
FAIR VALUE MEASUREMENTS AT REPORTING DATE USING QUOTED PRICES IN ACTIVE MARKETS FOR SIGNIFICANT IDENTICAL OTHER SIGNIFICANT ASSETS/ OBSERVABLE UNOBSERVABLE CARRYING FAIR LIABILITIES INPUTS INPUTS
DECEMBER 31, 2017 AMOUNT VALUE (LEVEL 1) (LEVEL 2) (LEVEL 3) Cash and due from banks $ 17 711 421 $ 17 711 421 $ 17 711 421 $ - $ - Interest bearing time deposits in banks $ 69 436 000 $ 68 834 406 $ - $ 68 834 406 $ - Securities available-for-sale $ 156 727 876 $ 156 727 876 $ - $ 156 727 876 $ - Securities held-to-maturity $ 1 937 187 $ 1 909 422 $ - $ 1 909 422 $ - Restricted equity securities $ 571 520 $ N/A $ - $ - $ - Loans receivable $ 121 021 481 $ 120 367 730 $ - $ - $ 120 367 730 Accrued interest receivable $ 1 494 819 $ 1 494 819 $ 1 494 819 $ - $ - Financial Liabilities: Deposit liabilities $ 328 537 253 $ 323 853 158 $ - $ - $ 323 853 158 Accrued interest payable $ 16 640 $ 16 640 $ 16 640 $ - $ -
The following methodologies and assumptions were used by the Company in estimating its fair value disclosures for financial instruments:
Cash and Cash Equivalents The carrying amounts report in the consolidated balance sheets for cash and cash equivalents approximate those assets' fair values. Interest Bearing Time Deposits in Banks Fair values of interest bearing deposits in banks are estimated using discounted cash flow analysis, based on rates currently being offered on certificates with terms approximating the remaining term of the certificates in the portfolio. Investment Securities and Restricted Equity Securities Fair values for investment securities are based on quoted market prices, where available. If quoted market prices are not available, fair values are based on discounted cash flow analysis based on observable inputs, except for restricted securities where fair value equals par value based on redemption value. Loans, Net For both fixed and variable rate loans in 2018 and 2017, fair values are estimated using discounted cash flow analysis and current interest rates charged for the types of loans in the portfolio. Accrued Interest Receivable The carrying amount of accrued interest receivable approximates fair value. Deposits The fair values of transactional deposits accounts (interest and noninterest checking, savings and money market accounts) are considered to be their carrying amounts. Fair values for fixed rate certificates of deposits are estimated using a discounted cash flow calculation that applies interest rates currently being offered on certificates to a schedule of the aggregate expected monthly maturities on time deposits.

29
FNB COMPANY AND SUBSIDIARIES NOTES TO FINANCIAL STATEMENTS - CONTINUED
NOTE 8 - FINANCIAL INSTRUMENTS - CONTINUED
Accrued Interest Payable The carrying amount of accrued interest payable approximates fair value. Federal Fund Purchased Fair value of overnight borrowings approximate those liabilities' carrying amount. Commitments to Extend Credit There is not material difference between the notional amount and the estimated fair value of off-balance-sheet unfunded loan commitments which are generally priced at market at the time of funding. Letters of credit have an estimated fair value based on fees currently charged for similar agreements. Fees related to the unexpired term of the letters of credit are not significant. The Company has not incurred any losses on its commitments to extend credit or standby letters of credit during the years presented.
NOTE 9 - CONCENTRATION OF CREDIT RISK The Company periodically carries certain assets with other financial institutions which are subject to credit risk by the amount such assets exceed Federal deposit insurance limits. From time to time, the Bank is also due amounts in excess of FDIC insurance limits for checks and transit items. The Federal Deposit Insurance Corporation (FDIC) provides deposit insurance coverage for amounts up to $250,000 for substantially all depository accounts. Management monitors the financial stability of correspondent banks and considers amounts advanced in excess of FDIC insurance limits to present no significant additional risk to the Bank. NOTE 10 - REGULATORY MATTERS The Bank is subject to various regulatory capital requirements administered by the Federal banking agencies. Failure to meet minimum capital requirements can initiate certain mandatory - and possibly additional discretionary - actions by regulators that, if undertaken, could have a direct, material effect on the financial statements. Under capital adequacy guidelines and the regulatory framework for prompt corrective action, the Bank must meet specific capital guidelines that involve quantitative measures of assets, liabilities, and certain off-balance-sheet items as calculated under regulatory accounting practices. The capital amounts and classification are also subject to qualitative judgments by the regulators about components, risk weightings and other factors. Quantitative measures established by regulation to ensure capital adequacy require the Bank to maintain minimum amounts and ratios (set forth in the table below) of Total, Common and Tier I capital (as defined in the regulations) to risk-weighted assets (as defined), and of Tier I capital (as defined) to average assets (as defined). Management believes, as of December 31, 2018, that the Bank meets all capital adequacy requirements to which it is subject. As of December 31, 2018 and 2017, the most recent notification from the Office of the Comptroller of Currency categorized the Bank as well-capitalized under the regulatory framework for prompt corrective action. To be categorized as well-capitalized, minimum total risk-based, Tier I risk based common equity Tier I risk based and Tier I leverage ratios as set forth in the table must be maintained. There are no conditions or events since that notification that management believes have changed the Bank's categories.

30
FNB COMPANY AND SUBSIDIARIES NOTES TO FINANCIAL STATEMENTS - CONTINUED
NOTE 10 - REGULATORY MATTERS - CONTINUED Actual capital amounts and ratios are presented in the table for the Bank (in thousands). Bank only amounts and percentages are presented as they do not differ materially from bank holding company amounts and percentages.
TO BE WELL CAPITALIZED FOR CAPITAL UNDER PROMPT CORRECTIVE ACTUAL ADEQUACY PURPOSES ACTION PROVISIONS
AMOUNT RATIO AMOUNT RATIO AMOUNT RATIO As of December 31, 2018: Total Risk Based Capital (to Risk Weighted Assets) $ 54 722 42.84% $ 12 615 9.875% $ 12 775 10.0% Tier I Capital (to Risk Weighted Assets) $ 53 118 41.58% $ 10 060 7.875% $ 10 220 8.0% Common Equity Tier I Capital Ratio (to Risk Weighted Assets) $ 53 118 41.58% $ 8 144 5.375% $ 8 304 6.5% Tier I Leverage Capital (to Average Assets) $ 53 118 14.27% $ 14 890 4.000% $ 18 613 5.0% As of December 31, 2017: Total Risk Based Capital (to Risk Weighted Assets) $ 52 495 41.42% $ 11 724 9.250% $ 12 675 10.0% Tier I Capital (to Risk Weighted Assets) $ 50 904 40.16% $ 9 189 7.250% $ 10 140 8.0% Common Equity Tier I Capital Ratio (to Risk Weighted Assets) $ 50 904 40.16% $ 7 288 5.750% $ 8 239 6.5% Tier I Leverage Capital (to Average Assets) $ 50 904 13.29% $ 15 316 4.000% $ 19 145 5.0%
The above 2018 risk-weighted capital ratios for capital adequacy purposes include a 1.875% capital conservation buffer. The capital conservation buffer will be fully phased in by 2019 to 2.50%. Financial institutions with a buffer greater than 1.875% (2018) are not subject to limits on capital distributions or discretionary bonus payments beyond those currently included in regulations. As reflected above, the Bank's capital was sufficient to exceed its minimum capital requirements including the required capital conservation buffer. Although Federal Reserve regulations regarding specific capital requirements do not generally apply to Bank Holding Companies with consolidated assets of less than $500 million, the Federal Reserve may apply capital guidelines to the Company on a consolidated basis, regardless of asset size, if such action is warranted for supervisory purposes. NOTE 11 - RESTRICTIONS ON DISTRIBUTIONS (DIVIDENDS) The Bank is subject to certain restrictions on the amount of distributions that it may pay without prior regulatory approval. The Bank normally restricts distributions to a lesser amount. At December 31, 2018, retained earnings of approximately $6,100,000, were available to the Bank for the payment of distributions without prior regulatory approval. This amount available is reduced subsequent to December 31, 2018 to approximately $4,200,000 since it is based on the current year to date earnings retained plus the previous two years retained income. In addition, distributions may not be paid by the Bank without regulatory approval if capital requirements will not be met subsequent to the dividend. As a subchapter S corporation, the Company may also be limited as to distributions based on previous retained subchapter S earnings or bank capital requirements as noted above.

31
FNB COMPANY AND SUBSIDIARIES NOTES TO FINANCIAL STATEMENTS - CONTINUED
NOTE 12 - RESTRICTION ON CASH AND DUE FROM BANKS The Bank is required to maintain reserve funds in cash or on deposit with the Federal Reserve Bank. The required reserve at December 31, 2018, was approximately $4,525,000. NOTE 13 - DISCONTINUED OPERATIONS Effective December 31, 2010, the physical assets and related title and abstract business of Polk County Title Company, Inc. were sold. Polk County Title Company, Inc. will remain in existence for a period of years in accordance with certain legal requirements and may generate or expend insignificant amounts of cash flow during the remaining years of its existence. NOTE 14 - COMPONENTS OF OTHER COMPREHENSIVE INCOME The following table presents the components of other comprehensive income (loss) for the years ended December 31, 2018 and 2017.
YEARS ENDED DECEMBER 31, 2018 DECEMBER 31, 2017 BEFORE TAX NET OF BEFORE TAX NET OF
TAX EFFECT TAX TAX EFFECT TAX Changes in net unrealized gains on securities available for sale $ (2 012 695) $ - $ (2 012 695) $ 122 553 $ - $ 122 553 Reclassification adjustment for gains realized - - - - - - OTHER COMPREHENSIVE INCOME (LOSS) $ (2 012 695) $ - $ (2 012 695) $ 122 553 $ - $ 122 553
The following table presents the changes in each component of accumulated other comprehensive income, net of tax, for the years ended December 31, 2018 and 2017.
ACCUMULATED SECURITIES OTHER AVAILABLE COMPREHENSIVE FOR SALE INCOME (LOSS)
Balance at December 31, 2016 $ (1 904 392) $ (1 904 392) Other comprehensive income before reclassifications 122 553 122 553 Amounts reclassified from accumulated other comprehensive income - - Balance at December 31, 2017 (1 781 839) (1 781 839) Other comprehensive income before reclassifications (2 012 695) (2 012 695) Amounts reclassified from accumulated other comprehensive income - - Balance at December 31, 2018 $ (3 794 534) $ (3 794 534)

32
FNB COMPANY AND SUBSIDIARIES NOTES TO FINANCIAL STATEMENTS - CONTINUED
NOTE 15 - BROKERAGE COMMISSION Net brokerage commission consists of the following for the years ended December 31, 2018 and 2017:
2018 2017 Gross brokerage commissions $ 2 443 936 $ 2 076 409 Expenses: Broker dealer 202 589 171 319 Brokerage ticket charges 169 257 103 820 Insurance expense 19 872 17 430 Technology expense 12 674 10 835 Brokerage bundled fees 9 330 9 627 Other expenses 10 071 7 386 TOTAL EXPENSES 423 793 320 417 NET BROKERAGE COMMISSIONS $ 2 020 143 $ 1 755 992

33
INDEPENDENT AUDITORS' REPORT ON SUPPLEMENTARY INFORMATION Board of Directors FNB Company and Subsidiaries Livingston, Texas We have audited the consolidated financial statements of FNB Company and Subsidiaries as of and for the years ended December 31, 2018 and 2017, and our report thereon dated February 16, 2019 which expressed an unmodified opinion on those financial statements appears on page 3. Our audit was conducted for the purpose of forming an opinion on the consolidated financial statements as a whole. The consolidating information is presented for purposes of additional analysis and is not a required part of the consolidated financial statements. Such information is the responsibility of management and was derived from and relates directly to the underlying accounting and other records used to prepare the consolidated financial statements. The information has been subjected to the auditing procedures applied in the audit of the consolidated financial statements and certain additional procedures, including comparing and reconciling such information directly to the underlying accounting and other records used to prepare the consolidated financial statements or to the consolidated financial statements themselves, and other additional procedures in accordance with auditing standards generally accepted in the United States of America. In our opinion, the information is fairly stated in all material respects in relation to the consolidated financial statements as a whole. ____________________________________ CERTIFIED PUBLIC ACCOUNTANTS Lufkin, Texas February 16, 2019

34
CONSOLIDATING SUPPLEMENTARY INFORMATION
FNB COMPANY AND SUBSIDIARIES
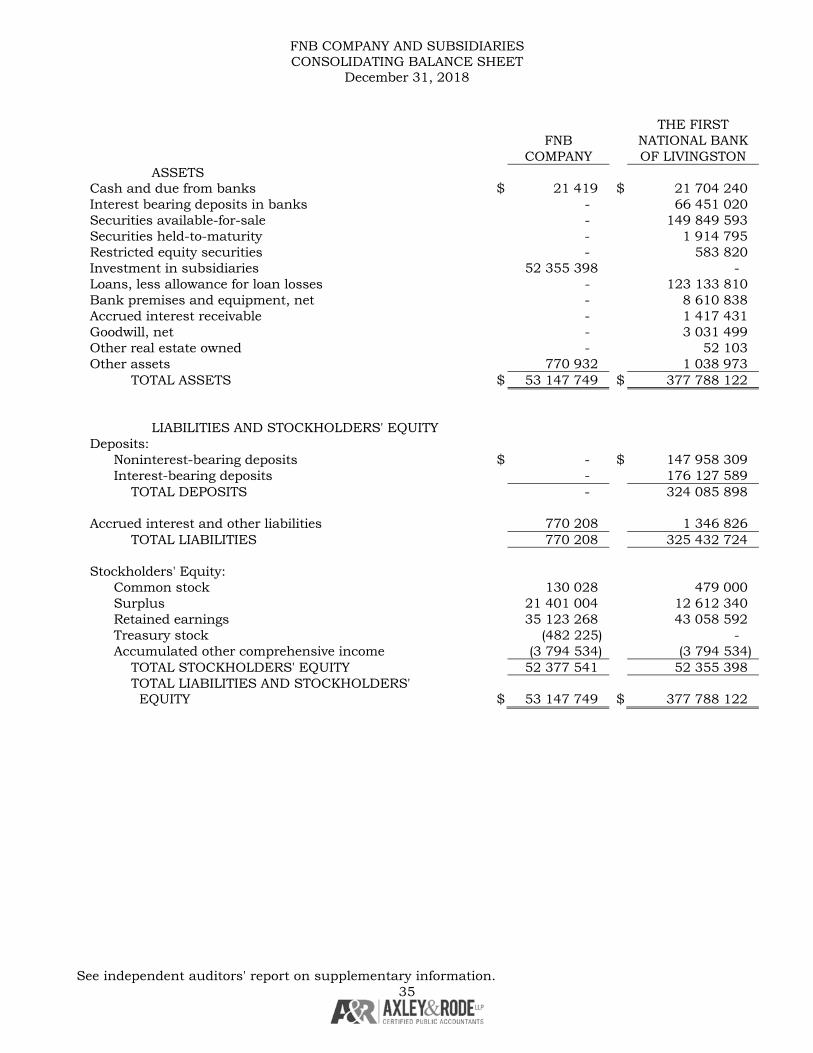
35
FNB COMPANY AND SUBSIDIARIES CONSOLIDATING BALANCE SHEET
December 31, 2018
THE FIRST FNB NATIONAL BANK COMPANY OF LIVINGSTON ASSETS Cash and due from banks $ 21 419 $ 21 704 240 Interest bearing deposits in banks - 66 451 020 Securities available-for-sale - 149 849 593 Securities held-to-maturity - 1 914 795 Restricted equity securities - 583 820 Investment in subsidiaries 52 355 398 - Loans, less allowance for loan losses - 123 133 810 Bank premises and equipment, net - 8 610 838 Accrued interest receivable - 1 417 431 Goodwill, net - 3 031 499 Other real estate owned - 52 103 Other assets 770 932 1 038 973 TOTAL ASSETS $ 53 147 749 $ 377 788 122 LIABILITIES AND STOCKHOLDERS' EQUITY Deposits: Noninterest-bearing deposits $ - $ 147 958 309 Interest-bearing deposits - 176 127 589 TOTAL DEPOSITS - 324 085 898 Accrued interest and other liabilities 770 208 1 346 826 TOTAL LIABILITIES 770 208 325 432 724 Stockholders' Equity: Common stock 130 028 479 000 Surplus 21 401 004 12 612 340 Retained earnings 35 123 268 43 058 592 Treasury stock (482 225) - Accumulated other comprehensive income (3 794 534) (3 794 534) TOTAL STOCKHOLDERS' EQUITY 52 377 541 52 355 398 TOTAL LIABILITIES AND STOCKHOLDERS' EQUITY $ 53 147 749 $ 377 788 122
See independent auditors' report on supplementary information.

36
ELIMINATING CONSOLIDATED ENTRIES TOTALS
$ (21 419) $ 21 704 240 - 66 451 020 - 149 849 593 - 1 914 795 - 583 820 (52 355 398) - - 123 133 810 - 8 610 838 - 1 417 431 - 3 031 499 - 52 103 (770 988) 1 038 917
$ (53 147 805) $ 377 788 066
$ (21 419) $ 147 936 890 - 176 127 589 (21 419) 324 064 479 (770 988) 1 346 046 (792 407) 325 410 525 (479 000) 130 028 (12 612 340) 21 401 004 (43 058 592) 35 123 268 - (482 225) 3 794 534 (3 794 534) (52 355 398) 52 377 541
$ (53 147 805) $ 377 788 066

37
FNB COMPANY AND SUBSIDIARIES CONSOLIDATING BALANCE SHEET
December 31, 2017
THE FIRST FNB NATIONAL BANK COMPANY OF LIVINGSTON ASSETS Cash and due from banks $ 19 162 $ 17 711 421 Interest bearing deposits in banks - 69 436 000 Securities available-for-sale - 156 727 876 Securities held-to-maturity - 1 937 187 Restricted equity securities - 571 520 Investment in subsidiaries 52 154 201 - Loans, less allowance for loan losses - 121 021 481 Bank premises and equipment, net - 8 791 247 Accrued interest receivable - 1 494 819 Goodwill, net - 3 031 499 Other real estate owned - 90 000 Other assets 661 712 1 049 956 TOTAL ASSETS $ 52 835 075 $ 381 863 006 LIABILITIES AND STOCKHOLDERS' EQUITY Deposits: Noninterest-bearing deposits $ - $ 136 256 782 Interest-bearing deposits - 192 299 633 TOTAL DEPOSITS - 328 556 415 Accrued interest and other liabilities 661 765 1 152 390 TOTAL LIABILITIES 661 765 329 708 805 Stockholders' Equity: Common stock 130 028 479 000 Surplus 21 401 004 12 612 340 Retained earnings 32 860 055 40 844 700 Treasury stock (435 938) - Accumulated other comprehensive income (1 781 839) (1 781 839) TOTAL STOCKHOLDERS' EQUITY 52 173 310 52 154 201 TOTAL LIABILITIES AND STOCKHOLDERS' EQUITY $ 52 835 075 $ 381 863 006
See independent auditors' report on supplementary information.

38
ELIMINATING CONSOLIDATED ENTRIES TOTALS
$ (19 162) $ 17 711 421 - 69 436 000 - 156 727 876 - 1 937 187 - 571 520 (52 154 201) - - 121 021 481 - 8 791 247 - 1 494 819 - 3 031 499 - 90 000 (661 765) 1 049 903
$ (52 835 128) $ 381 862 953
$ (19 162) $ 136 237 620 - 192 299 633 (19 162) 328 537 253 (661 765) 1 152 390 (680 927) 329 689 643 (479 000) 130 028 (12 612 340) 21 401 004 (40 844 700) 32 860 055 - (435 938) 1 781 839 (1 781 839) (52 154 201) 52 173 310
$ (52 835 128) $ 381 862 953

39
FNB COMPANY AND SUBSIDIARIES CONSOLIDATING STATEMENT OF INCOME
For the Year Ended December 31, 2018 THE FIRST FNB NATIONAL BANK COMPANY OF LIVINGSTON Interest Income: Interest and fees on loans $ - $ 6 518 240 Interest on Investment Securities: Taxable - 2 585 133 Exempt from Federal income tax - 732 906 Interest on deposits in banks - 1 534 368 TOTAL INTEREST INCOME - 11 370 647 Interest expense on deposits - 464 944 Interest on Federal funds purchased - 454 NET INTEREST INCOME - 10 905 249 Provision for loan losses - 240 000 NET INTEREST INCOME AFTER PROVISION FOR LOAN LOSSES - 10 665 249 Other Income: Service charges on deposit accounts - 1 870 896 Other service charges and fees - 1 761 807 Equity in earnings of subsidiaries 5 222 056 - Insurance commissions - 714 735 Brokerage commissions (net) - 2 020 143 Gain/(loss) other - 28 050 Other income 3 831 43 824 TOTAL OTHER INCOME 5 225 887 6 439 455 Other Expenses: Salaries and employee benefits - 6 699 667 Occupancy, insurance and equipment expense - 1 447 021 ATM processing - 791 771 Deposit insurance expense - 120 000 Data processing - 887 930 Directors fees - 175 633 Postage and freight - 136 533 Printing and office supplies 132 229 134 Legal and professional services 1 444 256 409 Telephone - 105 041 Marketing - 100 859 Other operating expenses - 932 650 TOTAL OTHER EXPENSES 1 576 11 882 648 NET INCOME $ 5 224 311 $ 5 222 056
See independent auditors' report on supplementary information.

40
ELIMINATING CONSOLIDATED ENTRIES TOTALS
$ - $ 6 518 240 - 2 585 133 - 732 906 - 1 534 368 - 11 370 647 - 464 944 - 454 - 10 905 249 - 240 000 - 10 665 249 - 1 870 896 - 1 761 807 (5 222 056) - - 714 735 - 2 020 143 - 28 050 - 47 655 (5 222 056) 6 443 286 - 6 699 667 - 1 447 021 - 791 771 - 120 000 - 887 930 - 175 633 - 136 533 - 229 266 - 257 853 - 105 041 - 100 859 - 932 650 - 11 884 224
$ (5 222 056) $ 5 224 311

41
FNB COMPANY AND SUBSIDIARIES CONSOLIDATING STATEMENT OF INCOME
For the Year Ended December 31, 2017 THE FIRST FNB NATIONAL BANK COMPANY OF LIVINGSTON Interest Income: Interest and fees on loans $ - $ 6 224 701 Interest on Investment Securities: Taxable - 2 179 662 Exempt from Federal income tax - 1 089 678 Interest on deposits in banks - 1 167 528 TOTAL INTEREST INCOME - 10 661 569 Interest expense on deposits - 442 102 Interest on Federal funds purchased - 1 018 NET INTEREST INCOME - 10 218 449 Provision for loan losses - 240 000 NET INTEREST INCOME AFTER PROVISION FOR LOAN LOSSES - 9 978 449 Other Income: Service charges on deposit accounts - 1 909 860 Other service charges and fees - 1 741 283 Equity in earnings of subsidiaries 4 625 398 - Insurance commissions - 639 906 Brokerage commissions (net) - 1 755 992 Gain/(loss) other - (1 130) Other income 4 592 46 266 TOTAL OTHER INCOME 4 629 990 6 092 177 Other Expenses: Salaries and employee benefits - 6 365 471 Occupancy, insurance and equipment expense - 1 427 688 ATM processing - 737 766 Deposit insurance expense - 159 995 Data processing - 831 786 Directors fees - 185 819 Postage and freight - 134 066 Printing and office supplies - 216 107 Legal and professional services 1 086 247 630 Telephone - 111 764 Marketing - 90 665 Other operating expenses 1 125 936 471 TOTAL OTHER EXPENSES 2 211 11 445 228 NET INCOME $ 4 627 779 $ 4 625 398
See independent auditors' report on supplementary information.

42
ELIMINATING CONSOLIDATED ENTRIES TOTALS
$ - $ 6 224 701 - 2 179 662 - 1 089 678 - 1 167 528 - 10 661 569 - 442 102 - 1 018 - 10 218 449 - 240 000 - 9 978 449 - 1 909 860 - 1 741 283 (4 625 398) - - 639 906 - 1 755 992 - (1 130) - 50 858 (4 625 398) 6 096 769 - 6 365 471 - 1 427 688 - 737 766 - 159 995 - 831 786 - 185 819 - 134 066 - 216 107 - 248 716 - 111 764 - 90 665 - 937 596 - 11 447 439
$ (4 625 398) $ 4 627 779

43
This page left blank intentionally.

44
CONSOLIDATING SUPPLEMENTARY INFORMATION
THE FIRST NATIONAL BANK OF LIVINGSTON AND SUBSIDIARIES
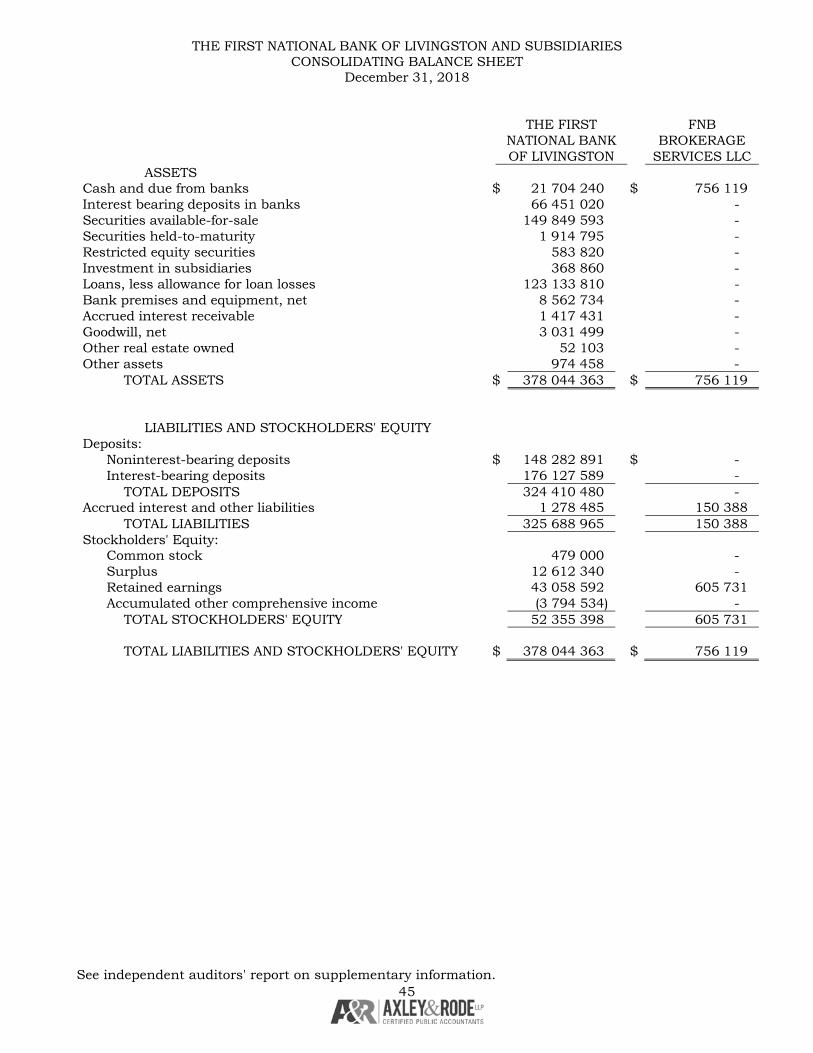
45
THE FIRST NATIONAL BANK OF LIVINGSTON AND SUBSIDIARIES CONSOLIDATING BALANCE SHEET
December 31, 2018 THE FIRST FNB NATIONAL BANK BROKERAGE OF LIVINGSTON SERVICES LLC ASSETS Cash and due from banks $ 21 704 240 $ 756 119 Interest bearing deposits in banks 66 451 020 - Securities available-for-sale 149 849 593 - Securities held-to-maturity 1 914 795 - Restricted equity securities 583 820 - Investment in subsidiaries 368 860 - Loans, less allowance for loan losses 123 133 810 - Bank premises and equipment, net 8 562 734 - Accrued interest receivable 1 417 431 - Goodwill, net 3 031 499 - Other real estate owned 52 103 - Other assets 974 458 - TOTAL ASSETS $ 378 044 363 $ 756 119 LIABILITIES AND STOCKHOLDERS' EQUITY Deposits: Noninterest-bearing deposits $ 148 282 891 $ - Interest-bearing deposits 176 127 589 - TOTAL DEPOSITS 324 410 480 - Accrued interest and other liabilities 1 278 485 150 388 TOTAL LIABILITIES 325 688 965 150 388 Stockholders' Equity: Common stock 479 000 - Surplus 12 612 340 - Retained earnings 43 058 592 605 731 Accumulated other comprehensive income (3 794 534) - TOTAL STOCKHOLDERS' EQUITY 52 355 398 605 731 TOTAL LIABILITIES AND STOCKHOLDERS' EQUITY $ 378 044 363 $ 756 119
See independent auditors' report on supplementary information.

46
CHURCH POLK COUNTY STREET TITLE COMPANY, ELIMINATING CONSOLIDATED FINANCIAL INC. ENTRIES TOTALS $ 138 074 $ 36 120 $ (930 313) $ 21 704 240 - - - 66 451 020 - - - 149 849 593 - - - 1 914 795 - - - 583 820 - - (368 860) - - - - 123 133 810 48 104 - - 8 610 838 - - - 1 417 431 - - - 3 031 499 - - - 52 103 214 903 - (150 388) 1 038 973 $ 401 081 $ 36 120 $ (1 449 561) $ 377 788 122 $ - $ - $ (324 582) $ 147 958 309 - - - 176 127 589 - - (324 582) 324 085 898 68 341 - (150 388) 1 346 826 68 341 - (474 970) 325 432 724 350 000 2 000 (352 000) 479 000 - 111 795 (111 795) 12 612 340 (17 260) (77 675) (510 796) 43 058 592 - - - (3 794 534) 332 740 36 120 (974 591) 52 355 398 $ 401 081 $ 36 120 $ (1 449 561) $ 377 788 122

47
THE FIRST NATIONAL BANK OF LIVINGSTON AND SUBSIDIARIES CONSOLIDATING BALANCE SHEET
December 31, 2017 THE FIRST FNB NATIONAL BANK BROKERAGE OF LIVINGSTON SERVICES LLC ASSETS Cash and due from banks $ 17 711 421 $ 433 349 Interest bearing deposits in banks 69 436 000 - Securities available-for-sale 156 727 876 - Securities held-to-maturity 1 937 187 - Restricted equity securities 571 520 - Investment in subsidiaries 435 930 - Loans, less allowance for loan losses 121 021 481 - Bank premises and equipment, net 8 784 230 - Accrued interest receivable 1 494 819 - Goodwill, net 3 031 499 - Other real estate owned 90 000 - Other assets 1 025 106 - TOTAL ASSETS $ 382 267 069 $ 433 349 LIABILITIES AND STOCKHOLDERS' EQUITY Deposits: Noninterest-bearing deposits $ 136 728 724 $ - Interest-bearing deposits 192 299 633 - TOTAL DEPOSITS 329 028 357 - Accrued interest and other liabilities 1 084 511 136 954 TOTAL LIABILITIES 330 112 868 136 954 Stockholders' Equity: Common stock 479 000 - Surplus 12 612 340 - Retained earnings 40 844 700 296 395 Accumulated other comprehensive income (1 781 839) - TOTAL STOCKHOLDERS' EQUITY 52 154 201 296 395 TOTAL LIABILITIES AND STOCKHOLDERS' EQUITY $ 382 267 069 $ 433 349
See independent auditors' report on supplementary information.

48
CHURCH POLK COUNTY STREET TITLE COMPANY, ELIMINATING CONSOLIDATED FINANCIAL INC. ENTRIES TOTALS $ 298 865 $ 36 172 $ (768 386) $ 17 711 421 - - - 69 436 000 - - - 156 727 876 - - - 1 937 187 - - - 571 520 - - (435 930) - - - - 121 021 481 7 017 - - 8 791 247 - - - 1 494 819 - - - 3 031 499 - - - 90 000 160 924 - (136 074) 1 049 956 $ 466 806 $ 36 172 $ (1 340 439) $ 381 863 006 $ - $ - $ (471 942) $ 136 256 782 - - - 192 299 633 - - (471 942) 328 556 415 67 879 - (136 954) 1 152 390 67 879 - (608 945) 329 708 805 350 000 2 000 (352 000) 479 000 - 111 795 (111 795) 12 612 340 48 927 (77 623) (267 699) 40 844 700 - - - (1 781 839) 398 927 36 172 (731 494) 52 154 201 $ 466 806 $ 36 172 $ (1 340 439) $ 381 863 006

49
THE FIRST NATIONAL BANK OF LIVINGSTON AND SUBSIDIARIES CONSOLIDATING STATEMENT OF INCOME
For the Year Ended December 31, 2018 THE FIRST FNB NATIONAL BANK BROKERAGE OF LIVINGSTON SERVICES LLC Interest Income: Interest and fees on loans $ 6 518 240 $ - Interest on Investment Securities: Taxable 2 585 133 - Exempt from Federal income tax 732 906 - Interest on deposits in banks 1 534 368 - TOTAL INTEREST INCOME 11 370 647 - Interest expense on deposits 464 944 - Interest on Federal funds purchased 454 - NET INTEREST INCOME 10 905 249 - Provision for loan losses 240 000 - NET INTEREST INCOME AFTER PROVISION FOR LOAN LOSSES 10 665 249 - Other Income: Service charges on deposit accounts 1 870 896 - Other service charges and fees 1 761 807 - Equity in earnings of subsidiaries 733 761 - Insurance commissions - - Brokerage commissions (net) - 2 020 143 Management fee - - Gain/(loss) other 9 050 - Other income 187 824 - TOTAL OTHER INCOME 4 872 595 2 020 143 Other Expenses: Salaries and employee benefits 5 362 824 - Occupancy, insurance and equipment expense 1 405 373 - ATM processing 791 771 - Deposit insurance expense 120 000 - Data processing 855 392 - Directors fees 163 633 - Postage and freight 133 314 - Printing and office supplies 218 800 - Legal and professional services 244 130 - Telephone 98 109 - Marketing 90 057 - Management fee paid - 1 710 886 Other operating expenses 832 385 - TOTAL OTHER EXPENSES 10 315 788 1 710 886 NET INCOME $ 5 222 056 $ 309 257
See independent auditors' report on supplementary information.

50
CHURCH STREET POLK CO. TITLE ELIMINATING CONSOLIDATED FINANCIAL COMPANY, INC. ENTRIES TOTALS $ - $ - $ - $ 6 518 240 - - - 2 585 133 - - - 732 906 - - - 1 534 368 - - - 11 370 647 - - - 464 944 - - - 454 - - - 10 905 249 - - - 240 000 - - - 10 665 249 - - - 1 870 896 - - - 1 761 807 - - (1 043 018) - 714 735 - - 714 735 - - - 2 020 143 1 710 886 - (1 710 886) - 19 000 - - 28 050 - - (144 000) 43 824 2 444 621 - (2 897 904) 6 439 455 1 336 843 - - 6 699 667 185 648 - (144 000) 1 447 021 - - - 791 771 - - - 120 000 32 538 - - 887 930 12 000 - - 175 633 3 219 - - 136 533 10 334 - - 229 134 12 279 - - 256 409 6 932 - - 105 041 10 802 - - 100 859 - - (1 710 886) - 100 213 52 - 932 650 1 710 808 52 (1 854 886) 11 882 648 $ 733 813 $ (52) $ (1 043 018) $ 5 222 056

51
THE FIRST NATIONAL BANK OF LIVINGSTON AND SUBSIDIARIES CONSOLIDATING STATEMENT OF INCOME
For the Year Ended December 31, 2017 THE FIRST FNB NATIONAL BANK BROKERAGE OF LIVINGSTON SERVICES LLC Interest Income: Interest and fees on loans $ 6 224 701 $ - Interest on Investment Securities: Taxable 2 179 662 - Exempt from Federal income tax 1 089 678 - Interest on deposits in banks 1 167 528 - TOTAL INTEREST INCOME 10 661 569 - Interest expense on deposits 442 102 - Interest on Federal funds purchased 1 018 - NET INTEREST INCOME 10 218 449 - Provision for loan losses 240 000 - NET INTEREST INCOME AFTER PROVISION FOR LOAN LOSSES 9 978 449 - Other Income: Service charges on deposit accounts 1 909 860 - Other service charges and fees 1 741 283 - Equity in earnings of subsidiaries 824 901 - Insurance commissions - - Brokerage commissions (net) - 1 755 992 Management fee - - Gain/(loss) other (1 130) - Other income 190 266 - TOTAL OTHER INCOME 4 665 180 1 755 992 Other Expenses: Salaries and employee benefits 5 172 535 - Occupancy, insurance and equipment expense 1 393 233 - ATM processing 737 766 - Deposit insurance expense 159 995 - Data processing 807 481 - Directors fees 173 819 - Postage and freight 130 591 - Printing and office supplies 202 909 - Legal and professional services 235 517 - Telephone 102 624 - Marketing 79 254 - Management fee paid - 1 571 046 Other operating expenses 822 507 - TOTAL OTHER EXPENSES 10 018 231 1 571 046 NET INCOME $ 4 625 398 $ 184 946
See independent auditors' report on supplementary information.

52
CHURCH STREET POLK CO. TITLE ELIMINATING CONSOLIDATED FINANCIAL COMPANY, INC. ENTRIES TOTALS $ - $ - $ - $ 6 224 701 - - - 2 179 662 - - - 1 089 678 - - - 1 167 528 - - - 10 661 569 - - - 442 102 - - - 1 018 - - - 10 218 449 - - - 240 000 - - - 9 978 449 - - - 1 909 860 - - - 1 741 283 - - (824 901) - 639 906 - - 639 906 - - - 1 755 992 1 571 046 - (1 571 046) - - - - (1 130) - - (144 000) 46 266 2 210 952 - (2 539 947) 6 092 177 1 192 936 - - 6 365 471 178 455 - (144 000) 1 427 688 - - - 737 766 - - - 159 995 24 305 - - 831 786 12 000 - - 185 819 3 475 - - 134 066 13 198 - - 216 107 12 113 - - 247 630 9 140 - - 111 764 11 411 - - 90 665 - - (1 571 046) - 113 964 - - 936 471 1 570 997 - (1 715 046) 11 445 228 $ 639 955 $ - $ (824 901) $ 4 625 398

Report Item
1:
2a:
100%
100%
100% 100%
No LEI is available for any entity listed above.
Organization Chart
Incorporated in Texas
Livingston, Texas
TBL Insurance Agency, Inc.
Incorporated in Texas
Livingston, Texas
Polk County Title Co., Inc.
Form FR Y‐6
Incorporated in Texas
Livingston, Texas
FNB Company
Livingston, Texas
The First National Bank of Livingston
Fiscal Year Ending December 31, 2018
Livingston, Texas
FNB Company
The BHC does prepare an annual report for its shareholders. Enclosed are two copies of the annual report.

Report Item 2b: Domestic Branch Listing
FNB Company ID# 630658
Data Action Effective Date
Branch Service Type Branch ID_RSSD*
Popular Name Street Address City State Zip Code County Country FDIC UNINUM* Office Number* Head Office Head Office ID_RSSD*
Comments
Ok Full Service (Head
Office)
630658 FIRST NATIONAL BANK OF
LIVINGSTON, THE
2121 HWY 190 WEST LIVINGSTON TX 77351 POLK UNITED STATES Not Required Not Required FIRST NATIONAL BANK OF
LIVINGSTON, THE
630658
Ok Full Service 2114796 DOWNTOWN BRANCH 308 WEST CHURCH STREET LIVINGSTON TX 77351 POLK UNITED STATES Not Required Not Required FIRST NATIONAL BANK OF
LIVINGSTON, THE
630658
Ok Full Service 1464234 ONALASKA BRANCH 14114 US HIGHWAY 190 WEST ONALASKA TX 77360 POLK UNITED STATES Not Required Not Required FIRST NATIONAL BANK OF
LIVINGSTON, THE
630658

(1)(a) (1)(b) (1)(c) (2)(a) (2)(b) (2)(c)
Name & Address (City, State, Country)
Country of Citizenship or Incorporation
Number and Percentage of Each Class of Voting Securities
Name & Address (City, State, Country)
Country of Citizenship or Incorporation
Number and Percentage of Each Class of Voting Securities
Carey L. Cochran, Jr. USA 21,208 common 16.52% N/A
Livingston, TX
Ernest H. Cochran USA 8,610 common 6.71%Bypass Trust B
Livingston, TX
Ernest H Cochran USA 11,124 common 8.67%Residuary Trust C
Livingston, TX
The John Guy Slocomb USA 14,335 common 11.17%Family Trust
Livingston, TX
Constance Slocomb USA 19,421** common 15.13%Livingston, TX
Judy Cochran USA 21,354* common 16.64%Livingston, TX
Malcolm Jones USA 19,934* common 15.53%Livingston, TX
** Includes 14,335 shares common reported under The John Guy SlocombFamily Trust of which Mrs. Slocomb is trustee.
Judy Cochran & Malcolm Jones, Trustees
Judy Cochran & Malcolm Jones, Trustees
Constance Slocomb, Trustee
* Includes 19,734 shares common reported under Ernest H CochranTrusts of which Mrs. Cochran & Mr. Jones are trustees.
Form FR Y-6
FNB CompanyLivingston, TX
Fiscal Year Ending December 31, 2018
Report Item 3: Securities Holders
Current Securities Holders with ownership, control or holdings of 5% or more with power to vote as of fiscal year ending 12-31-2018
Securities Holders not listed in 3(1)(a) through (3)(1)(c) that had ownership, control or holdings of 5% or more with power to vote during the fiscal year ending 12-31-2018

(1) (2) (3)(a) (3)(b) (3)(c) (4)(a) (4)(b) (4)(c)Names & Address (City, State, Country)
Principal Occupation if other than with holding company
Title & Position with holding company
Title & Position with Subsidiaries (include names of subsidiaries)
Title & Position with Other Businesses (include names of other businesses)
Percentage of Voting Securities in holding company
Percentage of Voting Securities in Subsidiaries (include names of subsidiaries)
List names of other companies (includes partnerships) if 25% or more of voting securities are held (List names of companies and percentage of voting securities held)
Judy Cochran Investments Director Director-FNB 16.64% NONE 25% Livingston Lands, Inc.Livingston, Texas, USA
C.L. Cochran, Jr. Merchant Director Director-FNB Pres-Cochran Funeral Home 16.52% NONE 100% Cochran Funeral HomeLivingston, Texas, USA
R. Malcolm Jones Attorney Sr. Chm N/A 15.53% NONE N/A
Livingston, Texas, USA
Constance T. Slocomb Attorney/CPA Director Director-FNB 15.13% NONELivingston, Texas, USA
Richard L. Gilbert Safety Advisor Director Director-FNB N/A 3.99% NONE N/ALivingston, Texas, USA
Linda Nadolski Retired/Interior Designer Director Director-FNB N/A 3.33% NONE N/ALivingston, Texas, USA
John Thompson Consultant Director Director-FNB N/A 2.06% NONE N/ALivingston, Texas, USA
Zonna Craig Retired/Banking Director Director-FNB N/A 1.73% NONE N/ALivingston, Texas, USA
John Haynes Equipment Manufacturing Director Director-FNB 1.48% NONELivingston, Texas, USA
J.E. Peters, Jr. Investments/Ranching Director Director-FNB 1.15% NONE N/ALivingston, Texas, USA
A.C. Evans, Jr. Banker N/A 0.97% NONE N/ALivingston, Texas, USA
President CEO/Director-FNB Director-TBL Ins
N/A
(1)(a)(b)(c) and (2)(a)(b)(c)
Sr. Chm-FNB Director-TBL Ins.
Pres-Livingston Lands, Inc. Director-JAR Partnership
Pres-L.B. Equipment, Inc. V.P.-Little Beaver, Inc.
Director-Peters Tractor & Equipment
N/A
50% H & H Leasing; 50% L.B. Equipment, Inc; 50% Little Beaver
Form FR Y-6
FNB CompanyLivingston, TX
Fiscal Year Ending December 31, 2018
Report Item 4: Insiders
President CEO/Director Treasurer
Page 1 of 2

(1) (2) (3)(a) (3)(b) (3)(c) (4)(a) (4)(b) (4)(c)Names & Address (City, State, Country)
Principal Occupation if other than with holding company
Title & Position with holding company
Title & Position with Subsidiaries (include names of subsidiaries)
Title & Position with Other Businesses (include names of other businesses)
Percentage of Voting Securities in holding company
Percentage of Voting Securities in Subsidiaries (include names of subsidiaries)
List names of other companies (includes partnerships) if 25% or more of voting securities are held (List names of companies and percentage of voting securities held)
(1)(a)(b)(c) and (2)(a)(b)(c)
Form FR Y-6
FNB CompanyLivingston, TX
Fiscal Year Ending December 31, 2018
Report Item 4: Insiders
Claud Thomas Building Materials Director Director-FNB Pres-Thomas Supply, Inc. 0.86% NONE Thomas Supply, Inc.-52%Livingston, Texas, USA
Craig Anderson Evans Insurance/Investments Director N/A 0.60% NONE N/ALivingston, Texas, USA
John Allen Slocomb Banker Director N/A 0.16% NONE N/ALivingston, Texas, USA
Cindy Snook Banker Director N/A 0.16% NONELivingston, Texas, USA
Kyle J. Kuntz Electric Power Distribution Director Director-FNB CEO-Sam Houston Electric Co-op 0.16% NONE N/ALivingston, Texas, USA
Russell Thomas Building Materials Director Director-FNB Director-Thomas Supply 0.24% NONE Thomas Supply Inc- 48%Livingston, Texas, USA
Director/Sr. Vice President-FNB
50% Snook Roofing and Sheet Metal, LLC
Director/Vice President-TBL Ins.
Director/Sr. Vice President-FNB
Page 2 of 2