Embed Size (px)
Citation preview
Health andConsumers
Annual Report on surveillancefor avian influenza inpoultry and in wild birds in Member States of theEuropean Unionin 2012


Annual Report on surveillance for avian influenza
in poultry and wild birds in Member States of the European Union in
2012
EUROPEAN UNION REFERENCE LABORATORY FOR AVIAN INFLUENZA

2
About the report The work of EU Member States' veterinary administrations, veterinary laboratories and others (such as ornithologists, bird watching organisations and hunters) involved in the sampling, laboratory testing and gathering of data for the avian influenza surveys in poultry and wild birds is specifically acknowledged. This report was prepared by the European Union Reference Laboratory for Avian Influenza, Animal Health and Veterinary Laboratories Agency (AHVLA), Weybridge, Addlestone, Surrey, KT15 3NB, United Kingdom, according to its work programme. It was prepared by Daisy Duncan, Emma Wittmann, Joanna Tye and David Stroud under the main responsibility of: Dr Andrew C. Breed Tel: +44 1932 357 773 Email: [email protected] and the Director of the EU reference laboratory for avian influenza: Prof. Ian H. Brown Tel: +44 1932 357 339 Email: [email protected] The European Commission is responsible for the evaluation and approval of the surveillance programmes submitted by Member States and the EU financial contribution to their implementation. For more information please contact: Dr. Valentina Piazza, Unit G5 - Veterinary programmes Tel. +32 2 29 62975 Email: [email protected] The European Commission is also responsible for the collection of the surveillance data from Member States via an online reporting system operated by the Commission services of Directorate General for Health and Consumers (DG SANCO). For more information on that system and the Annual Report please contact: Dr. Maria Pittman, Unit G2-Animal Health Tel: +32-2-29 92842 Email: [email protected] The European Commission is responsible for the final revision of the Annual Report on surveillance for avian influenza in poultry in the European Union and its publication on the Commission's website: http://ec.europa.eu/food/animal/diseases/controlmeasures/avian/eu_resp_surveillance_en.htm Reproduction is authorised, provided the source is acknowledged, save where otherwise stated. The views or positions expressed in this report do not necessarily represent in legal terms the official position of the European Commission. The European Commission assumes no responsibility or liability for any errors or inaccuracies that may appear.

3
1 EXECUTIVE SUMMARY
Background Avian Influenza (AI) is a highly contagious viral infection, which can affect all species of birds. Highly Pathogenic Avian Influenza (HPAI) viruses can spread rapidly, causing serious disease with high mortality in many bird species. To date all HPAI viruses have been of H5 or H7 subtypes. The on-going H5N1 HPAI epidemic has affected over 60 countries across Asia, Africa and Europe, resulting in the loss of hundreds of millions of birds and causing major socio-economic impacts. Low Pathogenicity Avian Influenza (LPAI) viruses usually cause only mild disease in poultry however LPAI strains of haemagglutinin subtype H5 or H7 have the potential to mutate to HPAI viruses following introduction to poultry populations. Birds of the Orders Anseriformes and Charadriiformes are the major reservoirs for LPAI viruses. Although historically HPAI infection has been rarely observed in wild birds and almost exclusively in connection with poultry outbreaks, since the continuing outbreaks of H5N1 HPAI, wild birds have been implicated in the spread of the virus. In 2003 the European Union (EU) introduced an annual serological survey in poultry to detect subclinical or prior infection with AI of subtypes H5 and H7 and complement early detection systems. Wild bird surveillance and the reporting of the results have been compulsory since 2005 in the EU.
Timing and mandate The present survey was conducted between January and December 2012 according to Council Directive 2005/94/EC on Community measures to control avian influenza and guidelines laid down in Commission Decision 2010/367/EU.
Poultry survey participation Twenty-seven Member States (MS) participated in the poultry survey in 2012. In addition, one non-MS country (Switzerland) undertook active surveillance of avian influenza in poultry in 2012 and submitted data for this report. Ten MS followed a risk-based sampling approach in poultry. In total, 29,404 holdings were sampled, which compares to 29,806 poultry holdings in 2011, 29,484 in 2010, 35,016 in 2009, and 34,985 in 2008. The most frequently sampled poultry category in 2012 was Laying Hens (conventional and free-range), making up 30.0% of the total holdings sampled by EU MS, followed by Backyard Flocks (19.4%) and Chicken Breeders (17.9%). The least sampled poultry category was Ratites (0.7%), reflecting the low proportion of ratite holdings across the EU (0.05% of total holdings reported).
Poultry survey results In the 2012 EU serological survey for avian influenza in poultry, evidence of previous infection with H5 or H7 avian influenza according to Directive 2005/94/EC was detected in 43 holdings (0.15% of total holdings sampled). Forty holdings were serologically positive for subtype H5 and four for subtype H7, including one holding seropositive for both subtypes. The detection rate in Breeder Ducks (8.5%) and Breeder Geese (2.6%) was considerably higher than other poultry categories across the EU. Fattening Ducks had the third highest detection rate at 0.8%.
Holdings seropositive for H5 In 2012, 40 holdings were serologically positive for subtype H5 (0.14% of holdings sampled), including one holding that was also seropositive for subtype H7. This is less than in previous survey years. For example, in 2011, 50 holdings were found serologically positive for H5 (0.17% of holdings sampled), 48 were recorded in 2010 (0.16% of holdings sampled), and in 2009 and 2008, 52 holdings in each year were reported as serologically positive for H5 (0.15% of holdings sampled in each year). Of the 40 holdings reported to be seropositive in 2012, 22 underwent follow-up testing for the presence of active infection and one of these (1/22, 4.5%) tested positive for subtype H5 by PCR (an indicator of active infection).
Holdings seropositive for H7 In 2012, there were four holdings serologically positive for subtype H7 (0.01% of holdings sampled), including one holding that was also seropositive for subtype H5. This is less than in previous survey years. For example, in 2011, 15 holdings were found serologically positive for H7 (0.05% of holdings sampled), 11 were reported in 2010 (0.04% of holdings sampled), 38 in 2009 (0.11% of holdings sampled) and 21 in 2008 (0.06% of holdings sampled). Of the four holdings reported to be seropositive in 2012, three underwent follow-up testing for the presence of active

4
infection and one of these (1/3, 33.3%) tested positive for subtype H7 by PCR (an indicator of active infection).
Poultry survey summary The poultry survey continues to improve knowledge on which sectors of the poultry industry are more likely to be infected by H5 or H7 avian influenza viruses (e.g. Breeder Ducks and Breeder Geese) and identified other sectors which are consistently less likely to be affected (e.g. conventional and free-range Broilers, Turkey Breeders and Ratites). The sampling regimes among MS are diverse with different degrees of targeting and testing frequencies. Hence differences in between-flock detection rates for poultry categories or MS need to be interpreted with great caution. In particular, those MS undertaking risk-based sampling may experience higher seropositive detection rates than those using representative sampling. The on-going review of the results of avian influenza surveillance, together with the global picture of avian influenza and scientific research in this field, will further improve AI disease prevention whilst ensuring development of resource efficient programmes consistent with the overall objectives.
Wild bird survey participation According to the guidelines (EC, 2010) implementation of passive surveillance in wild birds (found dead, injured and live with clinical signs) is compulsory and hence EU co-financed. Data on active surveillance has only been included in the present report from MS that chose to submit data from their national surveys. A total of 6,508 wild birds, from 24 MS of the European Union and one Non-Member State (Switzerland) were tested by passive surveillance during the 2012 survey. There were no reported cases of H5N1 HPAI detected in Europe in 2012 although global surveillance indicates that some strains of virus continue to be detected in wild bird populations in Asia and endemic infection persists in poultry in Egypt with occasional spread in the region thereby presenting an ongoing threat to the EU. The results of the survey in 2012 are similar to 2011 when HPAI was not detected, and this is in contrast to the situation seen in 2008, 2009 and 2010 when, in each year, one MS (the United Kingdom, Germany and Bulgaria respectively) detected a single incident of the virus in wild birds. Only limited inferences can be made by direct comparisons of detections in different MS, species and years. The non-random nature of the sampling means that the proportion positive observed in a species, MS or time period cannot be assumed to be the true prevalence in the population sampled.
Wild bird survey results In 2012, LPAI viruses of subtypes H5 or H7 were detected in three of the birds sampled by passive surveillance in Hungary. These were two Mallards (Anas platyrhynchos) and one Black-crowned Night Heron (Nycticorax nycticorax).
Wild bird survey summary There is some evidence for ability of wild birds to transfer H5N1 HPAI from one area to another over relatively large distances. However the exact role and particular species involved in the epidemiology of H5N1 HPAI is not clear. H5N1 HPAI is currently circulating in poultry in Asia and North Africa. The North African areas where H5N1 HPAI is endemic in poultry include wetlands on major waterbird migratory flyways where large numbers of birds will spend time before moving into Europe. The EU survey provides detection of AI incidents in wild birds, independent of outbreaks in poultry, illustrating the value and role of wild bird surveillance as a potential early detection and monitoring system for the presence of H5N1 HPAI in the EU.

5
ABBREVIATIONS AND GLOSSARY
Table 1 Key to Member State abbreviations
*Non-EU MS
Table 2 Key to poultry category abbreviations
Poultry species and production categories included in the poultry survey, as referenced in Commission Decision 2010/367/EU (EC 2010).
Abb. Category CB Chicken Breeders LH Conventional Laying Hens
FR LH Free-range Laying Hens B Conventional Broilers
FR B Free-range Broilers FT Fattening Turkeys TB Turkey Breeders FD Fattening Ducks BD Breeder Ducks FG Fattening Geese BG Breeder Geese BYF Backyard Flocks GB Farmed Game Birds R Ratites O Others
Abb. Country AT Austria BE Belgium BG Bulgaria CY Cyprus CZ Czech Republic DE Germany DK Denmark EE Estonia EL Greece ES Spain FI Finland FR France HU Hungary IE Ireland IT Italy LT Lithuania LU Luxembourg LV Latvia MT Malta NL Netherlands PL Poland PT Portugal RO Romania SE Sweden SI Slovenia SK Slovak Republic UK United Kingdom CH* Switzerland

6
ADNS: Animal Disease Notification System http://ec.europa.eu/food/animal/diseases/adns/index_en.htm
AI: Avian Influenza as defined in Directive 2005/94/EC (EC 2006a)
EURL: European Union Reference Laboratory for avian influenza, AHVLA-Weybridge
DG SANCO: Directorate General for Health and Consumers, European Commission
EU: European Union
EU 27: Refers to the 27 Member States of the European Union in 2012
HPAI: Highly Pathogenic Avian Influenza
HPAIV: Highly Pathogenic Avian Influenza virus
LPAI: Low Pathogenicity Avian Influenza defined as LPAI caused by AI viruses of the H5 and H7 subtype according to Directive 2005/94/EC (EC 2006a)
LPAIV: Low Pathogenicity Avian Influenza virus of the H5 and H7 subtype
LPAIV of 'other subtype': Low Pathogenicity Avian Influenza virus of subtype other than H5 or H7
MS: Member State(s)
NUTS: Nomenclature of Units for Territorial Statistics. For example, at NUTS 3 level this refers to a region, district, county, municipal or unitary authority (depending on the MS).
PCR: Polymerase chain reaction is a laboratory methodology that acts through the amplification of specific viral nucleic acid from clinical specimens.
Positive poultry holding: For the purpose of this report a poultry holding is considered positive if at least one sample from that holding tested positive on either serology or PCR or viral isolation.
Poultry holding: A facility used for the rearing or keeping of breeding or productive poultry, as defined in Council Directive 2009/158/EC (EC 2009). For the purposes of avian influenza surveillance, this may include facilities that only contain poultry during certain months of the year (i.e. poultry do not need to be present all year round).
TS: Target species. Wild birds, in particular migratory water birds, that have been shown to be at a higher risk of becoming infected with, and transmitting the HPAI H5N1 virus, as referenced in Commission Decision 2010/367/EU (EC 2010).
VI: Virus isolation is a laboratory methodology that enables the propagation of infectious virus directly from clinical specimens.

7
Table of Contents 1 EXECUTIVE SUMMARY .............................................................................................................. 3
ABBREVIATIONS AND GLOSSARY ............................................................................................. 5
2 INTRODUCTION......................................................................................................................... 13
2.1 Objectives ............................................................................................................................ 13
2.1.1 Poultry ................................................................................................................................... 13
2.1.2 Wild Birds .............................................................................................................................. 14
2.2 Framework of Reporting ...................................................................................................... 14
2.2.1 Poultry ................................................................................................................................... 14
2.2.2 Wild Birds .............................................................................................................................. 15
2.3 Structure of Report .............................................................................................................. 15
3 RESULTS ................................................................................................................................... 16
3.1 Poultry.................................................................................................................................. 16
3.1.1 Holdings sampled.................................................................................................................. 16
3.1.2 Laboratory results ................................................................................................................. 18
3.1.2.1 H5 avian influenza ................................................................................................ 21
3.1.2.2 H7 avian influenza ................................................................................................ 21
3.1.2.3 Other LPAI subtypes............................................................................................. 22
3.1.2.4 Summary............................................................................................................... 22
3.1.3 Poultry categories ................................................................................................................. 25
3.1.3.1 Chicken Breeders ................................................................................................. 25
3.1.3.2 Conventional Laying Hens and Free-range Laying Hens..................................... 25
3.1.3.3 Conventional Broilers and Free-range Broilers..................................................... 26
3.1.3.4 Fattening Turkeys and Turkey Breeders .............................................................. 26
3.1.3.5 Fattening Ducks and Breeder Ducks .................................................................... 26
3.1.3.6 Fattening Geese and Breeder Geese................................................................... 27
3.1.3.7 Backyard Flocks.................................................................................................... 28
3.1.3.8 Game Birds ........................................................................................................... 28
3.1.3.9 Ratites ................................................................................................................... 28
3.1.3.10 Others ................................................................................................................. 29
3.1.3.11 Summary............................................................................................................. 29
3.2 Wild Birds............................................................................................................................. 34
3.2.1 Sampling by passive surveillance ......................................................................................... 34
3.2.1.1 Overview ............................................................................................................... 34
3.2.1.2 Geographical targeting.......................................................................................... 35
3.2.1.3 Seasonal targeting ................................................................................................ 36
3.2.1.4 Targeting of bird species....................................................................................... 38
3.2.2 H5N1 HPAI Positives ............................................................................................................ 40
3.2.3 LPAI Positives ....................................................................................................................... 40
3.2.3.1 Overview of LPAI results....................................................................................... 40
3.2.3.2 Geographical distribution of LPAI H5 detections .................................................. 42
3.2.3.3 Temporal distribution of LPAI H5 detections ........................................................ 43

8
3.2.3.4 Order and species of positive wild birds ............................................................... 44
3.3 Poultry and Wild Bird Survey Results by Member State ..................................................... 45
4 DISCUSSION.............................................................................................................................. 67
4.1 Poultry.................................................................................................................................. 67
4.2 Wild Birds............................................................................................................................. 68
5 METHODS .................................................................................................................................. 70
5.1 Poultry.................................................................................................................................. 70
5.1.1 Survey design ....................................................................................................................... 70
5.1.2 Laboratory testing ................................................................................................................. 72
5.1.3 Data and data processing ..................................................................................................... 75
5.2 Wild Birds............................................................................................................................. 77
5.2.1 Survey design ....................................................................................................................... 77
5.2.2 Laboratory testing ................................................................................................................. 77
5.2.3 Data and data processing ..................................................................................................... 77
6 REFERENCES............................................................................................................................ 80
7 ANNEXES................................................................................................................................... 81
7.1 Poultry Survey...................................................................................................................... 81
7.1.1 Annex 1 Details of prevalence by poultry category and MS for 2012 and 2011................... 81
7.1.2 Annex 2 Additional information on results of the 2012 poultry survey.................................. 91
7.2 Wild Bird Survey .................................................................................................................. 95
7.2.1 Annex 3 Passive surveillance data ....................................................................................... 95
7.2.1.1 Diagnosis .............................................................................................................. 95
7.2.1.2 AI Positives by passive surveillance ..................................................................... 95
7.2.1.3 Passive surveillance by quarter ............................................................................ 96
7.2.1.4 Overview of passive surveillance results by species ............................................ 97
7.2.2 Annex 4 Reported active surveillance data ........................................................................ 100
7.2.2.1 Overview of reported active surveillance ............................................................ 100
7.2.2.2 Geographical targeting of reported active surveillance ...................................... 101
7.2.2.3 Seasonal targeting of reported active surveillance............................................. 102
7.2.2.4 Bird species sampled by reported active surveillance........................................ 104
7.2.2.5 H5N1 HPAI Positives by reported active surveillance ........................................ 106
7.2.2.6 LPAI Positives by reported active surveillance ................................................... 106
7.2.2.7 Geographical distribution of LPAI H5/H7 detections by reported active surveillance........................................................................................................................................ 107
7.2.2.8 Temporal distribution of LPAI H5/H7 detections by reported active surveillance108
7.2.2.9 Order and species of wild birds positive for LPAI H5/H7 by reported active surveillance ..................................................................................................................... 109
7.2.3 Annex 5 Reported active surveillance data, supplementary tables and figures ................. 110
7.2.3.1 Diagnosis ............................................................................................................ 110
7.2.3.2 AI Positives by reported active surveillance ....................................................... 110
7.2.3.3 Reported active surveillance by quarter ............................................................. 111
7.2.3.4 Overview of reported active surveillance results by species .............................. 112
7.2.4 Annex 6 Scientific and English Names of Wild Birds Species............................................ 115

9
List of Figures
Figure 1 Total number of holdings sampled and found seropositive for influenza A virus subtypes H5 and H7 by Member State in 2012............................................................................................. 19 Figure 2 Total number of holdings sampled and found seropositive for influenza A virus subtypes H5 and H7 by poultry category in Member States in 2012 ............................................................ 20 Figure 3 Total number of H5 and H7 serologically positive holdings by Member State in 2012 ... 21 Figure 4 Map of the intensity of sampling in the EU AI poultry survey and holdings testing serologically positive for H5 and H7 in 2012.................................................................................. 23 Figure 5 Total number of holdings found serologically positive for influenza A virus subtypes H5 and H7 by poultry category across Member States in 2012 .......................................................... 32 Figure 6 Total number of birds sampled by passive surveillance in 2012 by Member States – Non-MS data included ........................................................................................................................... 34 Figure 7 Map of the intensity of sampling by passive surveillance across Member States in 2012 – EU-data only .................................................................................................................................. 35 Figure 8 Proportion of all birds sampled by passive surveillance in 2012, by quarter and MS. Raw numbers of birds sampled by quarter and MS are shown in the table below – Non-MS data included.......................................................................................................................................... 36 Figure 9 Proportion of birds sampled by passive surveillance in each quarter for Member States – EU-data only .................................................................................................................................. 37 Figure 10 Temporal distribution of the total number of birds sampled by passive surveillance during 2012 – Non-MS data included ............................................................................................ 37 Figure 11 Proportion of TS and non-TS sampled by passive surveillance in 2012, by Member State – Non-MS data included ....................................................................................................... 39 Figure 12 Map of the intensity of sample submissions from passive surveillance and the distribution of LPAI H5 and other influenza detections in wild birds in EU Member States in 2012 – EU-data only .................................................................................................................................. 42 Figure 13 Number and week of detection of LPAI H5 positive wild birds detected through passive surveillance in 2012 – EU-data only .............................................................................................. 43 Annex 4 Figure 1 Total number of birds sampled by reported active surveillance in 2012 by EU Member State............................................................................................................................... 100 Annex 4 Figure 2 Map of the intensity of reported sampling by active surveillance across Member States in 2012 .............................................................................................................................. 101 Annex 4 Figure 3 Proportion of all birds sampled by reported active surveillance in 2012, by quarter and Member States ......................................................................................................... 102 Annex 4 Figure 4 Proportion of birds sampled by reported active surveillance in each quarter for EU Member States....................................................................................................................... 103 Annex 4 Figure 5 Temporal distribution of the total number of birds sampled by reported active surveillance during 2012 .............................................................................................................. 103 Annex 4 Figure 6 Proportion of TS and non-TS sampled by reported active surveillance in 2012, by Member State.......................................................................................................................... 105 Annex 4 Figure 7 Intensity of sample submission from reported active surveillance, and distribution of LPAI H5 detections in wild birds in EU Member States in 2012............................ 107 Annex 4 Figure 8 Intensity of sample submission from reported active surveillance, and distribution of LPAI H7 detections in wild birds in EU Member States in 2012............................ 107 Annex 4 Figure 9 Number and week of detection of LPAI H5 (in red) and H7 (in green) positive birds detected through active surveillance reported in 2012, by EU Member State.................... 108 Annex 4 Figure 10 Number of LPAI H5 and H7 detections and the number of wild birds sampled by reported active surveillance in the EU by week in 2012 ......................................................... 108

10
List of Tables
Table 1 Key to Member State abbreviations.................................................................................... 5
Table 2 Key to poultry category abbreviations................................................................................. 5
Table 3 Number of holdings sampled and total number of holdings reported in regions where sampling took place, by poultry category across Member States in 2012..................................... 17
Table 4 Number of serological and virological H5 and H7 positive holdings by Member State in 2012 ............................................................................................................................................... 24
Table 5a Total number of H5 seropositive and sampled holdings in 2012 and 2011 by poultry category.......................................................................................................................................... 31
Table 5b Total number of H7 seropositive and sampled holdings in 2012 and 2011 by poultry category.......................................................................................................................................... 31
Table 6 Total number of holdings sampled and those found H5 or H7 seropositive by poultry category across Member States in 2012 ....................................................................................... 33
Table 7 Wild bird Orders most frequently sampled in 2012 – Non-MS data included................... 38
Table 8 Wild bird species most frequently sampled in 2012 – Non-MS data included.................. 38
As in 2012, there have been no, or very low numbers of detections of LPAI H7 by passive surveillance in recent years: 2011 (0.01%), 2010 (none), 2009 (0.12%), 2008 (none), 2007 (0.01%) and 2006 (0.01%).Table 9 Total number and proportion of wild birds testing positive by passive surveillance for LPAI H5, other LPAI subtypes and other positives during 2012 – Non-MS data included.................................................................................................................................. 40
Table 10 AI detected through passive surveillance, by wild bird Order in EU Member States in 2012 – EU-data only ...................................................................................................................... 44
Table 11 AI detected through passive surveillance, by wild bird species in EU Member States in 2012 – EU-data only ...................................................................................................................... 44
Table 12 Number of holdings to be sampled of each poultry category (except turkey, duck and goose holdings).............................................................................................................................. 70
Table 13 Number of turkey, duck and goose holdings to be sampled........................................... 71
Table 14 Criteria and risk factors considered by Member States following a risk-based surveillance approach in their 2012 poultry survey programme .................................................... 73
Table 15 Information on holdings included under Others (where category species details were provided) ........................................................................................................................................ 76
Table 16 Summary of passive surveillance sampling strategies, as described in Member States 2012 wild bird survey plans............................................................................................................ 78
Annex 1 Table 1 Total number of Chicken Breeder holdings reported (from regions where sampling took place), total number sampled and total number of positive holdings reported for 2012 and 2011 by Member State................................................................................................... 81
Annex 1 Table 2 Total number of Conventional and Free-range Laying Hen holdings reported (from regions where sampling took place), total number sampled, and total number of positive holdings reported for 2012 and 2011 by Member State ................................................................ 82
Annex 1 Table 3 Total number of Conventional and Free-range Broiler holdings reported (from regions where sampling took place), total number sampled, and total number of positive holdings reported for 2012 and 2011 by Member State ............................................................................... 83
Annex 1 Table 4 Total number of Fattening Turkey and Turkey Breeder holdings reported (from regions where sampling took place), total number sampled, and total number of positive holdings reported for 2012 and 2011 by Member State ............................................................................... 84
Annex 1 Table 5 Total number of Fattening and Breeder Duck holdings reported (from regions where sampling took place), total number sampled, and total number of positive holdings reported for 2012 and 2011 by Member State ............................................................................................. 85
Annex 1 Table 6 Total number of Fattening and Breeder Geese holdings reported (from regions where sampling took place), total number sampled, and total number of positive holdings reported for 2012 and 2011 by Member State ............................................................................................. 86
11
Annex 1 Table 7 Total number of Backyard Flock holdings reported (from regions where sampling took place), total number sampled, and total number of positive holdings reported for 2012 and 2011 by Member State................................................................................................................... 87
Annex 1 Table 8 Total number of Game Bird holdings reported (from regions where sampling took place), total number sampled, and total number of positive holdings reported for 2012 and 2011 by Member State............................................................................................................................ 88
Annex 1 Table 9 Total number of Ratite holdings reported (from regions where sampling took place), total number sampled, and total number of positive holdings reported for 2012 and 2011 by Member State............................................................................................................................ 89
Annex 1 Table 10 Total number of Other holdings reported (from regions where sampling took place), total number sampled, and total number of positive holdings reported for 2012 and 2011 by Member State............................................................................................................................ 90
Annex 2 Table 1 Prevalence of holdings positive for subtype H5.................................................. 91
Annex 2 Table 2 Prevalence of holdings positive for subtype H7.................................................. 92
Annex 2 Table 3 Number of holdings positive for subtype H5 by serology, serology and PCR/virus isolation, or PCR/virus isolation only.............................................................................................. 93
Annex 2 Table 4 Number of holdings positive for subtype H7 by serology, serology and PCR/virus isolation, or PCR/virus isolation only.............................................................................................. 94
Annex 3 Table 1 Type of samples collected for wild birds sampled by passive surveillance in 2012, by status of bird - EU-data only............................................................................................ 95
Annex 3 Table 2 Test-results and samples taken by passive surveillance for found dead birds - EU-data only. ................................................................................................................................. 96
Annex 3 Table 3 Number of birds tested through passive surveillance by Member State (injured, diseased and dead birds) – Non-MS data included....................................................................... 96
Annex 3 Table 4 Number of TS sampled by passive surveillance in each quarter by Member State – Non-MS data included................................................................................................................. 97
Annex 3 Table 5 Detections of LPAI H5 (in brackets) that were reported by passive surveillance in TS (in bold) and non-TS and the number of those species sampled in each Member State – Non-MS data included ........................................................................................................................... 98
Annex 3 Table 6 Detections of all AI types (in brackets) reported by passive surveillance in TS (in bold) and non-TS and the number of those species sampled in each Member State - Non-MS data included.................................................................................................................................. 99
Annex 4 Table 1 Wild bird Orders most frequently sampled by reported active surveillance in 2012..................................................................................................................................................... 104
Annex 4 Table 2 Bird species most frequently sampled by reported active surveillance in 2012104
Annex 4 Table 3 Total number and proportion of birds testing positive by reported active surveillance for LPAI H5, H7 and other subtypes for Member States detecting LPAI viruses during 2012 ............................................................................................................................................. 106
Annex 4 Table 4 LPAI detected through reported active surveillance, by Order in 2012............ 109
Annex 4 Table 5 LPAI detected through reported active surveillance, by species in 2012......... 109
Annex 5 Table 1 Number and proportion of wild bird samples collected by reported active surveillance, by Status of bird in 2012 ......................................................................................... 110
Annex 5 Table 2 Test-results and samples taken for live healthy birds sampled by reported active surveillance in 2012 ..................................................................................................................... 110
Annex 5 Table 3 Test-results and samples taken for hunted birds without clinical signs sampled by reported active surveillance in 2012........................................................................................ 111
Annex 5 Table 4 Number of birds (hunted and live healthy birds) tested through reported active surveillance by Member State and quarter .................................................................................. 111
Annex 5 Table 5 Number of TS and non-TS sampled by reported active surveillance in each quarter by Member State ............................................................................................................. 112

12
Annex 5 Table 6 Detections of LPAI H5 (in brackets) that were reported by active surveillance in TS (in bold) and non-TS, and the number of those species sampled in each Member State ..... 113
Annex 5 Table 7 Detections of LPAI H7 (in brackets) that were reported by active surveillance in TS (in bold) and non-TS, and the number of those species sampled in each Member State ..... 113
Annex 5 Table 8 Detections of all AI subtypes (in brackets) that were reported by active surveillance in TS (in bold) and non-TS, and the number of those species sampled in each Member State............................................................................................................................... 114
Annex 6 Table 1 All target species (in bold) as well as all other bird species that tested positive for AI in 2012, giving English and Latin names................................................................................. 115

13
2 INTRODUCTION
Avian Influenza (AI) is a highly contagious viral infection, which can affect all species of birds. Highly Pathogenic Avian Influenza (HPAI) viruses can spread rapidly, causing serious disease with high mortality in many bird species. The ongoing H5N1 HPAI epidemic has affected over 60 countries across Asia, Africa and Europe, resulting in the loss of hundreds of millions of birds and causing major socio-economic impacts.
Low Pathogenicity Avian Influenza (LPAI) can be any one of the haemagglutinin subtypes H1 to H16 and usually causes only mild disease in poultry. LPAI viruses of the H5 and H7 subtypes have the potential to mutate to highly pathogenic strains while circulating within domestic poultry populations.
Wild birds of the Orders Anseriformes and Charadriiformes are thought to be the major reservoirs for LPAI viruses. Historically HPAI infections have been rarely observed in wild birds and almost exclusively in connection with poultry outbreaks. However, during the H5N1 HPAI epidemic, wild birds have been implicated in the spread of the HPAI virus (EFSA 2006).
The Scientific Committee on Animal Health and Animal Welfare (SCAHAW; 2000) recommended the implementation of serological surveys of poultry populations in MS in order to detect the presence of LPAI viruses of H5 and H7 subtypes.
Surveys for avian influenza in poultry and wild birds in MS were first carried out in 2003 under Commission Decision 2002/649/EC (EC 2002).
Wild bird surveillance and the reporting of the results became compulsory in the EU in 2005. Decision 2005/726/EC (EC 2005) laid down a first list of 'higher risk species'. Directive 2005/94/EC (EC 2006a) subsequently provided a better legal basis to carry out surveillance programmes in poultry and wild birds., Harmonised guidelines with more detailed requirements for wild birds surveillance were introduced in 2007 (EC, 2007). These programmes were aimed at identifying the risk of introduction of AI viruses (LPAI and HPAI) into domestic poultry.
In 2006 and 2007, application of this system was demonstrated when H5N1 HPAI activity was relatively widespread in wild birds and incursions to poultry were limited and controlled (Hesterberg et al. 2009).
Since 2008 the number of detections of H5N1 HPAI in Europe has reduced. Clade 2.2 viruses and their derivatives appear to have disappeared from wild birds globally, while clade 2.3.2 viruses and their derivatives have been reported from wild birds more recently including in the EU (Bulgaria in 2010). The most recent European Commission guidelines on surveillance for avian influenza in wild birds (see below) includes a list of “Target Species” that incorporates knowledge of the number of detections of H5N1 HPAI in the EU surveillance programme and recent findings on the epidemiology of this virus in wild birds.
2.1 Objectives
2.1.1 Poultry The objectives of the surveillance programme for avian influenza in poultry (as described in Commission Decision 2010/367/EU; EC 2010) are to inform the competent authority of circulating avian influenza virus with a view to controlling the disease in accordance with Directive 2005/94/EC (EC 2006a) by the annual detection through active surveillance for:
“(a) low pathogenicity avian influenza (LPAI) of subtypes H5 and H7 in gallinaceous birds (chickens, turkeys, guinea fowl, pheasants, partridges and quails) and ratites thereby complementing other existing early detection systems.

14
(b) LPAI of subtypes H5 and H7 and highly pathogenic avian influenza (HPAI) in domestic waterfowl (ducks, geese and mallards for re-stocking supplies of game).”
2.1.2 Wild Birds In 2012, the objective of EU wild bird AI surveillance, according to Commission Decision 2010/367/EU (EC 2010), is the timely detection of HPAI of the subtype H5N1 in wild birds in order to protect poultry in poultry holdings and safeguard veterinary public health. It is also stated that:
“(a) A risk-based surveillance (RBS) shall be implemented as a ‘passive’ surveillance system by laboratory investigation of moribund wild birds or birds found dead and it shall be specifically directed towards water bird species.
(b) Wild birds, in particular migratory waterbirds, that have been shown to be at a higher risk of becoming infected with, and transmitting the HPAI H5N1 virus, the ‘target species’ (TS), shall be specifically targeted.
(c) Areas close to the sea, lakes and waterways where birds were found dead; and in particular when these areas are in close proximity to poultry holdings, especially in areas where there is a high density of poultry holdings, shall be targeted.
(d) Close cooperation with epidemiologists and ornithologists and the competent authority for nature conservation shall be ensured in the preparation of the surveillance programme, assisting in species identification and optimising sampling adapted to the national situation.
(e) If the epidemiological situation for the HPAI H5N1 virus so requires, surveillance activities shall be enhanced by awareness raising and active searching and monitoring for dead or moribund wild birds, in particular for those belonging to TS. This could be triggered by the detection of the HPAI H5N1 virus in poultry and/or wild birds in neighbouring Member States and third countries or in countries which are linked via the movement of migratory wild birds, in particular those of TS, to the Member State concerned. In that case the specific migration patterns and wild bird species, which may vary in different Member States shall be taken into account.”
2.2 Framework of Reporting
2.2.1 Poultry Directive 2005/94/EC (EC 2006a) on Community measures to control avian influenza, introduced with Article 4, a new legal basis for the obligatory conduct of surveillance programmes in poultry populations, to detect infections with LPAI of H5 and H7 subtype.
In 2010, 2009 and 2008, the poultry surveys were performed according to the guidelines laid down in Commission Decision 2007/268/EC (EC 2007), which are available under: http://eur-lex.europa.eu/LexUriServ/LexUriServ.do?uri=OJ:L:2007:115:0003:0017:EN:PDF
In 2011, MS had the option of following the guidelines laid down in Commission Decision 2007/268/EC (EC 2007) or following new guidelines laid down in Commission Decision 2010/367/EU (EC 2010), which are available under: http://eur-lex.europa.eu/LexUriServ/LexUriServ.do?uri=OJ:L:2010:166:0022:0032:EN:PDF
For 2012, the poultry surveys were performed according to the guidelines of Commission Decision 2010/367/EU (EC 2010) and the survey programmes of the MS were evaluated and approved for co-financing through Decision 2011/807/EU (EC 2011): http://eur-lex.europa.eu/LexUriServ/LexUriServ.do?uri=OJ:L:2011:322:0011:0022:EN:PDF
Details of the survey programmes for each MS are available on the internet at: http://ec.europa.eu/food/animal/diseases/eradication/programme2012/2011_807_eu_en.pdf

15
Samples were tested in accordance with the Diagnostic Manual for avian influenza (EC 2006b).
Previous Annual Reports on surveillance for avian influenza in poultry can be found at: http://ec.europa.eu/food/animal/diseases/controlmeasures/avian/eu_resp_surveillance_en.htm
2.2.2 Wild Birds In 2012 the surveys were performed according to the guidelines laid down in Commission Decision 2010/367/EU (EC 2010) which are available at the DG SANCO website under: http://eur-lex.europa.eu/LexUriServ/LexUriServ.do?uri=OJ:L:2010:166:0022:0032:EN:PDF
For 2012, the survey programmes of the MS were evaluated and approved through the Decision 2011/807/EU (EC 2011).
Details of the survey programmes for each MS are available on the internet at: http://ec.europa.eu/food/animal/diseases/eradication/programme2012/2011_807_eu_en.pdf
Samples were tested in accordance with the Diagnostic Manual for avian influenza (EC 2006b).
Previous Annual Reports on surveillance for avian influenza in wild birds can be found at: http://ec.europa.eu/food/animal/diseases/controlmeasures/avian/eu_resp_surveillance_en.htm
2.3 Structure of Report
This report provides information on the surveillance of poultry and wild birds undertaken by MS in 2012 and is structured as follows:
• The Executive Summary provides an outline of the main findings and conclusions that can be drawn from these.
• The Introduction gives information on the objectives and framework for the surveillance carried out by the MS and also provides links to the Commission Decisions on which the surveillance is based.
• The Results section contains information on the results of the 2012 poultry survey and wild bird passive surveillance activities, including sampling effort and test results in MS.
• The Discussion section provides a summary of the findings and information on their importance in relation to the objectives of the survey.
• The Methods section includes information on the survey design, data received from the MS and methods of analysis of the data.
• The Annexes contain additional detailed tables on the sampling effort and test results of the poultry and wild bird surveys, including sampling effort and test results of wild bird active surveillance data, voluntarily submitted by MS.

16
3 RESULTS
3.1 Poultry
3.1.1 Holdings sampled All totals and overall proportions refer to 27 MS.
• In 2012, a total of 1,293,084 holdings were reported from regions where sampling took place among all MS, and 29,404 (2.3%) of these were sampled by the MS in their approved surveillance programmes. This compares to 29,806 holdings sampled in 2011, 29,484 holdings sampled in 2010, 35,016 holdings sampled in 2009, and 34,985 holdings sampled in 2008.
• In addition, Switzerland submitted data for 122 holdings that were sampled as part of the 2012 EU Poultry Survey.
• Of the 27 MS undertaking AI surveillance in poultry in 2012, ten MS (BE, BG, DE, DK, FI, FR, IT, LU, NL and UK) carried out a risk-based sampling approach, as described in Commission Decision (EC 2010). For more information on the risk-based surveillance approaches used by these MS, please see Table 14. In comparison in 2011 (the first year when MS had the option of using risk-based sampling), seven MS (ES, FR, LV, RO, SK, SE and UK) carried out a risk-based sampling approach.
• There was considerable variation in the number of holdings sampled among MS, varying from 16 holdings in Estonia to 9281 holdings in Italy. Thirteen MS sampled more holdings in total when compared to 2011 (AT, BG, CY, EL, FI, FR, IE, IT, LT, MT, NL, PL and SI), while 14 MS (BE, CZ, DE, DK, EE, ES, HU, LU, LV, PT, RO, SE, SK and UK) sampled less holdings in 2012. Some MS sampled individual holdings more than once during the period of the survey and hence the total reported number of holdings sampled during the survey exceeded the total number of holdings present for MS in certain poultry categories.
• Laying Hen holdings were sampled in 26 MS (excluding LT). This category (conventional and free-range) was the most frequently sampled poultry category, making up 30.0% (8821 of 29,404) of the total holdings sampled by EU MS in 2012, with the majority being sampled in NL (4047) and IT (2430).
• Twenty-two MS sampled Fattening Turkeys and Turkey Breeders (9.8%); 21 MS sampled Chicken Breeders (17.9%); 20 MS sampled Fattening Ducks and Breeder Ducks (3.8%) and also Game Birds (5.6%); 15 MS sampled Broilers (conventional and free-range) (4.5%), Fattening Geese and Breeder Geese (1.8%), and also Ratites (0.7%); 12 MS sampled Backyard Flocks (19.4%); and seven MS sampled Other poultry flocks (6.7%) – further details are given in Section 3.1.3 (Poultry categories).
• The total number of holdings reported (from regions where sampling took place) and the number sampled by MS in 2012 are displayed by poultry category in Table 3.

17
Table 3 Number of holdings sampled and total number of holdings reported in regions where sampling took place, by poultry category across Member States in 2012
The total number of holdings (from regions where sampling took place) is displayed in parentheses.
Chicken Breeders
Conventional Laying Hens
and Free-range Laying
Hens
Conventional Broilers and Free-range
Broilers
Fattening Turkeys and
Turkey breeders
Fattening Ducks and
Breeder Ducks
Fattening Geese and
Breeder Geese
Backyard Flocks Game Birds Ratites Others
Total Holdings
sampled and proportion of EU total
Total Holdings
reported and proportion of
EU total 30 118 53 14 45 9 269 1338
AT (35) (1095) (139) (14) (45) (10) 0.91% 0.10%145 400 4 49 25 2 18 1 644 686
BE (203) (396) (4) (35) (20) (4) (22) (2) 2.19% 0.05%7 21 4 56 1595 4 1 1688 405,177
BG (10) (51) (6) (98) (405,006) (5) (1) 5.74% 31.33%12 70 6 14 10 112 8602
CY (18) (37) (8) (8530) (9) 0.38% 0.67%60 34 42 10 42 188 285
CZ (146) (45) (42) (10) (42) 0.64% 0.02%53 4 53 36 8 18 8 8 102 290 168,783
DE (53,750) (1296) (1279) 1143 465 (47,608) 26 286 (62,930) 0.99% 13.05%532 292 5 46 16 1 258 1150 915
DK (452) (129) (17) (44) (62) (1) (210) 3.91% 0.07%15 1 16 17
EE (16) (1) 0.05% 0.00%48 45 48 26 9 3 56 235 697
EL (103) (366) (48) (54) (10) (5) (111) 0.80% 0.05%104 199 118 79 49 2 64 448 43 151 1257 23,157
ES (386) (926) (1254) (488) (54) (2) (12,399) (547) (101) (7000) 4.27% 1.79%53 75 46 2 1 5 2 184 616
FI (64) (491) (46) (2) (1) (10) (2) 0.63% 0.05%61 115 88 197 253 15 41 144 4 918 29,533
FR (1000)1 (7030)1 (6000)1 (4300)1 (4550) (133)1 (3000) (3500) (20)1 3.12% 2.28%17 57 65 90 113 485 21 2 850 248,305
HU (100) (424) (371) (332) (399) (246,626)2 (50) (3) 2.89% 19.20%108 118 48 44 2 2 322 405
IE (86) (186) (16) (115) (1) (1) 1.10% 0.03%677 2430 1686 223 66 2038 437 59 1665 9281 148,968
IT (321) (1609) (900) (168) (75) (143,445) (455) (78) (1917)3 31.56% 11.52%57 4 61 11
LT (9) (2) 0.21% 0.00%7 4 7 4 22 513
LU (8) (4) (500) (1) 0.07% 0.04%1 34 2 167 204 2819
LV (1) (34) (2) (2782) 0.69% 0.22%62 62 33
MT (33) 0.21% 0.00%3235 4047 839 180 81 8382 2158
NL (402) (1016) (641) (46) (53) 28.51% 0.17%59 112 79 92 170 36 40 588 3963
PL (493) (1150) (836) (174) (1170) (49) (91) 2.00% 0.31%55 58 60 55 13 66 55 3 1 366 237,414
PT (80) (134) (238) (131) (12) (236,735) (77) (3) (4) 1.24% 18.36%67 187 1 17 4 1106 24 2 1408 1034
RO (44) (208) (15) (9) (2) (737) (18) (1) 4.79% 0.08%36 78 34 22 3 20 23 4 220 471
SE (36) (328) (34) (22) (3) (20) (25) (3) 0.75% 0.04%8 61 46 90 6 2 213 4408
SI (9) (190) (46) (4155) (6) (2) 0.72% 0.34%11 42 2 12 6 1 16 7 97 183
SK (14) (89) (29) (12) (10) (1) (18) (10) 0.33% 0.01%8 65 67 101 65 71 377 2593
UK (65) (1070) (413) (278) (140) (627) 1.28% 0.20%5274 8821 1316 2866 1110 521 5691 1636 192 1977
EU Total (%) (3922) (70,912) (9611) (9341) (7020) (2467) (1,111,523) (5707) (616) (71,965) 29,404 1,293,08417.9% 30.0% 4.5% 9.8% 3.8% 1.8% 19.4% 5.6% 0.7% 6.7%
CH98
(3523)24
(63)122 3586
Notes on total number of holdings reported (in regions where sampling took place)1FR: The total number of holdings included for several poultry categories (CB, LH, FR LH, FR B, TB, BG and R) was based on data from 2011 (as this information was unavailable for 2012). 2HU: For the total number of BYF holdings only an estimate was available.3IT: The total number of holdings for 'O' in NUTS code region ITF6 was not known and so could not be included in the total number of holdings.
Number of holdings sampled (total number of holdings reported in regions where sampling took place)
Proportion figures for the total number of holdings sampled and total number of holdings reported are calculated based on the proportion of the EU total reported to the survey.

18
3.1.2 Laboratory results A total of 43 holdings tested positive by serology for previous exposure to AI virus subtypes H5 and H7. This included one holding that was seropositive for both subtypes. Five holdings tested positive by PCR for H5/H7, including four for subtype H5 (one was also seropositive and another was also VI positive for H5) and one for subtype H7 (which was also seropositive for H7). A further three holdings were reported as positive for subtypes other than H5 or H7 (identification of subtypes other than H5 and H7 is not a compulsory requirement of the surveillance and will depend on the laboratory method used), including one holding seropositive and PCR/VI positive for H9, one holding positive by virus isolation for the H4 subtype, and one holding positive by virus isolation for the H6 subtype. In comparison, 65 holdings were found seropositive for H5 and H7 in 2011, 59 in 2010, 90 in 2009 and 72 in 2008.
The non-MS country Switzerland did not detect any positive holdings in 2012, as was the case in 2011 and 2010.
Overall nine MS reported H5 or H7 seropositive holdings in 2012, including BE, CZ, DK, FI, FR, IT, NL, PL, and UK. These MS also reported seropositive holdings in 2011, as well as EL and SE. In addition, in 2012, DE and ES detected holdings positive for subtypes other than H5 or H7.
The total number of holdings sampled and found seropositive for influenza A virus subtypes H5 or H7 by MS in 2012 are displayed in Figure 1.
The total number of holdings sampled and found seropositive for influenza A virus subtypes H5 or H7 by poultry category in 2012 are displayed in Figure 2.
Figure 3 displays the total number of H5 and H7 serologically positive holdings by MS in 2012.
Figure 4 displays the intensity of sampling, as well as the holdings found seropositive in this survey, for subtype H5 (indicated by red circles) and subtype H7 (indicated by green circles).
Table 4 shows the number of holdings that tested positive by serology and/or PCR/VI for subtypes H5 and H7 by MS in 2012.

19
Figure 1 Total number of holdings sampled and found seropositive for influenza A virus subtypes H5 and H7 by Member State in 2012
IT NL BG RO ES DK FR HU BE PL UK PT IE DE AT EL SE SI LV CZ FI CY SK MT LT LU EETotal number of holdings sampled 9281 8382 1688 1408 1257 1150 918 850 644 588 377 366 322 290 269 235 220 213 204 188 184 112 97 62 61 22 16
Total number of holdings(in regions where sampling took place)* 148,968 2158 405,177 1034 23,157 915 29,533 248,305 686 3963 2593 237,414 405 168,783 1338 697 471 4408 2819 285 616 8602 183 33 11 513 17
Total number of H5 / H7 seropositive holdings** 5 2 0 0 0 1 21 0 2 1 8 0 0 0 0 0 0 0 0 1 2 0 0 0 0 0 0
0
5
10
15
20
25
0
1000
2000
3000
4000
5000
6000
7000
8000
9000
10000
Tota
l num
ber o
f H5
/ H7
sero
posi
tive
hold
ings
Tota
l num
ber o
f hol
ding
s sa
mpl
ed
*Notes on total number of holdings (in regions where sampling took place) FR: The total number of holdings included for several poultry categories (CB, LH, FR LH, FR B, TB, BG and R) was based on data from 2011 (as this information was unavailable for 2012). HU: For the total number of BYF holdings only an estimate was available. IT: The total number of holdings for ‘O’ in NUTS code region ITF6 was not known and so could not be included in the total number of holdings. **Notes on total number of H5/H7 seropositive holdings UK: One (Game Bird) holding was seropositive for both H5 and H7 and so is only counted once in the total number of H5/H7 seropositive holdings.

20
Figure 2 Total number of holdings sampled and found seropositive for influenza A virus subtypes H5 and H7 by poultry category in Member States in 2012
CB LH FR LH B FR B FT TB FD BD FG BG BYF GB* R OTotal number of holdings sampled 5274 6090 2731 1057 259 2632 234 863 247 365 156 5691 1636 192 1977Total number of holdings (in regions where sampling took place) 3922 44,977 25,935 3288 6323 8884 457 6507 513 2062 405 1,111,523 5707 616 71,965Total number of H5 / H7 seropositive holdings 0 4 3 0 0 1 0 7 21 1 4 1 1 0 0
0
5
10
15
20
25
0
1000
2000
3000
4000
5000
6000
7000
8000
9000
10000
Tota
l num
ber o
f H5
/ H7
sero
posi
tive
hold
ings
Tota
l num
ber o
f hol
ding
s sa
mpl
ed
*GB: One holding (from the UK) was seropositive for both H5 and H7 and so is only counted once in the total number of H5/H7 seropositive holdings.
See Abbreviations and Glossary and Section 5.1.1 Survey Design for the abbreviations of poultry categories

21
Figure 3 Total number of H5 and H7 serologically positive holdings by Member State in 2012
BE CZ DK FI FR IT NL PL UK* EUTotal
H5 seropositive holdings 2 1 1 2 21 4 1 0 8 40H7 seropositive holdings 0 0 0 0 0 1 1 1 1 4H5/H7 seropositive holdings 2 1 1 2 21 5 2 1 8 43
0
5
10
15
20
25
30
35
40
45
50
Tota
l num
ber o
f ser
opos
itive
hol
ding
s
*UK: One Game Bird holding was seropositive for both H5 and H7 and so is only counted once in the total number of H5/H7 seropositive holdings.
In 2012, 43 holdings (in eight MS) returned positive results for subtype H5 (0.15% of holdings sampled). Of these, 40 were serologically positive (0.14% of holdings sampled), with a high proportion (21/40, 52.5%) being found in FR (as was the case in 2011). One holding that was seropositive for H5 was also seropositive for H7. Of the 40 holdings reported to be seropositive in 2012, 22 underwent follow-up testing for the presence of active infection and one of these (1/22, 4.5%) tested positive for subtype H5 by PCR (an indicator of active infection).
The number of H5 seropositive holdings reported (40) is less than in previous survey years. For example, in 2011, 50 holdings were found serologically positive for H5 (0.17% of holdings sampled), 48 were recorded in 2010 (0.16% of holdings sampled), and in 2009 and 2008, 52 holdings in each year were reported as serologically positive for H5 (0.15% of holdings sampled in each year).
In 2012, a high proportion of the H5 seropositive holdings were Breeder Ducks (21/40, 52.5%), followed by Fattening Ducks (7/40, 17.5%), and Conventional Laying Hens (4/40, 10%).
Four holdings from four MS: IT, NL, PL and UK, returned positive results for subtype H7 (0.01% of holdings sampled). All four holdings were serologically positive for H7 and one holding was also seropositive for H5. This differed to the situation in 2011, when the majority of H7 seropositive holdings (12/15, 80%) were found in IT. Of the four holdings reported to be seropositive in 2012, three underwent follow-up testing for the presence of active infection and one of these (1/3, 33.3%) tested positive for subtype H7 by PCR (an indicator of active infection).
The number of H7 seropositive holdings reported (four) is less than in previous survey years. For example, in 2011, 15 holdings were found serologically positive for H7 (0.05% of holdings
3.1.2.1 H5 avian influenza
3.1.2.2 H7 avian influenza

22
sampled), 11 were reported in 2010 (0.04% of holdings sampled), 38 in 2009 (0.11% of holdings sampled) and 21 in 2008 (0.06% of holdings sampled).
In 2012, one H7 seropositive holding was detected in each of the Free-range Laying Hen, Breeder Geese, Backyard Flocks and Game Birds categories.
The identification of avian influenza subtypes other than H5 or H7 is not compulsory according to the surveillance guidelines (EC 2010) and will also depend on the laboratory method used. However, as part of the 2012 survey, three holdings were reported as positive for avian influenza subtypes other than H5 or H7, by serology and/or PCR/virus isolation. This included one Fattening Turkey holding from DE, which was seropositive and PCR/virus isolation positive for H9, and two Fattening Duck holdings from ES, one of which was positive by virus isolation for the H4 subtype (PCR positive for influenza A virus/serology negative), and the other which was positive by virus isolation for the H6 subtype (PCR/serology negative).
In comparison, in 2011, no holdings were reported to the survey as positive for avian influenza subtypes other than H5 or H7, although there were two holdings (one from RO and one from EL) that tested positive by PCR (only) for influenza A virus with subtype undetermined. However, in 2010, 16 holdings were reported as positive for other subtypes, including H6, H4 and H3, from two MS (BG and CZ); in 2009, other subtypes were detected from four MS (13 holdings); and in 2008 other subtypes were reported from six MS (20 holdings).
• A total of 43 holdings tested positive for H5 or H7 subtypes by serological testing (0.15% of holdings sampled), 40 of subtype H5 (0.14% of holdings sampled) and four of subtype H7 (0.01% of holdings sampled), with one holding seropositive for both H5 and H7 subtypes.
• A high proportion of H5 seropositive holdings were found in France (21/40, 52.5%) and the poultry categories with the most detections were Breeder Ducks (21/40, 52.5%), followed by Fattening Ducks (7/40, 17.5%), and Conventional Laying Hens (4/40, 10%).
• One H7 seropositive holding (four total) was found in each of the Free-range Laying Hen, Breeder Geese, Backyard Flocks, and Game Birds categories, from NL, PL, IT and UK respectively.
• As in previous years, evidence of H5 infection was detected more frequently than H7. The number of seropositive H5 (n = 40) and H7 (n = 4) holdings detected in 2012 was lower than in previous survey years. For example, in 2011 50 H5 and 15 H7 seropositive holdings were reported (0.17% and 0.05% respectively of holdings sampled); in 2010 48 H5 and 11 H7 seropositive holdings were detected (0.16% and 0.04% respectively of holdings sampled); in 2009 there were 52 H5 and 38 H7 seropositive holdings (0.15% and 0.11% respectively of holdings sampled); and in 2008 52 H5 and 21 H7 seropositive holdings were found (0.15% and 0.06% respectively of holdings sampled).
3.1.2.3 Other LPAI subtypes
3.1.2.4 Summary

23
Figure 4 Map of the intensity of sam
pling in the EU A
I poultry survey and holdings testing serologically positive for H5 and H
7 in 2012
The classification of intensity of surveillance is grouped by holdings sampled per 100km
2 Low
: >0 and <10, Medium
: >10 and <100, High: >100 and <500, V
ery high: >500

24
Table 4 Number of serological and virological H5 and H7 positive holdings by Member State in 2012
MS
Total H5/H7
positive holdings
Number of H5
seropositive holdings
Number of H5
PCR/VI positive holdings
Number of H7
seropositive holdings
Number of H7
PCR/VI positive holdings
Total holdings sampled
Total holdings reported
(in regions where sampling
took place) AT 0 0 0 0 0 269 1338BE 2 2 0 0 0 644 686BG 0 0 0 0 0 1688 405,177CY 0 0 0 0 0 112 8602CZ 1 1 0 0 0 188 285DE 0 0 0 0 0 290 168,783DK 1 1 0 0 0 1150 915EE 0 0 0 0 0 16 17EL 0 0 0 0 0 235 697ES 0 0 0 0 0 1257 23,157FI 2 2 0 0 0 184 616FR 21 21 0 0 0 918 29,533HU 0 0 0 0 0 850 248,305IE 0 0 0 0 0 322 405IT 8 4 3 1 0 9281 148,968LT 0 0 0 0 0 61 11LU 0 0 0 0 0 22 513LV 0 0 0 0 0 204 2819MT 0 0 0 0 0 62 33NL 2 1 1 1 1 8382 2158PL 1 0 0 1 0 588 3963PT 0 0 0 0 0 366 237,414RO 0 0 0 0 0 1408 1034SE 0 0 0 0 0 220 471SI 0 0 0 0 0 213 4408SK 0 0 0 0 0 97 183UK* 8 8 0 1 0 377 2593
EU Total 46 40 4 4 1 29,404 1,293,084CH 0 0 0 0 0 122 3586
*UK: One holding was seropositive for both H5 and H7 and so is only counted once in the total number of H5/H7 seropositive holdings.
Notes on virological data and subtypes other than H5 or H7
DE: One holding was serologically and PCR/VI positive for H9.
ES: One holding was VI positive for H4 and PCR positive for influenza A virus (serology negative). Another holding was VI positive for H6 (serology/PCR negative).
IT: Two holdings were PCR positive for H5 (serology/VI not performed) and one holding was PCR and VI positive for H5 (serology not performed).
NL: The H5 seropositive holding was also PCR positive for H5 (VI not performed). The H7 seropositive holding was also PCR positive for H7 (VI not performed).
Notes on total number of holdings (in regions where sampling took place)
FR: The total number of holdings included for several poultry categories (CB, LH, FR LH, FR B, TB, BG and R) was based on data from 2011 (as this information was unavailable for 2012).
HU: For the total number of BYF holdings only an estimate was available.
IT: The total number of holdings for ‘O’ in NUTS code region ITF6 was not known and so could not be included in the total number of holdings.

25
3.1.3 Poultry categories Tables 5a and 5b show the total number of holdings sampled and the number found to be seropositive for subtypes H5 and H7 by poultry category in the years 2012 and 2011. The number of holdings found serologically positive for subtypes H5 or H7 by poultry category across MS in 2012 is also displayed in Figure 5. This information is also shown in Table 6, along with the number of holdings sampled by poultry category across MS in 2012.
Descriptive results of the 2012 poultry survey by poultry category
Detailed tables displaying the number of holdings reported (from regions where sampling took place), holdings sampled and holdings testing positive by poultry category across MS are shown in Section 7.1.1 Annex I.
• Chicken Breeder holdings made up 17.9% of total holdings sampled in the EU in 2012. This compares to 17.0% in 2011 and 13.2% in 2010.
• Chicken Breeder holdings were sampled in 21 MS, which was the same as in 2011 and slightly higher than in 2010 when 18 MS sampled Chicken Breeder holdings. The number of holdings sampled varied from one holding (LV) to 3235 (NL).
• No positive holdings were reported in this category in 2012. This was also the case in 2011 and 2010.
• As in 2011 and 2010, the Laying Hens category was split into Conventional Laying Hens and Free-range Laying Hens. Conventional Laying Hens made up 69.0% of the total holdings sampled in these categories, which was slightly lower than in 2011 (72.0%) and 2010 (77%).
• Overall, Laying Hen holdings (conventional and free-range combined) made up 30% of the total holdings sampled in the EU in 2012. Conventional holdings made up 20.7% of the holdings sampled, which compares to 21.9% in 2011 and 17.8% in 2010. Free-range Laying Hen holdings made up 9.3% of the total holdings sampled, which was slightly higher than in 2011 (8.6%) and 2010 (5.3%).
• Conventional Laying Hen holdings were sampled in 26 MS (excluding LT), which compares to 27 MS in 2011 and 25 MS in 2010 (excluding FR and MT, where only Free Range Laying Hen holdings were sampled in this year). The number of holdings sampled varied from four holdings (LU) to 2385 (NL). A total of 16 MS sampled Free-range Laying Hens, plus CH. This was the same as in 2011 (16 MS, plus CH) and slightly higher than in 2010, when 14 MS sampled Free-range Laying Hens, plus CH. The number of holdings sampled varied from three holdings (LU) to 1622 (NL).
• Four Conventional Laying Hen holdings were seropositive for influenza A virus subtype H5 in 2012. In addition, three Free-range Laying Hen holdings were seropositive for influenza A virus, two for subtype H5 and one for subtype H7 (this holding was also PCR positive for H7). The total number of positive Conventional Laying Hen/Free-range Hen holdings (n = 7) was slightly higher than in 2011 and 2010, when five positive holdings were detected in each year. The percentage of the total Laying Hen/Free-range Laying Hen holdings sampled that were positive was also slightly higher in 2012 (0.08%), compared to 2011 (0.06%) and 2010 (0.07%).
• Four MS detected H5 or H7 positive holdings in 2012; FI in Conventional Laying Hens, DK and NL in Free-range Laying Hens, and IT in both Conventional Laying Hens and Free-range Laying Hens. This was slightly more than in 2011 and 2010, when two MS detected positive holdings in Laying Hens.
3.1.3.1 Chicken Breeders
3.1.3.2 Conventional Laying Hens and Free-range Laying Hens

26
• As in 2011 and 2010, the Broiler poultry category was split into Conventional and Free-range Broilers. Conventional Broilers made up 80.3% of the total holdings sampled in these poultry categories. This compares to 83.2% in 2011 and 79.7% in 2010.
• Overall, Broiler holdings (conventional and free-range combined) made up 4.5% of the total holdings sampled in the EU in 2012. Conventional Broiler holdings made up 3.6% of those sampled, which is slightly less than in 2011 (4.5%) and 2010 (4.2%). Free-range Broiler holdings made up just 0.9% of the total holdings sampled, which is comparable to 2011 (0.9%) and 2010 (1.1%).
• Conventional Broiler holdings were sampled in ten MS. This is slightly higher than in 2011 and 2010, when sampling was carried out in eight MS. The number of holdings sampled varied from one holding (RO) to 837 (NL). A total of eight MS sampled Free-range Broiler holdings, which compares to eight in 2011 and seven in 2010. The number of holdings sampled varied from two holdings (NL) to 88 (FR).
• No positive holdings were reported in this category in 2012, which was also the case in 2011 and 2010.
• Overall, Turkey holdings (Fattening and Breeder combined) made up 9.8% of the total holdings sampled in the EU in 2012. Fattening Turkey holdings made up 9.0% of those sampled, which is slightly less than in 2011 (9.7%) and 2010 (10.3%). Turkey Breeder holdings made up just 0.8% of total holdings sampled in the EU in 2012, which is comparable to 0.7% in 2011 and 0.8% in 2010.
• Fattening Turkey holdings were sampled in 22 MS, plus CH, compared to 21 MS, plus CH in 2011 and 22 MS in 2010. The number of holdings sampled varied from four holdings (LT and SK) to 1579 (IT). A total of 12 MS sampled Turkey Breeder holdings, compared to 12 and 13 MS in 2011 and 2010 respectively. The number of holdings sampled varied from one holding (CZ) to 107 (IT).
• In 2012, one Fattening Turkey holding from NL was seropositive (and PCR positive) for influenza A virus subtype H5. In addition, one Fattening Turkey holding from DE was seropositive and PCR/virus isolation positive for influenza A virus subtype H9. This differs to the situation in 2011 and 2010 when no positive Fattening Turkey holdings were reported to the survey.
• For Turkey Breeders, no positive holdings were reported in 2012, which was also the case in 2011 and 2010.
• Overall, Duck holdings (Fattening and Breeder combined) made up 3.8% of the total holdings sampled in the EU in 2012. Fattening Duck holdings made up 2.9% of those sampled, which compares to 3% in 2011 and 2010. Breeder Ducks made up just 0.8% of the total holdings sampled, which was the same as 2011 and 2010.
• Fattening Duck holdings were sampled in 20 MS, which compares to 20 in 2011 and 18 in 2010. The number of holdings sampled varied from two holdings (FI, IE, LV and RO) to 199 (IT). A total of 13 MS sampled Breeder Duck holdings, which compares to 12 in 2011
3.1.3.3 Conventional Broilers and Free-range Broilers
3.1.3.4 Fattening Turkeys and Turkey Breeders
3.1.3.5 Fattening Ducks and Breeder Ducks

27
and nine in 2010. The number of holdings sampled varied from one holding (ES and SK) to 85 (FR).
• Overall 28 Duck holdings were found to be seropositive for influenza A virus subtype H5 in 2012. This accounted for 62.8% (28/43) of all the seropositive holdings reported to the survey in 2012 and 70.0% (28/40) of the H5 seropositive holdings. Of the 28 H5 seropositive holdings, seven were Fattening Duck holdings and 21 were Breeder Duck holdings. In addition, one Fattening Duck holding was PCR (only) positive for the H5 subtype (serology/virus isolation not performed). A further two Fattening Duck holdings were positive for subtypes other than H5 or H7, including one positive by virus isolation for the H4 subtype (PCR positive for influenza A virus/serology negative); and one positive by virus isolation for the H6 subtype (PCR/serology negative). In comparison in 2011, 33 Duck holdings were seropositive for subtypes of H5 or H7, including eight H5 seropositive Fattening Duck holdings, and 24 H5 and one H7 seropositive Breeder Duck holdings. In 2010, 26 Duck holdings were serologically positive for subtype H5, including four Fattening Duck holdings and 22 Breeder Duck holdings.
• Overall Duck holdings found to be positive for influenza A virus subtype H5 were reported from 4 MS, with H5 seropositive holdings detected from BE, FR and UK, and a PCR (only) positive holding detected in IT. In addition, two holdings from ES were positive for subtypes other than H5 or H7. In 2011 and 2010, six and three MS respectively reported positives from Duck holdings.
• Overall, Geese holdings (Fattening and Breeder combined) made up 1.8% of the total holdings sampled in the EU in 2012. Fattening Geese holdings made up 1.2% of those sampled, which compares to 1.3% in 2011 and 1.2% in 2010. Breeder Geese made up just 0.5% of the total holdings sampled and is comparable to 2011 (0.5%) and 2010 (0.4%).
• Fattening Geese were sampled in 11 MS, which compares to 15 and 11 MS in 2011 and 2010 respectively. The number of holdings sampled varied from one holding (FI) to 93 (HU). A total of nine MS sampled Breeder Geese holdings, compared to seven in 2011 and eight in 2010. The number of holdings sampled varied from one holding (DK and SK) to 83 (PL).
• Overall five Geese holdings were found to be seropositive for influenza A virus subtypes H5 or H7; one Fattening Geese holding was H5 seropositive and four Breeder Geese holdings were seropositive (three H5 subtype and one H7). The detection rate in Breeder Geese (4 seropositive holdings/156 holdings sampled, 2.6%) was the second highest after Breeder Ducks (8.5%). In comparison in 2011, ten Geese holdings were seropositive for influenza A virus subtypes H5 or H7; two Fattening Geese holdings were seropositive (one H5 subtype and one H7) and eight Breeder Geese holdings were H5 seropositive. Two of the H5 seropositive Breeder Geese holdings were also virologically positive for influenza A virus – one was PCR/virus isolation positive for influenza A virus, while the other was PCR positive for influenza A virus/virus isolation negative. In 2010, eight Breeder Geese holdings were seropositive for subtype H5, but no positives were detected in Fattening Geese.
• One MS (FI) detected a Fattening Geese seropositive holding in 2012, compared to two MS (FI and UK) in 2011, while no seropositives were detected in Fattening Geese in 2010. For Breeder Geese, three MS reported H5/H7 seropositive holdings in 2012, including CZ, FR and PL. This compares to four MS (BE, CZ, FR and PL) in 2011 and two MS (FR and PL) in 2010.
3.1.3.6 Fattening Geese and Breeder Geese

28
3.1.3.7 Backyard Flocks
• Backyard Flocks is the largest poultry category reported to the EU with 1,111,523 holdings recorded in regions where sampling took place (86.0% of EU total), most of which (97.1%) are reported in BG, HU, PT, IT and DE. Backyard Flocks made up 19.4% of total holdings sampled in the EU in 2012. This is comparable to 2011 when Backyard Flocks made up 17.8% of total holdings sampled, but is lower than in 2010 when 26.8% of holdings sampled were Backyard Flocks, reflecting the revision of the guidelines (EC 2010).
• Backyard Flocks were sampled in 12 MS, which is comparable to 2011 (13 MS) and 2010 (12 MS, plus CH). The number of holdings sampled varied from seven holdings (LU) to 2038 (IT). Three MS sampled the majority of Backyard Flock holdings; IT (2038, 35.8%), BG (1595, 28.0%) and RO (1106, 19.4%). This is similar to previous years, although previously ES has also sampled a high number of the Backyard Flocks. For example, in 2010 and 2009, ES sampled 2337 and 3336 Backyard Flock holdings respectively, compared to only 64 in 2012 and 301 in 2011, reflecting the revision of the guidelines (EC 2010).
• In 2012, one Backyard Flock holding from IT was seropositive for influenza A virus subtype H7. In addition, another Backyard Flock holding from IT was PCR (only) positive for the H5 subtype (serology/virus isolation not performed). This was lower than in 2011, when two H5 and six H7 seropositive holdings, all from IT, were detected. Also in 2010, one H5 and three H7 seropositive holdings were reported from IT.
• Game Bird holdings made up 5.6% of total holdings sampled in the EU in 2012. This compares to 5.5% in 2011 and 6.3% in 2010.
• Game Bird holdings were sampled in 20 MS, which compares to 18 MS in 2011 and 2010. The number of holdings sampled varied from one holding (EE) to 448 (ES).
• One Game Bird holding, from the UK, was seropositive for influenza A virus subtypes H5 and H7, which is lower than in previous years. For example, in 2011, three Game Bird holdings, from two MS (IT and SE), were seropositive for influenza A virus subtype H5, while in 2010, 12 H5 and three H7 seropositive holdings from four MS were detected.
• Ratite holdings made up just 0.7% of total holdings sampled in the EU in 2012. This was similar in 2011 (0.7%) and 2010 (0.8%).
• Ratite holdings were sampled in 15 MS, which was the same in 2011 and 2010. The number of holdings sampled varied from two holdings (FI, HU, RO and SI) to 59 (IT), although the majority of MS (12/15) sampled ≤10 holdings. As in 2011, three MS sampled the majority of Ratite holdings; IT (59, 30.7%), ES (43, 22.4%) and PL (40, 20.8%).
• No positive holdings were detected in this category in 2012, which was also the case in 2011 and 2010.
3.1.3.8 Game Birds
3.1.3.9 Ratites

29
3.1.3.10 Others
• Others holdings made up 6.7% of total holdings sampled in the EU in 2012. This compares to 7.2% in 2011 and 7.8% in 2010.
• Where details were provided, the types of poultry reported in this category included: ornamental fowl, exotic birds, incubators, rescue centre, zoos, poultry (mainly chicken) reared and sold as backyard, chicken registered as 'leisure exposure', fighting cock, pigeon, dove, guinea fowl, quail, dealer, and pet shops. For more information on this, please see Table 15.
• Others holdings were sampled in seven MS, compared to eight and six in 2011 and 2010 respectively. The number of holdings sampled varied from one holding (BE, BG and PT) to 1665 (IT). IT sampled the majority of Others holdings (1655, 83.7%), followed by ES (151, 7.6%), although ES sampled considerably fewer holdings than in 2011 (457).
• One Others (Dealer) holding was PCR and virus isolation positive for influenza A virus subtype H5 (serology not performed). This is lower than in 2011, when two H5 (one of these was also PCR positive) and four H7 seropositive Others holdings were detected. In addition, one holding (Others, Dealer) was PCR positive for the H5 subtype, as well as being serologically positive for the H7 subtype, and one holding was PCR (only) positive for the H7 subtype (serology/virus isolation not performed). There was also one Others holding that tested PCR positive for influenza A virus (serology not performed/virus isolation negative). In 2010, one holding was seropositive for H7 and an additional four holdings were positive for H5/H7 by PCR/virus isolation.
• In 2012 and 2010 positive Others holdings were only detected in IT. In 2011, two MS detected positive holdings – IT and EL (although the majority were found in IT).
• The most frequently sampled poultry category was Laying Hens (conventional and free-range), making up 30.0% of the total holdings sampled by EU MS in 2012, followed by Backyard Flocks (19.4%) and Chicken Breeders (17.9%). This was similar to 2011, but differed to 2010 when Backyard Flocks was the most sampled poultry category (26.8% of EU total), followed by Laying Hens (conventional and free-range) (23.1%).
• Overall, in 2012, there was an increase in the number of holdings sampled from Chicken Breeders, Free-range Laying Hens, Turkey Breeders, Breeder Ducks, Breeder Geese, Backyard Flocks and Game Birds, compared to 2011, while all other poultry categories saw a decrease in the number of holdings sampled in 2012. Percentage increases in the number of holdings sampled compared with 2011 varied from 0.6% (Game Birds) to 20.0% (Turkey Breeders).
• In 2012, the poultry category with the highest number of holdings positive for H5 subtypes by serology was Breeder Ducks (21/40, 52.5%), followed by Fattening Ducks (7/40, 17.5%), and Conventional Laying Hens (4/40, 10%). In 2011, the poultry category with the highest number of holdings seropositive for H5 was also Breeder Ducks (24/50, 48.0%), followed by Breeder Geese (8/50, 16.0%) and Fattening Ducks (8/50, 16.0%).
• In 2012, one H7 seropositive holding was detected in each of the Free-range Laying Hen, Breeder Geese, Backyard Flocks and Game Birds categories. In 2011, 15 H7 seropositive holdings were detected, with most found in Backyard Flocks (6/15, 40%), followed by Others (4/15, 26.7%).
• In addition in 2012, three holdings tested virologically (only) positive for the H5 subtype. This included one Fattening Duck holding (PCR positive; serology/virus isolation not performed), one Backyard Flock holding (PCR positive; serology/virus isolation not performed), and one Others (Dealer) holding (PCR/virus isolation positive; serology not performed). There was also a further three holdings that were positive for subtypes other
3.1.3.11 Summary

30
than H5 or H7. This included one Fattening Turkey holding, which was seropositive and PCR/VI positive for H9, one Fattening Duck holding positive by virus isolation for the H4 subtype (PCR positive for influenza A virus/serology negative), and one Fattening Duck holding positive by virus isolation for the H6 subtype (PCR/serology negative).

31
Table 5a Total number of H5 seropositive and sampled holdings in 2012 and 2011 by poultry category
Table 5b Total number of H7 seropositive and sampled holdings in 2012 and 2011 by poultry category
2012 2011 2012 2011
Chicken Breeders 0 / 5274 0 / 5062
Chicken Breeders 0 / 5274 0 / 5062
Conventional Laying Hens
and Free-range Laying
Hens 6 / 8821 2 / 9083
Conventional Laying Hens
and Free-range Laying
Hens 1 / 88211 3 / 9083
Conventional Broilers and Free-range
Broilers 0 / 1316 0 / 1606
Conventional Broilers and Free-range
Broilers 0 / 1316 0 / 1606
Fattening Turkeys and
Turkey Breeders 1 / 28661 0 / 3089
Fattening Turkeys and
Turkey Breeders 0 / 28662 0 / 3089
Fattening and Breeder
Ducks 28 / 11102 32 / 1139
Fattening and Breeder
Ducks 0 / 11103 1 / 1139
Fattening and Breeder
Geese 4 / 521 9 / 543
Fattening and Breeder
Geese 1 / 521 1 / 543Backyard
Flocks 0 / 56913 2 / 5297Backyard
Flocks 1 / 5691 6 / 5297
Game Birds 1 / 1636* 3 / 1626 Game Birds 1 / 1636* 0 / 1626
Ratites 0 / 192 0 / 197 Ratites 0 / 192 0 / 197
Others 0 / 19774 2 / 2164 Others 0 / 1977 4 / 2164
EU Total (excluding
CH) 40 / 29,404 50 / 29,806
EU Total (excluding
CH) 4 / 29,404 15 / 29,806
2FD: One holding was PCR (only) positive for H5 (serology/VI not performed). In addition, one holding was VI positive for H4 and PCR positive for influenza A virus (serology negative), and another was VI positive for H6 (serology/PCR negative). 3BYF: One holding PCR (only) positive for H5 (serology/VI not performed).4O: One holding PCR/VI positive for H5 (serology not performed).
1FT: The H5 seropositive holding was also PCR positive for H5 (VI not performed). In addition, one holding was serologically and PCR/VI positive for H9.
Poultry category
Seropositive / sampled
Seropositive / sampled
*GB: The H7 seropositve holding was also seropositive for H5.
2012 notes on virological data and subtypes other than H5 or H7 (not shown in table)1FRLH: The H7 seropositive holding was also PCR positive for H7 (VI not performed). 2FT: One holding serologically and PCR/VI positive for H9.3FD: One holding VI positive for H4 and PCR positive for influenza A virus (serology negative); one holding VI positive for H6 (serology/PCR negative).
Poultry category
Seropositive / sampled
Seropositive / sampled
*GB: The H5 seropositve holding was also seropositive for H7.
2012 notes on virological data and subtypes other than H5 or H7 (not shown in table)

32
Figure 5 Total number of holdings found serologically positive for influenza A virus subtypes H5 and H7 by poultry category across Member States in 2012
ConventionalLaying Hens
Free-rangeLaying Hens
FatteningTurkeys
FatteningDucks
BreederDucks
FatteningGeese
BreederGeese
BackyardFlocks Game Birds*
BE 2CZ 1DK 1FI 1 1FR 5 14 2IT 3 1 1NL 1 1PL 1UK* 7 1EU Total 4 3 1 7 21 1 4 1 1
0
5
10
15
20
25
Tota
l num
ber o
f H5
/ H7
sero
posi
tive
hold
ings
*UK/Game Birds: One holding was seropositive for both H5 and H7 and so is only counted once in the total number of H5/H7 seropositive holdings.

33
Table 6 Total number of holdings sampled and those found H5 or H7 seropositive by poultry category across Member States in 2012
The number of seropositive holdings is displayed in parentheses.
Member States
Chicken Breeders
Conventional Laying Hens
Free-range Laying Hens
Conventional Broilers
Free-range Broilers
Fattening Turkeys
Turkey Breeders
Fattening Ducks
Breeder Ducks
Fattening Geese
Breeder Geese
Backyard Flocks
Game Birds* Ratites Others Total
AT 30 57 61 53 14 45 9 269BE 145 292 108 2 2 49 25 (2) 2 18 1 644BG 7 21 4 56 1595 4 1 1688CY 12 21 49 6 14 10 112CZ 53 7 33 1 24 18 3 7 (1) 42 188DE 41 12 4 50 3 34 2 8 18 8 8 102 290DK 532 33 259 (1) 5 46 13 3 1 258 1150EE 15 1 16EL 48 45 48 22 4 9 3 56 235ES 104 144 55 118 71 8 48 1 2 64 448 43 151 1257FI 53 49 (1) 26 46 2 1 (1) 5 2 184FR 61 48 67 88 132 65 168 (5) 85 (14) 15 (2) 41 144 4 918HU 17 57 55 10 77 13 93 20 485 21 2 850IE 108 60 58 48 42 2 2 2 322IT 677 2119 (3) 311 (1) 1579 107 199 24 46 20 2038 (1) 437 59 1665 9281LT 51 6 4 61LU 4 3 4 7 4 22LV 1 34 2 167 204MT 62 62NL 3235 2385 1662 (1) 837 2 180 (1) 50 31 8382PL 59 91 21 61 18 77 15 87 83 (1) 36 40 588PT 55 58 60 55 10 3 66 55 3 1 366RO 67 187 1 17 2 2 1106 24 2 1408SE 36 54 24 34 19 3 3 20 23 4 220SI 8 61 46 90 6 2 213SK 11 42 2 4 8 5 1 1 16 7 97
71 (1)71 (1)
EU Total 5274 6090 2731 1057 259 2632 234 863 247 365 156 5691 1636 192 1977 29,404Total H5/H7 seropositive
holdings0 4 3 0 0 1 0 7 21 1 4 1 1 0 0 43
% positive 0% 0.07% 0.11% 0% 0% 0.04% 0% 0.81% 8.50% 0.27% 2.56% 0.02% 0.06% 0% 0% 0.15%CH 98 24 122
*UK/Game Birds: one holding was seropositive for both H5 and H7 and so is only counted once in the total number of H5/H7 seropositive holdings.
Seropositive H5 Seropositive H7
DE: One Fattening Turkey holding was serologically and PCR/VI positive for H9.
IT: One Fattening Duck holding was PCR positive for H5 (serology / VI not performed); one Backyard Flock holding was PCR positive for H5 (serology/VI not performed); and one Others (Dealer) holding was PCR/VI positive for H5 (serology not performed). NL: The H7 seropositive Free-range Laying Hen holding was also PCR positive for H7 (VI not performed). The H5 seropositive Fattening Turkey holding was also PCR positive for H5 (VI not performed).
Notes on virological data and subtypes other than H5 or H7 (not shown in table)
UK* 8 57 8 52 49 (7) 5862 5 377
ES: One Fattening Duck holding was VI positive for H4 and PCR positive for influenza A virus (serology negative). Another Fattening Duck holding was VI positive for H6 (serology/PCR negative).
7

34
3.2 Wild Birds
3.2.1 Sampling by passive surveillance
Birds sampled by passive surveillance were reported as “found dead”, “injured” or “live with clinical signs". During 2012, 6,508 birds were sampled by passive surveillance. This includes 6,504 birds sampled by EU Member States (MS) as well as 4 birds sampled by Switzerland, the one contributing non-MS, Figure 6. Detailed information regarding the number of birds sampled by MS in each quarter is displayed in Annex 3 (section 7.2.1.3). In total 24 EU MSs submitted passive surveillance data for analysis in 2012. Luxembourg and Malta did not submit passive surveillance data, but did voluntarily submit data sampled by active surveillance (see Annex 4, section 7.2.2), whilst Latvia did not submit any data in 2012. The Member State with the highest number of birds tested by passive surveillance in 2012 was Hungary (n=1,513) and the next highest passive surveillance programme was carried out by Germany (n=1,256), which together contribute to over a third of the whole EU passive surveillance effort. Eleven MS and Switzerland each sampled fewer than 100 dead or moribund birds throughout the year. Figure 6 Total number of birds sampled by passive surveillance in 2012 by Member States – Non-MS data included
3.2.1.1 Overview

35
Figure 7 Map of the intensity of sampling by passive surveillance across Member States in 2012 – EU-data only
The classification of sampling intensity is grouped by number of submissions per 100 square kilometres. Low: >0 and ≤25, Medium: >25 and ≤250, High: >250 and ≤2500, Very High: >2500
3.2.1.2 Geographical targeting

36
Figure 8 displays the percentage of birds sampled by MSs in each quarter. For the EU overall, comprising data for all 24 MS submitting passive surveillance data, more surveillance was conducted in the winter months (1st and 4th quarters), than in the summer months (2nd and 3rd quarters). Temporal targeting of sampling varied greatly among MS. Some MS carried out the majority of their sampling in a single quarter, most notably Estonia and Hungary in the 4th quarter (Oct-Dec) and Sweden and Switzerland in the 3rd quarter (Jul-Sep). Other MS focused their surveillance efforts in the summer months, such as Bulgaria, Ireland and Poland, or in the winter months, such as France and Romania. In other cases, the surveillance was relatively evenly distributed throughout the year, as was the case in Germany and Italy.
Figure 8 Proportion of all birds sampled by passive surveillance in 2012, by quarter and MS. Raw numbers of birds sampled by quarter and MS are shown in the table below – Non-MS data included
3.2.1.3 Seasonal targeting

37
Figure 9 Proportion of birds sampled by passive surveillance in each quarter for Member States – EU-data only
Figure 10 Temporal distribution of the total number of birds sampled by passive surveillance during 2012 – Non-MS data included
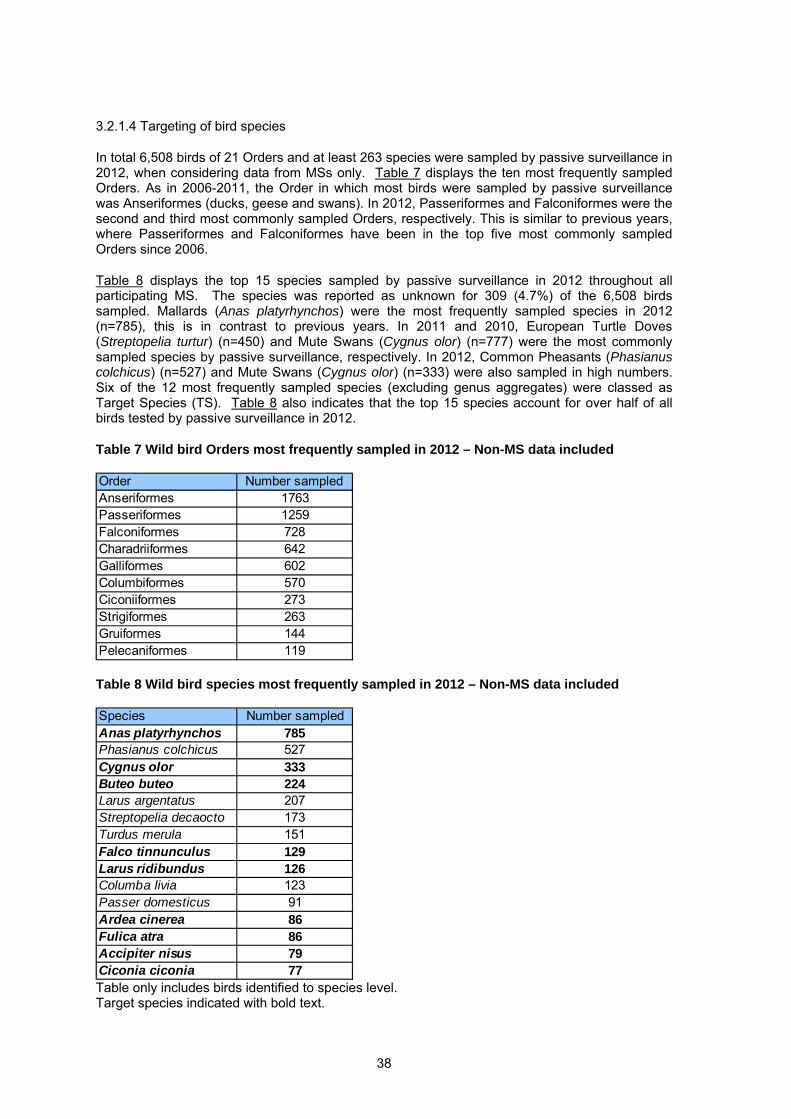
38
In total 6,508 birds of 21 Orders and at least 263 species were sampled by passive surveillance in 2012, when considering data from MSs only. Table 7 displays the ten most frequently sampled Orders. As in 2006-2011, the Order in which most birds were sampled by passive surveillance was Anseriformes (ducks, geese and swans). In 2012, Passeriformes and Falconiformes were the second and third most commonly sampled Orders, respectively. This is similar to previous years, where Passeriformes and Falconiformes have been in the top five most commonly sampled Orders since 2006.
Table 8 displays the top 15 species sampled by passive surveillance in 2012 throughout all participating MS. The species was reported as unknown for 309 (4.7%) of the 6,508 birds sampled. Mallards (Anas platyrhynchos) were the most frequently sampled species in 2012 (n=785), this is in contrast to previous years. In 2011 and 2010, European Turtle Doves (Streptopelia turtur) (n=450) and Mute Swans (Cygnus olor) (n=777) were the most commonly sampled species by passive surveillance, respectively. In 2012, Common Pheasants (Phasianus colchicus) (n=527) and Mute Swans (Cygnus olor) (n=333) were also sampled in high numbers. Six of the 12 most frequently sampled species (excluding genus aggregates) were classed as Target Species (TS). Table 8 also indicates that the top 15 species account for over half of all birds tested by passive surveillance in 2012.
Table 7 Wild bird Orders most frequently sampled in 2012 – Non-MS data included
Order Number sampledAnseriformes 1763Passeriformes 1259Falconiformes 728Charadriiformes 642Galliformes 602Columbiformes 570Ciconiiformes 273Strigiformes 263Gruiformes 144Pelecaniformes 119
Table 8 Wild bird species most frequently sampled in 2012 – Non-MS data included
Species Number sampledAnas platyrhynchos 785Phasianus colchicus 527Cygnus olor 333Buteo buteo 224Larus argentatus 207Streptopelia decaocto 173Turdus merula 151Falco tinnunculus 129Larus ridibundus 126Columba livia 123Passer domesticus 91Ardea cinerea 86Fulica atra 86Accipiter nisus 79Ciconia ciconia 77 Table only includes birds identified to species level. Target species indicated with bold text.
3.2.1.4 Targeting of bird species

39
Figure 11 Proportion of TS and non-TS sampled by passive surveillance in 2012, by Member State – Non-MS data included
Raw numbers of birds sampled in each category are shown in the table below. Figure 11 includes birds identified at species level only (figure excludes birds identified to the genus or family level).
When considering the EU data combined, 49% of birds sampled by passive surveillance and identified to species level in 2012 were from the target species list.

40
3.2.2 H5N1 Highly Pathogenic Avian Influenza Positives None of the 24 MSs nor the one non-MS submitting passive surveillance data reported any highly pathogenic H5N1 HPAI detections in 2012. This is consistent with data reported in 2011, but contrasts previous years as one HPAI H5 incident was reported in both 2009 and 2010. In 2010 the HPAI H5 detection was made in Bulgaria by passive surveillance in a Common Buzzard ‘found dead’; however in 2009 the detection was made in Germany by active surveillance of a Mallard that was ‘hunted without clinical signs’. No H5N1 HPAI detections were made by active surveillance in 2012; see Annex 4 (section 7.2.2) for more details on 2012 active surveillance data.
3.2.3 Low Pathogenicity Avian Influenza Positives This section describes detections of LPAI detected by passive surveillance, particularly focusing on ‘H’ subtypes H5 and H7.
As some virus-positive birds were reported with virus pathotype “unknown”, “pending”, “missing” etc, birds that tested positive on PCR or virus isolation are reported in four groups in this section:
1) ‘LPAI H5’ are birds positive for LPAI subtype H5.
2) ‘LPAI H7’ are birds positive for LPAI subtype H7.
3) ‘LPAI other’ are birds reported as LPAI of other, or unspecified, ‘H’ subtypes.
4) ‘Other Positives’ are birds positive for influenza A by PCR or Virus isolation but were not reported as either LPAI or HPAI.
In 2012, 64 birds tested positive for AI when considering MSs passive surveillance data. There were no positive birds detected in Switzerland, the only reporting non-MS.
LPAI H5 was detected in three birds from Hungary; two Mallards (Anas platyrhynchos) and one Black-crowned Night Heron (Nycticorax nycticorax). LPAI H7 was not detected by passive surveillance in 2012.
LPAI of other subtypes (LPAI Other) were detected in 42 birds from Seven MS; Belgium (29), Czech Republic (1), Denmark (2), Hungary (6), Italy (1), the Netherlands (2) and the United Kingdom (1). “Other Positives” were detected in 19 birds in five MSs; Austria (2), Germany (9), Ireland (2), Italy (4) and Slovenia (2).
Table 9 indicates the total number and proportion of wild birds testing positive for LPAI H5, LPAI other and “Other Positives” by Member State, when considering passive surveillance data only. A very low proportion of birds tested positive for LPAI H5 by passive surveillance in 2012 (0.05%). This is similar to findings in previous years: 2011 (0.04%), 2010 (0.07%), 2009 (0.08%), 2008 (0.01%) and 2007 (0.01%).
As in 2012, there have been no, or very low numbers of detections of LPAI H7 by passive surveillance in recent years: 2011 (0.01%), 2010 (none), 2009 (0.12%), 2008 (none), 2007 (0.01%) and 2006 (0.01%).
3.2.3.1 Overview of LPAI results

41
Table 9 Total number and proportion of wild birds testing positive by passive surveillance for LPAI H5, other LPAI subtypes and other positives during 2012 – Non-MS data included
Member State
Number of birds sampled
Number of H5 LPAI
detections
LPAI H5 (proportion of
total sampled)
Number ofLPAI other detections
LPAI other (proportion of
total sampled)
Number of "Other positives"
detections
"Other positives" (proportion of
total sampled)
AT 89 - - - - 2 2.25%BE 365 - - 29 7.95% - -BG 5 - - - - - -CY 158 - - - - - -CZ 102 - - 1 0.98% - -DE 1256 - - - 9 0.72%DK 18 - - 2 11.11% - -EE 16 - - - - - -EL 11 - - - - - -ES 888 - - - - - -FI 113 - - - - - -FR 49 - - - - - -HU 1513 3 0.20% 6 0.40% - -IE 35 - - - - 2 5.71%IT 693 - - 1 0.14% 4 0.58%LT 6 - - - - - -NL 165 - - 2 1.21% - -PL 20 - - - - - -PT 17 - - - - - -RO 236 - - - - - -SE 103 - - - - - -SI 129 - - - - 2 1.55%SK 19 - - - - - -UK 498 - - 1 0.20% - -
EU TOTAL 6504 3 0.05% 42 0.65% 19 0.29%CH 4 - - - - - -
H7 was not detected by passive surveillance in 2012.
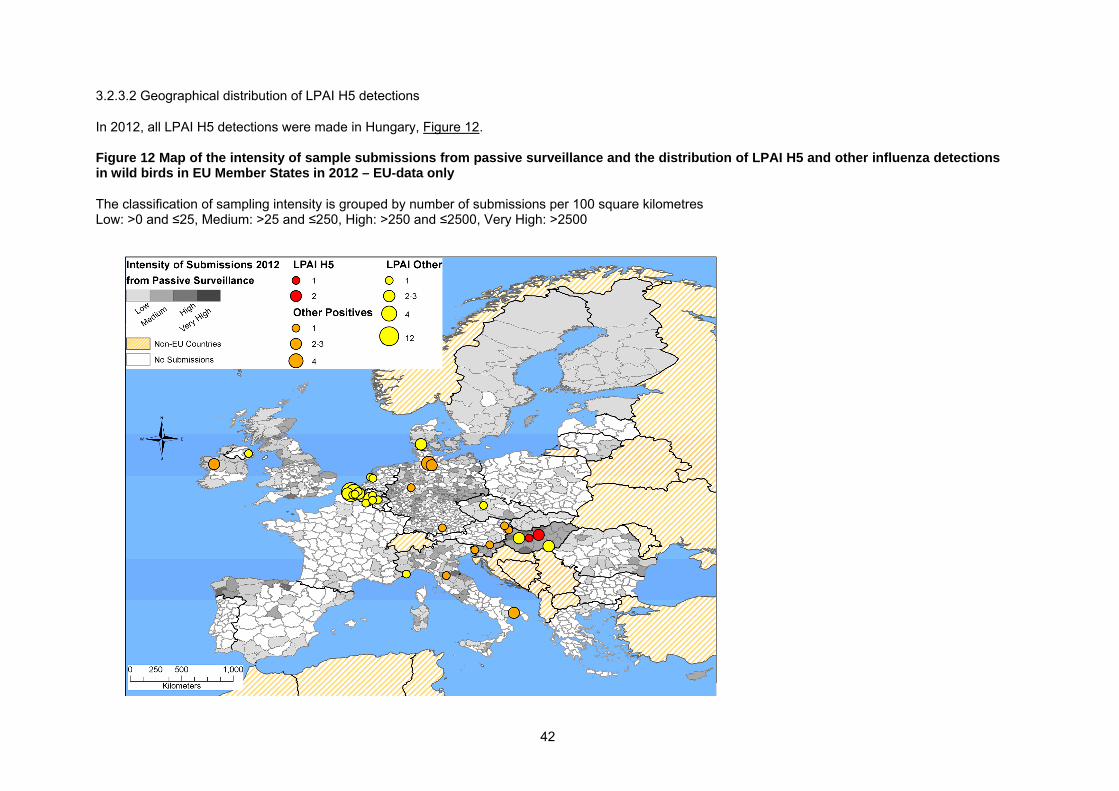
42
In 2012, all LPAI H5 detections were made in Hungary, Figure 12. Figure 12 Map of the intensity of sample submissions from passive surveillance and the distribution of LPAI H5 and other influenza detections in wild birds in EU Member States in 2012 – EU-data only
The classification of sampling intensity is grouped by number of submissions per 100 square kilometres Low: >0 and ≤25, Medium: >25 and ≤250, High: >250 and ≤2500, Very High: >2500
3.2.3.2 Geographical distribution of LPAI H5 detections

43
Figure 13 displays the calendar week of LPAI H5 detections by MS. In figure 8 the first and last weeks are incomplete as 2012 did not begin on a Monday; both the first and the last weeks are one day long. All three detections of LPAI H5 were found in the winter.
Figure 13 Number and week of detection of LPAI H5 positive wild birds detected through passive surveillance in 2012 – EU-data only
Each week has been assigned to the month in which most days fell.
3.2.3.3 Temporal distribution of LPAI H5 detections
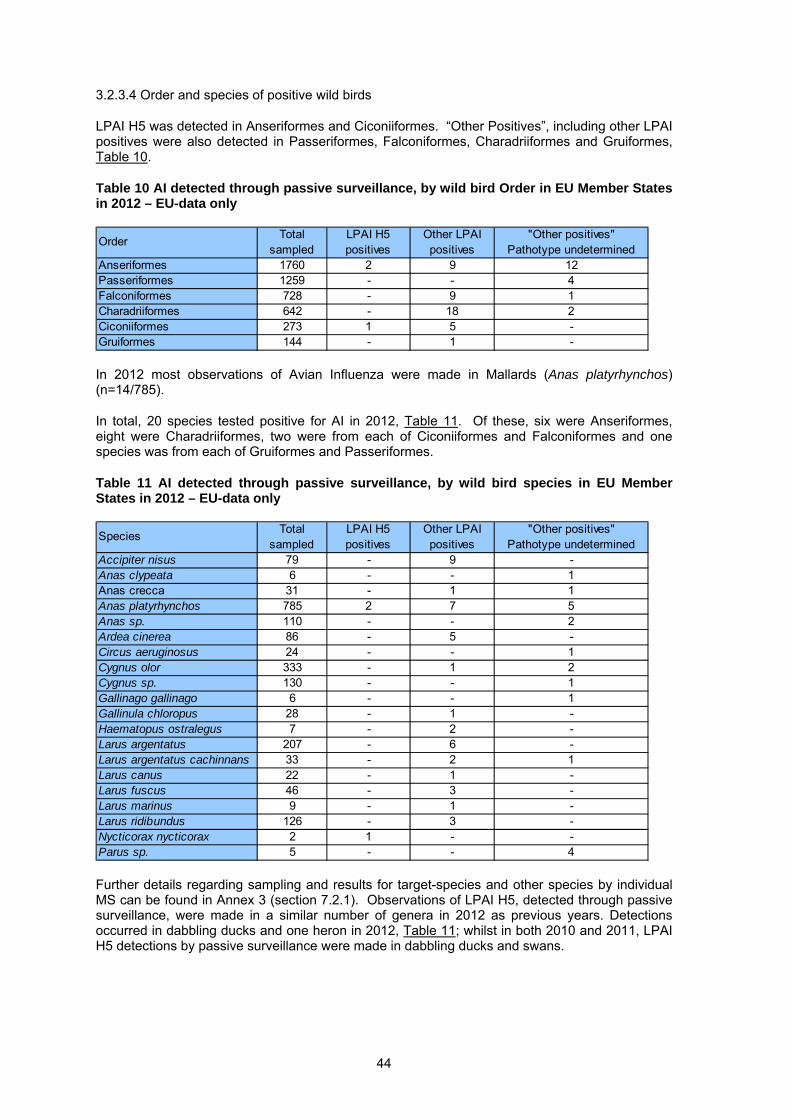
44
LPAI H5 was detected in Anseriformes and Ciconiiformes. “Other Positives”, including other LPAI positives were also detected in Passeriformes, Falconiformes, Charadriiformes and Gruiformes, Table 10.
Table 10 AI detected through passive surveillance, by wild bird Order in EU Member States in 2012 – EU-data only
Order Total sampled
LPAI H5positives
Other LPAI positives
"Other positives" Pathotype undetermined
Anseriformes 1760 2 9 12Passeriformes 1259 - - 4Falconiformes 728 - 9 1Charadriiformes 642 - 18 2Ciconiiformes 273 1 5 -Gruiformes 144 - 1 -
In 2012 most observations of Avian Influenza were made in Mallards (Anas platyrhynchos) (n=14/785).
In total, 20 species tested positive for AI in 2012, Table 11. Of these, six were Anseriformes, eight were Charadriiformes, two were from each of Ciconiiformes and Falconiformes and one species was from each of Gruiformes and Passeriformes.
Table 11 AI detected through passive surveillance, by wild bird species in EU Member States in 2012 – EU-data only
Species Total sampled
LPAI H5positives
Other LPAI positives
"Other positives" Pathotype undetermined
Accipiter nisus 79 - 9 -Anas clypeata 6 - - 1Anas crecca 31 - 1 1Anas platyrhynchos 785 2 7 5Anas sp. 110 - - 2Ardea cinerea 86 - 5 -Circus aeruginosus 24 - - 1Cygnus olor 333 - 1 2Cygnus sp. 130 - - 1Gallinago gallinago 6 - - 1Gallinula chloropus 28 - 1 -Haematopus ostralegus 7 - 2 -Larus argentatus 207 - 6 -Larus argentatus cachinnans 33 - 2 1Larus canus 22 - 1 -Larus fuscus 46 - 3 -Larus marinus 9 - 1 -Larus ridibundus 126 - 3 -Nycticorax nycticorax 2 1 - -Parus sp. 5 - - 4
Further details regarding sampling and results for target-species and other species by individual MS can be found in Annex 3 (section 7.2.1). Observations of LPAI H5, detected through passive surveillance, were made in a similar number of genera in 2012 as previous years. Detections occurred in dabbling ducks and one heron in 2012, Table 11; whilst in both 2010 and 2011, LPAI H5 detections by passive surveillance were made in dabbling ducks and swans.
3.2.3.4 Order and species of positive wild birds

45
3.3 Poultry and Wild Bird Survey Results by Member State
Table 3 shows the number of poultry holdings sampled and the total number of holdings reported (from regions where sampling took place) by poultry category across MS in 2012. In addition, Table 6 shows the number of poultry holdings sampled and the number of seropositive H5 and H7 holdings by poultry category across MS in 2012. Furthermore, for wild birds, Table 9 shows the number of birds sampled by passive surveillance and the number of AI detections across MS in 2012.
Descriptive results relating to individual Member State’s programmes
Poultry: The total number of holdings (from regions where sampling took place) reported for each poultry category per MS is given in parentheses in the text below. Where the number of sampled holdings exceeds the total number of holdings reported, holdings are assumed to have been sampled more than once. For more information on how the poultry data were processed, including the definition of a poultry holding and how the total number of poultry holdings figure (from regions where sampling took place) was calculated, please refer to the Methods Section 5.1. Details are also given below on the number of influenza A virus positive poultry holdings (including H5, H7 and other subtypes) detected in each MS.
Wild Birds: The total number of wild birds sampled by passive surveillance is reported, including the number of H5, H7 or other H subtypes detected through passive surveillance.
Austria
Poultry:
• Austria carried out surveillance using a representative sampling approach.
• Test results from holdings sampled were reported from Chicken Breeders, Conventional Laying Hens, Free-range Laying Hens, Fattening Turkeys, Fattening Ducks, Fattening Geese, and Ratites.
• 30 Chicken Breeder holdings were sampled (35 total).
• 57 Conventional Laying Hen holdings were sampled (460 total).
• 61 Free-range Laying Hen holdings were sampled (635 total).
• 53 Fattening Turkey holdings were sampled (139 total).
• 14 Fattening Duck holdings were sampled (14 total).
• 45 Fattening Geese holdings were sampled (45 total).
• Nine Ratite holdings were sampled (Ten total).
• Austria reported from seven regions. The number of regions sampled varied across poultry categories.
• No positive holdings were reported in 2012, which was also the case in 2011 and 2010.
Wild Birds:
• 89 wild birds were sampled by passive surveillance.

46
• There were no positive H5 or H7 detections in wild birds sampled by passive surveillance in 2012.
• One Mallard (Anas platyrhynchos) and one Caspian Gull (Larus argentatus cachinnans) each tested positive for AI. For both birds, the Influenza A virus H subtype was not H5 or H7.
Belgium
Poultry:
• Belgium carried out surveillance using a risk-based sampling approach.
• Test results from holdings sampled were reported from Chicken Breeders, Conventional Laying Hens, Free-range Laying Hens, Conventional Broilers, Free-range Broilers, Fattening Turkeys, Fattening Ducks, Breeder Geese, Game Birds, and Others. Hobby holdings reported under the Conventional Broilers category were reassigned to Free-range Broilers.
• 145 Chicken Breeder holdings were sampled (203 total).
• 292 Conventional Laying Hen holdings were sampled (293 total).
• 108 Free-range Laying Hen holdings were sampled (103 total).
• Two Conventional Broiler holdings were sampled (Two total).
• Two Free-range Broiler holdings were sampled (Two total).
• 49 Fattening Turkey holdings were sampled (35 total).
• 25 Fattening Duck holdings were sampled (20 total).
• Two Breeder Geese holdings were sampled (Four total).
• 18 Game Bird holdings were sampled (22 total).
• One Other holding was sampled (Two total).
• Belgium reported from ten regions. The number of regions sampled varied by poultry category.
• Positive holdings were reported in 2012, which was also the case in 2011 and 2010.
• In 2012, two Fattening Duck holdings were reported as serologically positive for influenza A virus subtype H5.
• In 2011, three holdings were reported as positive. One Fattening Duck holding and two Breeder Geese holdings tested serologically positive for influenza A virus subtype H5. The two Breeder Geese holdings also both tested virologically positive for influenza A virus (one was PCR/virus isolation positive for influenza A virus, while the other was PCR positive for influenza A virus/virus isolation negative).
• In 2010, one Fattening Duck holding was serologically and PCR positive for influenza A virus, subtype H5.
Wild Birds:
• 365 wild birds were sampled by passive surveillance.

47
• There were no positive H5 or H7 detections in wild birds sampled by passive surveillance in 2012.
• 29 birds from eight different species tested positive for Influenza A virus, H subtype not H5 or H7. More details about these birds can be found in Annex 5 (section 7.2.3.4).
Bulgaria
Poultry:
• Bulgaria carried out surveillance using a risk-based sampling approach.
• Test results from holdings sampled were reported from Chicken Breeders, Conventional Laying Hens, Conventional Broilers, Fattening Ducks, Backyard Flocks, Game Birds, and Others. Partridges, Pheasants and Quails reported in the Others category were reassigned to Game Birds.
• Seven Chicken Breeder holdings were sampled (10 total).
• 21 Conventional Laying Hen holdings were sampled (51 total).
• Four Conventional Broiler holdings were sampled (six total).
• 56 Fattening Duck holdings were sampled (98 total).
• 1595 Backyard Flock holdings were sampled (405,006 total).
• Four Game Bird holdings were sampled (Five total).
• One Other holding was sampled (One total).
• Bulgaria reported from 26 regions. The number of regions sampled varied by poultry category.
• No positive holdings were reported in 2012, as was the case in 2011, but not 2010.
• In 2010, 15 Fattening Duck holdings were reported serologically and PCR/virologically positive for influenza A virus subtypes H3, H4 and H6.
Wild Birds:
• Five wild birds were sampled by passive surveillance.
• There were no positive H5 or H7 detections in wild birds sampled by passive surveillance in 2012.
Cyprus
Poultry:
• Cyprus carried out surveillance using a representative sampling approach.
• Test results from holdings sampled were reported from Chicken Breeders, Conventional Laying Hens, Free-range Laying Hens, Fattening Turkeys, Backyard Flocks, and Game Birds.
48
• 12 Chicken Breeder holdings were sampled (18 total).
• 21 Conventional Laying Hen holdings were sampled (22 total).
• 49 Free-range Laying Hen holdings were sampled (15 total).
• Six Fattening Turkey holdings were sampled (Eight total).
• 14 Backyard Flock holdings were sampled (8530 total).
• Ten Game Bird holdings were sampled (Nine total).
• Cyprus reported as one region.
• No positive holdings were reported in 2012, which was also the case in 2011 and 2010.
Wild Birds:
• 158 wild birds were sampled by passive surveillance.
• There were no positive H5 or H7 detections in wild birds sampled by passive surveillance in 2012.
Czech Republic
Poultry:
• The Czech Republic carried out surveillance using a representative sampling approach.
• Test results from holdings sampled were reported from Conventional Laying Hens, Free-range Laying Hens, Fattening Turkeys, Turkey Breeders, Fattening Ducks, Breeder Ducks, Fattening Geese, Breeder Geese, and Game Birds.
• 53 Conventional Laying Hen holdings were sampled (139 total).
• Seven Free-range Laying Hen holdings were sampled (Seven total).
• 33 Fattening Turkey holdings were sampled (44 total).
• One Turkey Breeder holding was sampled (One total).
• 24 Fattening Duck holdings were sampled (24 total).
• 18 Breeder Duck holdings were sampled (18 total).
• Three Fattening Geese holdings were sampled (Three total).
• Seven Breeder Geese holdings were sampled (Seven total).
• 42 Game Bird holdings were sampled (42 total).
• The Czech Republic reported from 13 regions. The number of regions sampled varied by poultry category.
• Positive holdings were reported in 2012, which was also the case in 2011 and 2010.
• In 2012, one Breeder Geese holding tested serologically positive for influenza A virus subtype H5.

49
• In 2011, two holdings were reported as positive. One Breeder Duck holding and one Breeder Geese holding tested serologically positive for influenza A virus subtype H5.
• In 2010, one Game Bird holding was virologically (PCR) positive for influenza A virus other subtype H6.
Wild Birds:
• 102 wild birds were sampled by passive surveillance.
• There were no positive H5 or H7 detections in wild birds sampled by passive surveillance in 2012.
• One Mallard (Anas platyrhynchos) tested PCR positive for Influenza A virus subtype H4.
Denmark
Poultry:
• Denmark carried out surveillance using a risk-based sampling approach.
• Test results from holdings sampled were reported from Chicken Breeders, Conventional Laying Hens, Free-range Laying Hens, Free-range Broilers, Fattening Turkeys, Fattening Ducks, Breeder Ducks, Breeder Geese, and Game Birds.
• 532 Chicken Breeder holdings were sampled (452 total).
• 33 Conventional Laying Hen holdings were sampled (23 total).
• 259 Free-range Laying Hen holdings were sampled (106 total).
• Five Free-range Broiler holdings were sampled (17 total).
• 46 Fattening Turkey holdings were sampled (44 total).
• 13 Fattening Duck holdings were sampled (60 total).
• Three Breeder Duck holdings were sampled (Two total).
• One Breeder Geese holding was sampled (One total).
• 258 Game Bird holdings were sampled (210 total).
• Denmark reported as one region.
• Positive holdings were reported in 2012, which was also the case in 2011 and 2010.
• In 2012, one Free-range Laying Hen holding tested serologically positive for influenza A virus subtype H5.
• In 2011, one Fattening Duck holding tested serologically positive for influenza A virus subtype H5.
• In 2010, five Game Bird holdings were reported as positive for influenza A virus. Two holdings were reported serologically positive for influenza A virus, subtype H5, and one of these was also virologically positive for H7 subtype. Another three holdings were serologically positive for influenza A virus, subtype H7, and one of these was also virologically (PCR) positive for the same subtype (H7).

50
Wild Birds:
• 18 wild birds were sampled by passive surveillance.
• There were no positive H5 or H7 detections in wild birds sampled by passive surveillance in 2012.
• Two Eurasian Oystercatchers (Haematopus ostralegus) tested PCR positive for Influenza A virus, H subtype not H5 or H7.
Estonia
Poultry:
• Estonia carried out surveillance using a representative sampling approach.
• Test results from holdings sampled were reported from Conventional Laying Hens. In addition, birds that were reported in the Others category as Quails were reassigned to Game Birds.
• 15 Conventional Laying Hen holdings were sampled (16 total).
• One Game Bird holding was sampled (One total).
• Estonia reported from one region.
• No positive holdings were reported in 2012, which was also the case in 2011 and 2010.
Wild Birds:
• 16 wild birds were sampled by passive surveillance.
• There were no positive H5 or H7 detections in wild birds sampled by passive surveillance in 2012.
Finland
Poultry:
• Finland carried out surveillance using a risk-based sampling approach.
• Test results from holdings sampled were reported from Chicken Breeders, Conventional Laying Hens, Free-range Laying Hens, Fattening Turkeys, Fattening Ducks, Fattening Geese, Game Birds, and Ratites. One holding (mixed farm, with hens, geese and ducks, with a H5 seropositive detected in hens) was reassigned from Fattening Geese to Conventional Laying Hens.
• 53 Chicken Breeder holdings were sampled (64 total).
• 49 Conventional Laying Hen holdings were sampled (452 total).
• 26 Free-range Laying Hen holdings were sampled (39 total).
• 46 Fattening Turkey holdings were sampled (46 total).
• Two Fattening Duck holdings were sampled (Two total).

51
• One Fattening Geese holding was sampled (One total).
• Five Game Bird holdings were sampled (Ten total).
• Two Ratite holdings were sampled (Two total).
• Finland reported from four regions. The number of regions sampled varied by poultry category.
• Positive holdings were reported in 2012, as was the case in 2011, but not 2010.
• In 2012, two holdings were reported as positive. One Conventional Laying Hen holding and one Fattening Geese holding tested serologically positive for influenza A virus subtype H5.
• In 2011, one Fattening Geese holding tested serologically positive for influenza A virus subtype H5.
Wild Birds:
• 113 wild birds were sampled by passive surveillance.
• There were no positive H5 or H7 detections in wild birds sampled by passive surveillance in 2012.
France
Poultry:
• France carried out surveillance using a risk-based sampling approach.
• Test results from holdings sampled were reported from Chicken Breeders, Conventional Laying Hens, Free-range Laying Hens, Free-range Broilers, Fattening Turkeys, Turkey Breeders, Fattening Ducks, Breeder Ducks, Breeder Geese, Backyard Flocks, Game Birds, and Ratites.
• 61 Chicken Breeder holdings were sampled (1000* total).
• 48 Conventional Laying Hen holdings were sampled (6000* total).
• 67 Free-range Laying Hen holdings were sampled (1030* total).
• 88 Free-range Broiler holdings were sampled (6000* total).
• 132 Fattening Turkey holdings were sampled (4070 total).
• 65 Turkey Breeder holdings were sampled (230* total)
• 168 Fattening Ducks holdings were sampled (4300 total).
• 85 Breeder Duck holdings were sampled (250 total).
• 15 Breeder Geese holdings were sampled (133* total).
• 41 Backyard Flock holdings were sampled (3000 total)
• 144 Game Bird holdings were sampled (3500 total).
• Four Ratite holdings were sampled (20* total).

52
• *The total number of holdings reported for Chicken Breeders, Conventional Laying Hens, Free-range Laying Hens, Free-range Broilers, Turkey Breeders, Breeder Geese, and Ratites is from 2011 as this information was unavailable for 2012.
• France reported from 41 regions. The number of regions sampled varied by poultry category.
• Positive holdings were reported in 2012, which was also the case in 2011 and 2010.
• In 2012, 21 holdings were reported as positive. Five Fattening Duck holdings, 14 Breeder Duck holdings and two Breeder Geese holdings tested serologically positive for influenza A virus subtype H5.
• In 2011, 28 holdings were reported as positive. Six Fattening Duck holdings, 19 Breeder Duck holdings, two Breeder Geese holdings and one Game Bird holding tested serologically positive for influenza A virus subtype H5.
• In 2010, 33 holdings were reported as positive. Influenza A viruses were detected in Breeder Ducks (19 holdings), Fattening Ducks (three holdings), Breeder Geese (six holdings) and Game Birds (five holdings), all of which were serologically positive for subtype H5.
Wild Birds:
• 49 wild birds were sampled by passive surveillance.
• There were no positive H5 or H7 detections in wild birds sampled by passive surveillance in 2012.
Germany
Poultry:
• Germany carried out surveillance using a risk-based sampling approach.
• Test results from holdings sampled were reported from Conventional Laying Hens, Free-range Laying Hens, Conventional Broilers, Fattening Turkeys, Turkey Breeders, Fattening Ducks, Breeder Ducks, Fattening Geese, Backyard Flocks, Game Birds, Ratites, and Others.
• 41 Conventional Laying Hen holdings were sampled (30,846 total).
• 12 Free-range Laying Hen holdings were sampled (22,904 total).
• Four Conventional Broiler holdings were sampled (1296 total).
• 50 Fattening Turkey holdings were sampled (1192 total).
• Three Turkey Breeder holdings were sampled (87 total).
• 34 Fattening Duck holdings were sampled (1140 total).
• Two Breeder Duck holdings were sampled (Three total).
• Eight Fattening Geese holdings were sampled (465 total).
• 18 Backyard Flock holdings were sampled (47,608 total).
• Eight Game Bird holdings were sampled (26 total).

53
• Eight Ratite holdings were sampled (286 total).
• 102 Other holdings were sampled (62,930 total).
• Germany reported from 18 regions. The number of regions sampled varied by poultry category.
• Positive holdings were reported in 2012, unlike in 2011 and 2010.
• In 2012, one Fattening Turkey holding tested serologically and virologically (PCR and virus isolation) positive for influenza A virus subtype H9.
Wild Birds:
• 1,256 wild birds were sampled by passive surveillance.
• There were no positive H5 or H7 detections in wild birds sampled by passive surveillance in 2012.
• One Duck (Anas spp.) and one Swan (Cygnus spp.) each tested positive for Influenza A virus subtype H4 and H9, respectively. In addition, one Duck (Anas spp.), one Mute Swan (Cygnus olor), four Tits (Parus spp.) and one Western Marsh Harrier (Circus aeruginosus) tested PCR positive for Influenza A virus, but the H subtype and pathogenicity could not be determined.
Greece
Poultry:
• Greece carried out surveillance using a representative sampling approach.
• Test results from holdings sampled were reported from Chicken Breeders, Conventional Laying Hens, Free-range Broilers, Fattening Turkeys, Turkey Breeders, Game Birds, Ratites, and Others.
• 48 Chicken Breeder holdings were sampled (103 total).
• 45 Conventional Laying Hen holdings were sampled (366 total).
• 48 Free-range Broiler holdings were sampled (48 total).
• 22 Fattening Turkey holdings were sampled (47 total).
• Four Turkey Breeder holdings were sampled (Seven total).
• Nine Game Bird holdings were sampled (Ten total).
• Three Ratite holdings were sampled (Five total).
• 56 Other holdings were sampled (111 total).
• Greece reported from ten regions. The number of regions sampled varied by poultry category.
• No positive holdings were reported in 2012, which was also the case in 2010, but not 2011.
• In 2011, two holdings were reported as positive. One ‘Other’ holding (geese reared and sold for use as backyard) tested serologically positive for influenza A virus subtype H5. In

54
addition, another ‘Other’ holding (quails and pheasants reared and sold for use as backyard) tested PCR positive for influenza A virus (serology not performed/virus isolation negative).
Wild Birds:
• 11 wild birds were sampled by passive surveillance.
• There were no positive H5 or H7 detections in wild birds sampled by passive surveillance in 2012.
Hungary
Poultry:
• Hungary carried out surveillance using a representative sampling approach.
• Test results from holdings sampled were reported from Chicken Breeders, Conventional Laying Hens, Fattening Turkeys, Turkey Breeders, Fattening Ducks, Breeder Ducks, Fattening Geese, Breeder Geese, Backyard Flocks, Game Birds, and Ratites.
• 17 Chicken Breeder holdings were sampled (100 total).
• 57 Conventional Laying Hen holdings were sampled (424 total).
• 55 Fattening Turkey holdings were sampled (345 total).
• Ten Turkey Breeder holdings were sampled (26 total).
• 77 Fattening Duck holdings were sampled (295 total).
• 13 Breeder Duck holdings were sampled (37 total).
• 93 Fattening Geese holdings were sampled (345 total).
• 20 Breeder Geese holdings were sampled (54 total).
• 485 Backyard Flock holdings were sampled (246,626 estimated total).
• 21 Game Bird holdings were sampled (50 total).
• Two Ratite holdings were sampled (Three total).
• Hungary reported from 19 regions. The number of regions sampled varied across poultry categories.
• No positive holdings were reported in 2012, which was also the case in 2011 and 2010.
Wild Birds:
• 1,513 wild birds were sampled by passive surveillance.
• Three wild birds sampled by passive surveillance were reported as PCR positive for LPAI H5 in 2012. These were two Mallards (Anas platyrhynchos) and one Black-crowned Night Heron (Nycticorax nycticorax).
55
• Four Mallards (Anas platyrhynchos) tested positive for Influenza A virus; three were subtype H3 and one was subtype H11. In addition, two Caspian Gulls (Larus argentatus cachinnans) tested positive for Influenza A virus, subtype H13.
Ireland
Poultry:
• Ireland carried out surveillance using a representative sampling approach.
• Test results from holdings sampled were reported from Chicken Breeders, Conventional Laying Hens, Free-range Laying Hens, Free-range Broilers, Fattening Turkeys, Turkey Breeders, Fattening Ducks, and Fattening Geese.
• 108 Chicken Breeder holdings were sampled (86 total).
• 60 Conventional Laying Hen holdings were sampled (89 total).
• 58 Free-range Laying Hen holdings were sampled (97 total).
• 48 Free-range Broiler holdings were sampled (16 total).
• 42 Fattening Turkey holdings were sampled (107 total).
• Two Turkey Breeder holdings were sampled (Eight total).
• Two Fattening Duck holdings were sampled (One total).
• Two Fattening Geese holdings were sampled (One total).
• Ireland reported from two regions. The number of regions sampled varied by poultry category.
• No positive holdings were reported in 2012, which was also the case in 2011 and 2010.
Wild Birds:
• 35 wild birds were sampled by passive surveillance.
• There were no positive H5 or H7 detections in wild birds sampled by passive surveillance in 2012.
• Two Mallards (Anas platyrhynchos) tested positive for Influenza A virus, but the H subtype and pathogenicity could not be determined.
Italy
Poultry:
• Italy carried out surveillance using a risk-based sampling approach.
• Test results from holdings sampled were reported from Chicken Breeders, Conventional Laying Hens, Free-range Laying Hens, Fattening Turkeys, Turkey Breeders, Fattening Ducks, Breeder Ducks, Fattening Geese, Breeder Geese, Backyard Flocks, Game Birds, Ratites, and Others.

56
• 677 Chicken Breeder holdings were sampled (321 total).
• 2119 Conventional Laying Hen holdings were sampled (1379 total).
• 311 Free-range Laying Hen holdings were sampled (230 total).
• 1579 Fattening Turkey holdings were sampled (846 total).
• 107 Turkey Breeder holdings were sampled (54 total).
• 199 Fattening Duck holdings were sampled (160 total).
• 24 Breeder Duck holdings were sampled (Eight total).
• 46 Fattening Geese holdings were sampled (67 total).
• 20 Breeder Geese holdings were sampled (Eight total).
• 2038 Backyard Flock holdings were sampled (143,445 total).
• 437 Game Bird holdings were sampled (455 total).
• 59 Ratite holdings were sampled (78 total).
• 1665 Other holdings were sampled (1917* total).
*The total number of holdings for Others (Quail) in NUTS code region ITF6 was not known and so could not be included in the total number of holdings calculation.
• Italy reported from 21 regions. The number of regions sampled varied by poultry category.
• Positive holdings were reported in 2012, which was also the case in 2011 and 2010.
• In 2012, eight holdings were reported as positive. Three Conventional Laying Hen holdings and one Free-range Laying Hen holding tested serologically positive for influenza A virus subtype H5. One Fattening Duck holding was PCR positive for the H5 subtype (serology/virus isolation not performed). Two Backyard Flock holdings were reported positive for influenza A virus; one was PCR positive for the H5 subtype (serology/virus isolation not performed); and one was serologically positive for the H7 subtype. In addition, one Others (Dealer) holding was PCR and virus isolation positive for the H5 subtype (serology not performed).
• In 2011, 18 holdings were reported as positive. Four Conventional Laying Hen holdings tested serologically positive for influenza A virus, two for subtype H5 (one of these was also PCR/virus isolation positive), and two for subtype H7. Eight Backyard Flock holdings tested serologically positive for influenza A virus, two for subtype H5 and six for subtype H7. In addition, six ‘Other’ holdings were reported positive for influenza A virus; one (Others, dealer) was PCR positive for the H5 subtype (serology negative/virus isolation not performed), as well as being serologically positive for the H7 subtype; one was serologically and PCR positive (virus isolation not performed) for the H5 subtype; and four were positive for the H7 subtype (three were serologically positive and one was PCR positive (serology/virus isolation not performed)).
• In 2010, a total of 12 holdings were reported positive. Four Backyard Flock holdings were serologically positive for influenza A virus, one for subtype H5, and three for subtype H7. Three Conventional Laying Hen holdings were serologically positive for influenza A virus, again one for H5 subtype, and two for H7 (one of these was also PCR/virologically positive). In addition, five ‘Other’ holdings were reported positive for influenza A virus; two were virologically (PCR) positive for H5 subtype, and three holdings were positive for subtype H7 (one of these was serologically and virologically positive, and two were virologically positive).

57
Wild Birds:
• 693 wild birds were sampled by passive surveillance.
• There were no positive H5 or H7 detections in wild birds sampled by passive surveillance in 2012.
• Two Black-headed Gulls (Larus ridibundus) tested positive for Influenza A virus subtype H13. In addition, one northern shoveler (Anas clypeata), one Eurasian Teal (Anas crecca), one Mallard (Anas platyrhynchos) and one Common Snipe (Gallinago gallinago) each tested PCR positive for Influenza A virus, but the H subtype and pathogenicity could not be determined.
Latvia
Poultry:
• Latvia carried out surveillance using a representative sampling approach.
• Test results from holdings sampled were reported from Chicken Breeders, Conventional Laying Hens, Fattening Ducks, and Backyard Flocks.
• One Chicken Breeder holding was sampled (One total).
• 34 Conventional Laying Hen holdings were sampled (34 total).
• Two Fattening Duck holdings were sampled (Two total).
• 167 Backyard Flock holdings were sampled (2782 total).
• Latvia reported from five regions. The number of regions sampled varied by poultry category.
• No positive holdings were reported in 2012, which was also the case in 2011 and 2010.
Wild Birds:
• No wild birds were sampled by passive surveillance.
Lithuania
Poultry:
• Lithuania carried out surveillance using a representative sampling approach.
• Test results from holdings sampled were reported from Conventional Broilers, Free-range Broilers, and Fattening Turkeys.
• 51 Conventional Broiler holdings were sampled (Eight total).
• Six Free-range Broiler holdings were sampled (One total).
• Four Fattening Turkey holdings were sampled (Two total).
• Lithuania reported from five regions. The number of regions sampled varied by poultry category.

58
• No positive holdings were reported in 2012, which was also the case in 2011 and 2010.
Wild Birds:
• Six wild birds were sampled by passive surveillance.
• There were no positive H5 or H7 detections in wild birds sampled by passive surveillance in 2012.
Luxembourg
Poultry:
• Luxembourg carried out surveillance using a risk-based sampling approach.
• Test results from holdings sampled were reported from Conventional Laying Hens, Free-range Laying Hens, Conventional Broilers, Backyard Flocks, and Ratites.
• Four Conventional Laying Hen holdings were sampled (Four total).
• Three Free-range Laying Hen holdings were sampled (Four total).
• Four Conventional Broiler holdings were sampled (Four total).
• Seven Backyard Flock holdings were sampled (500 total).
• Four Ratite holdings were sampled (One total).
• Luxembourg reported from one region.
• No positive holdings were reported in 2012, which was also the case in 2011 and 2010.
Wild Birds:
• No wild birds were sampled by passive surveillance.
Malta
Poultry:
• Malta carried out surveillance using a representative sampling approach.
• Test results from holdings sampled were reported from Conventional Laying Hens.
• 62 Conventional Laying Hen holdings were sampled (33 total).
• Malta reported from one region.
• No positive holdings were reported in 2012, which was also the case in 2011. (In 2010 Malta did not submit data for the annual poultry surveillance).
Wild Birds:
• No wild birds were sampled by passive surveillance.

59
The Netherlands
Poultry:
• The Netherlands carried out surveillance using a risk-based sampling approach.
• Test results from holdings sampled were reported from Chicken Breeders, Conventional Laying Hens, Free-range Laying Hens, Conventional Broilers, Free-range Broilers, Fattening Turkeys, Fattening Ducks, and Breeder Ducks.
• 3235 Chicken Breeder holdings were sampled (402 total).
• 2385 Conventional Laying Hen holdings were sampled (742 total).
• 1662 Free-range Laying Hen holdings were sampled (274 total).
• 837 Conventional Broiler holdings were sampled (640 total).
• Two Free-range Broiler holdings were sampled (One total).
• 180 Fattening Turkey holdings were sampled (46 total).
• 50 Fattening Duck holdings were sampled (44 total).
• 31 Breeder Duck holdings were sampled (Nine total).
• The Netherlands reported from 12 regions. The number of regions sampled varied by poultry category.
• Positive holdings were reported in 2012, which was also the case in 2011 and 2010.
• In 2012, two holdings were reported as positive. One Free-range Laying Hen holding tested serologically and PCR positive for influenza A virus subtype H7. Also one Fattening Turkey holding tested serologically and PCR positive for influenza A virus subtype H5.
• In 2011, one Free-range Laying Hen holding tested serologically positive for influenza A virus subtype H7.
• In 2010, two positive holdings were reported. One Conventional Laying Hen holding was serologically and virologically (PCR) positive for influenza A virus subtype H7. Whilst one Free-range Laying Hen holding was serologically positive, also for subtype H7.
Wild Birds:
• 165 wild birds were sampled by passive surveillance.
• There were no positive H5 or H7 detections in wild birds sampled by passive surveillance in 2012.
• One Eurasian Teal (Anas crecca) and one Great Black-backed Gull (Larus marinus) each tested positive for Influenza A virus in 2012. They were reported as subtype H8 and subtype ‘not H5 or H7’, respectively.

60
Poland
Poultry:
• Poland carried out surveillance using a representative sampling approach.
• Test results from holdings sampled were reported from Chicken Breeders, Conventional Laying Hens, Free-range Laying Hens, Fattening Turkeys, Turkey Breeders, Fattening Ducks, Breeder Ducks, Fattening Geese, Breeder Geese, Game Birds, and Ratites.
• 59 Chicken Breeder holdings were sampled (493 total).
• 91 Conventional Laying Hen holdings were sampled (993 total).
• 21 Free-range Laying Hen holdings were sampled (157 total).
• 61 Fattening Turkey holdings were sampled (815 total).
• 18 Turkey Breeder holdings were sampled (21 total).
• 77 Fattening Duck holdings were sampled (152 total).
• 15 Breeder Duck holdings were sampled (22 total).
• 87 Fattening Geese holdings were sampled (1000 total).
• 83 Breeder Geese holdings were sampled (170 total).
• 36 Game Bird holdings were sampled (49 total).
• 40 Ratite holdings were sampled (91 total).
• Poland reported from 16 regions. The number of regions sampled varied by poultry category.
• Positive holdings were reported in 2012, which was also the case in 2011 and 2010.
• In 2012, one Breeder Geese holding tested serologically positive for influenza A virus subtype H7.
• In 2011, four holdings were reported as positive. One Breeder Duck holding and three Breeder Geese holdings tested serologically positive for influenza A virus subtype H5.
• In 2010, two Breeder Geese holdings tested positive by serology for H5 influenza A virus.
Wild Birds:
• 20 wild birds were sampled by passive surveillance.
• There were no positive H5 or H7 detections in wild birds sampled by passive surveillance in 2012.
Portugal
Poultry:
• Portugal carried out surveillance using a representative sampling approach.

61
• Test results from holdings sampled were reported from Chicken Breeders, Conventional Laying Hens, Free-range Broilers, Fattening Turkeys, Fattening Ducks, Breeder Ducks, Backyard Flocks, Game Birds, Ratites, and Others.
• 55 Chicken Breeder holdings were sampled (80 total).
• 58 Conventional Laying Hen holdings were sampled (134 total).
• 60 Free-range Broiler holdings were sampled (238 total).
• 55 Fattening Turkey holdings were sampled (131 total).
• Ten Fattening Duck holdings were sampled (Ten total).
• Three Breeder Duck holdings were sampled (Two total).
• 66 Backyard Flock holdings were sampled (236,735 total).
• 55 Game Bird holdings were sampled (77 total).
• Three Ratite holdings were sampled (Three total).
• One Other holding was sampled (Four total).
• Portugal reported from seven regions. The number of regions sampled varied by poultry category.
• No positive holdings were reported in 2012, which was also the case in 2011 and 2010.
Wild Birds:
• 17 wild birds were sampled by passive surveillance.
• There were no positive H5 or H7 detections in wild birds sampled by passive surveillance in 2012.
Romania
Poultry:
• Romania carried out surveillance using a representative sampling approach.
• Test results from holdings sampled were reported from Chicken Breeders, Conventional Laying Hens, Conventional Broilers, Fattening Turkeys, Fattening Ducks, Breeder Ducks, Backyard Flocks, Game Birds, and Ratites. Pheasants and Quails reported in the Others category were reassigned to Game Birds.
• 67 Chicken Breeder holdings were sampled (44 total).
• 187 Conventional Laying Hen holdings were sampled (208 total).
• One Conventional Broiler holding was sampled (15 total).
• 17 Fattening Turkey holdings were sampled (Nine total).
• Two Fattening Duck holdings were sampled (One total).
• Two Breeder Duck holdings were sampled (One total).

62
• 1106 Backyard Flock holdings were sampled (737 total).
• 24 Game Bird holdings were sampled (18 total).
• Two Ratite holdings were sampled (One total).
• Romania reported from 42 regions. The number of regions sampled varied by poultry category.
• No positives holdings were reported in 2012, which was also the case in 2010, but not 2011.
• In 2011, one Backyard Flock holding (fattening geese, sentinel birds) tested PCR positive for influenza A virus (serology negative/virus isolation negative).
Wild Birds:
• 236 wild birds were sampled by passive surveillance.
• There were no positive H5 or H7 detections in wild birds sampled by passive surveillance in 2012.
Slovak Republic
Poultry:
• The Slovak Republic carried out surveillance using a representative sampling approach.
• Test results from holdings sampled were reported from Chicken Breeders, Conventional Laying Hens, Conventional Broilers, Fattening Turkeys, Turkey Breeders, Fattening Ducks, Breeder Ducks, Breeder Geese, Game Birds, and Ratites.
• 11 Chicken Breeder holdings were sampled (14 total).
• 42 Conventional Laying Hen holdings were sampled (89 total).
• Two Conventional Broiler holdings were sampled (29 total).
• Four Fattening Turkey holdings were sampled (Five total).
• Eight Turkey Breeder holdings were sampled (Seven total).
• Five Fattening Duck holdings were sampled (Eight total).
• One Breeder Duck holding was sampled (Two total).
• One Breeder Geese holding was sampled (One total).
• 16 Game Bird holdings were sampled (18 total).
• Seven Ratite holdings were sampled (Ten total).
• Slovak Republic reported from four regions. The number of regions sampled varied by poultry category.
• No positive holdings were reported in 2012, which was also the case in 2011 and 2010.

63
Wild Birds:
• 19 wild birds were sampled by passive surveillance.
• There were no positive H5 or H7 detections in wild birds sampled by passive surveillance in 2012.
Slovenia
Poultry:
• Slovenia carried out surveillance using a representative sampling approach.
• Test results from holdings sampled were reported from Chicken Breeders, Conventional Laying Hens, Fattening Turkeys, Backyard Flocks, Game Birds, and Ratites.
• Eight Chicken Breeder holdings were sampled (Nine total).
• 61 Conventional Laying Hen holdings were sampled (190 total).
• 46 Fattening Turkey holdings were sampled (46 total).
• 90 Backyard Flock holdings were sampled (4155 total).
• Six Game Bird holdings were sampled (Six total).
• Two Ratite holdings were sampled (Two total).
• Slovenia reported from one region.
• No positive holdings were reported in 2012, which was also the case in 2011 and 2010.
Wild Birds:
• 129 wild birds were sampled by passive surveillance.
• There were no positive H5 or H7 detections in wild birds sampled by passive surveillance in 2012.
• One Mallard (Anas platyrhynchos) and one Mute Swan (Cygnus olor) each tested PCR positive for Influenza A virus, H subtype not H5 or H7.
Spain
Poultry:
• Spain carried out surveillance using a representative sampling approach.
• Test results from holdings sampled were reported from Chicken Breeders, Conventional Laying Hens, Free-range Laying Hens, Conventional Broilers, Fattening Turkeys, Turkey Breeders, Fattening Ducks, Breeder Ducks, Fattening Geese, Backyard Flocks, Game Birds, Ratites, and Others. One pheasant holding reported in the Others category was reassigned to Game Birds.
• 104 Chicken Breeder holdings were sampled (386 total).
64
• 144 Conventional Laying Hen holdings were sampled (830 total).
• 55 Free-range Laying Hen holdings were sampled (96 total).
• 118 Conventional Broiler holdings were sampled (1254 total).
• 71 Fattening Turkey holdings were sampled (480 total).
• Eight Turkey Breeder holdings were sampled (Eight total).
• 48 Fattening Duck holdings were sampled (53 total).
• One Breeder Duck holding was sampled (One total).
• Two Fattening Geese holdings were sampled (Two total).
• 64 Backyard Flock holdings were sampled (12,399 total).
• 488 Game Bird holdings were sampled (547 total).
• 43 Ratite holdings were sampled (101 total).
• 151 Other holdings were sampled (7000 total).
• Spain reported from 17 regions. The number of regions sampled varied by poultry category.
• Positive holdings were reported in 2012, unlike in 2011 and 2010.
• In 2012, two Fattening Duck holdings were reported as positive for influenza A virus. One was positive by virus isolation for the H4 subtype (PCR positive for influenza A virus/serology negative); and one was positive by virus isolation for the H6 subtype (PCR/serology negative).
Wild Birds:
• 888 wild birds were sampled by passive surveillance.
• There were no positive H5 or H7 detections in wild birds sampled by passive surveillance in 2012.
Sweden
Poultry:
• Sweden carried out surveillance using a representative sampling approach.
• Test results from holdings sampled were reported from Chicken Breeders, Conventional Laying Hens, Free-range Laying Hens, Conventional Broilers, Fattening Turkeys, Turkey Breeders, Fattening Ducks, Fattening Geese, Game Birds, and Ratites.
• 36 Chicken Breeder holdings were sampled (36 total).
• 54 Conventional Laying Hen holdings were sampled (236 total).
• 24 Free-range Laying Hen holdings were sampled (92 total).
• 34 Conventional Broiler holdings were sampled (34 total).

65
• 19 Fattening Turkey holdings were sampled (19 total).
• Three Turkey Breeder holdings were sampled (Three total).
• Three Fattening Duck holdings were sampled (Three total).
• 20 Fattening Geese holdings were sampled (20 total).
• 23 Game Bird holdings were sampled (25 total).
• Four Ratite holdings were sampled (Three total).
• Sweden reported from eight regions. The number of regions sampled varied by poultry category.
• No positive holdings were reported in 2012, unlike in 2011 and 2010.
• In 2011, two Game Bird (mallard) holdings were reported as serologically positive for influenza A virus subtype H5.
• In 2010, four Game Bird holdings tested serologically positive for influenza A virus, subtype H5 (two of these also tested virologically (PCR) positive for influenza A virus).
Wild Birds:
• 103 wild birds were sampled by passive surveillance.
• There were no positive H5 or H7 detections in wild birds sampled by passive surveillance in 2012.
United Kingdom
Poultry:
• The United Kingdom carried out surveillance using a risk-based sampling approach.
• Test results from holdings sampled were reported from Chicken Breeders, Conventional Laying Hens, Free-range Laying Hens, Fattening Turkeys, Turkey Breeders, Fattening Ducks, Breeder Ducks, Fattening Geese, Breeder Geese, and Game Birds.
• Eight Chicken Breeder holdings were sampled (65 total).
• 57 Conventional Laying Hen holdings were sampled (924 total).
• Eight Free-range Laying Hen holdings were sampled (146 total).
• 62 Fattening Turkey holdings were sampled (408 total).
• Five Turkey Breeder holdings were sampled (Five total).
• 52 Fattening Duck holdings were sampled (120 total).
• 49 Breeder Duck holdings were sampled (158 total).
• 58 Fattening Geese holdings were sampled (113 total).
• Seven Breeder Geese holdings were sampled (27 total).
• 71 Game Bird holdings were sampled (627 total).

66
• The UK reported from 19 regions. The number of regions sampled varied by poultry category.
• Positive holdings were reported in 2012, which was also the case in 2011 and 2010.
• In 2012, eight holdings were reported as positive. Seven Breeder Duck holdings tested serologically positive for influenza A virus subtype H5. Also one Game Bird (Duck) holding tested serologically positive for influenza A virus subtypes H5 and H7.
• In 2011, five holdings were reported as positive. Four Breeder Duck holdings tested serologically positive for influenza A virus, three for subtype H5 and one for subtype H7. In addition, one Fattening Geese holding tested serologically positive for influenza A virus subtype H7.
• In 2010, four holdings tested positive. Three Breeder Duck holdings tested serologically positive for influenza A virus subtype H5. In addition, one Game Bird holding (Ducks) also tested serologically positive for influenza A virus H5 subtype.
Wild Birds:
• 498 wild birds were sampled by passive surveillance.
• There were no positive H5 or H7 detections in wild birds sampled by passive surveillance in 2012.
• One Mute Swan (Cygnus olor) tested PCR positive for low pathogenicity Influenza A virus, but the H subtype could not be determined.
Non-EU countries
Switzerland
Poultry:
• Switzerland carried out surveillance using a representative sampling approach.
• Test results from holdings sampled were reported from Free-range Laying Hens and Fattening Turkeys.
• 98 Free-range Laying Hen holdings were sampled (3523 total).
• 24 Fattening Turkey holdings were sampled (63 total).
• Switzerland reported from six regions. The number of regions sampled varied by poultry category.
• No positive holdings were reported in 2012, which was also the case in 2011 and 2010.
Wild Birds:
• Four wild birds were sampled by passive surveillance.
• There were no positive H5 or H7 detections in wild birds sampled by passive surveillance in 2012.

67
4 DISCUSSION
4.1 Poultry
In 2012 active surveillance for avian influenza in poultry holdings was carried out in 27 MS according to Directive 2005/94/EC (EC 2006a). In addition, one non-MS, Switzerland (CH), submitted data for this report.
Ten MS used a risk-based sampling approach according to guidelines of Commission Decision 2010/367/EC (EC 2010), compared with seven MS in 2011.
A total of 29,404 holdings were sampled, which compares to 29,806 poultry holdings in 2011, 29,484 in 2010, 35,016 in 2009, and 34,985 in 2008. The most frequently sampled poultry category in 2012 was Laying Hens (conventional and free-range), making up 30.0% of the total holdings sampled by EU MS, followed by Backyard Flocks (19.4%) and Chicken Breeders (17.9%). The least sampled poultry category was Ratites (0.7%), reflecting the low proportion of ratite holdings across the EU (0.05% of total holdings reported).
The number of holdings sampled by each MS varied from 16 holdings in Estonia to 9281 in Italy. Italy also sampled the most holdings in 2011 (n = 8750), 2010 (n = 9174), 2009 (n = 10,254), and 2008 (n = 9025). There was an increase in the number of holdings sampled from Chicken Breeders, Free-range Laying Hens, Turkey Breeders, Breeder Ducks, Breeder Geese, Backyard Flocks and Game Birds, compared to 2011, while a decreased number of holdings was sampled for all other poultry categories in 2012. Percentage increases in the number of holdings sampled compared with 2011 varied from 0.6% (Game Birds) to 20.0% (Turkey Breeders).
In 2012, evidence of previous infection with H5 or H7 avian influenza was detected in 43 holdings (including one holding seropositive for both subtypes), which is 0.15% of total holdings sampled. This is a smaller proportion than in 2011, when 65 of 28,806 holdings were serologically positive for H5 or H7 (0.22% of holdings sampled). In 2012, detection of antibodies to avian influenza (H5 and H7 subtypes) occurred in Conventional Laying Hens, Free-range Laying Hens, Fattening Turkeys, Fattening Ducks, Breeder Ducks, Fattening Geese, Breeder Geese, Backyard Flocks, and Game Birds. Most detections of antibodies to subtype H5 infection were in Breeder Ducks (21/40, 52.5%), followed by Fattening Ducks (7/40, 17.5%), and Conventional Laying Hens (4/40, 10%). Antibodies to the H7 subtype were detected in one holding (four total) from each of the Free-range Laying Hen, Breeder Geese, Backyard Flocks and Game Birds categories.
In 2012, 40 holdings were found positive for subtype H5 by serological testing (0.14% of holdings sampled), including one holding that was also seropositive for subtype H7. This is less than in previous survey years. For example, in 2011, 50 holdings were found serologically positive for H5 (0.17% of holdings sampled), 48 were recorded in 2010 (0.16% of holdings sampled), and in 2009 and 2008, 52 holdings in each year were reported as serologically positive for H5 (0.15% of holdings sampled in each year). Of the 40 holdings reported to be seropositive in 2012, 22 underwent follow-up testing for the presence of active infection and one of these (1/22, 4.5%) tested positive for subtype H5 by PCR (indicating active infection). In comparison in 2011, two of 35 H5 seropositive holdings (5.7%) that underwent follow-up testing, tested positive for subtype H5 by PCR or virus isolation.
In 2012, four holdings were found positive for subtype H7 by serological testing (0.01% of holdings sampled), including one holding that was also seropositive for subtype H5. This is less than in previous survey years. For example, in 2011, 15 holdings were found serologically positive for H7 (0.05% of holdings sampled), 11 were reported in 2010 (0.04% of holdings sampled), 38 in 2009 (0.11% of holdings sampled) and 21 in 2008 (0.06% of holdings sampled). Of the four holdings reported to be seropositive in 2012, three underwent follow-up testing for the presence of active infection and one of these (1/3, 33.3%) tested positive for subtype H7 by PCR (indicating active infection). In comparison in 2011, five H7 seropositive holdings underwent follow-up testing and none tested positive for subtype H7 by PCR or virus isolation.
In some poultry species, infection with LPAI can result in only mild clinical signs and may not be detected by poultry keepers and veterinary practitioners. A positive PCR or virus isolation result indicates that active infection is present on the holding and potential for transmission exists. Such

68
a test result will lead to the implementation of measures and restrictions in accordance with Council Directive 2005/94/EC (EC 2006a).
Overall nine MS reported H5 or H7 seropositive holdings in 2012 (BE, CZ, DK, FI, FR, IT, NL, PL, and UK). These MS also reported seropositive holdings in 2011, as well as Greece and Sweden. In addition, in 2012, Germany and Spain detected holdings positive for subtypes other than H5 or H7. A high proportion of the H5 seropositive holdings (21/40, 52.5%) were detected in France, particularly in Breeder Ducks. Regarding H7, one seropositive holding was found in each of the Free-range Laying Hen, Breeder Geese, Backyard Flocks, and Game Birds categories, from the Netherlands, Poland, Italy and the United Kingdom respectively.
The detection rate of H5/H7 seropositive holdings in Breeder Ducks (21 seropositives/247 holdings sampled, 8.5%) and Breeder Geese (4 seropositves/156 holdings sampled, 2.6%) was considerably higher than other poultry categories, followed by Fattening Ducks (7 seropositives/863 holdings sampled, 0.8%) and Fattening Geese (1 seropositive/365 holdings sampled, 0.3%). The high rate of detections in these categories may be due to the following factors: ducks and geese are less likely to show clinical signs than other poultry species so infection is less likely to have been detected earlier by passive surveillance, while in other species clinical disease due to AI may lead to earlier detection. The breeder category birds tend to have a longer lifespan than birds of other poultry categories, and therefore a longer time period over which they could be exposed to the virus. Ducks and geese are frequently kept outdoors and therefore may have a higher probability of contact with wild birds, either directly or indirectly, and hence possibly a greater risk of exposure to AI virus.
The sampling regimes among MS and poultry categories are diverse with different degrees of targeting and testing frequencies, varying numbers of samples collected in each flock and likely variance of within-flock seroprevalence at the time of sampling. Hence differences in between-flock detection rates for poultry categories or MS need to be interpreted with great caution. In particular, those MS undertaking risk-based sampling may experience higher seropositive detection rates than those using representative sampling.
The current guidelines on surveillance in poultry for the EU surveillance programme encourage a risk-based approach. Criteria and risk factors suggested for incorporation include those associated with virus introduction into poultry holdings due to direct or indirect exposure to wild birds and also those for virus spread within the poultry holding and between poultry holdings, as well as the consequences (impact) of the spread of avian influenza between poultry holdings. It is recognised that to carry out risk-based surveillance incorporating such risk factors, an evidence-base applicable to the individual Member State is required. If insufficient evidence is available to develop a risk-based surveillance plan, then representative sampling is recommended as in previous years. The move towards risk-based surveillance should increase the sensitivity of the surveillance programme and/or provide greater efficiency in terms of targeting effort and resource to sampling the holdings that are most likely to have been infected with avian influenza.
4.2 Wild Birds
Avian Influenza (AI) is a highly contagious viral infection, which can affect all species of birds. Highly Pathogenic Avian Influenza (HPAI) can spread rapidly causing serious disease with high mortality in many poultry species. To date all HPAI viruses have been of H5 or H7 subtypes of influenza A. Since 2005, the on-going H5N1 HPAI epizootic has affected over 60 countries across Asia, Africa and Europe, resulting in the loss of hundreds of millions of domestic poultry and major socio-economic impacts. Historically HPAI infection has rarely been observed in wild birds, and nearly always in connection with poultry outbreaks. However, since the current H5N1 HPAI epizootic, wild birds have been implicated in the spread of this virus.
The EU guidelines on surveillance for avian influenza in wild birds published in 2010 (EU 2010) focus the objective of the surveillance to the timely detection of H5N1 HPAI and do not include baseline surveillance for LPAI H5 or H7. The guidelines state that a risk-based design should be implemented via passive surveillance i.e. moribund wild birds or birds found dead, particularly those on the Target Species list (see Annex 6, section 7.2.4). Formulation of this list incorporated data on the number of detections of H5N1 HPAI in the EU surveillance programme from 2005 – 2009 and recent findings on the epidemiology of this virus in wild birds.
69
The detection of HPAI H5N1 in wild birds not associated with outbreaks in poultry illustrates the value of wild bird surveillance in the early detection of the presence of H5N1 HPAI in a country (e.g. Hesterberg et al. 2009). Detections of such infections in wild birds require the implementation of control measures, which include investigations on poultry holdings to detect possible virus introduction, increasing vigilance and reinforcement of biosecurity measures amongst the poultry sector, especially free-range poultry (EC 2006a).
As in previous years, surveillance programmes in 2012 were variable between MS with respect to a number of parameters including: sample size, temporal pattern, and differential targeting of species and areas. Therefore only limited inferences can be made by direct comparisons of detections in different MS, species and seasons. The non-random nature of the sampling means that the proportion positive observed in a species, Member State or time period cannot be assumed to be the true prevalence in the population sampled. The efficacy of passive surveillance is problematic to measure as detection relies on birds dying and being found. A large amount of time and resources may be spent in patrolling a reserve, or the public may frequently observe a particular area, but if mortalities are not observed and reported to the appropriate veterinary authority then dead birds will not be tested for AI. The general decrease in interest in avian and other influenza infections poses a further challenge to veterinary authorities in maintaining a high level of awareness.
A total of 6,508 wild birds, from 24 Member States of the European Union and one non-MS (Switzerland) were tested by passive sampling programmes during the 2012 survey. As in 2011, and by in contrast to the period 2006-2010, H5N1 HPAI was not reported in wild birds. These findings are consistent with the apparent global epidemiology of H5N1 HPAI in wild birds whereby clade 2.2 and subsequent derivative viruses have apparently disappeared from wild bird populations. However, the ongoing threat of incursion via wild birds is still a real risk to the EU since there has been an apparent increase in detections of clade 2.3.2 viruses and their derivatives in wild birds, detected through surveillance particularly in central Asia. Therefore these results together with those obtained from the EU programme confirm that there is a continuing threat for incursion to Europe of such viruses potentially mediated through infected wild birds and other routes.
The proportion of all wild birds sampled by passive surveillance that yielded any AI virus was 0.98% in 2012 which is similar to previous years at around 0.29-2.96%. The proportion of birds testing positive for LPAI H5 or LPAI H7 by passive surveillance (0.05%) was very similar to recent years (0.07% in 2010 and 0.06% in 2011).
LPAI viruses of subtype H5 were detected in three birds from one Member State - Hungary. There were no detections of LPAI H7 by passive surveillance in 2012. It is pertinent to note here that H5 or H7 LPAI infection is highly unlikely to result in significant morbidity or mortality in most wild birds exposed in nature, while H5N1 HPAI can be fatal to many wild bird species.

70
5 METHODS
5.1 Poultry
5.1.1 Survey design A ‘poultry holding', as defined in Council Directive 2009/158/EC (EC 2009), is a facility used for the rearing or keeping of breeding or productive poultry. For the purposes of avian influenza surveillance, this may include facilities that only contain poultry during certain months of the year (i.e. poultry do not need to be present all year round).
MS sampled holdings and submitted data for some or all of the following poultry categories:
• Chicken Breeders (CB) • Conventional Laying Hens (LH) and Free-range Laying Hens (FR LH) • Conventional Broilers (B) and Free-range Broilers (FR B) • Fattening Turkeys (FT) • Turkey Breeders (TB) • Fattening Ducks (FD) • Breeder Ducks (BD) • Fattening Geese (FG) • Breeder Geese (BG) • Backyard Flocks (BYF) • Farmed Game Birds (GB) • Ratites (R) • Others (O)
Where the survey design was based upon representative sampling, the required number of holdings to be sampled for specified poultry categories was determined according to Tables 12 and 13 below.
Note: The number of holdings to be sampled is defined to ensure the identification of at least one infected holding if the prevalence of infected holdings is at least 5 %, with a 95 % confidence interval.
Table 12 Number of holdings to be sampled of each poultry category (except turkey, duck and goose holdings)
Number of holdings per poultry category per Member
State
Number of holdings to be sampled
Up to 34 All
35 –50 35
51-80 42
81-250 53
>250 60

71
Note: The number of turkey, duck and goose holdings to be sampled is defined to ensure the identification of at least one infected holding if the prevalence of infected holdings is at least 5 %, with a 99 % confidence interval.
Where the survey design was based upon risk-based surveillance, the following criteria and risk factors would be considered:
• Criteria and risk factors for virus introduction into poultry holdings due to direct or indirect exposure to wild birds in particular those of identified ‘target species’ for HPAI H5N1 detection (EC 2010):
(a) The location of the poultry holding in proximity to wet areas, ponds, swamps, lakes, rivers or sea shores where migratory wild water birds may gather.
(b) The location of the poultry holding in areas with a high density of migratory wild birds, in particular of those birds that are characterised as ‘target species’.
(c) The location of poultry holding in proximity to resting and breeding places of migratory wild water birds, in particular where these areas are linked through migratory birds’ movements to areas where HPAI H5N1 is known to occur in wild birds or poultry.
(d) Poultry holdings with free range production, or poultry holdings where poultry or other captive birds are kept in the open-air in any premises in which contact with wild birds cannot be sufficiently prevented.
(e) Low biosecurity level in the poultry holding, including the method of storage of feed and the use of surface water.
• Criteria and risk factors for virus spread within the poultry holding and between poultry holdings, as well as the consequences (impact) of the spread of avian influenza from poultry to poultry and between poultry holdings:
(a) The presence of more than one poultry species in the same poultry holding, in particular the presence of domestic ducks and geese together with other poultry species.
(b) The type of poultry production and the poultry species on the holding for which surveillance data have shown an increased detection rate of avian influenza infection in the Member State, such as duck holdings and poultry intended for re-stocking supplies of game (in particular farmed mallards).
(c) The location of the poultry holding in areas with high densities of poultry holdings.
Table 13 Number of turkey, duck and goose holdings to be sampled
Number of holdings per poultry category per Member
State
Number of holdings to be sampled
Up to 46 All
47 -60 47
61-100 59
101-350 80
>350 90
72
(d) Trade patterns, including imports and related intensity of movements, both direct and indirect, of poultry and other factors including vehicles, equipment and persons.
(e) The presence of long lived poultry categories and multi-age groups of poultry on the holding (such as layers).
In addition, in terms of targeting of populations at risk:
• The level of targeting must reflect the number and local weighting of risk factors present on the poultry holding.
• The competent authority may consider other risk factors in its assessment in designing its surveillance design, which must be duly indicated and justified in their surveillance programme.
• Broilers should only be included when: (i) they are kept in significant numbers in free range production and (ii) they are considered to pose a higher risk of infection with avian influenza.
• Backyard Flocks generally play a minor role in virus circulation and spread and sampling them is resource intensive; however, in certain Member States Backyard Flocks may pose a higher risk of avian influenza due to their presence in significant numbers, their proximity to commercial poultry holdings, involvement in local/regional trade and other criteria and risk factors.
Table 14 shows the criteria and risk factors considered by Member States following a risk-based surveillance approach in their 2012 programmes, according to the guidelines of Commission Decision 2010/367/EU (EC 2010).
5.1.2 Laboratory testing Samples were tested in accordance with the Diagnostic Manual for avian influenza, which lays down the procedures for confirmation and differential diagnosis of avian influenza (EC 2006b).
All positive serological findings must then be followed up at the poultry holding by epidemiological investigations and further sampling for testing by virological methods, in order to determine if active infection of avian influenza virus is present on the poultry holding.

73
Table 14 Criteria and risk factors considered by Member States following a risk-based surveillance approach in their 2012 poultry survey programme
Demographic Production Type Biosecurity Trade Timing of Sampling Reactive Sampling Epidemiology Location Explicitly Defined
Sampling Difference Between Risk Strata
Proximity to waterbodies
Proximity to high density
areas of migratory wild
birds
Proximity to resting and
breeding areas of migratory wild birds
Others Densely populated poultry areas Free-text
Presence of poultry holdings where poultry or other birds are kept in the
open air in premises in which contact with wild
birds cannot be sufficiently prevented.
Free-text Free-text Free-text
BE
Free-range holdings; turkey, ducks and geese are considered most at risk; distance between
poultry holdings.
Yes
BG
The surveillance frequency could
be with decreased intensity in
regions considered of
lower risk.
It is preferable the samples taken from domestic poultry from gallinaceous species and waterfowls to be sent
with separate cover letters.
The samples should be taken within the migratory
period of wild birds.
Testing of poultry carcasses collected in case of mortality rates higher than the normal
poultry ones.
No
DE
DK
Additional risk areas are defined as areas 3 km
from the coastal line and
around large lakes.
Yes
Indoor laying hens sampled in high risk areas only; doubled frequency in
breeding flocks (hens, ducks and geese) in high
risk areas.
FI
The poultry business in Finland is
concentrated in the province of
Western Finland. However, the aim
is to include farms also from
other parts of the country.
The type of poultry production and the poultry species on the holding,
such as duck holdings and poultry intended for re-
stocking supplies of game.
No
FRClimate
conditions (high humidity areas).
Free-range holdings; holdings supplying non EU approved abattoirs; focus on sampling of holdings with chickens; turkeys;
ducks and geese; game birds.
Samples will be taken from game birds (pheasants, partridges and mallards)
and palmipeds, which have shown stronger serological
prevalence in previous surveys.
No
Member State
Geographical

74
Demographic Production Type Biosecurity Trade Timing of Sampling Reactive Sampling Epidemiology Location Explicitly Defined
Sampling Difference Between Risk Strata
Proximity to waterbodies
Proximity to high density
areas of migratory wild
birds
Proximity to resting and
breeding areas of migratory wild birds
Others Densely populated poultry areas Free-text
Presence of poultry holdings where poultry or other birds are kept in the
open air in premises in which contact with wild
birds cannot be sufficiently prevented.
Free-text Free-text Free-text
Sampling in defined High Risk Areas: turkey broilers; breeding quail; breeding
ducks and geese; fattening ducks and geese; breeding
flocks and laying hen flocks; ostriches; other
birds bred for meat (excluding broilers and
quail); wild game.
Sampling in defined Low Risk Areas: fattening and
breeding ducks and geese; breeding turkeys and
broilers; breeding chicken; laying hens, both those kept indoors and free-
range; breeding wild game.
LU
The types of production and their specific risks will be targeted, such as free
circulation, free-range production and holding
yard poultry.
The sampling period will coincide with seasonal
production.No
NL Flows and types: breeders have extra testing.
Contiguous and contact testing on seropositives. Yes
Turkey holdings sampled 3 times more frequently, free-range holdings samples 4 times more frequently. Pre-
movement sampling.
UKFree-range holdings; mixed
poultry species holding, where one of the species is
waterfowl.
Minimum flock sizes for sampling. Yes Samples only taken from
defined risk area.
Risk factors for introduction and spread of previous
epidemics.Yes
Member State
Geographical
Production type and biosecurity of commercial
holdings of susceptible species (presence on the holding of categories of
poultry with a long productive life, of different
ages and of different species).
Flows and types.IT

75
5.1.3 Data and data processing The poultry data presented in the report are restricted to data that were collected in 2012 under Decisions 2010/367/EU (EC 2010) and 2011/807/EU (EC 2011).
MS submitted data to the EC database in a standardised format, containing laboratory testing information and more detailed information on the positive holdings found for each poultry category. The data submitted by MS were extracted from the EC database and checked and analysed by the EURL. The standardised format for submission of data ensured that in the majority of MS the data were complete and could be analysed effectively.
The total number of holdings for each poultry category in a MS was calculated using the total number of holdings figure provided for each NUTS code in the last quarter of the year, or the last quarter sampled, from NUTS regions where sampling took place. Hence if a MS did not sample in all NUTS regions that a poultry category is present, this figure will differ from the total number of holdings for that poultry category at the MS level.
If positives were found in two or more poultry categories on the same holding, they were reported in each of the poultry categories, but in the overall positive holdings figures for the MS, the holding was only counted once. Similarly if positives were found for both H5 and H7 subtypes on the same holding, they were reported under each of the subtypes, but in the overall H5/H7 positive holdings figures for the MS, the holding was only counted once.
For the comparison of survey results according to poultry categories across years, free-range and indoor categories were combined, as were fatteners and breeders for Turkeys, Ducks and Geese.
A number of MS that submitted data in the Others category provided further species details. In light of this information, if queries arose concerning whether a type of poultry should be included under Others or another category, they were referred to the relevant MS. For BG, EE, ES and RO, the following data submitted in the Others category were reassigned to Game Birds:
BG – Partridges, Pheasants and Quails, EE - Quails, ES – Pheasants, and RO - Pheasants and Quails.
There were also two cases where reassignment between other poultry categories occurred: BE - Hobby holdings submitted under Conventional Broilers were reassigned to Free-range Broilers. FI – One holding originally submitted under Fattening Geese was reassigned to Conventional Laying Hens. It was a mixed farm (hens, geese and ducks) with a H5 seropositive detected in hens.
Where extra category species details were provided, information on holdings included under Others is shown in Table 15.

76
Table 15 Information on holdings included under Others (where category species details were provided)
Member State
Category species detail included Comments
BE Ornamental fowl.
BG Can include exotic birds, incubators, rescue centres and zoos. In 2012, only one Others holding was sampled in BG, which was ‘incubator’.
EL Poultry (mainly chicken) reared and sold for use as backyard.
This poultry category is exclusively farmed indoors in ‘authorised holdings’ with no access to the outside. At a certain age the birds are distributed by authorised merchants to rural areas where they are kept outside as backyard poultry. Due to this unique production system, EL reported under ‘Others’ instead of reassigning.
ES Chicken registered as 'leisure exposure', fighting cock, pigeon, dove and zoo.
IT Guinea fowl, quail and dealer. Due to the particular production system, IT reported under Others and chose not to reassign to another category.
PT Zoos, pet shops and racing pigeons.
The map (Figure 4) showing the intensity of sampling in the poultry survey and H5/H7 serologically positive holdings was produced using the ArcMap function of Arc GIS version 10.
Positive holdings are displayed at NUTS 2 or 3 level (NUTS 1 for the DK H5 positive). The intensity of surveillance was determined by calculating the density of holdings sampled across mainly NUTS 2 or 3 level regions, but some NUTS 1 regions were used where higher level locations were not available.

77
5.2 Wild Birds
5.2.1 Survey design In 2012, MS wild bird survey plans were approved under Commission Decision 2011/807/EU (EC 2011). Details of individual MS passive surveillance sampling strategies, as described in their 2012 survey plans can be found in Table 16.
5.2.2 Laboratory testing Laboratory tests were carried out in accordance with the EU diagnostic manual for avian influenza (EC 2006b). It was recommended that samples should initially be tested using M gene PCR (to detect presence of AI virus), with rapid testing of positives for H5, and if possible N1, and that analysis of the haemagglutinin cleavage site should be undertaken to determine the pathogenicity of the AI virus.
5.2.3 Data and data processing The data presented in this report is limited to data collected under Commission Decision 2010/367/EU (EC 2010), submitted to the EC database in the required format. Consequently the data may differ from other reporting systems such as the Animal Disease Notification System (ADNS).
Species of wild birds
For passive surveillance 5,428 birds were identified to species level (83%); while a further 765 (12%) were identified to genus level. In addition, 308 (5%) birds were submitted with identification to family level and only 7 submissions were completely unidentified (0.1%). For active surveillance 13,707 birds (98%) were identified to species level, 179 (1%) were identified to their genus, 153 (1%) to the family level.
Wild bird status
Information on the status of the bird at sampling (e.g. live, found dead etc) was complete with 100% of birds sampled for the year 2012 having this information submitted.
Wild bird Subtype / Pathotype information
Of the 64 wild birds testing positive for influenza by passive surveillance, 50 (78%) had H subtype determined and 45 (70%) were identified as LPAI.
Date of wild bird sampling
MS provided a localisation date (from when the bird was sampled in the field) for all birds sampled in 2012.
Wild bird spatial information
Maps were produced using the ArcMap function of Arc GIS version 10, and the sampling intensity is displayed per unit area at NUTS 3 level. Of the submitted spatial information for 2012, 8675 (42.2% of birds sampled during this period) were provided with NUTS 3 codes or better for mapping. 83 (0.4%) were provided with a NUTS 2 code. A further 11,790 (57.4%) birds could be located at NUTS 3 level via geo-coordinates provided.
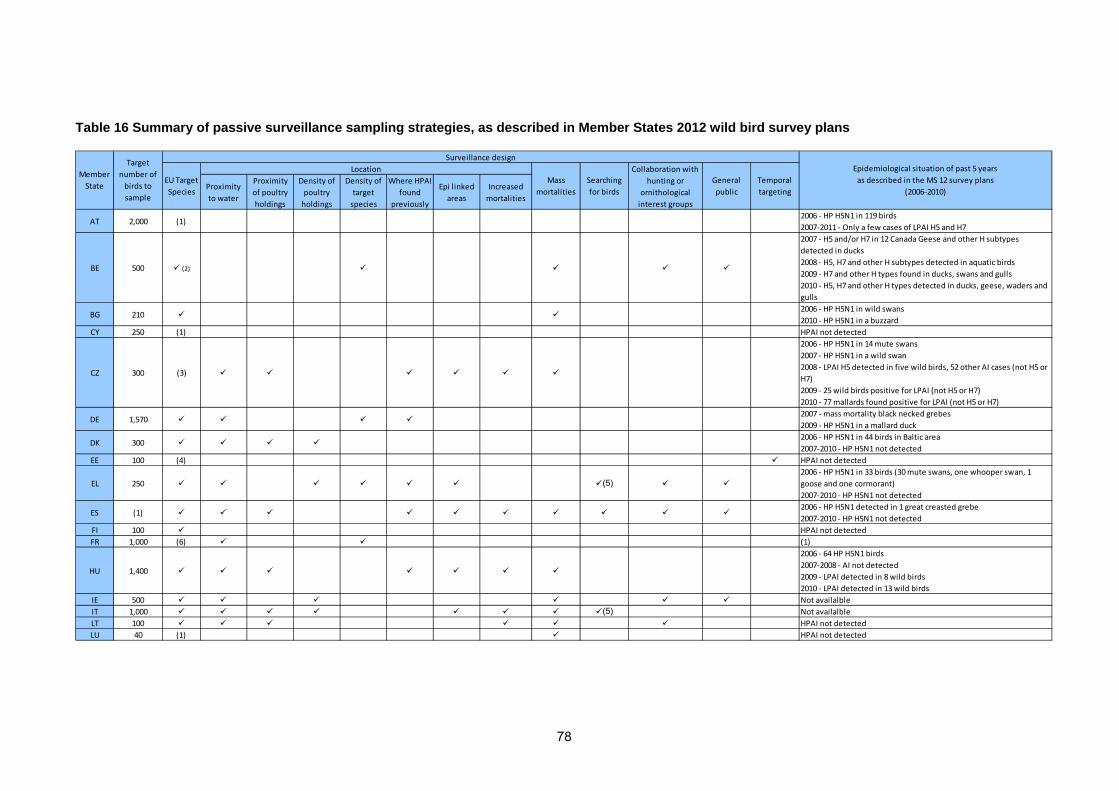
78
Table 16 Summary of passive surveillance sampling strategies, as described in Member States 2012 wild bird survey plans
Proximity to water
Proximity of poultry holdings
Density of poultry
holdings
Density of target
species
Where HPAI found
previously
Epi linked areas
Increased mortalities
AT 2,000 (1)2006 - HP H5N1 in 119 birds2007-2011 - Only a few cases of LPAI H5 and H7
BE 500 (2)
2007 - H5 and/or H7 in 12 Canada Geese and other H subtypes detected in ducks2008 - H5, H7 and other H subtypes detected in aquatic birds2009 - H7 and other H types found in ducks, swans and gulls2010 - H5, H7 and other H types detected in ducks, geese, waders and gulls
BG 2102006 - HP H5N1 in wild swans2010 - HP H5N1 in a buzzard
CY 250 (1) HPAI not detected
CZ 300 (3)
2006 - HP H5N1 in 14 mute swans2007 - HP H5N1 in a wild swan2008 - LPAI H5 detected in five wild birds, 52 other AI cases (not H5 or H7)2009 - 25 wild birds positive for LPAI (not H5 or H7)2010 - 77 mallards found positive for LPAI (not H5 or H7)
DE 1,5702007 - mass mortality black necked grebes2009 - HP H5N1 in a mallard duck
DK 3002006 - HP H5N1 in 44 birds in Baltic area2007-2010 - HP H5N1 not detected
EE 100 (4) HPAI not detected
EL 250 (5)2006 - HP H5N1 in 33 birds (30 mute swans, one whooper swan, 1 goose and one cormorant)2007-2010 - HP H5N1 not detected
ES (1)2006 - HP H5N1 detected in 1 great creasted grebe2007-2010 - HP H5N1 not detected
FI 100 HPAI not detectedFR 1,000 (6) (1)
HU 1,400
2006 - 64 HP H5N1 birds 2007-2008 - AI not detected2009 - LPAI detected in 8 wild birds2010 - LPAI detected in 13 wild birds
IE 500 Not availalbleIT 1,000 (5) Not availalbleLT 100 HPAI not detectedLU 40 (1) HPAI not detected
Epidemiological situation of past 5 years as described in the MS 12 survey plans
(2006-2010)EU Target Species
Member State
Target number of
birds to sample
Surveillance design
Temporal targeting
LocationMass
mortalitiesSearching for birds
Collaboration with hunting or
ornithological interest groups
General public

79
Proximity to water
Proximity of poultry holdings
Density of poultry
holdings
Density of target
species
Where HPAI found
previously
Epi linked areas
Increased mortalities
LV 50 (7)
2006 - 44 ducks positive for LPAI (not H5 or H7)2007 - 27 ducks positive for LPAI (not H5 or H7)2008 - 1 duck positive for LPAI (not H5 or H7)2009 - 18 ducks positive for LPAI (not H5 or H7)2010 - 19 ducks positive for LPAI (not H5 or H7)
MT 50 (8) HPAI not detectedNL 1,000 (5) HPAI not detectedPL 100 (5) (1)
PT 350
2006 - LPAI H7 and other subtypes found in wild birds2007 - LPAI H5 (5 birds) and H7 (7 birds) detected in Anseriformes2008 - LPAI H5 (9 birds) and H7 (7 birds) detected in Anseriformes2009-2010 - no outbreaks of AI detected
RO 240 (5) 2005-2010: HP H5N1 detected in 24 wild birds
SE 1,000 (1) (5)2006 - HPAI detected in 65 wild birds2009 - LPAI detected in 69 mallards2010 - 77 wild birds positive for LPAI
SI 200 (5)
2006 - 48 HPAI H5 birds (mostly mute swans)2007 and 2008 - no H5 or H72009 - LPAI H5 detected in 1 mallard and H7 in 1 mute swan. 10 mallards LPAI positive (not H5 or H7)2010 - 6 mallards positive for LPAI (not H5 or H7)
SK 200 (5) 2006 - 2 birds positive for H5N12007-2010 - no AI detected
UK 8502006 - HP H5N1 in a whooper swan in Scotland2008 - HP H5N1 in wild swans and a canada goose in England
(1) Information was not specified in the 2012 survey plan(2) BE uses target species, plus 6 additional species identified as high risk in BE specifically(3) CZ uses 6 'target species' considered higher risk in their country, not EU TS list(4) EE target species are 'Waterfowl 70% and shorebirds 20% and other wild birds 10%'(5) Searching for dead or moribund birds will occur if the epidemiological situation requires(6) FR targeting Anatidae family (7) LV targeting orders Anseriformes and Charadriiformes(8) MT targets wild ducks and other migratory birds
Member State
Target number of
birds to sample
Surveillance design
Epidemiological situation of past 5 years(2006-2010)
EU Target Species
LocationMass
mortalitiesSearching for birds
Collaboration with hunting or
ornithological interest groups
General public
Temporal targeting
.

80
6 REFERENCES
EC (2002) Commission Decision 2002/649/EC of 5 August 2002 on the implementation of surveys for avian influenza in poultry and wild birds in the Member States, Official Journal of the European Union, L 213, 9.8.2002, p.38.
EC(2005) Commission Decision 2005/726/EC of 17 October 2005 amending Decision 2005/464/EC on the implementation of survey programmes for avian influenza in poultry and wild birds to be carried out in the Member States, Official Journal of the European Union, OJ L 273, 19.10.2005, p. 21.
EC (2006a) Council Directive 2005/94/EC of 20 December 2005 on Community measures for the control of avian influenza and repealing Directive 92/40/EEC, Official Journal of the European Union, L 10, 14.1.2006, p. 16.
EC (2006b) Commission Decision 2006/437/EC of 4 August 2006 approving a Diagnostic Manual for avian influenza as provided for in Council Directive 2005/94/EC, Official Journal of the European Union, L 237, 31.8.2006, p. 1.
EC (2007) Commission Decision 2007/268/EC of 13 April 2007 on the implementation of surveillance programmes for avian influenza in poultry and wild birds to be carried out in the Member States and amending Decision 2004/450/EC, Official Journal of the European Union L115, 3.5.2007, p. 3.
EC (2009) Council Directive 2009/158/EC of 30 November 2009 on animal health conditions governing intra-Community trade in, and imports from third countries of, poultry and hatching eggs, Official Journal of the European Union, L 343, 22.12.2009, p. 74.
EC (2010) Commission Decision 2010/367/EU of 25 June 2010 on the implementation by Member States of surveillance programmes for avian influenza in poultry and wild birds, Official Journal of the European Union, L 166, 1.7.2010, p. 22.
EC (2011) Commission Decision 2011/807/EU of 30 November 2011 on approving annual and multiannual programmes and the financial contribution from the Union for the eradication, control and monitoring of certain animal diseases and zoonoses presented by the Member States for 2012 and following years, Official Journal of the European Union, L 322, 6.12.2011, p. 11.
EFSA (2006) Scientific Opinion of the Panel on Animal Health and Welfare on migratory birds and their possible role in the spread of highly pathogenic avian influenza. The EFSA Journal, 357, 1-46.
Hesterberg, U., Harris, K., Stroud, D., Guberti, V., Busani, L., Pittman, M., Piazza, V., Cook, A. & Brown, I. (2009) Avian influenza surveillance in wild birds in the European Union in 2006. Influenza and Other Respiratory Viruses, 3, 1-14.
SCAHAW (2000) Opinion of the Scientific Committee on Animal Health and Animal Welfare on: ‘The Definition of Avian Influenza and the use of Vaccination against Avian Influenza’ http://ec.europa.eu/food/fs/sc/scah/out45-final_en.pdf
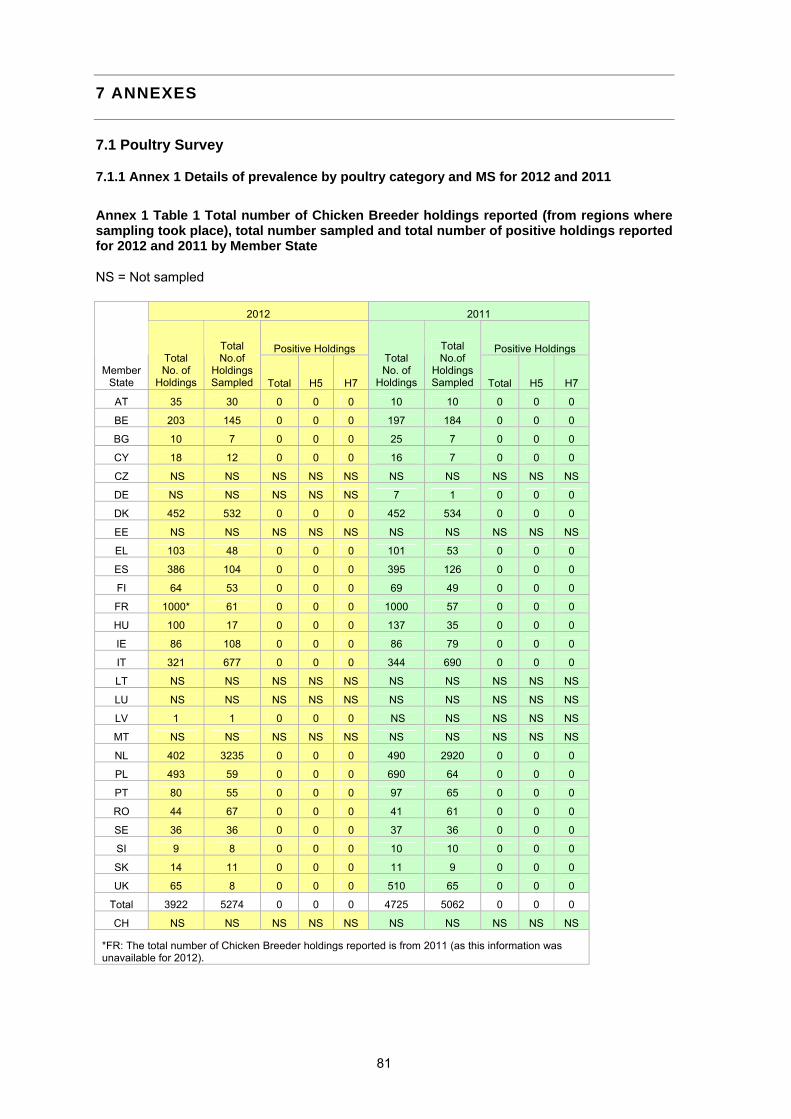
81
7 ANNEXES
7.1 Poultry Survey
7.1.1 Annex 1 Details of prevalence by poultry category and MS for 2012 and 2011
Annex 1 Table 1 Total number of Chicken Breeder holdings reported (from regions where sampling took place), total number sampled and total number of positive holdings reported for 2012 and 2011 by Member State
NS = Not sampled
2012 2011
Positive Holdings Positive Holdings
Member State
Total No. of
Holdings
Total No.of
Holdings Sampled Total H5 H7
Total No. of
Holdings
Total No.of
Holdings Sampled Total H5 H7
AT 35 30 0 0 0 10 10 0 0 0
BE 203 145 0 0 0 197 184 0 0 0
BG 10 7 0 0 0 25 7 0 0 0
CY 18 12 0 0 0 16 7 0 0 0
CZ NS NS NS NS NS NS NS NS NS NS
DE NS NS NS NS NS 7 1 0 0 0
DK 452 532 0 0 0 452 534 0 0 0
EE NS NS NS NS NS NS NS NS NS NS
EL 103 48 0 0 0 101 53 0 0 0
ES 386 104 0 0 0 395 126 0 0 0
FI 64 53 0 0 0 69 49 0 0 0
FR 1000* 61 0 0 0 1000 57 0 0 0
HU 100 17 0 0 0 137 35 0 0 0
IE 86 108 0 0 0 86 79 0 0 0
IT 321 677 0 0 0 344 690 0 0 0
LT NS NS NS NS NS NS NS NS NS NS
LU NS NS NS NS NS NS NS NS NS NS
LV 1 1 0 0 0 NS NS NS NS NS
MT NS NS NS NS NS NS NS NS NS NS
NL 402 3235 0 0 0 490 2920 0 0 0
PL 493 59 0 0 0 690 64 0 0 0
PT 80 55 0 0 0 97 65 0 0 0
RO 44 67 0 0 0 41 61 0 0 0
SE 36 36 0 0 0 37 36 0 0 0
SI 9 8 0 0 0 10 10 0 0 0
SK 14 11 0 0 0 11 9 0 0 0
UK 65 8 0 0 0 510 65 0 0 0
Total 3922 5274 0 0 0 4725 5062 0 0 0
CH NS NS NS NS NS NS NS NS NS NS
*FR: The total number of Chicken Breeder holdings reported is from 2011 (as this information was unavailable for 2012).

82
Annex 1 Table 2 Total number of Conventional and Free-range Laying Hen holdings reported (from regions where sampling took place), total number sampled, and total number of positive holdings reported for 2012 and 2011 by Member State
Virological data is displayed in italics in parentheses. (If a holding was virologically positive for H5/H7 only, further information is provided at the base of the table).
NS = Not sampled
Total H5 H7 Total H5 H7 Total H5 H7 Total H5 H7AT 460 57 0 0 0 635 61 0 0 0 428 64 0 0 0 635 56 0 0 0BE 293 292 0 0 0 103 108 0 0 0 323 296 0 0 0 99 116 0 0 0BG 51 21 0 0 0 NS NS NS NS NS 144 57 0 0 0 NS NS NS NS NSCY 22 21 0 0 0 15 49 0 0 0 26 22 0 0 0 15 28 0 0 0CZ 139 53 0 0 0 7 7 0 0 0 134 54 0 0 0 6 6 0 0 0DE 30,846 41 0 0 0 22,904 12 0 0 0 73,784 109 0 0 0 20,341 3 0 0 0DK 23 33 0 0 0 106 259 1 1 0 35 53 0 0 0 109 283 0 0 0EE 16 15 0 0 0 NS NS NS NS NS 18 18 0 0 0 NS NS NS NS NSEL 366 45 0 0 0 NS NS NS NS NS 360 47 0 0 0 NS NS NS NS NSES 830 144 0 0 0 96 55 0 0 0 863 186 0 0 0 74 53 0 0 0FI 452 49 1 1 0 39 26 0 0 0 761 62 0 0 0 27 11 0 0 0FR 6000* 48 0 0 0 1030* 67 0 0 0 6000 51 0 0 0 1030 65 0 0 0HU 424 57 0 0 0 NS NS NS NS NS 487 84 0 0 0 3 2 0 0 0IE 89 60 0 0 0 97 58 0 0 0 83 46 0 0 0 97 70 0 0 0IT 1379 2119 3 3 0 230 311 1 1 0 1279 2108 4(1) 2(1) 2 212 271 0 0 0LT NS NS NS NS NS NS NS NS NS NS 1 1 0 0 0 NS NS NS NS NSLU 4 4 0 0 0 4 3 0 0 0 4 4 0 0 0 3 3 0 0 0LV 34 34 0 0 0 NS NS NS NS NS 44 44 0 0 0 NS NS NS NS NSMT 33 62 0 0 0 NS NS NS NS NS 35 49 0 0 0 NS NS NS NS NSNL 742 2385 0 0 0 274 1662 1(1) 0 1(1) 965 2669 0 0 0 288 1548 1 0 1PL 993 91 0 0 0 157 21 0 0 0 1144 60 0 0 0 NS NS NS NS NSPT 134 58 0 0 0 NS NS NS NS NS 156 63 0 0 0 NS NS NS NS NSRO 208 187 0 0 0 NS NS NS NS NS 171 163 0 0 0 NS NS NS NS NSSE 236 54 0 0 0 92 24 0 0 0 264 61 0 0 0 95 30 0 0 0SI 190 61 0 0 0 NS NS NS NS NS 138 59 0 0 0 NS NS NS NS NSSK 89 42 0 0 0 NS NS NS NS NS 64 39 0 0 0 NS NS NS NS NSUK 924 57 0 0 0 146 8 0 0 0 1212 57 0 0 0 342 12 0 0 0
Total 44,977 6090 4 4 0 25,935 2731 3(1) 2 1(1) 88,923 6526 4(1) 2(1) 2 23,376 2557 1 0 1CH NS NS NS NS NS 3523 98 0 0 0 NS NS NS NS NS 3523 40 0 0 0
Total No. of
Holdings
Total No.of
Holdings Sampled
Positive Holdings
Member State
2012 2011
Conventional Laying Hens Free-range Laying Hens Conventional Laying Hens Free-range Laying Hens
*FR: The total number of Conventional Laying Hen and Free-range Laying Hen holdings reported is from 2011 (as this information w as unavailable for 2012).
Total No. of
Holdings
Total No.of
Holdings Sampled
Positive Holdings Total No.
of Holdings
Total No.of
Holdings Sampled
Positive HoldingsTotal No.
of Holdings
Total No.of
Holdings Sampled
Positive Holdings
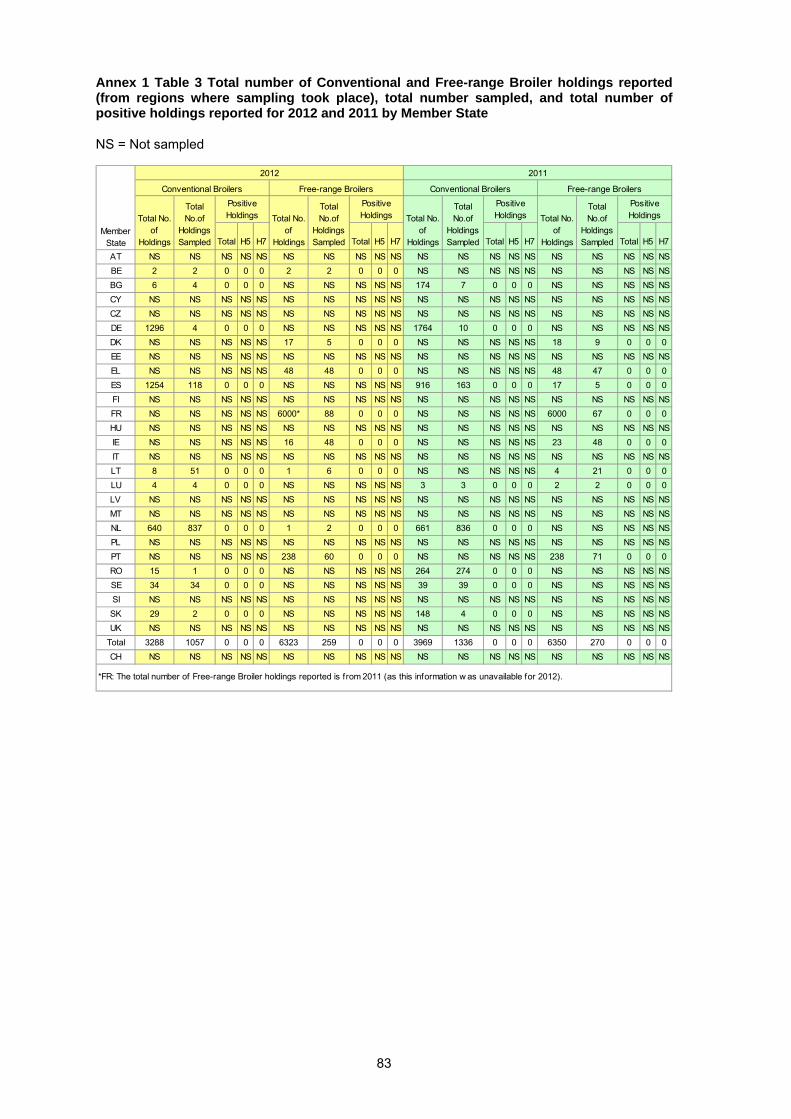
83
Annex 1 Table 3 Total number of Conventional and Free-range Broiler holdings reported (from regions where sampling took place), total number sampled, and total number of positive holdings reported for 2012 and 2011 by Member State
NS = Not sampled
Total H5 H7 Total H5 H7 Total H5 H7 Total H5 H7
AT NS NS NS NS NS NS NS NS NS NS NS NS NS NS NS NS NS NS NS NSBE 2 2 0 0 0 2 2 0 0 0 NS NS NS NS NS NS NS NS NS NSBG 6 4 0 0 0 NS NS NS NS NS 174 7 0 0 0 NS NS NS NS NSCY NS NS NS NS NS NS NS NS NS NS NS NS NS NS NS NS NS NS NS NSCZ NS NS NS NS NS NS NS NS NS NS NS NS NS NS NS NS NS NS NS NSDE 1296 4 0 0 0 NS NS NS NS NS 1764 10 0 0 0 NS NS NS NS NSDK NS NS NS NS NS 17 5 0 0 0 NS NS NS NS NS 18 9 0 0 0EE NS NS NS NS NS NS NS NS NS NS NS NS NS NS NS NS NS NS NS NSEL NS NS NS NS NS 48 48 0 0 0 NS NS NS NS NS 48 47 0 0 0ES 1254 118 0 0 0 NS NS NS NS NS 916 163 0 0 0 17 5 0 0 0FI NS NS NS NS NS NS NS NS NS NS NS NS NS NS NS NS NS NS NS NSFR NS NS NS NS NS 6000* 88 0 0 0 NS NS NS NS NS 6000 67 0 0 0HU NS NS NS NS NS NS NS NS NS NS NS NS NS NS NS NS NS NS NS NSIE NS NS NS NS NS 16 48 0 0 0 NS NS NS NS NS 23 48 0 0 0IT NS NS NS NS NS NS NS NS NS NS NS NS NS NS NS NS NS NS NS NSLT 8 51 0 0 0 1 6 0 0 0 NS NS NS NS NS 4 21 0 0 0LU 4 4 0 0 0 NS NS NS NS NS 3 3 0 0 0 2 2 0 0 0LV NS NS NS NS NS NS NS NS NS NS NS NS NS NS NS NS NS NS NS NSMT NS NS NS NS NS NS NS NS NS NS NS NS NS NS NS NS NS NS NS NSNL 640 837 0 0 0 1 2 0 0 0 661 836 0 0 0 NS NS NS NS NSPL NS NS NS NS NS NS NS NS NS NS NS NS NS NS NS NS NS NS NS NSPT NS NS NS NS NS 238 60 0 0 0 NS NS NS NS NS 238 71 0 0 0RO 15 1 0 0 0 NS NS NS NS NS 264 274 0 0 0 NS NS NS NS NSSE 34 34 0 0 0 NS NS NS NS NS 39 39 0 0 0 NS NS NS NS NSSI NS NS NS NS NS NS NS NS NS NS NS NS NS NS NS NS NS NS NS NSSK 29 2 0 0 0 NS NS NS NS NS 148 4 0 0 0 NS NS NS NS NSUK NS NS NS NS NS NS NS NS NS NS NS NS NS NS NS NS NS NS NS NS
Total 3288 1057 0 0 0 6323 259 0 0 0 3969 1336 0 0 0 6350 270 0 0 0CH NS NS NS NS NS NS NS NS NS NS NS NS NS NS NS NS NS NS NS NS
*FR: The total number of Free-range Broiler holdings reported is from 2011 (as this information w as unavailable for 2012).
Total No. of
Holdings
Total No.of
Holdings Sampled
Positive Holdings Total No.
of Holdings
Total No.of
Holdings Sampled
Positive HoldingsTotal No.
of Holdings
Total No.of
Holdings Sampled
Positive Holdings Total No.
of Holdings
Total No.of
Holdings Sampled
Positive Holdings
Member State
2012 2011
Conventional Broilers Free-range Broilers Conventional Broilers Free-range Broilers

84
Annex 1 Table 4 Total number of Fattening Turkey and Turkey Breeder holdings reported (from regions where sampling took place), total number sampled, and total number of positive holdings reported for 2012 and 2011 by Member State
Virological data is displayed in italics in parentheses. (If a holding was virologically positive for H5/H7 only, further information is provided at the base of the table. Information is also provided on virological data other than H5/H7).
NS = Not sampled
Total H5 H7 Total H5 H7 Total H5 H7 Total H5 H7
AT 139 53 0 0 0 NS NS NS NS NS 111 53 0 0 0 NS NS NS NS NSBE 35 49 0 0 0 NS NS NS NS NS 37 46 0 0 0 NS NS NS NS NSBG NS NS NS NS NS NS NS NS NS NS NS NS NS NS NS NS NS NS NS NSCY 8 6 0 0 0 NS NS NS NS NS 8 6 0 0 0 NS NS NS NS NSCZ 44 33 0 0 0 1 1 0 0 0 47 35 0 0 0 1 1 0 0 0DE 1192 50 1(1) 1 0 0 87 3 0 0 0 4456 97 0 0 0 4268 1 0 0 0DK 44 46 0 0 0 NS NS NS NS NS 44 28 0 0 0 NS NS NS NS NSEE NS NS NS NS NS NS NS NS NS NS NS NS NS NS NS NS NS NS NS NSEL 47 22 0 0 0 7 4 0 0 0 48 20 0 0 0 4 3 0 0 0ES 480 71 0 0 0 8 8 0 0 0 436 90 0 0 0 9 13 0 0 0FI 46 46 0 0 0 NS NS NS NS NS 44 45 0 0 0 NS NS NS NS NSFR 4070 132 0 0 0 230* 65 0 0 0 4070 124 0 0 0 230 62 0 0 0HU 345 55 0 0 0 26 10 0 0 0 301 58 0 0 0 19 16 0 0 0IE 107 42 0 0 0 8 2 0 0 0 107 43 0 0 0 8 2 0 0 0IT 846 1579 0 0 0 54 107 0 0 0 855 1733 0 0 0 41 72 0 0 0LT 2 4 0 0 0 NS NS NS NS NS NS NS NS NS NS NS NS NS NS NSLU NS NS NS NS NS NS NS NS NS NS NS NS NS NS NS NS NS NS NS NSLV NS NS NS NS NS NS NS NS NS NS NS NS NS NS NS NS NS NS NS NSMT NS NS NS NS NS NS NS NS NS NS NS NS NS NS NS NS NS NS NS NSNL 46 180 1(1) 1(1) 0 NS NS NS NS NS 58 188 0 0 0 NS NS NS NS NSPL 815 61 0 0 0 21 18 0 0 0 852 85 0 0 0 15 10 0 0 0PT 131 55 0 0 0 NS NS NS NS NS 143 93 0 0 0 NS NS NS NS NSRO 9 17 0 0 0 NS NS NS NS NS 8 8 0 0 0 NS NS NS NS NSSE 19 19 0 0 0 3 3 0 0 0 22 22 0 0 0 4 3 0 0 0SI 46 46 0 0 0 NS NS NS NS NS 46 46 0 0 0 NS NS NS NS NSSK 5 4 0 0 0 7 8 0 0 0 10 6 0 0 0 6 6 0 0 0UK 408 62 0 0 0 5 5 0 0 0 522 68 0 0 0 14 6 0 0 0
Total 8884 2632 2(2) 1(1) 0 457 234 0 0 0 12,225 2894 0 0 0 4619 195 0 0 0CH 63 24 0 0 0 NS NS NS NS NS 63 25 0 0 0 NS NS NS NS NS
2012 notes
Fattening Turkeys Turkey Breeders
1One holding seropositive and PCR/VI positive for H9.
Positive Holdings Total No.
of Holdings
Total No.of
Holdings Sampled
Positive HoldingsTotal No.
of Holdings
Total No.of
Holdings Sampled
Positive Holdings Total No.
of Holdings
Total No.of
Holdings Sampled
*FR: The total number of Turkey Breeder holdings reported is from 2011 (as this information w as unavailable for 2012).
Positive Holdings Total No.
of Holdings
Total No.of
Holdings Sampled
Fattening Turkeys Turkey Breeders
Member State
2012 2011

85
Annex 1 Table 5 Total number of Fattening and Breeder Duck holdings reported (from regions where sampling took place), total number sampled, and total number of positive holdings reported for 2012 and 2011 by Member State
Virological data is displayed in italics in parentheses. (If a holding was virologically positive for H5/H7 only, further information is provided at the base of the table. Information is also provided on virological data other than H5/H7).
NS = Not sampled
Total H5 H7 Total H5 H7 Total H5 H7 Total H5 H7AT 14 14 0 0 0 NS NS NS NS NS 9 9 0 0 0 NS NS NS NS NSBE 20 25 2 2 0 NS NS NS NS NS 22 20 1 1 0 NS NS NS NS NSBG 98 56 0 0 0 NS NS NS NS NS 115 91 0 0 0 3 2 0 0 0CY NS NS NS NS NS NS NS NS NS NS NS NS NS NS NS NS NS NS NS NSCZ 24 24 0 0 0 18 18 0 0 0 24 24 0 0 0 20 19 1 1 0DE 1140 34 0 0 0 3 2 0 0 0 8435 129 0 0 0 4 1 0 0 0DK 60 13 0 0 0 2 3 0 0 0 56 15 1 1 0 1 2 0 0 0EE NS NS NS NS NS NS NS NS NS NS NS NS NS NS NS NS NS NS NS NSEL NS NS NS NS NS NS NS NS NS NS NS NS NS NS NS NS NS NS NS NSES 53 48 2(2) 1 0 0 1 1 0 0 0 63 56 0 0 0 NS NS NS NS NSFI 2 2 0 0 0 NS NS NS NS NS 7 3 0 0 0 NS NS NS NS NSFR 4300 168 5 5 0 250 85 14 14 0 4300 160 6 6 0 250 74 19 19 0HU 295 77 0 0 0 37 13 0 0 0 287 60 0 0 0 27 10 0 0 0IE 1 2 0 0 0 NS NS NS NS NS 3 2 0 0 0 NS NS NS NS NSIT 160 199 1(1) 1(1) 2 0 8 24 0 0 0 147 156 0 0 0 14 25 0 0 0LT NS NS NS NS NS NS NS NS NS NS NS NS NS NS NS NS NS NS NS NSLU NS NS NS NS NS NS NS NS NS NS NS NS NS NS NS NS NS NS NS NSLV 2 2 0 0 0 NS NS NS NS NS 2 2 0 0 0 2 2 0 0 0MT NS NS NS NS NS NS NS NS NS NS NS NS NS NS NS NS NS NS NS NSNL 44 50 0 0 0 9 31 0 0 0 52 54 0 0 0 11 40 0 0 0PL 152 77 0 0 0 22 15 0 0 0 113 47 0 0 0 34 14 1 1 0PT 10 10 0 0 0 2 3 0 0 0 12 10 0 0 0 2 2 0 0 0RO 1 2 0 0 0 1 2 0 0 0 2 4 0 0 0 NS NS NS NS NSSE 3 3 0 0 0 NS NS NS NS NS 6 6 0 0 0 NS NS NS NS NSSI NS NS NS NS NS NS NS NS NS NS NS NS NS NS NS NS NS NS NS NSSK 8 5 0 0 0 2 1 0 0 0 5 4 0 0 0 NS NS NS NS NSUK 120 52 0 0 0 158 49 7 7 0 167 45 0 0 0 190 51 4 3 1
Total 6507 863 10(3) 8(1) 0 513 247 21 21 0 13,827 897 8 8 0 558 242 25 24 1CH NS NS NS NS NS NS NS NS NS NS NS NS NS NS NS NS NS NS NS NS
2One holding PCR positive for H5 (serology/VI not performed).
2012 notes1One holding VI positive for H4 and PCR positive for influenza A virus (serology negative); one holding VI positive for H6 (serology/PCR negative).
Total No.of
Holdings Sampled
Positive Holdings Total No.
of Holdings
Total No.of
Holdings Sampled
Positive Holdings
Total No.of
Holdings Sampled
Fattening Ducks Breeder Ducks
Member State
Positive Holdings
2011
Fattening Ducks Breeder Ducks
Total No. of
Holdings
Positive Holdings
2012
Total No. of
Holdings
Total No.of
Holdings Sampled
Total No. of
Holdings

86
Annex 1 Table 6 Total number of Fattening and Breeder Geese holdings reported (from regions where sampling took place), total number sampled, and total number of positive holdings reported for 2012 and 2011 by Member State
Virological data is displayed in italics in parentheses. (If a holding was virologically positive for H5/H7 only, further information is provided at the base of the table. Information is also provided on virological data other than H5/H7).
NS = Not sampled
Total H5 H7 Total H5 H7 Total H5 H7 Total H5 H7AT 45 45 0 0 0 NS NS NS NS NS 71 71 0 0 0 NS NS NS NS NSBE NS NS NS NS NS 4 2 0 0 0 NS NS NS NS NS 3 4 2(2) 1 2 0BG NS NS NS NS NS NS NS NS NS NS NS NS NS NS NS NS NS NS NS NSCY NS NS NS NS NS NS NS NS NS NS NS NS NS NS NS NS NS NS NS NSCZ 3 3 0 0 0 7 7 1 1 0 4 4 0 0 0 7 7 1 1 0DE 465 8 0 0 0 NS NS NS NS NS 2466 37 0 0 0 NS NS NS NS NSDK NS NS NS NS NS 1 1 0 0 0 24 6 0 0 0 NS NS NS NS NSEE NS NS NS NS NS NS NS NS NS NS NS NS NS NS NS NS NS NS NS NSEL NS NS NS NS NS NS NS NS NS NS NS NS NS NS NS NS NS NS NS NSES 2 2 0 0 0 NS NS NS NS NS 6 3 0 0 0 NS NS NS NS NSFI 1 1 1 1 0 NS NS NS NS NS 1 1 1 1 0 NS NS NS NS NSFR NS NS NS NS NS 133* 15 2 2 0 NS NS NS NS NS 133 17 2 2 0HU 345 93 0 0 0 54 20 0 0 0 443 74 0 0 0 59 31 0 0 0IE 1 2 0 0 0 NS NS NS NS NS 2 1 0 0 0 NS NS NS NS NSIT 67 46 0 0 0 8 20 0 0 0 67 49 0 0 0 12 30 0 0 0LT NS NS NS NS NS NS NS NS NS NS NS NS NS NS NS NS NS NS NS NSLU NS NS NS NS NS NS NS NS NS NS NS NS NS NS NS NS NS NS NS NSLV NS NS NS NS NS NS NS NS NS NS 3 3 0 0 0 NS NS NS NS NSMT NS NS NS NS NS NS NS NS NS NS NS NS NS NS NS NS NS NS NS NSNL NS NS NS NS NS NS NS NS NS NS NS NS NS NS NS NS NS NS NS NSPL 1000 87 0 0 0 170 83 1 0 1 780 52 0 0 0 218 47 3 3 0PT NS NS NS NS NS NS NS NS NS NS NS NS NS NS NS NS NS NS NS NSRO NS NS NS NS NS NS NS NS NS NS 8 8 0 0 0 NS NS NS NS NSSE 20 20 0 0 0 NS NS NS NS NS 20 20 0 0 0 NS NS NS NS NSSI NS NS NS NS NS NS NS NS NS NS NS NS NS NS NS NS NS NS NS NSSK NS NS NS NS NS 1 1 0 0 0 4 2 0 0 0 NS NS NS NS NSUK 113 58 0 0 0 27 7 0 0 0 194 64 1 0 1 37 12 0 0 0
Total 2062 365 1 1 0 405 156 4 3 1 4093 395 2 1 1 469 148 8(2) 8 0CH NS NS NS NS NS NS NS NS NS NS NS NS NS NS NS NS NS NS NS NS
*FR: The total number of Breeder Geese holdings reported is from 2011 (as this information w as unavailable for 2012).
Positive Holdings
Fattening Geese Breeder Geese
2011
1The two H5 seropositive Breeder Geese holdings in BE were PCR positive for influenza A virus; one was also VI positive for influenza A.
Member State
Total No.of
Holdings Sampled
Positive Holdings Total No.
of Holdings
Total No.of
Holdings Sampled
2011 notes
Positive Holdings Total No.
of Holdings
Total No.of
Holdings Sampled
Positive Holdings
2012
Total No. of
Holdings
Total No.of
Holdings Sampled
Total No. of
Holdings
Fattening Geese Breeder Geese

87
Annex 1 Table 7 Total number of Backyard Flock holdings reported (from regions where sampling took place), total number sampled, and total number of positive holdings reported for 2012 and 2011 by Member State
Virological data is displayed in italics in parentheses. (If a holding was virologically positive for H5/H7 only, further information is provided at the base of the table. Information is also provided on virological data other than H5/H7).
NS = Not sampled
2012 2011
Positive Holdings
Positive Holdings
Member State
Total No. of
Holdings
Total No.of
Holdings Sampled Total H5 H7
Total No. of
Holdings
Total No.of
Holdings Sampled Total H5 H7
AT NS NS NS NS NS NS NS NS NS NS
BE NS NS NS NS NS NS NS NS NS NS
BG 405,006 1595 0 0 0 566,369 990 0 0 0
CY 8530 14 0 0 0 8530 18 0 0 0
CZ NS NS NS NS NS NS NS NS NS NS
DE 47,608 18 0 0 0 64,886 29 0 0 0
DK NS NS NS NS NS NS NS NS NS NS
EE NS NS NS NS NS NS NS NS NS NS
EL NS NS NS NS NS NS NS NS NS NS
ES 12,399 64 0 0 0 15,399 301 0 0 0
FI NS NS NS NS NS NS NS NS NS NS
FR 3000 41 0 0 0 3000 49 0 0 0
HU 246,626* 485 0 0 0 351,499 500 0 0 0
IE NS NS NS NS NS NS NS NS NS NS
IT 143,445 2038 2(1) 1(1)1 1 143,286 1629 8 2 6
LT NS NS NS NS NS 4 4 0 0 0
LU 500 7 0 0 0 600 8 0 0 0
LV 2782 167 0 0 0 2461 171 0 0 0
MT NS NS NS NS NS NS NS NS NS NS
NL NS NS NS NS NS NS NS NS NS NS
PL NS NS NS NS NS NS NS NS NS NS
PT 236,735 66 0 0 0 236,735 387 0 0 0
RO 737 1106 0 0 0 1534 1152 1(1)2 0 0
SE NS NS NS NS NS NS NS NS NS NS
SI 4155 90 0 0 0 19,422 59 0 0 0
SK NS NS NS NS NS NS NS NS NS NS
UK NS NS NS NS NS NS NS NS NS NS
Total 1,111,523 5691 2(1) 1(1) 1 1,413,725 5297 9(1) 2 6
CH NS NS NS NS NS NS NS NS NS NS
*HU: The total number of Backyard Flock holdings reported is an estimate.
2012 notes 1One holding PCR positive for H5 (serology/VI not performed).
2011 notes 2One holding PCR positive for influenza A virus (serology/VI negative).

88
Annex 1 Table 8 Total number of Game Bird holdings reported (from regions where sampling took place), total number sampled, and total number of positive holdings reported for 2012 and 2011 by Member State
NS = Not sampled
2012 2011
Positive Holdings Positive Holdings
Member State
Total No. of
Holdings
Total No.of
Holdings Sampled Total H5 H7
Total No. of
Holdings
Total No.of
Holdings Sampled Total H5 H7
AT NS NS NS NS NS NS NS NS NS NS
BE 22 18 0 0 0 18 22 0 0 0
BG 5 4 0 0 0 NS NS NS NS NS
CY 9 10 0 0 0 6 9 0 0 0
CZ 42 42 0 0 0 53 53 0 0 0
DE 26 8 0 0 0 NS NS NS NS NS
DK 210 258 0 0 0 213 256 0 0 0
EE 1 1 0 0 0 1 1 0 0 0
EL 10 9 0 0 0 9 6 0 0 0
ES 547 448 0 0 0 522 389 0 0 0
FI 10 5 0 0 0 12 8 0 0 0
FR 3500 144 0 0 0 4000 145 1 1 0
HU 50 21 0 0 0 38 34 0 0 0
IE NS NS NS NS NS NS NS NS NS NS
IT 455 437 0 0 0 469 478 0 0 0
LT NS NS NS NS NS NS NS NS NS NS
LU NS NS NS NS NS NS NS NS NS NS
LV NS NS NS NS NS NS NS NS NS NS
MT NS NS NS NS NS NS NS NS NS NS
NL NS NS NS NS NS NS NS NS NS NS
PL 49 36 0 0 0 56 34 0 0 0
PT 77 55 0 0 0 111 65 0 0 0
RO 18 24 0 0 0 14 18 0 0 0
SE 25 23 0 0 0 24 24 2 2 0
SI 6 6 0 0 0 6 6 0 0 0
SK 18 16 0 0 0 35 25 0 0 0
UK 627 71 11 1 1 857 53 0 0 0
Total 5707 1636 1 1 1 6444 1626 3 3 0
CH NS NS NS NS NS NS NS NS NS NS
2012 notes 1One holding was seropositive for both H5 and H7 and so is only counted once in the total positives column for the UK.

89
Annex 1 Table 9 Total number of Ratite holdings reported (from regions where sampling took place), total number sampled, and total number of positive holdings reported for 2012 and 2011 by Member State
NS = Not sampled
2012 2011
Positive Holdings Positive Holdings
Member State
Total No. of
Holdings
Total No.of
Holdings Sampled Total H5 H7
Total No. of
Holdings
Total No.of
Holdings Sampled Total H5 H7
AT 10 9 0 0 0 4 1 0 0 0
BE NS NS NS NS NS NS NS NS NS NS
BG NS NS NS NS NS NS NS NS NS NS
CY NS NS NS NS NS 1 1 0 0 0
CZ NS NS NS NS NS NS NS NS NS NS
DE 286 8 0 0 0 NS NS NS NS NS
DK NS NS NS NS NS NS NS NS NS NS
EE NS NS NS NS NS NS NS NS NS NS
EL 5 3 0 0 0 2 2 0 0 0
ES 101 43 0 0 0 69 33 0 0 0
FI 2 2 0 0 0 2 2 0 0 0
FR 20* 4 0 0 0 20 3 0 0 0
HU 3 2 0 0 0 3 3 0 0 0
IE NS NS NS NS NS NS NS NS NS NS
IT 78 59 0 0 0 151 72 0 0 0
LT NS NS NS NS NS NS NS NS NS NS
LU 1 4 0 0 0 1 4 0 0 0
LV NS NS NS NS NS NS NS NS NS NS
MT NS NS NS NS NS NS NS NS NS NS
NL NS NS NS NS NS NS NS NS NS NS
PL 91 40 0 0 0 124 48 0 0 0
PT 3 3 0 0 0 4 4 0 0 0
RO 1 2 0 0 0 2 2 0 0 0
SE 3 4 0 0 0 5 5 0 0 0
SI 2 2 0 0 0 7 7 0 0 0
SK 10 7 0 0 0 17 10 0 0 0
UK NS NS NS NS NS NS NS NS NS NS
Total 616 192 0 0 0 412 197 0 0 0
CH NS NS NS NS NS NS NS NS NS NS
*FR: The total number of Ratite holdings reported is from 2011 (as this information was unavailable for 2012).

90
Annex 1 Table 10 Total number of Other holdings reported (from regions where sampling took place), total number sampled, and total number of positive holdings reported for 2012 and 2011 by Member State
Virological data is displayed in italics in parentheses. (If a holding was virologically positive for H5/H7 only, further information is provided at the base of the table. Information is also provided on virological data other than H5/H7). NS = Not sampled.
For information on the type of holdings included under Others, please see Table 15.
2012 2011
Positive Holdings Positive Holdings
Total No. of
Holdings
Total No.of
Holdings Sampled Total H5 H7
Total No. of
Holdings
Total No.of
Holdings Sampled Total H5 H7
AT NS NS NS NS NS NS NS NS NS NS
BE 2 1 0 0 0 NS NS NS NS NS
BG 1 1 0 0 0 6 1 0 0 0 CY NS NS NS NS NS NS NS NS NS NS CZ NS NS NS NS NS NS NS NS NS NS DE 62930 102 0 0 0 60,561 138 0 0 0 DK NS NS NS NS NS NS NS NS NS NS EE NS NS NS NS NS NS NS NS NS NS
EL 111 56 0 0 0 111 56 2(1)2 1 0 ES 7000 151 0 0 0 2859 457 0 0 0 FI NS NS NS NS NS NS NS NS NS NS FR NS NS NS NS NS NS NS NS NS NS HU NS NS NS NS NS NS NS NS NS NS IE NS NS NS NS NS NS NS NS NS NS
IT 1917* 1665 1(1) 1(1)1 0 1877 1437 6(3) 2(2)3 5(1)4
LT NS NS NS NS NS 1 1 0 0 0
LU NS NS NS NS NS 3 1 0 0 0
LV NS NS NS NS NS NS NS NS NS NS MT NS NS NS NS NS NS NS NS NS NS NL NS NS NS NS NS NS NS NS NS NS PL NS NS NS NS NS NS NS NS NS NS PT 4 1 0 0 0 122 73 0 0 0 RO NS NS NS NS NS NS NS NS NS NS SE NS NS NS NS NS NS NS NS NS NS SI NS NS NS NS NS NS NS NS NS NS SK NS NS NS NS NS NS NS NS NS NS UK NS NS NS NS NS NS NS NS NS NS
Total 71,965 1977 1(1) 1(1) 0 65,540 2164 8(4) 3(2) 5(1) CH NS NS NS NS NS NS NS NS NS NS
*IT: The total number of holdings in NUTS code region ITF6 was not known and so could not be included in the total number of holdings reported.
2012 notes 1One holding PCR/VI positive for H5 (serology not performed).
2011 notes 2One holding PCR positive for influenza A virus (serology not performed/VI negative). 3Includes one holding PCR positive for H5 (serology negative/VI not performed). This holding was also seropositive for H7, and so has only been counted once in the total positives column for IT. 4Includes one holding PCR positive for H7 (serology/VI not performed).

91
7.1.2 Annex 2 Additional information on results of the 2012 poultry survey Annex 2 Table 1 Prevalence of holdings positive for subtype H5
Member State Poultry category
Total holdings reported
(from regions where
sampling took place)
Total holdings sampled
Number of H5
serological positive holdings
Number of PCR /
virus isolation
H5 positive holdings Comments
BE Fattening Ducks 20 25 2
CZ Breeder Geese 7 7 1
DK Free-range
Laying Hens 106 259 1
Conventional Laying Hens 452 49 1
FI Fattening Geese 1 1 1
Fattening Ducks 4300 168 5
Breeder Ducks 250 85 14 FR Breeder Geese 133* 15 2
Conventional Laying Hens 1379 2119 3
Free-range Laying Hens 230 311 1
Fattening Ducks 160 199 1
One holding PCR positive for H5 (serology/VI not performed).
Backyard Flocks 143,445 2038 1
One holding PCR positive for H5 (serology/VI not performed).
IT Others 1917** 1665 1
One holding PCR/VI positive for H5 (serology not performed).
NL Fattening Turkeys 46 180 1 1
One holding serologically and PCR positive for H5.
Breeder Ducks 158 49 7
UK Game Birds 627 71 1
One holding seropositive for both H5 and H7.
Total 153,231 7241 40 4 *FR: The total number of Breeder Geese holdings reported is from 2011 (as this information was unavailable for 2012).
**IT: The total number of holdings in NUTS code region ITF6 was not known and so could not be included in the total number of holdings reported.

92
Annex 2 Table 2 Prevalence of holdings positive for subtype H7
Member State Poultry category
Total holdings reported
(from regions where
sampling took place)
Total holdings sampled
Number of H7
serological positive holdings
Number of PCR /
virus isolation
H7 positive holdings Comments
IT Backyard Flocks 143,445 2038 1
NL Free-range
Laying Hens 274 1662 1 1
One holding serologically and PCR positive for H7.
PL Breeder Geese 170 83 1
UK Game Birds 627 71 1
One holding seropositive for both H5 and H7.
Total 144,516 3854 4 1

93
Annex 2 Table 3 Number of holdings positive for subtype H5 by serology, serology and PCR/virus isolation, or PCR/virus isolation only
Member State
Poultry category
Number serologically
positive only,
PCR/virus isolation
negative or not
performed
Number serologically positive and PCR/virus isolation positive
Number PCR/ virus isolation positive, serology
negative or not
performed
BE Fattening
Ducks 2
CZ Breeder Geese 1
DK Free-range
Laying Hens 1 Conventional Laying Hens 1
FI Fattening
Geese 1 Fattening
Ducks 5 Breeder Ducks 14
FR Breeder Geese 2
Conventional Laying Hens 3 Free-range
Laying Hens 1
Fattening Ducks 1
Backyard Flocks 1
IT Others 1
NL Fattening Turkeys 1 Breeder Ducks 7
UK Game Birds 11
EU Total 39 1 3 1One holding seropositive for both H5 and H7.

94
Annex 2 Table 4 Number of holdings positive for subtype H7 by serology, serology and PCR/virus isolation, or PCR/virus isolation only
Member State
Poultry category
Number serologically
positive only,
PCR/virus isolation
negative or not
performed
Number serologically positive and PCR/virus isolation positive
Number PCR/ virus isolation positive, serology
negative or not
performed
IT Backyard
Flocks 1
NL Free-range
Laying Hens 1
PL Breeder Geese 1
UK Game Birds 11 EU
Total 3 1 0 1One holding seropositive for both H5 and H7.

95
7.2 Wild Bird Survey
7.2.1 Annex 3 Passive surveillance data
This section reports the samples collected through passive surveillance activities and the associated test results. The 2007 guidelines (EC, 2007) recommend oro-pharyngeal (tracheal) and cloacal swabs to be collected from healthy free living birds and cloacal and oro-pharyngeal swabs and/ or tissues from dead or shot birds. Similarly, the 2010 guidelines (EC 2010a) recommend that cloacal and tracheal/oro-pharyngeal swabs and/or tissues from wild birds found dead or moribund should be sampled. The totals for the 2012 passive surveillance testing regimes are shown below.
Annex 3 Table 1 Type of samples collected for wild birds sampled by passive surveillance in 2012, by status of bird - EU-data only
Found dead Injured Live with clinical signsBlood 1 - 4 5Cloacal 1264 100 15 1379Faeces 345 - - 345Other 270 - - 270Tissue 2139 1 4 2144Tracheal 838 - 13 851Cloacal and Tissue 5 - - 5Cloacal and Tracheal 1093 45 305 1443Faeces and Tissue 30 1 8 39Tissue and Other 1 - - 1Tracheal and Tissue 4 - - 4Cloacal, Tracheal and Blood 1 - - 1Cloacal, Tracheal and Tissue 17 - - 17Total 6008 147 349 6504
Sample type Status of bird Passive surveillance total
The most commonly submitted sample type for birds found dead was tissue (36%). Cloacal swabs (21%) and birds with both cloacal and oro-pharyngeal (tracheal) swab submissions (18%) were also tested in large numbers for dead birds. For injured birds, the majority of samples collected were cloacal swabs (68%) or both cloacal and tracheal swabs (31%), whilst for live birds with clinical signs, the most common sample type was for birds where both cloacal and tracheal samples were submitted (87%).
During 2012, three birds tested positive for LPAI H5 in Hungary and LPAI H7 was not detected. In addition, 42 birds tested positive for LPAI of subtypes other than H5 or H7, and 19 birds tested positive for AI, where the pathotype was not specified.
Table 2 shows the test results for birds that were positive for AI virus (all subtypes). In 2012, only birds found dead tested positive for AI; no AI virus was detected in birds that were live with clinical signs or injured. For all sample types, a high proportion of those tested by both PCR and virus isolation were PCR positive only and VI negative.
Of the nine AI positive birds that had oro-pharyngeal (tracheal) and cloacal swabs tested, four tested positive on the cloacal swab only. All of the three birds testing positive for AI with faecal and tissue samples tested positive on the faecal samples only.
7.2.1.1 Diagnosis
7.2.1.2 AI Positives by passive surveillance

96
Annex 3 Table 2 Test-results and samples taken by passive surveillance for found dead birds - EU-data only.
Where more than one sample has been taken per bird parenthesis indicate the number assigned to each sample and therefore where the data for that sample is displayed (Sample 1 or 2).
PCR+VI+
PCR+VI-
PCR+VI NP
PCR+VI-
PCR+VI NP
PCR-VI NP
Cloacal 1264 10 0 0 10 - - -Tissue 2139 39 2 30 7 - - -Tracheal 838 3 0 3 0 - - -Cloacal (1) Tracheal (2)
1093 9 0 4 5 1 4 4
Faeces (1) Tissue (2)
30 3 0 1 2 0 0 3
Total sampled
Total positive
Sample typeTest 2Test 1
NP: not performed.
Table 3 displays the number of birds sampled in 2012, by passive surveillance in each bird status category (found dead, injured and live with clinical signs).
Annex 3 Table 3 Number of birds tested through passive surveillance by Member State (injured, diseased and dead birds) – Non-MS data included
Found dead
Injured Live with clinical signs
Found dead
Injured Live with clinical signs
Found dead
Injured Live with clinical signs
Found dead
Injured Live with clinical signs
AT 27 0 0 26 0 0 23 0 0 13 0 0BE 127 0 0 78 0 0 137 0 0 23 0 0BG 1 0 0 2 0 0 2 0 0 0 0 0CY 11 14 2 4 13 1 14 25 6 29 36 3CZ 16 0 0 32 0 0 41 0 0 13 0 0DE 361 0 0 285 0 3 316 0 7 280 0 4DK 8 0 0 1 0 0 5 0 0 4 0 0EE 2 0 0 0 0 0 1 0 0 13 0 0EL 5 0 0 2 0 2 1 0 1 0 0 0ES 117 0 46 62 3 109 69 17 88 332 17 28FI 42 0 0 23 0 0 32 0 0 16 0 0FR 21 0 0 3 0 0 11 0 0 14 0 0HU 74 0 0 61 0 0 143 0 0 1235 0 0IE 1 0 1 13 0 7 7 0 0 5 1 0IT 180 0 1 158 0 1 166 0 5 182 0 0LT 2 0 0 0 0 0 4 0 0 0 0 0NL 99 0 0 37 0 0 16 0 0 13 0 0PL 2 0 0 11 0 0 6 0 0 1 0 0PT 5 0 0 1 0 0 9 0 0 2 0 0RO 102 0 0 36 1 0 37 0 0 60 0 0SE 0 0 0 0 0 0 72 0 0 31 0 0SI 32 0 0 13 0 2 19 0 10 12 20 21SK 7 0 0 2 0 0 4 0 1 5 0 0UK 150 0 0 149 0 0 106 0 0 93 0 0
EU Total 1392 14 50 999 17 125 1244 42 118 2377 74 56CH 0 0 0 0 0 0 3 0 0 1 0 0
MemberState
Quarter 4Quarter 3Quarter 2Quarter 1
Latvia, Luxembourg and Malta did not carry out any passive surveillance in 2012.
Table 4 displays the number of target species (TS) and non-target species (non-TS) sampled by MS in each quarter.
7.2.1.3 Passive surveillance by quarter

97
Annex 3 Table 4 Number of TS sampled by passive surveillance in each quarter by Member State – Non-MS data included
TS Non-TS TS Non-TS TS Non-TS TS Non-TSAT 20 4 20 6 6 15 12 1BE 96 31 36 42 45 92 8 15BG 1 0 0 2 0 2 0 0CY 13 13 6 11 13 32 43 24CZ 4 12 17 15 39 2 9 4DE 160 59 114 108 110 126 92 48DK 2 6 1 0 4 1 4 0EE 0 2 0 0 0 1 0 13EL 75 70 70 75 67 68 65 28ES 12 30 9 14 11 21 5 11FI 9 12 3 0 9 2 4 10FR 121 26 70 67 57 34 50 25HU 5 0 2 2 0 2 0 0IE 35 39 11 49 26 117 529 706IT 1 1 2 18 6 1 6 0LT 62 98 31 117 83 71 45 121NL 2 0 0 0 4 0 0 0PL 40 59 26 11 6 10 2 11PT 2 0 6 5 4 0 1 0RO 5 0 0 1 4 0 0 2SE 69 31 16 21 14 22 30 29SI 0 0 0 0 25 47 12 19SK 30 2 12 3 17 10 29 24UK 5 2 2 0 2 3 0 5
EU Total 769 497 454 567 552 679 946 1096CH 0 0 0 0 2 1 1 0
Quarter 4Quarter 3Quarter 2Quarter 1MemberState
The aim of these tables is to provide context of AI detections taking into account bird species and the number of birds sampled by MS.
Key to tables
LPAI H5 No AI detected
LPAI H7 Not sampled
All AI patho/subtypes
Not presenting actual data, for illustrative purposes only.
7.2.1.4 Overview of passive surveillance results by species

98
Annex 3 Table 5 Detections of LPAI H5 (in brackets) that were reported by passive surveillance in TS (in bold) and non-TS and the number of those species sampled in each Member State – Non-MS data included
SPECIES AT BE CY CZ DE ES FI FR HU IE IT NL PL PT RO SI SK UK EU
Anas platyrhynchos 11 21 12 41 89 28 1 9 439 (2)
5 58 24 1 3 10 5 2 26 785(2)
Nycticorax nycticorax 1 1 (1)
2(1)
Target species indicated with bold text. LPAI H7 was not detected in 2012.

99
Annex 3 Table 6 Detections of all AI types (in brackets) reported by passive surveillance in TS (in bold) and non-TS and the number of those species sampled in each Member State - Non-MS data included
SPECIES AT BE BG CY CZ DE DK EL ES FI FR HU IE IT LT NL PL PT RO SE SI SK UK EU CH
Accipiter nisus 20(9)
6 18 1 11 2 4 8 3 3 3 79(9)
Anas clypeata 4 2(1)
6 (1)
Anas crecca 10 3 2(1)
1(1)
11 4 31(2)
Anas platyrhynchos 11(1)
21(2)
12 41(1)
89 28 1 9 439(6)
5(2)
58(1)
24 1 3 10 5(1)
2 26 785(14)
Anas sp. 77(2)
20 1 1 1 10 110 (2)
Ardea cinerea 1 28(5)
17 10 3 14 7 4 2 86(5)
Circus aeruginosus 8 3(1)
3 1 1 3 4 1 24(1)
Cygnus olor 23 11 1 22 41(1)
3 3 13 5 4 4 2 11 5 1 9 2 42(1)
128(1)
330(3)
3
Cygnus sp. 11 78(1)
1 7 1 7 25 130(1)
Gallinago gallinago 4 1(1)
1 6(1)
Gallinula chloropus 8(1)
2 1 2 1 7 1 1 5 28 (1)
Haematopus ostralegus 2 3(2)
1 1 7(2)
Larus argentatus 117(6)
4 2 39 24 2 19 207(6)
Larus argentatus cachinnans 17(1)
1 1 6(2)
4 4 33(3)
Larus canus 8(1)
2 7 5 22(1)
Larus fuscus 35(3)
1 2 8 46(3)
Larus marinus 1 8(1)
9(1)
Larus ridibundus 5 25 (2)
5 1 22 5 7 25(1)
8 6 2 15 126(3)
Nycticorax nycticorax 1 1(1)
2(1)
Parus sp. 4(4)
1 5(4)
Target species indicated with bold text.

100
7.2.2 Annex 4 Reported active surveillance data
During 2012, there was no mandatory requirement for MS to carry out or submit AI surveillance data collected through active surveillance programmes (sampling healthy live or hunted birds). A total of 16 MS voluntarily submitted active surveillance data in 2012, the results of which are presented in the current Annex 4 (section 7.2.2). Additional tables and figures presenting diagnostic results and species data are presented in Annex 5 (section 7.2.3). The data presented in this section of the report may not accurately represent the active surveillance effort carried out across the EU as a whole. The submission of active surveillance data to the European Commission was voluntary in 2012, and other activities may have been carried out but not reported by MS.
In total of 14,040 birds were sampled by active surveillance. The Netherlands submitted the largest number of birds tested by active surveillance in 2012 (n=6,883), followed by Belgium (n=3345), Figure 1. In 2012 the Netherlands and Belgium accounted for over two thirds of the total active surveillance data submitted.
Annex 4 Figure 1 Total number of birds sampled by reported active surveillance in 2012 by EU Member State
7.2.2.1 Overview of reported active surveillance
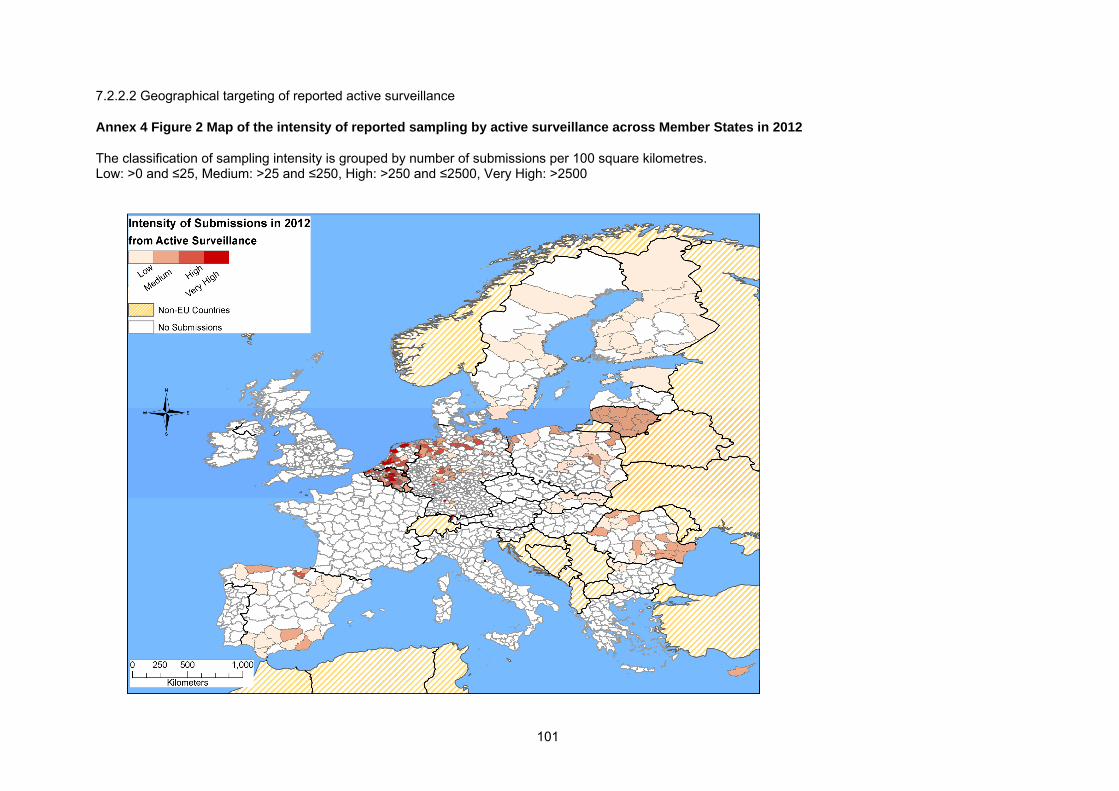
101
Annex 4 Figure 2 Map of the intensity of reported sampling by active surveillance across Member States in 2012
The classification of sampling intensity is grouped by number of submissions per 100 square kilometres. Low: >0 and ≤25, Medium: >25 and ≤250, High: >250 and ≤2500, Very High: >2500
7.2.2.2 Geographical targeting of reported active surveillance

102
Figure 3 displays the percentage of birds sampled by MSs in each quarter, when considering active surveillance data. For the EU overall (16 submitting MSs), sampling was very evenly spread across the four quarters. For individual MSs, the temporal targeting varied. Some MS carried out all or most of their sampling in the summer (Bulgaria and Malta), whilst others carried out the majority of their sampling in the winter months (Poland and Slovakia). Austria, the Netherlands and Spain all had fairly evenly distributed surveillance programmes throughout the year.
Annex 4 Figure 3 Proportion of all birds sampled by reported active surveillance in 2012, by quarter and Member States
Raw numbers of birds sampled by quarter and MS are shown in the table below.
7.2.2.3 Seasonal targeting of reported active surveillance
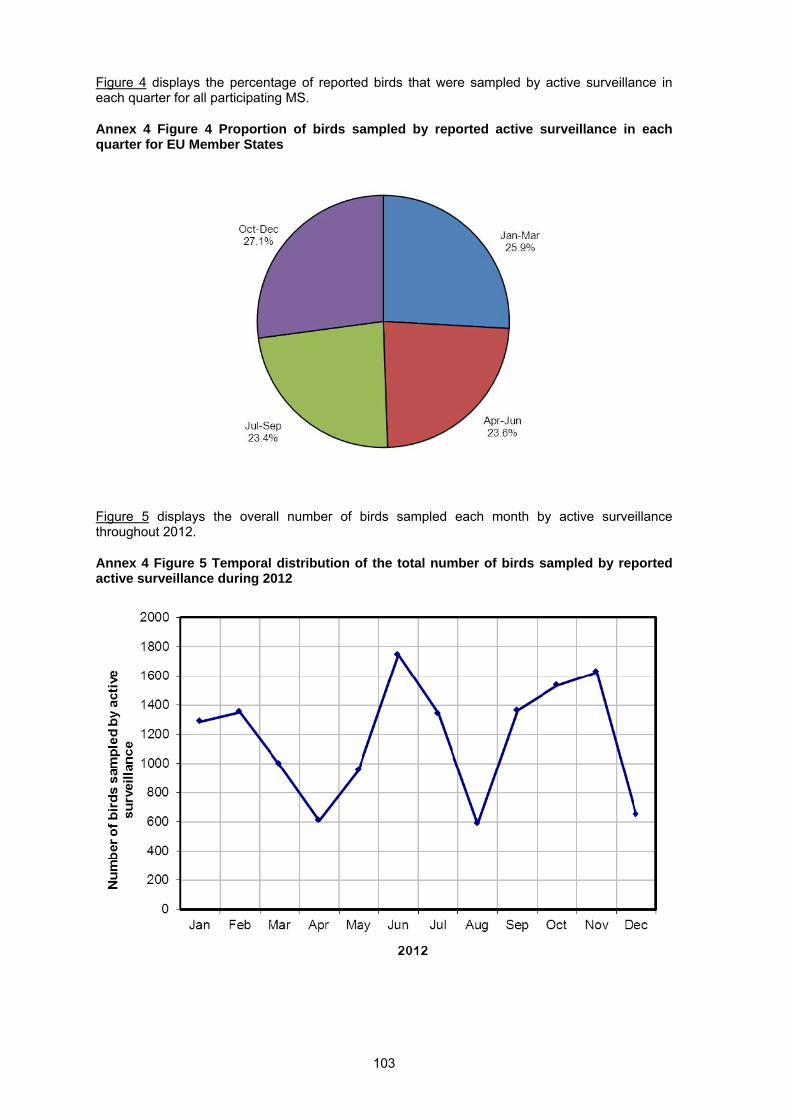
103
Figure 4 displays the percentage of reported birds that were sampled by active surveillance in each quarter for all participating MS.
Annex 4 Figure 4 Proportion of birds sampled by reported active surveillance in each quarter for EU Member States
Figure 5 displays the overall number of birds sampled each month by active surveillance throughout 2012.
Annex 4 Figure 5 Temporal distribution of the total number of birds sampled by reported active surveillance during 2012
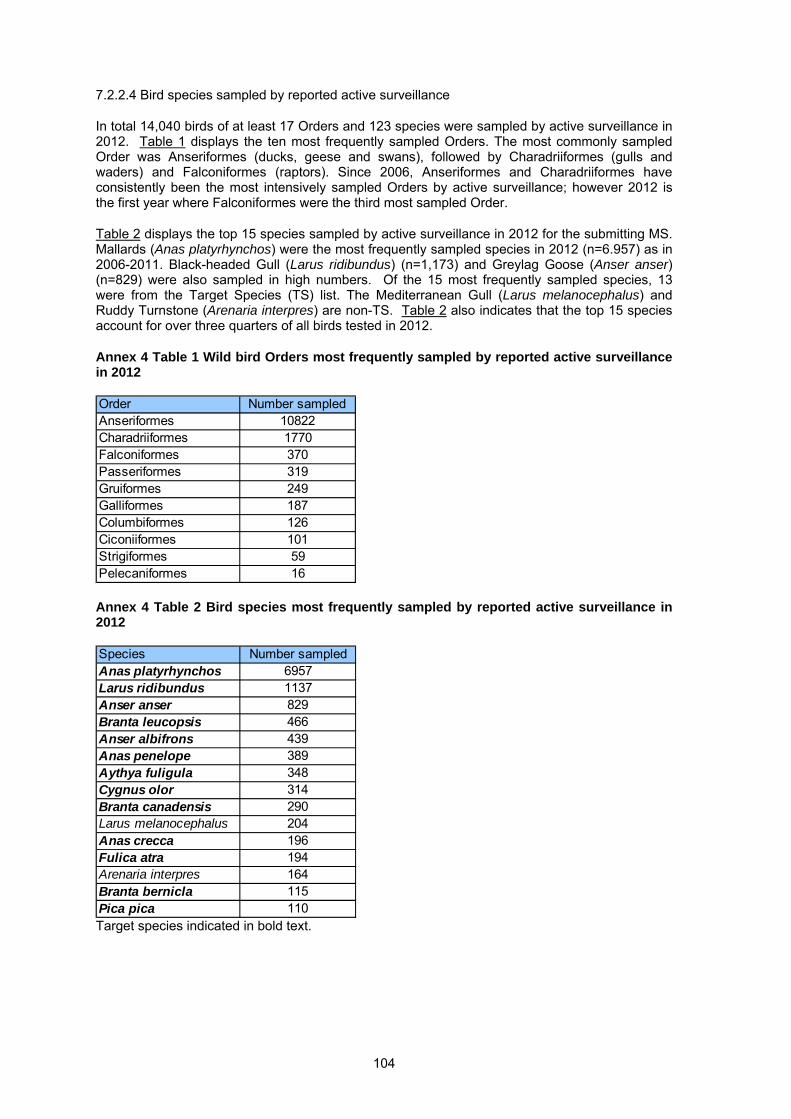
104
In total 14,040 birds of at least 17 Orders and 123 species were sampled by active surveillance in 2012. Table 1 displays the ten most frequently sampled Orders. The most commonly sampled Order was Anseriformes (ducks, geese and swans), followed by Charadriiformes (gulls and waders) and Falconiformes (raptors). Since 2006, Anseriformes and Charadriiformes have consistently been the most intensively sampled Orders by active surveillance; however 2012 is the first year where Falconiformes were the third most sampled Order.
Table 2 displays the top 15 species sampled by active surveillance in 2012 for the submitting MS. Mallards (Anas platyrhynchos) were the most frequently sampled species in 2012 (n=6.957) as in 2006-2011. Black-headed Gull (Larus ridibundus) (n=1,173) and Greylag Goose (Anser anser) (n=829) were also sampled in high numbers. Of the 15 most frequently sampled species, 13 were from the Target Species (TS) list. The Mediterranean Gull (Larus melanocephalus) and Ruddy Turnstone (Arenaria interpres) are non-TS. Table 2 also indicates that the top 15 species account for over three quarters of all birds tested in 2012.
Annex 4 Table 1 Wild bird Orders most frequently sampled by reported active surveillance in 2012
Order Number sampledAnseriformes 10822Charadriiformes 1770Falconiformes 370Passeriformes 319Gruiformes 249Galliformes 187Columbiformes 126Ciconiiformes 101Strigiformes 59Pelecaniformes 16
Annex 4 Table 2 Bird species most frequently sampled by reported active surveillance in 2012
Species Number sampledAnas platyrhynchos 6957Larus ridibundus 1137Anser anser 829Branta leucopsis 466Anser albifrons 439Anas penelope 389Aythya fuligula 348Cygnus olor 314Branta canadensis 290Larus melanocephalus 204Anas crecca 196Fulica atra 194Arenaria interpres 164Branta bernicla 115Pica pica 110 Target species indicated in bold text.
7.2.2.4 Bird species sampled by reported active surveillance

105
Figure 6 displays the proportion of birds target species that were sampled by active surveillance by each MS submitting data in 2012. The large majority of non-target species were sampled in very low numbers (87% of all birds sampled were Target Species).
Annex 4 Figure 6 Proportion of TS and non-TS sampled by reported active surveillance in 2012, by Member State
Raw numbers of birds sampled in each category are shown in the table below. Figure 6 includes birds identified at species level only (figure excludes birds identified to the genus or family level).
When considering the EU data combined, 92% of birds reported for active surveillance and identified to species level in 2012 were from the target species list.
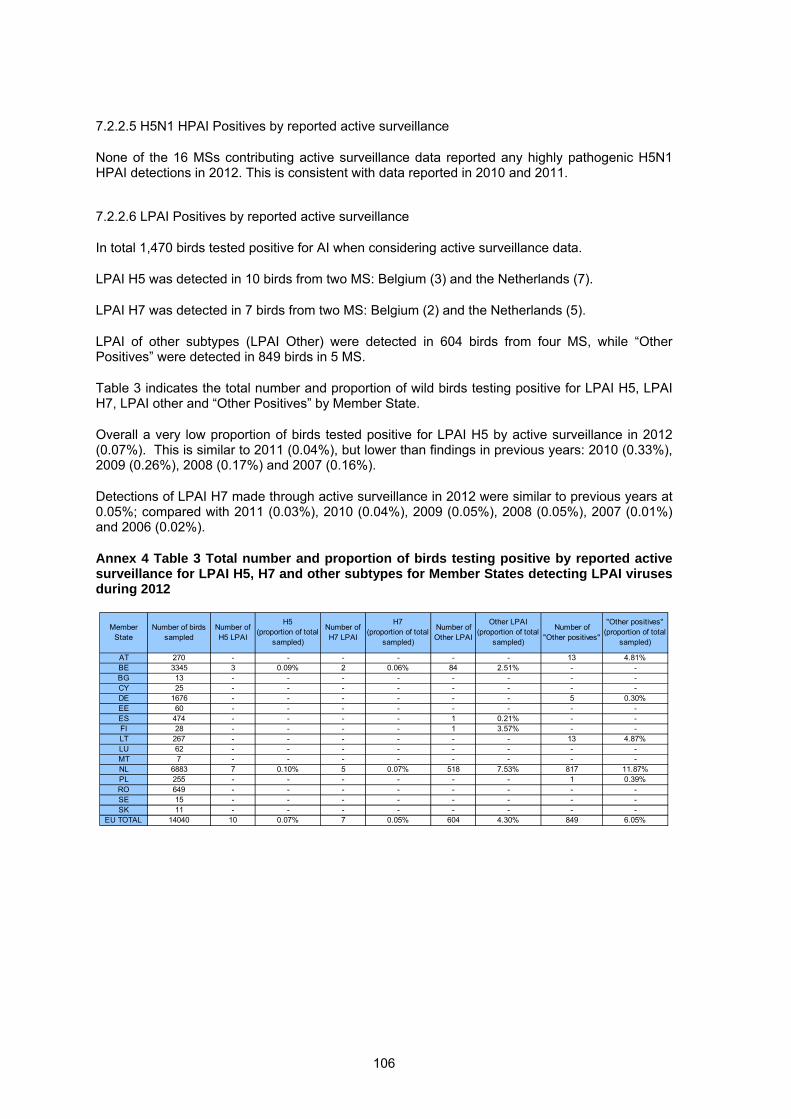
106
None of the 16 MSs contributing active surveillance data reported any highly pathogenic H5N1 HPAI detections in 2012. This is consistent with data reported in 2010 and 2011.
In total 1,470 birds tested positive for AI when considering active surveillance data.
LPAI H5 was detected in 10 birds from two MS: Belgium (3) and the Netherlands (7).
LPAI H7 was detected in 7 birds from two MS: Belgium (2) and the Netherlands (5).
LPAI of other subtypes (LPAI Other) were detected in 604 birds from four MS, while “Other Positives” were detected in 849 birds in 5 MS.
Table 3 indicates the total number and proportion of wild birds testing positive for LPAI H5, LPAI H7, LPAI other and “Other Positives” by Member State.
Overall a very low proportion of birds tested positive for LPAI H5 by active surveillance in 2012 (0.07%). This is similar to 2011 (0.04%), but lower than findings in previous years: 2010 (0.33%), 2009 (0.26%), 2008 (0.17%) and 2007 (0.16%).
Detections of LPAI H7 made through active surveillance in 2012 were similar to previous years at 0.05%; compared with 2011 (0.03%), 2010 (0.04%), 2009 (0.05%), 2008 (0.05%), 2007 (0.01%) and 2006 (0.02%).
Annex 4 Table 3 Total number and proportion of birds testing positive by reported active surveillance for LPAI H5, H7 and other subtypes for Member States detecting LPAI viruses during 2012
Member State
Number of birds sampled
Number of H5 LPAI
H5 (proportion of total
sampled)
Number of H7 LPAI
H7 (proportion of total
sampled)
Number of Other LPAI
Other LPAI(proportion of total
sampled)
Number of "Other positives"
"Other positives" (proportion of total
sampled)
AT 270 - - - - - - 13 4.81%BE 3345 3 0.09% 2 0.06% 84 2.51% - -BG 13 - - - - - - - -CY 25 - - - - - - - -DE 1676 - - - - - - 5 0.30%EE 60 - - - - - - - -ES 474 - - - - 1 0.21% - -FI 28 - - - - 1 3.57% - -LT 267 - - - - - - 13 4.87%LU 62 - - - - - - - -MT 7 - - - - - - - -NL 6883 7 0.10% 5 0.07% 518 7.53% 817 11.87%PL 255 - - - - - - 1 0.39%RO 649 - - - - - - - -SE 15 - - - - - - - -SK 11 - - - - - - - -
EU TOTAL 14040 10 0.07% 7 0.05% 604 4.30% 849 6.05%
7.2.2.5 H5N1 HPAI Positives by reported active surveillance
7.2.2.6 LPAI Positives by reported active surveillance

107
Figure 7 and Figure 8 present the geographical distribution of LPAI H5 and H7 positives, respectively. The classification of sampling intensity is grouped by number of submissions per 100 square kilometres - Low: >0 and ≤25, Medium: >25 and ≤250, High: >250 and ≤2500, Very High: >2500.
Annex 4 Figure 7 Intensity of sample submission from reported active surveillance, and distribution of LPAI H5 detections in wild birds in EU Member States in 2012
Annex 4 Figure 8 Intensity of sample submission from reported active surveillance, and distribution of LPAI H7 detections in wild birds in EU Member States in 2012
7.2.2.7 Geographical distribution of H5/H7 detections by reported active surveillance

108
Figure 9 displays the calendar week of LPAI H5 and H7 detections by MS. Figure 9 displays the number of LPAI H5/H7 detections and the number of birds sampled by week. In both Figure 9 and Figure 10 the first and last weeks are incomplete as 2012 did not begin on a Monday. Both the first and the last weeks are just one day long.
Annex 4 Figure 9 Number and week of detection of LPAI H5 (in red) and H7 (in green) positive birds detected through active surveillance reported in 2012, by EU Member State
Each week has been assigned to the month in which most days fell.
MS 1 2 3 4 5 6 7 8 10 11 12 13 14 15 16 17 18 19 20 21 22 23 24 25 26 27 28 29 30 31 32 33 34 35 36 39 40 41 42 43 44 45 46 47 48 49 50 51 52 53 54BE 1 1 1NL 1 1 1 1 1 1 2 1 1 1 1
Oct Nov Dec381
Feb Mar Apr May JunJan Jul Aug9 37
1
Sep
Annex 4 Figure 10 Number of LPAI H5 and H7 detections and the number of wild birds sampled by reported active surveillance in the EU by week in 2012
Each week has been assigned to the month in which most days fell.
7.2.2.8 Temporal distribution of LPAI H5/H7 detections by reported active surveillance

109
In 2012 both LPAI H5 and LPAI H7 were mainly detected in the autumn months, with three detections in the first few months of the year. In previous years a greater variation in the seasonality of H5 and H7 has been evident, with the majority of H5 LPAI detections appearing between September and December, and just a few detections in January and February, but a more variable pattern seen of LPAI H7 throughout the year.
All LPAI H5 and LPAI H7 detections were made in Anseriformes. “Other Positives”, were also detected in Charadriiformes, and Other LPAI positives were additionally detected in Gruiformes and Pelecaniformes, Table 4.
Annex 4 Table 4 LPAI detected through reported active surveillance, by Order in 2012
Order Total sampled
Positive for LPAI H5
Positive for LPAI H7
Other LPAI positives
"Other positives"Pathotype undetermined
Anseriformes 10822 10 7 317 707Charadriiformes 1770 0 0 284 142Gruiformes 249 0 0 2 0Pelecaniformes 16 0 0 1 0
Further details and tables regarding active surveillance sampling and results for target-species and other species by MS can be found in Annex 5 (section 7.2.3).
In 2012, all observations of LPAI H5 and H7 were made in Mallards (Anas platyrhynchos), Table 5. In total, at least 19 species tested positive for AI. Of these, 12 were Anseriformes, four were Charadriiformes, two were Gruiformes and one was from the order Pelecaniformes.
Annex 4 Table 5 LPAI detected through reported active surveillance, by species in 2012
SpeciesTotal
sampledPositive for
LPAI H5Positive for
LPAI H7Other LPAI positives
"Other positives" Pathotype undetermined
Anas clypeata 13 - - - 3Anas crecca 196 - - 6 17Anas penelope 389 - - 4 19Anas platyrhynchos 6957 10 7 249 626Anas strepera 92 - - - 5Anser albifrons 439 - - 35 23Anser anser 829 - - - 1Anser fabalis 53 - - 4 2Arenaria interpres 164 - - 4 -Aythya fuligula 348 - - 3 -Branta leucopsis 466 - - 13 10Cygnus olor 314 - - 3 -Cygnus sp. 13 - - - 1Fulica atra 194 - - 1 -Gallinula chloropus 32 - - 1 -Larus argentatus 33 - - 2 -Larus melanocephalus 204 - - 3 2Larus ridibundus 1137 - - 275 140Unknown 153 - - 1 -
7.2.2.9 Order and species of wild birds positive for LPAI H5/H7 by reported active surveillance

110
7.2.3 Annex 5 Reported active surveillance data, supplementary tables and figures
This section reports the samples collected and the associated test results. The 2007 guidelines (EC, 2007) recommend oro-pharyngeal (tracheal) and cloacal swabs to be collected from healthy free living birds and cloacal and oro-pharyngeal swabs and/ or tissues from dead or shot birds. Similarly, the 2010 guidelines (EC 2010a) recommend that cloacal and tracheal/oro-pharyngeal swabs and/or tissues from wild birds found dead or moribund should be sampled. The totals for the 2012 testing regimes for active surveillance are shown below.
Annex 5 Table 1 Number and proportion of wild bird samples collected by reported active surveillance, by Status of bird in 2012
Hunted without clinical signs
Hunted with clinical signs
Live without clinical signs
Cloacal 707 3 2879 3589Faeces 0 0 1041 1041Other 22 0 1753 1775Tissue 532 16 1 549Tracheal 396 6 577 979Cloacal and Tracheal 885 31 5190 6106Cloacal, Tracheal and Other 0 0 1 1Total 2542 56 11442 14040
Status of birdSample Type Active surveillance
total
The majority of healthy live caught birds were sampled either by cloacal and oral-pharyngeal (tracheal) swabs (45%), or cloacal swabs only (25%). For hunted birds 36% were both cloacal and oro-pharyngeal (tracheal) swabs, whilst 28% of the samples were cloacal only.
Table 2 shows the test results of samples collected from live healthy birds that were positive for all subtypes of AI. For all birds where a single sample type was collected, a high proportion of the samples tested by both PCR and virus isolation were PCR positive only and VI negative. Of the 707 positive live and healthy birds that had oro-pharyngeal (tracheal) and cloacal swabs collected, 43% tested positive on both the oro-pharyngeal (tracheal) and cloacal swab; whilst 29% tested positive on the oro-pharyngeal (tracheal) swab only, and 28% tested positive for the cloacal swab only.
Annex 5 Table 2 Test-results and samples taken for live healthy birds sampled by reported active surveillance in 2012
Where more than one sample has been taken per bird parenthesis indicate the number assigned to each sample and therefore where the data for that sample is displayed (Sample 1 or 2).
PCR+ VI+
PCR+ VI-
PCR+ VI NP
PCR- Test 2+
PCR+ VI+
PCR+ VI-
PCR+ VI NP
PCR- Test 1+
Cloacal 2879 21 0 11 6 4 - - - -Faecal 1041 1 0 1 0 0 - - - -Other 1753 483 118 187 178 0 - - - -Tracheal 577 35 0 29 6 0 - - - -Cloacal(1) Tracheal(2)
5190 707 10 103 386 208 2 96 413 196
Sample Type Total sampled
Total positive
Test 1 Test 2
Table 3 displays the test results for samples collected from hunted birds without clinical signs. As in 2011, no AI virus was detected in birds that were hunted with clinical signs.
In 2012, the majority of samples tested for both PCR and VI were positive by PCR and negative for VI (79%). Of the 145 positive hunted birds that had oro-pharyngeal (tracheal) and cloacal swabs collected, 26% only tested positive on the oro-pharyngeal swab, and 34% tested positive on the cloacal swab only.
7.2.3.1 Diagnosis
7.2.3.2 AI Positives by reported active surveillance

111
Annex 5 Table 3 Test-results and samples taken for hunted birds without clinical signs sampled by reported active surveillance in 2012
Where more than one sample has been taken per bird parenthesis indicate the number assigned to each sample and therefor where the data for that sample is displayed (Sample 1 or 2).
PCR+ VI+
PCR+ VI-
PCR+ VI NP
PCR- Test 2+
PCR+ VI+
PCR+ VI-
PCR+ VI NP
PCR- Test 1+
Cloacal 710 64 17 47 0 0 0 0 0 64Tissue 548 1 0 1 0 0 0 0 0 1Tracheal 402 13 0 0 13 0 0 0 0 13Cloacal(1) Tracheal(2)
916 145 2 18 88 37 0 7 88 50
Sample Type Total sampled
Total positive
Test 1 Test 2
Table 4 presents the number of live (without clinical signs) and hunted (with and without clinical signs) birds sampled through active surveillance in 2012, by MS and quarter. When considering the submitted data as a whole, most hunted birds were sampled in Quarter 4 (Oct-Dec) (n=1364), whilst most live birds were sampled in Quarter 2 (Apr-Jun) (n=3275).
Table 5 displays the number of target species and non-target species sampled by active surveillance in each quarter by MS.
Annex 5 Table 4 Number of birds (hunted and live healthy birds) tested through reported active surveillance by Member State and quarter
Hunted Live Hunted Live Hunted Live Hunted LiveSK 3 0 0 1 0 0 7 0FI 5 0 6 0 11 0 6 0CY 1 11 0 3 0 6 0 4EE 0 0 0 0 21 0 39 0LT 6 0 13 0 135 0 113 0MT 0 0 1 0 4 0 2 0ES 130 19 0 103 0 117 70 35BG 0 0 2 6 2 3 0 0BE 0 605 0 1113 428 272 147 780RO 68 0 10 12 39 63 274 183LU 0 0 0 62 0 0 0 0AT 0 81 0 66 0 66 0 57DE 56 450 1 313 20 193 290 353NL 178 1927 0 1566 89 1811 406 906PL 0 95 0 30 0 5 0 125SE 0 0 0 0 5 0 10 0
EU Total 447 3188 33 3275 754 2536 1364 2443
Quarter 4Quarter 3Quarter 2Quarter 1Member State
7.2.3.3 Reported active surveillance by quarter

112
Annex 5 Table 5 Number of TS and non-TS sampled by reported active surveillance in each quarter by Member State
TS non-TS TS non-TS TS non-TS TS non-TSAT 81 0 66 0 66 0 57 0BE 421 184 878 235 696 4 881 46BG 0 0 8 0 0 5 0 0CY 1 11 2 1 2 4 2 2DE 474 27 234 79 184 21 582 20EE 0 0 0 0 20 1 38 1ES 4 131 68 14 4 0 13 34FI 3 2 3 3 5 5 2 4LT 6 0 13 0 135 0 113 0LU 0 0 62 0 0 0 0 0MT 0 0 0 0 2 2 0 2NL 2078 27 1503 63 1872 28 1312 0PL 70 10 0 10 4 1 105 0RO 40 27 19 3 95 7 400 57SE 0 0 0 0 3 2 5 4SK 1 2 1 0 0 0 2 5
EU Total 3179 421 2857 408 3088 80 3512 175
Member State
Quarter 1 Quarter 2 Quarter 3 Quarter 4
Annex 5 Table 6 displays the detections of LPAI H5 reported in TS (in bold) and non-TS, and the number of those species sampled in each MS.
Annex 5 Table 7 displays the detections of LPAI H7 reported in TS (in bold) and non-TS, and the number of those species sampled in each MS.
Annex 5 Table 8 displays the detections of all AI types in TS (in bold text) and non-TS, and the number of those species sampled in each MS.
The aim of these tables is to provide context of AI detections taking into account bird species and the number of birds sampled by MS.
For a key to tables 6-8 please refer to Annex 3 (section 7.2.1.4).
7.2.3.4 Overview of reported active surveillance results by species

113
Annex 5 Table 6 Detections of LPAI H5 (in brackets) that were reported by active surveillance in TS (in bold) and non-TS, and the number of those species sampled in each Member State
SPECIES AT BE BG DE EE ES FI LT NL PL RO SE SK EU
Anas platyrhynchos 270 1457(3)
6 328 28 11 1 248 4348(7)
115 140 3 2 6957(10)
There were no detections of LPAI H5 by active surveillance in non-TS in 2012.
Annex 5 Table 7 Detections of LPAI H7 (in brackets) that were reported by active surveillance in TS (in bold) and non-TS, and the number of those species sampled in each Member State
SPECIES AT BE BG DE EE ES FI LT NL PL RO SE SK EU
Anas platyrhynchos 270 1457(2)
6 328 28 11 1 248 4348(5)
115 140 3 2 6957(7)
There were no detections of LPAI H7 by active surveillance in non-TS in 2012.

114
Annex 5 Table 8 Detections of all AI subtypes (in brackets) that were reported by active surveillance in TS (in bold) and non-TS, and the number of those species sampled in each Member State
SPECIES AT BE BG CY DE EE ES FI LT LU NL PL RO SE SK EU
Anas clypeata 2 2 9(3)
13(3)
Anas crecca 7(1)
31(1)
1 1 6 53(21)
97 196(23)
Anas penelope 1 1 3(1)
3 380(22)
1 389(23)
Anas platyrhynchos 270(13)
1457(74)
6 328(3)
28 11 1 248(13)
4348(788)
115(1)
140 3 2 6957(892)
Anas strepera 20 72(5)
92(5)
Anser albifrons 163 6 268(58)
2 439(58)
Anser anser 32 753 1 14 11(1)
10 8 829(1)
Anser fabalis 12 6 25(6)
10 53(6)
Arenaria interpres 164(4)
164(4)
Aythya fuligula 341(3)
5 2 348(3)
Branta leucopsis 7 4 455(23)
466(23)
Cygnus olor 142(3)
49 1 62 4 5 51 314(3)
Cygnus sp. 13(1)
13(1)
Fulica atra 120(1)
1 3 70 194(1)
Gallinula chloropus 18 7 1 1 5(1)
32(1)
Larus argentatus 28(2)
5 33(2)
Larus melanocephalus 145(1)
59(4)
204(5)
Larus ridibundus 72 2 1 1 1051(415)
10 1137(415)
Spain reported one additional bird as positive for AI from the Ardeidae family (herons and bitterns), but the species was unknown. Target species indicated with bold text.

115
7.2.4 Annex 6 Scientific and English Names of Wild Birds Species Annex 6 Table 1 All target species (in bold) as well as all other bird species that tested positive for AI in 2012, giving English and Latin names
Scientific name English nameAccipiter gentilis Northern GoshawkAccipiter nisus Eurasian Sparrowhawk
Anas acuta Northern PintailAnas clypeata Northern ShovelerAnas crecca Eurasian Teal
Anas penelope Eurasian WigeonAnas platyrhynchos MallardAnas querquedula Garganey
Anas spp. Duck speciesAnas strepera Gadwall
Anser albifrons Greater White-fronted GooseAnser anser Greylag Goose
Anser brachyrhynchus Pink-footed GooseAnser erythropus Lesser White-fronted Goose
Anser fabalis Bean GooseArdea cinerea Grey Heron
Arenaria interpres Ruddy TurnstoneAythya ferina Common Pochard
Aythya fuligula Tufted DuckBranta bernicla Brant Goose
Branta canadensis Canada GooseBranta leucopsis Barnacle GooseBranta ruficollis Red-breasted Goose
Bubo bubo Eurasian Eagle-OwlButeo buteo Common Buzzard
Buteo lagopus Rough-legged BuzzardCairina moschata Muscovy DuckCiconia ciconia White Stork
Circus aeruginosus Western Marsh HarrierCygnus columbianus Tundra Swan
Cygnus cygnus Whooper SwanCygnus olor Mute SwanCygnus sp. Swan species
Falco peregrinus Peregrine FalconFalco tinnunculus Common Kestrel
Fulica atra Eurasian CootGallinago gallinago Common SnipeGallinula chloropus Common Moorhen
Haematopus ostralegus Eurasian OystercatcherLarus argentatus European Herring Gull
Larus argentatus cachinnans Caspian GullLarus canus Mew Gull

116
Larus fuscus Lesser Black-backed GullLarus marinus Great Black-backed Gull
Larus melanocephalus Mediterranean GullLarus ridibundus Black-headed Gull
Limosa limosa Black-tailed GodwitMarmaronetta angustirostris Marbled Duck
Mergus albellus SmewMilvus migrans Black KiteMilvus milvus Red Kite
Nycticorax nycticorax Black-crowned Night HeronNetta rufina Red-crested Pochard
Parus sp. Tit speciesPhalacrocorax carbo Great CormorantPhilomachus pugnax Ruff
Pica pica Eurasian MagpiePluvialis apricaria European Golden PloverPodiceps cristatus Great Crested Grebe
Podiceps nigricollis Black-necked GrebePorphyrio porphyrio Purple Swamphen
Tachybaptus ruficollis Little GrebeVanellus vanellus Northern Lapwing