Embed Size (px)
Citation preview
Annual Report of Vital Statistics: New York State 2013
Division of Information and Statistics Office of Quality and Patient Safety
New York State Department of Health October 2015
Table of Contents
Chapter 1. Introduction .......................................................................................................... 1 Measures Used in this Report ............................................................................................................................... 2 Race/Ethnicity Reporting ...................................................................................................................................... 4
Chapter 2. Overview .............................................................................................................. 5 Table 1. Average Daily Statistics for Selected Vital Events: New York State 2008-2013 ...................................... 6 Table 2. Population Demographics by Age Group and Region: New York State 2013 1 ....................................... 7 Chart 1. Population Distribution by Age Group and Region: New York State 2013 .............................................. 8 Chart 2. Population, Births, and Deaths: New York State, 1950-2013 1 ................................................................ 9 Chart 3. Birth and Death Rates per 100,000 Population: New York State 1950-2013 1...................................... 10 Chart 4. Population Trends and Projections by Age Group: New York State 1980-2030 1,2 ............................... 11 Table 3. Births, Deaths, and Death-to-Birth Ratio by Region and County: New York State 2013 ....................... 12 Map 1. Birth Rate per 1,000 Population by County: New York State 2013 ........................................................ 14 Map 2. Death Rates per 1,000 Population by County: New York State 2013 ..................................................... 15 Map 3. Death-to-Birth Ratio by County: New York State 2013........................................................................... 16
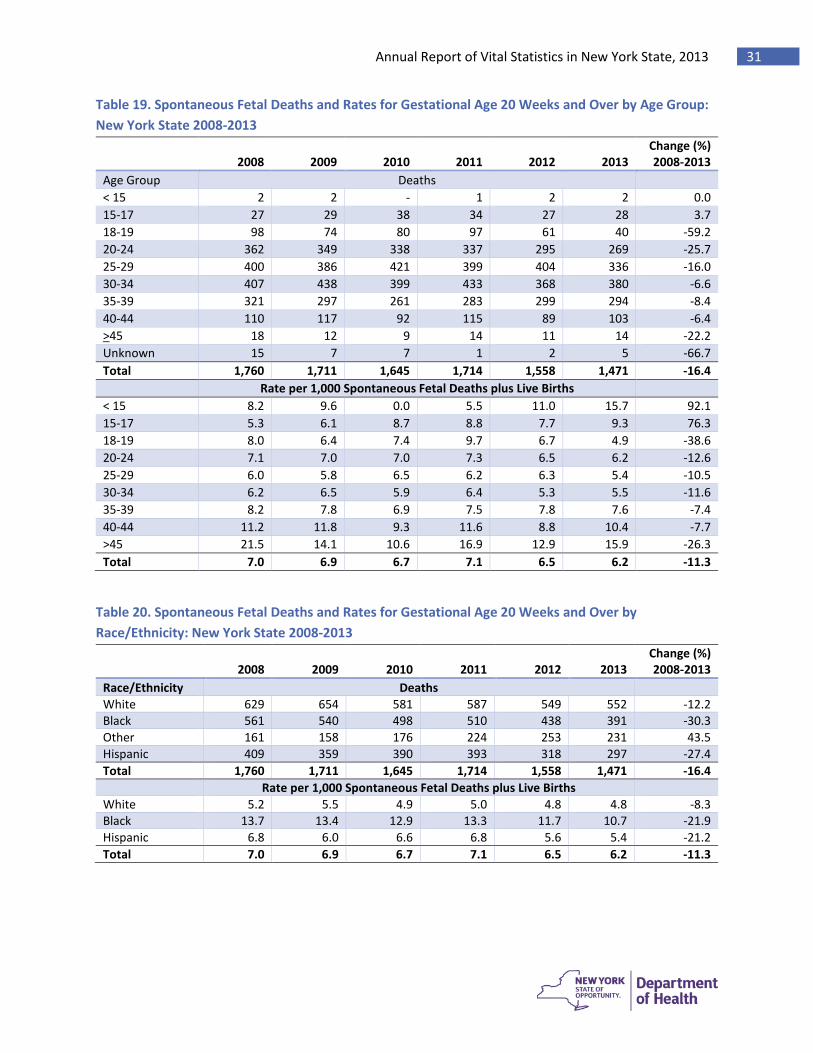
Chapter 3. Pregnancies ........................................................................................................ 17 Table 4. Live Births by Age Group and Race/Ethnicity: New York State 2008-2013 ........................................... 18 Table 5. Pregnancy Outcomes for Women All Ages: New York State 2008-2013 .............................................. 18 Table 6. Teenage1 Pregnancy Outcomes: New York State 2008-2013 ................................................................ 19 Table 7. Fertility Rates by Race/Ethnicity: New York State 2008-2013 ............................................................... 19 Table 8. Pregnancy Rates by Age Group and Race/Ethnicity: New York State 2008-2013 ................................. 20 Table 9. Birth Rates by Age Group and Race/Ethnicity: New York State 2008-2013 .......................................... 20 Table 10. Live Birth Maternal Characteristics: New York State 2008-2013 ........................................................ 21 Table 11. Live Birth Prenatal Characteristics: New York State 2008-2013 .......................................................... 22 Table 12. Live Birth Characteristics and Outcomes: New York State 2008-2013 ................................................ 23 Map 4. Percent of All Live Births that are Cesarean Delivery by County 2013 .................................................. 24 Table 13. Percent Low Birthweight1 by Mother’s Age Group and Race/Ethnicity: New York State 2008-2013 . 25 Table 14. Percent Preterm Live Births1 by Mother’s Age Group and Race/Ethnicity: New York State 2008-2013 ............................................................................................................................................................................ 26 Table 15. Births by Method of Delivery: New York State 2009-2013 1 ............................................................... 27 Table 16. Top 10 Baby First Names by Gender: New York State 2008-2013 ...................................................... 28 Spontaneous Fetal Deaths and Induced Abortions............................................................................................. 29 Table 17. Spontaneous Fetal Deaths and Rates All Gestational Ages by Age Group: New York State 2008-2013 ............................................................................................................................................................................ 30 Table 18. Spontaneous Fetal Deaths and Rates for All Gestational Ages by Race/Ethnicity: New York State 2008-2013 ........................................................................................................................................................... 30 Table 19. Spontaneous Fetal Deaths and Rates for Gestational Age 20 Weeks and Over by Age Group: New York State 2008-2013 .......................................................................................................................................... 31 Table 20. Spontaneous Fetal Deaths and Rates for Gestational Age 20 Weeks and Over by Race/Ethnicity: New York State 2008-2013 ................................................................................................................................. 31
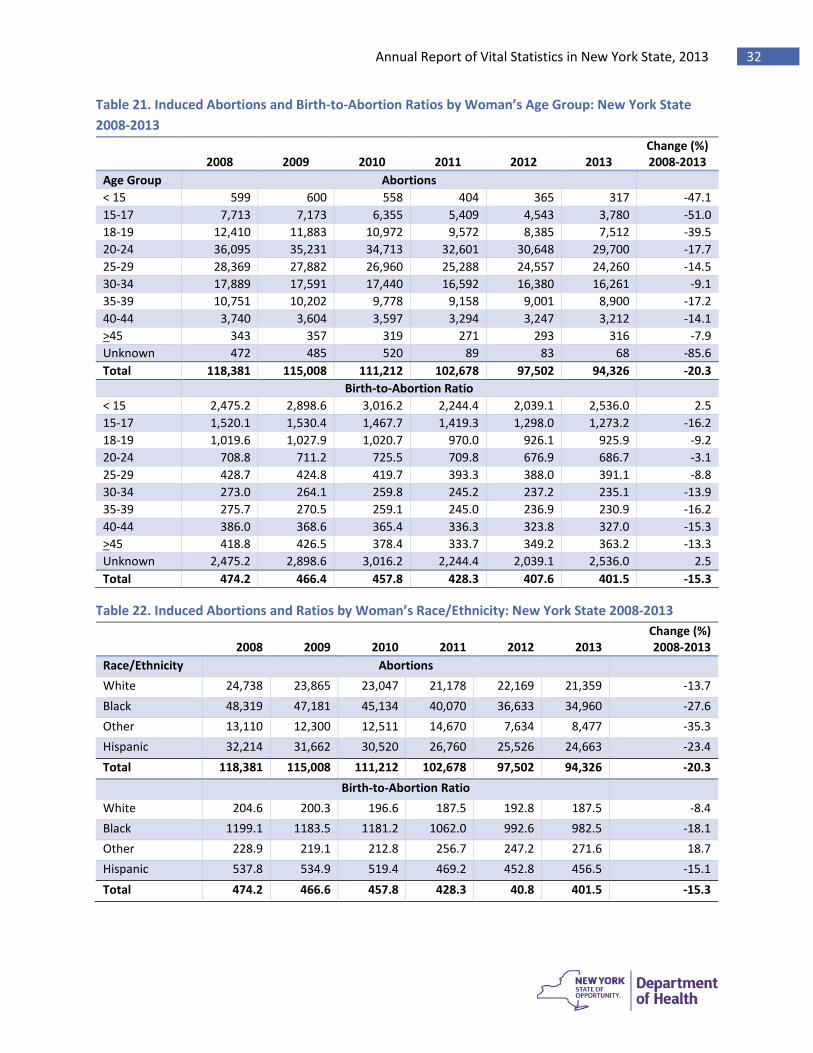
Table 21. Induced Abortions and Birth-to-Abortion Ratios by Woman’s Age Group: New York State 2008-2013 ............................................................................................................................................................................ 32 Table 22. Induced Abortions and Ratios by Woman’s Race/Ethnicity: New York State 2008-2013 ................... 32
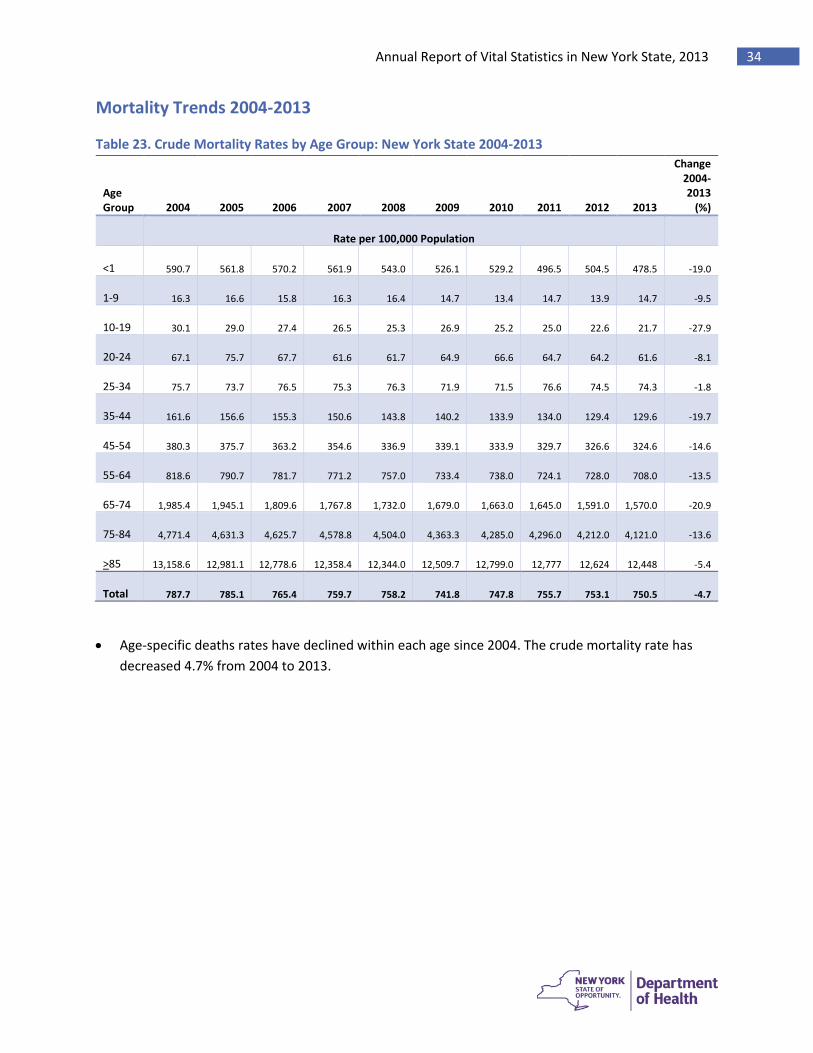
Chapter 4. Deaths ................................................................................................................ 33 Mortality Trends 2004-2013 ............................................................................................................................... 34 Table 23. Crude Mortality Rates by Age Group: New York State 2004-2013 ..................................................... 34 Chart 5. Trends in Age-Adjusted Mortality by Gender: New York State 2004-2013 ........................................... 35 Chart 6. Trends in Age-Adjusted Mortality by Race/Ethnicity: New York State 2004-2013 ............................... 35 Infant Mortality ................................................................................................................................................... 36 Table 24. Infant, Neonatal, Post-Neonatal, and Perinatal Mortality and Rates: New York State 2004-2013 ..... 36 Table 25. Infant Cause of Death: New York State 2013 ...................................................................................... 37 Cause of Death Trends 2004-2013 ...................................................................................................................... 38 Table 26. Crude Cause of Death Rates: New York State 2004-2013 ................................................................... 38
Leading Causes of Death ............................................................................................................... 39 Table 27. Age-Adjusted Mortality Rates for the Five Leading Causes of Death by Race/Ethnicity: New York State 2013 ........................................................................................................................................................... 39 Table 28. Age-Adjusted Mortality Rates for the Five Leading Causes of Death by Gender and Race/Ethnicity: New York State 2013 ........................................................................................................................................... 40 Chart 7. Leading Underlying Causes of Death: New York State 2013 ................................................................. 41 Chart 8. Leading Underlying Causes of Death by Gender: New York State 2013 ............................................... 41 Chart 9. Leading Causes of Death (Any Mention of a Cause)1: New York State 2013......................................... 42 Chart 10. Leading Causes of Death (Any Mention of a Cause)1 by Gender: New York State 2013 ..................... 42
Place of Death and Disposition ..................................................................................................... 43 Chart 11. Place of Death: New York State 2004-2013 ........................................................................................ 43 Chart 12. Disposition after Death: New York State 2004-2013 .......................................................................... 43
Deaths Due to Diseases of the Heart ............................................................................................. 44 Table 29. Diseases of the Heart Mortality Rates per 100,000 and Ranking by Age Group and Gender: New York State 2013 ........................................................................................................................................................... 44
Cancer Deaths .............................................................................................................................. 46 Table 30. Cancer Deaths and Ranking by Site and Gender: New York State 2013 ............................................. 46 Table 31. Top 5 Causes of Deaths By Gender Due to Malignant Neoplasms, Mortality Rates per 100,000 Population and Ranking by Age Group and Gender: New York State 2013 ........................................................ 47
External Causes of Death .............................................................................................................. 48 Table 32. External Cause of Death Age-Adjusted Mortality Rates per 100,000 Population and Ranking by Gender: New York State 2013 ............................................................................................................................. 48 Table 33. External Cause of Death Crude Mortality Rates and Ranking by Age Group: New York State 2013... 49 Table 34. External Cause of Death Age-Adjusted Mortality Rates and Ranking by Race/Ethnicity: New York State 2013 ........................................................................................................................................................... 50
Suicide Deaths ............................................................................................................................. 51 Table 35. Suicide Deaths and Crude Mortality Rates by Age Group: New York State 2004-2013 ...................... 51 Chart 13. Age-Adjusted Suicide Mortality Rates by Gender: New York State 2004-2013 .................................. 52 Chart 14. Age-Adjusted Suicide Mortality Rates by Race/Ethnicity: New York State 2004-2013 ....................... 52
Firearm-Related Deaths ................................................................................................................ 53 Table 36. Firearm-Related Deaths1 and Crude Mortality Rates by Age Group: New York State 2004-2013 ...... 53 Chart 15. Firearm-Related Age-Adjusted Mortality Rates by Gender: New York State 2004-2013 .................... 54 Chart 16. Firearm-Related Age-Adjusted Mortality Rates by Race/Ethnicity: New York State 2004-2013 ........ 54
Alcohol-Related Deaths ................................................................................................................ 55 Table 37. Alcohol-Related Deaths1 and Crude Mortality Rates by Age Group: New York State 2004-2013 ...... 55 Chart 17. Alcohol-Related Age-Adjusted Mortality Rates by Gender: New York State 2004-2013 .................... 56 Chart 18. Alcohol-Related Age-Adjusted Mortality Rates by Race/Ethnicity: New York State 2004-2013 ......... 56
Opioid-Related Deaths ................................................................................................................. 57 Table 38. Opioid-Related1 Deaths and Crude Mortality Rates by Age Group: New York State 2004-2013 ........ 57 Chart 19. Opioid-Related Age-Adjusted Mortality Rates by Gender: New York State 2004-2013 ..................... 58 Chart 20. Opioid-Related Age-Adjusted Mortality Rates by Race/Ethnicity: New York State 2004-2013 .......... 58
Chapter 5. Marriages and Dissolutions ................................................................................. 59 Table 39. Marriage by Gender in the Rest of State Region: New York State 2013 ............................................. 60 Table 40. Number and Percent of Marriages by Month of Ceremony: New York State 2009-2013 .................. 61 Table 41. Dissolutions of Marriage by Duration: New York State 2005-2013 .................................................... 62
Chapter 6. Additional Resources .......................................................................................... 63 New York State Vital Statistics Tables Available on DOH Website, 1997-2013 .................................................. 63 Other State Vital Statistics Web Links ................................................................................................................. 65
Technical Notes ................................................................................................................... 67
How the Vital Event Data Are Collected ........................................................................................ 67 Population Estimates ...................................................................................................................................... 70
Cause of Death ICD-10 Codes ........................................................................................................ 71
Acknowledgments ............................................................................................................... 72
Annual Report of Vital Statistics in New York State, 2013 1
Chapter 1. Introduction
The Annual Report of Vital Statistics: New York State 2013 is prepared by the Division of Information and Statistics, Office of Quality and Patient Safety within the New York State Department of Health (NYSDOH). This report contains the most current information available on New York State pregnancies, deaths, and marriages, including trends over time and state population demographics. For additional vital event data, trends and statistical reports, readers may visit the Vital Statistics page on the DOH website at the following address: http://www.health.ny.gov/statistics/vital_statistics/. Researchers interested in longitudinal data files of vital events can find them available for download on the Open NY Data portal for health data - Health Data NY https://health.data.ny.gov/. Feedback on this report is welcome. Please contact us at:
Division of Information and Statistics Office of Quality and Patient Safety
New York State Department of Health Corning Tower, Room 1911
Empire State Plaza Albany, New York 12237 Phone: (518) 474-3189
Email: [email protected]
Annual Report of Vital Statistics: New York State 2013 2
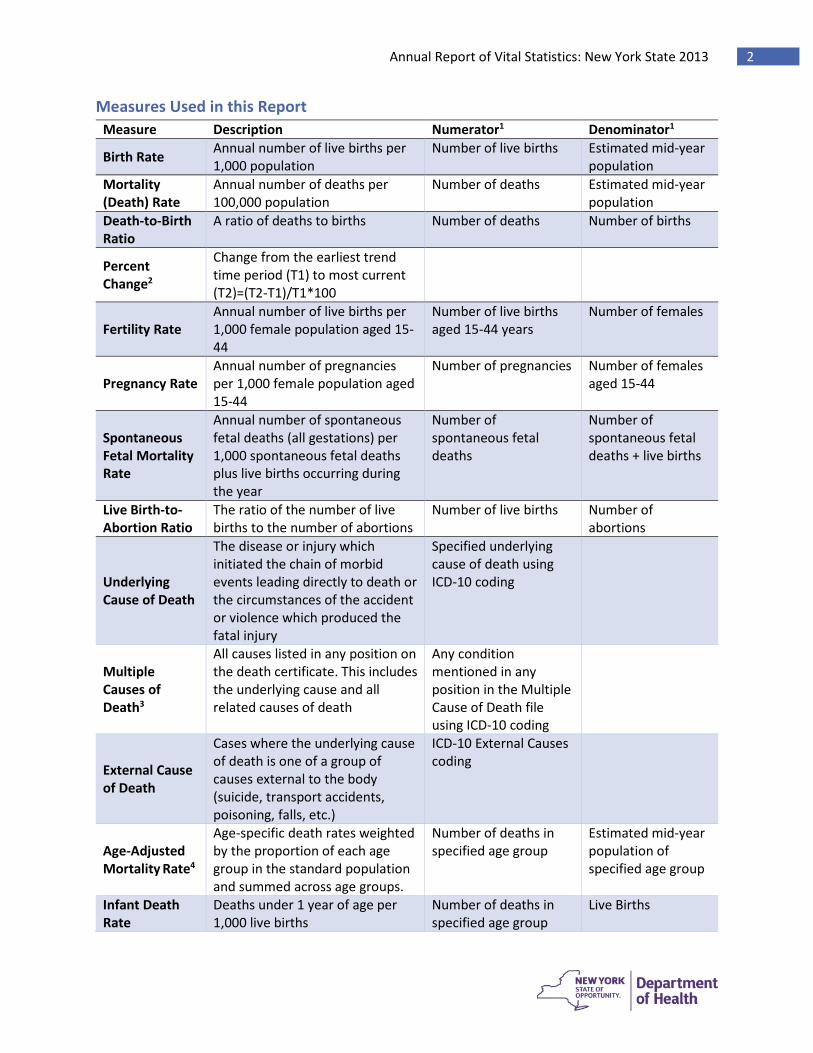
Measures Used in this Report Measure Description Numerator1 Denominator1
Birth Rate Annual number of live births per 1,000 population
Number of live births Estimated mid-year population
Mortality (Death) Rate
Annual number of deaths per 100,000 population
Number of deaths Estimated mid-year population
Death-to-Birth Ratio
A ratio of deaths to births Number of deaths Number of births
Percent Change2
Change from the earliest trend time period (T1) to most current (T2)=(T2-T1)/T1*100
Fertility Rate Annual number of live births per 1,000 female population aged 15-44
Number of live births aged 15-44 years
Number of females
Pregnancy Rate Annual number of pregnancies per 1,000 female population aged 15-44
Number of pregnancies Number of females aged 15-44
Spontaneous Fetal Mortality Rate
Annual number of spontaneous fetal deaths (all gestations) per 1,000 spontaneous fetal deaths plus live births occurring during the year
Number of spontaneous fetal deaths
Number of spontaneous fetal deaths + live births
Live Birth-to-Abortion Ratio
The ratio of the number of live births to the number of abortions
Number of live births Number of abortions
Underlying Cause of Death
The disease or injury which initiated the chain of morbid events leading directly to death or the circumstances of the accident or violence which produced the fatal injury
Specified underlying cause of death using ICD-10 coding
Multiple Causes of Death3
All causes listed in any position on the death certificate. This includes the underlying cause and all related causes of death
Any condition mentioned in any position in the Multiple Cause of Death file using ICD-10 coding
External Cause of Death
Cases where the underlying cause of death is one of a group of causes external to the body (suicide, transport accidents, poisoning, falls, etc.)
ICD-10 External Causes coding
Age-Adjusted Mortality Rate4
Age-specific death rates weighted by the proportion of each age group in the standard population and summed across age groups.
Number of deaths in specified age group
Estimated mid-year population of specified age group
Infant Death Rate
Deaths under 1 year of age per 1,000 live births
Number of deaths in specified age group
Live Births
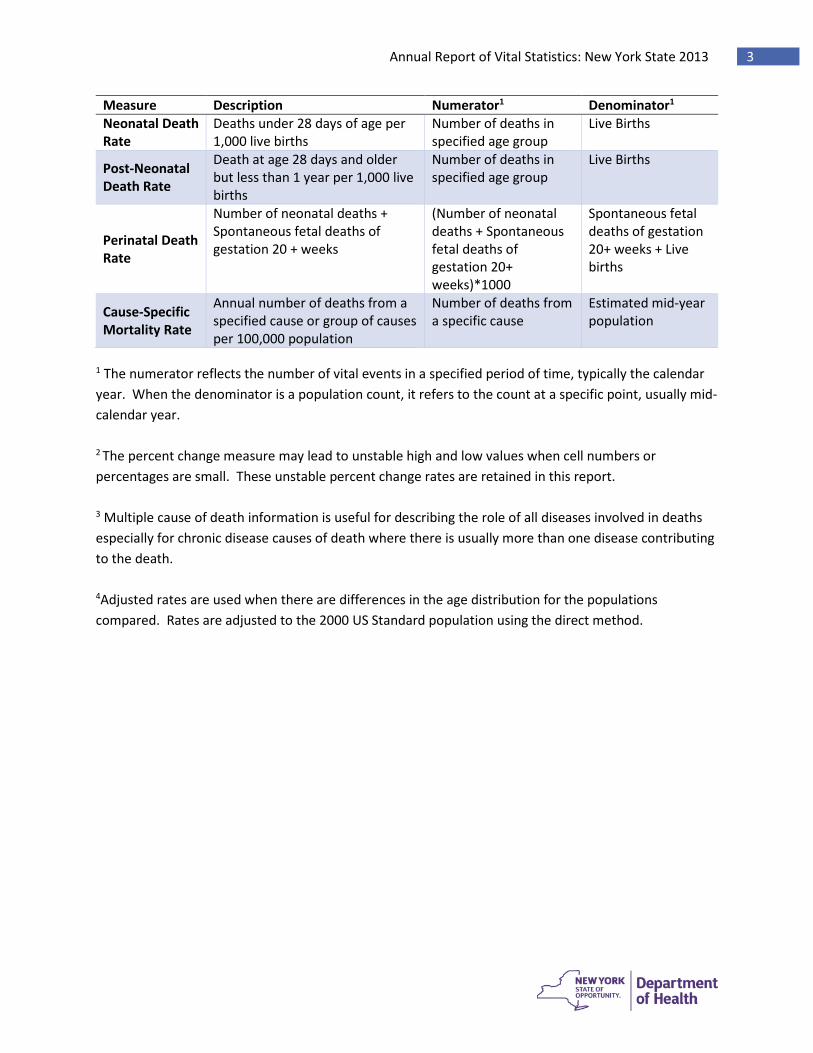
Annual Report of Vital Statistics: New York State 2013 3
Measure Description Numerator1 Denominator1
Neonatal Death Rate
Deaths under 28 days of age per 1,000 live births
Number of deaths in specified age group
Live Births
Post-Neonatal Death Rate
Death at age 28 days and older but less than 1 year per 1,000 live births
Number of deaths in specified age group
Live Births
Perinatal Death Rate
Number of neonatal deaths + Spontaneous fetal deaths of gestation 20 + weeks
(Number of neonatal deaths + Spontaneous fetal deaths of gestation 20+ weeks)*1000
Spontaneous fetal deaths of gestation 20+ weeks + Live births
Cause-Specific Mortality Rate
Annual number of deaths from a specified cause or group of causes per 100,000 population
Number of deaths from a specific cause
Estimated mid-year population
1 The numerator reflects the number of vital events in a specified period of time, typically the calendar year. When the denominator is a population count, it refers to the count at a specific point, usually mid-calendar year. 2 The percent change measure may lead to unstable high and low values when cell numbers or percentages are small. These unstable percent change rates are retained in this report.
3 Multiple cause of death information is useful for describing the role of all diseases involved in deaths especially for chronic disease causes of death where there is usually more than one disease contributing to the death.
4Adjusted rates are used when there are differences in the age distribution for the populations compared. Rates are adjusted to the 2000 US Standard population using the direct method.
Annual Report of Vital Statistics: New York State 2013 4
Race/Ethnicity Reporting Birth Certificate Race and ethnicity reported in the birth record is based solely on the self-reported information provided by the mother. The birth certificate allows for the selection of multiple races from a list of 15 categories that follow the Census 2000 coding scheme. Ethnicity information is used to distinguish women of Spanish origin, regardless of race. In this report, Hispanic refers to anyone of Hispanic origin regardless of race. When race groups are reported, they are non-Hispanic. Rates in this report are based on mid-year Census population estimates and are limited to white non-Hispanic, black non-Hispanic, and Hispanic in order to ensure consistency between the numerators and available population denominators. Tables showing birth outcomes as counts or as a percentage of births include a more detailed breakdown of race/ethnicity. Fetal Deaths For both induced and spontaneous fetal deaths, race and ethnicity are self-reported. These fetal death certificates allow for the selection of only one race category. Death Certificate Race and ethnicity information on death certificates is completed by the funeral director, often in consultation with the decedent’s family. The death certificate allows for the selection of multiple races from a list of 15 categories that follow the Census 2000 coding scheme. The reporting of Hispanic ethnicity is known to be undercounted. This information should be considered when analyzing mortality data by race\ethnicity. Please see the Technical Notes section for additional details.
Annual Report of Vital Statistics: New York State 2013 5
Chapter 2. Overview
• Each day in New York State, an average of 950 women become pregnant, 645 babies are born, and 404 residents die. Heart disease continues as the leading cause of death for males and females.
• Of the 404 average deaths each day, about 30 percent of them are related to heart disease and 24 percent to cancer on the average; and 15 New Yorkers experience an accidental death daily.
• In 2013, New York State had a population of 19.65 million residents. Forty-three percent of New Yorkers reside in the five boroughs of New York City and 57 percent reside in the Rest of State.
• A larger proportion of the population aged 20-44 resides in New York City, with a higher percentage of females than males.
• A disproportionately larger percentage of older adults aged 50 years and over reside in the Rest of State region (62 percent).
• The aging of the population is made evident by projections indicating that the percentage of the population aged 65 years and older will grow from 13.2% in 1980 to 18.0% in 2030.
Annual Report of Vital Statistics: New York State 2013 6
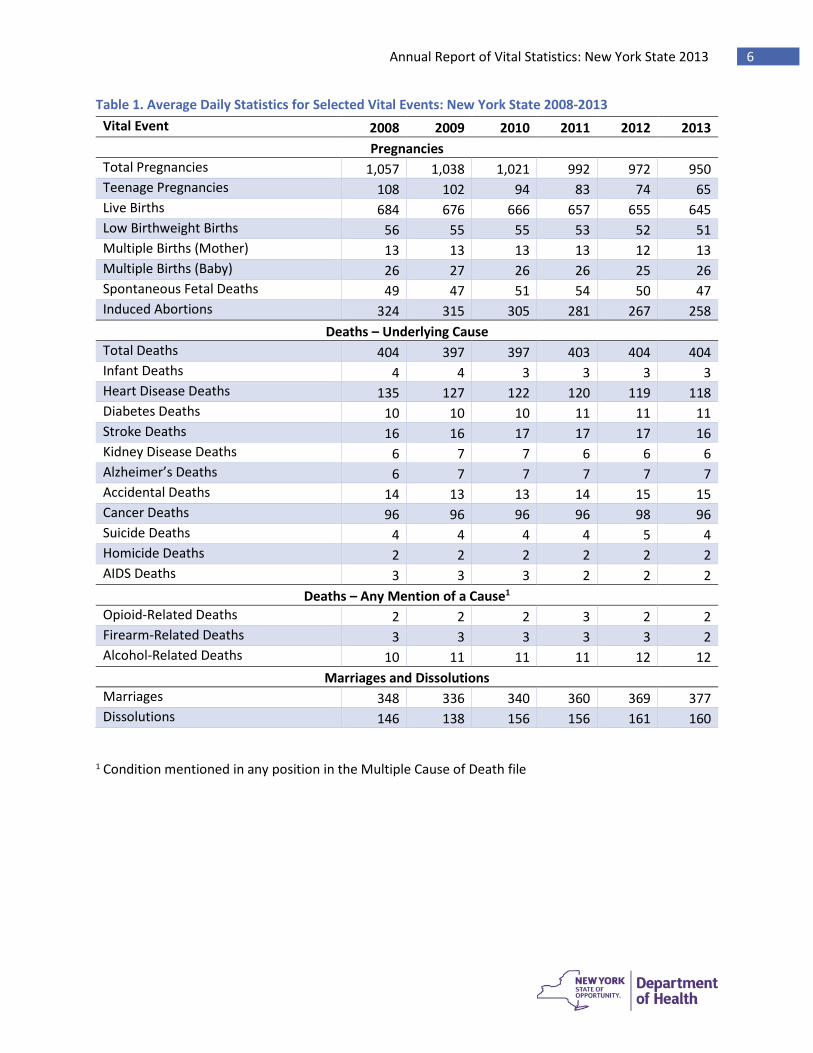
Table 1. Average Daily Statistics for Selected Vital Events: New York State 2008-2013
1 Condition mentioned in any position in the Multiple Cause of Death file
Vital Event 2008 2009 2010 2011 2012 2013 Pregnancies
Total Pregnancies 1,057 1,038 1,021 992 972 950 Teenage Pregnancies 108 102 94 83 74 65 Live Births 684 676 666 657 655 645 Low Birthweight Births 56 55 55 53 52 51 Multiple Births (Mother) 13 13 13 13 12 13 Multiple Births (Baby) 26 27 26 26 25 26 Spontaneous Fetal Deaths 49 47 51 54 50 47 Induced Abortions 324 315 305 281 267 258
Deaths – Underlying Cause Total Deaths 404 397 397 403 404 404 Infant Deaths 4 4 3 3 3 3 Heart Disease Deaths 135 127 122 120 119 118 Diabetes Deaths 10 10 10 11 11 11 Stroke Deaths 16 16 17 17 17 16 Kidney Disease Deaths 6 7 7 6 6 6 Alzheimer’s Deaths 6 7 7 7 7 7 Accidental Deaths 14 13 13 14 15 15 Cancer Deaths 96 96 96 96 98 96 Suicide Deaths 4 4 4 4 5 4 Homicide Deaths 2 2 2 2 2 2 AIDS Deaths 3 3 3 2 2 2
Deaths – Any Mention of a Cause1 Opioid-Related Deaths 2 2 2 3 2 2 Firearm-Related Deaths 3 3 3 3 3 2 Alcohol-Related Deaths 10 11 11 11 12 12
Marriages and Dissolutions Marriages 348 336 340 360 369 377 Dissolutions 146 138 156 156 161 160
Annual Report of Vital Statistics: New York State 2013 7
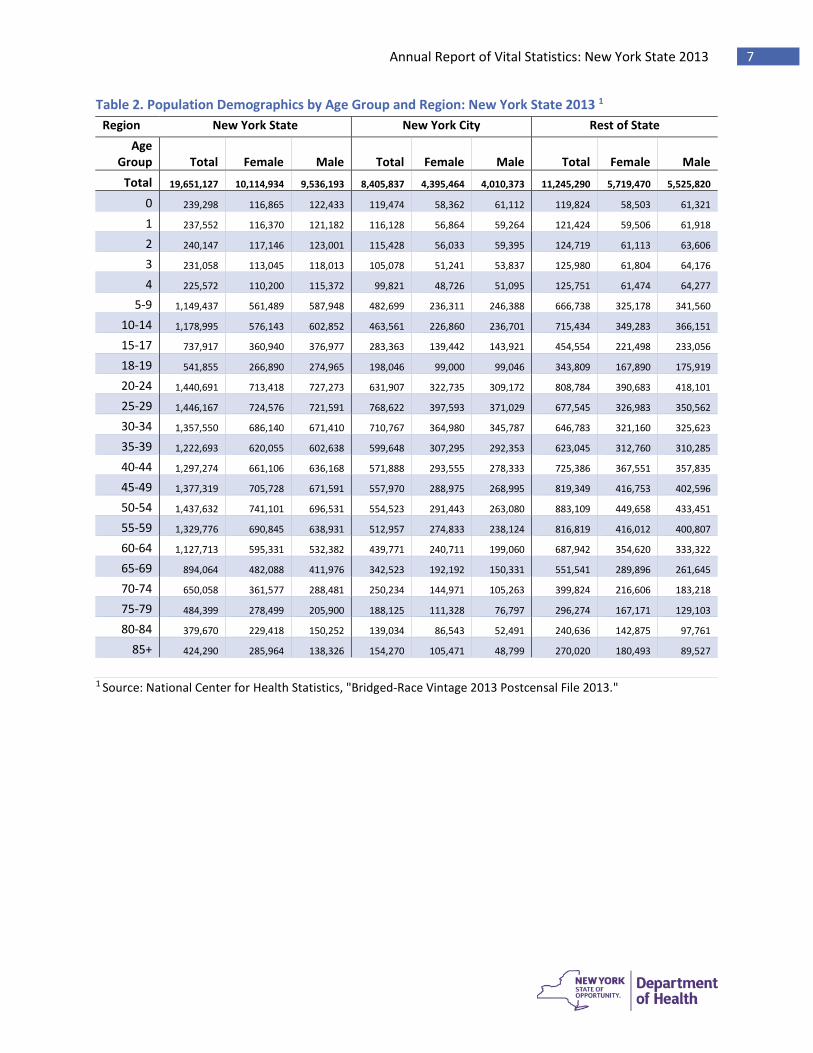
Table 2. Population Demographics by Age Group and Region: New York State 2013 1
1 Source: National Center for Health Statistics, "Bridged-Race Vintage 2013 Postcensal File 2013."
Region New York State New York City Rest of State Age
Group
Total
Female
Male
Total
Female
Male
Total
Female
Male Total 19,651,127 10,114,934 9,536,193 8,405,837 4,395,464 4,010,373 11,245,290 5,719,470 5,525,820
0 239,298 116,865 122,433 119,474 58,362 61,112 119,824 58,503 61,321
1 237,552 116,370 121,182 116,128 56,864 59,264 121,424 59,506 61,918
2 240,147 117,146 123,001 115,428 56,033 59,395 124,719 61,113 63,606
3 231,058 113,045 118,013 105,078 51,241 53,837 125,980 61,804 64,176
4 225,572 110,200 115,372 99,821 48,726 51,095 125,751 61,474 64,277
5-9 1,149,437 561,489 587,948 482,699 236,311 246,388 666,738 325,178 341,560
10-14 1,178,995 576,143 602,852 463,561 226,860 236,701 715,434 349,283 366,151
15-17 737,917 360,940 376,977 283,363 139,442 143,921 454,554 221,498 233,056
18-19 541,855 266,890 274,965 198,046 99,000 99,046 343,809 167,890 175,919
20-24 1,440,691 713,418 727,273 631,907 322,735 309,172 808,784 390,683 418,101
25-29 1,446,167 724,576 721,591 768,622 397,593 371,029 677,545 326,983 350,562
30-34 1,357,550 686,140 671,410 710,767 364,980 345,787 646,783 321,160 325,623
35-39 1,222,693 620,055 602,638 599,648 307,295 292,353 623,045 312,760 310,285
40-44 1,297,274 661,106 636,168 571,888 293,555 278,333 725,386 367,551 357,835
45-49 1,377,319 705,728 671,591 557,970 288,975 268,995 819,349 416,753 402,596
50-54 1,437,632 741,101 696,531 554,523 291,443 263,080 883,109 449,658 433,451
55-59 1,329,776 690,845 638,931 512,957 274,833 238,124 816,819 416,012 400,807
60-64 1,127,713 595,331 532,382 439,771 240,711 199,060 687,942 354,620 333,322
65-69 894,064 482,088 411,976 342,523 192,192 150,331 551,541 289,896 261,645
70-74 650,058 361,577 288,481 250,234 144,971 105,263 399,824 216,606 183,218
75-79 484,399 278,499 205,900 188,125 111,328 76,797 296,274 167,171 129,103
80-84 379,670 229,418 150,252 139,034 86,543 52,491 240,636 142,875 97,761
85+ 424,290 285,964 138,326 154,270 105,471 48,799 270,020 180,493 89,527
Annual Report of Vital Statistics: New York State 2013 8
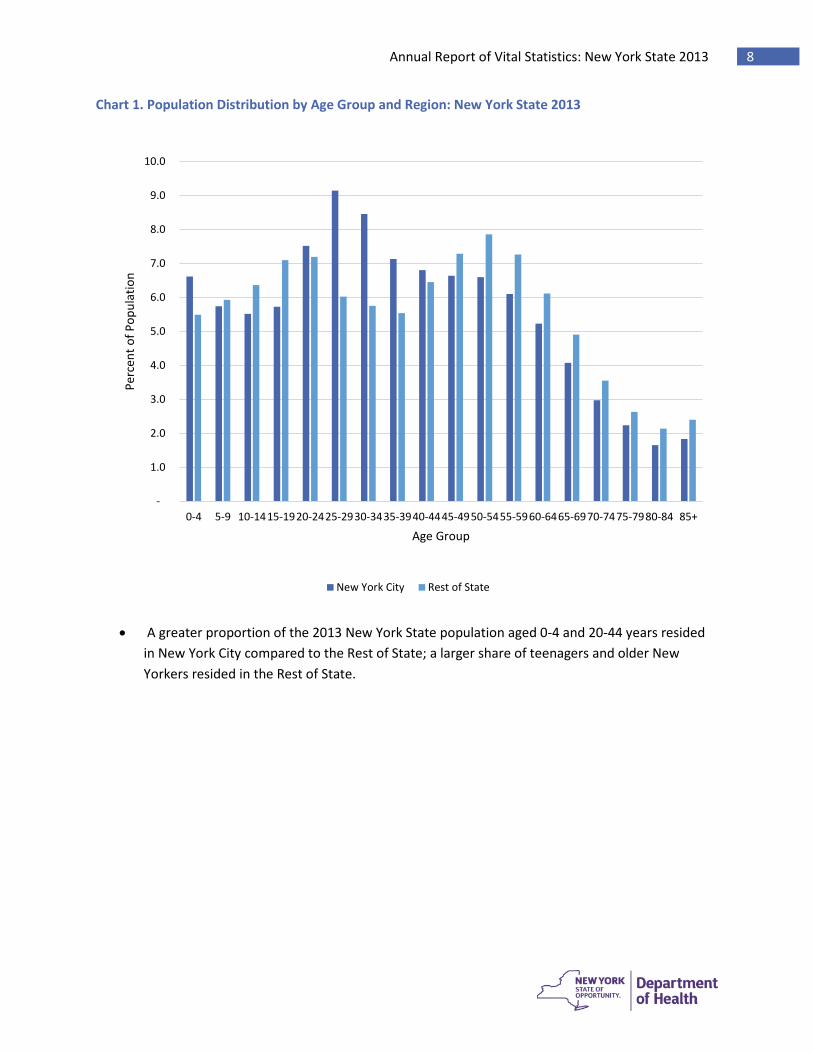
Chart 1. Population Distribution by Age Group and Region: New York State 2013
• A greater proportion of the 2013 New York State population aged 0-4 and 20-44 years resided in New York City compared to the Rest of State; a larger share of teenagers and older New Yorkers resided in the Rest of State.
-
1.0
2.0
3.0
4.0
5.0
6.0
7.0
8.0
9.0
10.0
0-4 5-9 10-1415-1920-2425-2930-3435-3940-4445-4950-5455-5960-6465-6970-7475-7980-84 85+
Perc
ent o
f Pop
ulat
ion
Age Group
New York City Rest of State
Annual Report of Vital Statistics: New York State 2013 9
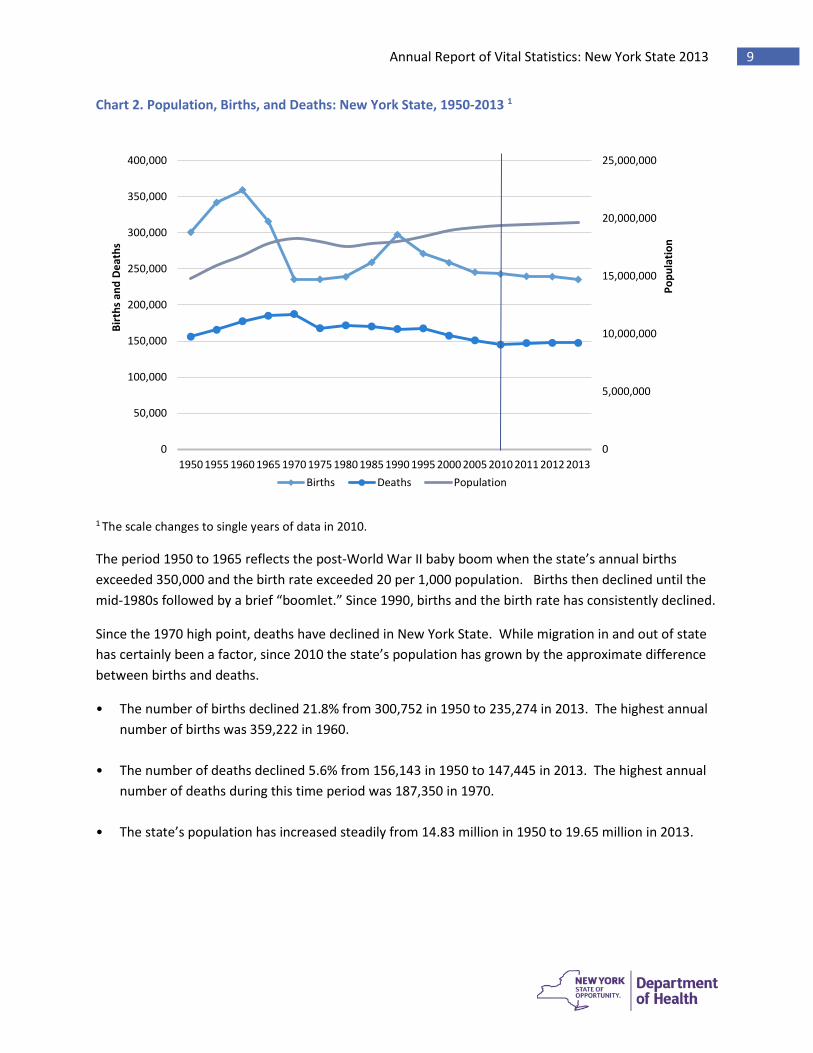
Chart 2. Population, Births, and Deaths: New York State, 1950-2013 1
1 The scale changes to single years of data in 2010.
The period 1950 to 1965 reflects the post-World War II baby boom when the state’s annual births exceeded 350,000 and the birth rate exceeded 20 per 1,000 population. Births then declined until the mid-1980s followed by a brief “boomlet.” Since 1990, births and the birth rate has consistently declined.
Since the 1970 high point, deaths have declined in New York State. While migration in and out of state has certainly been a factor, since 2010 the state’s population has grown by the approximate difference between births and deaths.
• The number of births declined 21.8% from 300,752 in 1950 to 235,274 in 2013. The highest annual number of births was 359,222 in 1960.
• The number of deaths declined 5.6% from 156,143 in 1950 to 147,445 in 2013. The highest annual number of deaths during this time period was 187,350 in 1970.
• The state’s population has increased steadily from 14.83 million in 1950 to 19.65 million in 2013.
0
5,000,000
10,000,000
15,000,000
20,000,000
25,000,000
0
50,000
100,000
150,000
200,000
250,000
300,000
350,000
400,000
1950 1955 1960 1965 1970 1975 1980 1985 1990 1995 2000 2005 2010 2011 2012 2013
Popu
latio
n
Birt
hs a
nd D
eath
s
Births Deaths Population
Annual Report of Vital Statistics: New York State 2013 10
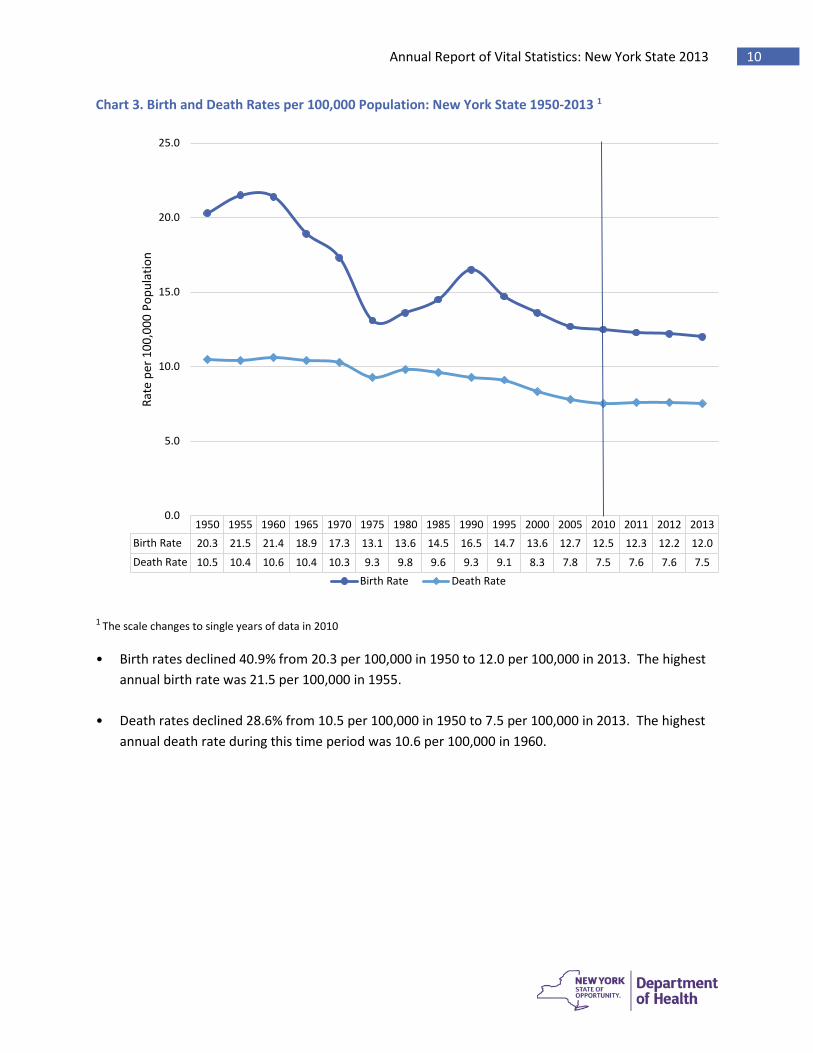
Chart 3. Birth and Death Rates per 100,000 Population: New York State 1950-2013 1
1 The scale changes to single years of data in 2010
• Birth rates declined 40.9% from 20.3 per 100,000 in 1950 to 12.0 per 100,000 in 2013. The highest annual birth rate was 21.5 per 100,000 in 1955.
• Death rates declined 28.6% from 10.5 per 100,000 in 1950 to 7.5 per 100,000 in 2013. The highest annual death rate during this time period was 10.6 per 100,000 in 1960.
1950 1955 1960 1965 1970 1975 1980 1985 1990 1995 2000 2005 2010 2011 2012 2013Birth Rate 20.3 21.5 21.4 18.9 17.3 13.1 13.6 14.5 16.5 14.7 13.6 12.7 12.5 12.3 12.2 12.0Death Rate 10.5 10.4 10.6 10.4 10.3 9.3 9.8 9.6 9.3 9.1 8.3 7.8 7.5 7.6 7.6 7.5
0.0
5.0
10.0
15.0
20.0
25.0Ra
te p
er 1
00,0
00 P
opul
atio
n
Birth Rate Death Rate
Annual Report of Vital Statistics: New York State 2013 11
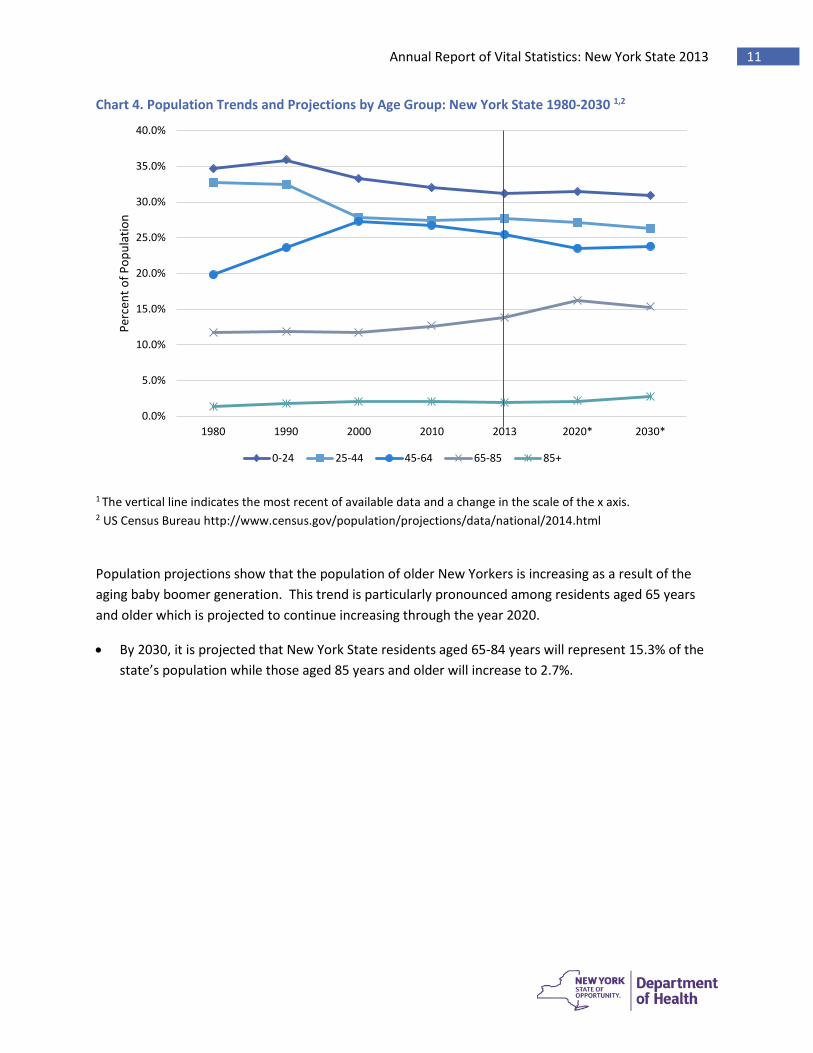
Chart 4. Population Trends and Projections by Age Group: New York State 1980-2030 1,2
1 The vertical line indicates the most recent of available data and a change in the scale of the x axis. 2 US Census Bureau http://www.census.gov/population/projections/data/national/2014.html
Population projections show that the population of older New Yorkers is increasing as a result of the aging baby boomer generation. This trend is particularly pronounced among residents aged 65 years and older which is projected to continue increasing through the year 2020.
• By 2030, it is projected that New York State residents aged 65-84 years will represent 15.3% of the state’s population while those aged 85 years and older will increase to 2.7%.
0.0%
5.0%
10.0%
15.0%
20.0%
25.0%
30.0%
35.0%
40.0%
1980 1990 2000 2010 2013 2020* 2030*
Perc
ent o
f Pop
ulat
ion
0-24 25-44 45-64 65-85 85+
Annual Report of Vital Statistics: New York State 2013 12
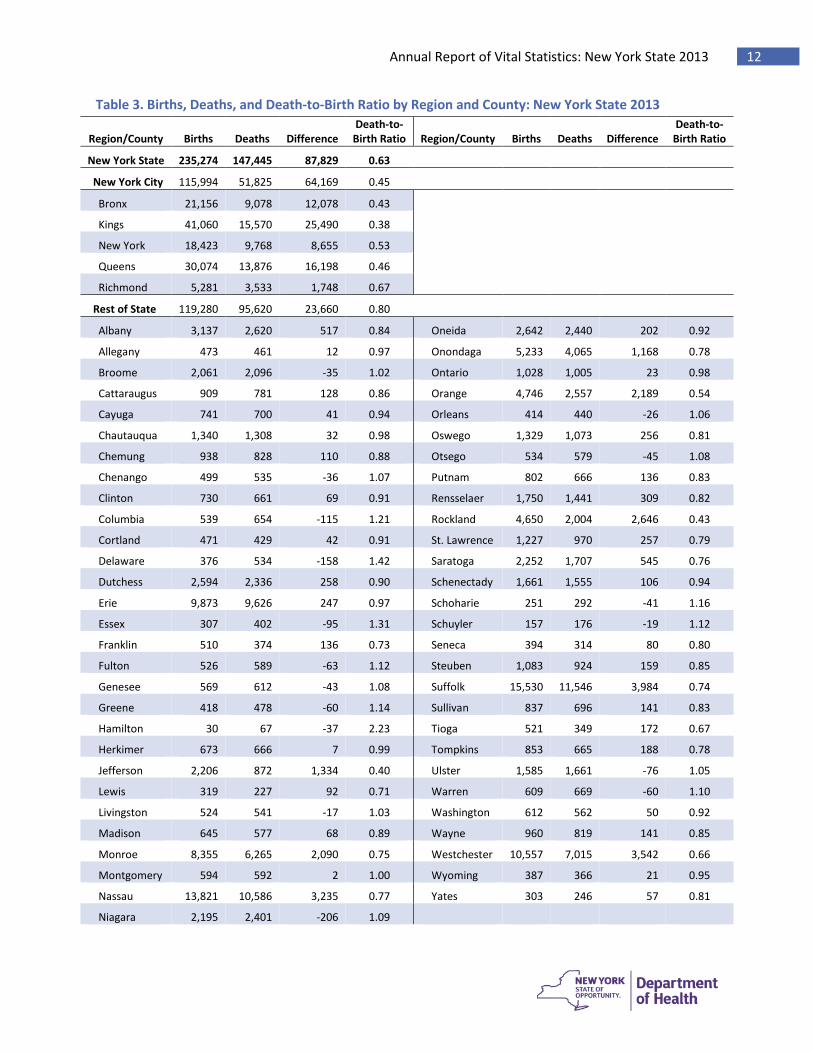
Table 3. Births, Deaths, and Death-to-Birth Ratio by Region and County: New York State 2013
Region/County Births Deaths Difference Death-to-
Birth Ratio
Region/County
Births
Deaths
Difference Death-to-
Birth Ratio
New York State 235,274 147,445 87,829 0.63
New York City 115,994 51,825 64,169 0.45
Bronx 21,156 9,078 12,078 0.43
Kings 41,060 15,570 25,490 0.38
New York 18,423 9,768 8,655 0.53
Queens 30,074 13,876 16,198 0.46
Richmond 5,281 3,533 1,748 0.67
Rest of State 119,280 95,620 23,660 0.80
Albany 3,137 2,620 517 0.84 Oneida 2,642 2,440 202 0.92
Allegany 473 461 12 0.97 Onondaga 5,233 4,065 1,168 0.78
Broome 2,061 2,096 -35 1.02 Ontario 1,028 1,005 23 0.98
Cattaraugus 909 781 128 0.86 Orange 4,746 2,557 2,189 0.54
Cayuga 741 700 41 0.94 Orleans 414 440 -26 1.06
Chautauqua 1,340 1,308 32 0.98 Oswego 1,329 1,073 256 0.81
Chemung 938 828 110 0.88 Otsego 534 579 -45 1.08
Chenango 499 535 -36 1.07 Putnam 802 666 136 0.83
Clinton 730 661 69 0.91 Rensselaer 1,750 1,441 309 0.82
Columbia 539 654 -115 1.21 Rockland 4,650 2,004 2,646 0.43
Cortland 471 429 42 0.91 St. Lawrence 1,227 970 257 0.79
Delaware 376 534 -158 1.42 Saratoga 2,252 1,707 545 0.76
Dutchess 2,594 2,336 258 0.90 Schenectady 1,661 1,555 106 0.94
Erie 9,873 9,626 247 0.97 Schoharie 251 292 -41 1.16
Essex 307 402 -95 1.31 Schuyler 157 176 -19 1.12
Franklin 510 374 136 0.73 Seneca 394 314 80 0.80
Fulton 526 589 -63 1.12 Steuben 1,083 924 159 0.85
Genesee 569 612 -43 1.08 Suffolk 15,530 11,546 3,984 0.74
Greene 418 478 -60 1.14 Sullivan 837 696 141 0.83
Hamilton 30 67 -37 2.23 Tioga 521 349 172 0.67
Herkimer 673 666 7 0.99 Tompkins 853 665 188 0.78
Jefferson 2,206 872 1,334 0.40 Ulster 1,585 1,661 -76 1.05
Lewis 319 227 92 0.71 Warren 609 669 -60 1.10
Livingston 524 541 -17 1.03 Washington 612 562 50 0.92
Madison 645 577 68 0.89 Wayne 960 819 141 0.85
Monroe 8,355 6,265 2,090 0.75 Westchester 10,557 7,015 3,542 0.66
Montgomery 594 592 2 1.00 Wyoming 387 366 21 0.95
Nassau 13,821 10,586 3,235 0.77 Yates 303 246 57 0.81
Niagara 2,195 2,401 -206 1.09
Annual Report of Vital Statistics in New York State, 2013 13
Measures of the difference between births and deaths and the death-to-birth ratio can be useful indicators of the health and well-being of the population, aging, and migration trends. A larger difference and a ratio exceeding 1.0 indicate more deaths than births in the county. A lower ratio is usually indicative of a younger population. This information is further illustrated in Map 3.
• In 2013, New York State had a birth-death difference of 87,829; 64,169 for New York City and 23,660 for the Rest of State. The death-to-birth ratios were 0.63, 0.45, and 0.80, respectively.
• Birth-death differences in New York City ranged from a high of 25,490 in Kings County to a low of 1,748 in Richmond County. Differences in the Rest of State region ranged from a high of 3,984 in Suffolk County to a low of -206 in Niagara County.
• Death-to-birth ratios in New York City ranged from a low of 0.43 in Bronx County to a high of 0.67 in Richmond County. Ratios in the Rest of State region ranged from a low of 0.40 in Jefferson County to a high of 2.23 in Hamilton County.
Annual Report of Vital Statistics in New York State, 2013 14
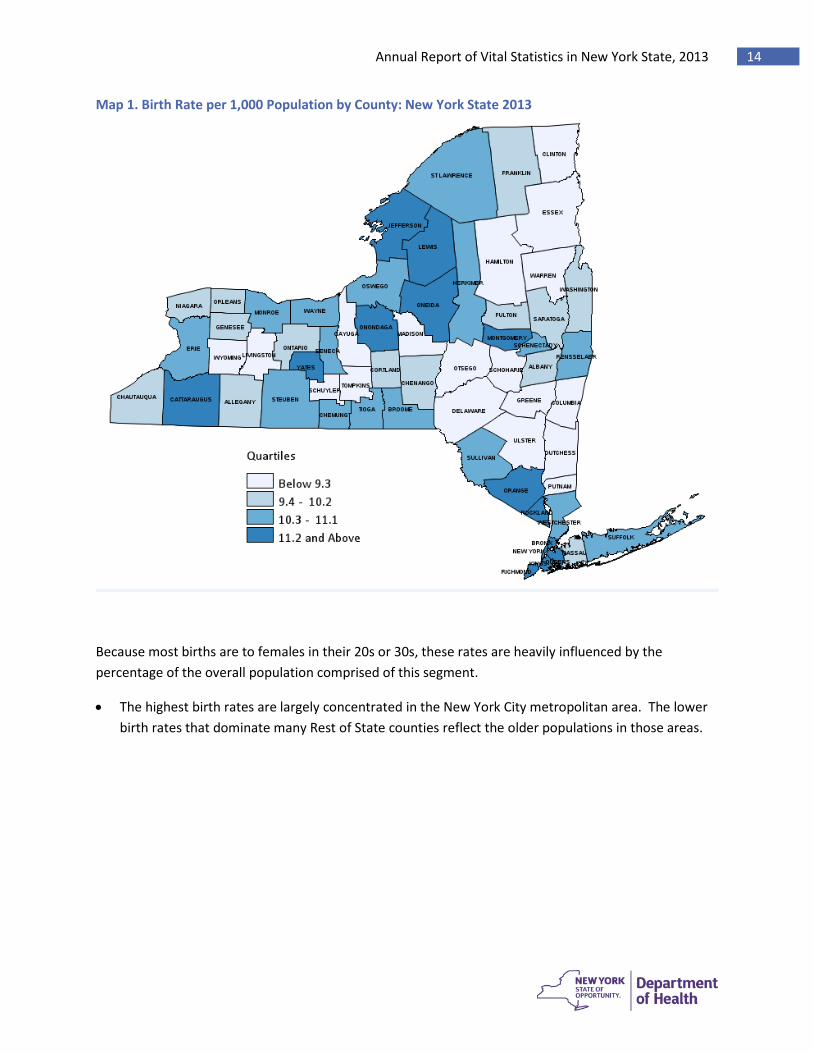
Map 1. Birth Rate per 1,000 Population by County: New York State 2013
Because most births are to females in their 20s or 30s, these rates are heavily influenced by the percentage of the overall population comprised of this segment.
• The highest birth rates are largely concentrated in the New York City metropolitan area. The lower birth rates that dominate many Rest of State counties reflect the older populations in those areas.
Annual Report of Vital Statistics in New York State, 2013 15
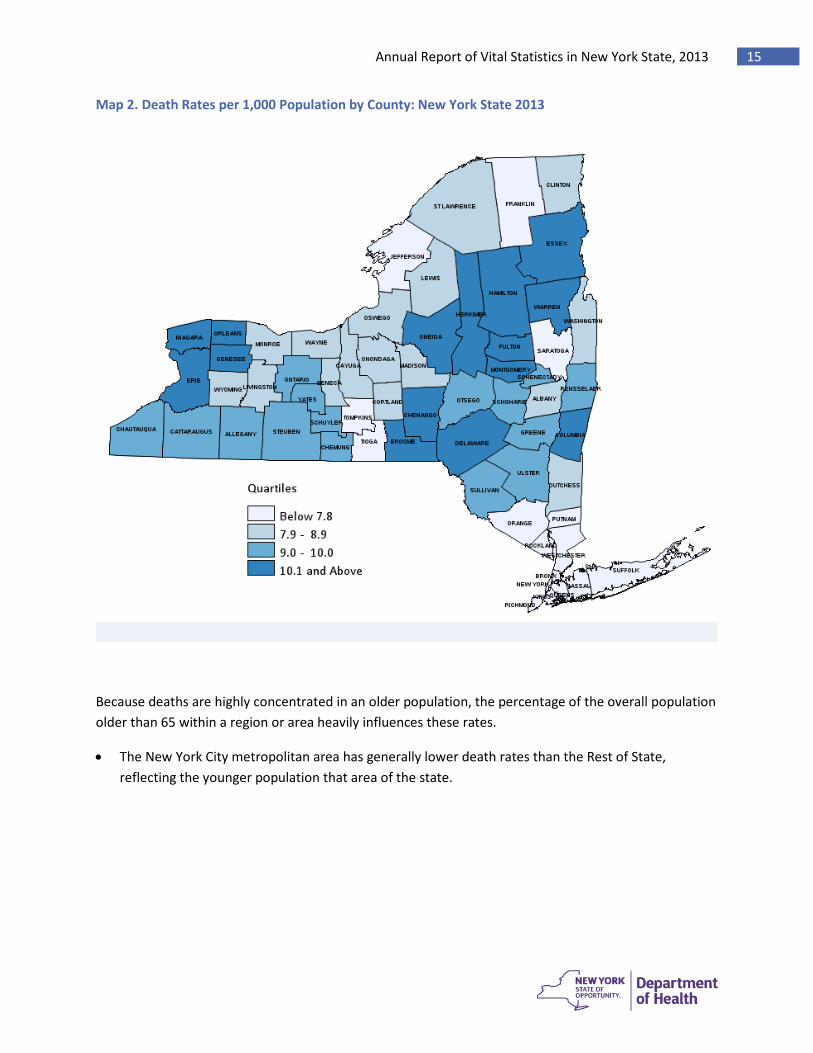
Map 2. Death Rates per 1,000 Population by County: New York State 2013
Because deaths are highly concentrated in an older population, the percentage of the overall population older than 65 within a region or area heavily influences these rates.
• The New York City metropolitan area has generally lower death rates than the Rest of State, reflecting the younger population that area of the state.
Annual Report of Vital Statistics in New York State, 2013 16
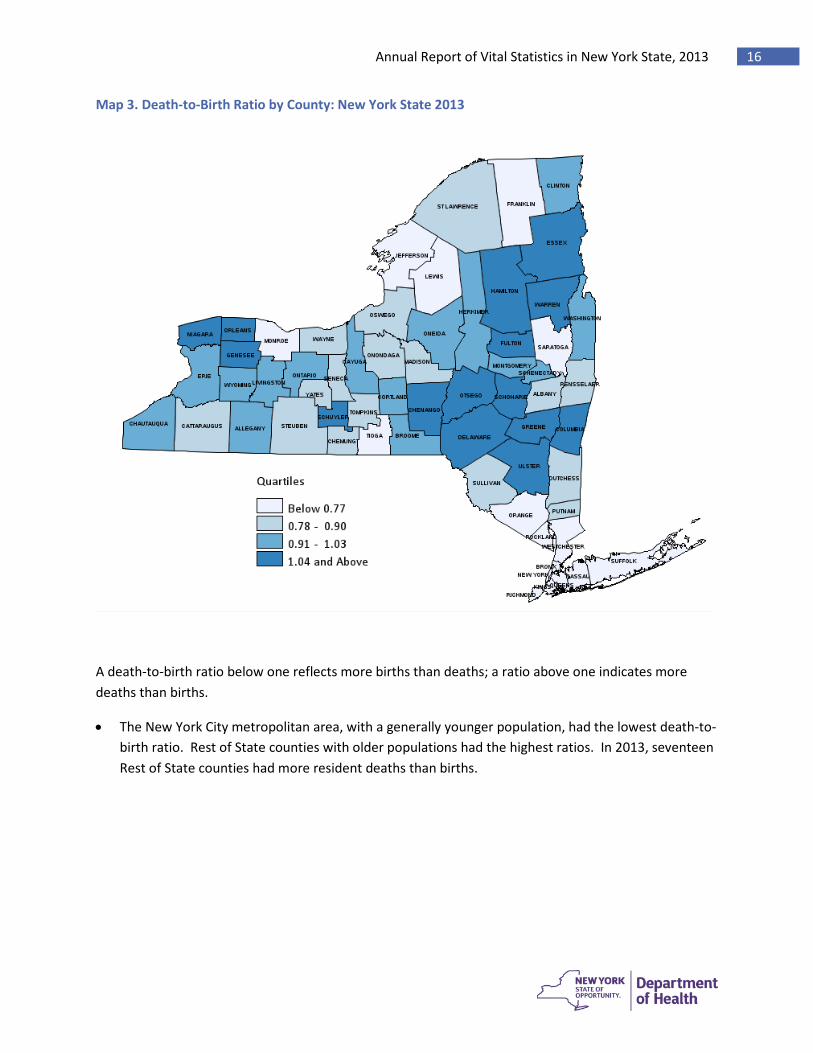
Map 3. Death-to-Birth Ratio by County: New York State 2013
A death-to-birth ratio below one reflects more births than deaths; a ratio above one indicates more deaths than births.
• The New York City metropolitan area, with a generally younger population, had the lowest death-to-birth ratio. Rest of State counties with older populations had the highest ratios. In 2013, seventeen Rest of State counties had more resident deaths than births.
Annual Report of Vital Statistics in New York State, 2013 17
Chapter 3. Pregnancies
• The number of lives births, and birth, pregnancy, and fertility rates in New York State have all declined since 2008.
• Total pregnancies and related outcomes have all declined from 2008 to 2013: teenage pregnancies and related outcomes have all declined to a greater extent than for all women combined.
• Over half of pregnancies resulting in a live birth during 2013 were insured by Medicaid, Family Health Plus or Child Health Plus.
• According to information provided on the birth certificate, approximately 7 in 10 of women in New York State received prenatal care in the first trimester, and less than 1 percent of women received no prenatal care.
• Nearly one quarter of mothers having a live birth in 2013 were overweight, and another one-fifth were obese.
• The number of women who self-reported smoking during pregnancy is declining. • Preterm births have declined since 2008 in all age and racial/ethnic groups. • In 2013, the large majority of newborns were fed either exclusively breast milk or breast
milk with formula. • The number of women who delivered vaginally after having a previous cesarean delivery
(VBAC) has increased while the number of primary cesarean deliveries has decreased over time.
• The rates of spontaneous fetal deaths have not changed substantially since 2008, but rates have been consistently highest among black non-Hispanic women
• The number of induced abortions and abortion ratios have decreased since 2008 in nearly all age and race/ethnicity groups with black women receiving the largest number of abortions each year.
Annual Report of Vital Statistics in New York State, 2013 18
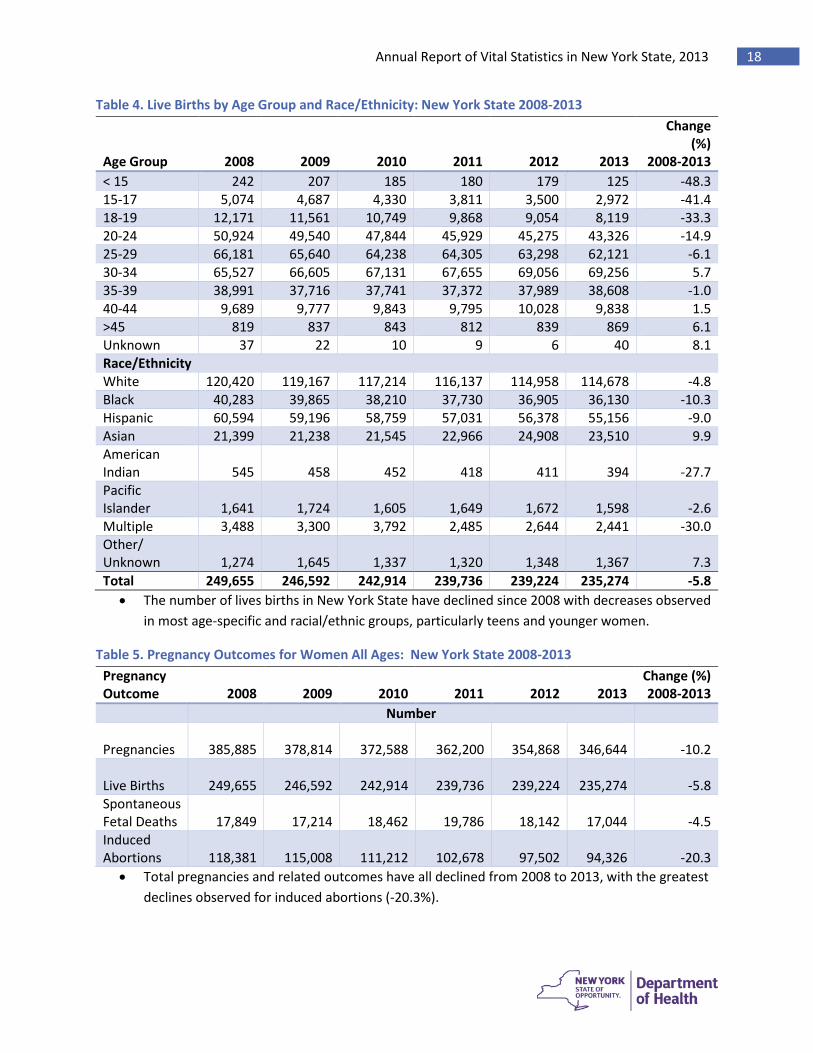
Table 4. Live Births by Age Group and Race/Ethnicity: New York State 2008-2013 Age Group
2008
2009
2010
2011
2012
2013
Change (%)
2008-2013 < 15 242 207 185 180 179 125 -48.3 15-17 5,074 4,687 4,330 3,811 3,500 2,972 -41.4 18-19 12,171 11,561 10,749 9,868 9,054 8,119 -33.3 20-24 50,924 49,540 47,844 45,929 45,275 43,326 -14.9 25-29 66,181 65,640 64,238 64,305 63,298 62,121 -6.1 30-34 65,527 66,605 67,131 67,655 69,056 69,256 5.7 35-39 38,991 37,716 37,741 37,372 37,989 38,608 -1.0 40-44 9,689 9,777 9,843 9,795 10,028 9,838 1.5 >45 819 837 843 812 839 869 6.1 Unknown 37 22 10 9 6 40 8.1 Race/Ethnicity White 120,420 119,167 117,214 116,137 114,958 114,678 -4.8 Black 40,283 39,865 38,210 37,730 36,905 36,130 -10.3 Hispanic 60,594 59,196 58,759 57,031 56,378 55,156 -9.0 Asian 21,399 21,238 21,545 22,966 24,908 23,510 9.9 American Indian
545
458
452
418
411
394
-27.7
Pacific Islander
1,641
1,724
1,605
1,649
1,672
1,598 -2.6
Multiple 3,488 3,300 3,792 2,485 2,644 2,441 -30.0 Other/ Unknown
1,274
1,645
1,337
1,320
1,348
1,367
7.3
Total 249,655 246,592 242,914 239,736 239,224 235,274 -5.8 • The number of lives births in New York State have declined since 2008 with decreases observed
in most age-specific and racial/ethnic groups, particularly teens and younger women.
Table 5. Pregnancy Outcomes for Women All Ages: New York State 2008-2013 Pregnancy Outcome
2008
2009
2010
2011
2012
2013
Change (%) 2008-2013
Number Pregnancies
385,885
378,814
372,588
362,200
354,868
346,644
-10.2
Live Births
249,655
246,592
242,914
239,736
239,224
235,274
-5.8
Spontaneous Fetal Deaths
17,849
17,214
18,462
19,786
18,142
17,044
-4.5
Induced Abortions
118,381
115,008
111,212
102,678
97,502
94,326
-20.3
• Total pregnancies and related outcomes have all declined from 2008 to 2013, with the greatest declines observed for induced abortions (-20.3%).
Annual Report of Vital Statistics in New York State, 2013 19
Table 6. Teenage1 Pregnancy Outcomes: New York State 2008-2013 Pregnancy Outcome
2008
2009
2010
2011
2012
2013
Change (%) 2008-2013
Number Pregnancies
39,312
37,058
34,277
30,315
26,922
23,549
-40.1
Live Births
17,487
16,455
15,264
13,859
12,733
11,216
-35.9
Spontaneous Fetal Deaths
1,103
947
1,128
1,071
896
724
-34.4
Induced Abortions
20,722
19,656
17,885
15,385
13,293
11,609
-45.0
1 Teenage includes ages 10-19 years.
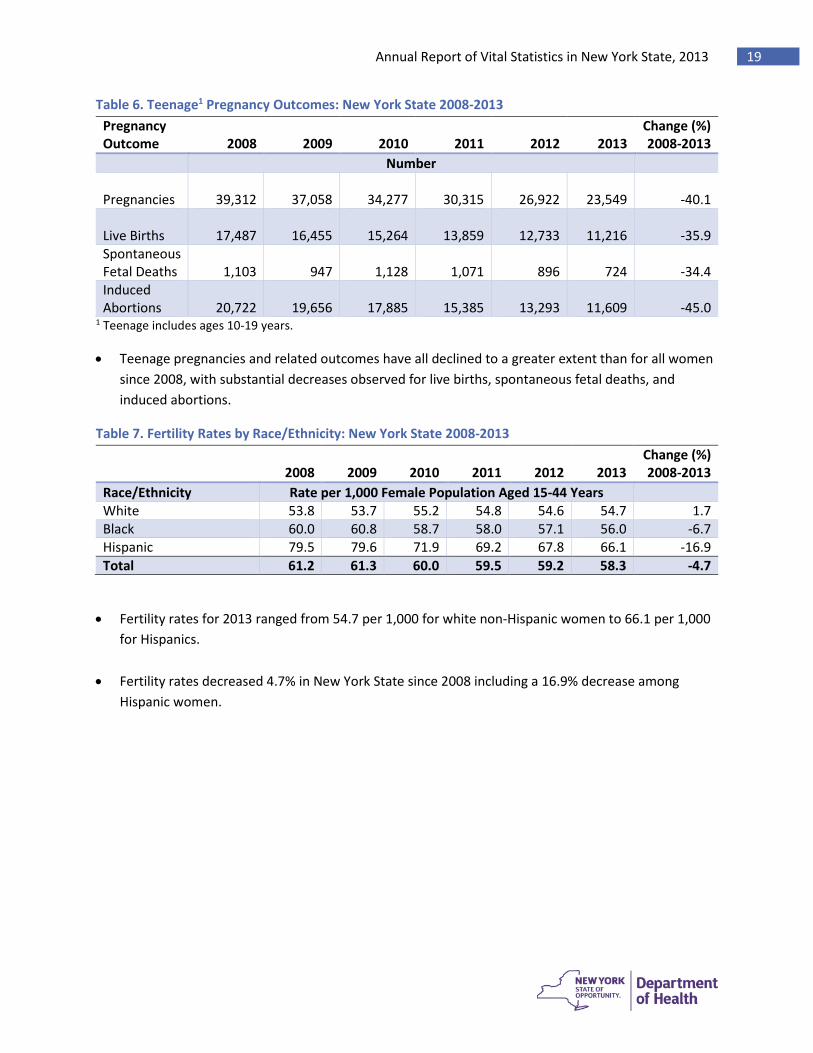
• Teenage pregnancies and related outcomes have all declined to a greater extent than for all women since 2008, with substantial decreases observed for live births, spontaneous fetal deaths, and induced abortions.
Table 7. Fertility Rates by Race/Ethnicity: New York State 2008-2013
• Fertility rates for 2013 ranged from 54.7 per 1,000 for white non-Hispanic women to 66.1 per 1,000 for Hispanics.
• Fertility rates decreased 4.7% in New York State since 2008 including a 16.9% decrease among Hispanic women.
2008
2009
2010
2011
2012
2013
Change (%) 2008-2013
Race/Ethnicity Rate per 1,000 Female Population Aged 15-44 Years White 53.8 53.7 55.2 54.8 54.6 54.7 1.7 Black 60.0 60.8 58.7 58.0 57.1 56.0 -6.7 Hispanic 79.5 79.6 71.9 69.2 67.8 66.1 -16.9 Total 61.2 61.3 60.0 59.5 59.2 58.3 -4.7
Annual Report of Vital Statistics in New York State, 2013 20
Table 8. Pregnancy Rates by Age Group and Race/Ethnicity: New York State 2008-2013
2008
2009
2010
2011
2012
2013
Change (%) 2008-2013
Age Group Rate per 1,000 Female Population Aged 15-44 Years <15 1.4 1.4 1.3 1.0 1.0 0.8 -42.9 15-17 33.3 31.4 28.5 25.3 22.6 19.3 -42.0 18-19 86.3 85.6 80.3 74.7 66.4 60.4 -30.0 20-24 128.8 130.7 122.4 115.3 110.3 105.7 -17.9 25-29 151.0 143.7 136.0 132.4 128.0 124.1 -17.8 30-34 140.1 138.0 137.1 134.4 133.6 131.2 -6.4 35-39 78.3 78.4 80.0 82.0 82.6 82.7 5.6 40-44 20.9 21.4 22.0 21.9 22.4 22.5 7.7 >45 1.8 1.8 1.9 1.8 1.9 2.0 11.1 Race/Ethnicity White 67.6 66.9 68.1 67.8 67.6 67.5 0.2 Black 133.2 134.4 130.6 123.0 116.5 112.6 -0.1 Hispanic 125.9 127.0 114.5 106.1 102.5 99.7 -15.5 Total 94.7 94.2 92.0 89.8 87.9 85.9 -9.3
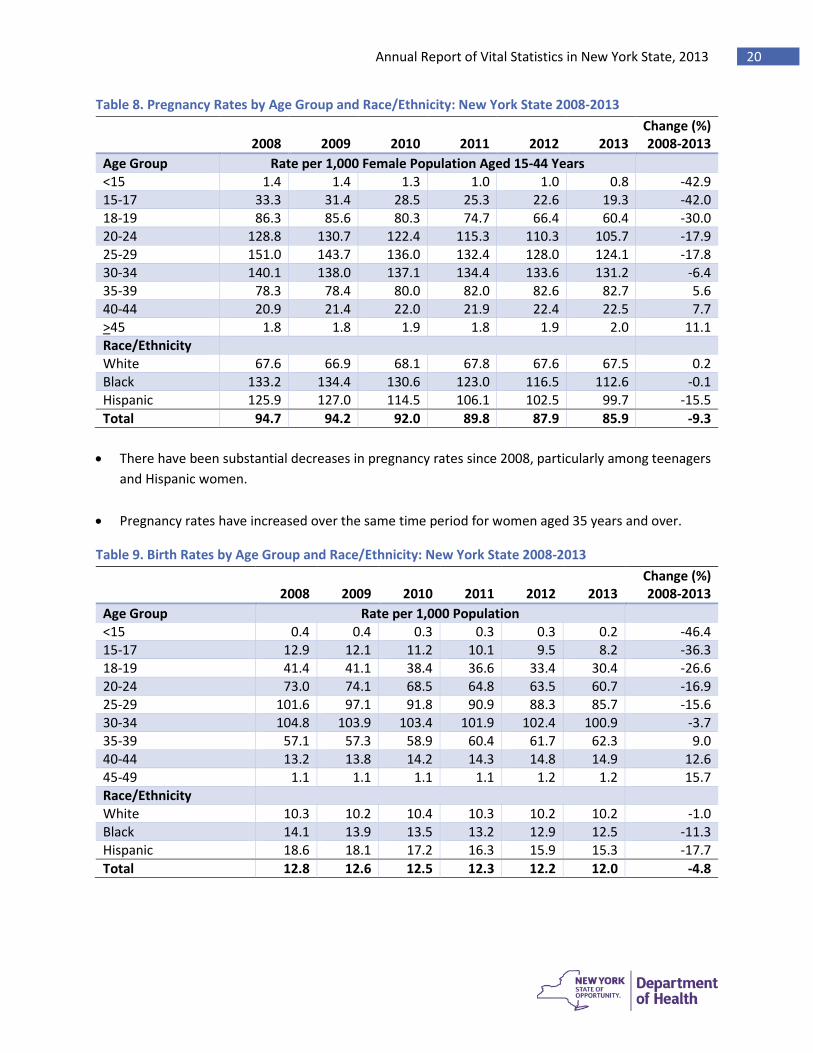
• There have been substantial decreases in pregnancy rates since 2008, particularly among teenagers
and Hispanic women.
• Pregnancy rates have increased over the same time period for women aged 35 years and over.
Table 9. Birth Rates by Age Group and Race/Ethnicity: New York State 2008-2013
2008
2009
2010
2011
2012
2013
Change (%) 2008-2013
Age Group Rate per 1,000 Population <15 0.4 0.4 0.3 0.3 0.3 0.2 -46.4 15-17 12.9 12.1 11.2 10.1 9.5 8.2 -36.3 18-19 41.4 41.1 38.4 36.6 33.4 30.4 -26.6 20-24 73.0 74.1 68.5 64.8 63.5 60.7 -16.9 25-29 101.6 97.1 91.8 90.9 88.3 85.7 -15.6 30-34 104.8 103.9 103.4 101.9 102.4 100.9 -3.7 35-39 57.1 57.3 58.9 60.4 61.7 62.3 9.0 40-44 13.2 13.8 14.2 14.3 14.8 14.9 12.6 45-49 1.1 1.1 1.1 1.1 1.2 1.2 15.7 Race/Ethnicity White 10.3 10.2 10.4 10.3 10.2 10.2 -1.0 Black 14.1 13.9 13.5 13.2 12.9 12.5 -11.3 Hispanic 18.6 18.1 17.2 16.3 15.9 15.3 -17.7 Total 12.8 12.6 12.5 12.3 12.2 12.0 -4.8
Annual Report of Vital Statistics in New York State, 2013 21
• Birth rates have declined nearly 5% since 2008. As anticipated, the highest birth rates were observed among women aged 20-39 years. From 2008 to 2013, birth rates decreased among teenagers and increased among women aged 35-49 years.
• Birth rates for 2013 were highest (15.3 per 1,000) for Hispanics who also had the largest decrease in birth rates over the 2008-2013 time period declining by 17.7%.
Table 10. Live Birth Maternal Characteristics: New York State 2008-2013 Maternal Characteristics
2008
2009
2010
2011
2012
2013
Change (%) 2008-2013
Education Percent of All Live Births No High School Diploma 21.2 20.5 20.2 19.2 18.7 17.7 -16.2 High School Graduate 22.7 22.8 22.3 22.1 21.9 21.7 -4.3 Some College 24.7 24.5 24.3 24.7 24.7 24.7 0.2 Bachelor’s Degree 16.5 16.9 17.0 17.5 18.0 18.5 11.9 Master’s or Higher 14.2 14.6 15.6 16.0 16.2 16.7 18.2 Unknown 0.7 0.8 0.7 0.6 0.5 0.5 -25.8 Marriage Status Married 57.7 57.5 57.2 57.8 58.1 58.7 1.8 Unmarried 41.1 41.6 41.8 41.3 41.0 40.3 -1.9 Unknown 1.2 0.9 0.9 0.9 0.9 0.9 -21.0 Insurance Primary Payer Medicaid1 48.5 50.2 50.7 50.7 50.9 51.0 5.2 Private Insurance 46.4 45.2 44.6 44.8 44.5 44.7 -3.6 Self-Pay 1.8 1.7 1.7 1.6 1.6 1.6 -10.9 Other Commercial 2.3 2.1 1.9 1.9 2.0 1.9 -17.4 Not Stated 1.0 0.9 1.1 1.0 1.0 0.8 -21.2
1 Medicaid includes Family Health Plus and Child Health Plus.
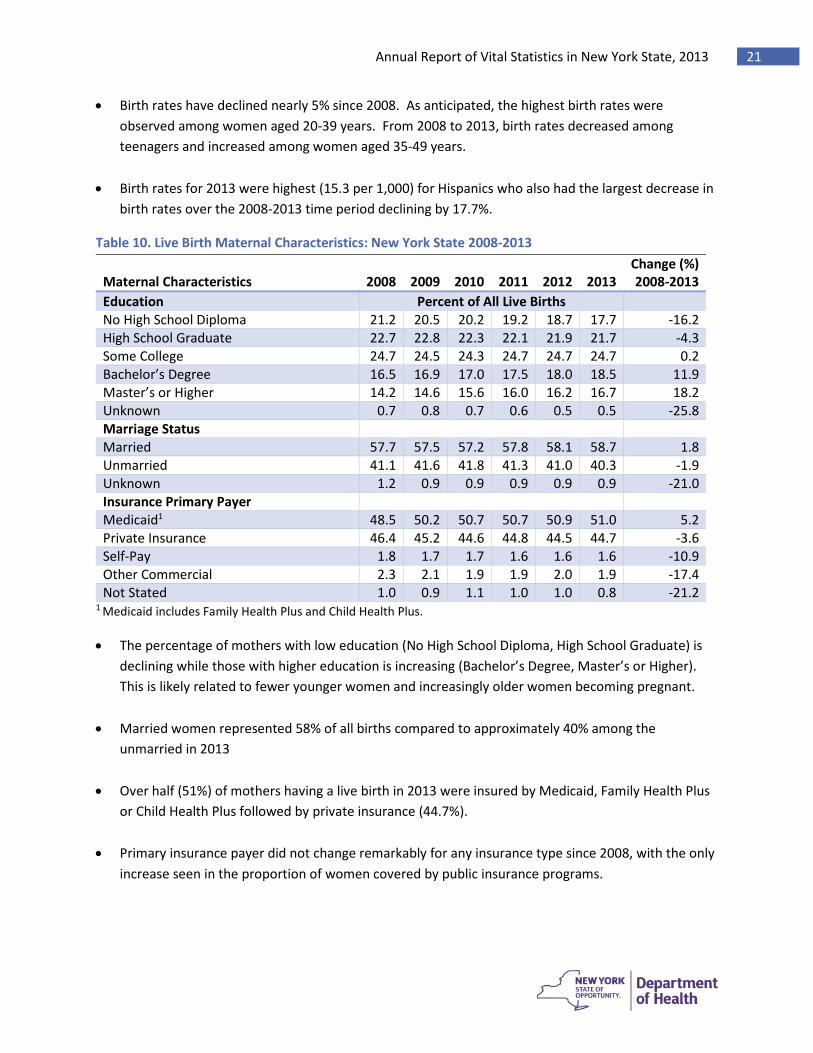
• The percentage of mothers with low education (No High School Diploma, High School Graduate) is declining while those with higher education is increasing (Bachelor’s Degree, Master’s or Higher). This is likely related to fewer younger women and increasingly older women becoming pregnant.
• Married women represented 58% of all births compared to approximately 40% among the unmarried in 2013
• Over half (51%) of mothers having a live birth in 2013 were insured by Medicaid, Family Health Plus or Child Health Plus followed by private insurance (44.7%).
• Primary insurance payer did not change remarkably for any insurance type since 2008, with the only increase seen in the proportion of women covered by public insurance programs.
Annual Report of Vital Statistics in New York State, 2013 22
Table 11. Live Birth Prenatal Characteristics: New York State 2008-2013 Prenatal Characteristics
2008
2009
2010
2011
2012
2013
Change (%) 2008-2013
Month Prenatal Care Began Percent of All Live Births 1st Trimester 66.3 67.5 69.7 69.7 71.8 72.7 9.6 2nd Trimester 20.2 19.9 20.0 20.5 20.0 18.9 -6.3 3rd trimester 4.7 4.5 4.8 4.6 4.8 5.1 9.2 None 1.0 0.7 0.7 0.7 0.6 0.6 -42.2 Not Stated 4.0 2.8 1.7 1.6 1.8 1.6 -60.1 Start Unknown 3.7 4.6 3.1 2.8 0.9 1.0 -72.8 Maternal Pre-Pregnancy BMI Underweight 4.3 4.3 4.1 4.2 4.4 4.2 -2.1 Normal 49.4 49.2 48.9 49.0 48.9 48.5 -1.8 Overweight 23.7 23.8 24.0 24.2 24.1 24.4 2.9 Obese 18.6 19.2 19.5 19.4 19.6 19.9 6.9 Unknown 4.0 3.4 3.5 3.2 3.1 3.1 -24.1 Smoking During Pregnancy1 Yes 6.8 6.6 6.3 6.0 5.9 5.6 -17.6
1 Smoking during pregnancy is likely under-reported on birth certificates.
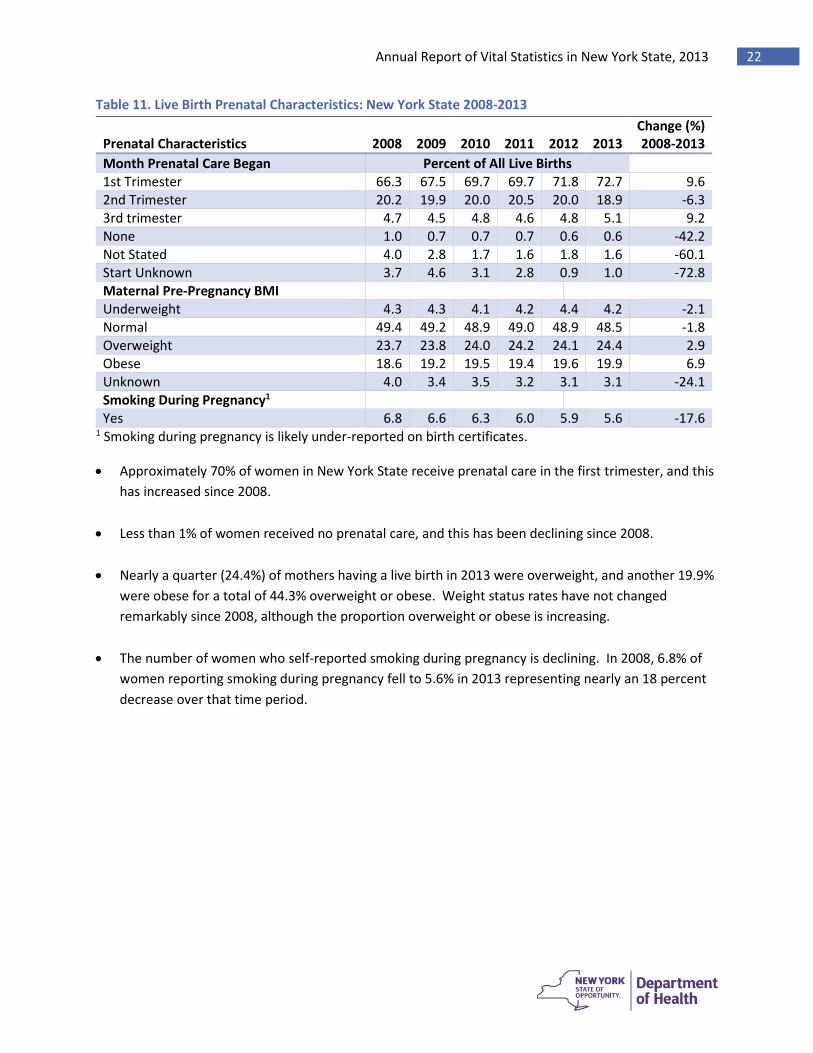
• Approximately 70% of women in New York State receive prenatal care in the first trimester, and this has increased since 2008.
• Less than 1% of women received no prenatal care, and this has been declining since 2008.
• Nearly a quarter (24.4%) of mothers having a live birth in 2013 were overweight, and another 19.9% were obese for a total of 44.3% overweight or obese. Weight status rates have not changed remarkably since 2008, although the proportion overweight or obese is increasing.
• The number of women who self-reported smoking during pregnancy is declining. In 2008, 6.8% of women reporting smoking during pregnancy fell to 5.6% in 2013 representing nearly an 18 percent decrease over that time period.
Annual Report of Vital Statistics in New York State, 2013 23
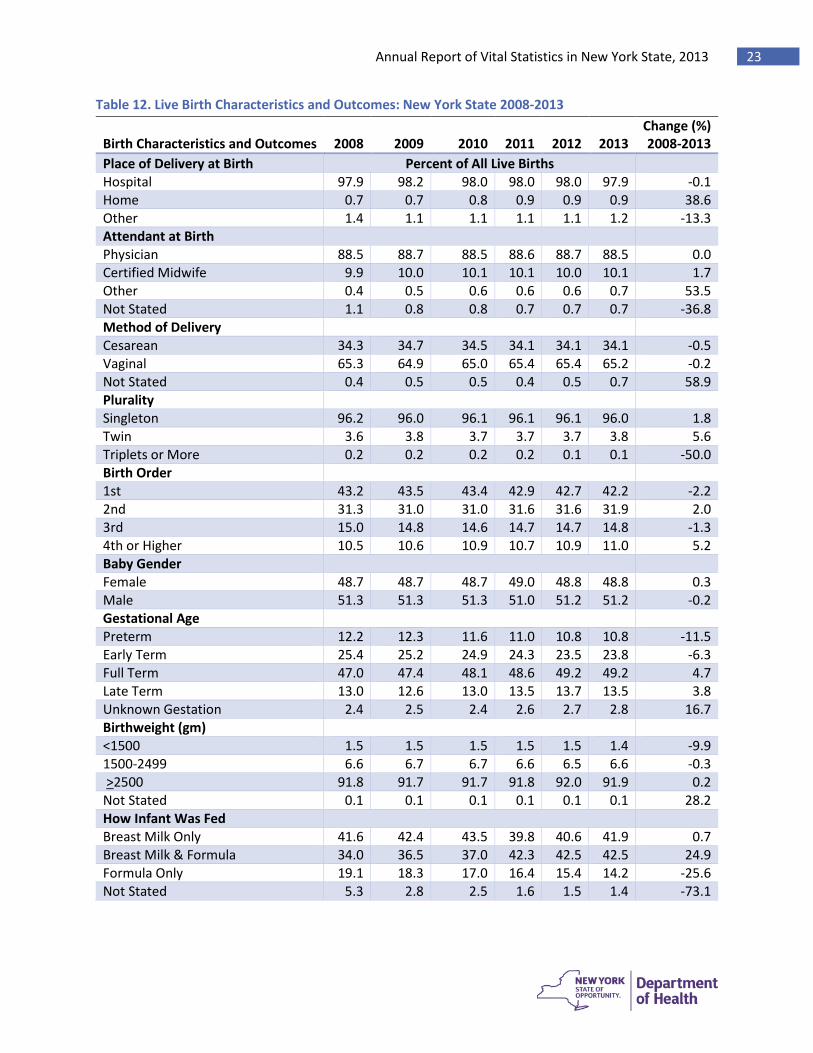
Table 12. Live Birth Characteristics and Outcomes: New York State 2008-2013
Birth Characteristics and Outcomes
2008
2009
2010
2011
2012
2013
Change (%) 2008-2013
Place of Delivery at Birth Percent of All Live Births Hospital 97.9 98.2 98.0 98.0 98.0 97.9 -0.1 Home 0.7 0.7 0.8 0.9 0.9 0.9 38.6 Other 1.4 1.1 1.1 1.1 1.1 1.2 -13.3 Attendant at Birth Physician 88.5 88.7 88.5 88.6 88.7 88.5 0.0 Certified Midwife 9.9 10.0 10.1 10.1 10.0 10.1 1.7 Other 0.4 0.5 0.6 0.6 0.6 0.7 53.5 Not Stated 1.1 0.8 0.8 0.7 0.7 0.7 -36.8 Method of Delivery Cesarean 34.3 34.7 34.5 34.1 34.1 34.1 -0.5 Vaginal 65.3 64.9 65.0 65.4 65.4 65.2 -0.2 Not Stated 0.4 0.5 0.5 0.4 0.5 0.7 58.9 Plurality Singleton 96.2 96.0 96.1 96.1 96.1 96.0 1.8 Twin 3.6 3.8 3.7 3.7 3.7 3.8 5.6 Triplets or More 0.2 0.2 0.2 0.2 0.1 0.1 -50.0 Birth Order 1st 43.2 43.5 43.4 42.9 42.7 42.2 -2.2 2nd 31.3 31.0 31.0 31.6 31.6 31.9 2.0 3rd 15.0 14.8 14.6 14.7 14.7 14.8 -1.3 4th or Higher 10.5 10.6 10.9 10.7 10.9 11.0 5.2 Baby Gender Female 48.7 48.7 48.7 49.0 48.8 48.8 0.3 Male 51.3 51.3 51.3 51.0 51.2 51.2 -0.2 Gestational Age Preterm 12.2 12.3 11.6 11.0 10.8 10.8 -11.5 Early Term 25.4 25.2 24.9 24.3 23.5 23.8 -6.3 Full Term 47.0 47.4 48.1 48.6 49.2 49.2 4.7 Late Term 13.0 12.6 13.0 13.5 13.7 13.5 3.8 Unknown Gestation 2.4 2.5 2.4 2.6 2.7 2.8 16.7 Birthweight (gm) <1500 1.5 1.5 1.5 1.5 1.5 1.4 -9.9 1500-2499 6.6 6.7 6.7 6.6 6.5 6.6 -0.3 >2500 91.8 91.7 91.7 91.8 92.0 91.9 0.2 Not Stated 0.1 0.1 0.1 0.1 0.1 0.1 28.2 How Infant Was Fed Breast Milk Only 41.6 42.4 43.5 39.8 40.6 41.9 0.7 Breast Milk & Formula 34.0 36.5 37.0 42.3 42.5 42.5 24.9 Formula Only 19.1 18.3 17.0 16.4 15.4 14.2 -25.6 Not Stated 5.3 2.8 2.5 1.6 1.5 1.4 -73.1
Annual Report of Vital Statistics in New York State, 2013 24
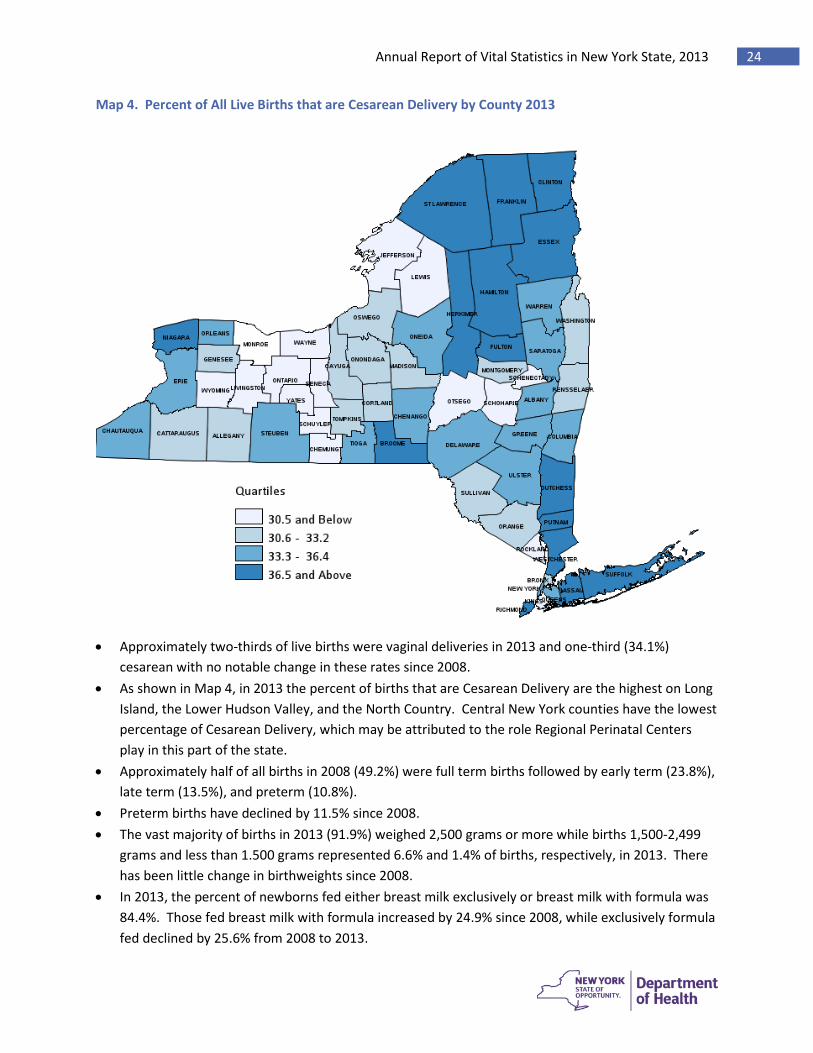
Map 4. Percent of All Live Births that are Cesarean Delivery by County 2013
• Approximately two-thirds of live births were vaginal deliveries in 2013 and one-third (34.1%) cesarean with no notable change in these rates since 2008.
• As shown in Map 4, in 2013 the percent of births that are Cesarean Delivery are the highest on Long Island, the Lower Hudson Valley, and the North Country. Central New York counties have the lowest percentage of Cesarean Delivery, which may be attributed to the role Regional Perinatal Centers play in this part of the state.
• Approximately half of all births in 2008 (49.2%) were full term births followed by early term (23.8%), late term (13.5%), and preterm (10.8%).
• Preterm births have declined by 11.5% since 2008. • The vast majority of births in 2013 (91.9%) weighed 2,500 grams or more while births 1,500-2,499
grams and less than 1.500 grams represented 6.6% and 1.4% of births, respectively, in 2013. There has been little change in birthweights since 2008.
• In 2013, the percent of newborns fed either breast milk exclusively or breast milk with formula was 84.4%. Those fed breast milk with formula increased by 24.9% since 2008, while exclusively formula fed declined by 25.6% from 2008 to 2013.
Annual Report of Vital Statistics in New York State, 2013 25
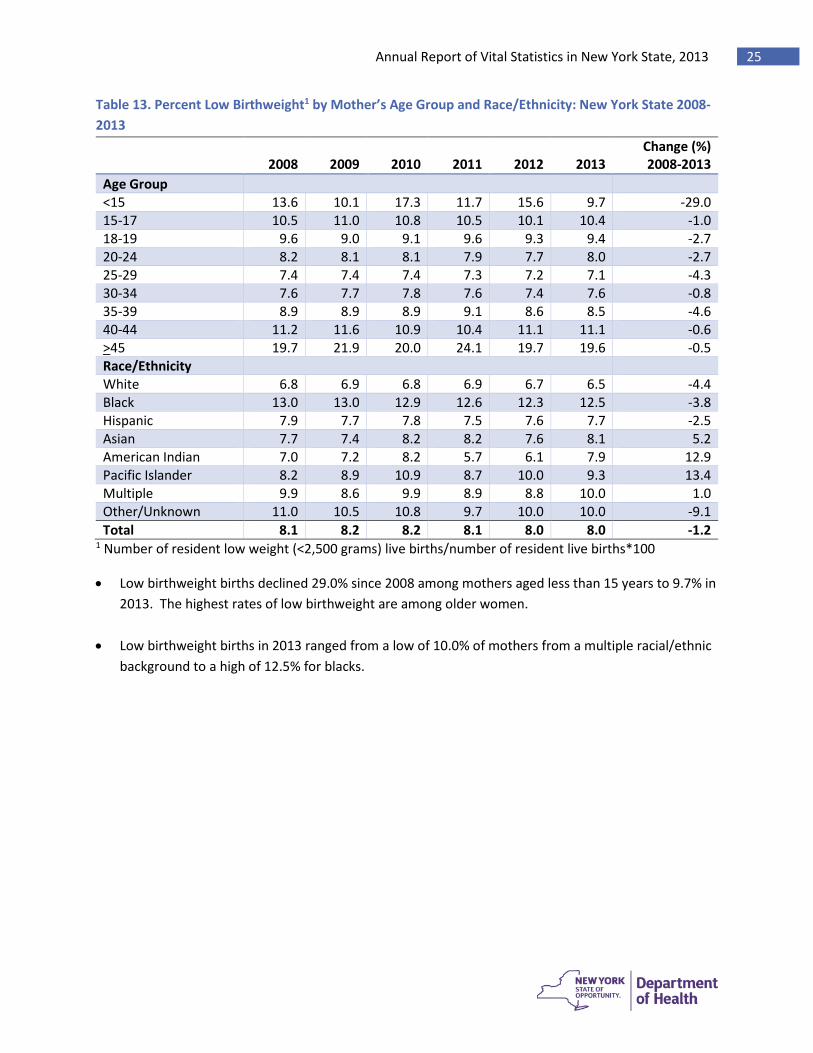
Table 13. Percent Low Birthweight1 by Mother’s Age Group and Race/Ethnicity: New York State 2008-2013
1 Number of resident low weight (<2,500 grams) live births/number of resident live births*100
• Low birthweight births declined 29.0% since 2008 among mothers aged less than 15 years to 9.7% in 2013. The highest rates of low birthweight are among older women.
• Low birthweight births in 2013 ranged from a low of 10.0% of mothers from a multiple racial/ethnic background to a high of 12.5% for blacks.
2008
2009
2010
2011
2012
2013
Change (%) 2008-2013
Age Group <15 13.6 10.1 17.3 11.7 15.6 9.7 -29.0 15-17 10.5 11.0 10.8 10.5 10.1 10.4 -1.0 18-19 9.6 9.0 9.1 9.6 9.3 9.4 -2.7 20-24 8.2 8.1 8.1 7.9 7.7 8.0 -2.7 25-29 7.4 7.4 7.4 7.3 7.2 7.1 -4.3 30-34 7.6 7.7 7.8 7.6 7.4 7.6 -0.8 35-39 8.9 8.9 8.9 9.1 8.6 8.5 -4.6 40-44 11.2 11.6 10.9 10.4 11.1 11.1 -0.6 >45 19.7 21.9 20.0 24.1 19.7 19.6 -0.5 Race/Ethnicity White 6.8 6.9 6.8 6.9 6.7 6.5 -4.4 Black 13.0 13.0 12.9 12.6 12.3 12.5 -3.8 Hispanic 7.9 7.7 7.8 7.5 7.6 7.7 -2.5 Asian 7.7 7.4 8.2 8.2 7.6 8.1 5.2 American Indian 7.0 7.2 8.2 5.7 6.1 7.9 12.9 Pacific Islander 8.2 8.9 10.9 8.7 10.0 9.3 13.4 Multiple 9.9 8.6 9.9 8.9 8.8 10.0 1.0 Other/Unknown 11.0 10.5 10.8 9.7 10.0 10.0 -9.1 Total 8.1 8.2 8.2 8.1 8.0 8.0 -1.2
Annual Report of Vital Statistics in New York State, 2013 26
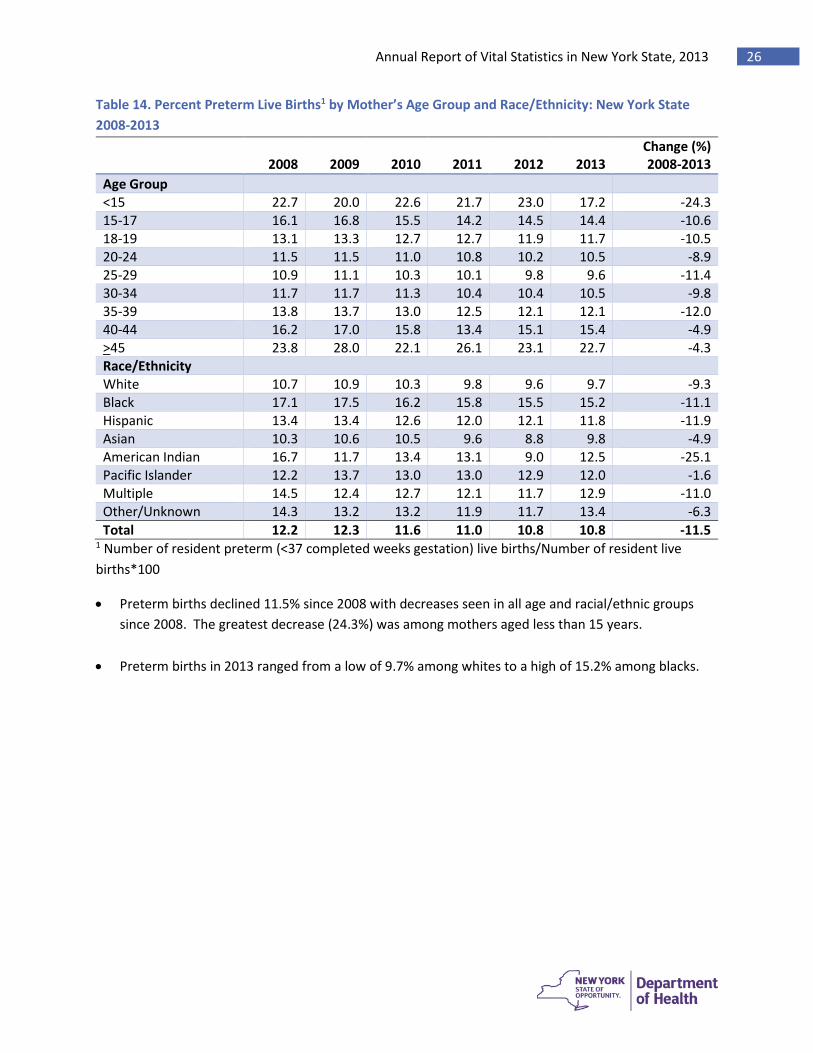
Table 14. Percent Preterm Live Births1 by Mother’s Age Group and Race/Ethnicity: New York State 2008-2013
1 Number of resident preterm (<37 completed weeks gestation) live births/Number of resident live births*100
• Preterm births declined 11.5% since 2008 with decreases seen in all age and racial/ethnic groups since 2008. The greatest decrease (24.3%) was among mothers aged less than 15 years.
• Preterm births in 2013 ranged from a low of 9.7% among whites to a high of 15.2% among blacks.
2008
2009
2010
2011
2012
2013
Change (%) 2008-2013
Age Group <15 22.7 20.0 22.6 21.7 23.0 17.2 -24.3 15-17 16.1 16.8 15.5 14.2 14.5 14.4 -10.6 18-19 13.1 13.3 12.7 12.7 11.9 11.7 -10.5 20-24 11.5 11.5 11.0 10.8 10.2 10.5 -8.9 25-29 10.9 11.1 10.3 10.1 9.8 9.6 -11.4 30-34 11.7 11.7 11.3 10.4 10.4 10.5 -9.8 35-39 13.8 13.7 13.0 12.5 12.1 12.1 -12.0 40-44 16.2 17.0 15.8 13.4 15.1 15.4 -4.9 >45 23.8 28.0 22.1 26.1 23.1 22.7 -4.3 Race/Ethnicity White 10.7 10.9 10.3 9.8 9.6 9.7 -9.3 Black 17.1 17.5 16.2 15.8 15.5 15.2 -11.1 Hispanic 13.4 13.4 12.6 12.0 12.1 11.8 -11.9 Asian 10.3 10.6 10.5 9.6 8.8 9.8 -4.9 American Indian 16.7 11.7 13.4 13.1 9.0 12.5 -25.1 Pacific Islander 12.2 13.7 13.0 13.0 12.9 12.0 -1.6 Multiple 14.5 12.4 12.7 12.1 11.7 12.9 -11.0 Other/Unknown 14.3 13.2 13.2 11.9 11.7 13.4 -6.3 Total 12.2 12.3 11.6 11.0 10.8 10.8 -11.5
Annual Report of Vital Statistics in New York State, 2013 27
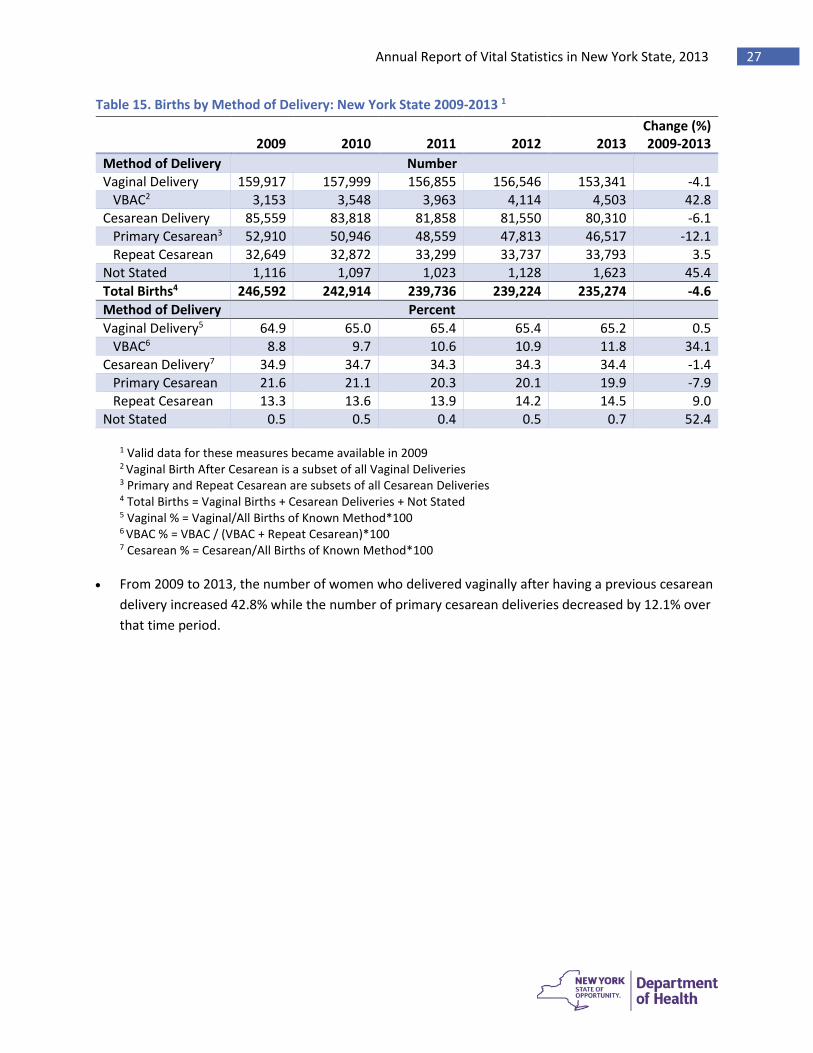
Table 15. Births by Method of Delivery: New York State 2009-2013 1
2009
2010
2011
2012
2013
Change (%) 2009-2013
Method of Delivery Number Vaginal Delivery 159,917 157,999 156,855 156,546 153,341 -4.1 VBAC2 3,153 3,548 3,963 4,114 4,503 42.8 Cesarean Delivery 85,559 83,818 81,858 81,550 80,310 -6.1 Primary Cesarean3 52,910 50,946 48,559 47,813 46,517 -12.1 Repeat Cesarean 32,649 32,872 33,299 33,737 33,793 3.5 Not Stated 1,116 1,097 1,023 1,128 1,623 45.4 Total Births4 246,592 242,914 239,736 239,224 235,274 -4.6 Method of Delivery Percent Vaginal Delivery5 64.9 65.0 65.4 65.4 65.2 0.5 VBAC6 8.8 9.7 10.6 10.9 11.8 34.1 Cesarean Delivery7 34.9 34.7 34.3 34.3 34.4 -1.4 Primary Cesarean 21.6 21.1 20.3 20.1 19.9 -7.9 Repeat Cesarean 13.3 13.6 13.9 14.2 14.5 9.0 Not Stated 0.5 0.5 0.4 0.5 0.7 52.4
1 Valid data for these measures became available in 2009 2 Vaginal Birth After Cesarean is a subset of all Vaginal Deliveries 3 Primary and Repeat Cesarean are subsets of all Cesarean Deliveries 4 Total Births = Vaginal Births + Cesarean Deliveries + Not Stated 5 Vaginal % = Vaginal/All Births of Known Method*100 6 VBAC % = VBAC / (VBAC + Repeat Cesarean)*100 7 Cesarean % = Cesarean/All Births of Known Method*100
• From 2009 to 2013, the number of women who delivered vaginally after having a previous cesarean delivery increased 42.8% while the number of primary cesarean deliveries decreased by 12.1% over that time period.
Annual Report of Vital Statistics in New York State, 2013 28
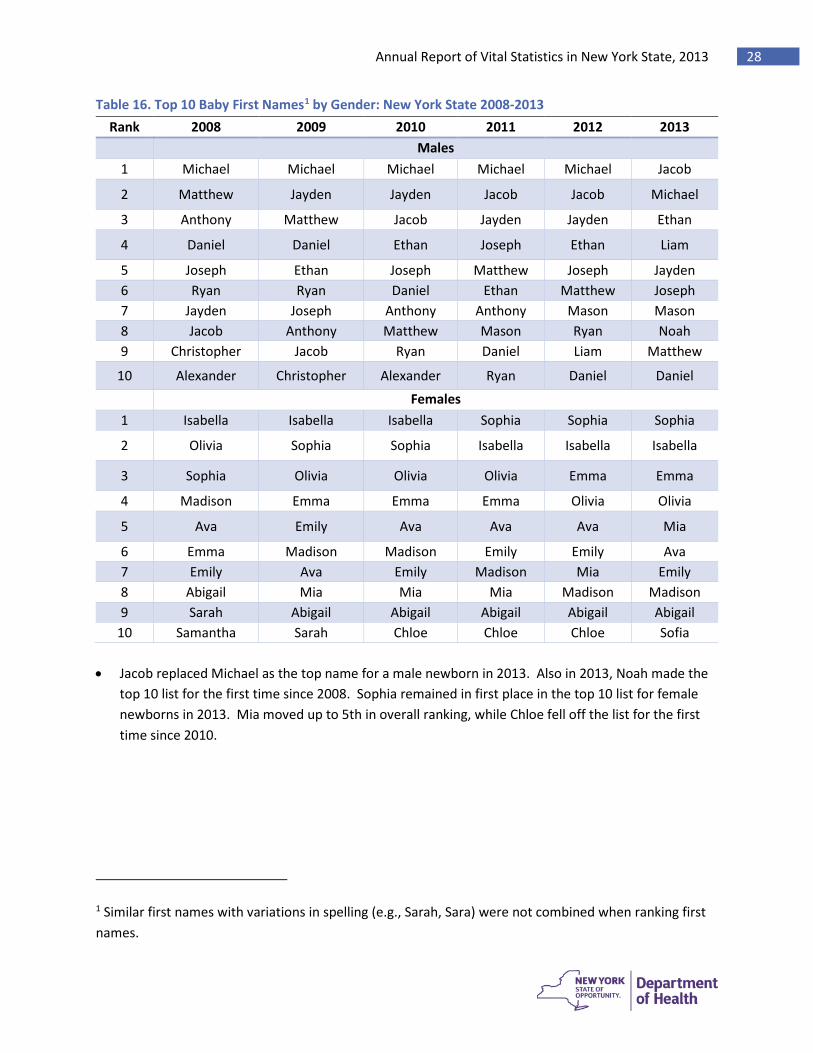
Table 16. Top 10 Baby First Names1 by Gender: New York State 2008-2013
• Jacob replaced Michael as the top name for a male newborn in 2013. Also in 2013, Noah made the
top 10 list for the first time since 2008. Sophia remained in first place in the top 10 list for female newborns in 2013. Mia moved up to 5th in overall ranking, while Chloe fell off the list for the first time since 2010.
1 Similar first names with variations in spelling (e.g., Sarah, Sara) were not combined when ranking first names.
Rank 2008 2009 2010 2011 2012 2013 Males
1 Michael Michael Michael Michael Michael Jacob
2 Matthew Jayden Jayden Jacob Jacob Michael
3 Anthony Matthew Jacob Jayden Jayden Ethan
4 Daniel Daniel Ethan Joseph Ethan Liam
5 Joseph Ethan Joseph Matthew Joseph Jayden 6 Ryan Ryan Daniel Ethan Matthew Joseph 7 Jayden Joseph Anthony Anthony Mason Mason 8 Jacob Anthony Matthew Mason Ryan Noah 9 Christopher Jacob Ryan Daniel Liam Matthew
10 Alexander Christopher Alexander Ryan Daniel Daniel
Females 1 Isabella Isabella Isabella Sophia Sophia Sophia
2 Olivia Sophia Sophia Isabella Isabella Isabella
3 Sophia Olivia Olivia Olivia Emma Emma
4 Madison Emma Emma Emma Olivia Olivia
5 Ava Emily Ava Ava Ava Mia
6 Emma Madison Madison Emily Emily Ava 7 Emily Ava Emily Madison Mia Emily 8 Abigail Mia Mia Mia Madison Madison 9 Sarah Abigail Abigail Abigail Abigail Abigail
10 Samantha Sarah Chloe Chloe Chloe Sofia
Annual Report of Vital Statistics in New York State, 2013 29
Spontaneous Fetal Deaths and Induced Abortions
• While the number of spontaneous fetal deaths declined in New York State since 2008, the
rate remained relatively constant. The highest spontaneous fetal death rates are among older women.
• The rates of spontaneous fetal deaths have not changed substantially since 2008, but rates have been consistently highest among black non-Hispanic women.
• The number of spontaneous fetal deaths later in pregnancy decreased 16.4% from 2008
to 2013, with mothers aged 18-24 years having the largest decline over that time period. • The rate of spontaneous fetal deaths later in pregnancy has decreased in all age groups,
with the exception of younger teens where increases were observed since 2008. • The number of spontaneous fetal deaths declined from 2008 to 2013 among white and
black non-Hispanics and Hispanics. However, the fetal death rate declined among whites, blacks, and Hispanics.
• The number of induced abortions decreased 20.3% since 2008. Over half of induced
abortions are for women between the ages of 20-29 years old. The largest decrease in induced abortions is seen in the teenage age groups under the age of 20 years.
• The abortion ratio has declined 15.3 percent since 2008 with decreases in nearly every
age group. • The number of induced abortions and abortion ratios decreased in all race/ethnicity
groups since 2008. • In the context of decreased ratios, black women received the largest number of abortions
and had the highest abortion ratio each year.
Annual Report of Vital Statistics in New York State, 2013 30
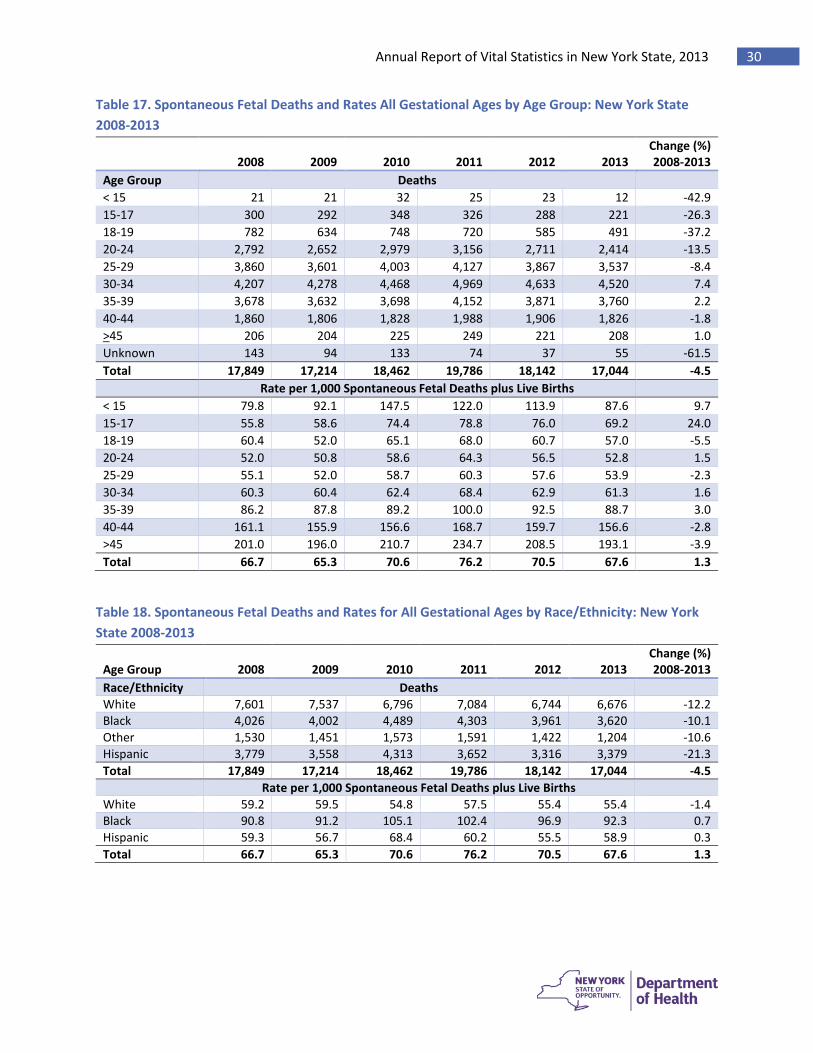
Table 17. Spontaneous Fetal Deaths and Rates All Gestational Ages by Age Group: New York State 2008-2013
Table 18. Spontaneous Fetal Deaths and Rates for All Gestational Ages by Race/Ethnicity: New York State 2008-2013
Age Group
2008
2009
2010
2011
2012
2013
Change (%) 2008-2013
Race/Ethnicity Deaths White 7,601 7,537 6,796 7,084 6,744 6,676 -12.2 Black 4,026 4,002 4,489 4,303 3,961 3,620 -10.1 Other 1,530 1,451 1,573 1,591 1,422 1,204 -10.6 Hispanic 3,779 3,558 4,313 3,652 3,316 3,379 -21.3 Total 17,849 17,214 18,462 19,786 18,142 17,044 -4.5 Rate per 1,000 Spontaneous Fetal Deaths plus Live Births White 59.2 59.5 54.8 57.5 55.4 55.4 -1.4 Black 90.8 91.2 105.1 102.4 96.9 92.3 0.7 Hispanic 59.3 56.7 68.4 60.2 55.5 58.9 0.3 Total 66.7 65.3 70.6 76.2 70.5 67.6 1.3
2008
2009
2010
2011
2012
2013
Change (%) 2008-2013
Age Group Deaths < 15 21 21 32 25 23 12 -42.9 15-17 300 292 348 326 288 221 -26.3 18-19 782 634 748 720 585 491 -37.2 20-24 2,792 2,652 2,979 3,156 2,711 2,414 -13.5 25-29 3,860 3,601 4,003 4,127 3,867 3,537 -8.4 30-34 4,207 4,278 4,468 4,969 4,633 4,520 7.4 35-39 3,678 3,632 3,698 4,152 3,871 3,760 2.2 40-44 1,860 1,806 1,828 1,988 1,906 1,826 -1.8 >45 206 204 225 249 221 208 1.0 Unknown 143 94 133 74 37 55 -61.5 Total 17,849 17,214 18,462 19,786 18,142 17,044 -4.5 Rate per 1,000 Spontaneous Fetal Deaths plus Live Births < 15 79.8 92.1 147.5 122.0 113.9 87.6 9.7 15-17 55.8 58.6 74.4 78.8 76.0 69.2 24.0 18-19 60.4 52.0 65.1 68.0 60.7 57.0 -5.5 20-24 52.0 50.8 58.6 64.3 56.5 52.8 1.5 25-29 55.1 52.0 58.7 60.3 57.6 53.9 -2.3 30-34 60.3 60.4 62.4 68.4 62.9 61.3 1.6 35-39 86.2 87.8 89.2 100.0 92.5 88.7 3.0 40-44 161.1 155.9 156.6 168.7 159.7 156.6 -2.8 >45 201.0 196.0 210.7 234.7 208.5 193.1 -3.9 Total 66.7 65.3 70.6 76.2 70.5 67.6 1.3
Annual Report of Vital Statistics in New York State, 2013 31
Table 19. Spontaneous Fetal Deaths and Rates for Gestational Age 20 Weeks and Over by Age Group: New York State 2008-2013
Table 20. Spontaneous Fetal Deaths and Rates for Gestational Age 20 Weeks and Over by Race/Ethnicity: New York State 2008-2013
2008
2009
2010
2011
2012
2013
Change (%) 2008-2013
Race/Ethnicity Deaths White 629 654 581 587 549 552 -12.2 Black 561 540 498 510 438 391 -30.3 Other 161 158 176 224 253 231 43.5 Hispanic 409 359 390 393 318 297 -27.4 Total 1,760 1,711 1,645 1,714 1,558 1,471 -16.4 Rate per 1,000 Spontaneous Fetal Deaths plus Live Births White 5.2 5.5 4.9 5.0 4.8 4.8 -8.3 Black 13.7 13.4 12.9 13.3 11.7 10.7 -21.9 Hispanic 6.8 6.0 6.6 6.8 5.6 5.4 -21.2 Total 7.0 6.9 6.7 7.1 6.5 6.2 -11.3
2008
2009
2010
2011
2012
2013
Change (%) 2008-2013
Age Group Deaths < 15 2 2 - 1 2 2 0.0 15-17 27 29 38 34 27 28 3.7 18-19 98 74 80 97 61 40 -59.2 20-24 362 349 338 337 295 269 -25.7 25-29 400 386 421 399 404 336 -16.0 30-34 407 438 399 433 368 380 -6.6 35-39 321 297 261 283 299 294 -8.4 40-44 110 117 92 115 89 103 -6.4 >45 18 12 9 14 11 14 -22.2 Unknown 15 7 7 1 2 5 -66.7 Total 1,760 1,711 1,645 1,714 1,558 1,471 -16.4 Rate per 1,000 Spontaneous Fetal Deaths plus Live Births < 15 8.2 9.6 0.0 5.5 11.0 15.7 92.1 15-17 5.3 6.1 8.7 8.8 7.7 9.3 76.3 18-19 8.0 6.4 7.4 9.7 6.7 4.9 -38.6 20-24 7.1 7.0 7.0 7.3 6.5 6.2 -12.6 25-29 6.0 5.8 6.5 6.2 6.3 5.4 -10.5 30-34 6.2 6.5 5.9 6.4 5.3 5.5 -11.6 35-39 8.2 7.8 6.9 7.5 7.8 7.6 -7.4 40-44 11.2 11.8 9.3 11.6 8.8 10.4 -7.7 >45 21.5 14.1 10.6 16.9 12.9 15.9 -26.3 Total 7.0 6.9 6.7 7.1 6.5 6.2 -11.3
Annual Report of Vital Statistics in New York State, 2013 32
Table 21. Induced Abortions and Birth-to-Abortion Ratios by Woman’s Age Group: New York State 2008-2013
Table 22. Induced Abortions and Ratios by Woman’s Race/Ethnicity: New York State 2008-2013
2008
2009
2010
2011
2012
2013 Change (%) 2008-2013
Race/Ethnicity Abortions White 24,738 23,865 23,047 21,178 22,169 21,359 -13.7 Black 48,319 47,181 45,134 40,070 36,633 34,960 -27.6 Other 13,110 12,300 12,511 14,670 7,634 8,477 -35.3 Hispanic 32,214 31,662 30,520 26,760 25,526 24,663 -23.4 Total 118,381 115,008 111,212 102,678 97,502 94,326 -20.3 Birth-to-Abortion Ratio White 204.6 200.3 196.6 187.5 192.8 187.5 -8.4 Black 1199.1 1183.5 1181.2 1062.0 992.6 982.5 -18.1 Other 228.9 219.1 212.8 256.7 247.2 271.6 18.7 Hispanic 537.8 534.9 519.4 469.2 452.8 456.5 -15.1 Total 474.2 466.6 457.8 428.3 40.8 401.5 -15.3
2008
2009
2010
2011
2012
2013
Change (%) 2008-2013
Age Group Abortions < 15 599 600 558 404 365 317 -47.1 15-17 7,713 7,173 6,355 5,409 4,543 3,780 -51.0 18-19 12,410 11,883 10,972 9,572 8,385 7,512 -39.5 20-24 36,095 35,231 34,713 32,601 30,648 29,700 -17.7 25-29 28,369 27,882 26,960 25,288 24,557 24,260 -14.5 30-34 17,889 17,591 17,440 16,592 16,380 16,261 -9.1 35-39 10,751 10,202 9,778 9,158 9,001 8,900 -17.2 40-44 3,740 3,604 3,597 3,294 3,247 3,212 -14.1 >45 343 357 319 271 293 316 -7.9 Unknown 472 485 520 89 83 68 -85.6 Total 118,381 115,008 111,212 102,678 97,502 94,326 -20.3 Birth-to-Abortion Ratio < 15 2,475.2 2,898.6 3,016.2 2,244.4 2,039.1 2,536.0 2.5 15-17 1,520.1 1,530.4 1,467.7 1,419.3 1,298.0 1,273.2 -16.2 18-19 1,019.6 1,027.9 1,020.7 970.0 926.1 925.9 -9.2 20-24 708.8 711.2 725.5 709.8 676.9 686.7 -3.1 25-29 428.7 424.8 419.7 393.3 388.0 391.1 -8.8 30-34 273.0 264.1 259.8 245.2 237.2 235.1 -13.9 35-39 275.7 270.5 259.1 245.0 236.9 230.9 -16.2 40-44 386.0 368.6 365.4 336.3 323.8 327.0 -15.3 >45 418.8 426.5 378.4 333.7 349.2 363.2 -13.3 Unknown 2,475.2 2,898.6 3,016.2 2,244.4 2,039.1 2,536.0 2.5 Total 474.2 466.4 457.8 428.3 407.6 401.5 -15.3

Annual Report of Vital Statistics in New York State, 2013 33
Chapter 4. Deaths
• Mortality rates have declined in New York State from 2004-2013 with decreases observed in all age, gender, and race/ethnicity groups.
• Infant, neonatal, post-neonatal, and perinatal deaths and rates have all been declining since 2004.
• Disorders related to preterm delivery and low birth weight are the most frequent cause of neonatal mortality, while congenital malformations and related conditions are the most common cause of death in the post-neonatal period.
• Diseases of the heart, malignant neoplasms, chronic lower respiratory disease, and cerebrovascular disease have been the top 4 underlying causes of death in New York State since 2004.
• Alzheimer’s disease, hypertension, influenza, suicide, cirrhosis of liver, accidents, diabetes, and septicemia have all seen increases in mortality rates.
• Suicide rates are on the increase in New York State with the rates highest among males and whites.
• Cancers of the lung and bronchus are the leading cause of deaths due to malignant neoplasms, followed by cancers of the breast, colon, and pancreas.
• Accidental poisoning is the leading external cause of death, followed by suicide, accidental fall, and motor vehicle accidents.
• Firearm-related deaths have remained stable over time, with the highest rates among males and blacks.
• Alcohol-related deaths have increased somewhat since 2004 with the largest increase occurring among whites.
• Opioid-related deaths have increased substantially from 2004-2013 with increases observed in both genders and the greatest increase among whites.
Annual Report of Vital Statistics in New York State, 2013 34
Mortality Trends 2004-2013
Table 23. Crude Mortality Rates by Age Group: New York State 2004-2013 Age Group
2004
2005
2006
2007
2008
2009
2010
2011
2012
2013
Change 2004-2013
(%)
Rate per 100,000 Population
<1
590.7
561.8
570.2
561.9
543.0
526.1
529.2
496.5
504.5
478.5
-19.0
1-9
16.3
16.6
15.8
16.3
16.4
14.7
13.4
14.7
13.9
14.7
-9.5
10-19
30.1
29.0
27.4
26.5
25.3
26.9
25.2
25.0
22.6
21.7
-27.9
20-24
67.1
75.7
67.7
61.6
61.7
64.9
66.6
64.7
64.2
61.6
-8.1
25-34
75.7
73.7
76.5
75.3
76.3
71.9
71.5
76.6
74.5
74.3
-1.8
35-44
161.6
156.6
155.3
150.6
143.8
140.2
133.9
134.0
129.4
129.6
-19.7
45-54
380.3
375.7
363.2
354.6
336.9
339.1
333.9
329.7
326.6
324.6
-14.6
55-64
818.6
790.7
781.7
771.2
757.0
733.4
738.0
724.1
728.0
708.0
-13.5
65-74
1,985.4
1,945.1
1,809.6
1,767.8
1,732.0
1,679.0
1,663.0
1,645.0
1,591.0
1,570.0
-20.9
75-84
4,771.4
4,631.3
4,625.7
4,578.8
4,504.0
4,363.3
4,285.0
4,296.0
4,212.0
4,121.0
-13.6
>85
13,158.6
12,981.1
12,778.6
12,358.4
12,344.0
12,509.7
12,799.0
12,777
12,624
12,448
-5.4
Total
787.7
785.1
765.4
759.7
758.2
741.8
747.8
755.7
753.1
750.5
-4.7
• Age-specific deaths rates have declined within each age since 2004. The crude mortality rate has decreased 4.7% from 2004 to 2013.
Annual Report of Vital Statistics in New York State, 2013 35
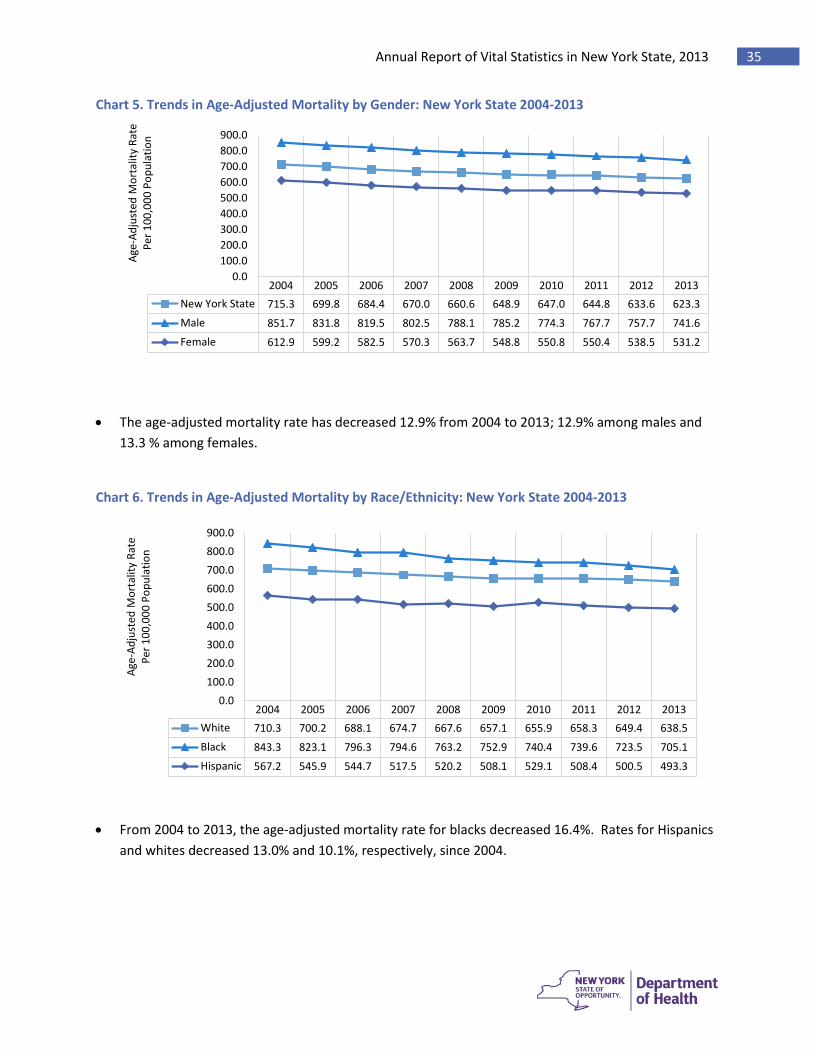
Chart 5. Trends in Age-Adjusted Mortality by Gender: New York State 2004-2013
• The age-adjusted mortality rate has decreased 12.9% from 2004 to 2013; 12.9% among males and 13.3 % among females.
Chart 6. Trends in Age-Adjusted Mortality by Race/Ethnicity: New York State 2004-2013
• From 2004 to 2013, the age-adjusted mortality rate for blacks decreased 16.4%. Rates for Hispanics and whites decreased 13.0% and 10.1%, respectively, since 2004.
2004 2005 2006 2007 2008 2009 2010 2011 2012 2013New York State 715.3 699.8 684.4 670.0 660.6 648.9 647.0 644.8 633.6 623.3Male 851.7 831.8 819.5 802.5 788.1 785.2 774.3 767.7 757.7 741.6Female 612.9 599.2 582.5 570.3 563.7 548.8 550.8 550.4 538.5 531.2
0.0100.0200.0300.0400.0500.0600.0700.0800.0900.0
Age-
Adju
sted
Mor
talit
y Ra
te
Per 1
00,0
00 P
opul
atio
n
2004 2005 2006 2007 2008 2009 2010 2011 2012 2013White 710.3 700.2 688.1 674.7 667.6 657.1 655.9 658.3 649.4 638.5Black 843.3 823.1 796.3 794.6 763.2 752.9 740.4 739.6 723.5 705.1Hispanic 567.2 545.9 544.7 517.5 520.2 508.1 529.1 508.4 500.5 493.3
0.0100.0200.0300.0400.0500.0600.0700.0800.0900.0
Age-
Adju
sted
Mor
talit
y Ra
te
Per 1
00,0
00 P
opul
atio
n
Annual Report of Vital Statistics in New York State, 2013 36
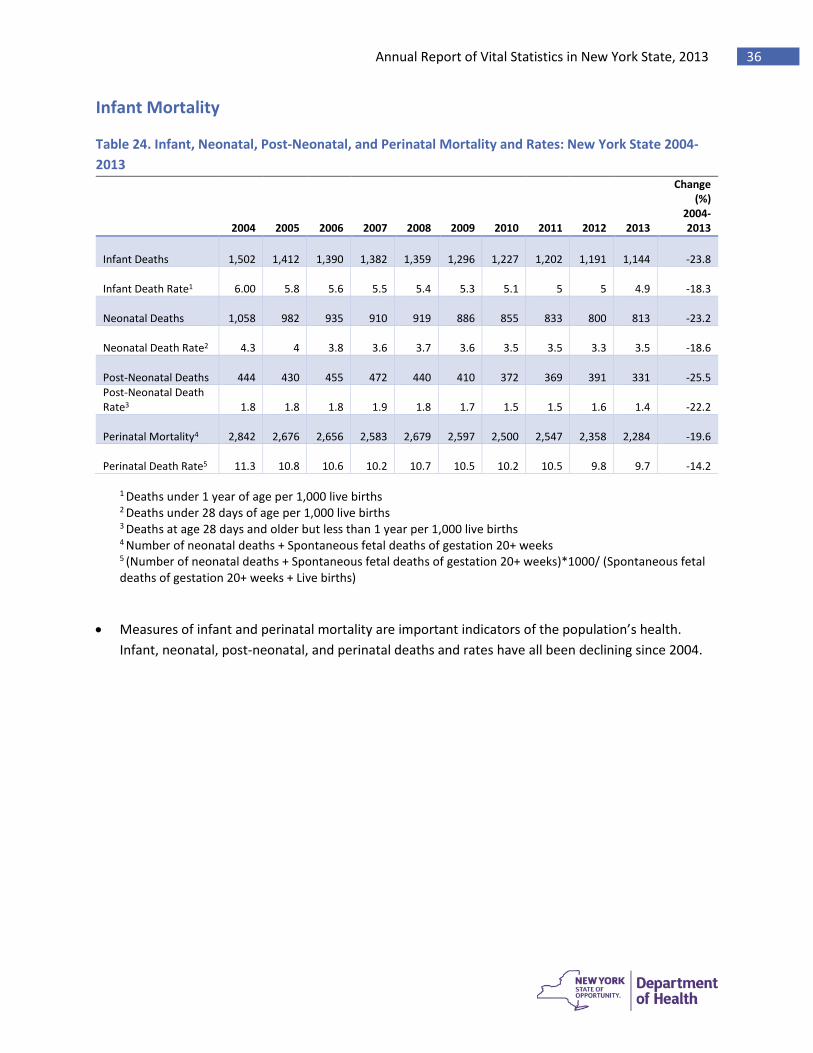
Infant Mortality
Table 24. Infant, Neonatal, Post-Neonatal, and Perinatal Mortality and Rates: New York State 2004-2013
2004 2005 2006 2007 2008 2009 2010 2011 2012 2013
Change (%)
2004-2013
Infant Deaths
1,502
1,412
1,390
1,382
1,359
1,296
1,227
1,202
1,191
1,144
-23.8
Infant Death Rate1
6.00 5.8 5.6 5.5 5.4 5.3 5.1 5 5 4.9
-18.3
Neonatal Deaths
1,058
982
935
910
919
886
855
833
800
813
-23.2 Neonatal Death Rate2 4.3 4 3.8 3.6 3.7 3.6 3.5 3.5 3.3 3.5
-18.6
Post-Neonatal Deaths 444 430 455 472 440 410 372 369 391 331
-25.5
Post-Neonatal Death Rate3 1.8 1.8 1.8 1.9 1.8 1.7 1.5 1.5 1.6 1.4
-22.2
Perinatal Mortality4
2,842
2,676
2,656
2,583
2,679
2,597
2,500
2,547
2,358
2,284
-19.6 Perinatal Death Rate5
11.3
10.8
10.6
10.2
10.7
10.5
10.2
10.5
9.8
9.7
-14.2
1 Deaths under 1 year of age per 1,000 live births 2 Deaths under 28 days of age per 1,000 live births 3 Deaths at age 28 days and older but less than 1 year per 1,000 live births 4 Number of neonatal deaths + Spontaneous fetal deaths of gestation 20+ weeks 5 (Number of neonatal deaths + Spontaneous fetal deaths of gestation 20+ weeks)*1000/ (Spontaneous fetal deaths of gestation 20+ weeks + Live births)
• Measures of infant and perinatal mortality are important indicators of the population’s health. Infant, neonatal, post-neonatal, and perinatal deaths and rates have all been declining since 2004.

Annual Report of Vital Statistics in New York State, 2013 37
Table 25. Infant Cause of Death: New York State 2013
Cause of Death
Neonatal
Post- Neonatal
Total Infant
N % N % N % Disorders related to short gestation and low birth weight, not elsewhere classified 233 28.7 11 3.3 244 21.3 Congenital malformations, deformations and chromosomal abnormalities 130 16.0 63 19.0 193 16.9 Cardiovascular disorders originating in the perinatal period 114 14.0 1 0.3 115 10.1 Newborn affected by maternal complications of pregnancy 51 6.3 0 0.0 51 4.5 Respiratory distress of newborn 36 4.4 0 0.0 36 3.1 Accidents (unintentional injuries) 6 0.7 26 7.9 32 2.8 Other respiratory conditions originating in the perinatal period 24 3.0 5 1.5 29 2.5 Newborn affected by complications of placenta, cord and membranes 25 3.1 1 0.3 26 2.3 Sudden infant death syndrome 3 0.4 23 6.9 26 2.3 Bacterial sepsis of newborn 24 3.0 1 0.3 25 2.2 Diarrhea and gastroenteritis of infectious origin 1 0.1 19 5.7 20 1.7 Diseases of the nervous system 6 0.7 14 4.2 20 1.7 Diseases of the circulatory system 3 0.4 13 3.9 16 1.4 Necrotizing enterocolitis of newborn 15 1.8 1 0.3 16 1.4 Neonatal hemorrhage 14 1.7 1 0.3 15 1.3 Intrauterine hypoxia and birth asphyxia 14 1.7 0 0.0 14 1.2 Influenza and pneumonia 0 0.0 11 3.3 11 1.0 Assault (homicide) 1 0.1 9 2.7 10 0.9 Endocrine, nutritional and metabolic diseases 4 0.5 6 1.8 10 0.9 Atelectasis 4 0.5 3 0.9 7 0.6 Diseases of the blood and blood-forming organs and certain disorders involving the immune mechanism 1 0.1 6 1.8 7 0.6 Diseases of the digestive system 4 0.5 3 0.9 7 0.6 Diseases of the genitourinary system 4 0.5 3 0.9 7 0.6 Neoplasms 6 0.7 1 0.3 7 0.6 Newborn affected by other complications of labor and delivery 5 0.6 0 0.0 5 0.4 Septicemia 1 0.1 3 0.9 4 0.3 Viral diseases 2 0.2 2 0.6 4 0.3 All Other Causes Combined 82 10.1 105 31.7 187 16.3 Total 813 100.0 331 100.0 1144 100.0
• Disorders related to preterm delivery and low birth weight are the most frequent cause of neonatal mortality, while congenital malformations and related conditions are the most common cause of death in the post-neonatal period.
Annual Report of Vital Statistics in New York State, 2013 38
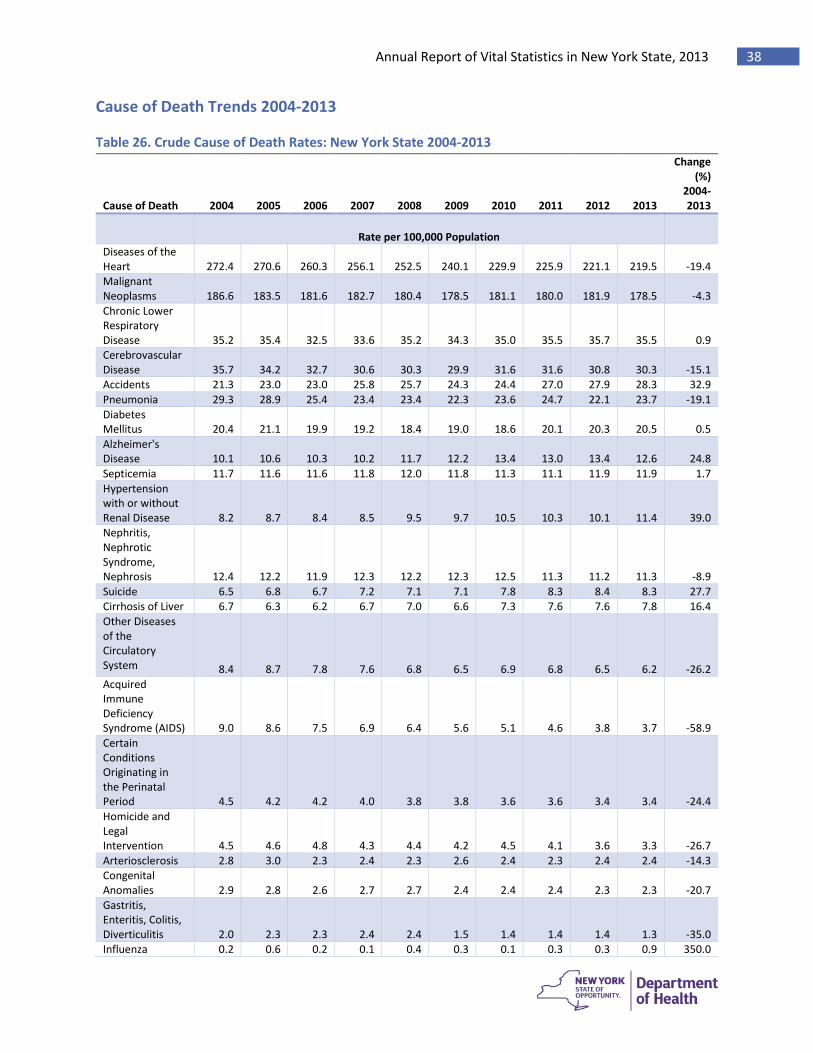
Cause of Death Trends 2004-2013
Table 26. Crude Cause of Death Rates: New York State 2004-2013
Cause of Death
2004
2005
2006
2007
2008
2009
2010
2011
2012
2013
Change (%)
2004-2013
Rate per 100,000 Population
Diseases of the Heart 272.4 270.6 260.3 256.1 252.5 240.1 229.9 225.9 221.1 219.5 -19.4 Malignant Neoplasms 186.6 183.5 181.6 182.7 180.4 178.5 181.1 180.0 181.9 178.5 -4.3 Chronic Lower Respiratory Disease 35.2 35.4 32.5 33.6 35.2 34.3 35.0 35.5 35.7 35.5 0.9 Cerebrovascular Disease 35.7 34.2 32.7 30.6 30.3 29.9 31.6 31.6 30.8 30.3 -15.1 Accidents 21.3 23.0 23.0 25.8 25.7 24.3 24.4 27.0 27.9 28.3 32.9 Pneumonia 29.3 28.9 25.4 23.4 23.4 22.3 23.6 24.7 22.1 23.7 -19.1 Diabetes Mellitus 20.4 21.1 19.9 19.2 18.4 19.0 18.6 20.1 20.3 20.5 0.5 Alzheimer's Disease 10.1 10.6 10.3 10.2 11.7 12.2 13.4 13.0 13.4 12.6 24.8 Septicemia 11.7 11.6 11.6 11.8 12.0 11.8 11.3 11.1 11.9 11.9 1.7 Hypertension with or without Renal Disease 8.2 8.7 8.4 8.5 9.5 9.7 10.5 10.3 10.1 11.4 39.0 Nephritis, Nephrotic Syndrome, Nephrosis 12.4 12.2 11.9 12.3 12.2 12.3 12.5 11.3 11.2 11.3 -8.9 Suicide 6.5 6.8 6.7 7.2 7.1 7.1 7.8 8.3 8.4 8.3 27.7 Cirrhosis of Liver 6.7 6.3 6.2 6.7 7.0 6.6 7.3 7.6 7.6 7.8 16.4 Other Diseases of the Circulatory System 8.4 8.7 7.8 7.6 6.8 6.5 6.9 6.8 6.5 6.2 -26.2 Acquired Immune Deficiency Syndrome (AIDS) 9.0 8.6 7.5 6.9 6.4 5.6 5.1 4.6 3.8 3.7 -58.9 Certain Conditions Originating in the Perinatal Period 4.5 4.2 4.2 4.0 3.8 3.8 3.6 3.6 3.4 3.4 -24.4 Homicide and Legal Intervention 4.5 4.6 4.8 4.3 4.4 4.2 4.5 4.1 3.6 3.3 -26.7 Arteriosclerosis 2.8 3.0 2.3 2.4 2.3 2.6 2.4 2.3 2.4 2.4 -14.3 Congenital Anomalies 2.9 2.8 2.6 2.7 2.7 2.4 2.4 2.4 2.3 2.3 -20.7 Gastritis, Enteritis, Colitis, Diverticulitis 2.0 2.3 2.3 2.4 2.4 1.5 1.4 1.4 1.4 1.3 -35.0 Influenza 0.2 0.6 0.2 0.1 0.4 0.3 0.1 0.3 0.3 0.9 350.0
Annual Report of Vital Statistics in New York State, 2013 39
Cause of Death
2004
2005
2006
2007
2008
2009
2010
2011
2012
2013
Change (%)
2004-2013
Complications of Pregnancy, Childbirth, and Puerperium 0.3 0.2 0.2 0.2 0.4 0.4 0.3 0.3 0.3 0.3 0.0 Sudden Infant Death Syndrome 0.2 0.3 0.3 0.3 0.4 0.3 0.2 0.2 0.2 0.2 0.0 Tuberculosis 0.2 0.2 0.2 0.2 0.2 0.2 0.2 0.3 0.1 0.1 -50.0
• Diseases of the heart, malignant neoplasms, chronic lower respiratory disease, and cerebrovascular disease have been the top 4 leading causes of death since 2004, but they are decreasing over time. The largest mortality rate decreases were seen for Sudden Infant Death Syndrome; AIDS; tuberculosis and other diseases of the circulatory system.
• Alzheimer’s disease, hypertension, influenza, suicide, cirrhosis of liver, accidents, diabetes, and septicemia have all seen increases in mortality rates since 2004.
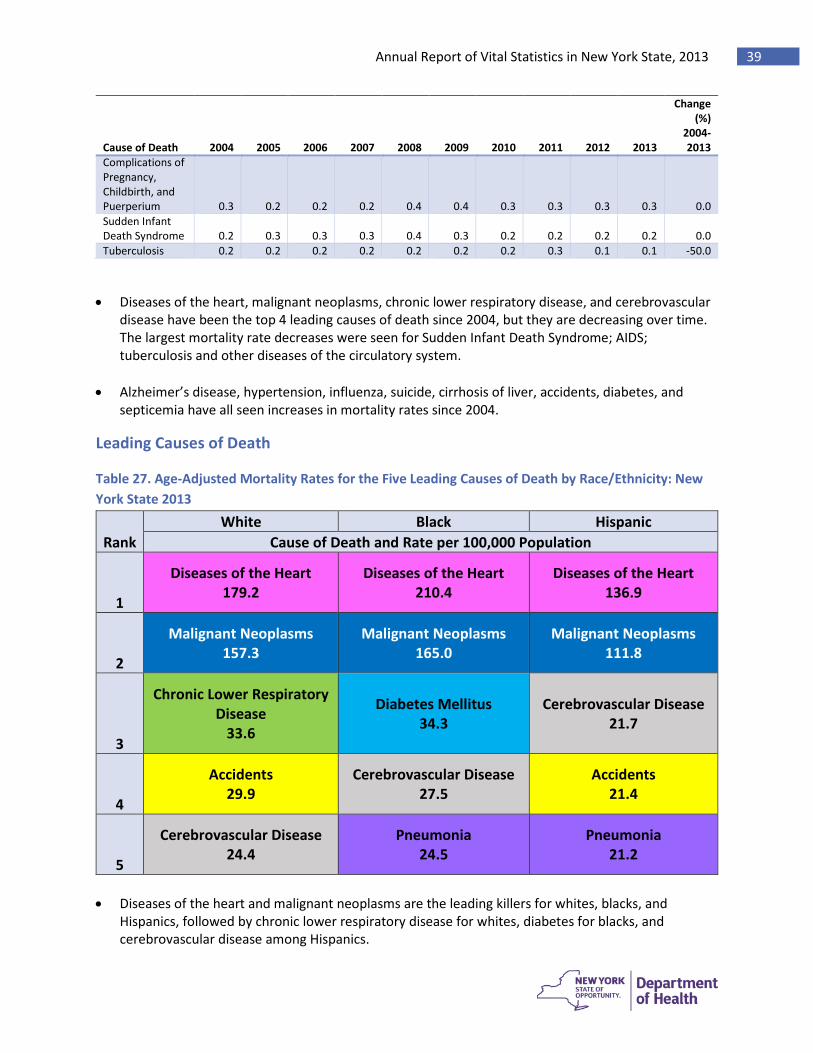
Leading Causes of Death
Table 27. Age-Adjusted Mortality Rates for the Five Leading Causes of Death by Race/Ethnicity: New York State 2013
Rank White Black Hispanic
Cause of Death and Rate per 100,000 Population
1
Diseases of the Heart 179.2
Diseases of the Heart 210.4
Diseases of the Heart 136.9
2
Malignant Neoplasms 157.3
Malignant Neoplasms 165.0
Malignant Neoplasms 111.8
3
Chronic Lower Respiratory Disease
33.6
Diabetes Mellitus 34.3
Cerebrovascular Disease 21.7
4
Accidents 29.9
Cerebrovascular Disease 27.5
Accidents 21.4
5
Cerebrovascular Disease 24.4
Pneumonia 24.5
Pneumonia 21.2
• Diseases of the heart and malignant neoplasms are the leading killers for whites, blacks, and Hispanics, followed by chronic lower respiratory disease for whites, diabetes for blacks, and cerebrovascular disease among Hispanics.
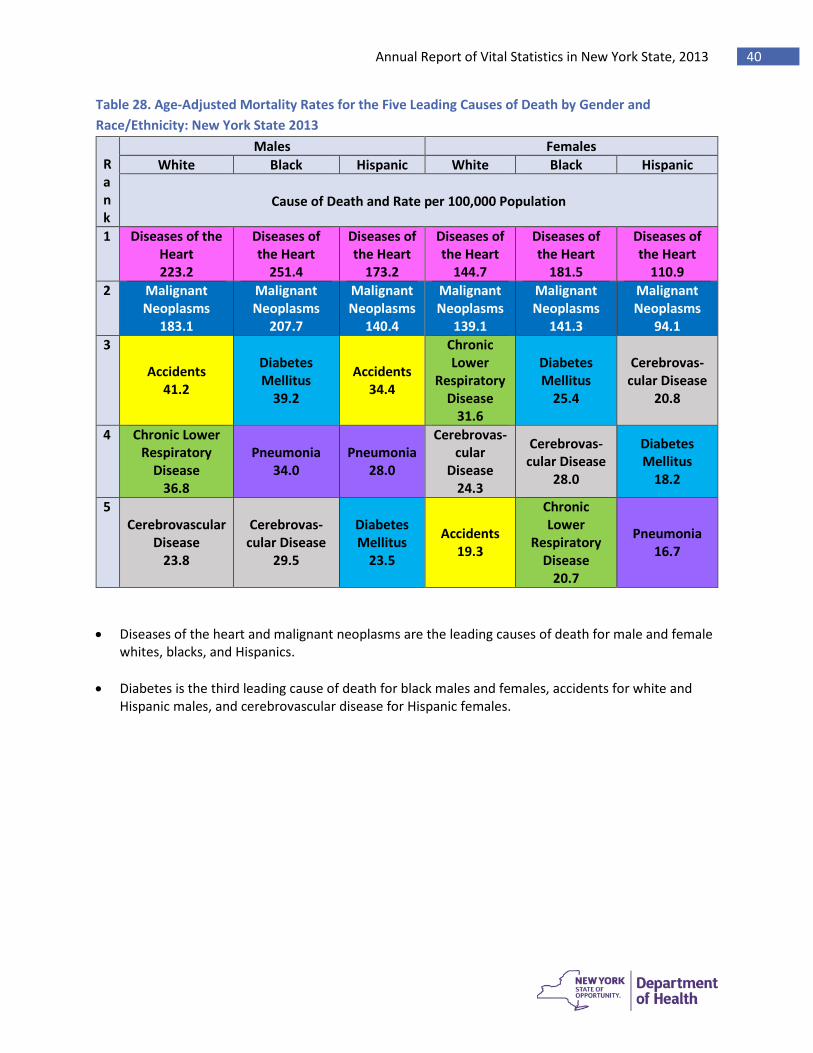
Annual Report of Vital Statistics in New York State, 2013 40
Table 28. Age-Adjusted Mortality Rates for the Five Leading Causes of Death by Gender and Race/Ethnicity: New York State 2013
Rank
Males Females White Black Hispanic White Black Hispanic
Cause of Death and Rate per 100,000 Population
1 Diseases of the Heart 223.2
Diseases of the Heart
251.4
Diseases of the Heart
173.2
Diseases of the Heart
144.7
Diseases of the Heart
181.5
Diseases of the Heart
110.9 2 Malignant
Neoplasms 183.1
Malignant Neoplasms
207.7
Malignant Neoplasms
140.4
Malignant Neoplasms
139.1
Malignant Neoplasms
141.3
Malignant Neoplasms
94.1 3
Accidents 41.2
Diabetes Mellitus
39.2
Accidents 34.4
Chronic Lower
Respiratory Disease
31.6
Diabetes Mellitus
25.4
Cerebrovas-cular Disease
20.8
4 Chronic Lower Respiratory
Disease 36.8
Pneumonia 34.0
Pneumonia 28.0
Cerebrovas-cular
Disease 24.3
Cerebrovas-cular Disease
28.0
Diabetes Mellitus
18.2
5 Cerebrovascular
Disease 23.8
Cerebrovas-cular Disease
29.5
Diabetes Mellitus
23.5
Accidents 19.3
Chronic Lower
Respiratory Disease
20.7
Pneumonia 16.7
• Diseases of the heart and malignant neoplasms are the leading causes of death for male and female whites, blacks, and Hispanics.
• Diabetes is the third leading cause of death for black males and females, accidents for white and Hispanic males, and cerebrovascular disease for Hispanic females.
Annual Report of Vital Statistics in New York State, 2013 41
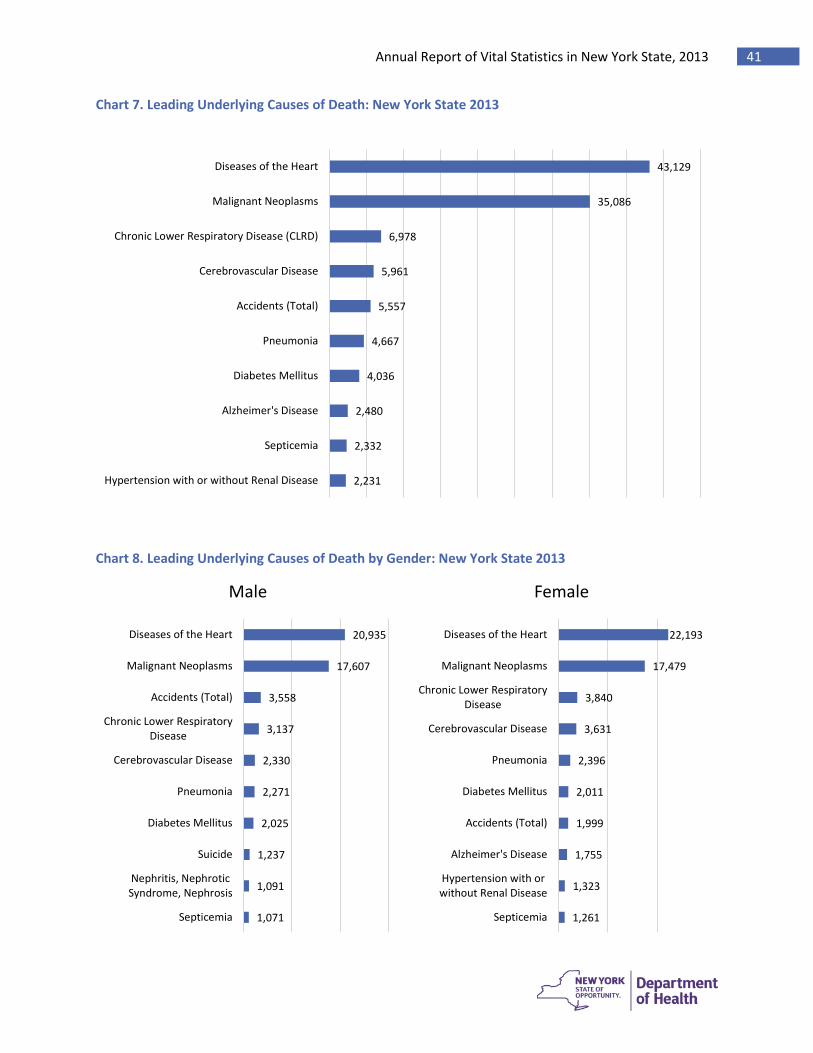
Chart 7. Leading Underlying Causes of Death: New York State 2013
Chart 8. Leading Underlying Causes of Death by Gender: New York State 2013
2,231
2,332
2,480
4,036
4,667
5,557
5,961
6,978
35,086
43,129
Hypertension with or without Renal Disease
Septicemia
Alzheimer's Disease
Diabetes Mellitus
Pneumonia
Accidents (Total)
Cerebrovascular Disease
Chronic Lower Respiratory Disease (CLRD)
Malignant Neoplasms
Diseases of the Heart
1,071
1,091
1,237
2,025
2,271
2,330
3,137
3,558
17,607
20,935
Septicemia
Nephritis, NephroticSyndrome, Nephrosis
Suicide
Diabetes Mellitus
Pneumonia
Cerebrovascular Disease
Chronic Lower RespiratoryDisease
Accidents (Total)
Malignant Neoplasms
Diseases of the Heart
Male
1,261
1,323
1,755
1,999
2,011
2,396
3,631
3,840
17,479
22,193
Septicemia
Hypertension with orwithout Renal Disease
Alzheimer's Disease
Accidents (Total)
Diabetes Mellitus
Pneumonia
Cerebrovascular Disease
Chronic Lower RespiratoryDisease
Malignant Neoplasms
Diseases of the Heart
Female

Annual Report of Vital Statistics in New York State, 2013 42
Chart 9. Leading Causes of Death (Any Mention of a Cause)1: New York State 2013
Chart 10. Leading Causes of Death (Any Mention of a Cause)1 by Gender: New York State 2013
1 Condition mentioned in any position in the Multiple Cause of Death file.
7,085
10,357
10,559
10,610
11,545
13,433
13,667
20,336
38,954
85,721
Accidents (Total)
Cerebrovascular Disease
Nephritis, Nephrotic Syndrome, Nephrosis
Septicemia
Pneumonia
Diabetes Mellitus
Chronic Lower Respiratory Disease (CLRD)
Hypertension with or without Renal Disease
Malignant Neoplasms
Diseases of the Heart
4,266
4,293
4,981
5,479
5,687
6,430
6,776
8,702
19,740
41,137
Cerebrovascular Disease
Accidents (Total)
Septicemia
Nephritis, NephroticSyndrome, Nephrosis
Pneumonia
Chronic Lower RespiratoryDisease
Diabetes Mellitus
Hypertension with orwithout Renal Disease
Malignant Neoplasms
Diseases of the Heart
Male
2,792
5,080
5,628
5,858
6,090
6,657
7,236
11,634
19,214
44,583
Accidents (Total)
Nephritis, NephroticSyndrome, Nephrosis
Septicemia
Pneumonia
CerebrovascularDisease
Diabetes Mellitus
Chronic LowerRespiratory Disease
Hypertension with orwithout Renal Disease
Malignant Neoplasms
Diseases of the Heart
Female
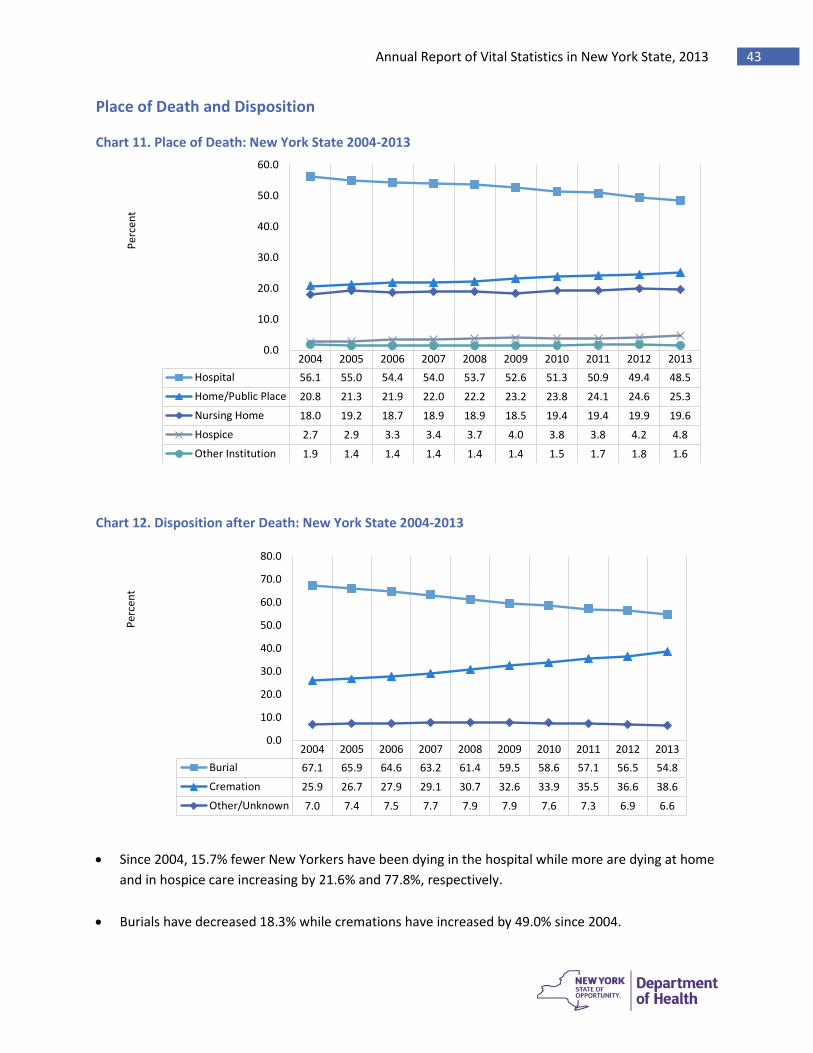
Annual Report of Vital Statistics in New York State, 2013 43
Place of Death and Disposition
Chart 11. Place of Death: New York State 2004-2013
Chart 12. Disposition after Death: New York State 2004-2013
• Since 2004, 15.7% fewer New Yorkers have been dying in the hospital while more are dying at home and in hospice care increasing by 21.6% and 77.8%, respectively.
• Burials have decreased 18.3% while cremations have increased by 49.0% since 2004.
2004 2005 2006 2007 2008 2009 2010 2011 2012 2013Hospital 56.1 55.0 54.4 54.0 53.7 52.6 51.3 50.9 49.4 48.5Home/Public Place 20.8 21.3 21.9 22.0 22.2 23.2 23.8 24.1 24.6 25.3Nursing Home 18.0 19.2 18.7 18.9 18.9 18.5 19.4 19.4 19.9 19.6Hospice 2.7 2.9 3.3 3.4 3.7 4.0 3.8 3.8 4.2 4.8Other Institution 1.9 1.4 1.4 1.4 1.4 1.4 1.5 1.7 1.8 1.6
0.0
10.0
20.0
30.0
40.0
50.0
60.0
Perc
ent
2004 2005 2006 2007 2008 2009 2010 2011 2012 2013Burial 67.1 65.9 64.6 63.2 61.4 59.5 58.6 57.1 56.5 54.8Cremation 25.9 26.7 27.9 29.1 30.7 32.6 33.9 35.5 36.6 38.6Other/Unknown 7.0 7.4 7.5 7.7 7.9 7.9 7.6 7.3 6.9 6.6
0.0
10.0
20.0
30.0
40.0
50.0
60.0
70.0
80.0
Perc
ent
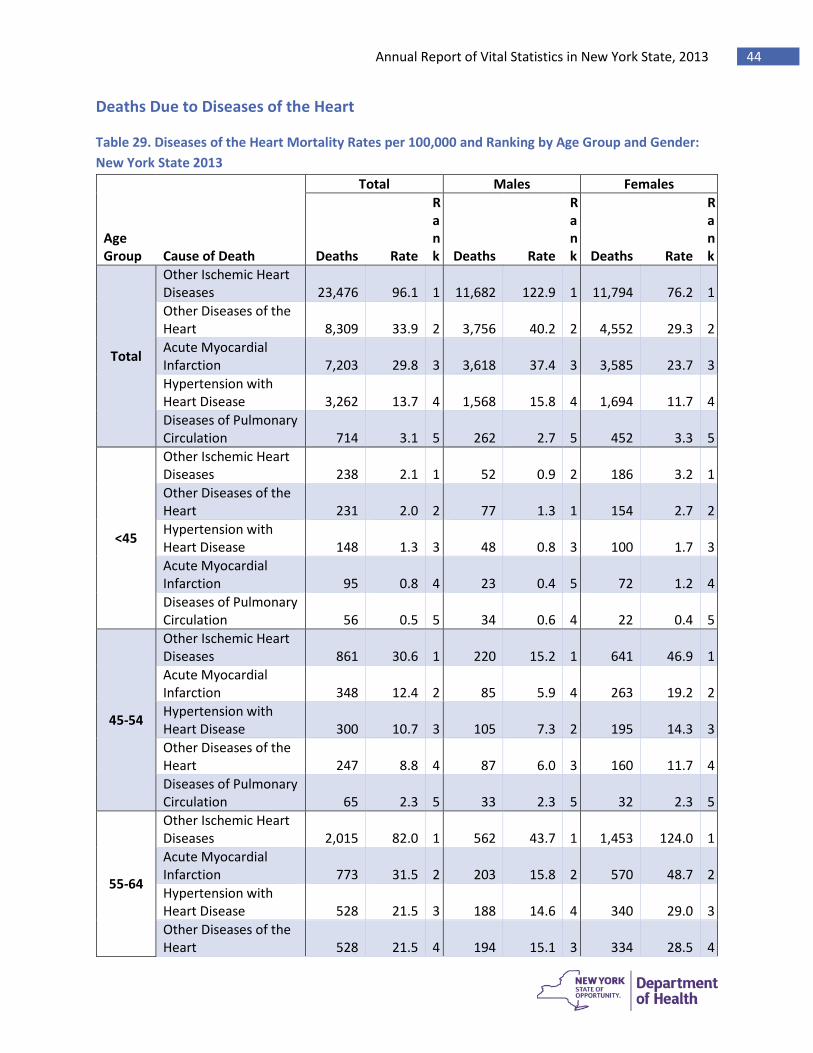
Annual Report of Vital Statistics in New York State, 2013 44
Deaths Due to Diseases of the Heart
Table 29. Diseases of the Heart Mortality Rates per 100,000 and Ranking by Age Group and Gender: New York State 2013
Age Group Cause of Death
Total Males Females
Deaths Rate
Rank Deaths Rate
Rank Deaths Rate
Rank
Total
Other Ischemic Heart Diseases 23,476 96.1 1 11,682 122.9 1 11,794 76.2 1 Other Diseases of the Heart 8,309 33.9 2 3,756 40.2 2 4,552 29.3 2 Acute Myocardial Infarction 7,203 29.8 3 3,618 37.4 3 3,585 23.7 3 Hypertension with Heart Disease 3,262 13.7 4 1,568 15.8 4 1,694 11.7 4 Diseases of Pulmonary Circulation 714 3.1 5 262 2.7 5 452 3.3 5
<45
Other Ischemic Heart Diseases 238 2.1 1 52 0.9 2 186 3.2 1 Other Diseases of the Heart 231 2.0 2 77 1.3 1 154 2.7 2 Hypertension with Heart Disease 148 1.3 3 48 0.8 3 100 1.7 3 Acute Myocardial Infarction 95 0.8 4 23 0.4 5 72 1.2 4 Diseases of Pulmonary Circulation 56 0.5 5 34 0.6 4 22 0.4 5
45-54
Other Ischemic Heart Diseases 861 30.6 1 220 15.2 1 641 46.9 1 Acute Myocardial Infarction 348 12.4 2 85 5.9 4 263 19.2 2 Hypertension with Heart Disease 300 10.7 3 105 7.3 2 195 14.3 3 Other Diseases of the Heart 247 8.8 4 87 6.0 3 160 11.7 4 Diseases of Pulmonary Circulation 65 2.3 5 33 2.3 5 32 2.3 5
55-64
Other Ischemic Heart Diseases 2,015 82.0 1 562 43.7 1 1,453 124.0 1 Acute Myocardial Infarction 773 31.5 2 203 15.8 2 570 48.7 2 Hypertension with Heart Disease 528 21.5 3 188 14.6 4 340 29.0 3 Other Diseases of the Heart 528 21.5 4 194 15.1 3 334 28.5 4
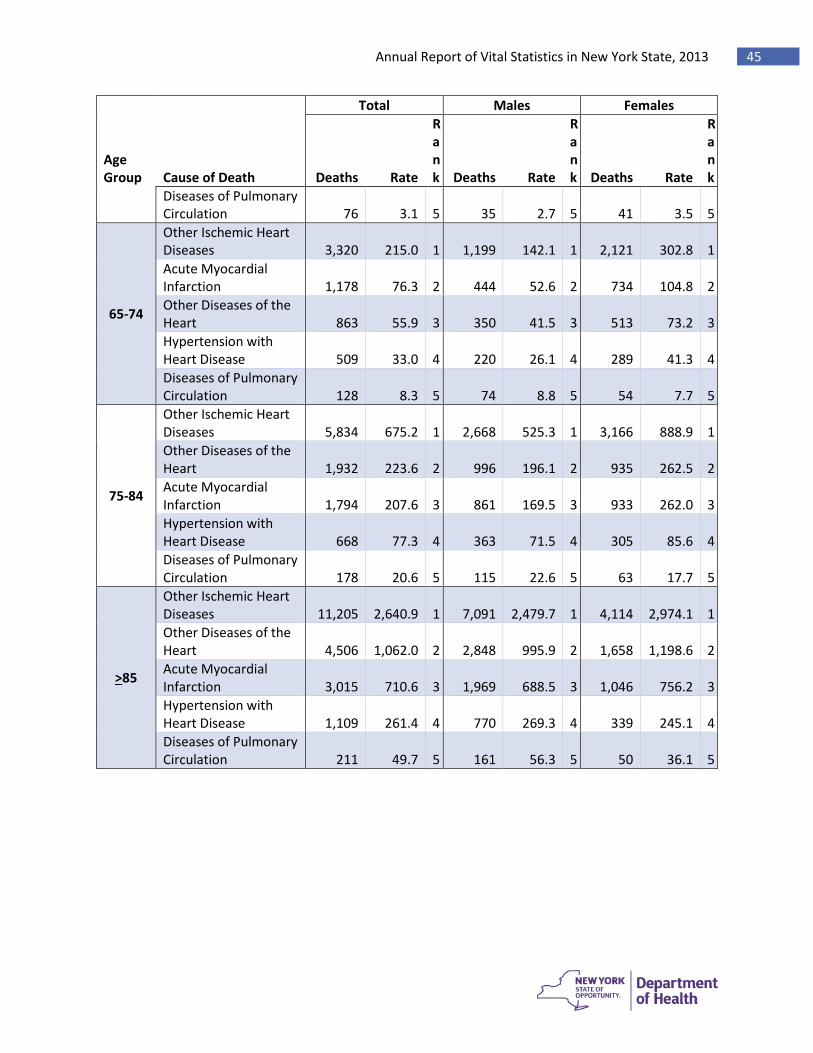
Annual Report of Vital Statistics in New York State, 2013 45
Age Group Cause of Death
Total Males Females
Deaths Rate
Rank Deaths Rate
Rank Deaths Rate
Rank
Diseases of Pulmonary Circulation 76 3.1 5 35 2.7 5 41 3.5 5
65-74
Other Ischemic Heart Diseases 3,320 215.0 1 1,199 142.1 1 2,121 302.8 1 Acute Myocardial Infarction 1,178 76.3 2 444 52.6 2 734 104.8 2 Other Diseases of the Heart 863 55.9 3 350 41.5 3 513 73.2 3 Hypertension with Heart Disease 509 33.0 4 220 26.1 4 289 41.3 4 Diseases of Pulmonary Circulation 128 8.3 5 74 8.8 5 54 7.7 5
75-84
Other Ischemic Heart Diseases 5,834 675.2 1 2,668 525.3 1 3,166 888.9 1 Other Diseases of the Heart 1,932 223.6 2 996 196.1 2 935 262.5 2 Acute Myocardial Infarction 1,794 207.6 3 861 169.5 3 933 262.0 3 Hypertension with Heart Disease 668 77.3 4 363 71.5 4 305 85.6 4 Diseases of Pulmonary Circulation 178 20.6 5 115 22.6 5 63 17.7 5
>85
Other Ischemic Heart Diseases 11,205 2,640.9 1 7,091 2,479.7 1 4,114 2,974.1 1 Other Diseases of the Heart 4,506 1,062.0 2 2,848 995.9 2 1,658 1,198.6 2 Acute Myocardial Infarction 3,015 710.6 3 1,969 688.5 3 1,046 756.2 3 Hypertension with Heart Disease 1,109 261.4 4 770 269.3 4 339 245.1 4 Diseases of Pulmonary Circulation 211 49.7 5 161 56.3 5 50 36.1 5
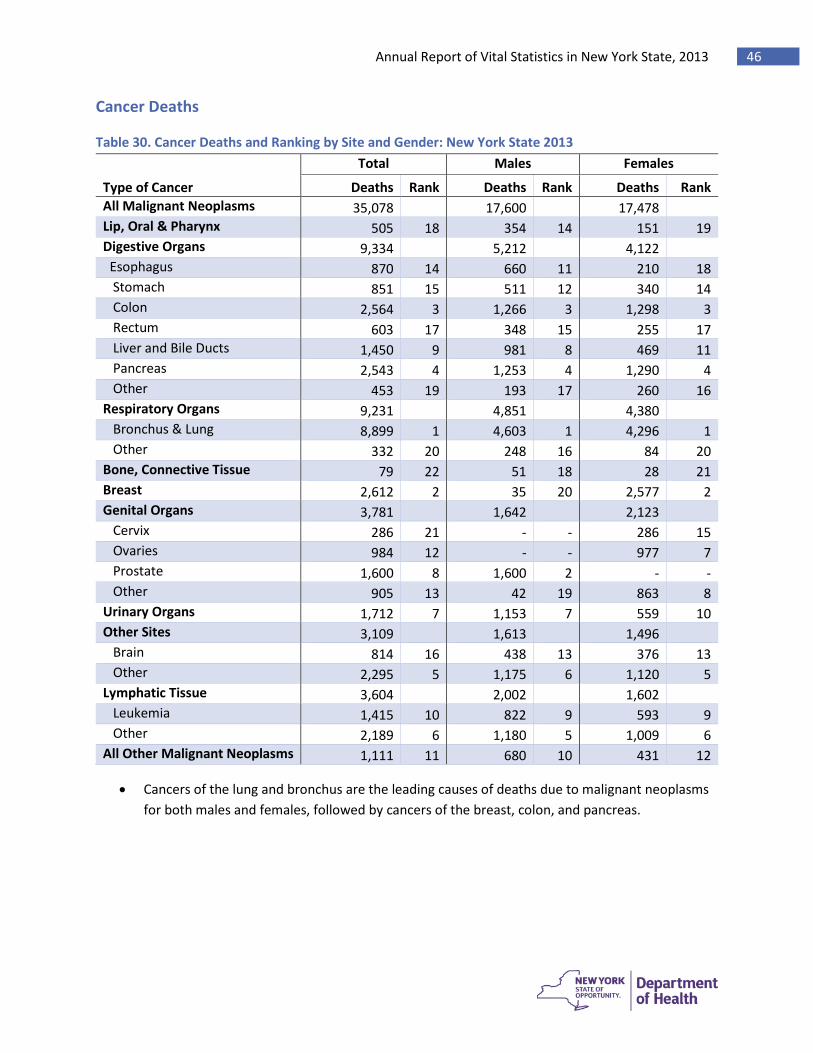
Annual Report of Vital Statistics in New York State, 2013 46
Cancer Deaths
Table 30. Cancer Deaths and Ranking by Site and Gender: New York State 2013
Type of Cancer
Total Males Females
Deaths Rank Deaths Rank Deaths Rank All Malignant Neoplasms 35,078 17,600 17,478 Lip, Oral & Pharynx 505 18 354 14 151 19 Digestive Organs 9,334 5,212 4,122 Esophagus 870 14 660 11 210 18 Stomach 851 15 511 12 340 14 Colon 2,564 3 1,266 3 1,298 3 Rectum 603 17 348 15 255 17 Liver and Bile Ducts 1,450 9 981 8 469 11 Pancreas 2,543 4 1,253 4 1,290 4 Other 453 19 193 17 260 16 Respiratory Organs 9,231 4,851 4,380 Bronchus & Lung 8,899 1 4,603 1 4,296 1 Other 332 20 248 16 84 20 Bone, Connective Tissue 79 22 51 18 28 21 Breast 2,612 2 35 20 2,577 2 Genital Organs 3,781 1,642 2,123 Cervix 286 21 - - 286 15 Ovaries 984 12 - - 977 7 Prostate 1,600 8 1,600 2 - - Other 905 13 42 19 863 8 Urinary Organs 1,712 7 1,153 7 559 10 Other Sites 3,109 1,613 1,496 Brain 814 16 438 13 376 13 Other 2,295 5 1,175 6 1,120 5 Lymphatic Tissue 3,604 2,002 1,602 Leukemia 1,415 10 822 9 593 9 Other 2,189 6 1,180 5 1,009 6 All Other Malignant Neoplasms 1,111 11 680 10 431 12
• Cancers of the lung and bronchus are the leading causes of deaths due to malignant neoplasms
for both males and females, followed by cancers of the breast, colon, and pancreas.
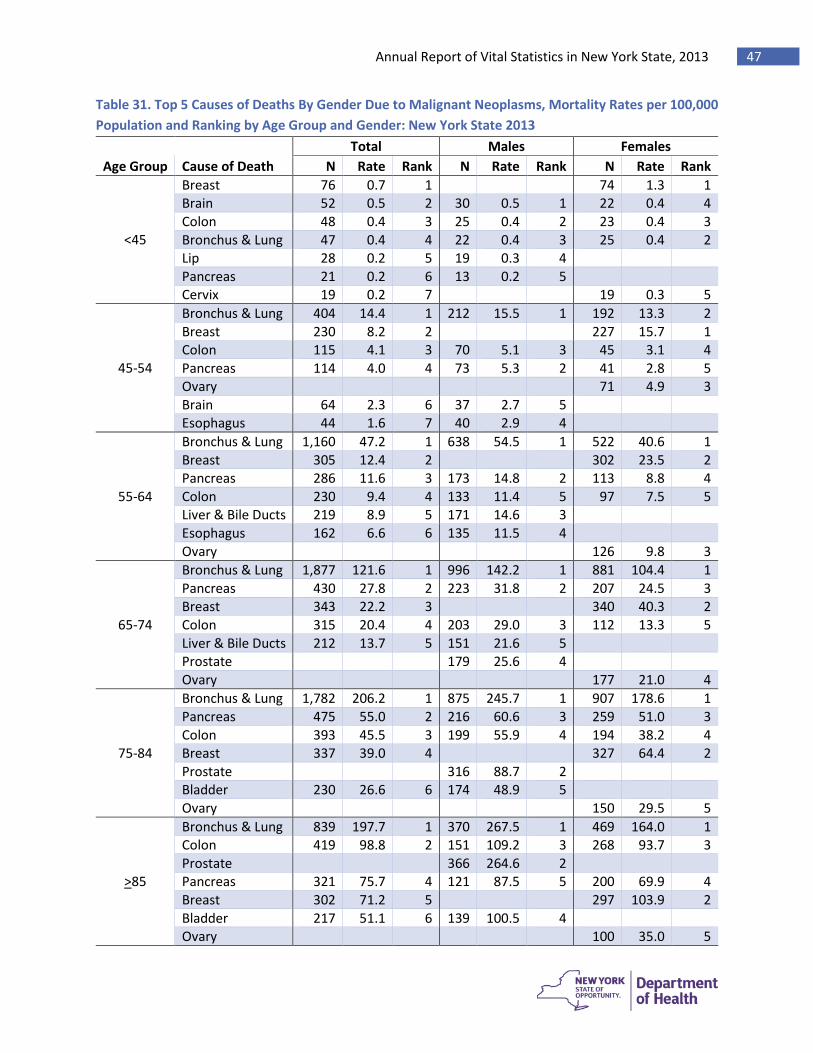
Annual Report of Vital Statistics in New York State, 2013 47
Table 31. Top 5 Causes of Deaths By Gender Due to Malignant Neoplasms, Mortality Rates per 100,000 Population and Ranking by Age Group and Gender: New York State 2013
Age Group Cause of Death Total Males Females
N Rate Rank N Rate Rank N Rate Rank
<45
Breast 76 0.7 1 74 1.3 1 Brain 52 0.5 2 30 0.5 1 22 0.4 4 Colon 48 0.4 3 25 0.4 2 23 0.4 3 Bronchus & Lung 47 0.4 4 22 0.4 3 25 0.4 2 Lip 28 0.2 5 19 0.3 4 Pancreas 21 0.2 6 13 0.2 5 Cervix 19 0.2 7 19 0.3 5
45-54
Bronchus & Lung 404 14.4 1 212 15.5 1 192 13.3 2 Breast 230 8.2 2 227 15.7 1 Colon 115 4.1 3 70 5.1 3 45 3.1 4 Pancreas 114 4.0 4 73 5.3 2 41 2.8 5 Ovary 71 4.9 3 Brain 64 2.3 6 37 2.7 5 Esophagus 44 1.6 7 40 2.9 4
55-64
Bronchus & Lung 1,160 47.2 1 638 54.5 1 522 40.6 1 Breast 305 12.4 2 302 23.5 2 Pancreas 286 11.6 3 173 14.8 2 113 8.8 4 Colon 230 9.4 4 133 11.4 5 97 7.5 5 Liver & Bile Ducts 219 8.9 5 171 14.6 3 Esophagus 162 6.6 6 135 11.5 4 Ovary 126 9.8 3
65-74
Bronchus & Lung 1,877 121.6 1 996 142.2 1 881 104.4 1 Pancreas 430 27.8 2 223 31.8 2 207 24.5 3 Breast 343 22.2 3 340 40.3 2 Colon 315 20.4 4 203 29.0 3 112 13.3 5 Liver & Bile Ducts 212 13.7 5 151 21.6 5 Prostate 179 25.6 4 Ovary 177 21.0 4
75-84
Bronchus & Lung 1,782 206.2 1 875 245.7 1 907 178.6 1 Pancreas 475 55.0 2 216 60.6 3 259 51.0 3 Colon 393 45.5 3 199 55.9 4 194 38.2 4 Breast 337 39.0 4 327 64.4 2 Prostate 316 88.7 2 Bladder 230 26.6 6 174 48.9 5 Ovary 150 29.5 5
>85
Bronchus & Lung 839 197.7 1 370 267.5 1 469 164.0 1 Colon 419 98.8 2 151 109.2 3 268 93.7 3 Prostate 366 264.6 2 Pancreas 321 75.7 4 121 87.5 5 200 69.9 4 Breast 302 71.2 5 297 103.9 2 Bladder 217 51.1 6 139 100.5 4 Ovary 100 35.0 5
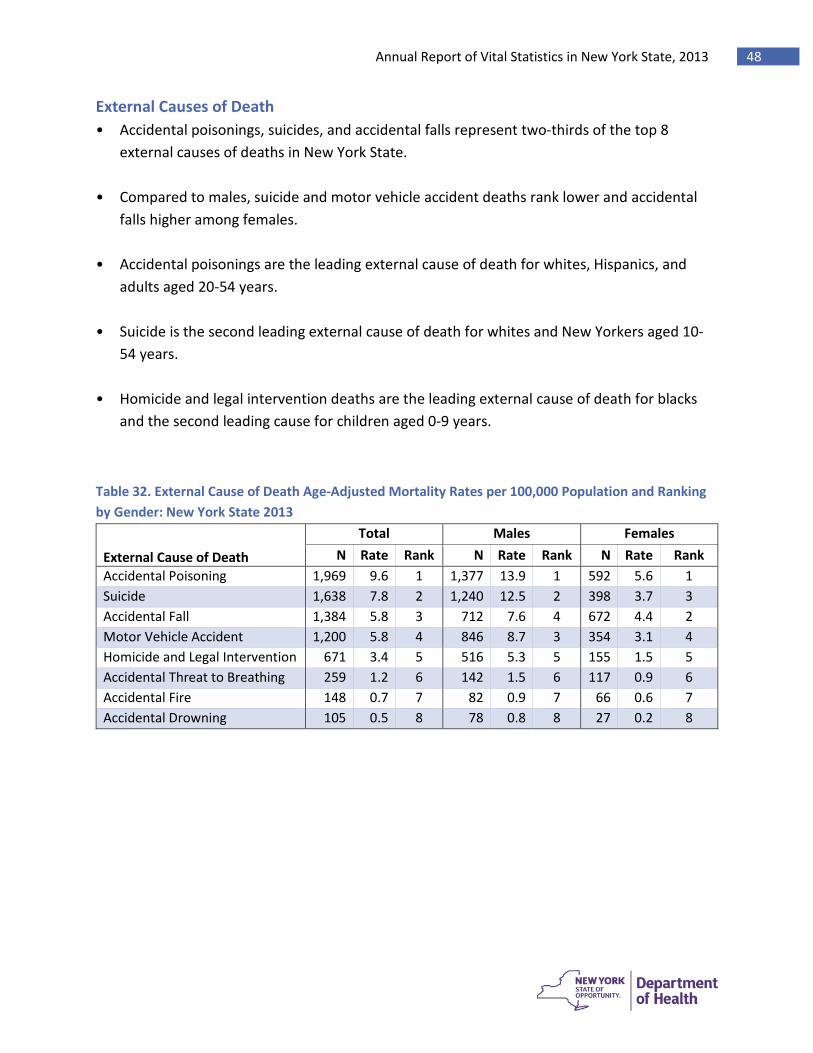
Annual Report of Vital Statistics in New York State, 2013 48
External Causes of Death • Accidental poisonings, suicides, and accidental falls represent two-thirds of the top 8
external causes of deaths in New York State.
• Compared to males, suicide and motor vehicle accident deaths rank lower and accidental falls higher among females.
• Accidental poisonings are the leading external cause of death for whites, Hispanics, and adults aged 20-54 years.
• Suicide is the second leading external cause of death for whites and New Yorkers aged 10-54 years.
• Homicide and legal intervention deaths are the leading external cause of death for blacks
and the second leading cause for children aged 0-9 years.
Table 32. External Cause of Death Age-Adjusted Mortality Rates per 100,000 Population and Ranking by Gender: New York State 2013
External Cause of Death
Total Males Females N Rate Rank N Rate Rank N Rate Rank
Accidental Poisoning 1,969 9.6 1 1,377 13.9 1 592 5.6 1 Suicide 1,638 7.8 2 1,240 12.5 2 398 3.7 3 Accidental Fall 1,384 5.8 3 712 7.6 4 672 4.4 2 Motor Vehicle Accident 1,200 5.8 4 846 8.7 3 354 3.1 4 Homicide and Legal Intervention 671 3.4 5 516 5.3 5 155 1.5 5 Accidental Threat to Breathing 259 1.2 6 142 1.5 6 117 0.9 6 Accidental Fire 148 0.7 7 82 0.9 7 66 0.6 7 Accidental Drowning 105 0.5 8 78 0.8 8 27 0.2 8

Annual Report of Vital Statistics in New York State, 2013 49
Table 33. External Cause of Death Crude Mortality Rates and Ranking by Age Group: New York State 2013
Rank 0-9 10-19 20-34 35-54 55-74 75+ Total
Cause and Rate per 100,000 Population
1
Accidental Threat to Breathing
(1.9)
Motor Vehicle
Accident (3.9)
Accidental Poisoning
(13.6)
Accidental Poisoning
(17.1)
Suicide (11.6)
Accidental Fall
(76.5)
Accidental Poisoning
(10.0)
2
Homicide and Legal
Intervention (1.5)
Suicide (2.9)
Suicide (8.5)
Suicide (11.3)
Accidental Poisoning
(10.1)
Motor Vehicle
Accident (14.4)
Suicide (8.3)
3
Motor Vehicle
Accident (1.3)
Homicide and Legal
Intervention (1.9)
Motor Vehicle
Accident (7.7)
Motor Vehicle
Accident (5.4)
Motor Vehicle
Accident (6.9)
Suicide (10.4)
Accidental Fall
(7.0)
4 Accidental
Fire (0.6)
Accidental Poisoning
(1.4)
Homicide and Legal
Intervention (7.2)
Homicide and Legal
Intervention (3.6)
Accidental Fall
(6.2)
Accidental Threat to Breathing
(8.4)
Motor Vehicle
Accident (6.1)
5 Accidental Drowning
(0.4)
Accidental Drowning
(0.5)
Accidental Fall
(0.6)
Accidental Fall
(2.2)
Homicide and Legal
Intervention (1.8)
Accidental Fire (3.2)
Homicide and Legal
Intervention (3.4)
6 Accidental
Fall (0.2)
Accidental Fire (0.4)
Accidental Fire
(0.4)
Accidental Threat to Breathing
(0.6)
Accidental Threat to Breathing
(1.5)
Accidental Poisoning
(3.1)
Accidental Threat to Breathing
(1.3)
7 Suicide (0.1)
Accidental Fall
(0.2)
Accidental Drowning
(0.4)
Accidental Drowning
(0.5)
Accidental Fire
(1.0)
Homicide and Legal
Intervention (1.6)
Accidental Fire
(0.8)
8 Accidental Poisoning
(0.0)
Accidental Threat to Breathing
(0.1)
Accidental Threat to Breathing
(0.3)
Accidental Fire
(0.4)
Accidental Drowning
(0.7)
Accidental Drowning
(1.0)
Accidental Drowning
(0.5)
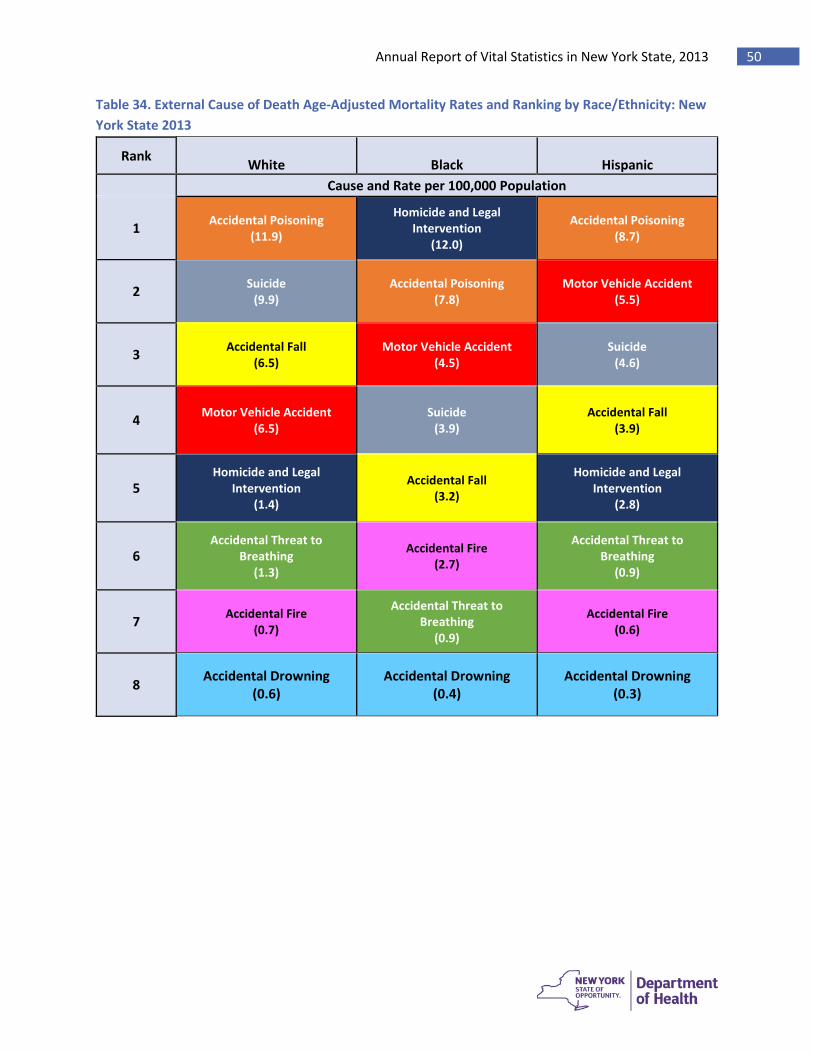
Annual Report of Vital Statistics in New York State, 2013 50
Table 34. External Cause of Death Age-Adjusted Mortality Rates and Ranking by Race/Ethnicity: New York State 2013
Rank White
Black
Hispanic
Cause and Rate per 100,000 Population
1 Accidental Poisoning (11.9)
Homicide and Legal Intervention
(12.0)
Accidental Poisoning (8.7)
2 Suicide (9.9)
Accidental Poisoning (7.8)
Motor Vehicle Accident (5.5)
3 Accidental Fall (6.5)
Motor Vehicle Accident (4.5)
Suicide (4.6)
4 Motor Vehicle Accident (6.5)
Suicide (3.9)
Accidental Fall (3.9)
5 Homicide and Legal
Intervention (1.4)
Accidental Fall (3.2)
Homicide and Legal Intervention
(2.8)
6 Accidental Threat to
Breathing (1.3)
Accidental Fire (2.7)
Accidental Threat to Breathing
(0.9)
7 Accidental Fire (0.7)
Accidental Threat to Breathing
(0.9)
Accidental Fire (0.6)
8 Accidental Drowning (0.6)
Accidental Drowning (0.4)
Accidental Drowning (0.3)
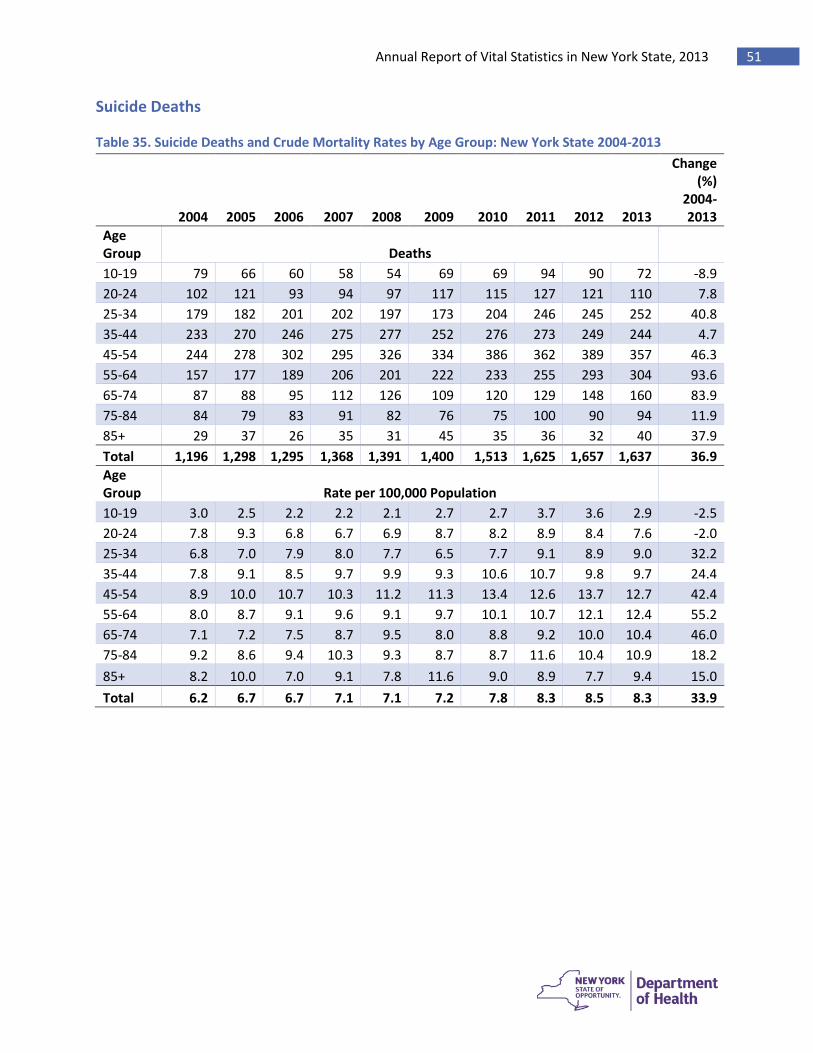
Annual Report of Vital Statistics in New York State, 2013 51
Suicide Deaths
Table 35. Suicide Deaths and Crude Mortality Rates by Age Group: New York State 2004-2013
2004
2005
2006
2007
2008
2009
2010
2011
2012
2013
Change (%)
2004-2013
Age Group Deaths
10-19 79 66 60 58 54 69 69 94 90 72 -8.9 20-24 102 121 93 94 97 117 115 127 121 110 7.8 25-34 179 182 201 202 197 173 204 246 245 252 40.8 35-44 233 270 246 275 277 252 276 273 249 244 4.7 45-54 244 278 302 295 326 334 386 362 389 357 46.3 55-64 157 177 189 206 201 222 233 255 293 304 93.6 65-74 87 88 95 112 126 109 120 129 148 160 83.9 75-84 84 79 83 91 82 76 75 100 90 94 11.9 85+ 29 37 26 35 31 45 35 36 32 40 37.9 Total 1,196 1,298 1,295 1,368 1,391 1,400 1,513 1,625 1,657 1,637 36.9 Age Group Rate per 100,000 Population
10-19 3.0 2.5 2.2 2.2 2.1 2.7 2.7 3.7 3.6 2.9 -2.5 20-24 7.8 9.3 6.8 6.7 6.9 8.7 8.2 8.9 8.4 7.6 -2.0 25-34 6.8 7.0 7.9 8.0 7.7 6.5 7.7 9.1 8.9 9.0 32.2 35-44 7.8 9.1 8.5 9.7 9.9 9.3 10.6 10.7 9.8 9.7 24.4 45-54 8.9 10.0 10.7 10.3 11.2 11.3 13.4 12.6 13.7 12.7 42.4 55-64 8.0 8.7 9.1 9.6 9.1 9.7 10.1 10.7 12.1 12.4 55.2 65-74 7.1 7.2 7.5 8.7 9.5 8.0 8.8 9.2 10.0 10.4 46.0 75-84 9.2 8.6 9.4 10.3 9.3 8.7 8.7 11.6 10.4 10.9 18.2 85+ 8.2 10.0 7.0 9.1 7.8 11.6 9.0 8.9 7.7 9.4 15.0 Total 6.2 6.7 6.7 7.1 7.1 7.2 7.8 8.3 8.5 8.3 33.9
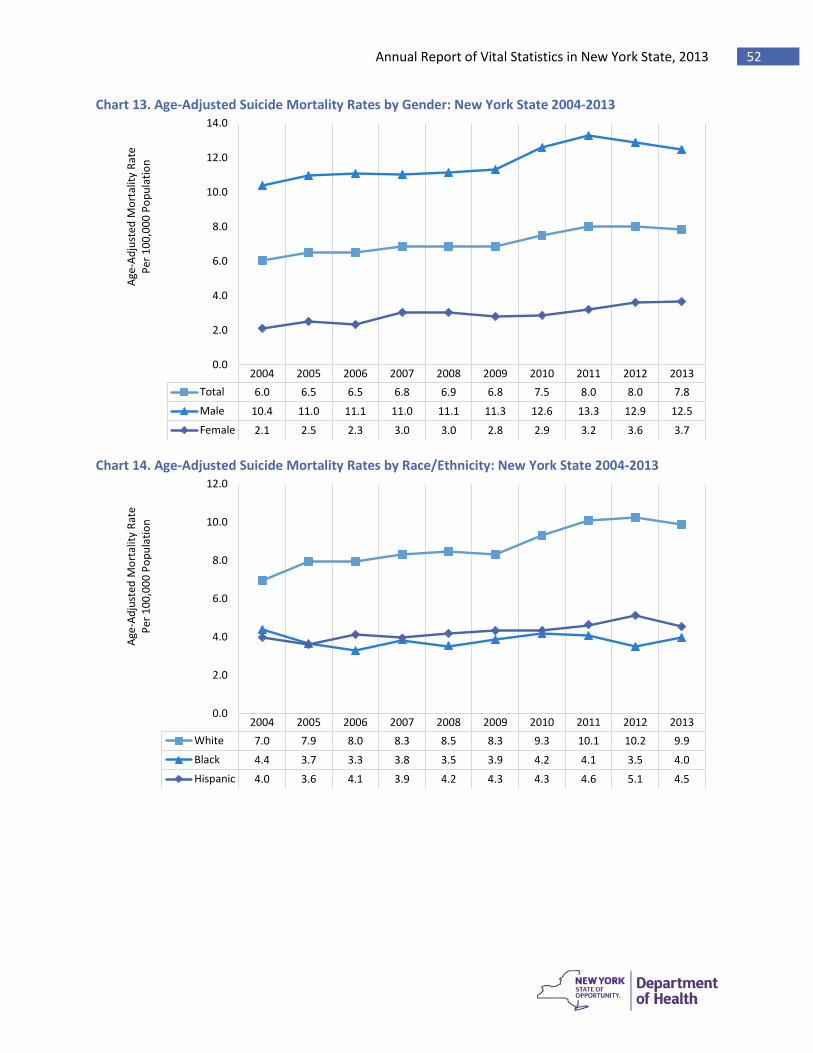
Annual Report of Vital Statistics in New York State, 2013 52
Chart 13. Age-Adjusted Suicide Mortality Rates by Gender: New York State 2004-2013
Chart 14. Age-Adjusted Suicide Mortality Rates by Race/Ethnicity: New York State 2004-2013
2004 2005 2006 2007 2008 2009 2010 2011 2012 2013Total 6.0 6.5 6.5 6.8 6.9 6.8 7.5 8.0 8.0 7.8Male 10.4 11.0 11.1 11.0 11.1 11.3 12.6 13.3 12.9 12.5Female 2.1 2.5 2.3 3.0 3.0 2.8 2.9 3.2 3.6 3.7
0.0
2.0
4.0
6.0
8.0
10.0
12.0
14.0Ag
e-Ad
just
ed M
orta
lity
Rate
Pe
r 100
,000
Pop
ulat
ion
2004 2005 2006 2007 2008 2009 2010 2011 2012 2013White 7.0 7.9 8.0 8.3 8.5 8.3 9.3 10.1 10.2 9.9Black 4.4 3.7 3.3 3.8 3.5 3.9 4.2 4.1 3.5 4.0Hispanic 4.0 3.6 4.1 3.9 4.2 4.3 4.3 4.6 5.1 4.5
0.0
2.0
4.0
6.0
8.0
10.0
12.0
Age-
Adju
sted
Mor
talit
y Ra
te
Per 1
00,0
00 P
opul
atio
n
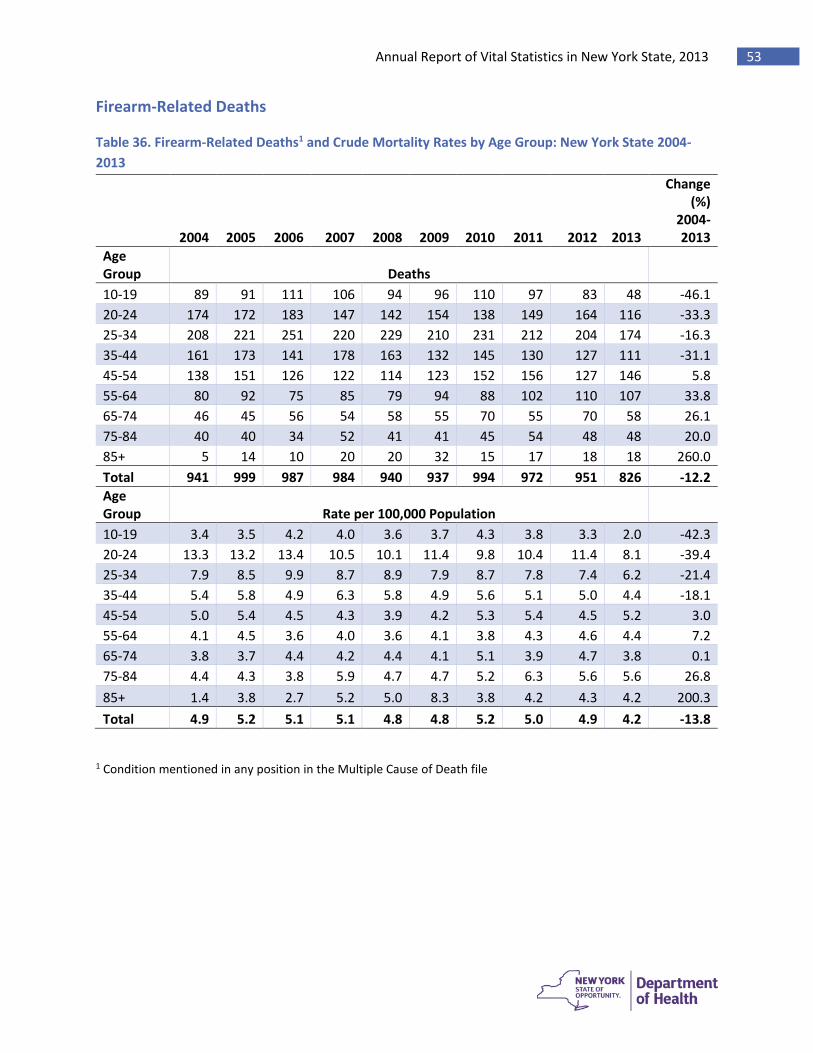
Annual Report of Vital Statistics in New York State, 2013 53
Firearm-Related Deaths
Table 36. Firearm-Related Deaths1 and Crude Mortality Rates by Age Group: New York State 2004-2013
2004
2005
2006
2007
2008
2009
2010
2011
2012
2013
Change (%)
2004-2013
Age Group Deaths 10-19 89 91 111 106 94 96 110 97 83 48 -46.1 20-24 174 172 183 147 142 154 138 149 164 116 -33.3 25-34 208 221 251 220 229 210 231 212 204 174 -16.3 35-44 161 173 141 178 163 132 145 130 127 111 -31.1 45-54 138 151 126 122 114 123 152 156 127 146 5.8 55-64 80 92 75 85 79 94 88 102 110 107 33.8 65-74 46 45 56 54 58 55 70 55 70 58 26.1 75-84 40 40 34 52 41 41 45 54 48 48 20.0 85+ 5 14 10 20 20 32 15 17 18 18 260.0 Total 941 999 987 984 940 937 994 972 951 826 -12.2 Age Group Rate per 100,000 Population 10-19 3.4 3.5 4.2 4.0 3.6 3.7 4.3 3.8 3.3 2.0 -42.3 20-24 13.3 13.2 13.4 10.5 10.1 11.4 9.8 10.4 11.4 8.1 -39.4 25-34 7.9 8.5 9.9 8.7 8.9 7.9 8.7 7.8 7.4 6.2 -21.4 35-44 5.4 5.8 4.9 6.3 5.8 4.9 5.6 5.1 5.0 4.4 -18.1 45-54 5.0 5.4 4.5 4.3 3.9 4.2 5.3 5.4 4.5 5.2 3.0 55-64 4.1 4.5 3.6 4.0 3.6 4.1 3.8 4.3 4.6 4.4 7.2 65-74 3.8 3.7 4.4 4.2 4.4 4.1 5.1 3.9 4.7 3.8 0.1 75-84 4.4 4.3 3.8 5.9 4.7 4.7 5.2 6.3 5.6 5.6 26.8 85+ 1.4 3.8 2.7 5.2 5.0 8.3 3.8 4.2 4.3 4.2 200.3 Total 4.9 5.2 5.1 5.1 4.8 4.8 5.2 5.0 4.9 4.2 -13.8
1 Condition mentioned in any position in the Multiple Cause of Death file
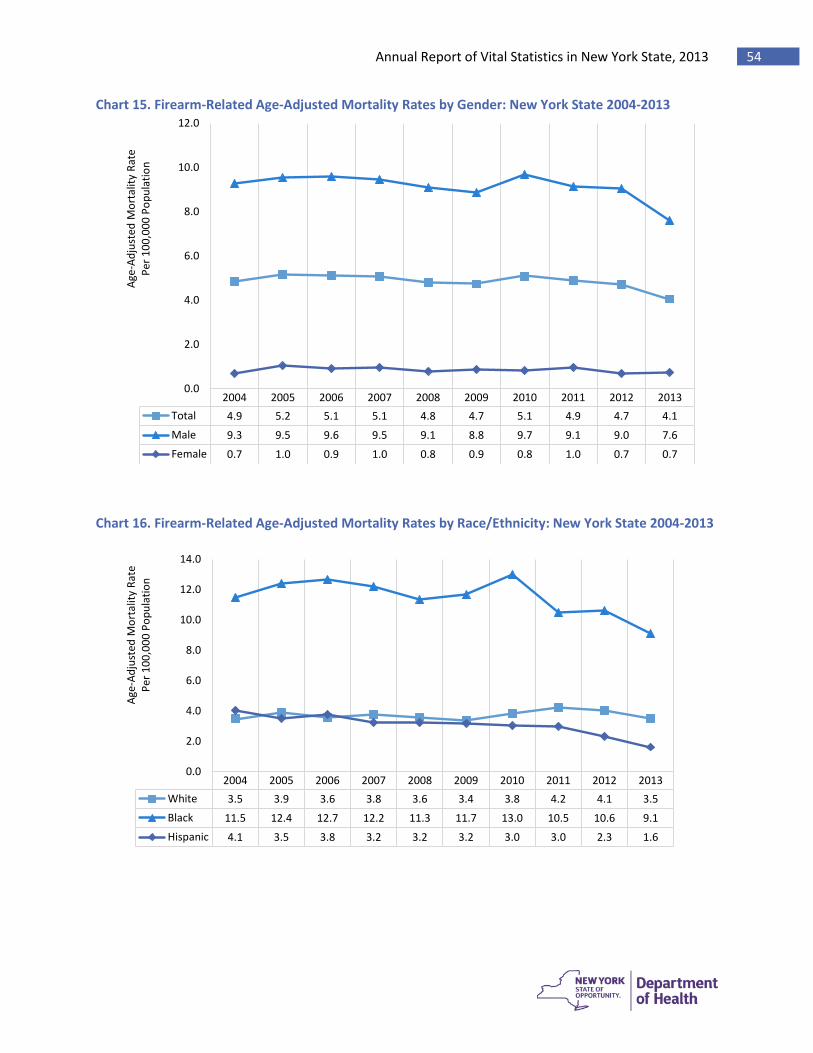
Annual Report of Vital Statistics in New York State, 2013 54
Chart 15. Firearm-Related Age-Adjusted Mortality Rates by Gender: New York State 2004-2013
Chart 16. Firearm-Related Age-Adjusted Mortality Rates by Race/Ethnicity: New York State 2004-2013
2004 2005 2006 2007 2008 2009 2010 2011 2012 2013Total 4.9 5.2 5.1 5.1 4.8 4.7 5.1 4.9 4.7 4.1Male 9.3 9.5 9.6 9.5 9.1 8.8 9.7 9.1 9.0 7.6Female 0.7 1.0 0.9 1.0 0.8 0.9 0.8 1.0 0.7 0.7
0.0
2.0
4.0
6.0
8.0
10.0
12.0Ag
e-Ad
just
ed M
orta
lity
Rate
Pe
r 100
,000
Pop
ulat
ion
2004 2005 2006 2007 2008 2009 2010 2011 2012 2013White 3.5 3.9 3.6 3.8 3.6 3.4 3.8 4.2 4.1 3.5Black 11.5 12.4 12.7 12.2 11.3 11.7 13.0 10.5 10.6 9.1Hispanic 4.1 3.5 3.8 3.2 3.2 3.2 3.0 3.0 2.3 1.6
0.0
2.0
4.0
6.0
8.0
10.0
12.0
14.0
Age-
Adju
sted
Mor
talit
y Ra
te
Per 1
00,0
00 P
opul
atio
n
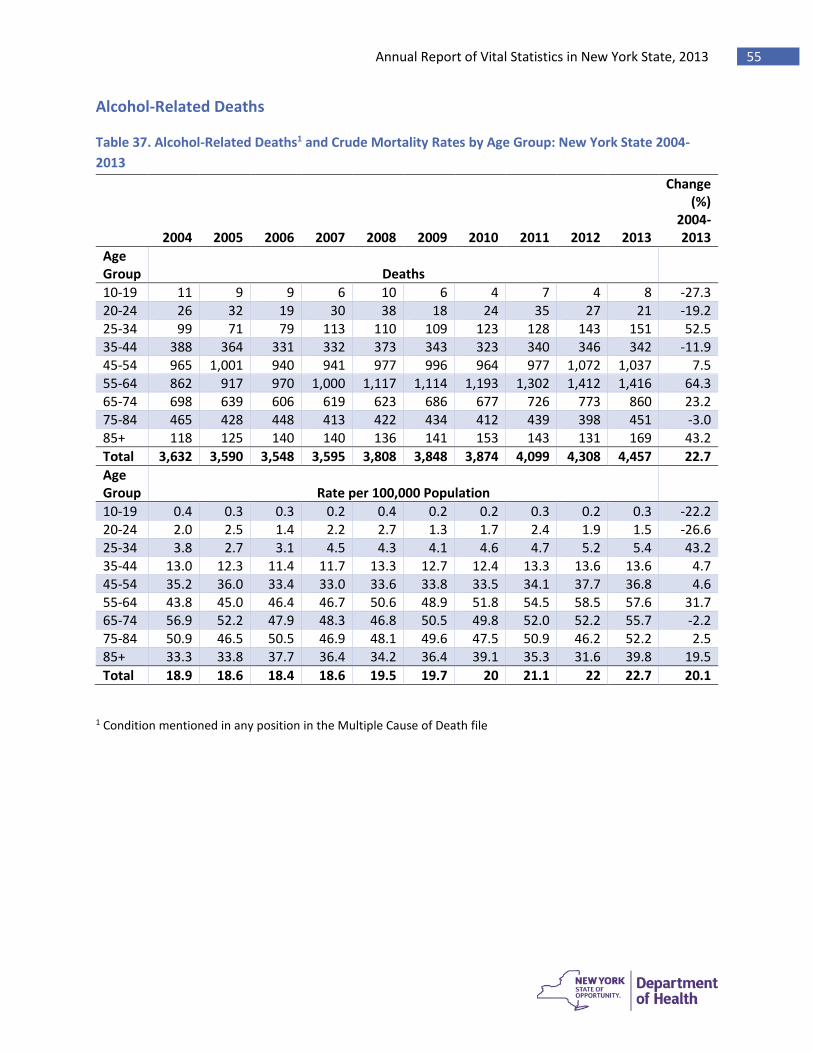
Annual Report of Vital Statistics in New York State, 2013 55
Alcohol-Related Deaths
Table 37. Alcohol-Related Deaths1 and Crude Mortality Rates by Age Group: New York State 2004-2013
2004
2005
2006
2007
2008
2009
2010
2011
2012
2013
Change (%)
2004-2013
Age Group Deaths
10-19 11 9 9 6 10 6 4 7 4 8 -27.3 20-24 26 32 19 30 38 18 24 35 27 21 -19.2 25-34 99 71 79 113 110 109 123 128 143 151 52.5 35-44 388 364 331 332 373 343 323 340 346 342 -11.9 45-54 965 1,001 940 941 977 996 964 977 1,072 1,037 7.5 55-64 862 917 970 1,000 1,117 1,114 1,193 1,302 1,412 1,416 64.3 65-74 698 639 606 619 623 686 677 726 773 860 23.2 75-84 465 428 448 413 422 434 412 439 398 451 -3.0 85+ 118 125 140 140 136 141 153 143 131 169 43.2 Total 3,632 3,590 3,548 3,595 3,808 3,848 3,874 4,099 4,308 4,457 22.7 Age Group Rate per 100,000 Population
10-19 0.4 0.3 0.3 0.2 0.4 0.2 0.2 0.3 0.2 0.3 -22.2 20-24 2.0 2.5 1.4 2.2 2.7 1.3 1.7 2.4 1.9 1.5 -26.6 25-34 3.8 2.7 3.1 4.5 4.3 4.1 4.6 4.7 5.2 5.4 43.2 35-44 13.0 12.3 11.4 11.7 13.3 12.7 12.4 13.3 13.6 13.6 4.7 45-54 35.2 36.0 33.4 33.0 33.6 33.8 33.5 34.1 37.7 36.8 4.6 55-64 43.8 45.0 46.4 46.7 50.6 48.9 51.8 54.5 58.5 57.6 31.7 65-74 56.9 52.2 47.9 48.3 46.8 50.5 49.8 52.0 52.2 55.7 -2.2 75-84 50.9 46.5 50.5 46.9 48.1 49.6 47.5 50.9 46.2 52.2 2.5 85+ 33.3 33.8 37.7 36.4 34.2 36.4 39.1 35.3 31.6 39.8 19.5 Total 18.9 18.6 18.4 18.6 19.5 19.7 20 21.1 22 22.7 20.1
1 Condition mentioned in any position in the Multiple Cause of Death file
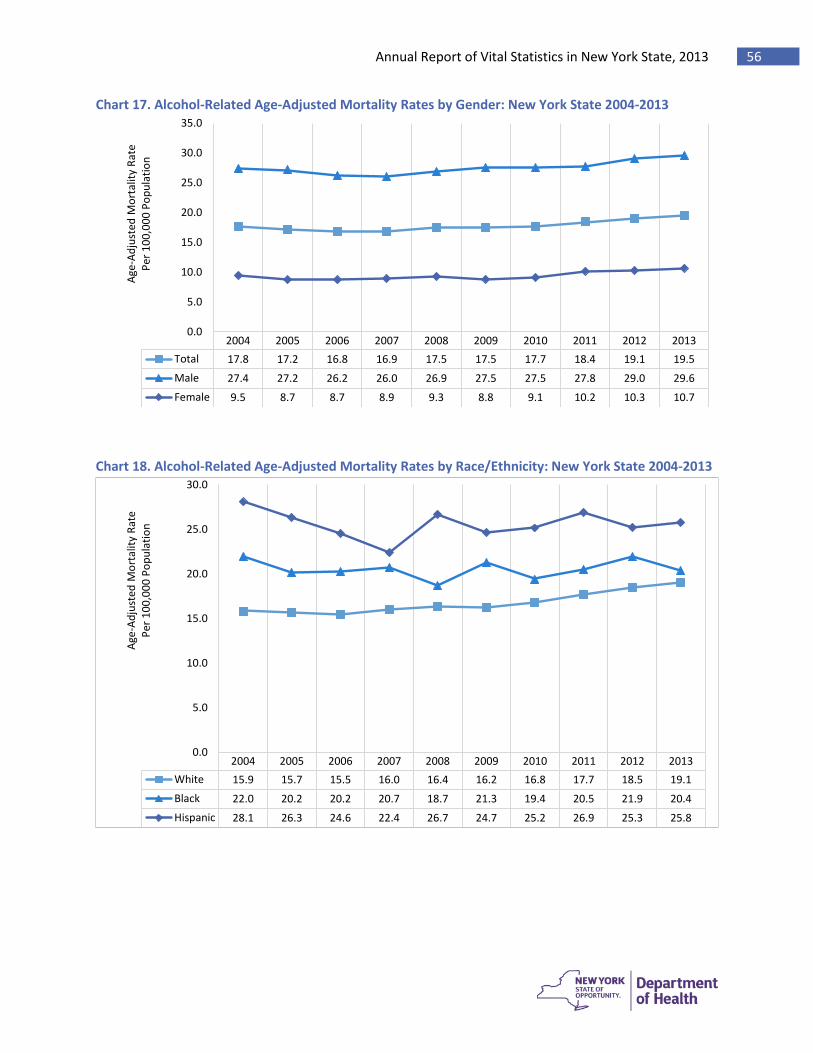
Annual Report of Vital Statistics in New York State, 2013 56
Chart 17. Alcohol-Related Age-Adjusted Mortality Rates by Gender: New York State 2004-2013
Chart 18. Alcohol-Related Age-Adjusted Mortality Rates by Race/Ethnicity: New York State 2004-2013
2004 2005 2006 2007 2008 2009 2010 2011 2012 2013Total 17.8 17.2 16.8 16.9 17.5 17.5 17.7 18.4 19.1 19.5Male 27.4 27.2 26.2 26.0 26.9 27.5 27.5 27.8 29.0 29.6Female 9.5 8.7 8.7 8.9 9.3 8.8 9.1 10.2 10.3 10.7
0.0
5.0
10.0
15.0
20.0
25.0
30.0
35.0Ag
e-Ad
just
ed M
orta
lity
Rate
Pe
r 100
,000
Pop
ulat
ion
2004 2005 2006 2007 2008 2009 2010 2011 2012 2013White 15.9 15.7 15.5 16.0 16.4 16.2 16.8 17.7 18.5 19.1Black 22.0 20.2 20.2 20.7 18.7 21.3 19.4 20.5 21.9 20.4Hispanic 28.1 26.3 24.6 22.4 26.7 24.7 25.2 26.9 25.3 25.8
0.0
5.0
10.0
15.0
20.0
25.0
30.0
Age-
Adju
sted
Mor
talit
y Ra
te
Per 1
00,0
00 P
opul
atio
n
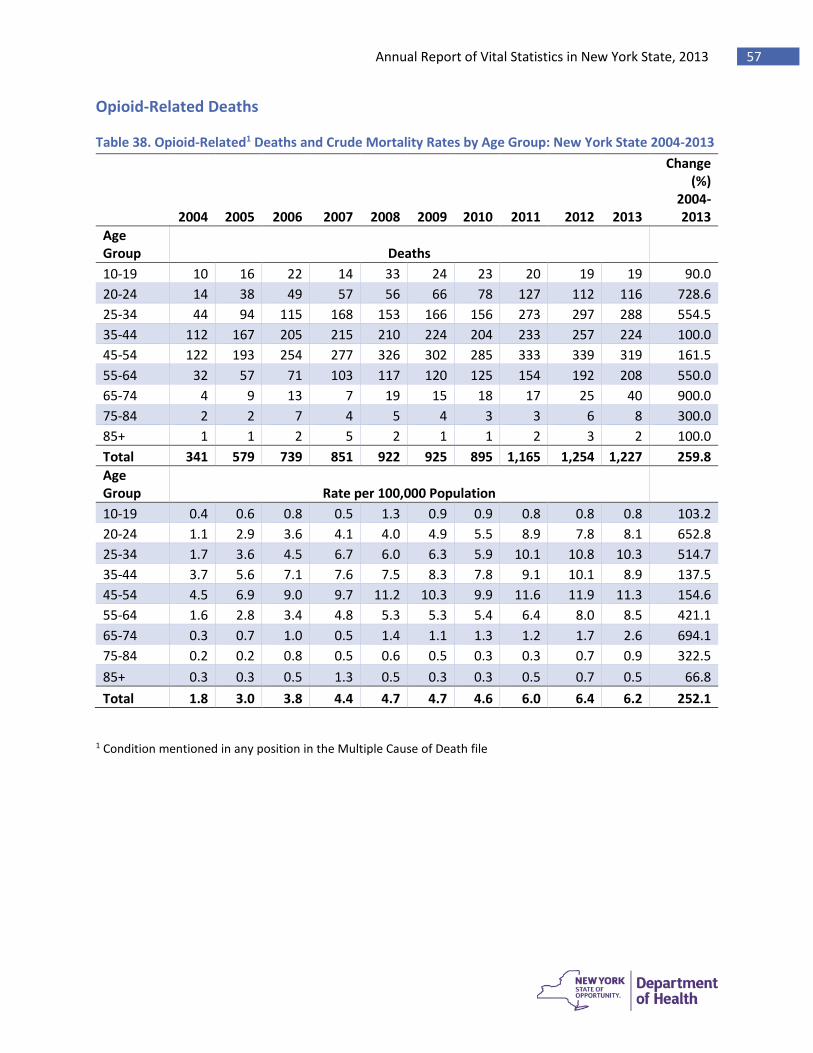
Annual Report of Vital Statistics in New York State, 2013 57
Opioid-Related Deaths
Table 38. Opioid-Related1 Deaths and Crude Mortality Rates by Age Group: New York State 2004-2013
2004
2005
2006
2007
2008
2009
2010
2011
2012
2013
Change (%)
2004-2013
Age Group Deaths 10-19 10 16 22 14 33 24 23 20 19 19 90.0 20-24 14 38 49 57 56 66 78 127 112 116 728.6 25-34 44 94 115 168 153 166 156 273 297 288 554.5 35-44 112 167 205 215 210 224 204 233 257 224 100.0 45-54 122 193 254 277 326 302 285 333 339 319 161.5 55-64 32 57 71 103 117 120 125 154 192 208 550.0 65-74 4 9 13 7 19 15 18 17 25 40 900.0 75-84 2 2 7 4 5 4 3 3 6 8 300.0 85+ 1 1 2 5 2 1 1 2 3 2 100.0 Total 341 579 739 851 922 925 895 1,165 1,254 1,227 259.8 Age Group Rate per 100,000 Population 10-19 0.4 0.6 0.8 0.5 1.3 0.9 0.9 0.8 0.8 0.8 103.2 20-24 1.1 2.9 3.6 4.1 4.0 4.9 5.5 8.9 7.8 8.1 652.8 25-34 1.7 3.6 4.5 6.7 6.0 6.3 5.9 10.1 10.8 10.3 514.7 35-44 3.7 5.6 7.1 7.6 7.5 8.3 7.8 9.1 10.1 8.9 137.5 45-54 4.5 6.9 9.0 9.7 11.2 10.3 9.9 11.6 11.9 11.3 154.6 55-64 1.6 2.8 3.4 4.8 5.3 5.3 5.4 6.4 8.0 8.5 421.1 65-74 0.3 0.7 1.0 0.5 1.4 1.1 1.3 1.2 1.7 2.6 694.1 75-84 0.2 0.2 0.8 0.5 0.6 0.5 0.3 0.3 0.7 0.9 322.5 85+ 0.3 0.3 0.5 1.3 0.5 0.3 0.3 0.5 0.7 0.5 66.8 Total 1.8 3.0 3.8 4.4 4.7 4.7 4.6 6.0 6.4 6.2 252.1
1 Condition mentioned in any position in the Multiple Cause of Death file
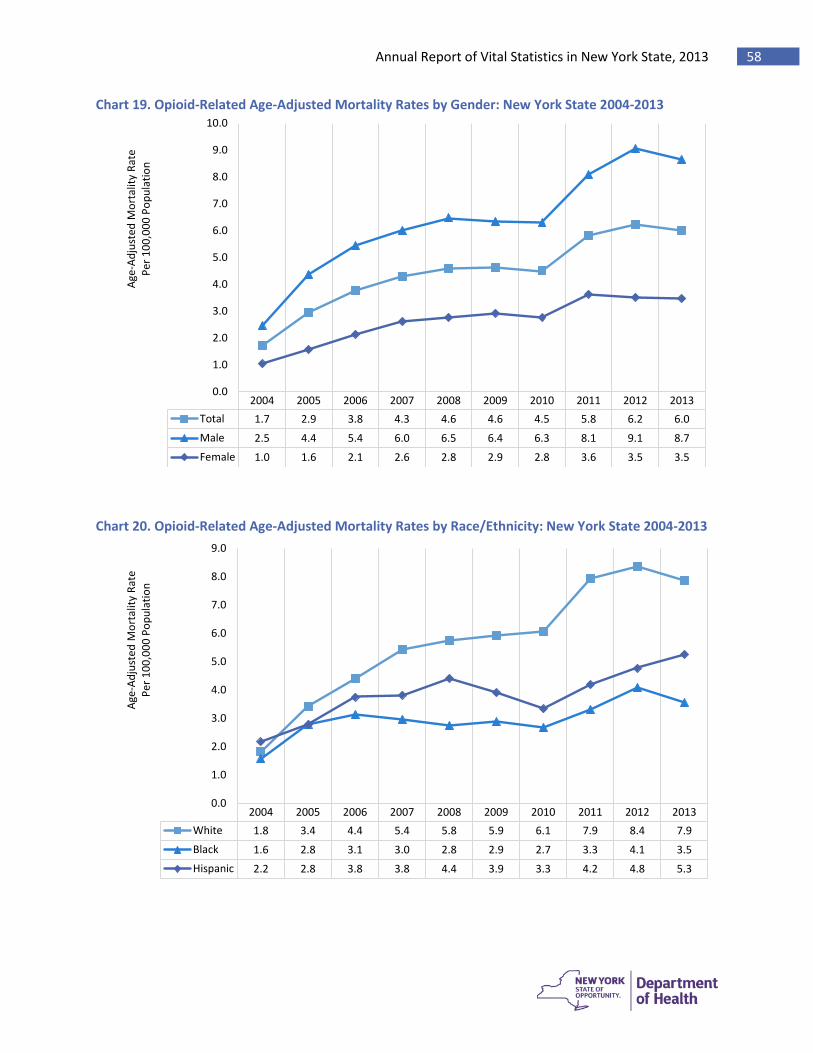
Annual Report of Vital Statistics in New York State, 2013 58
Chart 19. Opioid-Related Age-Adjusted Mortality Rates by Gender: New York State 2004-2013
Chart 20. Opioid-Related Age-Adjusted Mortality Rates by Race/Ethnicity: New York State 2004-2013
2004 2005 2006 2007 2008 2009 2010 2011 2012 2013Total 1.7 2.9 3.8 4.3 4.6 4.6 4.5 5.8 6.2 6.0Male 2.5 4.4 5.4 6.0 6.5 6.4 6.3 8.1 9.1 8.7Female 1.0 1.6 2.1 2.6 2.8 2.9 2.8 3.6 3.5 3.5
0.0
1.0
2.0
3.0
4.0
5.0
6.0
7.0
8.0
9.0
10.0Ag
e-Ad
just
ed M
orta
lity
Rate
Pe
r 100
,000
Pop
ulat
ion
2004 2005 2006 2007 2008 2009 2010 2011 2012 2013White 1.8 3.4 4.4 5.4 5.8 5.9 6.1 7.9 8.4 7.9Black 1.6 2.8 3.1 3.0 2.8 2.9 2.7 3.3 4.1 3.5Hispanic 2.2 2.8 3.8 3.8 4.4 3.9 3.3 4.2 4.8 5.3
0.0
1.0
2.0
3.0
4.0
5.0
6.0
7.0
8.0
9.0
Age-
Adju
sted
Mor
talit
y Ra
te
Per 1
00,0
00 P
opul
atio
n
Annual Report of Vital Statistics in New York State, 2013 59
Chapter 5. Marriages and Dissolutions
• Since the passage of same sex marriage legislation in July 2011, the percent of same sex marriages increased to 6.7 percent of all Rest of State marriages in 2013 (NYC has not reported data on same sex marriages).
• The number of marriages has increased since 2008 with more ceremonies taking place later in the calendar year.
• The number of couples divorcing has increased by nearly 10 percent since 2008 with increases seen in nearly every group irrespective of marriage duration.
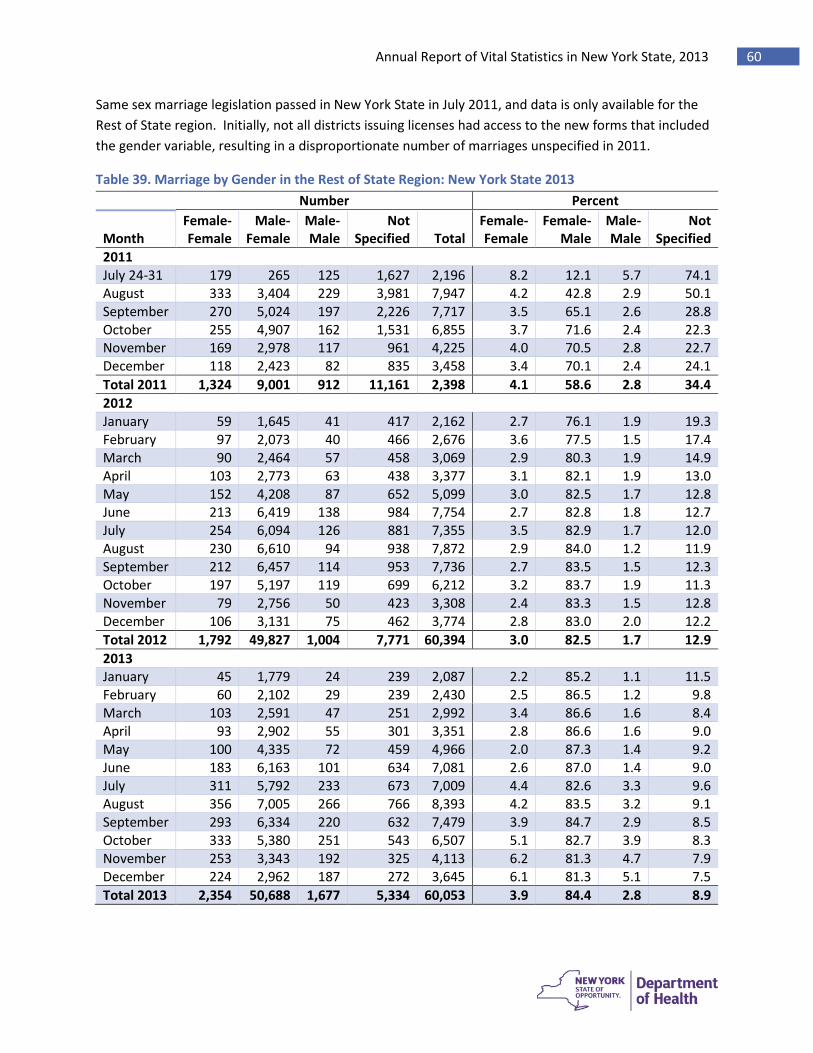
Annual Report of Vital Statistics in New York State, 2013 60
Same sex marriage legislation passed in New York State in July 2011, and data is only available for the Rest of State region. Initially, not all districts issuing licenses had access to the new forms that included the gender variable, resulting in a disproportionate number of marriages unspecified in 2011.
Table 39. Marriage by Gender in the Rest of State Region: New York State 2013 Number Percent
Month
Female- Female
Male- Female
Male- Male
Not Specified
Total
Female- Female
Female- Male
Male- Male
Not Specified
2011 July 24-31 179 265 125 1,627 2,196 8.2 12.1 5.7 74.1 August 333 3,404 229 3,981 7,947 4.2 42.8 2.9 50.1 September 270 5,024 197 2,226 7,717 3.5 65.1 2.6 28.8 October 255 4,907 162 1,531 6,855 3.7 71.6 2.4 22.3 November 169 2,978 117 961 4,225 4.0 70.5 2.8 22.7 December 118 2,423 82 835 3,458 3.4 70.1 2.4 24.1 Total 2011 1,324 9,001 912 11,161 2,398 4.1 58.6 2.8 34.4 2012 January 59 1,645 41 417 2,162 2.7 76.1 1.9 19.3 February 97 2,073 40 466 2,676 3.6 77.5 1.5 17.4 March 90 2,464 57 458 3,069 2.9 80.3 1.9 14.9 April 103 2,773 63 438 3,377 3.1 82.1 1.9 13.0 May 152 4,208 87 652 5,099 3.0 82.5 1.7 12.8 June 213 6,419 138 984 7,754 2.7 82.8 1.8 12.7 July 254 6,094 126 881 7,355 3.5 82.9 1.7 12.0 August 230 6,610 94 938 7,872 2.9 84.0 1.2 11.9 September 212 6,457 114 953 7,736 2.7 83.5 1.5 12.3 October 197 5,197 119 699 6,212 3.2 83.7 1.9 11.3 November 79 2,756 50 423 3,308 2.4 83.3 1.5 12.8 December 106 3,131 75 462 3,774 2.8 83.0 2.0 12.2 Total 2012 1,792 49,827 1,004 7,771 60,394 3.0 82.5 1.7 12.9 2013 January 45 1,779 24 239 2,087 2.2 85.2 1.1 11.5 February 60 2,102 29 239 2,430 2.5 86.5 1.2 9.8 March 103 2,591 47 251 2,992 3.4 86.6 1.6 8.4 April 93 2,902 55 301 3,351 2.8 86.6 1.6 9.0 May 100 4,335 72 459 4,966 2.0 87.3 1.4 9.2 June 183 6,163 101 634 7,081 2.6 87.0 1.4 9.0 July 311 5,792 233 673 7,009 4.4 82.6 3.3 9.6 August 356 7,005 266 766 8,393 4.2 83.5 3.2 9.1 September 293 6,334 220 632 7,479 3.9 84.7 2.9 8.5 October 333 5,380 251 543 6,507 5.1 82.7 3.9 8.3 November 253 3,343 192 325 4,113 6.2 81.3 4.7 7.9 December 224 2,962 187 272 3,645 6.1 81.3 5.1 7.5 Total 2013 2,354 50,688 1,677 5,334 60,053 3.9 84.4 2.8 8.9
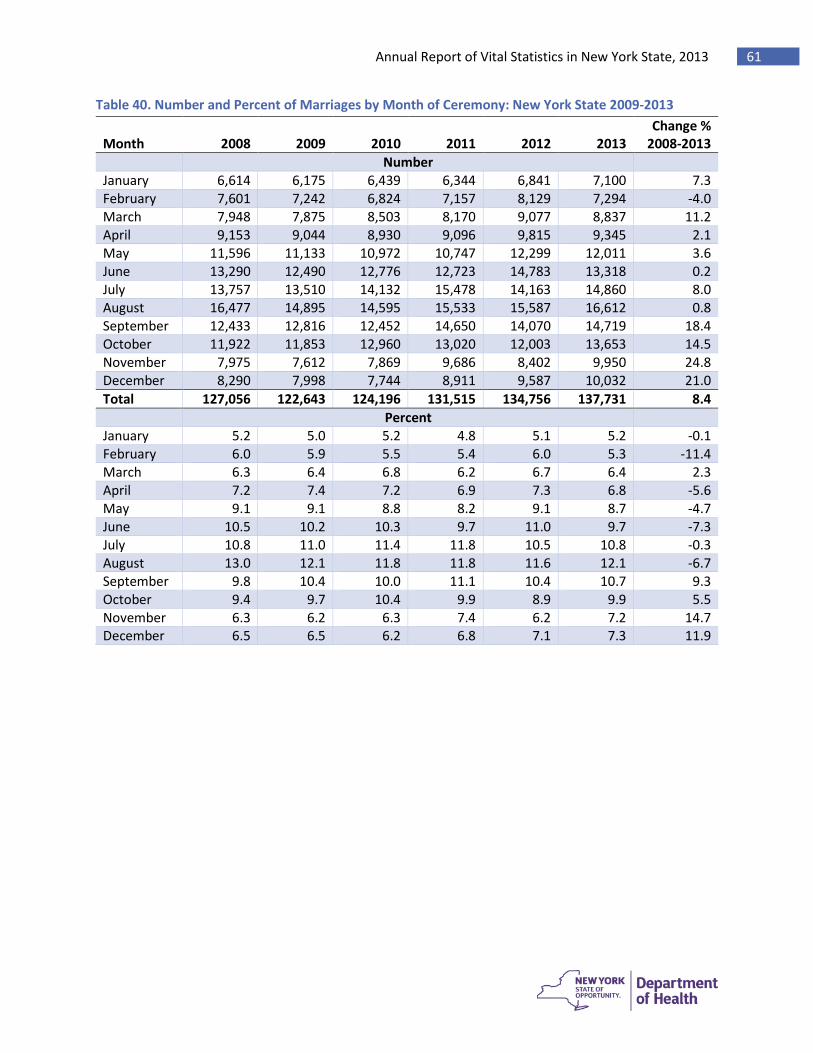
Annual Report of Vital Statistics in New York State, 2013 61
Table 40. Number and Percent of Marriages by Month of Ceremony: New York State 2009-2013 Month
2008
2009
2010
2011
2012
2013
Change % 2008-2013
Number January 6,614 6,175 6,439 6,344 6,841 7,100 7.3 February 7,601 7,242 6,824 7,157 8,129 7,294 -4.0 March 7,948 7,875 8,503 8,170 9,077 8,837 11.2 April 9,153 9,044 8,930 9,096 9,815 9,345 2.1 May 11,596 11,133 10,972 10,747 12,299 12,011 3.6 June 13,290 12,490 12,776 12,723 14,783 13,318 0.2 July 13,757 13,510 14,132 15,478 14,163 14,860 8.0 August 16,477 14,895 14,595 15,533 15,587 16,612 0.8 September 12,433 12,816 12,452 14,650 14,070 14,719 18.4 October 11,922 11,853 12,960 13,020 12,003 13,653 14.5 November 7,975 7,612 7,869 9,686 8,402 9,950 24.8 December 8,290 7,998 7,744 8,911 9,587 10,032 21.0 Total 127,056 122,643 124,196 131,515 134,756 137,731 8.4 Percent January 5.2 5.0 5.2 4.8 5.1 5.2 -0.1 February 6.0 5.9 5.5 5.4 6.0 5.3 -11.4 March 6.3 6.4 6.8 6.2 6.7 6.4 2.3 April 7.2 7.4 7.2 6.9 7.3 6.8 -5.6 May 9.1 9.1 8.8 8.2 9.1 8.7 -4.7 June 10.5 10.2 10.3 9.7 11.0 9.7 -7.3 July 10.8 11.0 11.4 11.8 10.5 10.8 -0.3 August 13.0 12.1 11.8 11.8 11.6 12.1 -6.7 September 9.8 10.4 10.0 11.1 10.4 10.7 9.3 October 9.4 9.7 10.4 9.9 8.9 9.9 5.5 November 6.3 6.2 6.3 7.4 6.2 7.2 14.7 December 6.5 6.5 6.2 6.8 7.1 7.3 11.9
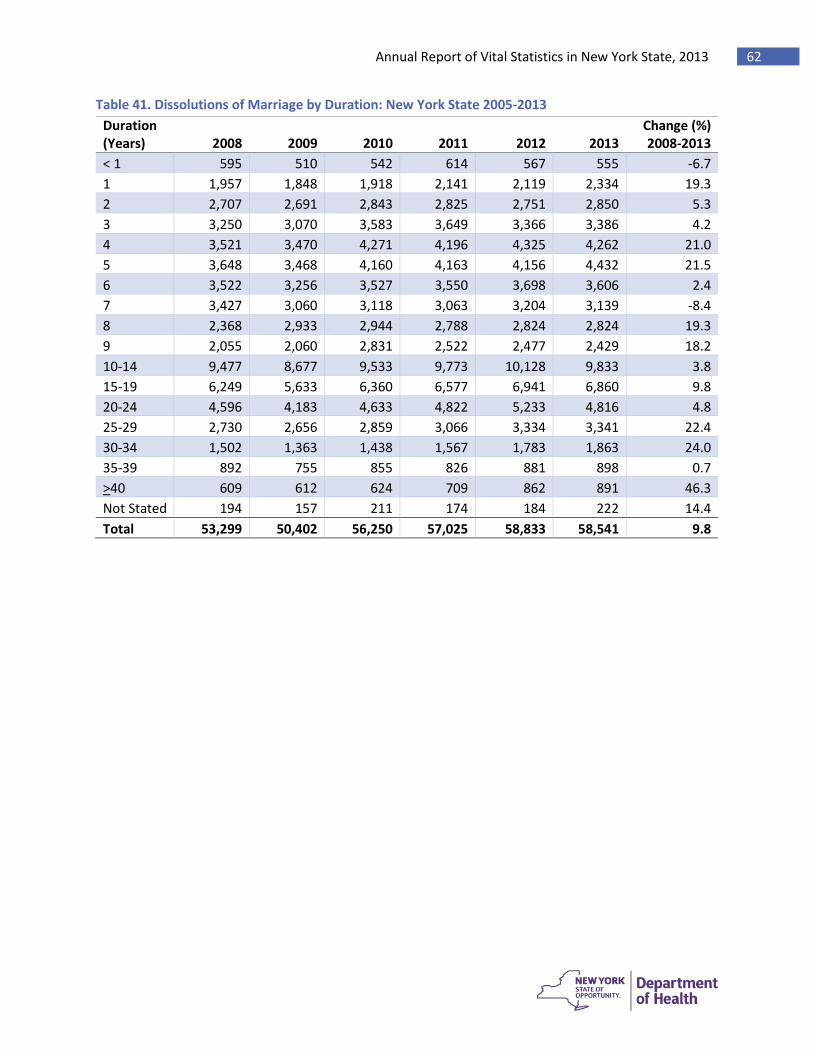
Annual Report of Vital Statistics in New York State, 2013 62
Table 41. Dissolutions of Marriage by Duration: New York State 2005-2013 Duration (Years) 2008 2009 2010 2011 2012 2013
Change (%) 2008-2013
< 1 595 510 542 614 567 555 -6.7 1 1,957 1,848 1,918 2,141 2,119 2,334 19.3 2 2,707 2,691 2,843 2,825 2,751 2,850 5.3 3 3,250 3,070 3,583 3,649 3,366 3,386 4.2 4 3,521 3,470 4,271 4,196 4,325 4,262 21.0 5 3,648 3,468 4,160 4,163 4,156 4,432 21.5 6 3,522 3,256 3,527 3,550 3,698 3,606 2.4 7 3,427 3,060 3,118 3,063 3,204 3,139 -8.4 8 2,368 2,933 2,944 2,788 2,824 2,824 19.3 9 2,055 2,060 2,831 2,522 2,477 2,429 18.2 10-14 9,477 8,677 9,533 9,773 10,128 9,833 3.8 15-19 6,249 5,633 6,360 6,577 6,941 6,860 9.8 20-24 4,596 4,183 4,633 4,822 5,233 4,816 4.8 25-29 2,730 2,656 2,859 3,066 3,334 3,341 22.4 30-34 1,502 1,363 1,438 1,567 1,783 1,863 24.0 35-39 892 755 855 826 881 898 0.7 >40 609 612 624 709 862 891 46.3 Not Stated 194 157 211 174 184 222 14.4 Total 53,299 50,402 56,250 57,025 58,833 58,541 9.8
Annual Report of Vital Statistics in New York State, 2013 63
Chapter 6. Additional Resources
New York State Vital Statistics Tables Available on DOH Website, 1997-2013
Population Table 1 - Estimated Population by Sex, Age and Region, New York State Table 1a - Estimated Female Population by County and Age, New York State Table 2 - Estimated Population, Land Area and Population Density by County, New York State Table 3 - New York State Life Tables by Sex Live Births Table 4 - Live Birth Summary by Mother's Race/Ethnicity, New York State Table 5 - Live Birth Summary by Mother's Age, New York State Table 6a - Live Births by Race/Ethnicity, Birthweight and Mother's Age, New York State Table 6b - Live Births by Race/Ethnicity, Month Prenatal Care Began and Mother's Age, New York State Table 7 - Live Births by Mother's Age and Resident County, New York State Table 8 - Live Birth and Fertility Rates by Mother's Age and Resident County, New York State Table 9 - Live Births by Race/Ethnicity and Resident County, New York State Table 10 - Out of Wedlock Live Births by Mother's Age and Resident County, New York State Table 11 - Low Birthweight (<2500 grams) Live Births by Mother's Age and Resident County, New York State Table 11a - Live Births by Birthweight and Resident County, New York State Table 11b - Live Births by Gestation in Weeks and Resident County, New York State Table 12 - Live Births by Month Prenatal Care Began and Resident County, New York State Table 12a - Percent Early and Late or No Prenatal Care by Mother's Age and Resident County, New York State Table 12b - Percent Early and Late or No Prenatal Care by Mother's Race and Resident County, New York State Table 13 - Live Births by Primary Financial Coverage and Resident County, New York State Table 14 - Live Births by Method of Delivery and Resident County, New York State Table 15 - Most Popular Birth Names by Sex, New York State Spontaneous Fetal Deaths Table 16 - Spontaneous Fetal Deaths (All Gestations) by Woman's Age and Resident County, New York State Table 17 - Spontaneous Fetal Deaths (Gestations 20 weeks and Over) by Woman's Age and Resident County, New York State Table 18 - Spontaneous Fetal Deaths and Rates by Race/Ethnicity and Resident County, New York State Induced Abortions Table 19 - Induced Abortion Summary Information by Race/Ethnicity, New York State Table 20 - Induced Abortion Summary Information by Woman's Age, New York State Table 21 - Induced Abortions by Woman's Age and Resident County, New York State Table 22 - Abortion Ratios by Woman's Age and Resident County, New York State
Annual Report of Vital Statistics in New York State, 2013 64
Table 23 - Induced Abortions and Abortion Ratios by Race/Ethnicity and Resident County, New York State Table 24 - Induced Abortions by Financial Coverage and Resident County, New York State Table 25 - Induced Abortions by Operative Procedure and Resident County, New York State Pregnancies Table 26 - Total Pregnancies by Woman's Age and Resident County, New York State Table 27 - Total Pregnancy Rates by Woman's Age and Resident County, New York State Table 28 - Total Pregnancies (Spontaneous Fetal Deaths Gestations 20 Weeks and Over Only) by Woman's Age and Resident County, New York State Table 29 - Total Pregnancies by Race/Ethnicity and Resident County, New York State Table 30 - Total Pregnancies and Teenage Pregnancies by Type and Resident County, New York State Mortality Table 31a - Death Summary Information by Race/Ethnicity, New York State Table 31b - Death Summary Information by Race/Ethnicity, New York State Exclusive of New York City Table 31c - Death Summary Information by Race/Ethnicity, New York City Table 32a - Death Summary Information by Age, New York State Table 32b - Death Summary Information by Age, New York State Exclusive of New York City Table 32c - Death Summary Information by Age, New York City Table 33a - Deaths and Death Rates from Selected Causes, New York State, Table 33b - Deaths and Death Rates from Selected Causes, New York State Exclusive of New York City Table 33c - Deaths and Death Rates from Selected Causes, New York City Table 34a - Deaths from Five Leading Causes of Death by Age and Race/Ethnicity, New York State Table 34b - Deaths from Five Leading Causes of Death by Age and Race/Ethnicity, New York State Exclusive of New York City Table 34c - Deaths from Five Leading Causes of Death by Age and Race/Ethnicity, New York City Table 35 - Deaths by Age and Resident County, New York State Table 36 - Death Rates by Age and Resident County, New York State Table 37 - Deaths by Race/Ethnicity and Resident County, New York State Table 38 - Selected Causes of Death by Resident County, New York State Table 39 - Death Rates and Selected Causes of Death, by Resident County, New York State Table 40 - Age-Sex Adjusted Death Rates and Selected Causes of Death by Resident County, New York State Table 41a - Deaths by Selected Causes of Death, Sex and Age, New York State Table 41b - Deaths by Selected Causes of Death, Sex and Age, New York State Exclusive of New York City Table 41c - Deaths by Selected Causes of Death, Sex and Age, New York City Table 42 - Deaths Due to Cancer by Site, Sex and Age, New York State Table 43 - Deaths Due to Suicide by Race/Ethnicity, Sex and Age, by Region, New York State Table 44 - Deaths Due to Homicide and Legal Intervention by Race/Ethnicity, Sex and Age, by Region, New York State Table 45 - Infant Deaths, Neonatal Deaths, Post Neonatal Deaths and Perinatal Mortality by Resident County, New York State Table 46a - Leading Causes of Premature Death and Years of Life Lost, New York State Table 46b - Leading Causes of Premature Death and Years of Life Lost, New York State Exclusive of New York City Table 46c - Leading Causes of Premature Death and Years of Life Lost, New York City Marriages and Dissolutions of Marriage Table 47 - Marriages by County of Occurrence and Month of Ceremony, New York State Table 47a - Marriages by County of Occurrence and Gender - New York State Exclusive of New York City Table 48 - Dissolutions of Marriage by County of Decree and Type of Decree, New York State Table 49 - Dissolutions of Marriage by Duration and Type of Decree by Region, New York State Table 50 - Divorces by County of Decree and Legal Grounds, New York State Table 51 - Divorces by County of Decree and Duration of Marriage, New York State
Annual Report of Vital Statistics in New York State, 2013 65
Table 52 - Divorces by County of Decree and Number of Children Under 18, New York State Sub-County Data Table 53 - City and Village Profiles -- Selected Statistics for Cities and Villages over 10,000 Population, New York State Table 54 - Total Live Births by School District Area, 2002-2013 Table 55 - Live Births by Minor Civil Division, 2002-2013
Other State Vital Statistics Web Links State/Region Vital Statistics Web Link National Vital Statistics System
http://www.cdc.gov/nchs/nvss.htm
National Vital Statistics Reports
http://www.cdc.gov/nchs/products/nvsr.htm
Alabama http://adph.org/vitalrecords/ Alaska http://dhss.alaska.gov/dph/VitalStats/Pages/default.aspx Arizona http://azdhs.gov/plan/ Arkansas http://www.healthy.arkansas.gov/programsservices/certificatesvitalrecords/pages
/default.aspx California http://www.cdph.ca.gov/data/dataresources/requests/Pages/VitalStatisticsBirthD
eathFetalDeathMarriageData.aspx Colorado https://www.colorado.gov/pacific/cdphe/center-health-and-environmental-
information-and-statistics-topics Connecticut http://www.ct.gov/dph/cwp/view.asp?a=3132&q=394598 Delaware http://www.dhss.delaware.gov/dhss/dph/pubreportsaz.html#V District of Columbia
http://doh.dc.gov/node/139482
Florida http://www.flpublichealth.com/VSBOOK/VSBOOK.aspx Georgia http://dph.georgia.gov/VitalRecords Hawaii http://health.hawaii.gov/vitalstatistics/ Idaho http://www.healthandwelfare.idaho.gov/Health/VitalRecordsandHealthStatistics/
HealthStatistics/VitalStatistics/tabid/914/Default.aspx Illinois http://www.idph.state.il.us/health/statshome.htm Indiana http://www.in.gov/isdh/18888.htm Iowa https://www.idph.state.ia.us/apl/health_statistics.asp Kansas http://www.kdheks.gov/hci/annsumm.html Kentucky http://chfs.ky.gov/dph/vital/vitalstats.htm Louisiana http://dhh.louisiana.gov/index.cfm/page/647/n/238 Maine http://www.maine.gov/dhhs/mecdc/public-health-systems/data-
research/data/index.html Maryland http://dhmh.maryland.gov/vsa/sitepages/reports.aspx Massachusetts http://www.mass.gov/eohhs/gov/departments/dph/programs/admin/dmoa/ Michigan http://www.michigan.gov/mdch/0,4612,7-132-2944_4669---,00.html
Annual Report of Vital Statistics in New York State, 2013 66
State/Region Vital Statistics Web Link Minnesota http://www.health.state.mn.us/divs/chs/ Mississippi http://msdh.ms.gov/msdhsite/_static/31,0,75.html Missouri http://health.mo.gov/data/vitalstatistics/ Montana http://dphhs.mt.gov/statisticalinformation Nebraska http://dhhs.ne.gov/publichealth/pages/ced_vs.aspx Nevada http://www.vitalrecordsus.com/nevada-vital-records.html New Hampshire http://sos.nh.gov/vital_records.aspx New Jersey http://www.nj.gov/health/chs/ New Mexico http://nmhealth.org/about/erd/bvrhs/hsp/ New York https://www.health.ny.gov/statistics/vital_statistics/ New York City http://www.nyc.gov/html/doh/html/data/vs-summary.shtml North Carolina http://www.schs.state.nc.us/data/vital.cfm North Dakota http://ndhealth.gov/vital/stats.htm Ohio http://www.odh.ohio.gov/healthstats/dataandstats.aspx Oklahoma http://www.ok.gov/health/Data_and_Statistics/Center_For_Health_Statistics/Heal
th_Care_Information/Vital_Statistics/Vital_Statistics_Data_and_Reports/ Oregon https://public.health.oregon.gov/BirthDeathCertificates/VitalStatistics/annualrepo
rts/Pages/index.aspx Pennsylvania http://www.portal.state.pa.us/portal/server.pt?open=514&objID=596032&mode=
2 Rhode Island http://www.health.ri.gov/publications/bytopic.php?parm=Vital Records South Carolina https://www.scdhec.gov/Health/SCPublicHealthStatisicsMaps/BiostatisticsPublicat
ions/ South Dakota https://doh.sd.gov/statistics/ Tennessee http://tn.gov/health/article/cedep-reports Texas http://www.dshs.state.tx.us/chs/vstat/annrpts.shtm Utah http://health.utah.gov/data/ Vermont http://healthvermont.gov/research/ Virginia http://www.vdh.state.va.us/HealthStats/stats.htm Washington http://www.doh.wa.gov/DataandStatisticalReports/VitalStatisticsandPopulationDa
ta West Virginia http://www.wvdhhr.org/bph/hsc/statserv/VitalStats.asp Wisconsin https://www.dhs.wisconsin.gov/stats/vitalstats.htm Wyoming http://health.wyo.gov/rfhd/vital_records/reports.html
Annual Report of Vital Statistics in New York State, 2013 67
Technical Notes
How the Vital Event Data Are Collected New York State consists of two vital event registration areas, New York City and New York State Exclusive of New York City (referred as Rest of State). New York City (NYC) includes the five boroughs of Bronx, Kings (Brooklyn), New York (Manhattan), Queens, and Richmond (Staten Island); the remaining 57 counties comprise the Rest of State (ROS).
The New York State Department of Health (NYSDOH), processes data from live births, deaths, spontaneous fetal deaths/induced abortions, and marriage and dissolution of marriage recorded outside of NYC. Through a cooperative agreement, the NYSDOH receives data on live births, deaths, spontaneous fetal deaths/induced abortions and marriage and dissolution of marriage recorded in NYC from the New York City Department of Health and on live births and deaths recorded outside of New York State to residents of New York State from other states and Canada. NYSDOH processes data from dissolution of marriage certificates recorded for the entire state.
Pregnancies / Spontaneous Fetal Deaths / Induced Abortions
Fetal deaths include both spontaneous fetal deaths and induced abortions which are presented separately in this report.
Fetal death is defined by NYS Public health Law (PHL) §4160 to be the death prior to the complete expulsion or extraction from its mother of a product of conception; the death is indicated by the fact that after such separation, the fetus does not breathe or show any other evidence of life such as beating of the heart, pulsation of the umbilical cord, or definite movement of voluntary muscles.
New York State Public Health Law requires the registration of all fetal deaths regardless of the gestation of the fetus. Unlike birth and death registration, the registration of fetal mortality is not uniform across the United States. In order to provide data comparable to other states, this report presents data for both spontaneous fetal deaths of gestation 20 weeks or more and for spontaneous fetal deaths of all gestations. Due to suspected underreporting of spontaneous fetal deaths, particularly those under 20 weeks gestation, caution should be used when analyzing spontaneous fetal death data.
Categories used to report operative procedure for induced abortions include dilation and curettage (D&C), suction and curettage, dilation and evacuation (D&E), saline injection, prostaglandin injection, medical (non-surgical) and other that includes hysterectomy, hysterectomy and other procedures.
Annual Report of Vital Statistics in New York State, 2013 68
Beginning in 1998, New York City combines saline and prostaglandin injection and this combination is reported in the saline injection procedure.
Live Births
New York State Public Health Law §4130 defines a live birth as the complete expulsion or extraction from its mother of a product of conception, irrespective of the duration of pregnancy, which, after such separation, breathes or shows any other evidence of life such as beating of the heart, pulsation of the umbilical cord or definite movement of voluntary muscles, whether or not the umbilical cord has been cut or the placenta is attached.
In 2003, the National Center of Health Statistics (NCHS) revised the U.S. Standard Certificate of Live Birth. The NCHS revisions were implemented outside of New York City beginning on January 1, 2004 in a web-based live birth registration system. NYC implemented the changes beginning on January 1, 2008.
One major change associated with the adoption of the revised birth certificate is the way the variable Race is reported. The selection of race for the statistical reporting of live births is based upon the self-reported race of the mother only. Prior to 2004, a mother was allowed to select only one race category (1990 Census scheme), even when she identified herself with more than one race due to her multiple race heritage. The revised birth certificate uses the Census 2000 scheme, allowing the mother and the father to report more than one race from among 15 race categories. Under this system, a response of white and no other races means that the respondent does not identify herself as part of any other race but white, a response of black and no other race means that the respondent does not identify herself as part of any other race but black. The current coding scheme uses the labels white only and black only respectively to denote these racial identities. All other respondents are included in the race category, other. Although not presented in this report, it is possible to tabulate the race of mother or the race of a decedent in several race combination categories.
Ethnicity is separate from race and is based on the ethnicity of the mother. Ethnicity distinguishes individuals of Spanish origin regardless of race. In order to better identify disparities in birth outcomes, race data is separated into Hispanic and Non-Hispanic categories. Non-Hispanic women are categorized by their race, Hispanic women are categorized by their ethnicity.
Both clinical estimate of gestation and calculated gestation based on the date of birth and the date of last menses are used in determining weeks gestation. Using methodology developed by NCHS, if the calculated gestation is missing or inconsistent with birthweight the clinical estimate is used instead if it is consistent with birthweight.
Early prenatal care is defined as prenatal care during the first trimester of the pregnancy. Late prenatal care is defined as prenatal care during the third trimester of the pregnancy. Unknown prenatal care is broken down as follow: Start Unknown for cases where the mother received prenatal care but not enough information was available to determine when it began and Unknown when no information is available to determine whether or not any prenatal care was received. The month in which prenatal care began is determined by calculating the interval between the date of last normal menses as stated on the

Annual Report of Vital Statistics in New York State, 2013 69
birth certificate, or in cases where the clinical estimate of gestation is used, the calculated LMP and the date of the first prenatal visit. This calculation is consistent with the calculation of gestational age.
Attendant at birth is categorized as physician, midwife or other. Physician includes medical doctors and doctors of osteopathy. Midwife includes certified nurse midwives and midwives.
The number of out of wedlock live births is imputed. New York State Public Health Law § 4135 prohibits the specific statement on the birth certificate as to whether the child was born in- or out-of-wedlock. Out-of-wedlock live births are defined as those births for which a mother reports that a paternity acknowledgement has been filed or births for which no further information is supplied by the mother.
Deaths
New York State PHL does not require that death be pronounced by a physician. Unless there is a local law that requires otherwise, anyone may make the pronouncement of death. However, this decision is more likely to fall upon emergency medical technicians, policemen, firemen and other emergency personnel. The pronouncement may even be implied by the decision to call a funeral director or coroner/medical examiner instead of an ambulance. NYS PHL §4140 requires that a death certificate be filed within 72 hours after death, or the finding of the body, by a funeral director or undertaker licensed and currently registered by the NYSDOH.
Unless otherwise specified, the cause of death reported in this publication is the underlying cause classified according to the tenth revision of the International Classification of Diseases (ICD, 10th revision) adopted by New York State in 1999. Historically, several revisions of the ICD have been used, therefore, it is necessary to employ a comparability ratio when comparing cause of death statistics across revisions. Comparability ratios have been published by the National Center for Health Statistics (NCHS).
Infant and neonatal mortality rates published in this report are based on all live births regardless of birth weight or gestation. No attempt was made to account for the viability of the infant at birth. These rates for a specific year are based on the number of deaths prior to one year of age and the number of live births that occurred during that year.
When tabulating deaths by place of death, other institution is defined as state institution, Veterans Administration facility, hospice, federal institution, health related facility or home for the aged.
The race and ethnicity information reported on death certificates is typically provided by the decedent's family. Race data is not categorized by Non-Hispanic and Hispanic on mortality tables because of the under-reporting of Hispanic ethnicity on death certificates1.
Marriage and Dissolution of Marriage
Marriages in New York State are required to be reported through town and county clerks. Marriages in New York City are tabulated by borough in which the license is issued. New York City marriage data is obtained from the City of New York, Office of the City Clerk and not from the New York City Health
Annual Report of Vital Statistics in New York State, 2013 70
Department. With the passage of the Marriage Equality Act, same sex marriage became legal in New York on July 24, 2011. The composition of couples married after that date is not available since sex is not required information on the license.
Dissolution of Marriage Certificates are filed by attorneys with the County Clerk of the county where the divorce is granted. The certificate is forwarded directly to the NYSDOH by the County Clerk. A local copy of the dissolution is not kept by the Clerk. This process applies for all counties of the state, including those in NYC.
Populations
Population Estimates - All population used in this report are derived from the NCHS released estimates of "Bridged Race Vintage," for the specific year which are consistent with the Bureau of the Census estimates).
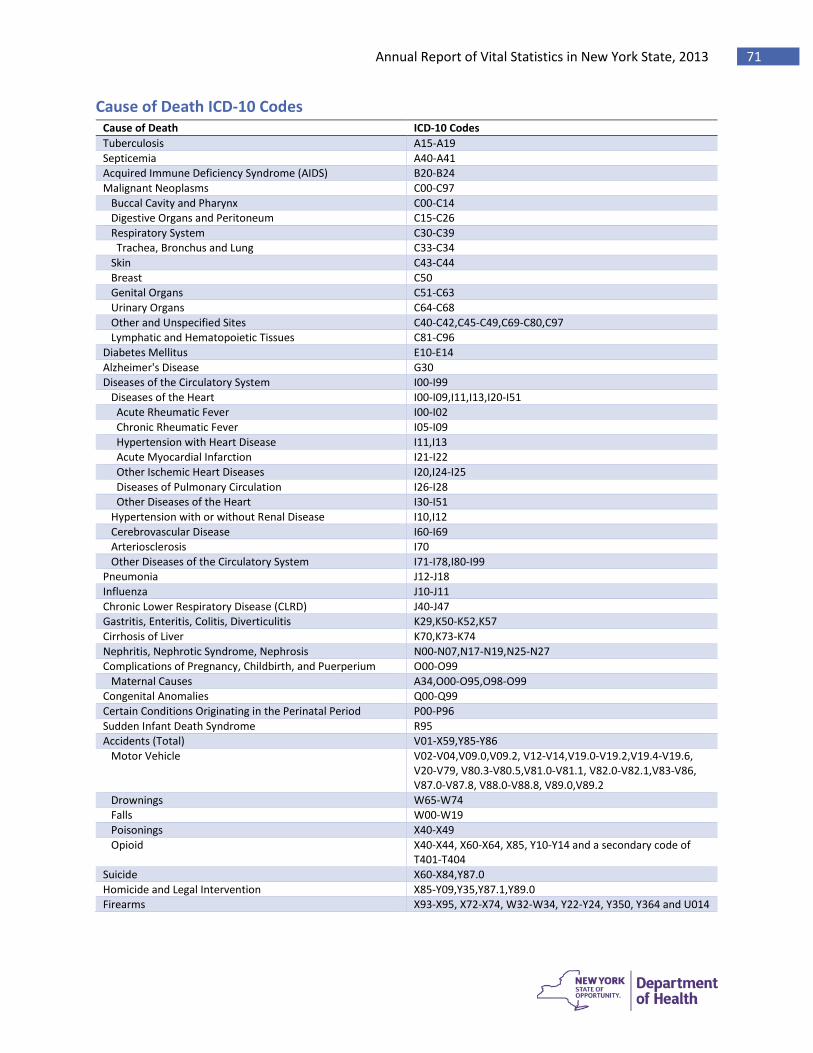
Annual Report of Vital Statistics in New York State, 2013 71
Cause of Death ICD-10 Codes Cause of Death ICD-10 Codes Tuberculosis A15-A19 Septicemia A40-A41 Acquired Immune Deficiency Syndrome (AIDS) B20-B24 Malignant Neoplasms C00-C97 Buccal Cavity and Pharynx C00-C14 Digestive Organs and Peritoneum C15-C26 Respiratory System C30-C39 Trachea, Bronchus and Lung C33-C34 Skin C43-C44 Breast C50 Genital Organs C51-C63 Urinary Organs C64-C68 Other and Unspecified Sites C40-C42,C45-C49,C69-C80,C97 Lymphatic and Hematopoietic Tissues C81-C96 Diabetes Mellitus E10-E14 Alzheimer's Disease G30 Diseases of the Circulatory System I00-I99 Diseases of the Heart I00-I09,I11,I13,I20-I51 Acute Rheumatic Fever I00-I02 Chronic Rheumatic Fever I05-I09 Hypertension with Heart Disease I11,I13 Acute Myocardial Infarction I21-I22 Other Ischemic Heart Diseases I20,I24-I25 Diseases of Pulmonary Circulation I26-I28 Other Diseases of the Heart I30-I51 Hypertension with or without Renal Disease I10,I12 Cerebrovascular Disease I60-I69 Arteriosclerosis I70 Other Diseases of the Circulatory System I71-I78,I80-I99 Pneumonia J12-J18 Influenza J10-J11 Chronic Lower Respiratory Disease (CLRD) J40-J47 Gastritis, Enteritis, Colitis, Diverticulitis K29,K50-K52,K57 Cirrhosis of Liver K70,K73-K74 Nephritis, Nephrotic Syndrome, Nephrosis N00-N07,N17-N19,N25-N27 Complications of Pregnancy, Childbirth, and Puerperium O00-O99 Maternal Causes A34,O00-O95,O98-O99 Congenital Anomalies Q00-Q99 Certain Conditions Originating in the Perinatal Period P00-P96 Sudden Infant Death Syndrome R95 Accidents (Total) V01-X59,Y85-Y86 Motor Vehicle V02-V04,V09.0,V09.2, V12-V14,V19.0-V19.2,V19.4-V19.6,
V20-V79, V80.3-V80.5,V81.0-V81.1, V82.0-V82.1,V83-V86, V87.0-V87.8, V88.0-V88.8, V89.0,V89.2
Drownings W65-W74 Falls W00-W19 Poisonings X40-X49 Opioid X40-X44, X60-X64, X85, Y10-Y14 and a secondary code of
T401-T404 Suicide X60-X84,Y87.0 Homicide and Legal Intervention X85-Y09,Y35,Y87.1,Y89.0 Firearms X93-X95, X72-X74, W32-W34, Y22-Y24, Y350, Y364 and U014

Annual Report of Vital Statistics in New York State, 2013 72
Acknowledgments
O
New York State Department of Health
Howard Zucker, M.D., J.D., Commissioner
Office of Quality and Patient Safety Patrick J. Roohan, Director
Joseph Anarella, Deputy Director Foster Gesten, M.D., Medical Director
Division of Information and Statistics
Mary Beth Conroy, Director Tom Melnik, Deputy Director
Bureau of Health Informatics
Scott Franko, Director
Vital Statistics Unit Larry Schoen, Director
Tong Wang, Research Scientist
Division of Information and Statistics Office of Quality and Patient Safety
New York State Department of Health Corning Tower, Room 1911
Albany, New York 12237 Phone: (518) 474-3189
Email: [email protected]