Embed Size (px)
Citation preview

Annual Results 2018
Annual Results 2018Swiss Re investor and analyst presentation Zurich, 21 February 2019
Annual Results 2018
Earnings in context
Focus areas of Annual Results 2018
2
Strong renewals
Life Capital transition
Capital actions
Leadership in sustainability

Annual Results 2018
USD 421m reported
Group net income
~USD 1bn higher claims from large losses vs. expectations
~USD 600m negative impactfrom recent change in US GAAP
accounting guidance
2018
1502017
2011
2005
81
143
140
4th highest annual market insured losses(USD bn)1
Worst equity markets in 10 years
Group net income significantly impacted by large losses and recent change in US GAAP accounting guidance on equity securities
Nat cat Man-made
3
MSCI World MSCI China
-9% -20%
in 2018 in 2018
Impact2 on Swiss Re’s 2018 results:
1 Historic losses adjusted for inflation2 Pre-tax

Annual Results 2018 4
0%
2%
4%
6%
8%
10%
12%
14%
4.2
0.8
4.0
0.0
3.6
3.4
3.8
4.6
1.0
4.4
0.6
0.2
0.4
2014 20172012 2013 20162015 2018
Group ROE 700bps above 10yr US govt. bonds
Group Net Income Impact of change in US GAAP accounting guidance
Second consecutive year with significantly higher than expected large losses
• After benign nat cat loss years from 2012-2016 the insurance industry experienced two elevated loss years
• Estimated claims from multiple nat cat and man-made disasters for Swiss Re amounted to USD 3.0bn in 2018
USD bn

Annual Results 2018
P&C Reinsurance
L&H Reinsurance
Corporate Solutions
Life Capital
• Underlying performance slightly below expectations
• Cost discipline supported by productivity measures
• Positive outlook due to improving price trend
• ROE in line with target range
• Strong growth driven by large transactions continued
• Asia and transactions remain key drivers for profitable growth
• Disappointing underwriting results
• 2018: 3% price increases; 2019: positive momentum to continue
• Ongoing portfolio management actions and further pruning in 2019
• GCG at upper end of target range; ROE below target
• ReAssure IPO preparation continues
• Dynamic open book growth continues
Return on equity
3.7%
Return on equity
11.1%
Return on equity
-19.4%
Gross cash generation
USD 818m
2018 performance2019
outlook
BU review: more positive outlook after a challenging year
5

Annual Results 2018
Addressing Corporate Solutions underperformance
• Difficult market environment: man-made losses above expectations and price improvements not yet sufficient after years of decline
• Higher net exposures led to large single event losses
• Unfavourable PYD related to structure1 and business mix (Excess Layers and overweight US)
• High cost ratio because of on-going investments and continued lack of scale
Drivers of underperformance
• Portfolio pruning started in 2017, continued in 2018 and intensifying in 2019
• Continued focus on productivity
• Higher prices already experienced and expecting more
• Reinsurance programme adjusted but to be revisited
• New experienced CEO to start in March 2019
Actions taken
Progress has been made and we will continue to address Corporate Solutions underperformance
Corporate Solutions remains core to Swiss Re and we continue to see long-term attractive potential in the business
Business update to be provided with Half-year 2019
Results
1 Positive development on Corporate Solutions historical loss reserves remaining in Reinsurance6

Annual Results 2018 7
Strong outcome of January renewals for P&C Reinsurance
P&C Reinsurance renewals
• Volume up 19% YTD –14% driven by transactions, 5% from growth in core business
• Price quality up 1%; renewals dominated by non loss affected regions
• Further price improvements expected in forthcoming renewals this year
• 2019 combined ratio estimate2 of 98%, reflecting price changes and scale effects
8.4
Total renewable 1 January
2.5
1.4
Cancelled Increase on renewable
Renewed New business
0.5
Estimated outcome
10.0
7.0
+19%
% of total 100% -17% 83% +6% +30% 119%
Price change1 +1%Exposure change +18%
(USD bn)
1 Price change defined as change in discounted premiums net of commissions / discounted expected claims; price change is adjusted for portfolio mix effects2 Assuming an average large loss burden

Annual Results 2018 8
January renewals for P&C Reinsurance supported by growth in Nat Cat and short-tail Casualty business
Up for renewal Jan
Premiumchange
Estimatedoutcome Jan
Price change
Nat Cat 1.2 +22% 1.5
Property2 1.9 -9% 1.7
Specialty 1.4 +7% 1.5
Casualty 4.0 +35% 5.4
Total 8.4 +19% 10.0 +1%
Up for renewal Jan
Premiumchange
Estimatedoutcome Jan
Americas 2.3 +54% 3.6
EMEA 4.2 +5% 4.4
Asia 1.9 +7% 2.0
Total 8.4 +19% 10.0
• Economic capital deployed increased by 20%: +36% for non-proportional Property Nat Cat business and +27% for Casualty
• Increase in Nat Cat business driven by growth in the US
• Casualty growth driven by large transactions, particularly in US SME market with short duration, low volatility and good performance track record
• Underwriting discipline maintained across all lines of business and regions
Gross premium volume by line of business1 (USD bn) Gross premium volume by region1 (USD bn)
1 Treaty portfolio2 Excluding Nat Cat

Annual Results 2018 9
ReAssure developments in 2018…
MS&AD stake increased to 25%
Exceptional GCG: USD 818m
IPO preparations continued
New Chairman and new CEO appointed
Life Capital transformation from closed book consolidator to dynamic primary B2B2C business in motion
…complemented by open book evolution
19in 2018
5in 2016
0
120k
60k
2014 2016 2018
# iptiQ distribution
partners
# new policies written in iptiQ
2019 outlook
Enhancing access to risk pools
with iptiQ platform
Scale-up ofelipsLife platform
2in 2014
Focus on ReAssure IPO preparation
0
150
300
450
elipsLife premium volume (USD m)
20182009 2014
Annual Results 2018
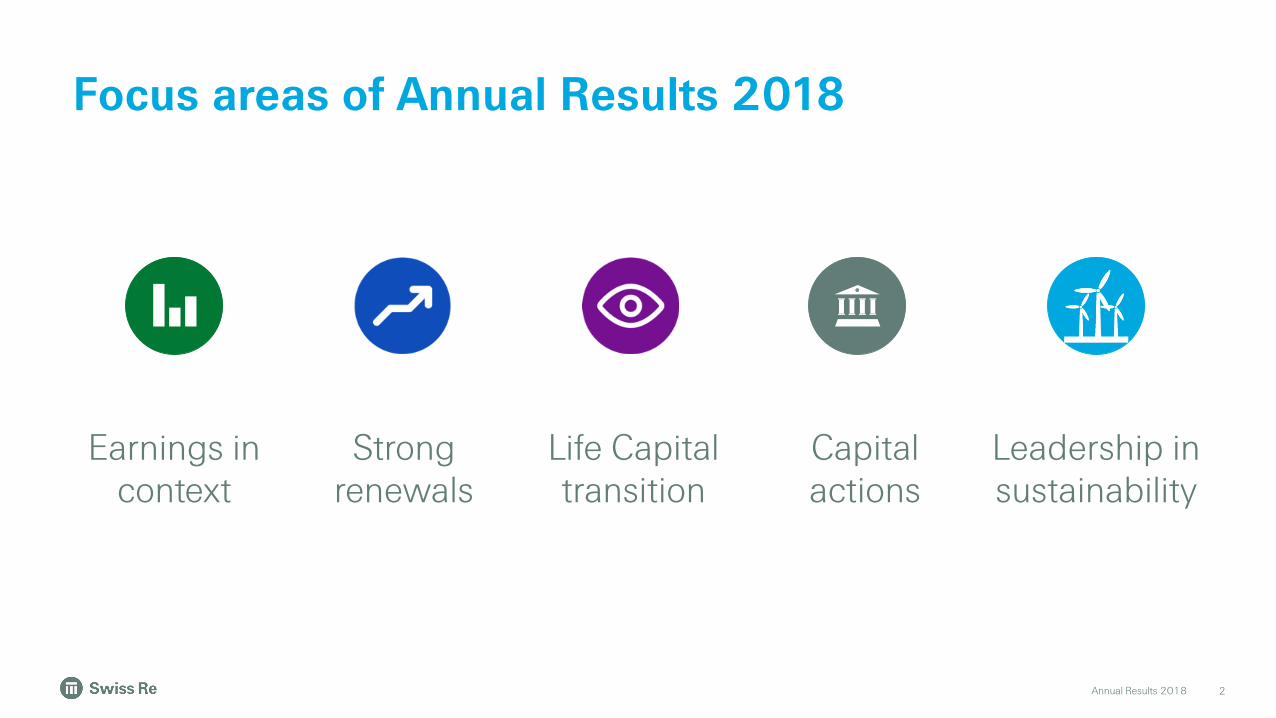
Swiss Re proposes attractive capital management actions
10
4.85 5.00 5.60
201912017 2018
+3% +12%
1.00 1.00
1.00
2017/18 2018/19 2019/201
1.00
Regular dividend per share (CHF)
Share buy-back programme (CHF bn)
12% regular dividend per share increase
Rebasing supported by long-term economic earnings and sustainable capital generation
New share buy-back programme1
consistent with Swiss Re’s capital management priorities
• Up to CHF 1bn with no commencement pre-conditions
• Up to CHF 1bn contingent on 2019 Group excess capital development, e.g. increase as a result of successful reduction of Swiss Re’s holding in ReAssure to below 50%
Very strong Group capitalisation, with Swiss Re’s Group SST ratio comfortably above the 220% target level
1 Subject to AGM 2019 approval; commencement of share repurchases subject to Board approval and legal and regulatory requirements being satisfied

Annual Results 2018 11
Close to
100%assets considering ESG criteria
96number of (sub-)sovereigns
advised on climate risk resilience
~3 400wind and solar farms insured
Innovative solutions
• First county-level earthquake parametric cover in China
• Largest sovereign-sponsored cat bond issued by the World Bank in Latin America
• Flood insurance for homeowners in Florida, based on proprietary flood model
Responsible investing
• Early mover in switching to ESG benchmarks in equity and credit markets
• USD 1.6bn of green bonds as of end FY 2018
Sustainable underwriting
• Implemented thermal coal policy – 30% investment threshold extended to underwriting
• Active in all renewable energy re/insurance and “lead market” for offshore wind risks
Recognised leadership
• Externally recognised: AAA-rating in MSCI ESG assessment and top 3 in DJSI
• Active participation in European and global expert groups
Key actions in 2018
More public-private partnerships are crucial to strengthen resilience and mitigate effect of climate change
Swiss Re maintains leadership in sustainability
For further information on sustainability at Swiss Re please visit http://media.swissre.com/documents/Swiss_Re_ESG_Highlights.pdf

Annual Results 2018Annual Results 2018
Financial highlights
12

Annual Results 2018
Key figures
131 Excluding contingent capital instruments (nil as of 31 December 2018 and USD 750m in L&H Re as of 31 December 2017); basis for ROE and BVPS calculations2 Excluding estimated impact of the change in US GAAP accounting guidance on recognition and measurement of financial instruments, effective for the Group as of 1 January 2018
Key figures excluding impact of change in US GAAP accounting guidance
USD m, unless otherwise stated
• Premiums earned and fee income 16 095 12 835 3 925 1 606 - 34 461 33 705
• Net income/loss 370 761 -405 23 -328 421 331
• Return on investments 2.4% 3.7% 2.1% 3.3% -1.5% 2.8% 3.9%
• Return on equity 3.7% 11.1% -19.4% 0.4% -6.0% 1.4% 1.0%
• Combined ratio 104.0% - 117.5% - -
• Earnings per share (USD) 1.37 1.03
(CHF) 1.34 1.02
• Common shareholders' equity1 9 483 6 274 1 795 5 113 5 265 27 930 33 374
of which unrealised gains -65 786 -60 1 215 26 1 902 4 744
• Book value per common share (USD) 93.09 106.09
(CHF) 91.72 103.37
• Net income/loss excluding accounting change impact 2 547 829 -387 17 -112 894
• Return on investments excluding accounting change impact 2 2.9% 3.9% 2.2% 3.3% 2.9% 3.3%
• Return on equity excluding accounting change impact 2 5.4% 12.1% -18.5% 0.3% -2.0% 2.9%
TotalFY 2018
TotalFY 2017P&C Re L&H Re
CorporateSolutions Life Capital Group items

Annual Results 2018Annual Results 2018
P&C Reinsurance
14
Impacted by several large nat cat and man-made losses

Annual Results 2018
P&C Reinsurance impacted by several large nat cat and man-made losses
15
Net operating margin1 (%) Combined ratio (%)
Net income (USD m, LHS), Return on equity (%, RHS)
Net premiums earned
USD 16.7bnin 2017
USD 16.1bnin 2018
• Net impact of large nat cat events in 2018 5.0%pts above expectations. Favourable prior-year development positively impacted the combined ratio by 0.9%pts
• Decrease of net premiums earned driven by a reduction of Chinese quota shares and US Casualty, partially offset by large transactions in Asia and the US
• Underwriting margin impacted by several large losses in both periods
• Decrease in investment margin driven by market value losses on equity securities and lower realised gains from fixed income securities
• Increase in the expense margin driven by the decrease in premiums earned
8.9 7.8
-3.9
2.9
-6.3
-6.4
-1.3
2017 2018
4.3
+5.6pts
Underwriting Investment Operating expenses
2 990 3 228 3 5643 008
2 100
26.7 26.0 26.7
22.4
16.4
-3.5
3.7
-5
0
5
10
15
20
25
30
-1 000
0
1 000
2 000
3 000
4 000
2012 20172013 2014 2015 2016
-413370
2018
Net income Return on equity
80.783.8 83.7
111.5
104.0
2017
93.5
2012 201820162013 2014
85.7
2015
1 Net operating margin = EBIT / total revenues
Annual Results 2018
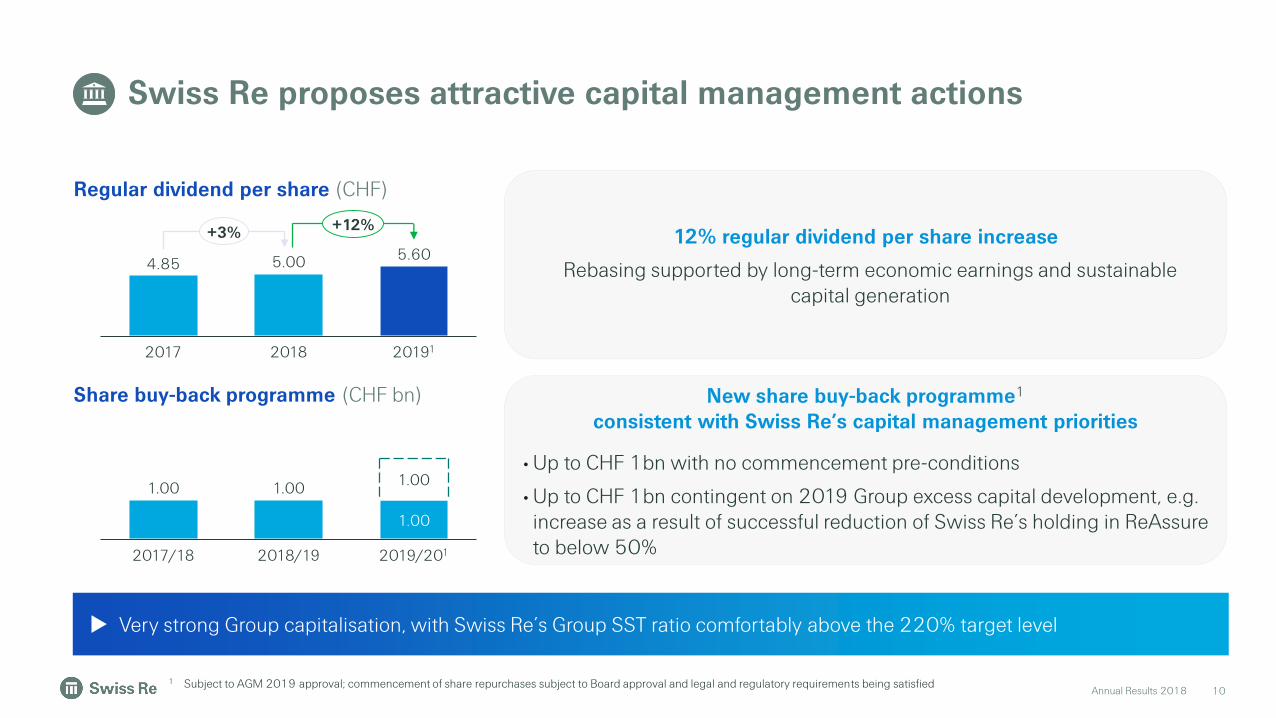
P&C Reinsurance strategy in action
16
SOLUTIONS – selected examples
TRANSACTIONS
COREUS GAAP operating expenses (USD m)
Economic profit (USD m)
Portfolio split by region and line of business (% of net earned premium, USD bn)
• >130 transactions closed in 2018
• Transactions contributed ~24% to economic profit in 2018
• Leveraging technology to achieve efficiency across Swiss Re’s value chain
48%
30%
22%
37%
20%
23%
6%
5%
3%
3% 3%
Americas
Asia
EMEA
A&H
Other specialty
Property
Liability
Motor
Marine
Engineering
Credit
1 159 1 114
2017 2018
-3.9%
Data analytics Addressing strategic questions through a combination of the latest data science methods with bespoke advisory
ADAS risk scoreWorking with OEM partners to improve the risk assessment of increasingly automated vehicles
0
100
200
2017 9M 20181
+15%
1 EVM FY 2018 results to be published on 14 March 2019

Annual Results 2018Annual Results 2018
L&H Reinsurance
17
Continues to deliver solid results and profitable growth

Annual Results 2018
L&H Reinsurance continues to deliver solid results and profitable growth
18
Running yield and ROI (%)Net premiums earned
• Slightly increasing running yield but lower ROI as prior period positively impacted by significant net realised gains
• Increase in premiums earned reflected growth across all markets including large transactions in Asia, intra-group retrocession agreements and favourable fx
• Decrease in underwriting margin due to unfavourable mortality experience in the US, partially offset by favourable contribution from transactions
• Lower investment margin as prior period was positively impacted by significant net realised gains from sales of equity securities
13.711.4
4.8
3.3
-5.4 -5.3
13.1
2017 2018
9.4
-3.7pts
Underwriting Investment Operating expenses
18
Net income (USD m, LHS), Return on equity (%, RHS)
739
-462
968 8071 092
761
8.96.4
-7.9
16.212.8
15.3
11.1
-10
-5
0
5
10
15
20
-1 000
-500
0
500
1 000
1 500
2013 2015
420
2012 2014 2016 2017 2018
Net income Return on equity
USD 11.9bnin 2017
USD 12.7bnin 2018
4.74.1
3.2 3.4 3.64.3
3.7
3.2
3.83.5 3.4 3.3 3.4
2014 20152012 2016
3.5
20182013 2017
Running yield ROI
Net operating margin1 (%)
1 Net operating margin = EBIT / (total revenues – net investment result unit linked & with profit)

Annual Results 2018
L&H Reinsurance strategy in action
19
SOLUTIONS – selected examples
TRANSACTIONS
CORE
• 24 transactions closed in 2018
• Transactions contributed ~34% to economic profit in 2018
• Large and tailored deals in Asia drove transactional growth in 2018
• Despite strong growth in the last years, expense base remained stable
43%
30%
26%
62%11%
11%
6%
10%
Americas
EMEA
Asia
Mortality
Disability
Medical
Critical Illness
Other
754 758
2017 2018
0.5%
0
200
400
2017 9M 20181
+51%
Behavioural economics Creating improvements across the insurance value chain by helping to enhance the way insurers connect with customers
MagnumUsed by >60 insurers and available in 26 countries; processes more than 12m applications per year; >1.3m devices in China
US GAAP operating expenses (USD m)
Economic profit (USD m)
Portfolio split by region and line of business (% of net earned premium, USD bn)
1 EVM FY 2018 results to be published on 14 March 2019

Annual Results 2018Annual Results 2018
Corporate Solutions
20
Result impacted by large man-made and nat cat losses

Annual Results 2018 21
Combined ratio (%)Net premiums earned
• Profitability continues to be impacted by underwriting performance, driven by an increase in severity and frequency of large man-made losses, and generally depressed rate levels, as well as unfavourable prior-year development
Net income (USD m, LHS), Return on equity (%, RHS)
USD 3.7bnin 2017
USD 3.9bnin 2018
• Premiums earned increased by 7.5% driven by growth in Primary Lead which more than offset active pruning in US General Liability portfolio
• Underwriting margin improved driven by lower nat cat losses, partially offset by an increase in severity and frequency of large man-made losses
• Investment margin decreased due to lower realised gains from equities, partially offset by increasing yields and a higher invested asset base
• Operating expense margin improved driven by strong growth and continued focus on productivity measures
7.4 5.4
-11.7
-19.2
-18.4
2017
1.9
2018
-23.5
-11.1
+12.4%pts
Underwriting Investment Operating expenses
96.2 95.1 93.0 93.2
101.1
133.4
117.5
2012 20182013 201720162014 2015
319 357
-741
-405
7.49.6 12.5
15.5
6.0
-32.2
-19.4
-40
-30
-20
-10
0
10
20
-800
-600
-400
-200
0
200
400
135196
2012
279
2013 20162015 20172014 2018
Net income Return on equity
Net operating margin1 (%)
Corporate Solutions result impacted by large man-made and nat cat losses
1 Net operating margin = EBIT / total revenues

Annual Results 2018
Corporate Solutions remains focused on key priorities
22
Performance improvement actions
• US General Liability pruning actions started 18 months ago; time lag for improvements to be reflected in financials
• Additional improvement actions initiated for less strategic segments which are further minimised or partially exited
• Pursue sizable rate increases on underperforming sub-segments and across the board
Increase productivity Primary Lead
• A combination of process improvements, cost saving measures, use of technology and strong growth led to a lower operating expense ratio
• Maintain focus on productivity to finance continuing investment into Primary Lead capabilities
• Extension of own domestic and international Primary Lead producing capabilities to 19 and 9 countries respectively
• Global network coverage for international programs > 120 countries
Own offices Network partners
US General Liability repositioning / pruning(Gross premiums written)
Positive price momentum expected to continue
Corporate Solutions will continue to take targeted actions addressing business performance issues and price deficiencies
2016 2017 2018
-30%
21.720.8
19.4
18%
19%
20%
21%
22%
201820172016
Operating expense ratio (%)

Annual Results 2018Annual Results 2018
Life Capital
23
Exceptional GCG; open book growth in line with expectations

Annual Results 2018
Exceptional Life Capital GCG; open book growth in line with expectations
24
Gross cash generation (USD m) Open book - Gross premiums written (USD m)
709
868
1 039
1 567
20182015 20172016
CAGR 30%
• Gross premiums written increase reflects significant growth in open book businesses:
– iptiQ L&H increase driven by a large medex transaction
– elipsLife increase reflects strong growth on core as well as medex business
• Exceptional gross cash generation (GCG) driven by strong underlying emerging surplus, the sale proceeds from the initial 5% stake in ReAssure acquired by MS&AD and the finalisation of the 2017 Solvency II position
• GCG 2016-2018 of USD 2.5bn at top end of USD 2.3-2.5bn target range (significantly outperforming original target of USD 1.4-1.7bn)
1196
521
945
543
721
998
818
201620132012 20182014 2015 2017

Annual Results 2018
Life Capital open book businesses continue to grow
25
Weekly policies sold1
# of distribution partners
5 19
545
~ 4x
2 755 ~ 5x
2016 2018
GPW2
(USD m) 247412
# of clients < 8 000 ~ 12 000
+ 67%
+ 50%
# of countries 5 7 + 2
# of countries 2 5 + 3
Ambition to continue growing at an accelerated
pace
Expansion of access to attractive risk pools
1 Weekly policies sold in Q4 2016 and Q4 2018, respectively2 Reflects core business, i.e. excludes medex business

Annual Results 2018
Group investments
26
Result reflects a negative impact from a change in US GAAP accounting guidance
Annual Results 2018
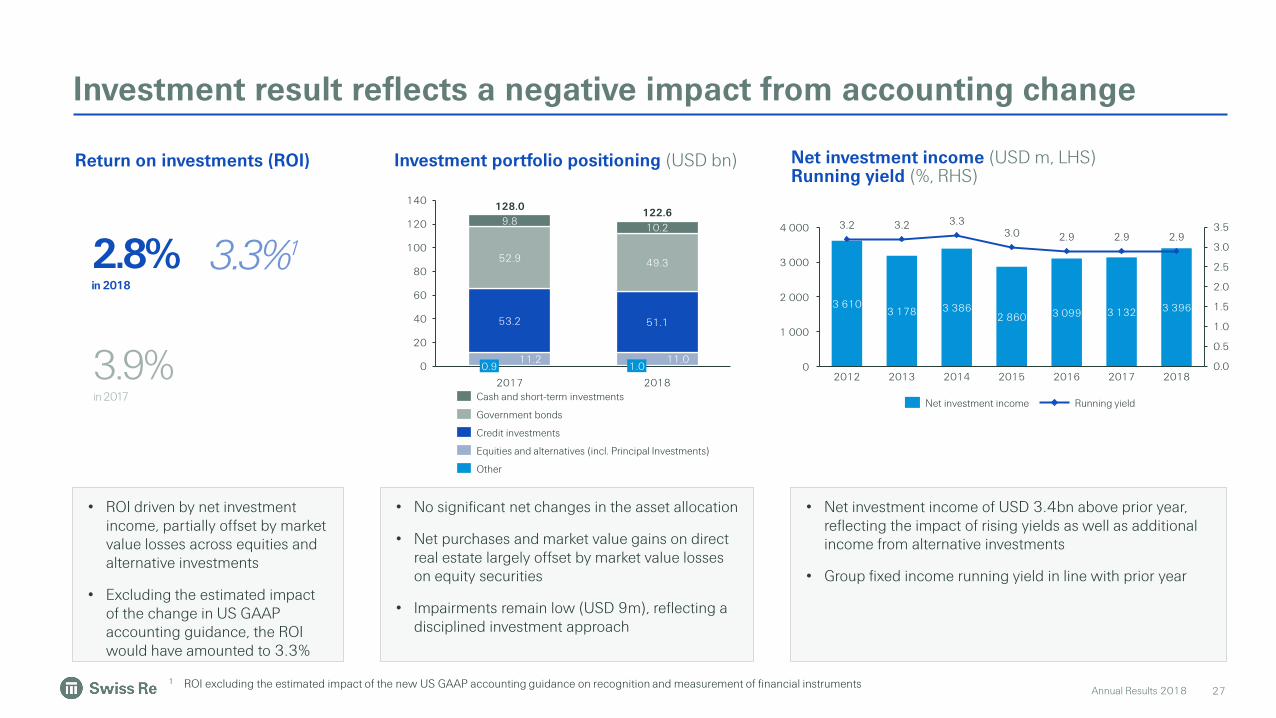
Investment result reflects a negative impact from accounting change
27
• ROI driven by net investment income, partially offset by market value losses across equities and alternative investments
• Excluding the estimated impact of the change in US GAAP accounting guidance, the ROI would have amounted to 3.3%
• Net investment income of USD 3.4bn above prior year, reflecting the impact of rising yields as well as additional income from alternative investments
• Group fixed income running yield in line with prior year
• No significant net changes in the asset allocation
• Net purchases and market value gains on direct real estate largely offset by market value losses on equity securities
• Impairments remain low (USD 9m), reflecting a disciplined investment approach
Return on investments (ROI) Investment portfolio positioning (USD bn)
53.2
9.810.2
0
20
40
60
80
100
120
140
52.9
11.20.9
2017
49.3
11.0
128.0
51.1
1.0
2018
122.6
Net investment income (USD m, LHS) Running yield (%, RHS)
3.2 3.2 3.33.0 2.9 2.9 2.9
0.0
0.5
1.0
1.5
2.0
2.5
3.0
3.5
0
1 000
2 000
3 000
4 000
20162012 20172013 2014
2 860
2015 2018
3 0993 610
3 178 3 386 3 132 3 396
Net investment income Running yieldCash and short-term investments
Government bonds
Other
Credit investments
Equities and alternatives (incl. Principal Investments)
3.9%in 2017
2.8%in 2018
3.3%1
1 ROI excluding the estimated impact of the new US GAAP accounting guidance on recognition and measurement of financial instruments

Annual Results 2018 28
High quality portfolio drives stable running yield of 2.9% for 2018 (quarterly running yield increased from 2.8% to 3.0% during 2018)
Impairment trend reflects significant reduction of high yield exposure in 2016
High quality portfolio drives the Group’s sustainable investment result
37
22
15
5
3
2 1
1 0
5
10
15
2015 2016 2017 20180
30
60
bpsUSD m
Fixed income impairments (USD m, LHS) ROI impact (bps, RHS)
Typical default rate assumption (Single A) ~13bps
Fixed income impairment trend
Credit spreads +/-50bps
USD -1.9bn USD +2.0bn
Credit spread sensitivity on shareholders’ equity and ENW2
Credit bonds: USD 45.1bn Below investment grade credit bonds represent approximately
half of peer average of 9%
1
93%
4%3%
Not rated
Investment grade rated
Non-investment grade rated
1 Determination of credit quality of non-rated securities, which includes catastrophe bonds and infrastructure loans, based on Swiss Re analysis2 Sensitivity on both shareholders’ equity and economic net worth assumed to take effect on 31 December 2018; sensitivities are comparable but not exact

Annual Results 2018Annual Results 2018
Appendix
29

Annual Results 2018
Business segment results FY 2018Income statement
30
Corporate Total TotalUSD m Reinsurance P&C Re L&H Re Solutions Life Capital Group items Consolidation FY 2018 FY 2017
Revenues
Gross premiums written 31 072 16 545 14 527 4 694 2 739 - -2 099 36 406 34 775
Net premiums written 28 745 16 098 12 647 4 122 1 175 - - 34 042 32 316
Change in unearned premiums 33 -3 36 -197 -3 - - -167 803
Premiums earned 28 778 16 095 12 683 3 925 1 172 - - 33 875 33 119
Fee income from policyholders 152 - 152 - 434 - - 586 586
Net investment income/loss – non participating 2 685 1 380 1 305 207 1 256 262 -335 4 075 3 708
Net realised investment gains/losses – non participating 331 -16 347 16 66 -348 - 65 1 727
Net investment result – unit-linked and with-profit -33 - -33 - -1 560 - - -1 593 3 315
Other revenues 37 36 1 3 - 353 -354 39 32
Total revenues 31 950 17 495 14 455 4 151 1 368 267 -689 37 047 42 487
Expenses
Claims and claim adjustment expenses -11 614 -11 614 - -3 241 - - - -14 855 -16 730
Life and health benefits -10 280 - -10 280 - -1 489 - - -11 769 -11 083
Return credited to policyholders -5 - -5 - 1 038 - - 1 033 -3 298
Acquisition costs -6 057 -4 012 -2 045 -607 -255 - - -6 919 -6 977
Operating expenses -1 872 -1 114 -758 -763 -549 -599 351 -3 432 -3 308
Total expenses -29 828 -16 740 -13 088 -4 611 -1 255 -599 351 -35 942 -41 396
Income/loss before interest and tax 2 122 755 1 367 -460 113 -332 -338 1 105 1 091
Interest expenses -723 -313 -410 -24 -41 -105 338 -555 -566
Income/loss before income tax expense/benefit 1 399 442 957 -484 72 -437 - 550 525
Income tax expense/benefit -227 -72 -155 75 -26 109 - -69 -132
Net income/loss before attribution of non-controlling interests 1 172 370 802 -409 46 -328 - 481 393
Income/loss attributable to non-controlling interests - - - 4 -23 - - -19 5
Net income/loss after attribution of non-controlling interests 1 172 370 802 -405 23 -328 - 462 398
Interest on contingent capital instruments -41 - -41 - - - - -41 -67
Net income/loss attributable to common shareholders 1 131 370 761 -405 23 -328 - 421 331

Annual Results 2018
Business segment results FY 2018Balance sheet
31
Corporate End End31 December 2018, USD m Reinsurance P&C Re L&H Re Solutions Life Capital Group Items Consolidation FY 2018 FY 2017
Assets
Fixed income securities 65 126 35 968 29 158 8 157 22 637 32 - 95 952 101 786
Equity securities 2 446 1 776 670 180 69 341 - 3 036 3 865
Other investments 16 498 13 298 3 200 132 2 550 6 447 -12 276 13 351 16 234
Short-term investments 3 721 2 547 1 174 451 1 207 38 - 5 417 4 846
Investments for unit-linked and with-profit business 424 - 424 - 29 122 - - 29 546 35 166
Cash and cash equivalents 3 356 1 651 1 705 796 1 605 228 - 5 985 6 806
Deferred acquisition costs 6 940 2 156 4 784 488 789 - - 8 217 6 871
Acquired present value of future profits 804 - 804 - 1 014 - - 1 818 1 989
Reinsurance recoverable 6 704 2 345 4 359 5 486 4 914 - -10 046 7 058 7 942
Other reinsurance assets 19 019 9 715 9 304 2 461 6 859 - -5 541 22 798 22 989
Goodwill 3 731 1 908 1 823 206 134 - - 4 071 4 172
Other 12 967 8 798 4 169 2 108 1 823 1 752 -8 329 10 321 9 860
Total assets 141 736 80 162 61 574 20 465 72 723 8 838 -36 192 207 570 222 526
Liabilities
Unpaid claims and claim adjustments expenses 57 851 45 659 12 192 11 929 2 601 1 -4 936 67 446 66 795
Liabilities for life and health policy benefits 17 888 - 17 888 501 26 314 - -5 110 39 593 42 561
Policyholder account balances 1 356 - 1 356 - 30 582 - - 31 938 37 537
Other reinsurance liabilities 14 493 10 331 4 162 3 816 3 365 3 -5 812 15 865 15 914
Short-term debt 7 810 2 735 5 075 - 238 - -6 415 1 633 433
Long-term debt 10 151 2 402 7 749 798 1 515 552 -4 514 8 502 10 148
Other 16 429 9 551 6 878 1 483 2 342 3 017 -9 405 13 866 14 844
Total liabilities 125 978 70 678 55 300 18 527 66 957 3 573 -36 192 178 843 188 232
Equity
Common shareholders' equity 15 757 9 483 6 274 1 795 5 113 5 265 - 27 930 33 374
Contingent capital instruments - - - - - - - - 750
Non-controlling interests 1 1 - 143 653 - - 797 170
Total equity 15 758 9 484 6 274 1 938 5 766 5 265 - 28 727 34 294
Total liabilities and equity 141 736 80 162 61 574 20 465 72 723 8 838 -36 192 207 570 222 526

Annual Results 2018
Total equity and ROE FY 2018
1 Excluding contingent capital instruments (nil as of 31 December 2018 and USD 750m in L&H Re as of 31 December 2017); basis for ROE and BVPS calculations2 Based on published net income attributable to common shareholders 3 Shares outstanding is the number of shares eligible for dividends and is used for the BVPS and EPS calculation; reflects 14.0m shares repurchased under share buy-back programmes
32
Corporate Total
USD m Reinsurance P&C Re L&H Re Solutions Life Capital Group Items FY 2018
Common shareholders' equity at 31 December 20171 18 226 10 755 7 471 2 385 7 088 5 675 33 374
Net income/loss attributable to common shareholders 1 131 370 761 -405 23 -328 421
Dividends and share buy-back -1 950 -1 300 -650 -50 -1 125 186 -2 939
Capital contributions - - - - 214 -214 -
Net change in unrealised investment gains/losses -1 303 -235 -1 068 -82 -1 118 -339 -2 842
Other (incl. fx) -347 -107 -240 -53 31 285 -84
Common shareholders' equity at 31 December 20181 15 757 9 483 6 274 1 795 5 113 5 265 27 930
Contingent capital instruments - - - - - - -
Shareholders' equity at 31 December 2018 15 757 9 483 6 274 1 795 5 113 5 265 27 930
Non-controlling interests 1 1 - 143 653 - 797
Total equity at 31 December 2018 15 758 9 484 6 274 1 938 5 766 5 265 28 727
ROE calculation Corporate Total
USD m Reinsurance P&C Re L&H Re Solutions Life Capital Group Items FY 2018
Net income/loss attributable to common shareholders 1 131 370 761 -405 23 -328 421
Opening common shareholders' equity1 18 226 10 755 7 471 2 385 7 088 5 675 33 374
Average common shareholders' equity1 16 992 10 119 6 873 2 090 6 101 5 469 30 652
ROE FY 20182 6.7% 3.7% 11.1% -19.4% 0.4% -6.0% 1.4%
Shares outstanding3
in millions
As at 31 December 2018 300.0 Weighted average 306.8

Annual Results 2018
Decrease in common shareholders' equity driven by dividend payments, share buy-back and unrealised losses
33
1 1
2
33 374- 2 939
- 2 842
- 84
421
27 930
Common shareholders'equity
31 December 2017
Net incomeattributable to
common shareholders
Dividends and share buy-back Net change inunrealised
gains/losses
Other Common shareholders'equity
31 December 2018
USD m
Gov bonds -1.1Corp bonds -2.2Sec products -0.1Other -0.2Tax 0.8
1 Excluding contingent capital instruments (nil as of 31 December 2018 and USD 750m in L&H Re as of 31 December 2017); basis for ROE and BVPS calculations2 Includes USD 437m from the share buy-back programme announced in 2017 and completed on 16 February 2018, and USD 910m from the share buy-back programme launched on 7 May 2018 and completed on 15
February 20193 Includes USD -127m due to reclassification to ‘Other’ as a result of the implementation of the change in US GAAP accounting guidance, and USD -325m due to the sale of a non-controlling interest in ReAssure to MS&AD 4 Includes USD 189m due to the sale of a non-controlling interest in ReAssure to MS&AD, USD 168m due to a reclassification upon implementation of ASUs 2018-02, 2016-16 and 2016-01 and USD 11m due to the
redemption of a contingent capital instrument, offset by USD -408m due to foreign currency translation adjustments
3
Dividends -1.6Share buy-back -1.3
4

Annual Results 2018 34
P&C Reinsurance January 2019 renewalsMovements in newly introduced price quality metric closely align with movements in the formerly reported LTPA
• Swiss Re’s metric for price quality
was adjusted to enhance
transparency and allow better
comparability to peers
• While the new metric correlates
strongly with the Long-Term Price
Adequacy (LTPA) provided so far, it
eliminates distortions from internal
assumption changes (e.g. internal
expense and capital cost allocation)
Change in price quality vs. change in Long-Term Price Adequacy (LTPA) for January renewals
-4%
-3%
-2%
-1%
0%
1%
2%
20162015 2017 2018 2019
Change in LTPA Change in price quality

Annual Results 2018
P&C underwriting performanceP&C Reinsurance and Corporate Solutions
35
Combined ratio Main drivers of change Net premiums earned
Underwriting result
Corporate Solutions FY 2017 FY 2018FY 2018
USD mFY 2018
USD m
Property 174.0% 117.9% • Decrease driven by lower nat cat losses compared to the prior-period, partially offset by high severity and frequency of large man-made losses
1 341 -240
Casualty 122.0% 125.5% • Both periods impacted by large Liability losses and Casualty reserve strengthening in North America
1 463 -373
Specialty 101.6% 106.5% • Increase mainly due to higher large loss activity, primarily driven by a major satellite loss and the Ituango dam flooding
1 121 -73
Total 133.4% 117.5% 3 925 -686
Combined ratio Main drivers of change Net premiums earned
Underwriting result
P&C ReinsuranceFY 2017 FY 2018
FY 2018USD m
FY 2018USD m
Property 119.9% 99.9% • Both periods impacted by large nat cat losses, partially offset by favourable prior-year development
6 029 9
Casualty 108.8% 110.6% • 2018 impacted by continued unfavourable development in the US and in EMEA, mainly in Motor
7 664 -812
Specialty 98.4% 93.4% • Improvement supported by a positive prior-year development across all lines of business, predominantly in Marine
2 402 158
Total 111.5% 104.0% 16 095 -645

Annual Results 2018
P&C Reinsurance combined ratio split
36
Combined ratio split (%)
59.9 59.0
25.5 24.9
7.0 6.9
21.9
12.1
-10
0
10
20
30
40
50
60
70
80
90
100
110
-0.9
0.5
2017
-3.3
2.0
2018
111.5
104.0
Large nat cat losses
Prior-year development
Attritional losses Operating expenses
Acquisition costs Large man-made losses
Key developments in 2018
• Expected impact of large nat cat losses of USD 1.15bn
• Net impact of large nat cat events 5.0%pts above expectations. Favourable prior-year development positively impacted the combined ratio by 0.9%pts
• Adjusted combined ratio amounts to 99.9%. The difference to the full year estimate of 99.0% was driven by a higher frequency of mid-sized nat cat losses particularly in Europe and Asia
• Reduction in other expenses reflects continuous focus on productivity measures
• Attritional loss ratio reflects the price improvements achieved, which were partially offset by the above mentioned high frequency of mid-sized nat cat losses
Note: large losses are defined as losses >USD 20m in P&C Reinsurance

Annual Results 2018
Corporate Solutions combined ratio split
37
Combined ratio split (%)
57.5 59.1
20.8 19.4
15.2 15.5
7.2 5.7
11.8
28.76.0
-10
0
10
20
30
40
50
60
70
80
90
100
110
120
130
4.0
20182017
133.4
117.5
Attritional losses Large man-made losses
Operating expenses
Acquisition costs
Prior-year development Large nat cat losses
Key developments in 2018
• FY impacted by large nat cat losses (hurricanes Florence and Michael)
• Increased severity and frequency of large man-made losses, including a satellite loss, a large industrial fire in Germany, and the Ituango dam flooding
• Prior-year development driven by
– Large losses predominantly from recent underwriting years (~80%)
– Reserve strengthening on the Excess & Surplus Casualty book (~20%)
• Improvement of operating expenses (below 20% target), due to strong premium growth and continued focus on productivity improvements and expense management
• Attritional losses influenced by generally depressed rate levels, business written in previous underwriting years and the time lag to reflect improving conditions
Note: large losses are defined as losses >USD 10m in Corporate Solutions

Annual Results 2018 38
L&H Reinsurance EBIT movements
FY 2017 FY 2018
Life Health L&H Life Health L&H
EBIT reported 935 345 1 8153 720 355 1 3673
Net operating margin, % 9.9 8.8 13.1 7.3 8.2 9.4
Mortality/morbidity experience vs. expected1 21 -8 13 -109 41 -68
Valuation/assumption changes2 -4 14 10 21 -25 -5
VA/GMDB/B36 2 - 2 41 -5 36
Other one-offs 45 -39 6 - - -
• FY 2018 reflected unfavourable mortality experience in the US including impact of large claims and favourable VA result driven by market performance
• Overall view on trends in the US mortality business remains unchanged
EBIT movements (USD m)
1 “Expected" reflects latest best estimate of claims expected to be paid out. Improvement in the estimate process reduces the volatility in the experience variance2 “Valuation/assumption changes” related to VA/GMDB/B36 also included3 The total includes unallocated net realised gains of USD 535m in 2017 and USD 292m in 2018

Annual Results 2018
Return on investments (ROI)
39
• Increase in investment related net investment income, in part driven by the impact of rising yields as well as additional income from alternative investments
• Decrease in investment related net realised gains reflects market value losses across equities and alternative investments; FY 2017 driven by significant realised gains from sales of equity securities
• Increase in insurance related net investment income driven by additional income from the L&G transaction in Life Capital
USD m P&C Re L&H ReCorporate Solutions Life Capital Group items Consolidation
Total FY 2018
Total FY 2017
Investment related net investment income 1 274 1 128 224 844 263 -337 3 396 3 132
Fixed income 831 1 046 211 803 1 - 2 892 2 765
Equities and alternative investments -incl RE, PE, HF 385 63 6 - 102 - 556 509
Other 257 108 25 84 204 -352 326 210
Investment expenses -199 -89 -18 -43 -44 15 -378 -352
Investment related net realised gains/losses -63 192 -24 77 -265 - -83 1 507
Fixed income -22 257 -28 55 4 - 266 620
Equities and alternative investments -incl RE, PE, HF 29 -64 2 6 -263 - -290 966
Other -70 -1 2 16 -6 - -59 -79
Other revenues 4 - - - - -2 2 -
Investment related operating income 1 215 1 320 200 921 -2 -339 3 315 4 639
Less income not related to investment return1 -64 -21 -16 -4 -92 93 -104 -82
Basis for ROI 1 151 1 299 184 917 -94 -246 3 211 4 557
ROI 2.4% 3.7% 2.1% 3.3% -1.5% n.a. 2.8% 3.9%
Insurance related net investment income 106 177 -17 412 -1 2 679 576
Insurance related net realised gains/losses 9 55 30 3 - - 97 99
Foreign exchange gains /losses 38 100 10 -14 -83 - 51 121
Net investment income/loss – non participating 1 380 1 305 207 1 256 262 -335 4 075 3 708
Net realised investment gains/losses – non participating -16 347 16 66 -348 - 65 1 727
Average invested assets 47 266 34 937 8 946 27 458 6 161 -10 433 114 335 115 872
1 Excluded from basis for ROI: cash and cash equivalents, securities lending, repurchase agreements and collateral balances; income from minority interests no longer being excluded in 2018

Annual Results 2018
Cash and cash equivalents4%
Short-term investments4%
Government bonds 41%
Credit bonds37%
Equities 5%
Mortgages and other loans4%
Other investments (incl. policy loans)
5%
Overall investment portfolio
40
USD bn
EndFY 2018
Balance sheet values 153.3
Unit-linked investments -25.9
With-profit business -4.8
Assets for own account(on balance sheet only)
122.6
USD bn P&C Re L&H ReCorporate Solutions
Life Capital Group items Consolidation
EndFY 2018
EndFY 2017
Cash and cash equivalents 1.7 1.7 0.8 0.4 0.2 - 4.8 4.9Short-term investments 2.5 1.2 0.5 1.2 - - 5.4 4.8Government bonds 25.8 13.1 5.5 6.5 - - 50.9 54.7Credit bonds 10.2 16.1 2.7 16.1 - - 45.1 47.1Equities1 3.2 0.7 0.2 0.1 2.1 - 6.3 7.1Mortgages and other loans 7.5 1.8 - 1.8 4.3 (10.9) 4.5 4.0Other investments (incl. policy loans) 4.4 1.3 0.1 0.8 0.4 (1.4) 5.6 9.1Total 55.3 35.9 9.8 26.9 7.0 (12.3) 122.6 131.7
1 Includes equity securities, private equity and Principal Investments

Annual Results 2018
40%
19%
6%
6%4%
3%
3%
3%2%
14%
United States United KingdomGermany CanadaFrance AustraliaItaly ChinaJapan RoW
48%
29%
8%
8%
4%3%
BBB A AAA AA <BBB NR
41
• Decrease in government bonds driven by foreign exchange impacts as well as net sales and market value losses stemming from rising interest rates across the US and UK
• Credit bonds include corporate bonds (USD 40.8bn) and securitised products (USD 4.3bn)
• Decrease in credit bonds driven by foreign exchange impacts as well as market value losses stemming from rising interest rates and wider credit spreads, partially offset by net purchases
USD mGovernment
bondsCredit bonds
EndFY 2017 54 658 47 128
EndFY 2018 50 876 45 076
Fixed income securities

Annual Results 2018
Equities and alternative investments
41%
26%
17%
13%3%
Real estateby geography
SwitzerlandUSGermanyOther DirectIndirect
• Decrease in equity securities mainly driven by net sales and market value losses
• Increase in real estate driven by net purchases and market value gains
• Decrease in Principal Investments reflects market value losses, mainly driven by New China Life
48%
13%
12%
7%
6%
6%3%2%1% 1%
Equity securitiesby sector
Exchange-traded funds
Non-Cyclical Consumer Goods
Financials
Information Technology
Cyclical Services
General Industrials
Basic Industries
Cyclical Consumer Goods
Non-Cyclical Services
Resources
Utilities
72%
15%
8% 5%
Principal Investmentsby sector
HGM Insurance
PE Funds
Developed Market Insurance
Non Insurance
42
USD mEnd
FY 2017End
FY 2018
Equity securities 3 326 2 695
Private equity 1 382 1 463
Hedge funds 359 327
Real estate 4 091 4 430
Principal Investments 2 422 2 109
Equity securities 539 341
Private equity 1 883 1 768
Total market value 11 580 11 024
1%

Annual Results 2018
Estimated impact of change in US GAAP accounting guidance on reported earnings
43
• Table reflects the estimated impact for FY 2018 associated with the change in US GAAP accounting guidance – which took effect at the start of 2018 – and which requires the change in fair value for all equity securities and certain alternative investments to be recorded in earnings
− Change in guidance significantly increases the volatility of reported earnings
• Broad-based equity markets declined during FY 2018 alongside the Group’s remaining position in New China Life (included in Group items) which significantly declined in value
− Estimated impact for 2018 reflects a large negative impact across both the Business Units and Group items
• Estimated impact on the Return on investments calculation for FY 2018 was -0.5%pts
USD mP&C Re L&H Re
Corporate Solutions
Life Capital Group itemsTotal
FY 2018
Market value of equities & alternative investments (AI) affected by the accounting guidance change 2 416 677 188 69 550 3 900
CURRENT RULES: Net realised gains / losses on equities & AI – excl. fx -191 -64 1 6 -264 -512
OLD RULES: Estimated net realised gains / losses on equities & AI – excl. fx 11 15 18 - 9 53
CURRENT RULES: Foreign exchange gains / losses on equities & AI -6 -5 -2 2 -2 -13
OLD RULES: Estimated foreign exchange gains / losses on equities & AI 16 2 4 - -1 21
Total estimated impact on net realised gains / losses – non participating -224 -86 -23 8 -274 -599

Annual Results 2018
Swiss Re proposes attractive capital management actions
44
Swiss Re’s capital management priorities
remain unchanged
• Ensure superior capitalisation at all times and
maximise financial flexibility
• Grow the regular dividend with long-term
earnings, and at a minimum maintain it
• Deploy capital for business growth where it
meets our strategy and profitability
requirements
• Repatriate further excess capital to
shareholders
Proposed capital management actions
• The Board of Directors (“Board”) will propose to the AGM 2019:
− Cancellation of shares repurchased through the 2018 share buy-back programme
− Increase of the regular dividend by 12% to CHF 5.60 per share
− Authorisation of new public share buy-back programme to be executed prior to the 2020 AGM in accordance with Swiss Re’s capital management priorities and subject to obtaining all necessary legal and regulatory approvals
o first tranche of up to CHF 1.0 billion to commence at the discretion of the Board shortly after the 2019 AGM pre-approval
o second tranche of up to CHF 1.0 billion conditional on the 2019 development of the Group’s excess capital position, for example a significant increase as a result of the successful reduction of Swiss Re’s holding in ReAssure to below 50%
− Renewal of existing authorised capital (up to 85 million shares with a sublimit of 33 million shares where Board may limit or withdraw subscription rights of existing shareholders); new proposed expiry date 17 April 2021
− No changes in conditional capital for equity-linked financing instruments of up to 50 million shares
− Limitation of the number of shares that can be issued, prior to the 2021 AGM, from authorised and conditional capital where existing shareholders' subscription rights are excluded to 33 million

Annual Results 2018
Capital actions supported by strong track record and confident outlookContribution to ENW is driving Group SST capital generation
• Group paid out USD 14.5bn to shareholders in the last 5 years, representing ~70% of Total Contribution to ENW (i.e. economic earnings) over the corresponding period
• L&H Re structurally a strong contributor to economic earnings with continued attractive growth
• P&C Re renewals, with improved volume and price quality, expected to increase economic earnings power
Peer-leading track record on capital repatriation
Group SST capital position significantly above target
1.5 1.5 1.6 1.6 1.6 1.7
1.61.0 1.0 1.0 1.0 1.0
1.1 1.0
201620152014 2017 2018 2019
3.1
3.6
2.6 2.6 2.6
2.7-3.7
Share buy-backOrdinary dividend Special dividend
3.5 3.83.1
261% 262% 269%
2016 2017 2018
Group SST Group SST target BU dividends to Group
USD bn
USD bn
6.3
20172013 Avg. 13-17
4.3
2014 20162015
5.23.7 4.2
1.9
Group items
Corporate Solutions
P&C Reinsurance
Life Capital
L&H Reinsurance
Ordinary dividends
Total Contribution to Economic Net Worth (USD bn)
220% target
451 Subject to AGM 2019 approval; commencement of share repurchases subject to Board approval and legal and regulatory requirements being satisfied
1

Annual Results 2018
Sensitivities
46
(USD bn, pre-tax)
Change in market values (Equities and Alternative Investments, excl. Real Estate) -25% -10% +25%
Estimated impact on shareholders' equity -1.7 -0.7 +1.7
Estimated impact on economic net worth (EVM) -2.0 -0.8 +2.0
Estimated impact on income/loss before income tax expense -1.5 -0.6 +1.5
Change in interest rates -50bps -25bps +50bps +100bps
Estimated impact on shareholders' equity +3.4 +1.6 -3.1 -6.0
Estimated impact on economic net worth (EVM) -0.1 -0.1 +0.1 +0.1
Change in credit spreads -50bps +50bps +100bps
Estimated impact on shareholders' equity +2.0 -1.9 -3.7
Estimated impact on economic net worth (EVM) +2.0 -1.9 -3.7
All sensitivities are assumed to take effect on 31 December 2018. No management actions are included in this analysis. Figures are estimated as mutually exclusive events and reflect the estimated impact on the Group. All figures are net of hedging impacts.
Annual Results 2018
Premiums by country
47
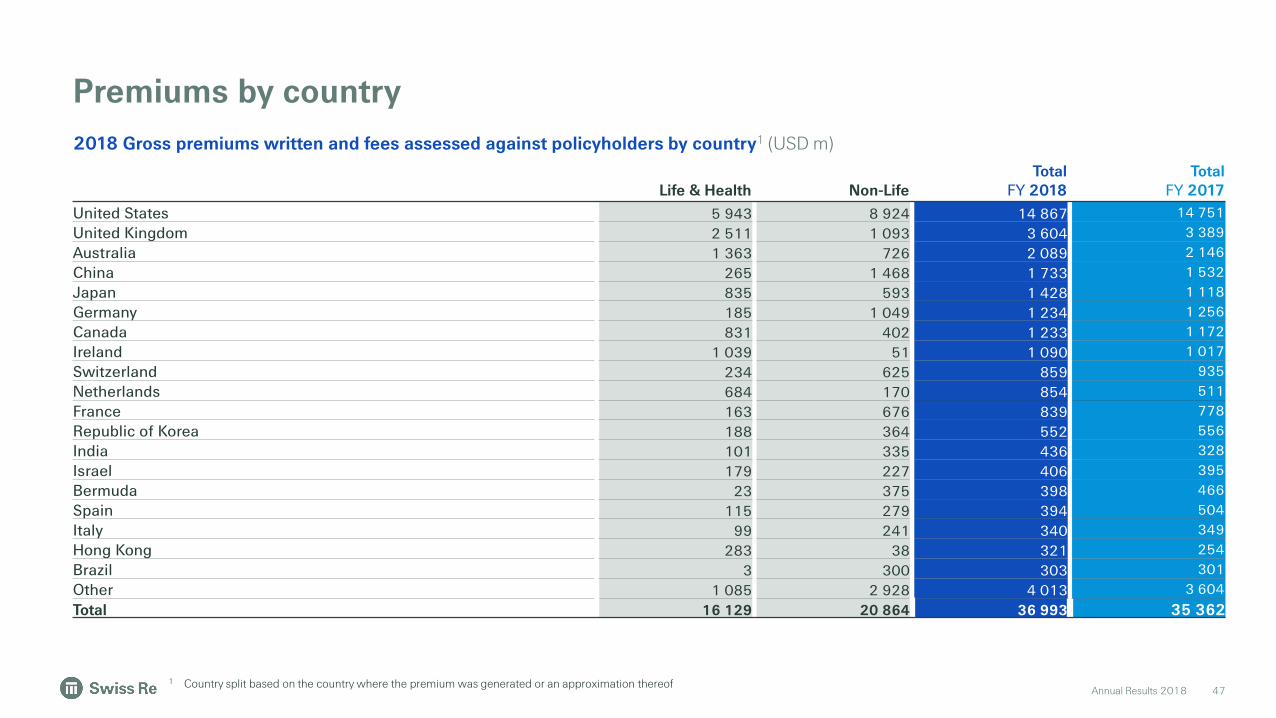
2018 Gross premiums written and fees assessed against policyholders by country1 (USD m)
Life & Health Non-LifeTotal
FY 2018Total
FY 2017
United States 5 943 8 924 14 867 14 751
United Kingdom 2 511 1 093 3 604 3 389
Australia 1 363 726 2 089 2 146
China 265 1 468 1 733 1 532
Japan 835 593 1 428 1 118
Germany 185 1 049 1 234 1 256
Canada 831 402 1 233 1 172
Ireland 1 039 51 1 090 1 017
Switzerland 234 625 859 935
Netherlands 684 170 854 511
France 163 676 839 778
Republic of Korea 188 364 552 556
India 101 335 436 328
Israel 179 227 406 395
Bermuda 23 375 398 466
Spain 115 279 394 504
Italy 99 241 340 349
Hong Kong 283 38 321 254
Brazil 3 300 303 301
Other 1 085 2 928 4 013 3 604
Total 16 129 20 864 36 993 35 362
1 Country split based on the country where the premium was generated or an approximation thereof

Annual Results 2018 48
Swiss Re is broadly diversified
HGMs incl. PI2: ~5% ~3% ~14% ≈22%
of which
HGMs: ~3% ~3% ~10% ≈16%
Swiss Re Group net premiums earned1 2018: USD 34.5bn
47%
AmericasUSD 16.1bn
32%
EMEAUSD 11.0bn
21%
AsiaUSD 7.3bn
1 Includes fee income from policyholders; does not reflect the exposure to HGMs through Principal Investments (PI)2 Based on additional pro rata net premiums from PI including FWD Group (14.8%), New China Life (2.5%) and SulAmérica (14.9%)

Annual Results 2018
46% 44% 42% 38% 40% 39% 44% 45% 48% 47%
42% 41%39% 42% 39% 36%
34% 33% 31% 32%
12% 15% 19% 20% 21% 25% 22% 22% 21% 21%
2009 2010 2011 2012 2013 2014 2015 2016 2017 2018
Americas Europe (incl. middle East & Africa) Asia - Pacific
23.5 20.6 22.2 25.4 28.8 31.3 30.2 33.2 33.7 34.5
22% 23% 24% 26% 28% 26% 24% 24% 22% 21%
18% 17% 18% 21% 22% 24% 25% 28% 29% 27%
15% 13% 12%11% 11% 11% 12% 10% 10% 10%
36% 36% 35% 30% 27% 26% 26% 26% 27% 28%
9% 11% 11% 12% 12% 13% 13% 12% 12% 14%
2009 2010 2011 2012 2013 2014 2015 2016 2017 2018
Property Casualty Specialty Life Health
23.5 20.6 22.2 25.4 28.8 31.3 30.2 33.2 33.7 34.5
49
Premium development by line of business and geography
Premiums earned and fee income by line of business (USD bn)
Premiums earned and fee income by geography (USD bn)

Annual Results 2018
Cautionary note on forward-looking statements
50
• the frequency, severity and development of insured claim events, particularly natural catastrophes, man-made disasters, pandemics, acts of terrorism and acts of war;
• mortality, morbidity and longevity experience;
• the cyclicality of the insurance and reinsurance sectors;
• instability affecting the global financial system;
• deterioration in global economic conditions;
• the effect of market conditions, including the global equity and credit markets, and the level and volatility of equity prices, interest rates, credit spreads, currency values and other market indices, on the Group’s investment assets;
• changes in the Group’s investment result as a result of changes in the Group’s investment policy or the changed composition of the Group’s investment assets, and the impact of the timing of any such changes relative to changes in market conditions;
• the Group’s ability to maintain sufficient liquidity and access to capital markets, including sufficient liquidity to cover potential recapture of reinsurance agreements, early calls of debt or debt-like arrangements and collateral calls due to actual or perceived deterioration of the Group’s financial strength or otherwise;
• any inability to realize amounts on sales of securities on the Group’s balance sheet equivalent to their values recorded for accounting purposes;
• changes in legislation and regulation, and the interpretations thereof by regulators and courts, affecting us or the Group’s ceding companies, including as a result of shifts away from multilateral approaches to regulation of global operations;
• the outcome of tax audits, the ability to realize tax loss carryforwards, the ability to realize deferred tax assets (including by reason of the mix of earnings in a jurisdiction or deemed change of control), which could negatively impact future earnings, and the overall impact of changes in tax regimes on business models;
• failure of the Group’s hedging arrangements to be effective;
• the lowering or loss of one of the financial strength or other ratings of one or more Swiss Re companies, and developments adversely affecting the Group’s ability to achieve improved ratings;
• uncertainties in estimating reserves;
• policy renewal and lapse rates;
• uncertainties in estimating future claims for purposes of financial reporting, particularly with respect to large natural catastrophes and certain large man-made losses, as significant uncertainties may be involved in estimating losses from such events and preliminary estimates may be subject to change as new information becomes available;
• extraordinary events affecting the Group’s clients and other counterparties, such as bankruptcies, liquidations and other credit-related events;
• legal actions or regulatory investigations or actions, including those in respect of industry requirements or business conduct rules of general applicability;
• changes in accounting standards;
• significant investments, acquisitions or dispositions, and any delays, unexpected costs, lower-than expected benefits, or other issues experienced in connection with any such transactions;
• changing levels of competition, including from new entrants into the market; and
• operational factors, including the efficacy of risk management and other internal procedures in managing the foregoing risks and the ability to manage cybersecurity risks.
Certain statements and illustrations contained herein are forward-looking. These statements (including as to plans, objectives, targets, and trends) and illustrations provide current expectations of future events based on certain assumptions and include any statement that does not directly relate to a historical fact or current fact.
Forward-looking statements typically are identified by words or phrases such as “anticipate”, “assume”, “believe”, “continue”, “estimate”, “expect”, “foresee”, “intend”, “may increase”, “may fluctuate” and similar expressions, or by future or conditional verbs such as “will”, “should”, “would” and “could”. These forward-looking statements involve known and unknown risks, uncertainties and other factors, which may cause the Group’s actual results of operations, financial condition, solvency ratios, capital or liquidity positions or prospects to be materially different from any future results of operations, financial condition, solvency ratios, capital or liquidity positions or prospects expressed or implied by such statements or cause Swiss Re to not achieve its published targets. Such factors include, among others:
These factors are not exhaustive. Swiss Re operates in a continually changing environment and new risks emerge continually. Readers are cautioned not to place undue reliance on forward-looking statements. Swiss Re undertakes no obligation to publicly revise or update any forward-looking statements, whether as a result of new information, future events or otherwise.
This communication is not intended to be a recommendation to buy, sell or hold securities and does not constitute an offer for the sale of, or the solicitation of an offer to buy, securities in any jurisdiction, including the United States. Any such offer will only be made by means of a prospectus or offering memorandum, and in compliance with applicable securities laws.

Annual Results 2018
Investor Relations contacts
Hotline E-mail+41 43 285 4444 [email protected]
Philippe Brahin Daniel Bischof Manfred Gasser+41 43 285 7212 +41 43 285 4635 +41 43 285 5516
Chris Menth Iunia Rauch-Chisacof+41 43 285 3878 +41 43 285 7844
Corporate calendar & contacts
51
Corporate calendar
201914 March Publication of Annual Report 2018 Conference call17 April 155th Annual General Meeting Zurich3 May Q1 2019 Key Financial Data Conference call23 May Management Dialogues London31 July H1 2019 Results Conference call31 October 9M 2019 Key Financial Data Conference call25 November Investors’ Day 2019 Zurich

Annual Results 2018 52

General Public Release
Legal notice
53
©2019 Swiss Re. All rights reserved. You are not permitted to create any modifications or derivative works of this presentation or to use it for commercial or other public purposes without the prior written permission of Swiss Re.
The information and opinions contained in the presentation are provided as at the date of the presentation and are subject to change without notice. Although the information used was taken from reliable sources, Swiss Re does not accept any responsibility for the accuracy or comprehensiveness of the details given. All liability for the accuracy and completeness thereof or for any damage or loss resulting from the use of the information contained in this presentation is expressly excluded. Under no circumstances shall Swiss Re or its Group companies be liable for any financial or consequential loss relating to this presentation.
![Analysis [4551/1] [4551/2] Biology [4551/3] - SMSKBbiologyaplus.smskb.edu.my/wp-content/uploads/...SPM... · Analysis [4551/1] [4551/2] ... SOALAN ULANGKAJI SPM 2011 SOALAN ULANGKAJI](https://img.pdfslide.net/doc/110x75/5a85f3267f8b9a882e8c9430/analysis-45511-45512-biology-45513-45511-45512-soalan-ulangkaji.jpg)
![SIJIL PELAJARAN MALAYSIA 4551/1 Pahang...Sup makanan laut, kek coklat, ikan SULIT 4551/1 4551/1© HakCipta JUJ Pahang 2019 14 [Lihat halaman sebelah]](https://img.pdfslide.net/doc/110x75/6090fd8eb08f7f2b9b30e82b/sijil-pelajaran-malaysia-45511-pahang-sup-makanan-laut-kek-coklat-ikan-sulit.jpg)
![Analysis [4551/1] [4551/2] Biology [4551/3]edu.joshuatly.com] Times... · SOALAN ULANGKAJI SPM 2011 SOALAN ULANGKAJI SPM 2011 123 JAWAPAN boleh didapati di laman web Biology Paper](https://img.pdfslide.net/doc/110x75/5e4524ef10f3b5217570b63f/analysis-45511-45512-biology-45513-edujoshuatlycom-times-soalan.jpg)