Embed Size (px)
Citation preview

Annual Results
Analyst Presentation
2020/2021

01
2020/2021 Highlights
3
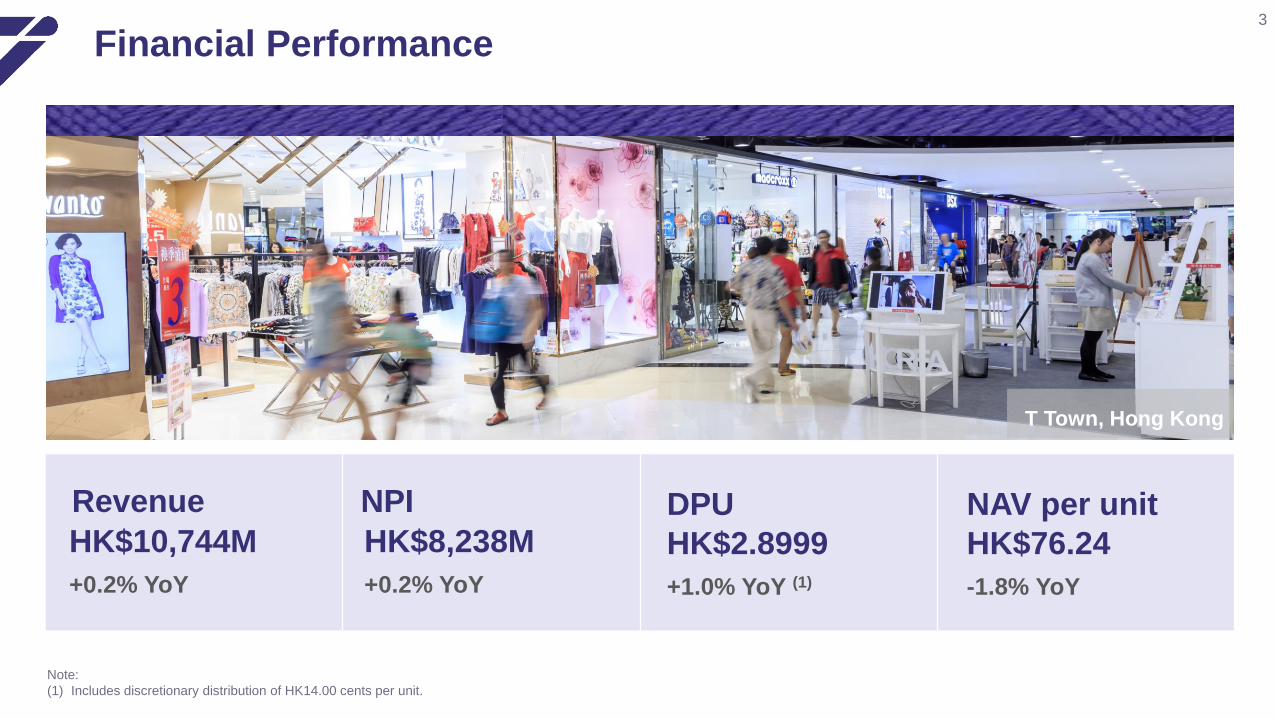
Financial Performance
Note:
(1) Includes discretionary distribution of HK14.00 cents per unit.
HK$10,744M
+0.2% YoY
Revenue
HK$8,238M
+0.2% YoY
NPI
HK$2.8999
+1.0% YoY (1)
DPU
HK$76.24
-1.8% YoY
NAV per unit
T Town, Hong Kong

4
Operational Performance
Hong Kong
96.8%
Occupancy Rates
Reversion Rates
Overall Rental Collection Rates
Notes:
(1) Committed occupancy as of June 2021.
(2) All figures for the year ended or as at 31 March 2021.
Retail
Mainland China
82.9%(1)96.3% 95.8% 100.0%
Overseas
Retail
-1.8%
Retail
11.1%
98% 98%
Hong Kong Mainland China
Link Plaza · Jingtong, BeijingHong Kong Mainland China
Hong Kong Mainland China
Office
~90%
Overseas
5
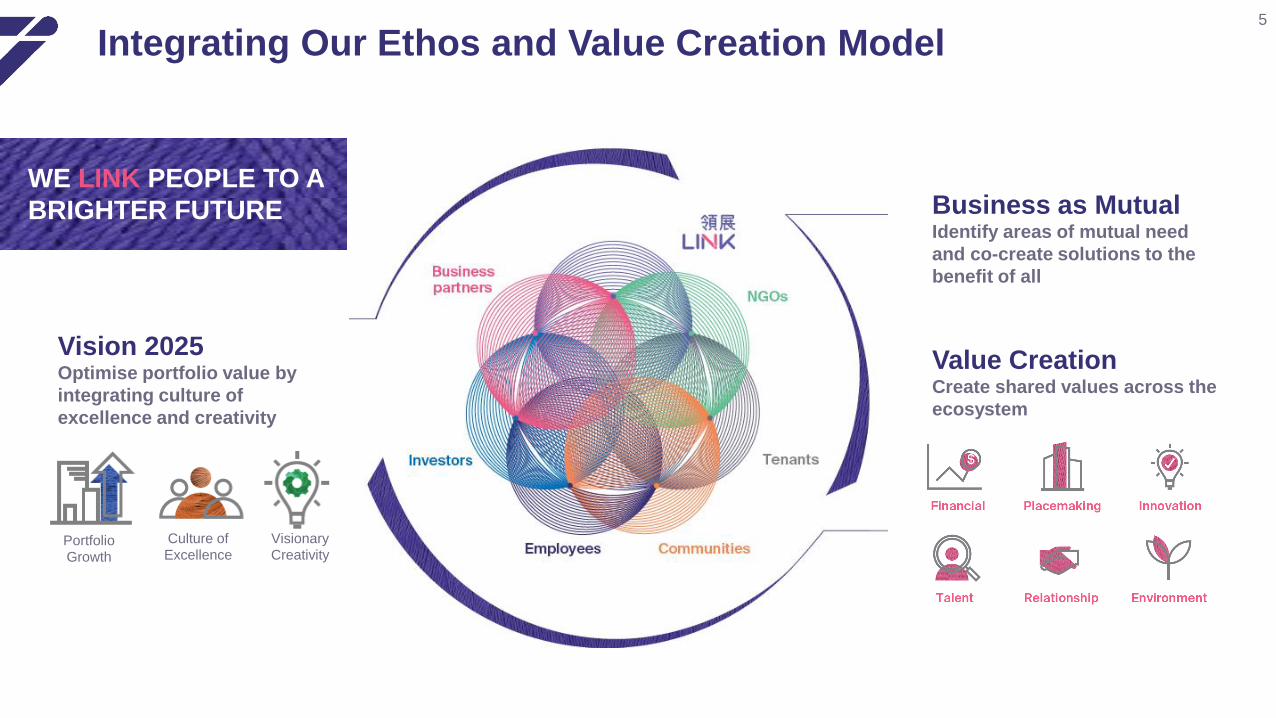
Integrating Our Ethos and Value Creation Model
Business as MutualIdentify areas of mutual need
and co-create solutions to the
benefit of all
Value CreationCreate shared values across the
ecosystem
Vision 2025Optimise portfolio value by
integrating culture of
excellence and creativity
WE LINK PEOPLE TO A
BRIGHTER FUTURE
Portfolio Growth
Culture of Excellence
VisionaryCreativity

6
Vision 2025 - Portfolio Growth
Organic Portfolio
Inorganic Drivers
Financial Strength
Achieve high single-digit CAGR
Note:
(1) The acquisition of 50% of Qibao Vanke Plaza, Shanghai was completed on 2 April 2021 while the acquisition of Happy Valley Shopping Mall, Guangzhou is expected to be completed in June 2021.
Maintained high occupancy of
>95% across portfolio
Executed 4 acquisitions in
Mainland China (1)
and overseas
Maintained “A” credit ratings
from S&P, Moody’s & FitchQibao Vanke Plaza, Shanghai

7
Vision 2025 - Culture of Excellence
No Layoff To provide job security
with our own
resources(2)
>80% Satisfaction level from
staff survey
Become “employer of choice”
Human Resources
Award Recognitions
Maintain Normalcy
Amid Pandemic
Notes:
(1) Over 80% of surveyed Linkers were satisfied with flexible working arrangement, felt connected with their teams and that there was a high degree of transparency from management during the pandemic.
(2) Link has decided not to make use of the HKSAR Government’s Employment Support Scheme.
(3) The STEVIE Awards are highly regarded internationally to honour the achievements and positive contributions of organisations in human resources.
(1)
3
Bronze AwardsAsia-Pacific STEVIE® (3)
Awards
Best Companies
to Work For in
Asia 2020by HR Asia
Celebration of 15th anniversary of Link REIT

8
Vision 2025 - Visionary Creativity
By 2035Net zero target
30% Portfolio electricity
reduction by 2035
Placemaking through innovationNet Zero Strategy
Energy Management
System
Solar Panels191,600 sqft
Planned for
installation
Energy generated
equivalent to
>330 HK household
consumption
Pro bonoProject to enhance
welfare tenants’
premises
20Welfare tenants
to benefit
Project Together
4Pilot properties
4%Target reduction in
energy consumption
per year
Urban Farm at Lok Fu Place
(1)
Notes:
(1) Comparing with baseline set in 2018/2019.
(2) Refers to average annual electricity consumption.
(2)

02
Operational Updates
Hong Kong Retail
Hong Kong Car park
Hong Kong Office
Mainland China Retail
Mainland China Office
OverseasOffice
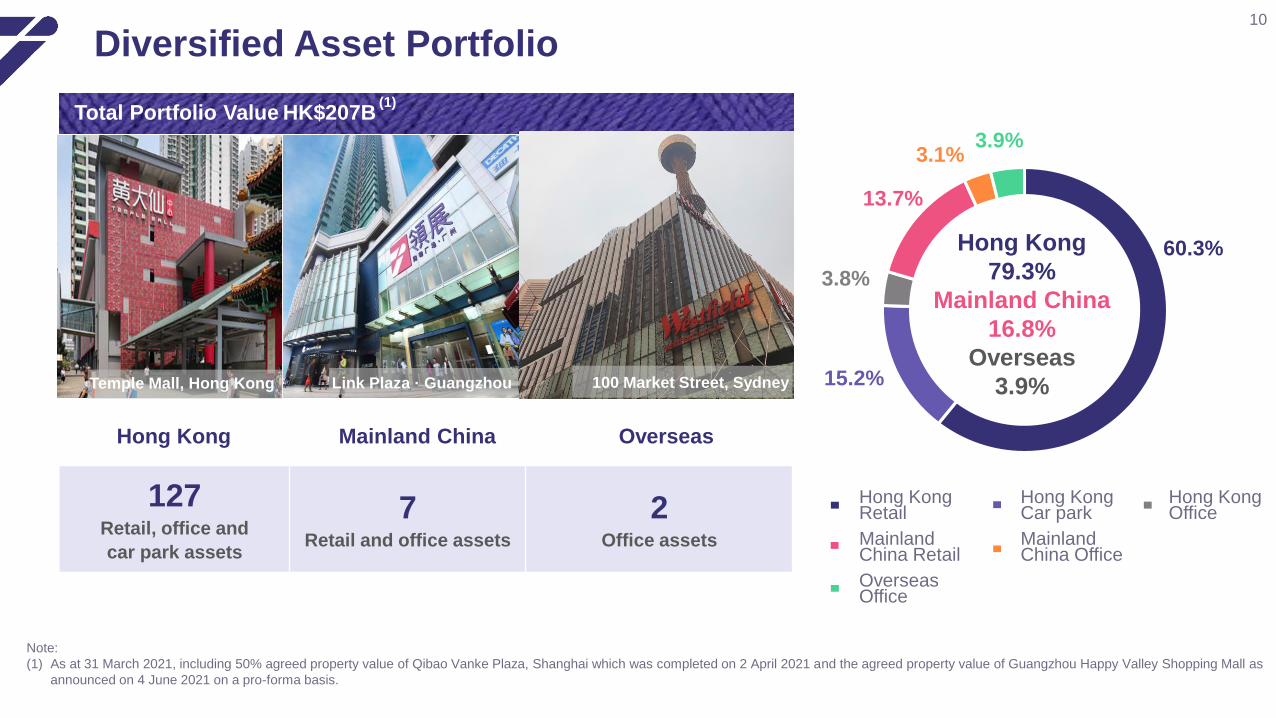
60.3%
15.2%
3.8%
3.9%3.1%
13.7%
10
Diversified Asset Portfolio
Note:
(1) As at 31 March 2021, including 50% agreed property value of Qibao Vanke Plaza, Shanghai which was completed on 2 April 2021 and the agreed property value of Guangzhou Happy Valley Shopping Mall as
announced on 4 June 2021 on a pro-forma basis.
Total Portfolio Value HK$207B(1)
Hong Kong Mainland China Overseas
127Retail, office and
car park assets
7Retail and office assets
2Office assets
Hong Kong
79.3%
Mainland China
16.8%
Overseas
3.9%Temple Mall, Hong Kong 100 Market Street, SydneyLink Plaza · Guangzhou

11
Hong Kong Retail and Office
Notes:
(1) All figures for the year ended or as at 31 March 2021.
(2) Reversion rate was calculated based on base rent (excluding management fee).
(3) Average monthly unit rent represents the average base rent (excluding management fee) per month psf of leased area.
(4) Committed occupancy as at June 2021.
▪ Revenue dipped mainly due to tenant support scheme
▪ Healthy levels of rental collection and arrears
▪ Slow but gradual improvements in leasing sentiment
Retail
-4.5%Revenue growth YoY
96.8%Occupancy rate
-1.8%Reversion rate (2)
-3.4%Average unit rent per
square foot (3) YoY
Office
82.9%(4)
Occupancy rate
Lok Fu Place, Hong Kong

12
Hong Kong Retail Tenant Performance
(2)
▪ Tenant sales were unavoidably dampened by lockdown but remained resilient due to non-discretionary nature
▪ General retail and F&B continued to face pressure and experienced a higher increase in occupancy cost
Notes:
(1) Percentage figures represent year-on-year change in tenants’ average monthly sales per square foot of the respective years.
(2) Including clothing, department store, electrical and household products, personal care/medicine, optical, books and stationery, newspaper, valuable goods, services, leisure and entertainment, and retail others.
(3) A ratio of base rent (excluding management fee) to tenant retail gross sales psf.
(2)
Apr 20 – Mar 21 (Link) Apr 20 – Mar 21 (HK)
Tenant Sales Growth (1) Occupancy Cost (3)
-18.7%
5.4%
-14.5%
-9.4%
-24.5%
-2.7%
-17.6%-16.1%
Food & beverage Supermarket &foodstuff
General retail Overall
16.9%
10.4%
16.4%
14.1%
2016/17 2017/18 2018/19 2019/20 2020/21
Food & beverage Supermarket & foodstuff
General retail Overall

13
Hong Kong Car Park
Note:
(1) All figures for the year ended or as at 31 March 2021.
▪ Hourly parking was impacted by the
partial lockdown in early 2020/2021
▪ Usage has picked up once social
distancing restrictions were relaxed
-1.5%Revenue growth YoY
-1.8%Car park income per
space per month YoY
-0.7%Average valuation
per space YoY
Carpark
Lok Fu Place, Hong Kong
Tin Shing, Hong Kong T Town, Hong Kong
14
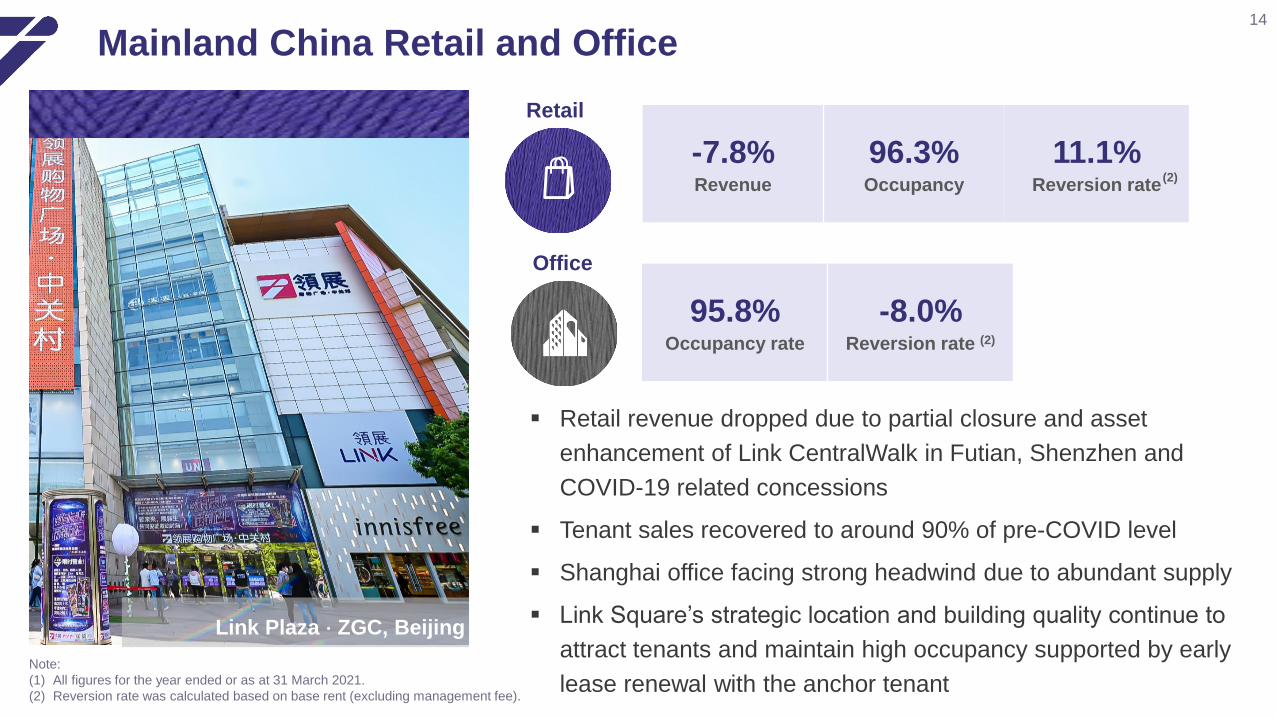
Mainland China Retail and Office
Note:
(1) All figures for the year ended or as at 31 March 2021.
(2) Reversion rate was calculated based on base rent (excluding management fee).
▪ Retail revenue dropped due to partial closure and asset
enhancement of Link CentralWalk in Futian, Shenzhen and
COVID-19 related concessions
▪ Tenant sales recovered to around 90% of pre-COVID level
▪ Shanghai office facing strong headwind due to abundant supply
▪ Link Square’s strategic location and building quality continue to
attract tenants and maintain high occupancy supported by early
lease renewal with the anchor tenant
Retail
Office
-7.8%Revenue
96.3%Occupancy
95.8%Occupancy rate
-8.0%Reversion rate (2)
11.1%Reversion rate
Link Plaza ⋅ ZGC, Beijing
(2)

15
Asset Enhancements
4 projects
More prudent and flexible
pipeline going forward
Completed
Underway
3 projects in 2020/21
Still achieved high-single to
low-double-digit ROIs despite
weak leasing market
PipelineEstimated
Costs
Target
Completion Date
Underway $434M
Tai Wo Plaza $50M Mid 2021
Hing Wah Shopping Centre $30M Mid 2021
Link CentralWalk, Shenzhen $327M Late 2021
Tai Yuen Market $27M Mid 2022
Under planning >$1.0B
Under
Planning>20 projects
Estimated costs totalling
>HK$1.0B
Completed Kai Tin in 2H 2020/21 Capex: HK$153M; ROI: 12.1%
Pipeline extending to 2026/27 onwards
Note:
(1) Estimated return on investment (“ROI”) is calculated based on projected annualised net property income post-project minus net property income pre-project divided by estimated project capital
expenditures and loss of rental.

16
Prudent Capital Management
63.5%Fixed-rate debt
Total debt
1.4 1.2
4.6
1.9
5.4
1.0
4.0
1.9
0.4
1.4
5.8
0.1
0.1
21/22 22/23 23/24 24/25 25/26 26/27 27/28 28/29 29/30or after
(HK$’B)
Medium Term Notes
Convertible bonds
Bank loans
3.3
1.6
10.0
7.7
5.5
8.1
1.1
0.11.2
2.66% Average borrowing costs
83bp from 2019/2020
18.4%Gearing ratio(4)
(3)
Notes:
(1) All figures for the year ended or as at 31 March 2021.
(2) Based on total debt with face value of HK$38.6B as at 31 March 2021.
(3) HK$4B convertible bond has a maturity of 5 years with a 3-year put option exercisable in 2022/2023.
(4) After adjusting for the impact of the acquisition of 50% interest in Qibao Vanke Plaza, Shanghai (completed on 2 April 2021), the final distribution declared, and the acquisition of Happy Valley
Shopping Mall, Tianhe, Guangzhou (expected to be completed in June 2021), the pro-forma gearing ratio is 20.2%.
Staggered Debt Maturity Profile(2)
HK$12.5BAvailable liquidity
4.3 yearsAverage
debt maturity
Ample Liquidity & Healthy Credit Metrics

17
Strong Capital Access and Ongoing Sustainability Commitment
Healthy Credit Ratings and Outlook
A
Stable
A
Stable
April 2020 Issued HK$1.01B 5-year notes at 2.35% per annum
May 2020 Arranged HK$1B 5-year sustainability-linked loan
June 2020 Arranged HK$1B 5-year sustainability-linked loan
October 2020 Issued HK$400M 18-year notes at 2.18% per annum
January 2021 Converted £200M 5-year loan to sustainability-linked loan
April 2021 Arranged HK$500M 5-year sustainability-linked loan
May 2021 Issued CNH650M 3-year notes at 2.80% per annum
June 2021 Issued CNH250M 3-year notes at 2.80% per annum
S&P’s
Moody’s
Fitch
Financing arranged since April 2020
A2
Stable

18
Valuation
Notes: (1) The amount represents the office portion only of The Quayside.(2) The amount excludes two floors of The Quayside which Link occupies as self-used office and are classified as property, plant and equipment.
Hong
Kong
Mainland
China
Overall
↑ 7.3%Due to RMB
appreciation compared
with last year end
↑ 3.0%Mainly due to
two new overseas
offices and exchange gain
↓ 2.4% Due to drop in
market rent
assumptions
Valuation Capitalisation Rate
HK$’M
As at
31 Mar 2021
As at
31 Mar 2020
As at
31 Mar 2021
As at
31 Mar 2020
Hong Kong
Retail properties 124,581 127,515 3.10% – 4.50% 3.10% – 4.50%
Car parks 31,516 31,732 3.10% – 5.30% 3.10% – 5.30%
Office property 8,943 9,914 3.00% 3.00%
Mainland China
Retail properties 20,713 19,146 4.25% – 4.75% 4.25% – 4.75%
Office property 6,447 6,171 4.25% 4.25%
Overseas
Australia office 4,038 - 4.50% N/A
United Kingdom office 4,019 - 5.24% N/A
Total valuation 200,257 194,478
Valuation of investment
properties 199,074 193,224
(1) (1)
(2) (2)

03
Way Forward

20
Overseas Offices
Note:
(1) All figures as at 31 March 2021.
Office
100%Office occupancy rate
100
Market
Street
~90%Rental collection rate
The
Cabot
~4%Annual Rental
Escalation
▪ New additions during the year with
blue chip tenants and long WALE
▪ 100 Market Street and The Cabot
commenced rental contribution
since April 2020 and August 2020,
respectively
▪ Sydney office workers have been
returning to office since 2021, while
London office workers are
beginning to return as UK lockdown
is gradually lifted
Overall100%Office occupancy rate
100 Market Street, Sydney The Cabot, London

Happy Valley Shopping Mall7th Investment in Mainland China
LocationNo. 36 Machang Road,
Tianhe District, Guangzhou
Completion 2012
Monthly Passing Income RMB10.6 M
Expected Completion of Acquisition June 2021
Notes:
(1) Appraised property value was RMB3,350M according to the valuation report dated 24 May 2021.
(2) Gross passing income of the Property (excluding management fees) was approximately RMB10.6M per month with retail income (including turnover rent) of approximately RMB10.0M per month and car
parking income of approximately RMB0.6M per month.
(1)
(2)
▪ Link's further investment in the Greater Bay Area
▪ Short WALE and occupancy at 70.3% provide
opportunities for tenant mix improvement
▪ Potential to further unlock asset value from asset
enhancement
Agreed Property Value
RMB3,205M4.3% discount to valuation
2nd Retail in
Guangzhou
(1)
21

22
Defensive Amid Challenging Environment
No.1First REIT listed in Hong Kong
100%Free float
1Only internally-managed REIT
in Asia
Resilient Focus on non-discretionary
retail, car parks and
premium grade A offices
15 yearsConsistent track record in
growing DPU
31%Female representation
in Board
Link Plaza · Guangzhou

Business
As MutualProactive stakeholder
engagement to navigate in
new normal
Placemaking Create delightful
experiences for our
community
Value
Creation
Continue to grow both
organically and
inorganically
Maintaining a Sustainable Business 23
Link CentralWalk to complete
renovation by end of 2021Welcomed >400 leases in our
Hong Kong portfolio
Announced net zero emissions
by 2035 Second acquisition in Guangzhou
Happy Valley Shopping Mall

Strong Capital Base to Fund Future Growth24
Funding Facilities
• Maintain low gearing and sufficient debt headroom to support strategic goals
Credit Ratings
• Continue to enjoy low funding cost
Forex Management• Cost effective hedging to fund overseas investments and stable distributions
Capital Return
• Committed to 100% payout ratio
• HK14 cents per year discretionary distribution until 2021/2022
• Further buyback will depend on market conditions and other regulatory concerns
A

Balanced Portfolio
• Focus on our organic portfolio
and managing our assets
strategically to enhance their
quality and value
Inorganic
Growth Drivers
• Target “core” & “core-plus” plus
“value-add” opportunities to
complement growth trajectory
• Assets in Hong Kong, Mainland
China tier-1 cities and their
surrounding delta areas and
overseas including United
Kingdom, Australia, Singapore
and Japan
Pro-forma
Composition
Management
Guidance
Hong Kong 79.3% 70-75%
Mainland
China16.8% ≤20%
Overseas 3.9% ≤10%
Office 10.8% ≤20%
Achieving Vision 202525
Diversifying while remaining prudent and selective
Note:
(1) As at 31 March 2021, including 50% agreed property value of Qibao Vanke Plaza, Shanghai which was completed on 2 April 2021 and the agreed property value of Guangzhou Happy Valley Shopping Mall
as announced on 4 June 2021 on a pro-forma basis.
(1)

26
Distribution Calendar
Distribution period October 2020 – March 2021
Last day of trading on a “cum” basis 28 June 2021
Ex-distribution date 29 June 2021
Distribution book close2 July – 5 July 2021
(both days inclusive)
Record date for entitlement to distribution 5 July 2021
Ten trading days to determine issue price for scrip
in lieu of final cash distribution
6 July – 19 July 2021
(both days inclusive)
Final date for scrip election27 July 2021
(no later than 4:30 pm)
Payment of distribution 12 August 2021

04
Appendix

28
Appendix 1Key Financial Data
Consolidated
FY20/21
(HK$’M)
FY19/20
(HK$’M)
YoY
%
Revenue 10,744 10,718 +0.2
Net property income 8,238 8,220 +0.2
Rentals(1)
Hong Kong retail properties 6,159 6,288 -2.1
Hong Kong car parks 1,883 1,912 -1.5
Mainland China retail properties 850 937 -9.3
Hong Kong, Mainland China and overseas offices 778 401 +94.0
Other revenue(2) 1,074 1,180 -9.0
Total revenue 10,744 10,718 +0.2
Total property expenses 2,506 2,498 +0.3
Notes:
(1) Management fee has been reclassified from rental to other miscellaneous revenue. Comparative figures have been restated.
(2) Other revenue includes management fee, air conditioning service fee, promotion levy and miscellaneous revenue.

29
Appendix 2Financials – Income Statement Summary
Year ended
31 Mar 2021
(HK$’M)
Year ended
31 Mar 2020
(HK$’M)
YoY
%
Revenue 10,744 10,718 +0.2
Property operating expenses (2,506) (2,498) +0.3
Net property income 8,238 8,220 +0.2
General and administrative expenses (428) (416) +2.9
Interest income 126 183 -31.1
Finance costs (770) (630) +22.2
Profit before taxation, change in fair values of investment properties,
impairment of goodwill and transactions with Unitholders 7,166 7,357 -2.6
Change in fair values of investment properties and impairment of
goodwill(5,322) (23,948) -77.8
Taxation (1,092) (712) +53.4
Non-controlling interest 433 181 +139.2
Profit / (loss) for the year, before transactions with Unitholders
attributable to Unitholders1,185 (17,122) -106.9
Note:
(1) Revenue recognised during the year comprise Hong Kong retail properties rentals of HK$6,159M, Hong Kong car parks rentals of HK$1,883M, Mainland China retail properties rentals of HK$850M,
Hong Kong, Mainland China and overseas offices rentals of HK$778M and other revenue of HK$1,074M.

30
Appendix 3Financials – Distribution Statement Summary
Year ended
31 Mar 2021
(HK$’M)
Year ended
31 Mar 2020
(HK$’M)
YoY
%
Profit / (loss) for the year, before transactions with Unitholders 1,185 (17,122) -106.9
Change in fair values of investment properties and
impairment of goodwill attributable to Unitholders4,910 23,831 -79.4
Deferred taxation on change in fair values of investment
properties attributable to Unitholders(12) (454) -97.4
Change in fair values of derivative components of convertible
bonds32 (157) -120.4
Change in fair values of financial instruments (320) (276) +15.9
Depreciation and amortisation of real estate and related
assets 54 41 +31.7
Other non-cash income (129) (189) -31.7
Total distributable income 5,720 5,674 +0.8
Discretionary distribution 290 291 -0.3
Total distributable amount 6,010 5,965 +0.8
Distribution per unit (HK cents) 289.99 287.19 +1.0

31
Appendix 4Financials – Financial Position & Investment Properties
HK$’MAs at
31 Mar 2021
As at
30 Sep 2020
As at
31 Mar 2020
Total assets 209,885 203,186 207,619
Total liabilities 51,192 49,159 47,502
Non-controlling interest (27) 174 406
Net assets attributable to Unitholders 158,720 153,853 159,711
Units in Issue (M) 2,081.9 2,062.4 2,057.9
Net asset value per unit (HK$) 76.24 74.60 77.61
HK$’MYear ended
31 Mar 2021
Period ended
30 Sep 2020
Year ended
31 Mar 2020
At beginning of year / period 193,224 193,224 218,496
Acquisition 7,253 7,253 -
Exchange adjustments 3,050 1,484 (1,791)
Additions 823 380 1,583
Transfer to property, plant and equipment - - (1,116)
Change in fair values of investment properties (5,276) (7,229) (23,948)
At end of year / period 199,074 195,112 193,224
Financial Position Summary
Fair Value of Investment Properties

32
Appendix 5Financials – Capital Management
As at
31 Mar 2021
As at
30 Sep 2020
S&P
requirement
(A / Stable)
Moody’s
requirement
(A2 / Stable)
Fitch
requirement
(A / Stable)
Net debt / IP 18.1% 17.5% N/A N/A < 30%
FFO (2) / debt (annualised) 18.6% 17.1% > 12% N/A N/A
EBITDA interest coverage 8.1x 7.5x N/A > 3.5x – 4.0x > 3.5x
Net debt / EBITDA (annualised) 4.5x 4.3x N/A < 6.5x N/A
HK$ B %
Mar-21 Sep-20 Mar-21 Sep-20
HK$ Bank loans 7.4 7.6 19.2 21.1
RMB Bank loans 2.8 0.8 7.3 2.2
AUD Bank loans 3.9 3.6 10.1 10.0
GBP Bank loans 3.8 3.7 9.7 10.3
Medium Term Notes 16.7 16.3 43.3 45.3
Convertible Bonds 4.0 4.0 10.4 11.1
Total debt 38.6 36.0 100.0 100.0
Cash 2.5 1.8 20.0 13.2
Undrawn facilities 10.0 11.8 80.0 86.8
Available liquidity 12.5 13.6 100.0 100.0
Key Credit Metrics by Rating Agencies (1)
Notes:
(1) Preliminary figures to be confirmed by rating agencies.
(2) Funds from operations is net cash generated from operating activities adjusted by operating lease expenses, interest expenses and income, tax paid.
Committed Debt Facilities (After Currency Swaps)

33
Appendix 6HK Portfolio – Retail Revenue Analysis
Year ended
31 Mar 2021
(HK$’M)
Year ended
31 Mar 2020
(HK$’M)
YoY
%
Percentage
contribution
Year ended
31 Mar 2021
%
Retail rentals: (1)
Shops (2) 4,881 5,095 -4.2 70.7
Markets / cooked food stalls 954 886 +7.7 13.8
Education / welfare and ancillary 140 139 +0.7 2.0
Mall merchandising 184 168 +9.5 2.7
Expenses recovery and other
miscellaneous revenue (3) 741 934 -20.7 10.8
Total 6,900 7,222 -4.5 100.0
Notes: (1) Management fee has been reclassified from rental to other miscellaneous revenue. Comparative figures have been restated.(2) Rental from shops included base rent of HK$4,826 million (2020: HK$5,028 million) and turnover rent of HK$55 million (2020: HK$67 million).(3) Other miscellaneous revenue includes management fee, air conditioning service fee, promotion levy and miscellaneous revenue.

34
Appendix 7HK Portfolio – Car Park Revenue Analysis
Year ended
31 Mar 2021
(HK$’M)
Year ended
31 Mar 2020
(HK$’M)
YoY
%
Percentage
contribution
Year ended
31 Mar 2021
%
Car park rentals:
Monthly 1,432 1,494 -4.1 75.8
Hourly 451 418 +7.9 23.9
Expenses recovery and other
miscellaneous revenue5 5 - 0.3
Total 1,888 1,917 -1.5 100.0

35
Appendix 8HK Portfolio – Property Operating Expenses Analysis
Year ended
31 Mar 2021
(HK$’M)
Year ended
31 Mar 2020
(HK$’M)
YoY
(%)
Percentage
contribution
Year ended
31 Mar 2021
(%)
Property managers’ fees, security
and cleaning (1) 592 578 +2.4 28.4
Staff costs 367 380 -3.4 17.6
Repair and maintenance (2) 227 207 +9.7 10.9
Utilities (3) 236 263 -10.3 11.3
Government rent and rates 270 313 -13.7 12.9
Promotion and marketing expenses (4) 139 113 +23.0 6.7
Estate common area costs 91 85 +7.1 4.4
Other property operating expenses (5) 167 229 -27.1 7.8
Total property operating expenses 2,089 2,168 -3.6 100.0
Notes: (1) Property managers’ fees, security and cleaning expenses increased by 2.4% year-on-year as we adopted stringent cleaning protocol to fight against the pandemic. (2) Repair and maintenance increased by 9.7% due to one-off reinstatement cost of an exited tenant and other expenses incurred in The Quayside after its completion in May 2020. (3) Utilities decreased by 10.3% mainly due to government subsidy received and reduction in energy consumption.(4) Promotion and marketing expenses increased by 23.0% as free parking programmes and more activities were organised in support of our tenants for business recovery. (5) The decrease in other property operating expenses was mainly due to higher bad debt provision made last financial year after the COVID-19 outbreak in February 2020.

36
Appendix 9HK Portfolio – Retail Portfolio Data
No. of
properties
Total area
(’000 sq. ft.)
Retail
properties
Valuation
(HK$’M)
Retail
rentals
(HK$’M)
Average monthly
unit rent (1)
(HK$ psf)
Occupancy rate
(%)
As at
31 Mar
2021
As at
31 Mar
2021
Year ended
31 Mar
2021
As at
31 Mar
2021
As at
31 Mar
2020
As at
31 Mar
2021
As at
31 Mar
2020
Destination 6 1,293 26,751 1,212 79.3 83.7 94.0 93.3
Community 35 4,063 68,567 3,487 69.2 71.6 97.6 96.9
Neighbourhood 57 2,721 29,263 1,460 44.6 45.6 97.2 97.4
Overall 98 8,077 124,581 6,159 62.4 64.6 96.8 96.5
Note :
(1) Average monthly unit rent represents the average base rent (exclude management fee) per month psf of leased area. Comparative figures have been restated.
37
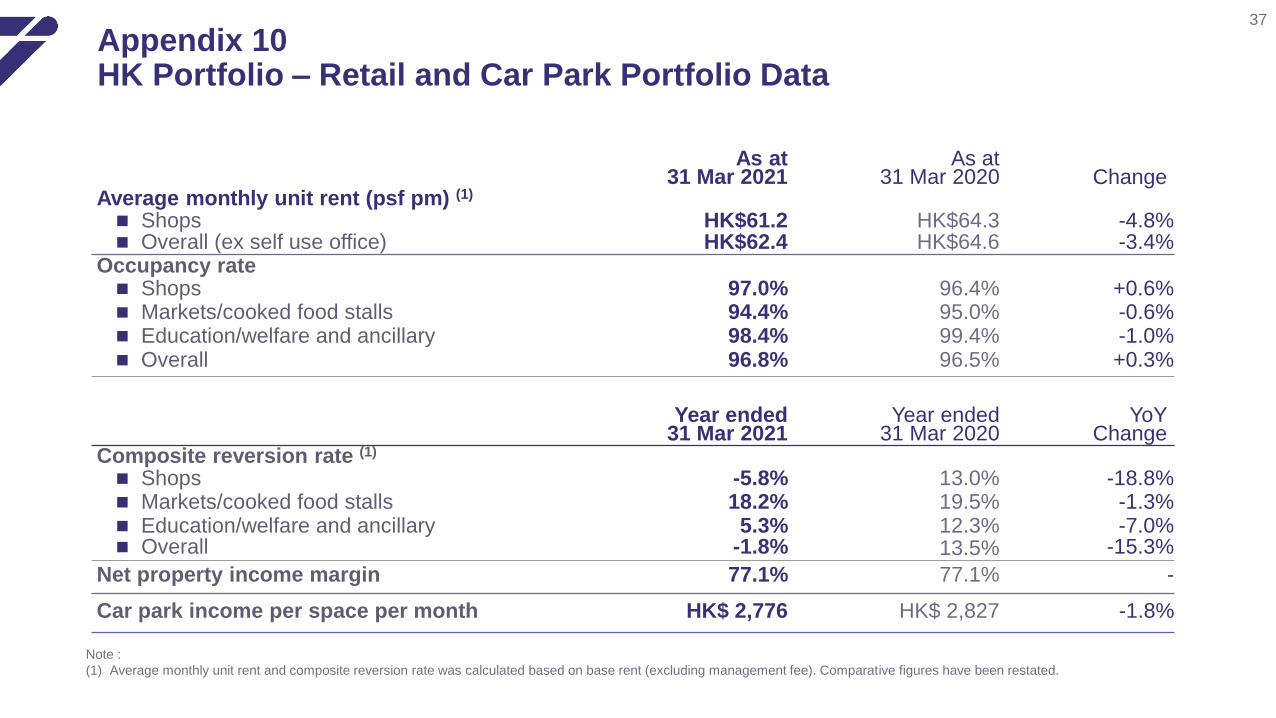
Appendix 10HK Portfolio – Retail and Car Park Portfolio Data
As at31 Mar 2021
As at31 Mar 2020 Change
Average monthly unit rent (psf pm) (1)
◼ Shops HK$61.2 HK$64.3 -4.8%◼ Overall (ex self use office) HK$62.4 HK$64.6 -3.4%
Occupancy rate◼ Shops◼ Markets/cooked food stalls◼ Education/welfare and ancillary
97.0%94.4%98.4%
96.4%95.0%99.4%
+0.6%-0.6%-1.0%
◼ Overall 96.8% 96.5% +0.3%
Year ended31 Mar 2021
Year ended31 Mar 2020
YoYChange
Composite reversion rate (1)
◼ Shops ◼ Markets/cooked food stalls◼ Education/welfare and ancillary
-5.8%18.2%
5.3%
13.0%19.5%12.3%
-18.8%-1.3%-7.0%
◼ Overall -1.8% 13.5% -15.3%
Net property income margin 77.1% 77.1% -
Car park income per space per month HK$ 2,776 HK$ 2,827 -1.8%
Note :
(1) Average monthly unit rent and composite reversion rate was calculated based on base rent (excluding management fee). Comparative figures have been restated.

38
Appendix 11HK Portfolio – Retail Lease Expiry Profile
As at 31 March 2021
As % of total area
%
As % of monthly rent (1)
%
FY21/22 32.9 31.1
FY22/23 24.5 28.4
FY23/24 20.8 22.1
FY24/25 and beyond 13.9 14.1
Short-term lease and vacancy 7.9 4.3
Total 100.0 100.0
Note: (1) Refers to base rent (excluding management fee).

55.4%
17.4%
10.1%
7.9%
2.1%
7.1%
39
Appendix 12HK Portfolio – Trade Mix
28.0%
21.6%16.6%
10.6%
5.5%
1.0%
0.8%
15.9%
Retail Trade Mix(by rent)(1)
Retail Mar-21 Sep-20
1. Food and beverage 28.0% 27.6%
2. Supermarket and foodstuff 21.6% 21.5%
3. Markets/ cooked food stalls 16.6% 16.4%
4. Services 10.6% 10.8%
5. Personal care/ medicine 5.5% 5.6%
6. Education/ welfare and ancillary 1.0% 1.0%
7. Valuable goods (2) 0.8% 0.8%
8. Others (3) 15.9% 16.3%
Total 100% 100%
1
2
5
4
76
8
Notes: (1) Refers to base rent (excluding management fee). Comparative figures have been restated.(2) Including jewellery, watches and clocks(3) Including clothing, department store, electrical and household products, optical, books and stationery, newspaper, leisure and entertainment.
1
3
4
5
Office Trade Mix(by rent) (1)
5
Office Mar-21 Sep-20
1. Finance 55.4% 51.1%
2. Real estate 17.4% 16.0%
3. Retailers & consumer products 10.1% 6.0%
4. Engineering & construction 7.9% 7.2%
5. Co-working space 2.1% 13.2%
6. Insurance 7.1% 6.5%
Total 100% 100%
1
2
3
4
56

39.6%
14.5%3.5%
10.3%
3.6%
28.5%
40
Appendix 13Mainland China Portfolio – Trade Mix
Retail Mar-21 Sep-20
1. Food and beverage 29.5% 28.2%
2. Fashion 34.9% 35.7%
3. General retail & others 28.0% 27.1%
4. Leisure & entertainment 4.4% 5.4%
5. Supermarket & foodstuff 3.2% 3.6%
Total 100% 100%
Office Mar-21 Sep-20
1. Professional services 39.6% 40.5%
2. Technology, media, telecom 14.5% 14.7%
3. Pharmacy 3.5% 2.8%
4. Industrial goods & services 10.3% 12.4%
5. Retailers & consumer products 3.6% 3.6%
6. Others 28.5% 26.0%
Total 100% 100%
29.5%
34.9%
28.0%
4.4%3.2%
Retail Trade Mix(by rent)(1)
1
2
3
54
Office Trade Mix(by rent) (1)
1
23
5
4
6
Note: (1) Refers to base rent (excluding management fee). Comparative figures have been restated.
53.3%
27.9%
15.3%
3.5%
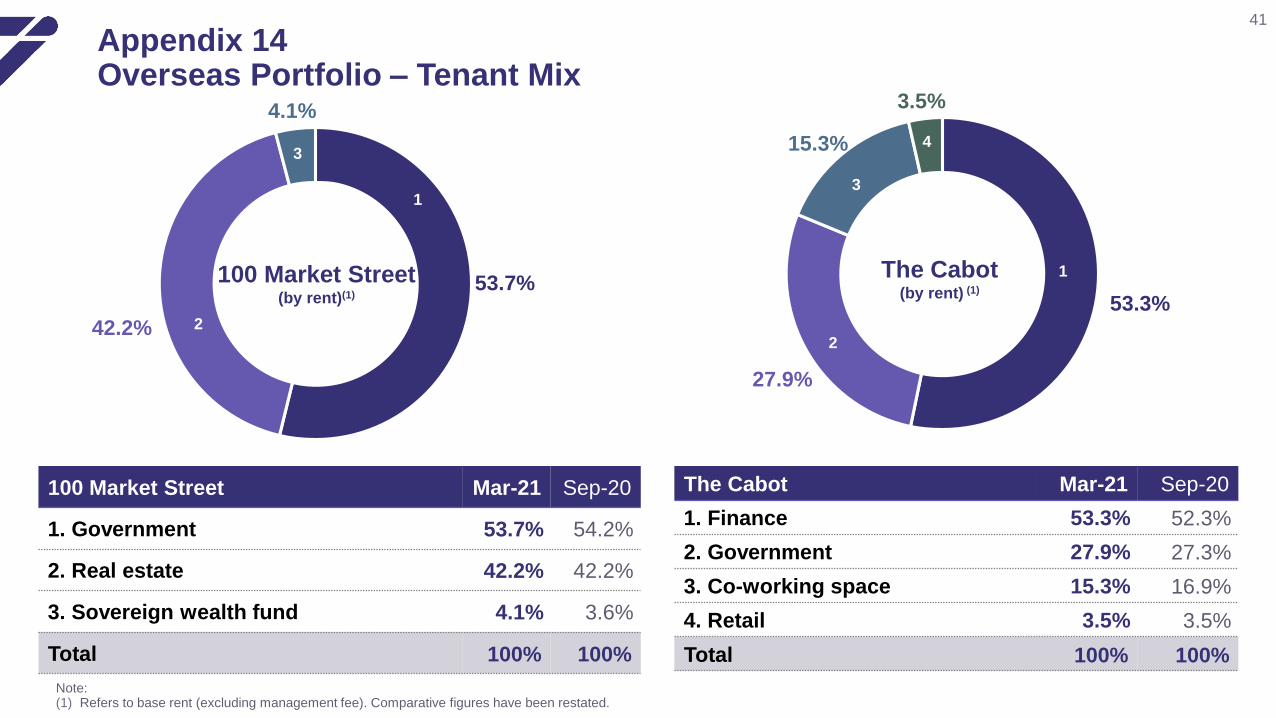
41
Appendix 14Overseas Portfolio – Tenant Mix
53.7%
42.2%
4.1%
100 Market Street(by rent)(1)
1
2
3
The Cabot(by rent) (1)
1
2
3
4
100 Market Street Mar-21 Sep-20
1. Government 53.7% 54.2%
2. Real estate 42.2% 42.2%
3. Sovereign wealth fund 4.1% 3.6%
Total 100% 100%
The Cabot Mar-21 Sep-20
1. Finance 53.3% 52.3%
2. Government 27.9% 27.3%
3. Co-working space 15.3% 16.9%
4. Retail 3.5% 3.5%
Total 100% 100%
Note: (1) Refers to base rent (excluding management fee). Comparative figures have been restated.

42
Appendix 15Mainland China Portfolio – Lease Expiry Profile
Retail Office
As at 31 March 2021
As % of
total area
(%)
As % of monthly rent (1)
(%)
As % of
total area
(%)
As % of monthly rent (1)
(%)
FY21/22 20.1 26.3 31.2 32.6
FY22/23 21.6 28.7 28.6 31.2
FY23/24 13.6 18.3 11.2 12.5
FY24/25 and beyond 41.0 26.7 24.8 23.7
Vacancy 3.7 - 4.2 -
Total 100.0 100.0 100.0 100.0
Note: (1) Refers to base rent (excluding management fee).
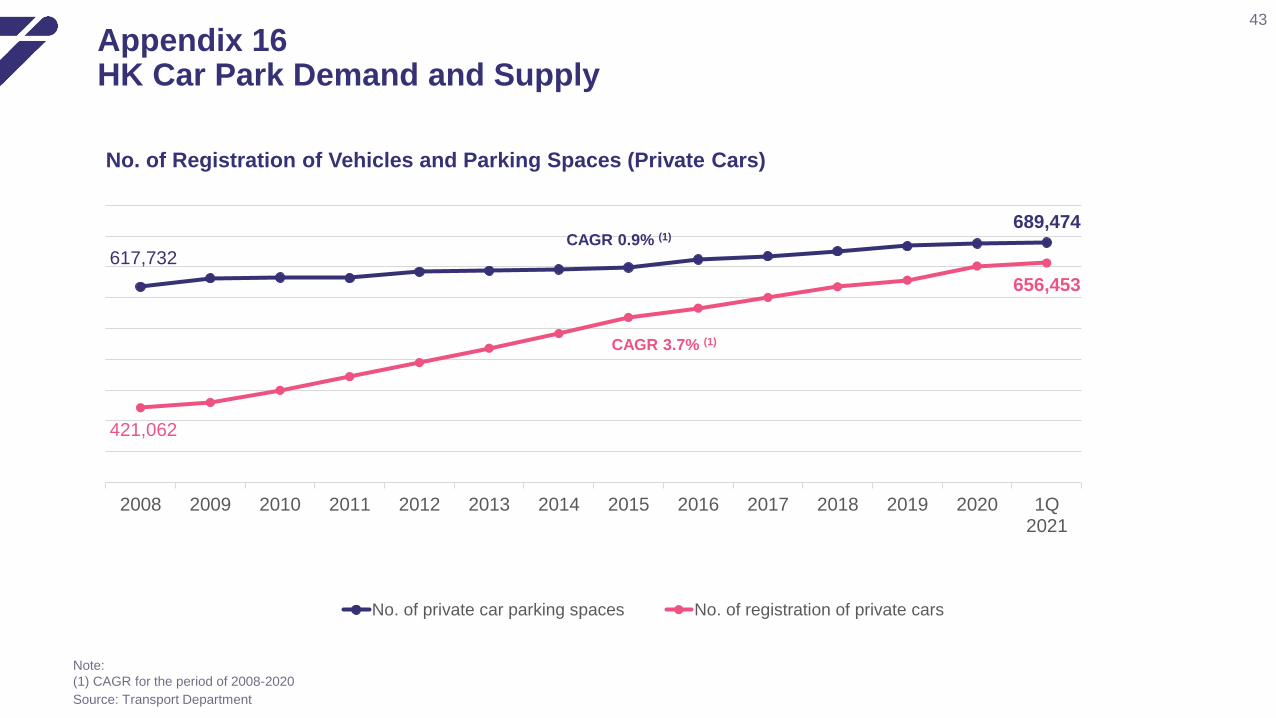
43
Appendix 16HK Car Park Demand and Supply
Source: Transport Department
No. of Registration of Vehicles and Parking Spaces (Private Cars)
689,474
617,732
656,453
421,062
1Q2021
2020201920182017201620152014201320122011201020092008
No. of private car parking spaces No. of registration of private cars
CAGR 3.7% (1)
CAGR 0.9% (1)
Note:
(1) CAGR for the period of 2008-2020

44
Disclaimer
◼ This document has been prepared by Link Asset Management Limited in its capacity as the Manager (the “Manager”) of Link Real Estate InvestmentTrust (“Link REIT”) solely for use at the presentations/meetings held and may not be reproduced or redistributed without permission. Neither thisdocument nor any copy may be taken or transmitted into or distributed, directly or indirectly, in the United States or to any U.S. person (within themeaning of Regulation S under the United States Securities Act of 1933, as amended). Neither this document nor any copy may be taken ortransmitted into or distributed or redistributed in Canada or to the resident thereof. The distribution of this document in other jurisdictions may berestricted by law and persons into whose possession this document comes should inform themselves about, and observe any such restrictions. Byattending this presentation/meeting, you are deemed to agree to be bound by the foregoing restrictions and represent that you have understood andaccepted the terms of this disclaimer. Any failure to comply with these restrictions may constitute a violation of applicable securities laws.
◼ All information and data are provided for reference only. All opinions expressed herein are based on information available as of the date hereof andare subject to change without notice. The slides forming part of this document have been prepared solely as a support for oral discussion about LinkREIT. No representation or warranty, express or implied, is made as to, and no reliance should be placed on, the fairness, accuracy, completeness orsuitability of any information or opinion contained herein. None of Link REIT, the Manager, or any of its directors, officers, employees, agents oradvisors shall be in any way responsible for the contents hereof, nor shall they be liable for any loss arising from use of the information contained inthis presentation or otherwise arising in connection therewith.
◼ This document may contain forward-looking statements. The past performance of Link REIT is not necessary indicative of the future performance ofLink REIT and that the actual results may differ materially from those set forth in any forward-looking statements herein. Nothing contained in thisdocument is, or shall be relied on, as a promise or forecast as to the future.
◼ This document does not constitute an offer or invitation to purchase or subscribe for any securities of Link REIT and neither any part of it shall formbasis of or be relied upon in connection with any contract, commitment or investment decision whatsoever. No action has been taken or will be takenby Link REIT, the Manager or any of its directors, officers, employees, agents or advisers, to register this document as an offering document orotherwise to permit public distribution of this document.