Embed Size (px)
Citation preview


Annual SIP Progress Report
December 29, 2014 – December 29, 2015
California - Child and Family Services Review


4
Ca
lifo
rnia
- C
hild
an
d F
am
ily
Se
rvic
es R
evie
w
Table of Contents
INTRODUCTION .....................................................................................................................PAGE 4
SIP NARRATIVE .....................................................................................................................PAGE 6
STATE AND FEDERALLY MANDATED CHILD WELFARE/PROBATION INITIATIVES ...................................PAGE 32
ATTACHMENTS .....................................................................................................................PAGE 44
FIVE-YEAR SIP CHART – CHILD WELFARE ...................................................................... ATTACHMENT 1
FIVE-YEAR SIP CHART – PROBATION ............................................................................ ATTACHMENT 2

5
Ca
lifo
rnia
- C
hild
an
d F
am
ily
Se
rvic
es R
evie
w
Introduction
Background – Child and Family Services Review
In 1994, amendments to the Social Security Act (SSA) authorized the U.S. Department of Health
and Human Services (HHS) to review state child and family service programs’ conformity with
the requirements in Titles IV-B and IV-E of the SSA. In response, the Federal Children's Bureau
initiated the Child and Family Services Reviews (CFSR) nationwide in 2000. It marked the first
time the federal government evaluated state child welfare service programs using
performance-based outcome measures in contrast to solely assessing indicators of processes
associated with the provision of child welfare services. California was first reviewed by the
Federal Health and Human Services Agency in 2002 and began its first round of the CFSRs in the
same year. Ultimately, the goal of these reviews is to help states achieve consistent
improvement in child welfare service delivery and outcomes essential to the safety,
permanency, and well-being of children and their families.
California Child and Family Services Review (C-CFSR)
The California Child and Family Services Review (C-CFSR), an outcomes-based review mandated
by the Child Welfare System Improvement and Accountability Act (Assembly Bill 636), was
passed by the state legislature in 2001. The goal of the C-CFSR is to establish and subsequently
strengthen a system of accountability for child and family outcomes resulting from the array of
services offered by California’s Child Welfare Services (CWS). As a state-county partnership,
this accountability system is an enhanced version of the federal oversight system mandated by
Congress to monitor states’ performance, and is comprised of multiple elements.
Quarterly Outcome and Accountability Data Reports
The California Department of Social Services (CDSS) issues quarterly data reports which include
key safety, permanency, and well-being outcomes for each county. These quarterly reports
provide summary-level federal and state program measures that serve as the basis for the C-
CFSR and are used to track performance over time. These data reports are used to inform and
guide both the assessment and planning processes, and are used to analyze policies and
procedures. This level of evaluation allows for a systematic assessment of program strengths
and limitations in order to improve service delivery. Linking program processes or performance
with federal and state outcomes helps staff to evaluate their progress and modify the program
or practice as appropriate. Information obtained can be used by program managers to make
decisions about future program goals, strategies, and options. In addition, this reporting cycle
is consistent with the notion that data analysis of this type is best viewed as a continuous
process, as opposed to a one-time activity for the purpose of quality improvement.

6
Ca
lifo
rnia
- C
hild
an
d F
am
ily
Se
rvic
es R
evie
w
County Self-Assessment and Peer Review
The County Self-Assessment (CSA) is a comprehensive review of each county’s Child Welfare
Services (CWS) and youth in foster care under the supervision of the Probation Department.
The CSA assesses the full array of child welfare and juvenile probation, from prevention and
protection through permanency and aftercare. The CSA is the analytic tool used by counties to
determine the effectiveness of current practice, programs and services across the continuum of
child welfare and probation placement services and to conduct a needs assessment to help
identify areas for targeted system improvement. In Marin, Child Welfare and Juvenile
Probation worked together, along with MAC and stakeholders, to compile the CSA and Peer
Review.
The CSA is developed every five years by the lead agencies (Children’s Services and Probation)
in coordination with the local community and prevention partners. The process has multiple
components including peer review, intensive case worker interviews, and focus groups to
gather input from child welfare constituents on the full scope of child welfare and juvenile
probation services provided within the County. The CSA also includes quantitative analysis of
child welfare data. The Peer Review is intended to provide counties with issue-specific,
qualitative information gathered by outside peer experts. Both the CSA and the Peer Review
serve as the foundation for the County System Improvement Plan.
In addition, the California Department of Social Services Office Of Child Abuse Prevention is
now integrated into the C-CFSR and information is reported in the SIP regarding the use of
CAPIT/CBCAP and/or PSSF funds to divert children and families from entering the child welfare
system. These funds support the County providing a continuum of services for children and
families with an emphasis on prevention and early intervention.
System Improvement Plan
Incorporating data collected through the Peer Review and the CSA, the final component of the
C-CFSR is the System Improvement Plan (SIP). The SIP serves as the operational agreement
between the County and state, outlining how the County will improve its capacity to provide
better outcomes for children, youth, and families. The SIP includes a coordinated service
provision plan for how the county will utilize prevention, early intervention, and treatment
funds (CAPIT/CBCAP/PSSF) to strengthen and preserve families, and to help children find
permanent families when they are unable to return to their families of origin. Quarterly county
data reports, quarterly monitoring by CDSS, and annual SIP progress reports are the
mechanisms for tracking a county's progress. The SIP is developed every five years by the lead
agencies in collaboration with their local community and prevention partners. The SIP includes
specific action steps, timeframes, and improvement targets and is approved by the BOS and
CDSS. The plan is a commitment to specific measurable improvements in performance
outcomes that the county will achieve within a defined timeframe including prevention
strategies.
System Improvement Plan Progress Report
Counties, in partnership with the state, utilize quarterly data reports to track progress. The
process is a continuous cycle and the county systematically attempts to improve outcomes.

7
Ca
lifo
rnia
- C
hild
an
d F
am
ily
Se
rvic
es R
evie
w
The SIP is updated yearly and becomes a mechanism through which counties report on
progress toward meeting agreed upon improvement goals. This report is the annual System
Improvement Plan Progress Report.
As required, Marin County Children and Family Services and Juvenile Probation will lead the
completion of this SIP Progress Report with partnership with the California Department of
Social Services. This Progress Report covers 12/29/2014 through 12/29/2015.
SIP Progress Narrative
Stakeholders Participation
The current System Improvement Plan (SIP) covers December 29, 2013 – 2018. Internal
meetings were conducted with all levels of staff to review the PR and CSA findings. In addition
the quarterly county data reports are consistently monitored and based on all of this
information, outcomes for inclusion in the SIP were identified. The management team met to
review strategies and timeframes and responsibilities were assigned. In addition, smaller
groups of external stakeholders were consulted regarding specific strategies and actions in
which they had indicated an interest and/or where there was a need for buy in and partnership.
For example, the SIP was shared with the Marin Foster Parent Association (MFPA) at one of the
regularly scheduled meetings between CFS and the MFPA, the SIP was also discussed at the
monthly meeting with the Courts and the Juvenile Court Judge (these meetings include
representatives from CASA and the local child abuse council). CFS also meets regularly with
mental health partners, foster parents, parents, and youth, and others as part of the ongoing
Katie A process. While the SIP is not a specific agenda item, SIP strategies are frequently
discussed. It is common practice to share our current SIP when meeting with community
partners (local domestic violence agency, alcohol and other drug partners, educational partners
and so forth); this is used to help facilitate dialogue about shared goals. In the last year much
progress has been made towards implementing the identified action steps.
Current Performance Towards SIP Improvement Goals
The analysis below includes a comparison between the baseline quarterly data report, Quarter
3, 2012 used in the CSA and the most recent quarterly data report, Quarter 1, 2015.
Additionally, Quarter 1, 2014 data from the previous System Improvement Plan Progress Report
is also included for reference.1
On October 10, 2014, the Administration for Children & Families (ACF) issued a new Federal
Register notice (79 FR 61241) that notified states of the final plan to replace the data outcome
1 Webster, D., Armijo, M., Lee, S., Dawson, W., Magruder, J., Exel, M., Cuccaro-Alamin, S., Putnam-Hornstein, E., King, B., Morris, Z., Sandoval,
A., Yee, H., Mason, F., Benton, C., & Pixton, E. (2015). CCWIP reports. Retrieved 8/24/2015, from University of California at Berkeley California
Child Welfare Indicators Project website. URL: http://cssr.berkeley.edu/ucb_childwelfare

8
Ca
lifo
rnia
- C
hild
an
d F
am
ily
Se
rvic
es R
evie
w
measures used to determine a state's substantial conformity with titles IV-B and IV-E of the
Social Security Act. On May 13, 2015, ACF published a correction to this Final Rule in the
Federal Register (80 FR 27263). More information can be found on the Federal Register’s
website at https://www.federalregister.gov, or the Federal CFSR Portal at
https://www.cfsrportal.org.
The previous 17 federal data outcome measures have been replaced, updated, or eliminated to
produce a total of seven new data outcome measures. The new measures are listed below:
SAFETY
S1 - Maltreatment in foster care: Of all children in foster care during a 12-month period,
what is the rate of victimization per day of foster care?
S2 - Recurrence of maltreatment: Of all children who were victims of a substantiated or
indicated maltreatment report during a 12-month reporting period, what percent were
victims of another substantiated or indicated maltreatment report within 12 months of
their initial report?
PERMANENCY
P1 - Permanency in 12 months for children entering foster care: Of all children who
enter foster care in a 12-month period, what percent are discharged to permanency
within 12 months of entering foster care?
P2 - Permanency in 12 months for children in foster care 12 to 23 months: Of all
children in foster care on the first day of a 12-month period, who had been in foster
care (in that episode) between 12 and 23 months, what percent dis-charged from foster
care to permanency within 12 months of the first day of the period?
P3 - Permanency in 12 months for children in foster care 24 months or longer: Of all
children in foster care on the first day of a 12 month period who had been in foster care
(in that episode) for 24 months or more, what percent discharged to permanency within
12 months of the first day of the 12 month period?
P4 - Re-entry into foster care in 12 months: Of all children who enter foster care in a 12-
month period who discharged within 12 months to reunification, live with relative, or
guardianship, what percent re-entered foster care within 12 months of their discharge?
P5 - Placement Stability: Of all children who enter foster care in a 12-month period,
what is the rate of placement moves per day of foster care?
Counties are required to report on the new outcome measures in C-CFSR documents due to
CDSS after October 1, 2015. This report will report on the previous CFSR 2 Measures as well as
the new CFSR 3 measures. The table below compares the old measures with the new
measures.
OLD
National
Standard NEW
National
Standard
SAFETY
S1.1 No Recurrence of
Maltreatment >94.6 S2 Recurrence of
Maltreatment <9.1

9
Ca
lifo
rnia
- C
hild
an
d F
am
ily
Se
rvic
es R
evie
w
OLD
National
Standard NEW
National
Standard
S1.2 No Maltreatment in Foster
Care >99.68 S1 Maltreatment in Foster
Care <8.50
Permanency
C1.3 Reunification w/in 12 months
(Entry Cohort)
>48.4
P1 Permanency in 12
months (Entering FC) >40.5%
C2.5 Adoption w/in 12 months
(Legally Free) >53.7
C2.1 Adoption w/in 24 months >36.6
P2 Permanency in 12
months (12-23 months)
>43.6%
C2.3 Adoption w/in 12 months (17
months in Care) >22.7
C2.5 Adoption w/in 12 months
(Legally Free) >53.7
C3.2 Exits to Permanency (legally
free at exit) >98.0
C2.1 Adoption w/in 24 months >36.6
P3 Permanency in 12
months (24+ months)
>30.3%
C2.5 Adoption w/in 12 month
(Legally Free) >53.7
C3.1 Exits to Permanency (24
months in Care) >29.1
C1.4 Re-Entry following
Reunification <9.9 P4 Re-Entry into Foster care
in 12 months
<8.3%
C4.1 Placement Stability (8 days to
12 days) >86.0
P5 Placement Stability
<4.12
C4.2 Placement Stability (12-23
months) >65.4
C4.3 Placement Stability (24 months
in care) >41.8
The following measures have been eliminated:
OLD National Standard
Eliminated
C1.1 Reunification w/in 12 months (Exit) >75.2
C1.2 Median Time to Reunification <5.4 months
C2.2 Median Time to Adoption <27.3 months

10
Ca
lifo
rnia
- C
hild
an
d F
am
ily
Se
rvic
es R
evie
w
C2.4 Legally Free w/in 6 months (17 months in care) >10.9
C3.3 In Care 3 yrs. or Longer (Emancipated) <37.5
Priority Outcome Measure or Systemic Factor:
CHILD WELFARE
SAFETY
S1.1 NO RECURRENCE OF MALTREATMENT
National Standard: 94.6%
Baseline Quarter 3, 2012: 85.7%
Quarter 1, 2014: 91.7% (99 out of 108 children)
Comparison to baseline: +6.0 % Positive movement
S2- CHILDREN WITH SUBSTANTIATED ALLEGATION DURING 12-MONTH PERIOD: RECURRENCE WITHIN 12 MONTHS.
Quarter Maltreated during the
12-month period Recurrence within 12 months %
Q3 2012
Oct 1, 2010 to Sept. 30, 2011 242 41 16.9%
Q1 2015
Apr 1, 2013 to Mar 31, 2014 185 24 13.00%
-23.4%
National Standard: <=9.1%
County Performance – Not meeting standard; needs improvement
ANALYSIS:
There has been a positive trend in outcome S1.1 since the baseline. Outcome S1.1 has
improved by 6% since the baseline from Quarter 3, 2012. Although it should be noted that a
closer analysis of the S1.1 data revealed that there was a data entry issue in the front end of
the system that was impacting outcomes. Apparently, hotline staff were not entering the
incident date of a historical report of abuse/neglect when it was received. So in some instances
children who were already in care appeared as if they were experiencing subsequent abuse as
omitting the incident date caused the incident date to default to the date the report was taken.
This has now been corrected. In measure S2, the table shows Quarter 1, 2015 that we are not
meeting this standard. Marin County has diligently tracked the number of children that
experience a recurrence of maltreatment. For S2, to meet the national standard of less than
9.1%, there would need to be 3 less children (16.7 children total) that experienced recurrence
of abuse. Preliminary data indicates that there were fewer re-entries last calendar year
suggesting that the Administrative Review process may be helping staff develop more solid
reunification plans with families. Some instances moreover, our strategies of implementing

11
Ca
lifo
rnia
- C
hild
an
d F
am
ily
Se
rvic
es R
evie
w
Safety Organized Practice, Structured Decision Making has strengthened our assessment and
engagement of families which has assisted in improving this outcome.
TABLE 1: MALTREATED DURING THE 6-MONTH PERIOD: NO RECURRENCE WITHIN 6 MONTHS (JANUARY 2012 –
SEPTEMBER 2014) PERCENT Interval
JAN2012-
JUN2012
APR2012-
SEP2012
JUL2012-
DEC2012
OCT2012-
MAR2013
JAN2013-
JUN2013
APR2013-
SEP2013
JUL2013-
DEC2013
OCT2013-
MAR2014
JAN2014-
JUN2014
APR2014-
SEP2014
% % % % % % % % % %
No recurrence
of
maltreatment
within 6
months
93.1 92.9 93 93.4 93.1 93.3 93.3 93.4 93.4 93.4
Recurrence of
maltreatment
within 6
months
6.9 7.1 7 6.6 6.9 6.7 6.7 6.6 6.6 6.6
Data Source: CWS/CMS 2015 Quarter 1 Extract.
Table 1 above demonstrates overall steadiness of this measure since January-June 2012. No
more than 7% of children are maltreated in Marin, however, we want this rate to drop and stay
below to 5.4%.
This SIP has several strategies that are intended to contribute to improvement in this outcome.
Through the CSA process it was identified that to reduce the outcome of recurrence of
maltreatment we needed to strengthen the cohesiveness of the supervisory team to ensure
more consistent guidance around decision making and use of safety and risk assessments tools.
Creating a common lens for working with families and assessing harm and danger and the
possible event of recurrence. It was further identified that increasing family engagement, so
that families could engage with the social worker and community partners for what services
they need would improve this outcome. Over the past reporting period CFS has taken steps to
implement the following strategies:
1. Strengthen the cohesiveness of the child welfare supervisory team through the
provision of ongoing SOP coaching and skill building
2. Provision of monthly unit/program specific training on use of SOP in the field
3. Ensuring that there are technical experts and agency champions available to offer
support and guidance for updated SDM tools
4. Increasing family engagement; building community awareness and response to child
abuse and neglect
While there has been significant work done with the CFS leadership team to strengthen team
cohesiveness and promote more uniform guidance, decision making and practice, given the
number of recent staff changes with the leadership team it will be important that work to
strengthen leadership cohesiveness continue into the next year.

12
Ca
lifo
rnia
- C
hild
an
d F
am
ily
Se
rvic
es R
evie
w
Finally, steady progress has been made in engaging or re-engaging key community
partners/stakeholders. Collaborative meetings with law enforcement, mental health/Katie A.
partners, local alcohol and other drugs partners, educational partners, the local domestic
violence agency and the DA and other partners addressing CSEC are now occurring on a regular
basis. Additionally, the County Office of Education and CFS are currently in the process of
implementing Foster Focus and are in the process of finalizing the MOU for the Educational
Liaison role.
PERMANENCY
PRIORITY OUTCOME MEASURE OR SYSTEMIC FACTOR: C1.4 RE-ENTRY FOLLOWING REUNIFICATION
National Standard: 9.9%
Baseline Quarter 3, 2012: 25.5%
Quarter 1, 2014: 14.8% (4 of 27 children)
Comparison to baseline: 5.8%
P4- CHILDREN WITH ENTRIES DURING 12-MONTH PERIOD, EXITS TO REUNIFICATION OR GUARDIANSHIP WITHIN 12
MONTHS: RE-ENTRIES WITHIN 12 MONTHS. APR 1, 2012 TO MAR 31, 2013.
Quarter Children with entries, exits to
reunification or guardianship
Children with
re-entries %
Q3 2012
Oct 1, 2010 to Sept. 30, 2011 13 5 38.5%
Q1 2015
Apr 1, 2013 to Mar 31, 2014 22 8 36.40%
-5.5%
National Standard: <= 8.3%
County Performance – Not meeting standard; needs improvement

13
Ca
lifo
rnia
- C
hild
an
d F
am
ily
Se
rvic
es R
evie
w
TABLE 2: C1.4 REENTRY FOLLOWING REUNIFICATION (EXIT COHORT) PERCENT Interval
APR2010-MAR2011 APR2011-MAR2012 APR2012-MAR2013 APR2013-MAR2014
% % % %
Reentered in less than 12 months 34.5% (10 kids) 18.5% (5 kids) 14.8% (4 kids) 31.3% (10 kids)
No reentry within 12 months 65.5% (22 kids) 81.5% (22 kids) 85.2% (23 kids) 69.7% (23 kids)
Data Source: CWS/CMS 2015 Quarter 1 Extract.
ANALYSIS
The December 2014 SIP progress report revealed positive improvement in C1.4 re-entry
outcome at 14.8%. However, this period (Q1 2015) shows a negative performance, with an
increase to 31.3% of re-entry. Ten children re-entered this period. Table 2 above shows the
variability in this measure over 4 intervals. Although the total number of children (between 22
and 32 children) is fairly constant, they are small numbers. A matter of 5 children can have
great impact. For measure P4 re-entry, we are also not meeting the national standard. In order
to meet this measure, there would need to be 9 less children who re-entered foster care.
There were a number of strategies explored during the CSA process that focused on how to
reduce re-entry. The SIP has multiple strategies that may contribute to strengthening
performance in this outcome. These include building the cohesiveness of the supervisory team;
increasing the utilization of standardized assessment tools; improving assessments of safety,
harm, and danger; and ensuring that families have realistic, sustainable safety plans. These
strategies require careful planning and strong family and community engagement. CFS
continues to work in collaboration with Mental Health partners to increase access to mental
health services; regularly uses SOP to better engage families and their natural supports; and has
implemented a system of Administrative review for all families where reunification is being
recommended. There is some preliminary indication that the Administrative reviews and other
efforts are helping to reduce re-entry. In addition, the Department is in the process of
reviewing its current Administrative Review procedures in an effort to systemize and streamline
the process and ensure that staff are better prepared and feel more supported at the meetings.
While there is still work to be done, the administrative process as a whole has been particularly
illuminating and has provided Managers the opportunity see both strengths and gaps in daily
practice. The information that we learn in these meetings has helped us better target our
training and support.
COMPLIANCE
PRIORITY OUTCOME MEASURE OR SYSTEMIC FACTOR: 2B TIMELY RESPONSE (10 DAY
RESPONSE)
State Goal: 90%
Baseline Quarter 3, 2012: 95.3%
Quarter 1, 2014: 97%

14
Ca
lifo
rnia
- C
hild
an
d F
am
ily
Se
rvic
es R
evie
w
Quarter 1, 2015: 93%
Comparison to Baseline: -4.0% Decrease; above State Goal
TABLE 3: REFERRALS BY TIME TO INVESTIGATION (10-DAY RESPONSE TYPE) PERCENT JAN2012-MAR2012 JAN2013-MAR2013 JAN2014-MAR2014 JAN2015-MAR2015
% % % %
Timely Response 88.6% 85.7% 97% 93%
No Timely Response 11.4% 14.3% 3% 7%
Total 100 100 100 100
ANALYSIS
It is an expectation of the County that all staff will conduct timely investigations of referral
allegations of child abuse and neglect. Since the baseline in Quarter 3, 2012, there has been a
decrease in this measure. However, this measures has been improving including peaking at
97% in January – March 2014.
A number of systemic barriers were noted in the CSA and strategies were identified to help
address this issue. In a small county staff absences and vacancies or changes in referral volume
can greatly impact workflow. Over the past reporting period unplanned staff absences and
increases in the percentage of referrals requiring an immediate response impacted the
compliance on 10 day referrals as Emergency Response Social workers must prioritize work to
respond to immediate referrals. Overall the creation of the Court Unit has helped improve the
work flow for Emergency Response workers however unanticipated staff absences are still a
challenge to manage. Moreover, the temporary loss of a bi-lingual staff person placed greater
burden on the unit. The Department continues to explore ways to minimize the impact that
unexpected staff absences have on the workflow in the front end of the system.
PROBATION
PRIORITY OUTCOME MEASURE OR SYSTEMIC FACTOR:
C1.1 - REUNIFICATION (WITHIN 12 MONTHS) EXIT COHORT
National Standard: 75.2%
Baseline Quarter 3, 2012: 33.3%
Quarter 1, 2014: 33.3% (2 of 6 children)
Comparison to baseline: 0%
P1- CHILDREN WHO ENTERED FOSTER CARE DURING 12-MONTH PERIOD: EXIT STATUS AT 12 MONTHS.
Quarter Entered foster care in a
12 month period
Children discharged to
permanency within 12 months %
Q3 2012 12 4 33.3%
15
Ca
lifo
rnia
- C
hild
an
d F
am
ily
Se
rvic
es R
evie
w
Oct 1, 2010 to Sept. 30, 2011
Quarter 1 2015
Apr 1, 2013 to Mar 31, 2014 8 0 0%
-100%
National Standard: >= 40.5%
County Performance - Not meeting standard; needs improvement
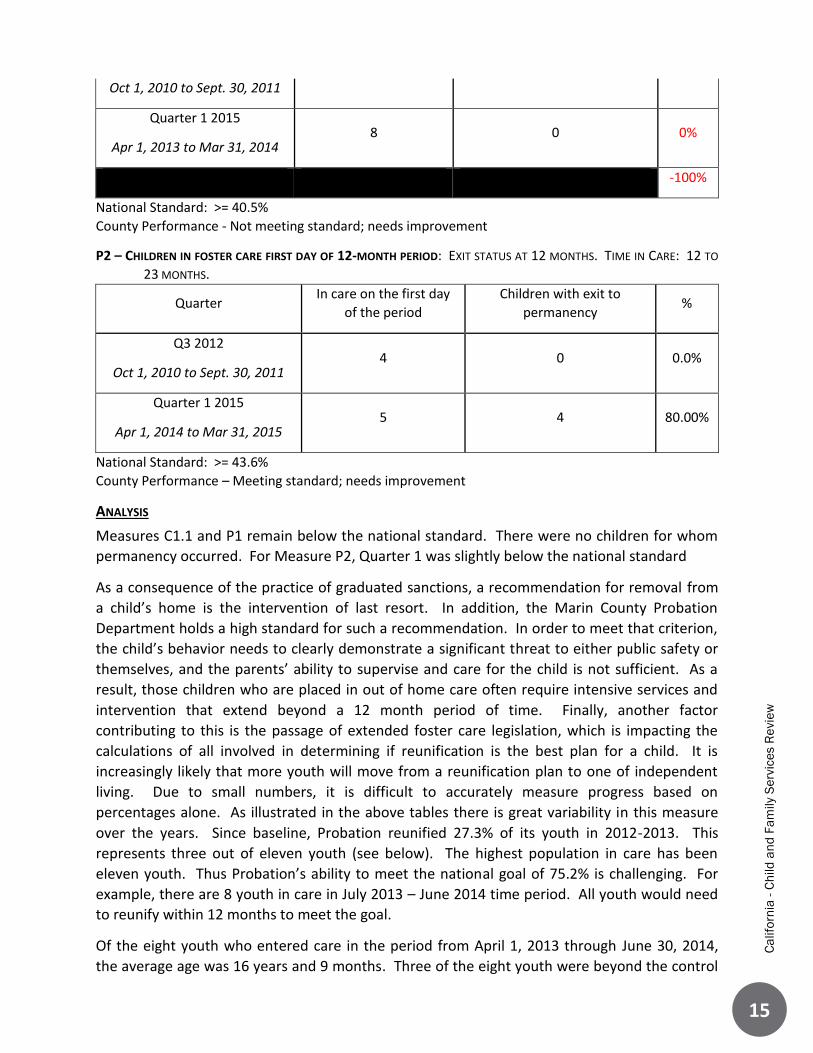
P2 – CHILDREN IN FOSTER CARE FIRST DAY OF 12-MONTH PERIOD: EXIT STATUS AT 12 MONTHS. TIME IN CARE: 12 TO
23 MONTHS.
Quarter In care on the first day
of the period
Children with exit to
permanency %
Q3 2012
Oct 1, 2010 to Sept. 30, 2011 4 0 0.0%
Quarter 1 2015
Apr 1, 2014 to Mar 31, 2015 5 4 80.00%
National Standard: >= 43.6%
County Performance – Meeting standard; needs improvement
ANALYSIS
Measures C1.1 and P1 remain below the national standard. There were no children for whom
permanency occurred. For Measure P2, Quarter 1 was slightly below the national standard
As a consequence of the practice of graduated sanctions, a recommendation for removal from
a child’s home is the intervention of last resort. In addition, the Marin County Probation
Department holds a high standard for such a recommendation. In order to meet that criterion,
the child’s behavior needs to clearly demonstrate a significant threat to either public safety or
themselves, and the parents’ ability to supervise and care for the child is not sufficient. As a
result, those children who are placed in out of home care often require intensive services and
intervention that extend beyond a 12 month period of time. Finally, another factor
contributing to this is the passage of extended foster care legislation, which is impacting the
calculations of all involved in determining if reunification is the best plan for a child. It is
increasingly likely that more youth will move from a reunification plan to one of independent
living. Due to small numbers, it is difficult to accurately measure progress based on
percentages alone. As illustrated in the above tables there is great variability in this measure
over the years. Since baseline, Probation reunified 27.3% of its youth in 2012-2013. This
represents three out of eleven youth (see below). The highest population in care has been
eleven youth. Thus Probation’s ability to meet the national goal of 75.2% is challenging. For
example, there are 8 youth in care in July 2013 – June 2014 time period. All youth would need
to reunify within 12 months to meet the goal.
Of the eight youth who entered care in the period from April 1, 2013 through June 30, 2014,
the average age was 16 years and 9 months. Three of the eight youth were beyond the control

16
Ca
lifo
rnia
- C
hild
an
d F
am
ily
Se
rvic
es R
evie
w
of their parents and engaged in behaviors that were extremely dangerous to themselves,
primarily use of drugs and alcohol, including methamphetamines, and one child was a victim of
human trafficking. Five of the eight youth were engaged in delinquent behaviors that
represented a threat to not only their safety but also that of the community. None of the
behaviors being addressed in out of home placement for these youth are easily corrected
within 12 months. In addition, four of the eight youth entered AB12 upon the completion of
their probation placement. This means that these youth made the voluntary determination
that they wished to participate in this program, and they made the transition to 450 Non-Minor
Dependent status immediately after their 18th birthday. In order to be eligible for this program,
they needed to complete their treatment goals in placement and to be 18 years old while under
a foster care order. All of these factors contributed to the Probation Department’s inability to
meet the national standard for reunification. The department will continue to monitor and
assess whether there are any strategies that the department can make internally to affect this
measure.
Status of Strategies
CHILD WELFARE (STRATEGIES 1-8)
Strategy 1: Strengthen cohesiveness of the child welfare supervisory team through:
Identification of common vision and goals
Consistent use Safety Organized Practice(SOP) tools as part of assessment and
supervision
Consistent use of Structured Decision Making (SDM) Assessment tools during
supervision
Provision of refresher supervisory training and coaching
Analysis
Strategy 1 is intended to improve the following outcomes:
S1.1 - Recurrence of Maltreatment
C1.4 - Re-entry following Reunification
2B - Timely Response (10 day response compliance)
S2 Recurrence of Maltreatment
P4 Re-entry
Use of SOP, specifically safety mapping and family team meetings engages families in safety
decision making and case planning, thus obtaining their input and opinions. Research has
shown when families are engaged in such processes, they are more likely to follow-through
with such decisions and case plan goals. Additionally, time is spent to ensure families
understand the harm and danger of circumstances that compromise child safety. With
families further understanding safety and following through with well-thought-out decisions,
they are less likely to experience reentry or recurrence.
This strategy remains an effective approach in improving all three outcome areas. With

17
Ca
lifo
rnia
- C
hild
an
d F
am
ily
Se
rvic
es R
evie
w
emphasis placed on strengthening the supervisory team, all outcomes are positively
impacted. For S1.1 and C1.4, while supervisors and managers have made great strides in
integrating SOP techniques into supervision and are actively helping their staff utilize SOP
tools such as mapping, safety planning, to help ensure children are safe at key decision
points, there is more work to be done to improve consistent use of SDM tools for ongoing
cases. The new version of SDM will provide an opportunity to offer additional training and
support for Supervisors in this area. Over the past reporting period there has been significant
change in the Supervisory team and a front end vacancy currently exists. Once all positions
are in place it will be important to attend to rebuilding team cohesiveness and consistency.
Action Step Analysis:
A. Bring together supervisory and management team to identify common vision and
goals. Utilize SIP to inform development of strategic plan.
B. Utilize Leadership meetings as an opportunity to promote increased use of SOP tools
and consistent use of SDM tools as part of data review, case assessment, and
supervision with staff.
C. Implement strategies identified in the plan with supervisors and staff.
D. Assess and Evaluate the implementation strategies as part of bi –monthly Leadership
Team meetings and track and monitor the increased use of SDM and SOP Tools.
E. Provide supervisor coaching and training.
Analysis:
As mentioned in the last progress report, the timeframe for action step A has been extended
to December 2015. While there was initial progress made on this strategy including the
completion of action step A with a productive leadership retreat focused on strengthening
teamwork and a follow up meeting to discuss SIP strategies in detail where supervisors and
staff identified their particular areas of interest.
Ongoing progress of the SIP strategies will continue to be reviewed monthly at Leadership
Team meetings. With the addition of new Supervisory staff it has been important to orient
new staff so that they are familiar with SIP strategies and their role in each strategy.
Moreover, with the addition of new mandates such as Case Review and CCR there is a need
re- assess timelines associated with each of the SIP strategies.
Method of Evaluation & Monitoring
This strategy will be assessed by management’s observation of Supervisors consistent use of
Safe Measures to track staff compliance and the completion of SDM tools. Safe Measures
usage can be monitored by the Child Welfare Director, and the completion of SDM tools is
tracked in Safe Measures. Safe measures data is reviewed monthly at leadership meetings.
SOP tools are utilized during Administrative Reviews and other staff and client meetings. SOP
language is being integrated into referral, investigative narratives, case plans, etc. as a means
to facilitate systematic and consistent use of the tool. Supervisors receive regular coaching to

18
Ca
lifo
rnia
- C
hild
an
d F
am
ily
Se
rvic
es R
evie
w
assist them in promoting use of SOP with their staff and the SOP coach meets every other
month with the Leadership Team to provide feedback.
Additional Strategies (when applicable)
No new action steps are being added to this strategy, however due to the fact that the
County has such a small leadership team action step A will need to be repeated once the new
members are in place. The completion date for action step A has been changed to June 2016
and ongoing given delays in filling vacant supervisor position and a more realistic assessment
that this works needs to be ongoing to be effective.
Program Reduction
None
Strategy 2: Implement a structured system of management case review for all cases where
there has been recurrence of maltreatment or re-entry after reunification, and continue
implementation of Review Process for all cases preparing for reunification.
Implement a system of case review for all cases in accordance with the Federal/State
standards incorporating continuous quality improvement (CQI) and continue the
implementation of the Administrative Review process for all cases preparing for reunification.
Analysis
Strategy 2 is intended to improve the following outcomes:
S1.1 - Recurrence of Maltreatment
C1.4 - Re-entry following Reunification
S2 Recurrence of Maltreatment
P4 Re-entry
The Administrative Review process which incorporates SOP mapping helps staff evaluate
family strengths as well as any current harm and danger. These discussions inform the
development of strong safety plans which ultimately contribute to successful and lasting
reunification, thus preventing reentry after reunification and recurrence of maltreatment.
The County has changed the plan and the target completion date for the case review process
to align with the Federally required CQI case review process. The completion of action steps
A-C has been extended so that they are in alignment with the State funding cycle needed to
support the budgetary demands associated with this responsibility.
Action Step Analysis:
A. Establish a Case Review Team.
B. Develop case review policy and protocol and review with staff.
C. Implement case review process.
D. Continue Administrative case reviews.
E. Track outcomes of reunification cases reviewed at the Administration Review to see if

19
Ca
lifo
rnia
- C
hild
an
d F
am
ily
Se
rvic
es R
evie
w
process is reducing re-entry.
F. Document lessons learned from both Administrative reviews and Case reviews
G. Review lessons learned from the Case Reviews with Leadership Team and identify
policies and/or practice changes that are needed.
H. Document policy/practice change and distribute to staff. Provide training as needed.
I. Evaluate if the changes have improved the outcome
Analysis:
The completion of action steps A & B associated with the implementation of the case review
and CQI process were extended to April 2015 to better align with receipt of the State
allocation that will support this new responsibility and creation of new position to oversee
the Case Review and CQI process. A Case Review Supervisor was hired in January and
certified by the Administration for Children and Families over the Summer. A part time
second case review position was added to the team during the Summer months and will
complete the mandated case review training at the end of October. Given recent decisions
by the Administration for Children and Families regarding the QA function, a third position
will be added by year end. Steps D-G associated with the Case Review, QA, and CQI need to
be extended through year end 2016 and should be ongoing.
A rewording of the strategy to better reflect the work that will occur is listed below:
Implement a system of case review for all cases in accordance with the Federal/State
standards incorporating continuous quality improvement (CQI) and continue the
implementation of the Administrative Review process for all cases preparing for reunification.
Method of Evaluation & Monitoring
This strategy will be assessed by monitoring and ensuring that there is a decrease in the
recurrence rates and a decrease in the number of re-entries into foster care via the CWS/CMS
Quarterly outcome reports.
Additional Strategies (when applicable)
None
Program Reduction
None
Strategy 3: Expand ongoing compliance with the use of standardized assessment tools and
the use of SOP best practices throughout the child welfare continuum.
Analysis
Strategy 3 is intended to improve the following outcomes:
S1.1 - Recurrence of Maltreatment

20
Ca
lifo
rnia
- C
hild
an
d F
am
ily
Se
rvic
es R
evie
w
C1.4 - Re-entry following Reunification
S2 Recurrence of Maltreatment
P4 Re-entry
Expanding compliance with SDM and utilizing best practices of SOP, help to create a higher
level of consistency in practice that should lead to improvements in both S2 and P4. The use
of an evidence based assessment tools at consistent points in a referral or case helps to
minimize bias, strengthen case assessments and ensure consistency of decision making
across the agency.
Action Step Analysis:
A. Review and re-issue policy regarding use of standardized assessment tools.
B. Gather baseline compliance numbers and goals
C. Provide support to staff and necessary refresher training to staff to ensure compliance
with the use of standardized tools.
D. Provide regular updates to management regarding the compliance levels.
E. Train staff on utilization of SOP tools to develop effective safety plans that reflect
what parents need to maintain the safety of their children in their homes.
F. Conduct random document reviews to determine that SOP language is incorporated
beginning at intake and throughout case (in Case Plans, Court Reports, and other CWS
documents.)
G. Provide additional training to staff on any gaps identified in the review.
Analysis:
There was progress made on this strategy. As already noted, a refresher SDM training was
held for supervisors and managers in 2014 however there have been a number of staff
transitions as well as recent updates to the SDM tool. Given this, additional attention to this
strategy needs to occur. As noted earlier the County has made only minimal progress
improving usage of the SDM tools on ongoing cases. The recent changes to SDM offer a new
opportunity to re-approach this issue and CFS’ new training supervisor will be working with
staff to identify new strategies to help strengthening SDM compliance. Additionally, existing
SDM policy will be reviewed to ensure that it provides proper guidelines regarding use of
tools. With regard to the use of SOP, coaching is available for both supervisors and staff on
the use of SOP practices. Staff have found this to be helpful and coaching slots are routinely
utilized. It appears that this strategy has been effective in improving both S1.1 and C1.4 as
both have improved. Next steps will be to hone in on specific SOP strategies including the
utilization of mapping, motivational interviewing, and safety planning. Future SOP trainings
will target program areas in order to offer staff more focused support.
Method of Evaluation & Monitoring
Safe Measures has been utilized to establish a baseline to measure compliance with SDM at
key points in the case including Safety Assessments, Risk Assessments, and Risk-
Reassessments. This will continue to be evaluated over time to track improvement in
compliance.

21
Ca
lifo
rnia
- C
hild
an
d F
am
ily
Se
rvic
es R
evie
w
Compliance review for the use of SOP tools will be conducted in supervision, at case review
meetings and eventually evidenced in the language in case plans, court reports, and other
child welfare documents
Additional Strategies (when applicable)
None
Program Reduction
None
Strategy 4: Assess CWS existing ER and CT Unit Structure and make recommendations for
structural or system changes to improve flow of ER assignments and improvement in
response time for referrals necessitating a response within 10 days.
Analysis
Strategy 4 is intended to improve the following outcomes:
2B Timely Response (10 day referral)
In a small county staff absences or changes in referral volume can greatly impact workflow in
a given unit. The existing ER/CT structure is especially vulnerable to this and unplanned staff
absences and/or unanticipated increases in the number of detentions often impacts
compliance on 10 day referrals. Social workers prioritize work to prepare court petitions and
reports and respond to immediate referrals, and compliance with 10 day referrals decreases.
Developing a structure that can better adapt to these unanticipated changes in volume will
be key to improving compliance.
Action Step Analysis:
A. Assess existing ER/Court structure, explore how other counties with similar
demographics are structured, and identify recommendations for change.
B. Once recommendations are made a small scale pilot will occur using the proposed
new ER/court structure.
C. After the pilot reconvene work group to make recommendations for modification and
expansion of the pilot structure.
D. Implement large scale changes.
E. Assess functionality of new structure and review and track impact on ER compliance
with 10 day referrals
Analysis:
The Court unit has now been in existence for 18 months and for the most part it has been
impactful in improving compliance on 10 day referrals. The original Emergency
Response/Court workgroup was reconvened in early 2015 and overall staff provided positive
feedback about the model. It should also be noted that the Court and all attorneys have also
provided positive feedback and feel that the model offers better support to families. That

22
Ca
lifo
rnia
- C
hild
an
d F
am
ily
Se
rvic
es R
evie
w
said, there are still some challenges with this model due to the size of the county and the
unpredictable nature of the volume of work. For example, the unit was initially staffed with 2
court workers, one bi-lingual and the other not, there have been occasions when it is
challenging to balance caseloads. Over the past year an additional bi-lingual caseworker was
hired to help assist with the mono-lingual Spanish speaking cases when needed.
Method of Evaluation & Monitoring
This strategy is evaluated through tracking of response times from receipt of the referral.
Additional Strategies (when applicable)
None needed
Program Reduction
None
Strategy 5: Increase family engagement through the provision of more systematic facilitated
family meetings for families in the emergency response program, incorporating principles of
SOP with other best practice models for family conferencing/teaming.
Analysis
Strategy 4 is intended to improve the following outcomes:
S1.1 - Recurrence of Maltreatment
C1.4 - Re-entry following Reunification
S2 Recurrence of Maltreatment
P4 Re-entry
Facilitated family meetings create the opportunity to develop a community and family
support system at the onset of a child welfare case, establishing essential safety plans that
can enable a child to remain safely in their home. They also create the necessary structure to
check in monitor and if necessary refine safety plans to help ensure that they are realistic
and workable at the time of CFS case closure.
Combining the strategies of Facilitated Family Meetings with principles of SOP (explained in
strategy 3) will enable family meeting participants to better identify what is working (family
strengths), and what is not “worries” and have a more open and frank dialogue in a family
friendly and focused manner. The increased engagement families and their natural supports
in such a manner will also potentially support improved outcomes in Recurrence of
Maltreatment and Re-entry following Reunification.
Similarly, the implementation of the Katie A Core Practice Model (strategy 8) encourages
better engagement of families through “teaming” processes which by design will assist in
decreasing the rate of re-entry by addressing the behavioral health issues of the children.
This strategy cannot be measured for effectiveness at this point as the timelines for the

23
Ca
lifo
rnia
- C
hild
an
d F
am
ily
Se
rvic
es R
evie
w
implementation of action steps will need to be changed and the strategy will not start until
mid-year 2016.
A. Research and review existing family meeting models such as Team Decision Making
and Family Group Conferencing and determine model best suited to meet the
County’s needs.
B. Adapt model to incorporate SOP principles.
C. Develop written policy for use of family meetings.
D. Train staff and community partners in the family meeting model, providing coaching
as needed.
E. Identify staff to pilot family meeting model.
F. Conduct a pilot of family meetings
G. Gather lessons learned from pilot and make needed modifications, implement across
the agency.
H. Evaluate effectiveness of meetings by tracking participation of family and community
members and case outcomes.
Analysis:
Given staffing issues and the implementation of the case review and the Resource Family
Approval process timelines for this strategy have been postponed. The new timelines are
outlined in this update. Action steps will begin mid-year 2016.
Method of Evaluation & Monitoring
The frequency and purpose of Facilitated Family Meetings can be tracked using the new
codes that are in CWS/CMS. Satisfaction of families can be evaluated via surveys or focus
groups and overall effectiveness should impact recurrence and re-entry rates.
Additional Strategies (when applicable)
None
Program Reduction
None
Strategy 6: Build community awareness of child abuse and neglect through the provision of
local child welfare data and education about the dynamics of child abuse and neglect. Work
in conjunction with Marin Advocates for Children (MAC), Marin’s recipient of Community
Based Child Abuse Prevention funds to target and strengthen collaboration with agencies
across the County who serve at risk families and children, especially in the services areas of
domestic violence and substance abuse treatment where there are identified service
gaps/challenges. Building on this strategy is the identification of community partners that
can assist families by participating in team meetings and providing needed support and
services to the families.

24
Ca
lifo
rnia
- C
hild
an
d F
am
ily
Se
rvic
es R
evie
w
Analysis
Strategy 6 is intended to improve the following outcomes:
S1.1 - Recurrence of Maltreatment
C1.4 - Re-entry following Reunification
S2 Recurrence of Maltreatment
P4 Re-entry
Awareness of child abuse and neglect continues to steadily increase throughout the
community. In addition to its relationship with MAC, the county maintains strong
partnerships with other agencies such as local law enforcement, community health,
children’s mental health, Alcohol and Other Drug agencies, domestic violence, the District
Attorney, Marin Community College, local school districts, and the Marin Foster Parent
association. A number of new partnerships with local faith based organizations, sexual
assault advocates, and others have also been established. This year CFS worked in
coordination with the Youth Law Center to implement the Quality Parenting Initiative. The
excellent community participation at these meetings (often 40-50 participants) is further
reflection of the progress that the agency has made in this arena. Additionally, participation
of community partners will be key as the County begins to roll out team decision making or
family group conferencing. These initial steps appear to be helping in improving these two
outcomes of S1.1 and C1.4. Increasing community awareness of child abuse and neglect,
especially among partners who provide essential resources such as AOD treatment or
domestic violence services helps strengthen understanding regarding the needs of families
and children in the community and ultimately creates a stronger safety net for our children.
Stakeholders including parents report that improving the communication and support of the
team in the engagement of services that the family needs improves successful family
dynamics. Families that have numerous supports are able to rely on those supports to
mitigate potential crisis in the family, especially in the case of relapse. The CSA found that
many families experienced recurrence of maltreatment and re-entry following reunification
due to substance abuse relapse. Surrounding these families with support will assist in
improving these outcome measures.
Action Step Analysis:
A. Identify and reach out to key child and family serving agencies, including Alcohol and
Other Drugs and Domestic Violence and initiate dialogue and promote opportunities
for increased collaboration and coordination, including participation in team meetings
and cross training.
B. Establish regular collaborative meetings with the Court and key agencies to provide a
venue for data sharing, problem resolution, increased engagement, coordination, and
agency cross training.
C. Evaluate whether the action plan was effective in increasing services and/or
collaboration with key partners and resulted in improvement in outcomes.
Analysis:

25
Ca
lifo
rnia
- C
hild
an
d F
am
ily
Se
rvic
es R
evie
w
Quarterly meetings have been held with community partners including Center Point, County
Mental Health (Katie A. Collaborative meetings), health providers such as the Marin
Community Clinic and Marin General Hospital, educational agencies including the County
Office of Education and our larger local school districts, law enforcement agencies, and
domestic violence partners. The County continues to contract with the local domestic
violence agency to support an on-site DV Liaison position and is about to finalize a contract
with the County Office of Education for the Educational Liaison position. The County is also in
the midst of a more in-depth partnership with the San Rafael Police Department to
strengthen cross training opportunities and deepen our work together. Additionally, the
County is an active participant in multiple CSEC sub-committees and has developed a strong
relationship with the District Attorney and victim advocate groups working on the CSEC issue.
Finally, the County is also working in close partnership with local community partners who
provide services to the Latino population and has recently established a contract to support
their assistance in helping youth maneuver the SIJS application process. The aforementioned
examples are all reflective of either new or renewed partnerships. The partnerships are a
valuable resource as they help maintain ongoing positive rapport which in turn can help
create a better pathway to services for the families we are working with.
Method of Evaluation & Monitoring
Track the number of trainings provided in the community that offer an overview of child
abuse/ neglect including the specific organizations who received the training(s) and the
number of participants who attended.
Analyze the outreach plan to ensure that CFS and its partner agency MAC have targeted and
prioritized training for those agencies that are best suited to help reduce existing service gaps
identified in the CSA.
Capture the number of times CFS staff present child welfare data and/or overview of child
welfare operations to other community groups.
Track the number of cross-trainings received from and provided to partners such as AOD
programs and Domestic Violence providers. It was identified in the CSA that the relationships
between CFS and partner agencies could be strengthened by the provision of cross training,
the creation of ongoing collaborative meeting opportunities, and meaningful participation in
family meetings. A list of the community members and service providers who participate in
team meetings will be kept and built upon each subsequent year.
Additional Strategies (when applicable)
None needed
Program Reduction
None

26
Ca
lifo
rnia
- C
hild
an
d F
am
ily
Se
rvic
es R
evie
w
Strategy 7: Determine the effectiveness of the existing Differential Response (DR) Path 1
model and make appropriate modifications.
Analysis
Strategy 7 is intended to improve the following outcomes:
S1.1 - No Recurrence of Maltreatment
S2 –Recurrence of Maltreatment
The use of DR is attributed to a better engagement of families in practice, identification of
motivations for family change and building on family strengths. In a multi-state evaluation of
DR, four states evaluated family satisfaction and engagement. It was reported that families
were more satisfied with how they were treated, felt more involved in decision making,
connected to the community and that their contact with CPS was beneficial. Notably one
state found that in 95% of the cases that were DR, families were included in service planning
compared to only 67% of traditional investigations. Social workers felt that families in DR
were more cooperative and willing to engage in services than those in traditional
investigations. Social workers also felt they treated the clients more respectfully in the DR
approach (Child Welfare Information Gateway. (2008). Differential responses to reports of
child abuse and neglect. Washington, DC: U.S. Department of Health and Human Services).
A review of our existing DR model will provide an opportunity to assess if the current DR Path
1 model effectively engages families and successfully links them to services in the
community. It will further assess if our current practice helps reduce recurrence of
maltreatment.
This strategy was scheduled to be initiated in June 2015 but a long term Supervisory vacancy
in the front-end of the system made it impossible to address this strategy. The new start
date will be March 2016. The CSA process identified that there was a need to examine the
D.R. program, look at current service providers, and determine if modifications need to be
changed in the program.
Action Step Analysis:
A. Analyze current Differential Response model and its effectiveness in preventing
recurrence of maltreatment.
B. Identify areas that require modification and develop plan of correction. Determine
next steps.
C. Implement changes as identified in B.
D. Evaluate the program by reviewing its effectiveness in preventing recurrence of
maltreatment
Analysis:
This strategy was scheduled to be initiated in June 2015 however other agency issues (loss of
key staff and case review) demanded management and staff attention. It is anticipated that
work will begin in March 2016.

27
Ca
lifo
rnia
- C
hild
an
d F
am
ily
Se
rvic
es R
evie
w
Method of Evaluation & Monitoring
Review of existing Path 1 program will help determine the effectiveness of our current model
and serve as a means to develop the baseline data needed as we move forward. With limited
resources available we will need to determine if a Path 1 or Path 2 model is better suited to
meet the needs of our County. In particular, we will review current Path 1 referrals to assess
level of client engagement and rate of re-referral. If a new strategy is developed an
evaluation component will be identified.
Additional Strategies (when applicable)
None needed
Program Reduction
None
Strategy 8: Work in collaboration with Mental Health partners to increase access and linkage
to children’s mental health services through implementation of Katie A required practices.
Katie A. v. Bonta is a federal class action lawsuit filed on behalf of California foster youth and
children at risk of out-of-home placement. In September 2011 the Katie A. settlement
agreement was reached which includes:
Timely screening of all children with open Court Ordered and Voluntary CFS cases
Completion of mental health assessments and connection to services
Connection to mental health services
Analysis
This strategy is intended to improve the following outcome:
C1.4 - Re-entry following Reunification
P4 – Re-entry to foster care in 12 months
In support of the foundational concepts of Katie A, research reveals that children in foster
care have significantly higher mental health issues than the general population. It is
estimated that up to 75% of foster children have mental health needs that rise to level of
requiring treatment; however, often children do not receive assessment or treatment. The
consequences of not meeting the mental health needs of children in care are lower
educational attainment, an increase in placement changes and a decrease in the likelihood to
reunify or achieve another form of permanency (Landsverk, J.A., Burns, B.J. Stambaugh, L.F.,
and Reutz, J.A.R. (2006). Mental health for children and adolescents in foster care. Casey
Family Programs).
http://www.casey.org/Resources/Publications/pdf/MentalHealthCareChildren.pdf

28
Ca
lifo
rnia
- C
hild
an
d F
am
ily
Se
rvic
es R
evie
w
Action Step Analysis:
A. Develop collaborative forum with mental health partners to increase access and
linkage to children’s mental health.
B. Implement collaborative forum and utilize forum to develop protocols and policies for
staff in each agency, CFS and Mental Health to implement Katie A. required practices.
C. Cross train staff regarding policies and protocols.
D. Implement policies and protocols that serve children in need of mental health
services.
E. Through collaborative forum, monitor process and modify as needed.
F. Track number of children served and outcomes of children receiving required mental
health services.
Analysis:
Steady progress has continued towards the completion of this Action Step although one of
CFS’ two mental health liaison staff retired and his replacement was only recently hired.
Policies and procedures are effective and remain in place outlining steps required to facilitate
completion of screenings as required by Katie A. Children’s Mental Health has procedures in
place to ensure timely completion of assessments. While the policies work well locally, there
continue to be challenges connecting children living with relatives or FFA providers out of
County with mental health resources. Regular meetings are in place with Children’s Mental
Health to troubleshoot this and any other challenges that surface. In addition, Marin County
is a partner in the new multi-county. Trauma Transformed Federal initiative, we are hopeful
that this partnership may help facilitate increased coordination across County lines.
Method of Evaluation & Monitoring
As there are new mandates regarding implementation of the Katie A Core Practice Model, it
is expected that there will be data entry requirements. It is also anticipated that CDSS will
require counties to submit reports detailing the use of services to ensure counties are
following the new requirements of Katie A.
Additional Strategies (when applicable)
None needed
Program Reduction
None

29
Ca
lifo
rnia
- C
hild
an
d F
am
ily
Se
rvic
es R
evie
w
PROBATION
Strategy 9: Assess the effectiveness of the parent support program and make recommended
modifications.
Analysis
This strategy is intended to impact the following strategy:
C1.1 - Reunification within 12 months
P1 Permanency in 12 months (entering foster care)
Effective July 1, 2015, the Probation Department increased its support to the Parent Support
Program by contracting with Seneca hiring a half-time Equivalent Case Manager, available to
provide additional support services to parents of youth in care. The case manager responds
to the needs, questions, and concerns of parents of youth while they are in foster care. One
of the lessons learned from focus groups conducted with parents was that some of them do
not have enough support or information and experience both stress and anxiety as a result.
The Deputy Probation Officers assigned to their child’s case must dedicate the majority of
their time to managing the placement, and only can provide the parents with the time that
remains after those tasks are taken care of. An additional goal of this position is to
encourage the parents to take the time and energy to address whatever issues they may
have that have contributed to the need for the child to be removed from their home. Parent
education classes (beyond the monthly support group sessions), drug and alcohol treatment,
individual counseling or mental health treatment are offered to the parents so that the child
can be returned to their home as soon as possible and remain safe and healthy. Particularly
in cases where the removal of the child was in part due to the parent’s inability to provide a
safe environment, such services may eliminate that concern and allow the Juvenile Court to
return the child within the 12 months.
Action Step Analysis:
Revisions to the action steps and/or timeframes including an explanation of all
revisions including obstacles or barriers preventing or delaying a strategy and action
step from timely completion.
Modifications made to address obstacles or barriers.
Lessons learned as well as successes encountered during implementation.
A. Implement the plan.
B. Conduct interviews with Probation Officers, facilitators of the group, and families to
determine if changes have been successful.
C. Make modifications as necessary
Analysis:
The Probation Department will be carefully monitoring the amount of participation of
parents in this service to see if there is value to it. It is a voluntary service, and if parents do

30
Ca
lifo
rnia
- C
hild
an
d F
am
ily
Se
rvic
es R
evie
w
not take advantage of the services, it will have to be re-evaluated to see if it is cost-effective
to continue. It may also make sense to assess whether a parent’s participation in this service
resulted in a reduced period of time in care for the child. It is too soon to assess the impact
at this time.
Method of Evaluation & Monitoring
Method of evaluation and/or monitoring of strategies and action steps.
Focus groups with parents can identify the parents’ perception of the effectiveness of the
program. Interviews and/or surveys conducted with probation officers can reveal if they are
seeing any difference in case management when parents are better supported and engaged
in their child’s case plan. Tracking the time to reunification can also assist in evaluating the
effectiveness of the program long-term. As this program has just been implemented we will
re-assess in 12 months to determine its initial effectiveness.
Additional Strategies (when applicable)
None needed
Program Reduction
None
Strategy 10: Actively explore strategies to engage youth and identify best practices for
implementation
Analysis
This strategy is intended to impact the following strategy:
C1.1 - Reunification within 12 months
P1 Permanency in 12 months (entering foster care)
Action Step Analysis:
A. Visit programs such as V.O.I.C.E.S and CHALK to identify the program that could best
meet the needs of Marin County.
B. Develop a plan to implement a youth engagement program that is realistic within
budgetary and staffing constraints.
C. Develop training for staff and community partners to assist in the implementation of
the plan.
D. Implement the plan.
E. Evaluate the effectiveness of the plan by way of surveys and focus groups.
Analysis:
After thoroughly assessing both programs, staff determined that neither program was viable
for a County such as ours with a very small number of youth on probation. While our existing
system has a planned “re-entry” process in which returning youth are introduced to a variety

31
Ca
lifo
rnia
- C
hild
an
d F
am
ily
Se
rvic
es R
evie
w
of services and supports, there is not always a dedicated case manager identified to ensure
cases do not fall “between the cracks”, such as when one Deputy Probation Officer creates a
re-entry plan and then transfers the case to another. As a result, the Probation Department
has dedicated a 0.5 Mental Health Practitioner to the position of “re-entry coordinator” to
assist in the development and implementation of re-entry plans for youth returning from
placement to their communities.
Method of Evaluation & Monitoring
Method of evaluation and/or monitoring of strategies and action steps.
Satisfaction surveys and focus groups will be conducted.
Additional Strategies (when applicable)
None needed
Program Reduction
None

32
Ca
lifo
rnia
- C
hild
an
d F
am
ily
Se
rvic
es R
evie
w
Obstacles and Barriers to Future Implementation
CHILD WELFARE
The past year has been a difficult year for a variety of reasons. There have been persistent
staffing challenges, including a key supervisory position that was vacant for 9 months and the
recent death of another supervisor. In addition, there were two child deaths, both due to
natural causes but traumatic for staff nonetheless. Finally, the demands resulting from the
establishment of the case review process and the upcoming implementation of the RFA process
are stretching the capacity of the Department and making it difficult to prioritize some of the
strategies identified in the SIP.
PROBATION
The uncertainty around foster care reform adds to the difficulty for planning for this process. In
addition, compounding directives from both the State and federal agencies, including this
process, and multiple and at times duplicative oversight mandates (such as reviews of Title IV-E
process and case reviews of placement files) all create demands that reduce capacity to actually
perform the tasks promised in this report. Finally, inconsistent funding at the State level, which
varies year to year and is not made final until a fiscal year is already underway, makes planning
challenging and uncertain.
Promising Practices/ Other Successes
CHILD WELFARE
Overall, the Department is pleased with the progress it is making with the implantation of SOP.
The coaching offered in Unit Meetings has been an effective way to promote consistency
amongst staff and to ensure that the Supervisor is engaged in the staff’s learning. This past
year the Department also implemented the Quality Parenting Initiative (QPI). The initiative has
been especially helpful in preparing the County for RFA. In addition, our increased emphasis on
recruitment helped us increase the number of new licensed foster/resource families. In 2014
we licensed 4 new families and in 2015 we will license 8 new families, a 100% increase.
PROBATION
Seneca, the local wrap services provider, to develop another foster home in the area. This will
further reduce the need to place youth far from their families, and should help to reduce the
period of time in which they are placed out of their homes.

33
Ca
lifo
rnia
- C
hild
an
d F
am
ily
Se
rvic
es R
evie
w
State and Federally Mandated Child Welfare/Probation Initiatives
Marin County is dedicated to providing appropriate services to the After 18 population and
continues to provide a robust Independent Living Skills program and Transitional Services for
both child welfare and probation youth. As of November 18, 2014, the Probation Department
provides services to nine young adults in the After 18 Program, while 14 are currently eligible
but not suitable for services.
As indicated in strategy 8, we continue to implement Katie A services for sub class members
and ensure the provision of appropriate mental health services.
Marin County is not a California Partners for Permanency County.
Marin County is not a Title IV-E Child Welfare Waiver Demonstration Capped Allocation project.
Marin County is not participating in any State corrective action plans.
This SIP is demonstrating how the county is contributing to the successful achievement of
California’s goals for outcomes for children and families.
Marin County is not receiving any technical assistance from the National Resource Center
Training and Technical Assistance.
Outcome Measures not Meeting State/National Standards
The following measures are not meeting state and/or national standards.
Child Welfare
SAFETY
S2.1 NO MALTREATMENT IN FOSTER CARE
GOAL 99.68%
CURRENT 98.48%
NUMERATOR/DENOMINATOR 130 132
Quarter 1 2015
S1- CHILDREN IN FOSTER CARE DURING 12-MONTH PERIOD: RATE OF VIVTIMIZATION PER DAY OF FOSTER CARE.
Quarter Foster care days
Instances of
substantiated
maltreatment
Maltreatment
Reports
n n per 100,000

34
Ca
lifo
rnia
- C
hild
an
d F
am
ily
Se
rvic
es R
evie
w
days
Q1 2015
April 1, 2014 to March 31,
2015
28,084 6 21.36
The national standard is ≤ 8.5.
County Performance – Not meeting standard; needs improvement
As already noted, this is likely a data entry issue. Staff have been advised and should not be
making this error in the future. As of 12/14/15 Safe Measures reported that there was no
recurrence of maltreatment in 95.3% of the referrals involving children who were victims of a
substantiated maltreatment allegation during the six-month period between 10/1/2014 and
3/31/2015.
ANALYSIS OF SAFETY – S2.1/S1
A review of this measure shows that this is the first time there has been a decrease in this
outcome. Since 1998, the outcome has measured 100%. The department is well aware of the
corresponding incident and has concluded that this does not appear to be a long standing
problem that would necessitate a SIP strategy. We are also re-evaluating our data as we have
potentially identified a data entry issue (see page 10 for further analysis).
PERMANENCY
C1.2 MEDIAN TIME TO REUNIFICATION (EXIT COHORT)
GOAL 5.4
CURRENT 7.4
NUMERATOR/DENOMINATOR N/A 23
Quarter 1 2015
TABLE 5: C1.2 MEDIAN TIME TO REUNIFICATION BY AGE GROUP
Age
Group
APR2011-
MAR2012
APR2012-
MAR2013
APR2013-
MAR2014
APR2014-
MAR2015
Months in care Months in care Months in care Months in care
Median Median Median Median
Under 1 1.3 4.3 3.9 1.9
'1-2 11.7 4.1 4.4 6.5
'3-5 5.5 13.2 6.2 8.1
'6-10 7.6 3.9 10.8 10.9
'11-15 14 15.9 9.2 10.1
16-17 0 14.2 2.9 0
Total 7.6 7.4 6.4 7.4

35
Ca
lifo
rnia
- C
hild
an
d F
am
ily
Se
rvic
es R
evie
w
C2.4 LEGALLY FREE WITHIN 6 MONTHS (17 MONTHS IN CARE)
GOAL 10.9%
CURRENT 0%
NUMERATOR/DENOMINATOR 0 7
Quarter 1 2015
P1- CHILDREN WHO ENTERED FOSTER CARE DURING 12-MONTH PERIOD: EXIT STATUS AT 12 MONTHS
Quarter Entered foster care in a 12
month period
Children discharged to
permanency within 12
months
%
Quarter 1 2015
Apr 1, 2013 to Mar 31,
2014
56 25 44.60%
National Standard: >= 40.5%
County Performance – Performing within standard; no improvement needed
P2 – CHILDREN IN FOSTER CARE FIRST DAY OF 12-MONTH PERIOD: EXIT STATUS AT 12 MONTHS. TIME IN CARE: 12 TO
23 MONTHS.
Quarter In care on the first day of the
period
Children with exit to
permanency %
Quarter 1 2015
Oct 1, 2013 to Sep 30,
2014
6 3 50.00%
National Standard: >= 43.6%
County Performance – Performing within standard; no improvement needed
C3.1 EXITS TO PERMANENCY (24 MONTHS IN CARE)
GOAL 29.1%
CURRENT 20%
NUMERATOR/DENOMINATOR 2 10
Quarter 1, 2015
TABLE 6: EXITS TO PERMANENCY (24 MONTHS IN CARE) Interval
APR2011-
MAR2012
APR2012-
MAR2013
APR2013-
MAR2014
APR2014-
MAR2015
Exited to adoption by end of year and
before age 18 26.7 35.3 25 20

36
Ca
lifo
rnia
- C
hild
an
d F
am
ily
Se
rvic
es R
evie
w
Still in care 60 41.2 56.3 70
Quarter 1, 2015
P3- CHILDREN IN FOSTER CARE FIRST DAY OF 12-MONTH PERIOD: EXIT STATUS AT 12 MONTHS - TIME IN CARE: 24
MONTHS OR LONGER.
Quarter In care on the first day of the
period Children with exit to permanency %
Quarter 1 2015
Apr 1, 2013 to
Mar 31, 2014
16 7 43.80%
National Standard: >= 30.3%
County Performance – Performing within standard; no improvement needed
ANALYSIS OF PERMANENCY (REUNIFICATION – C1.2, ADOPTION C2.4, PERMANENCY C3.1, P1, P2, P3)
Reunification measure C1.2 has been consistently between 6.4 and 7.6 months. It is above the
national standard of 5.4 months. In particular children between 6-15 years old have the longest
periods of reunification. We do best in reunifying babies under 1 year old. This specific
measure will no longer exist in the CFSR 3 Measures. In measure C2.4, there were no children
who met this criteria. With such small numbers, it is hard to meet this standard. Had we met
this standard, 1 child (14%) would have needed to have been legally freed. Measures P1 and P2
are all performing within the National Standard.
For Permanency C3.1, we see in Table 5, we have not met the national standard since 2013.
However, we have so few children, a matter of 1 or 2 children can make a significant impact on
the percentages. Measure P3 reveals county performing well above the national standard.
PERMANENCY – PLACEMENT MEASURE
C4.1 PLACEMENT STABILITY- AT LEAST 8 DAYS BUT LESS THAN 12 MONTHS
GOAL 86%
CURRENT 81.5%
NUMERATOR/DENOMINATOR 53 65
Quarter 1, 2015
C4.3 PLACEMENT STABILITY- AT LEAST 24 MONTHS
GOAL 41.8%
CURRENT 38.9%
NUMERATOR/DENOMINATOR 7 18
Quarter 1, 2015
P5- CHILDREN WHO ENTERED FOSTER CARE DURING 12-MONTH PERIOD: RATE OF PLACEMENT MOVES
County Foster Care Days for Children
with Entries
Placement
moves
per 1,000
days

37
Ca
lifo
rnia
- C
hild
an
d F
am
ily
Se
rvic
es R
evie
w
Quarter 1 2015
Apr 1, 2014 to Mar 31,
2015
8,339 36 4.31
National Standard: <= 4.12 per 1,000
County Performance – Not meeting standard; needs improvement
ANALYSIS OF PLACEMENT – C4.1 AND C4.3
Measures C4.1 and C4.3 are only slightly below the national standard and do not represent a
significant problem at this time. In the new CFSR 3 Measures, the county is just slightly above
the national goal in Quarter 1 2015. Not meeting this measure is a matter of 0.19 per 1,000
days. We do not believe this to be significant problem for our children at this point. We will
monitor the measure for the next year. A number of children disrupted placements with
relatives and Foster Family Homes due to the families’ inability to provide permanency.

38
Ca
lifo
rnia
- C
hild
an
d F
am
ily
Se
rvic
es R
evie
w
PROBATION
SAFETY
S1- CHILDREN IN FOSTER CARE DURING 12-MONTH PERIOD: RATE OF SUBSTANTIATED MALTREATMENT.
Quarter
Foster care
days
Instances of substantiated
maltreatment
Maltreatment
Reports
n n per 100,000 days
Q1 2015 2,644
0 0
The nation standard is ≤ 8.5.
County Performance - Performing within standard; no improvement needed
S2- CHILDREN WITH SUBSTANTIATED ALLEGATION DURING 12-MONTH PERIOD: RECURRENCE WITHIN 12 MONTHS. N/A
PERMANENCY
C1.3 REUNIFICATION WITHIN 12 MONTHS (ENTRY COHORT)
GOAL 48.4%
CURRENT 0%
NUMERATOR/DENOMINATOR 0 1
Quarter 1 2015
C1.4 REENTRY FOLLOWING REUNIFICATION (EXIT COHORT)
GOAL 9.9%
CURRENT 16.7%
NUMERATOR/DENOMINATOR 1 6
Quarter 1 2015
C2.3 ADOPTION WITHIN 12 MONTHS (17 MONTHS IN CARE)
GOAL 22.7%
CURRENT 0%
NUMERATOR/DENOMINATOR 0 1
Quarter 1 2015
C2.4 LEGALLY FREE WITHIN 6 MONTHS (17 MONTHS IN CARE)
GOAL 10.9%
CURRENT 0%
NUMERATOR/DENOMINATOR 0 1
Quarter 1 2015

39
Ca
lifo
rnia
- C
hild
an
d F
am
ily
Se
rvic
es R
evie
w
C3.1 EXITS TO PERMANENCY (24 MONTHS IN CARE)
GOAL 29.1%
CURRENT 0%
NUMERATOR/DENOMINATOR 0 1
Quarter 1 2015
GRAPH 1: EXITS TO PERMANENCY
C3.3 IN CARE 3 YEARS OR LONGER (EMANCIPATED OR AGE 18 IN CARE)
GOAL 37.5%
CURRENT 14.3%
NUMERATOR/DENOMINATOR 1 7
Quarter 1 2015

40
Ca
lifo
rnia
- C
hild
an
d F
am
ily
Se
rvic
es R
evie
w
GRAPH 2: IN CARE 3 YEARS OR LONGER
P3 – CHILDREN IN FOSTER CARE FIRST DAY OF 12-MONTH PERIOD: EXIT STATUS AT 12 MONTHS. TIME IN CARE:
24 MONTHS OR MORE.
Quarter In care on the first day of
the period
Children with exit to
permanency %
Quarter 1 2015
Apr 1, 2014 to Mar 31,
2015
1 0 0%
National Standard: >= 30.3%
County Performance – Not meeting standard; needs improvement
P4- CHILDREN WITH ENTRIES DURING 12-MONTH PERIOD, EXITS TO REUNIFICATION OR GUARDIANSHIP WITHIN 12
MONTHS: RE-ENTRIES WITHIN 12 MONTHS.
Quarter Children with entries, exits to reunification
or guardianship
Children with re-
entries %
Q1 2015 3 0 0
National Standard: <= 8.3%
County Performance - Performing within standard; no improvement needed

41
Ca
lifo
rnia
- C
hild
an
d F
am
ily
Se
rvic
es R
evie
w
ANALYSIS – REUNIFICATION C1.3, C1.4, C3.1, C3.3, AND P4
There are so few probation youth that were measured in these outcomes. We are below
standard in all of the measures except P4. We did not have any youth re-enter foster care. We
will continue to address Reunification in our SIP.
PERMANENCY – PLACEMENT MEASURES
C4.1 PLACEMENT STABILITY- AT LEAST 8 DAYS BUT LESS THAN 12 MONTHS
Goal 86%
Current 81.8%
Numerator/Denominator 9 11
Quarter 1 2015
GRAPH 3: PLACEMENT STABILITY
TABLE 7: PLACEMENT STABILITY (8 DAYS TO 12 MONTHS IN CARE) COUNT
APR2012-MAR2013 APR2013-MAR2014 APR2014-MAR2015
N n n
<=2 placements 10 9 9
>2 placements 3 2 2
Total 13 11 11
Data source Q1 2015

42
Ca
lifo
rnia
- C
hild
an
d F
am
ily
Se
rvic
es R
evie
w
P5- CHILDREN WHO ENTERED FOSTER CARE DURING 12-MONTH PERIOD: RATE OF PLACEMENT MOVES
Quarter Foster Care Days for Children with
Entries
Placement
moves
per 1,000
days
Q1 2015 1,901 5 2.63
National Standard: <= 4.12 per 1,000
County Performance - Performing within standard; no improvement needed
ANALYSIS OF PLACEMENT – C4.1
The tables above reveal a performance slightly below the national standard. In Quarter 1,
2015, 2 of 11 children had more than two placements (C4.1). To meet this measure, one less
child would have needed to remain in less than two placements. Measure P5 shows that we
are performing within the national standard. At this time, we do not believe we need to
address these measures specifically.

43
Ca
lifo
rnia
- C
hild
an
d F
am
ily
Se
rvic
es R
evie
w
Child Welfare
Priority Outcome Measure or Systemic Factor: S1.1 No Recurrence of Maltreatment
National Standard: 94.6%
Current Performance: According to the Quarterly Data Report (Quarter 4, 2012), of the 126
children who had substantiated referrals, 108 had no recurrence of maltreatment. This is an
85.7% rate of no recurrence.
Target Improvement Goal: Marin County will improve its performance on this measure from
85.7% to 95%, resulting in 12 more children not experiencing a recurrence of maltreatment.
Priority Outcome Measure or Systemic Factor: S2 Recurrence of Maltreatment; Of all
children who were victims of a substantiated maltreatment allegation during a 12-month
reporting period, what percent were victims of another substantiated maltreatment
allegation within 12 months of their initial report?
National Standard: 9.1%
CSA Baseline Performance: According to the Quarterly Data Report (Quarter 3, 2012), Of the 242 children who were victims of a substantiated maltreatment allegation during a 12-month reporting period, 41 were victims of another substantiated maltreatment allegation within 12 months of their initial report. This is a 16.9% additional substantiation rate.
Current Performance: According to the Quarterly Data Report (Quarter 1, 2015), 13% of 185
children (=24 children) were victims of another substantiated allegation.
Target Improvement Goal: Marin County will improve its performance on this measure from
13% to 9.1%, resulting in 7 less children experiencing repeated victimization (=17 children).
Priority Outcome Measure or Systemic Factor: C1.4 Re-entry following Reunification
National Standard: 9.9%
Current Performance: According to the Quarterly Data Report (Quarter 4, 2012), of the 32
children who were discharged from foster care to reunification, 8 re-entered within 12
months from their earliest discharge. This is a 25.0% rate of re-entry within 12 months.
Target Improvement Goal: Marin County will improve performance on this measure from
25% to 10%, resulting in 3 less child reentering within 12 months.
Priority Outcome Measure or Systemic Factor: P4 Re-entry into foster care within 12
months; Of all children who enter foster care in a 12-month period who discharged within 12
months to reunification, living with a relative(s), or guardianship, what percent re-enter

44
Ca
lifo
rnia
- C
hild
an
d F
am
ily
Se
rvic
es R
evie
w
foster care within 12 months of their discharge?
National Standard: 8.3%
CSA Baseline Performance: According to the Quarterly Data Report (Quarter 3, 2012), of the 13 children who entered foster care in the 12-month period who discharged within 12 months to reunification, living with a relative(s), or guardianship, five re-entered foster care within 12 months of their discharge. This is a 38.5% reentry rate.
urrent Performance: According to the Quarterly Data Report (Quarter 1, 2015), 36.4% (8) of
22 children re-entered into foster care.
Target Improvement Goal: Marin County will improve performance on this measure from
36.4% to 8.3% resulting in 6 less children reentering within 12 months.
Priority Outcome Measure or Systemic Factor: 2B Timely Response (10 day response)
National Standard: N/A
State Goal: 90%
CSA Baseline Performance: According to the Quarterly Data Report (Quarter 3, 2012), 123 of 129 child abuse and neglect referrals were attempted or completed within the required 10-day response time. This is a 95.3% compliance rate.
Current Performance:
From: 4/1/2013 4/1/2014 4/1/2015
To: 6/30/2013 6/30/2014 6/30/2015
Timely resp. (10-day resp.
compliance) (%) 91.3 95.7 93.0
90.0 90.0 90.0
"10 days or less response"
cases (n) 104 93 71
Seen by social worker w/in 10
days (n) 95 89 66
Target Improvement Goal: Marin County will improve its performance on this measure by
maintaining a 90% or greater rate each month.

45
Ca
lifo
rnia
- C
hild
an
d F
am
ily
Se
rvic
es R
evie
w
5 – Year SIP Chart Child Welfare
Strategy 1: Strengthen
cohesiveness of child welfare
supervisory team.
CAPIT Applicable Outcome Measure(s) and/or Systemic
Factor(s):
S1.1-Recurrence of Maltreatment
C1.4-Re-entry following Reunification
2B- Timely Response (10 day response compliance)
S2 Recurrence of Maltreatment
P4 Re-entry to Foster Care in 12 months
CBCAP
PSSF
N/A
Action Steps: Timeframe: Person Responsible:
A. Bring together supervisory
and management team to
identify common vision and
goals. Utilize SIP to inform
development of strategic plan.
January 2014 - March 2014
December 2015
June 2016
Program Manager II
B. Utilize Leadership meetings as
an opportunity to promote
increased use of SOP tools and
consistent use of SDM tools as
part of data review, case
assessment, and supervision with
staff.
April 2014 and monthly
thereafter
Program Managers
C. Implement strategies
identified in the plan with
supervisors and staff.
June 2014
March 2016
Program Managers
D. Assess and Evaluate the
implementation strategies as part
of bi –monthly Leadership Team
meetings and track and monitor
the increased use of SDM and
SOP Tools
August 2014 and monthly
thereafter
Program Managers
E. Provide supervisor coaching
and training.
June 2014 and ongoing Training Supervisor, Bay Area
Academy, Consultant

46
Ca
lifo
rnia
- C
hild
an
d F
am
ily
Se
rvic
es R
evie
w
Strategy 2: Implement a system of case
review for all cases in accordance with the
Federal/State standards incorporating
continuous quality improvement (CQI)
and continue the implementation of the
Administrative Review process for all
cases preparing for reunification.
Implement a structured system of
management case review for all cases
where there is recurrence or reentry and
continue implementation of the
Administrative Review Process for all
cases preparing for reunification.
CAPIT Applicable Outcome Measure(s)
and/or Systemic Factor(s):
S1.1-Recurrence of Maltreatment
C1.4-Re-entry following Reunification
S2 Recurrence of Maltreatment
P4 Re-entry to Foster Care in 12
months
CBCAP
PSSF
N/A
Action Steps: Timeframe: Person Responsible:
A. Establish a Case Management Review
Team.
January 2014
April 2015
Program Manager
B. Develop case review policy and
protocol and review with staff.
January – February 2014
May 2015
Program Manager
C. Implement case review process. March 2014
June 2015
October 2015
Program manager and assigned
lead
D. Continue Administrative case reviews. January 2014-ongoing Lead worker and Program
Manager
E. Track outcomes of reunification cases
reviewed at the Administration Review to
see if process is reducing re-entry.
June 2014 March 2015
and quarterly there after
Lead worker and Program
Manager
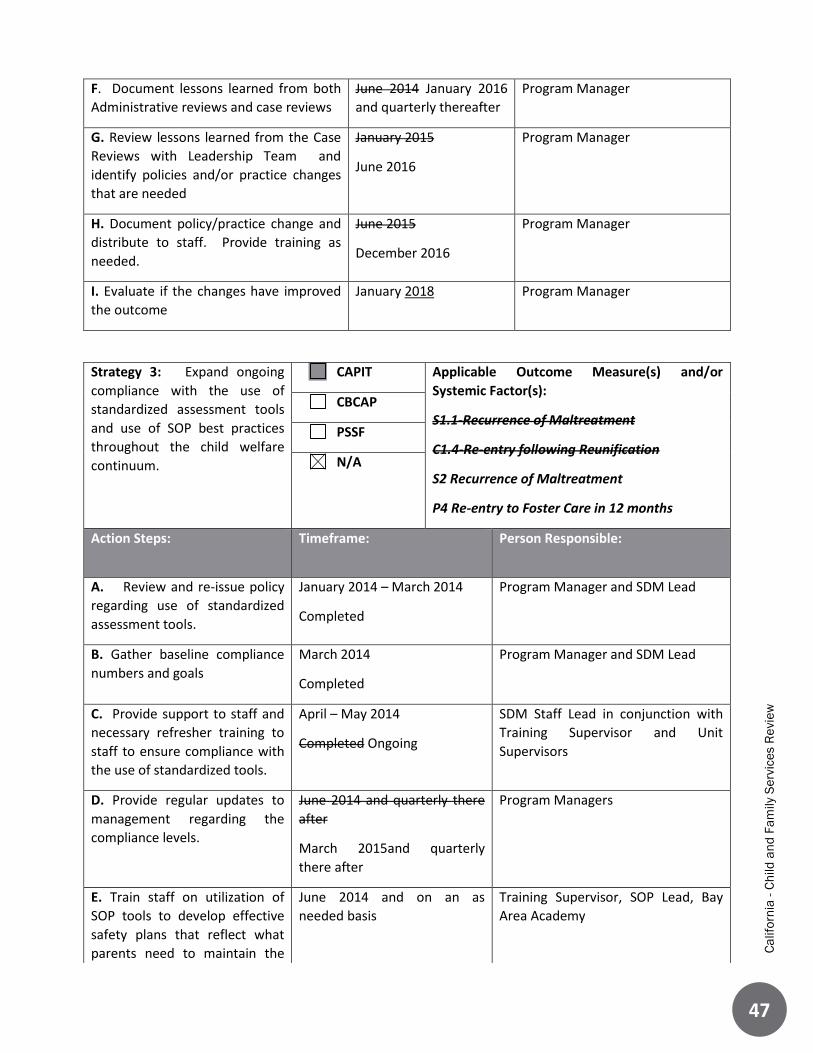
47
Ca
lifo
rnia
- C
hild
an
d F
am
ily
Se
rvic
es R
evie
w
F. Document lessons learned from both
Administrative reviews and case reviews
June 2014 January 2016
and quarterly thereafter
Program Manager
G. Review lessons learned from the Case
Reviews with Leadership Team and
identify policies and/or practice changes
that are needed
January 2015
June 2016
Program Manager
H. Document policy/practice change and
distribute to staff. Provide training as
needed.
June 2015
December 2016
Program Manager
I. Evaluate if the changes have improved
the outcome
January 2018 Program Manager
Strategy 3: Expand ongoing
compliance with the use of
standardized assessment tools
and use of SOP best practices
throughout the child welfare
continuum.
CAPIT Applicable Outcome Measure(s) and/or
Systemic Factor(s):
S1.1-Recurrence of Maltreatment
C1.4-Re-entry following Reunification
S2 Recurrence of Maltreatment
P4 Re-entry to Foster Care in 12 months
CBCAP
PSSF
N/A
Action Steps: Timeframe: Person Responsible:
A. Review and re-issue policy
regarding use of standardized
assessment tools.
January 2014 – March 2014
Completed
Program Manager and SDM Lead
B. Gather baseline compliance
numbers and goals
March 2014
Completed
Program Manager and SDM Lead
C. Provide support to staff and
necessary refresher training to
staff to ensure compliance with
the use of standardized tools.
April – May 2014
Completed Ongoing
SDM Staff Lead in conjunction with
Training Supervisor and Unit
Supervisors
D. Provide regular updates to
management regarding the
compliance levels.
June 2014 and quarterly there
after
March 2015and quarterly
there after
Program Managers
E. Train staff on utilization of
SOP tools to develop effective
safety plans that reflect what
parents need to maintain the
June 2014 and on an as
needed basis
Training Supervisor, SOP Lead, Bay
Area Academy

48
Ca
lifo
rnia
- C
hild
an
d F
am
ily
Se
rvic
es R
evie
w
safety of their children in their
homes.
F. Conduct random reviews to
determine that SOP language is
incorporated beginning at
intake and throughout the case
(in Case Plans, Court Reports,
and other CWS documents.)
June 2016 – December 2016 Training Supervisor, SOP Lead, Bay
Area Academy
G. Provide additional training to
staff on any gaps identified in
the Review.
February 2017 and ongoing Training Supervisor, SOP Lead, Bay
Area Academy

49
Ca
lifo
rnia
- C
hild
an
d F
am
ily
Se
rvic
es R
evie
w
Strategy 4: Assess existing ER/Court
structure and make recommendations
for changes to improve flow of ER
assignments.
CAPIT Applicable Outcome Measure(s) and/or
Systemic Factor(s):
2B Timely Response (10 day referral) CBCAP
PSSF
N/A
Action Steps: Timeframe: Person Responsible:
A. Assess existing ER/Court structure,
explore how other counties with similar
demographics are structured, and
identify recommendations for change.
Jan 2014 – September 2014
Completed
ER & Ongoing Supervisor
B. Once recommendations are made a
small scale pilot will occur using the
proposed new ER/court structure.
September 2014 – June 2015
Underway Completed
ER & Ongoing Supervisor
C. After the pilot reconvene work group
to make recommendations for
modification and expansion of the pilot
structure.
February 2015 - July 2015
June 2015 - December 2015
Completed
ER & Ongoing Supervisor
D. Implement large scale changes. January 2016 - June 2016 ER & Ongoing Supervisor
E. Assess functionality of new structure
and review and track impact on ER
compliance with 10 day referrals
June August 2015 and
ongoing
Supervisors & Managers
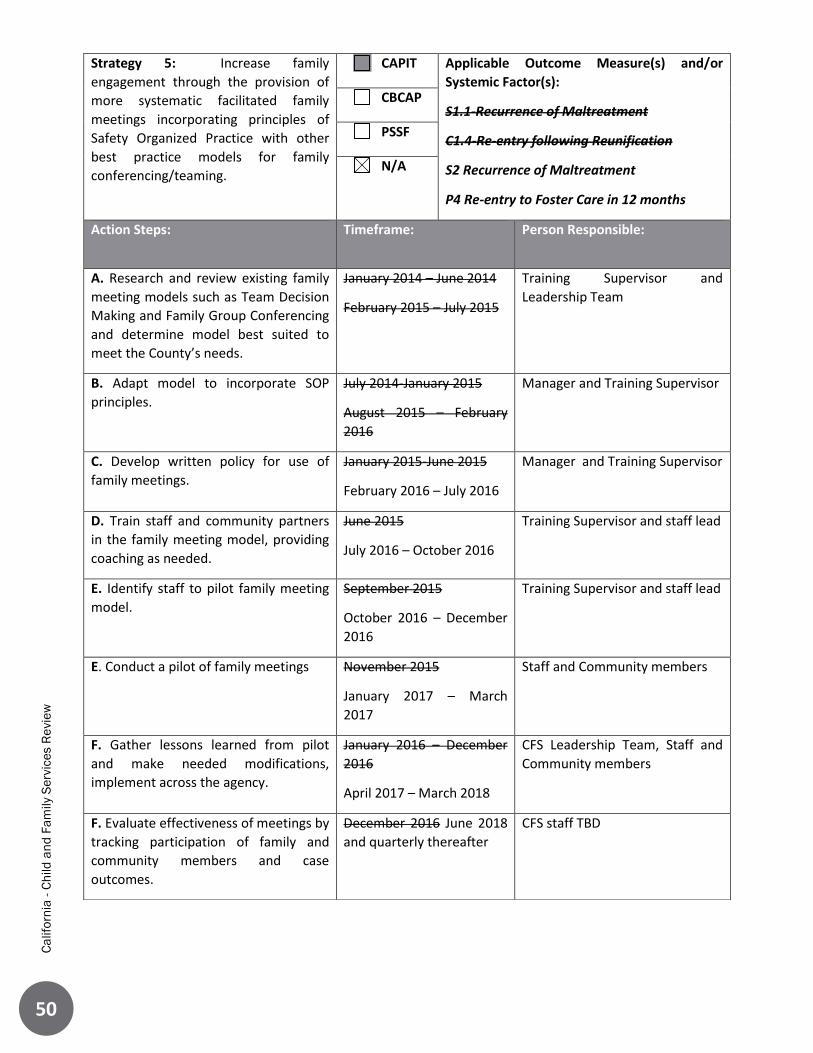
50
Ca
lifo
rnia
- C
hild
an
d F
am
ily
Se
rvic
es R
evie
w
Strategy 5: Increase family
engagement through the provision of
more systematic facilitated family
meetings incorporating principles of
Safety Organized Practice with other
best practice models for family
conferencing/teaming.
CAPIT Applicable Outcome Measure(s) and/or
Systemic Factor(s):
S1.1-Recurrence of Maltreatment
C1.4-Re-entry following Reunification
S2 Recurrence of Maltreatment
P4 Re-entry to Foster Care in 12 months
CBCAP
PSSF
N/A
Action Steps: Timeframe: Person Responsible:
A. Research and review existing family
meeting models such as Team Decision
Making and Family Group Conferencing
and determine model best suited to
meet the County’s needs.
January 2014 – June 2014
February 2015 – July 2015
Training Supervisor and
Leadership Team
B. Adapt model to incorporate SOP
principles.
July 2014-January 2015
August 2015 – February
2016
Manager and Training Supervisor
C. Develop written policy for use of
family meetings.
January 2015-June 2015
February 2016 – July 2016
Manager and Training Supervisor
D. Train staff and community partners
in the family meeting model, providing
coaching as needed.
June 2015
July 2016 – October 2016
Training Supervisor and staff lead
E. Identify staff to pilot family meeting
model.
September 2015
October 2016 – December
2016
Training Supervisor and staff lead
E. Conduct a pilot of family meetings November 2015
January 2017 – March
2017
Staff and Community members
F. Gather lessons learned from pilot
and make needed modifications,
implement across the agency.
January 2016 – December
2016
April 2017 – March 2018
CFS Leadership Team, Staff and
Community members
F. Evaluate effectiveness of meetings by
tracking participation of family and
community members and case
outcomes.
December 2016 June 2018
and quarterly thereafter
CFS staff TBD

51
Ca
lifo
rnia
- C
hild
an
d F
am
ily
Se
rvic
es R
evie
w
Strategy 6: Build community awareness
of child abuse and neglect through the
provision of local child welfare data and
mandated reporter training. Strengthen
collaboration with agencies across the
County who serve at risk families and
children, especially in the services areas
of domestic violence and substance
abuse treatment where there are
identified service gaps/challenges.
CAPIT Applicable Outcome Measure(s) and/or
Systemic Factor(s):
S1.1 No Recurrence of Maltreatment
C1.4-Re-entry following Reunification
S2 Recurrence of Maltreatment
P4 Re-entry to Foster Care in 12 months
CBCAP
PSSF
N/A
Action Steps: Timeframe: Person Responsible:
A. Identify and reach out to key child
and family serving agencies, including
Alcohol and Other Drugs and Domestic
Violence and initiate dialogue and
promote opportunities for increased
collaboration and coordination,
including participation in team meetings
and cross training.
February 2014 and ongoing
Completed and ongoing
Program Manager I & II
B. Establish regular collaborative
meetings to provide a venue for data
sharing, problem resolution, increased
engagement, coordination, and agency
cross training.
March 2014 - June 2014 monthly
June 2014 quarterly ongoing
Completed and ongoing
Program Managers,
Supervisors, PHNs
C. Evaluate whether action plan was
effective in increasing services and/or
collaboration with key partners and
resulted in improvement in outcomes.
January 2015 and quarterly
ongoing
Program Manager II

52
Ca
lifo
rnia
- C
hild
an
d F
am
ily
Se
rvic
es R
evie
w
Strategy 7: Review and evaluate
the Differential Response model
currently in practice to determine
effectiveness and make
modifications as determined
appropriate.
CAPIT Applicable Outcome Measure(s) and/or
Systemic Factor(s):
S1.1 No Recurrence of Maltreatment
S2 Recurrence of Maltreatment
CBCAP
PSSF
N/A
Action Steps: Timeframe: Person Responsible:
A. Analyze current Differential
Response model and its
effectiveness in preventing
recurrence of maltreatment.
June 2015 - December 2015
March 2016-December 2016
Program Manager and
Supervisor
B. Identify areas that require
modification and develop plan of
correction. Determine next
steps.
January 2016 - March 2016
January 2017-June 2017
Program Manager and Supervisor
C. Implement changes as
identified in B.
April 2016 - June 2016
July 2017-October 2017
Program Manager, Supervisor,
Staff
D. Evaluate the program by
reviewing its effectiveness in
preventing recurrence of
maltreatment
June 2017 - June 2018
November 2017-September 2018
Program Manager

53
Ca
lifo
rnia
- C
hild
an
d F
am
ily
Se
rvic
es R
evie
w
Strategy 8: Work in collaboration with
Mental Health partners to increase access
and linkage to children’s mental health
services through implementation of Katie A
required practices:
Timely screening and of all children with
open CFS cases (VFM,FM,RR)
Completion of mental health assessments
and connection to services
Connection to mental health services
CAPIT Applicable Outcome Measure(s) and/or
Systemic Factor(s):
C1.4 Re-entry following Reunification
P4 Re-entry to Foster Care in 12 months
CBCAP
PSSF
N/A
Action Steps: Timeframe: Person Responsible:
A. Develop collaborative forum with
mental health partners to increase access
and linkage to children’s mental health.
January 2014
Completed and
ongoing
Program Manager and Children’s
Mental Health
B. Implement collaborative forum and
utilize forum to develop protocols and
policies for staff in each agency, CFS and
Mental Health to implement Katie A.
required practices.
January 2014 -
June 2014
Partially
completed
Program Manager and Children Mental
Health
C. Cross train staff regarding policies and
protocols.
May 2014 -
December 2014
Completed and
ongoing
Program Manager and Children’s
Mental Health Staff, Training Supervisor
D. Implement policies and protocols that
serve children in need of mental health
services.
January 2015
Completed
Program Manager and Children’s
Mental Health
E. Through collaborative forum, monitor
process and modify as needed.
January - June
2015 and
ongoing
Program Manager, Children’s Mental
Health and collaborative forum partners
F. Track number of children served and
outcomes of children receiving required
mental health services.
January 2016
and yearly there
after
Program Manager

54
Ca
lifo
rnia
- C
hild
an
d F
am
ily
Se
rvic
es R
evie
w
5 – Year SIP Chart Probation
Priority Outcome Measure or Systemic Factor: C1.1 - Reunification within 12 months ) Exit
Cohort
Of all children discharged from foster care to reunification during the year who had been in
foster care for 8 days or longer, what percent were reunified in less than 12 months from the
date of the latest removal from the home?
National Standard: 75.2%
CSA Baseline Performance: According to the Quarterly Data Report (Quarter 3, 2012), of the 6
children who were discharged from foster care to reunification, 2 were reunified within 12
months from their latest removal. This is a 33.3% rate of reunification within 12 months.
Current Performance: 33.3% (CWS/CMS 2014 Quarter 1 Extract)
Target Improvement Goal: Marin County Juvenile Probation will improve performance on this
measure from 33.3% to 75.2%, resulting in more children reunifying.
Priority Outcome Measure or Systemic Factor
P1 Permanency in 12 months (entry into foster care) - Of all children who entered care in the
12-month period, what percent discharged to permanency within 12 months?
National Standard: 40.5%
CSA Baseline Performance: 33.3% (Quarter 3, 2012)
Current Performance: 0% (0 of 9 children) (Quarter 1 2015)
Target Improvement Goal: We will improve performance on this measure from 33.3% to 40.5%,
which had that occurred in this quarter, 4 children would have achieved permanency.

55
Ca
lifo
rnia
- C
hild
an
d F
am
ily
Se
rvic
es R
evie
w

56
Ca
lifo
rnia
- C
hild
an
d F
am
ily
Se
rvic
es R
evie
w
Strategy 9: There is an existing
parent support group that meets
monthly. This strategy is
designed to enhance the success
of this program.
CAPIT Applicable Outcome Measure(s) and/or
Systemic Factor(s):
C1.1 Reunification within 12 months
P1 Permanency in 12 months (entry into foster
care)
CBCAP
PSSF
N/A
Action Steps: Timeframe: Person Responsible:
A. Identify an organization to
assist in the assessment,
including recommendations for
modifications to the Parent
Support Group.
December 2013- January 2014
Completed
Juvenile Division Director
B. Organization to conduct
interviews with Probation
Officers, facilitators of the group,
and families to determine what is
working and what isn't.
January 2014 - March 2014
Completed
Juvenile Division Director
C. Develop a plan to modify the
parent support group based on
the feedback.
March 2014 - June2014
Completed
Juvenile Division Director
D. Develop a plan for engaging
foster youth and their families
through the use of a dedicated
case manager who would be
responsible for providing support
services to parents whose youth
are in placement.
January 2015 –March 2015 Juvenile Division Director
E. Implement the plan. In progress to be completed by
July 2015
Placement Supervisor
F. Conduct interviews with
Probation Officers, facilitators of
the group, and families to
determine if changes have been
successful.
September 2015 Juvenile Division Director
G. Make modifications as
necessary
March 2016 and ongoing Placement Supervisor

57
Ca
lifo
rnia
- C
hild
an
d F
am
ily
Se
rvic
es R
evie
w
Strategy 10: Explore and
implement strategies to engage
youth.
CAPIT Applicable Outcome Measure(s) and/or
Systemic Factor(s):
C1.1 Reunification within 12 months
P1 Permanency in 12 months (entry into
foster care)
CBCAP
PSSF
N/A
Action Steps: Timeframe: Person Responsible:
A. Visit programs such as
V.O.I.C.E.S and CHALK to identify
the program that could best
meet the needs of Marin County.
June 2014 - September 2014
Completed and determined that
neither program would be
practical in Marin County given
the few number of youth
interested in the services
Juvenile Division Director
B. Develop a plan for engaging a
foster youth(s) and their families
through the use of a dedicated
case manager who would be
responsible for: offer support
services to youth returning from
placement, whether they remain
on probation or not
January to March 2015 Juvenile Division Director
C. Implement the plan by
contracting with a provider to
deliver services described above.
July 2015 Juvenile Division Director
D. Evaluate the effectiveness of
the plan by interviews with staff
involved and youth interns.
March 2016 and ongoing Placement Supervisor