Embed Size (px)
Citation preview

Annual Statistical
Report
2007

HND = Households with no dependentsHWD = Households with dependents TCHC = Toronto Community Housing CoPNP = Private, non-profit housing provCo-op = Co-operative housing provider W/C = Wheelchair WSIB = Workplace Safety Insurance BoaTAWL = Toronto Applicant Waiting List SPHC = Special Priority Household CategDA = Households disadvantaged by th
Active status: When an applicant is on the chousing should it become available. Inactive status: Although the applicant maiapplicant will have to meet further eligibilitthis means Housing Connections has not haOverhoused: When tenants are living in a uConsumer/Survivor: One who uses or has uHouseholds disadvantaged by the chronologrequires one in seven vacancies be filled by This includes youth, homeless, and separateSeparated family: A family with a child undYouth: Applicants aged 16 and 17. Senior: Applicants aged 59 or older. Some phoused. Special Priority Household Category: The Shousing applicants whose personal safety, oindividual with whom they live. This speciapermanently from the abuser. Victims of violence: Applicants who may nhave been a victim of violence, would get thTerminally ill: In the City of Toronto there ioption to consider terminal illness as prioritCategory status. Following consultations wiConnections’ Board of Directors restricted tProvider: Social housing providers may be pSupportive housing: Housing which offers asuch as physical/accessibility needs, life skilRent supplement: A subsidy provided by Hoto pays the difference between geared‐to‐incoprivate‐market unit.
LEGEND Bach = Bachelor unit 1B = 1 bedroom unit rporation 2B = 2 bedroom unit ider 3B = 3 bedroom unit 4B = 4 bedroom unit 5B = 5 bedroom unit rd SHRA = Social Housing Reform Act RGI = Rent-geared-to-income ory e chronological system
DEFINITIONS hronological waiting list and is eligible to be offered
ntains his/her spot on the chronological waiting list, the y requirements before a provider can offer housing; usually, d contact with a client for more than 12 months. nit that exceeds their occupancy eligibility. sed the resources offered by the mental health system. ical system: In Toronto, there is a Local Access Priority that a household disadvantaged by the chronological system. d families. er the care of Children’s Aid Services.
roviders have mandates that require seniors to be 65 to be
ocial Housing Reform Act gives priority access to social r whose family’s safety, is at risk because of abuse by an l priority is to enable the applicant’s household to separate
ot qualify for the Special Priority Household Category, but is designation. s an ‘Optional Local Access Priority’, giving providers the y following households with Special Priority Household th medical professionals and community agencies, Housing his priority to those with less than two years to live. rivate non‐profits, co‐operatives or TCHC. range of support services for tenants with special needs, ls development, counselling, or other supports. using Connections for rent‐geared‐to‐income households which me rent paid by the tenant and the regular market rent in a

Housing Connections
Total number of people on Housing Connections centralized waiting list for social housing is 128,666 as of December 31, 2007. The rest of the numbers in this Statistical Report refer to household applications that may have several people on their application.
2006 2007 Increase/Decrease %
New & reactivated applications 22,230 22,767 +537 2
Applications housed 5,160 4,336 -824 16
Applications inactivated 9,431 8,489 -942 10
Applications cancelled 7,407 8,009 +602 8
Inactive waiting list 18,759 16,708 -2,051 11
Active waiting list 48,601 49,478 +877 2
Total waiting list as at December 31st 67,083 66,186 -897 1
SUMMARY OF ACTIVITIES
The total includes 3,123 clients currently living in subsidized accommodation. There are several situations why these households would be on the centralized waiting list:
• They have applied to live with another provider, • They are overhoused with their current landlord and are seeking smaller accommodation, or • They are currently living within the former MTHC portfolio of TCHC and applied for a
discretionary transfer, i.e., non priority. Prior to 2001, MTHC and THC administered the subsidized housing portfolio and waiting list in Toronto. These were integrated to form the current TCHC, which then created Housing Connections to maintain the waiting list.
Annual Report 2007 Page 1 of 13

Housing Connections
FIVE YEAR WAITING LIST TOTALS
13,802
22,58929,936
66,327
15,97525,961
32,032
73,697
14,79323,499
25,499
63,791
15,50825,121
25,550
66,556
16,10426,303
24,673
67,083
16,59426,707
22,885
66,186
0
20000
40000
60000
80000
2002 2003 2004 2005 2006 2007Senior Households no dependents Households with dependents Total
• This includes active and inactive waiting list totals. Active status means the applicant is on the chronological waiting list and is eligible to be offered housing should it become available. Inactive status means that although the applicant maintains his/her spot on the chronological waiting list, the applicant will have to meet further eligibility requirements before a provider can offer housing; usually, this means the applicant has not confirmed interest to remain on the list for at least 12 months.
Contact 2007
70%
6%
11%3%
2%6%
2%
Post
Fax
Drop Box
App Mail Box
Res. Ctr - In Person
Call Centre
Contact Methods 2006 Totals
% 2007 Totals
%
Post 35,520 11 31,891 11
Fax 14,868 4 8,847 3
Drop Box 21,572 6 7,325 2
Email 6,981 2 19,208 6
App Mail Box 3,736 1 5,461 2
Resource Centre (In Person) 21,056 6 18,513 6
Resource Centre (Call Centre) 236,254 70 211,748 70
Total 339,987 100 302,993 100
SUMMARY OF CONTACTS
Annual Report 2007 Page 2 of 13

Housing Connections
COMPARISION OF APPLICANTS HOUSED USING TAWL
Increase/Decrease in Activities from 2006 - 2007 by Provider Type
0 1,000 2,000 3,000 4,000 5,000 6,000
Total
Rent Supplement
PNP/Co-op
TCHC
2007
2006
Provider 2006 2007 Increase/Decrease
TCHC 3,909 3,437 -472
PNP/Co-op 773 741 -32
Rent Supplement 189 158 -31
Total *4,871 *4,336 -535
*This figure does not include applicants housed directly by provider or applicants who didn't follow through on a signed lease offer.
Annual Report 2007 Page 3 of 13

Housing Connections
SUMMARY OF THE ACTIVE WAITING LIST BY UNIT TYPE
181,592
29,679
10,621
6,415
1,028 122
0
4000
8000
12000
16000
20000
24000
28000
Unit Type Request Totals
Room
Bachelor
One bedroom
Two bedroom
Three bedroom
Four bedroom
Five bedroom
Unit Type Households no Dependents
Households with Dependents
Senior Total
Room 17 0 1 18
Bachelor 1,017 17 558 1,592
One bedroom 16,140 1,064 12,475 29,679
Two bedroom 1,769 8,488 364 10,621
Three bedroom 441 5,907 67 6,415
Four bedroom 55 958 15 1,028
Five bedroom+ 8 110 4 122
Total 19,441 16,540 13,479 49,460
• Unit type is from the largest types selected by the applicant, which means that a household could be on a waiting list for a bachelor and a one bedroom but only counted above as waiting for a one bedroom unit.
Annual Report 2007 Page 4 of 13

Housing Connections
HOUSEHOLDS WITH PRIORITY ON THE ACTIVE WAITING LIST
255
149
18
466
105
6
76107
10
050
100150200250300350400450500
Households nodependents
Households withdependents
Seniors
Households with Priority by Household Type
SPHC
Terminally ill
Overhoused tenant
Type of Priority Households no Dependents
Households with Dependents
Senior Total
SPHC 255 466 76 797
Terminally ill 149 105 107 361
Overhoused tenant 18 6 10 34
Total 422 577 193 1,192
• Under the SHRA, victims of family violence may be granted the Special Priority Household Category status (SPHC). Each provider is mandated to first offer available units to households with this status who have selected their buildings.
• In June 2002, City of Toronto Council approved the continuance of terminally ill as an ‘Optional Local Access Priority’, giving providers the option to consider ‘terminal’ as priority following households with Special Priority Household Category status. Following consultations with medical professionals and community agencies, Housing Connections’ Board of Directors restricted this priority to those with less than two years to live.
• Under the Local Access Priority rules, overhoused tenants are also considered a priority. Where a tenant has been in an overhoused situation for more than 12 months or the provider with whom the tenant resides does not have the unit size required in their portfolio, the tenant must be placed on the centralized waiting list with priority. Overhoused applicants are offered housing after those under the Special Priority Household Category and terminally ill applicants for each development.
Annual Report 2007 Page 5 of 13

Housing Connections
DISADVANTAGED HOUSEHOLDS ON THE ACTIVE WAITING LIST
3,141
2169
823
29 13
431
10
0
500
1,000
1,500
2,000
2,500
3,000
3,500
Households nodependents
Households withdependents
Seniors
Disadvantaged Households
Homeless
Separated families
Youth
Type of Disadvantaged Household
Households no Dependents
Households with Dependents
Senior Total
Homeless * 3,141 823 431 4,395
Separated families 21 29 1 51
Youth 69 13 0 82
Total 3,231 865 432 4,528
• This represents households who are disadvantaged at the time of application to the chronological
wait list. One in seven vacancies must be filled by households with these designations. *Homeless newcomers are included in this count.
Annual Report 2007 Page 6 of 13

Housing Connections
HOUSEHOLDS ON THE ACTIVE WAITING LIST WITH SPECIAL NEEDS
765
4
384
112
512
775
182
0
238
125
591
304
138
1
302
77136
141
0
100
200
300
400
500
600
700
800
Households nodependents
Households withdependents
Seniors
Households with Special Needs
Consumer/Survivor ofmental health services
Persons with developmentaldisabilities
Persons with disabilities
Persons requiringwheelchair access
Victims of violence*
Other special needs
Type of Special Need Households no Dependents
Households with Dependents
Senior Total
Consumer/Survivor of mental health services
765 182 138 1,085
Persons with developmental disabilities 4 0 1 5
Persons with disabilities 384 238 302 924
Persons requiring wheelchair access 112 125 77 314
Victims of violence* 512 591 136 1,239
Other special needs 775 304 141 1,220
Total 2,552 1,440 795 4,787
*This count includes households where the Special Priority Household Category (SPHC) has been assigned.
Annual Report 2007 Page 7 of 13

Housing Connections
HOUSEHOLDS ON THE ACTIVE WAITING LIST REQUIRING SUPPORTIVE HOUSING
188
10
9069 58
22 2810
103
263
24 51
0
50
100
150
200
250
300
Households nodependents
Households withdependents
Seniors
Households Requiring Supportive Housing
Attendant care
Frail senior
Head injury rehabilitation
Supportive housing
Type of Housing Households no Dependents
Households with Dependents
Senior Total
Attendant care 188 58 103 349
Frail senior 10 22 263 295
Head injury rehabilitation 90 28 24 142
Supportive housing 69 10 51 130
Total 357 118 441 916
INTERNAL REVIEW CASES
Category Number of Reviews
Decisions Upheld
Decisions Overturned
Deferred
Additional Bedroom 52 45 5 2
Arrears 5 2 0 3
Backdating 17 12 2 4
Rent Supplement 34 28 2 4
SPP 34 26 5 3
Status In Canada 6 4 1 1
Terminally Ill 66 64 2 0
Three Refusals 16 13 3 0
Total 230 194 20 16
Annual Report 2007 Page 8 of 13

Housing Connections
Annual Report 2007 Page 9 of 13
As per the SHRA, maintenance of waiting list records is conducted annually for each applicant. Record status may change as a result of this process. The following tables give a breakdown for the reasons applications were either inactivated or cancelled in 2005. An inactive application can be reinstated to its original date up to 24 months after it has been inactivated. Cancelled applicants must reapply. Applicants who are homeless and have their application inactivated are eligible for reactivation up to five years later, as per a 2002 Council request.
per the SHRA, maintenance of waiting list records is conducted annually for each applicant. Record status may change as a result of this process. The following tables give a breakdown for the reasons applications were either inactivated or cancelled in 2005. An inactive application can be reinstated to its original date up to 24 months after it has been inactivated. Cancelled applicants must reapply. Applicants who are homeless and have their application inactivated are eligible for reactivation up to five years later, as per a 2002 Council request.
Reasons for Inactivation
7.5%11.2%
81.3%
Documentation required
Homeless - unable to contact
No response/mail returned
Reasons for Inactivation * Total %
Documentation required 557 8
Homeless - unable to contact 838 11
No response/mail returned 6,056 81
*This does not include applications which were reactivated or cancelled in 2007. • 1,832 applications were reactivated and are counted in the applications received.
Reasons for Cancellation Totals % Applicant requested or deceased 734 4
Information incomplete 6,174 36
Housing Connections administrative – e.g. duplicate records 592 3
Other 1,415 8
Inactive 45 Days – moved to cancelled (three refusals, applicant not eligible)
279 2
Inactive 24 months - moved to cancelled (mail returned, no reply to correspondence, documents required)
7,985 47
Reasons for Cancellation
36%
3%
47%
2%
4%
8%
Applicant requested or deceased
Information incomplete
HC administrative
Other
Inactive 45 Days
Inactive 24 months
REASONS FOR REMOVAL FROM THE ACTIVE WAITING LIST

Housing Connections
ACTIVE HOUSEHOLDS ON THE WAITING LIST CURRENTLY RESIDING WITH A PROVIDER
Provider Provider of Choice
Subsidy Market Total
HND HWD SENIOR Total HND HWD SENIOR Total
TCHC TCHC 834 984 464 2,282 380 343 195 918 3,200
Other 71 83 89 243 19 10 10 39 282
Total 905 1,067 553 2,525 399 353 205 957 3,482
PNP PNP 130 74 88 292 157 120 252 529 821
Other 21 14 15 50 22 8 11 41 91
Total 151 88 103 342 179 128 263 570 912
Co-op Co-op 84 87 35 206 143 153 68 364 570
Other 17 16 17 50 6 7 15 28 78
Total 101 103 52 256 149 160 83 392 648
Total 1,157 1,258 708 3,123 727 641 551 1,919 5.042
Annual Report 2007 Page 10 of 13
Housing Connections
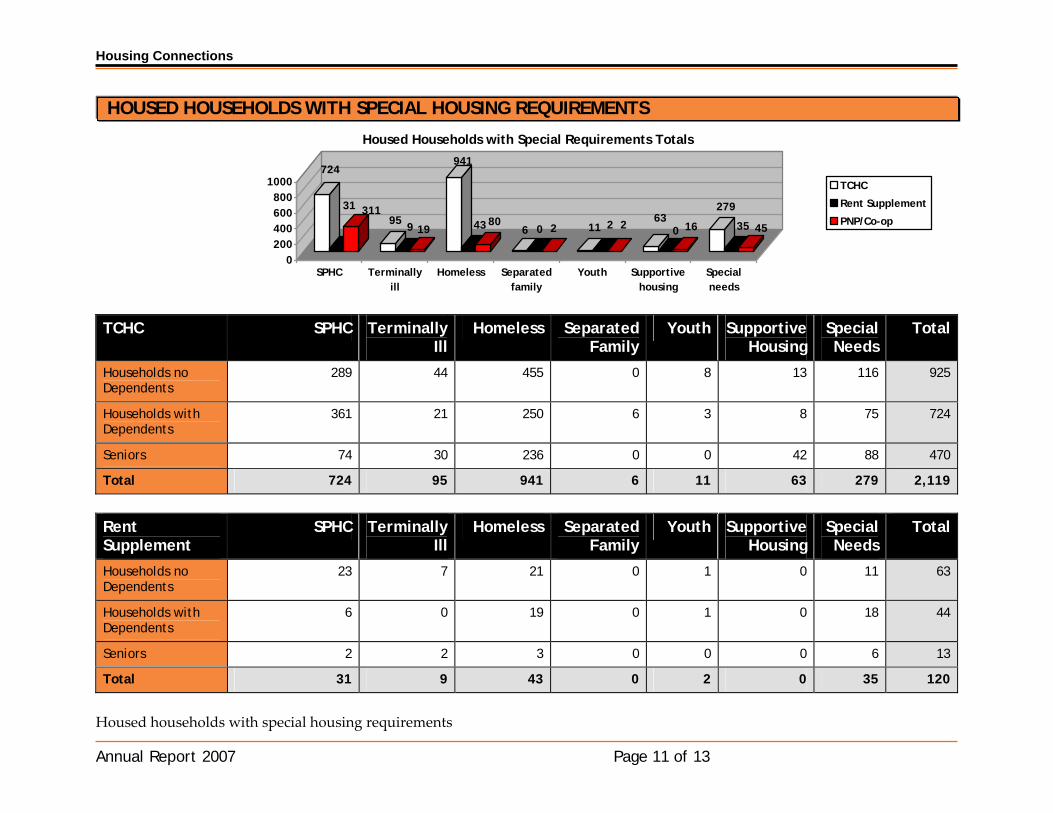
HOUSED HOUSEHOLDS WITH SPECIAL HOUSING REQUIREMENTS
724
31 31195 9 19
941
43 806 0 2 11 2 2 63
0 16
279
35 45
0200400600800
1000
SPHC Terminallyill
Homeless Separatedfamily
Youth Supportivehousing
Specialneeds
Housed Households with Special Requirements Totals
TCHC
Rent Supplement
PNP/Co-op
TCHC SPHC Terminally Ill
Homeless Separated Family
Youth Supportive Housing
Special Needs
Total
Households no Dependents
289 44 455 0 8 13 116 925
Households with Dependents
361 21 250 6 3 8 75 724
Seniors 74 30 236 0 0 42 88 470
Total 724 95 941 6 11 63 279 2,119
Rent Supplement
SPHC Terminally Ill
Homeless Separated Family
Youth Supportive Housing
Special Needs
Total
Households no Dependents
23 7 21 0 1 0 11 63
Households with Dependents
6 0 19 0 1 0 18 44
Seniors 2 2 3 0 0 0 6 13
Total 31 9 43 0 2 0 35 120
Housed households with special housing requirements
Annual Report 2007 Page 11 of 13

Housing Co
Annual Report 2007
nnections
Page 12 of 13
….cont’d
PNP/Co-op SPHC Terminally Ill
Homeless Separated Family
Youth Supportive Housing
Special Needs
Total
Households no Dependents
93 5 29 0 2 5 18 152
Households with Dependents
181 5 30 2 0 2 19 239
Seniors 37 9 21 0 0 9 8 84
Total 311 19 80 2 2 16 45 475
Grand total 1,066 123 1,064 8 15 79 359 2,714
• Applicants with SPHC status who are living in shelters are represented under the SPHC category, not the Homeless category.

Housing Connections
HOUSED TOTAL - % BY CATEGORY
TCHC Category Number of Households Housed Percentage Special Priority Housing Category 724 21 Terminally Ill 95 3 Overhoused 0 0 Disadvantaged 958 28 Supportive Housing 63 2 Special Needs 279 8 Regular Chronological Waiting List 1,318 38 Total 3,437 100
Rent Supplement Category Number of Households Housed Percentage Special Priority Housing Category 31 20
Terminally Ill 9 6
Overhoused 0 0
Disadvantaged 45 28
Supportive Housing 0 0
Special Needs 35 22
Regular Chronological Waiting List 38 24
Total 158 100
PNP/Co‐op Category Number of Households Housed Percentage Special Priority Housing Category 311 42
Terminally Ill 19 3
Overhoused 1 0
Disadvantaged 84 11
Supportive Housing 16 2
Special Needs 45 6
Regular Chronological Waiting List 265 36
Total 741 100
Annual Report 2007 Page 13 of 13