Embed Size (px)
Citation preview

Annual Status Report
on
EFFECTS OF GLOBALLY TRANSPORTED AFRICAN DUST TO CARIBBEAN MARINE ECOSYSTEMS
PRINCIPAL INVESTIGATORS Marion Nipper, Principal Investigator John W. Tunnell Jr, Co-Principal Investigator Texas A&M University-Corpus Christi, Center for Coastal Studies 6300 Ocean Drive, NRC Suite 3200, Unit 5866, Corpus Christi, TX, 78412-5866 Telephone: (361) 825-3045; email: [email protected] R. Scott Carr, Co- Principal Investigator US Geological Survey, Biological Resources Discipline Columbia Environmental Research Center, Marine Ecotoxicology Research Station Corpus Christi, TX Virginia (Ginger) H. Garrison, Co- Principal Investigator Dale Griffin, Co-Principal Investigator US Geological Survey, Biological Resources Discipline Center for Coastal and Watershed Studies, St. Petersburg, FL Garriet Smith, Co-Principal Investigator Department of Biology and Geology, University of South Carolina at Aiken, Aiken, SC
submitted to
National Oceanic and Atmospheric Administration National Undersea Research Program Grant No. CMRC-03-NRNN-01-04A
Center for Coastal Studies Report No. TAMU-CC-0501-CCS
March 30, 2005
CMRC-03-NRNN-01-04A Effects of African Dust to Caribbean Marine Ecosystems
Nipper et al., 2005 2
ACKNOWLEDGEMENTS This study was supported in part by a grant from NOAA’s National Underwater Research Program. Chemical analyses reported herein were performed by Paul J. Lamothe, Research Chemist with the U.S. Geological Survey, Denver, CO, for the USGS Global Dust Project. This study would not have been possible without the participation of numerous individuals. S. Caseau and C. Stengel (Virgin Islands National Park, St. John, US Virgin Islands), and H. Tonnemacher and M. Peterson (St. Croix, USVI) were instrumental for the sampling of the African dust used in toxicity testing and chemical and microbiological analyses. St. John sampling was conducted at Virgin Islands National Park under Research Permit #VIIS-2004-SCI-0010. We deeply appreciate Mr. Dan Brown’s permission for us to sample from his property at St. Croix. We are indebted to the expert technical assistance of Jim Biedenbach and Anne Evans, who helped preparing dust elutriates and conducting toxicity tests. John Wood prepared the site map. A starter culture of the copepod used in toxicity tests, Schizopera knabeni, was kindly donated by Dr. Gui Lotufo, with US Army Engineering Research & Development Center (ERDC). DISCLAIMER This report was prepared by Marion Nipper pursuant to subcontract CMRC-03-NRNN-01-04A from the Perry Institute for Marine Science, Caribbean Marine Research Center, through support provided by the National Oceanic and Atmospheric Administration, US Department of Commerce Award No. NA06RU0228 and No. NA16RU1496. The statements, findings, conclusions and recommendations are those of the authors and do not necessarily reflect the view of U.S. Department of Commerce, National Oceanic and Atmospheric Administration or The Perry Institute for Marine Science/Caribbean Marine Research Center.
CMRC-03-NRNN-01-04A Effects of African Dust to Caribbean Marine Ecosystems
Nipper et al., 2005 3
TABLE OF CONTENTS Page EXECUTIVE SUMMARY 5 INTRODUCTION.......................................................................................................................... 7 OBJECTIVES ................................................................................................................................ 9 METHODS .................................................................................................................................... 9
Dust Sampling and Processing ................................................................................................ 9 Toxicity Tests ......................................................................................................................... 12 Chemical Analyses ................................................................................................................. 14 Microbial Analyses ................................................................................................................ 14
RESULTS .................................................................................................................................... 14 Toxicity Tests and Chemistry ................................................................................................. 14 Microbial Analyses ................................................................................................................ 16
FUTURE PLANS ........................................................................................................................ 16 ADDITIONAL PERSONNEL..................................................................................................... 17 GPS COORDINATES OF RESEARCH SITES ......................................................................... 17 PAPERS PRESENTED BASED ON 2004 WORK.................................................................... 17 MANUSCRIPTS AND PUBLICATIONS .................................................................................. 17 REFERENCES ............................................................................................................................ 17 FIGURES
Figure 1. Sea WiFs satellite images of (A) African dust event in February 2000 and (B) dust extending into the Caribbean in May, 1999 .............................................. 7
Figure 2. US Virgin Island on a clear day (left) and during and African dust event (right) .... 7 Figure 3. Map of the US Virgin Islands showing sampling sites at St. John and St.
Croix...................................................................................................................... 10 Figure 4. Earthprobe TOMS Aerosol index showing dust crossing from north Africa to the
Caribbean on July 1st (left) and 2nd (right), 2004 ................................................ 11 Figure 5. Earthprobe TOMS Aerosol index showing dust crossing from north Africa to the
Caribbean on August 20 (left) and 21 (right), 2004 .............................................. 11 Figure 6. Dust sampling setup for QFF filters: filter with dust in inset ................................. 12 Figure 7. Dust Sampling setup for microbial filter with fungal and bacterial growth in
inset ....................................................................................................................... 12 TABLES Table 1. Results of sea urchin, Arbacia punctulata, fertilization tests with African
dust elutriates......................................................................................................... 20 Table 2. Results of sea urchin, Arbacia punctulata, embryological development tests
with African dust elutriates ................................................................................... 21 Table 3. Results of copepod, Schizopera knabeni, adult female survival endpoint
with African dust elutriates ................................................................................... 21 Table 4. Results of copepod, Schizopera knabeni, nauplii hatching success and
survival endpoint with African dust elutriates....................................................... 22 Table 5. Results of polychaete, Dinophilus gyrociliatus, female survival endpoint
CMRC-03-NRNN-01-04A Effects of African Dust to Caribbean Marine Ecosystems
Nipper et al., 2005 4
with African dust elutriates ................................................................................... 22 Table 6. Results of polychaete, Dinophilus gyrociliatus, reproductive endpoint with
African dust elutriates............................................................................................ 23 Table 7. Results of TIE procedures with African dust elutriates using the sea urchin,
Arbacia punctulata, fertilization test..................................................................... 24 Table 8. Result of reference toxicant test with SDS performed concurrently to the
sea urchin fertilization test with all seven dust elutriates and respective controls .................................................................................................................. 25
Table 9. Result of reference toxicant test with SDS performed concurrently to the sea urchin fertilization test with TIE treatments.................................................... 25
Table 10. Result of reference toxicant test with SDS performed concurrently to the sea urchin embryological development test with all seven dust elutriates and respective controls .......................................................................................... 25
Table 11. Result of reference toxicant test with SDS performed concurrently to the copepod test with elutriates from four selected dust samples and respective controls: survival endpoint .................................................................................... 26
Table 12. Result of reference toxicant test with SDS performed concurrently to the copepod test with elutriates from four selected dust samples and respective controls: hatching success endpoint ...................................................................... 26
Table 13. Result of reference toxicant test with SDS performed concurrently to the polychaete test with elutriates from four selected dust samples and respective controls (100% elutriate) ...................................................................... 26
Table 14. Result of reference toxicant test with SDS performed concurrently to the polychaete test with elutriates from four selected dust samples and respective controls (25 and 50% elutriate dilutions) ............................................. 27
Table 15. Water quality data of elutriates from all African dust samples and respective controls used in sea urchin fertilization and embryological development tests........................................................................................................................ 27
Table 16. Water quality data at termination of African dust elutriate toxicity tests with D. gyrociliatus. Each data point represents the mean of all test replicates .......... 28
Table 17. Water quality data of the baseline samples used in the TIE study with the sea urchin fertilization test .................................................................................... 28
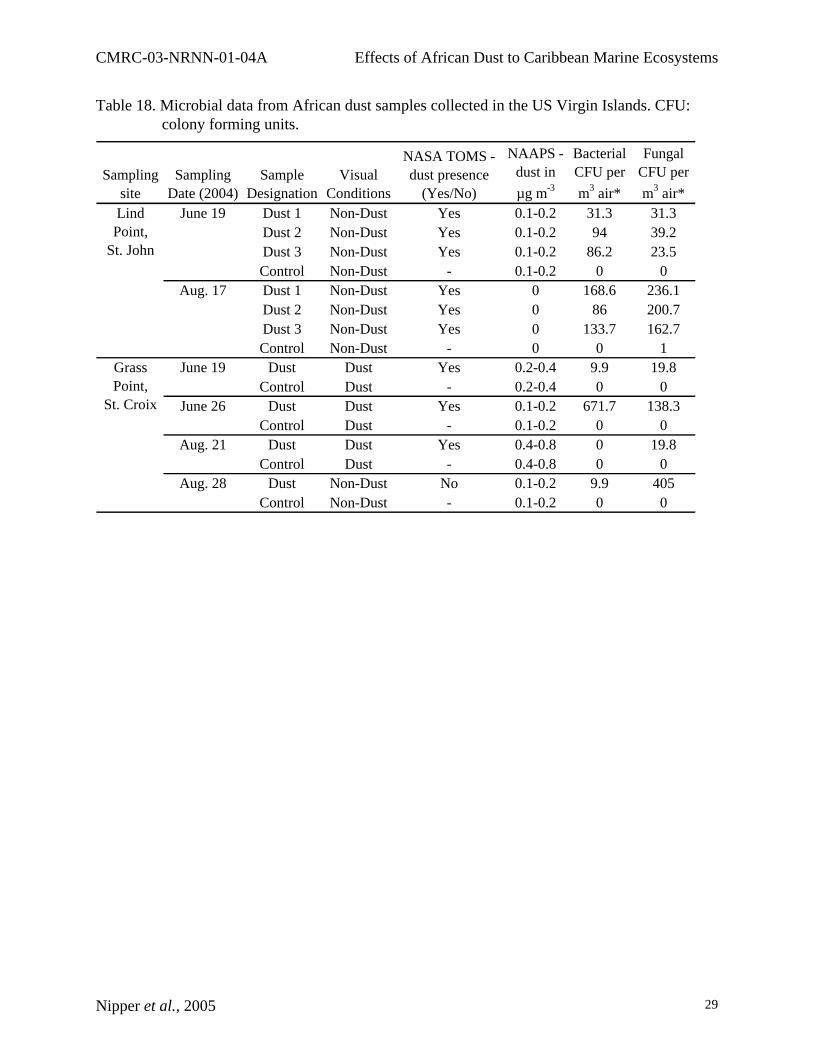
Table 18. Microbial data from African dust samples collected in the US Virgin Islands. CFU: colony forming units ...................................................................... 29
CMRC-03-NRNN-01-04A Effects of African Dust to Caribbean Marine Ecosystems
Nipper et al., 2005 5
EXECUTIVE SUMMARY
Millions of tons of dust are transported annually from the African Sahara to the Americas via the Saharan Air Layer. Although dust events have occurred for millennia, the mass of dust transported may be an indicator of desertification of the Sahel and linked with both changing land use practices and a drier climate. The production, use and release of man-made organic chemicals into the environment is also a relatively recent phenomenon, leading to the sorption of contaminants to the small, dry soil particles that can be advected into the atmosphere and transported. Microbial pathogens can also be associated to African dust. It is hypothesized that these chemical contaminants and microbes may adversely affect the health and function of marine and terrestrial ecosystems on which they are deposited. Dust may be linked with coral reef decline in a number of ways: 1) by widespread geographical distribution of microbial pathogens to the reefs; 2) by deposition of limiting micronutrients such as iron, which could spike pathogen reservoir populations, triggering the disease state; and 3) by influx of chemical contaminants that may weaken the natural immunocompetency of coral reef organisms, adversely affect reproduction or be directly toxic during and after dust events.
The current project has the objective of further testing the hypothesis that contaminants and microbial pathogens are transported by African dust and that they are harmful to marine organisms. Dust samples were collected during dust events and tested for toxicity using a variety of sensitive assays. Microbial and chemical analyses were also performed with the dust samples.
Two sites for African dust sampling were selected in the US Virgin Islands, one in St. John (Lind Point, 18.2°N, 64.8°W) and one in St. Croix (Grass Point, 17.41°N, 64.5°W). Samples were collected during seven dust episodes between June and August 2004, with a “non-dust” sample collected in St. John in December 2004, as a local control. Seawater elutriates of all samples were analyzed for toxicity using sea urchin, Arbacia punctulata, early life stages. Microbial analyses were performed on dust samples collected during some of the same events used for toxicity testing and some different events. Samples used in toxicity tests were also analyzed for a suite of metals under a separate USGS contract. Organic contaminants are also under analysis in a collaborative USGS study, but data are not available at this stage.
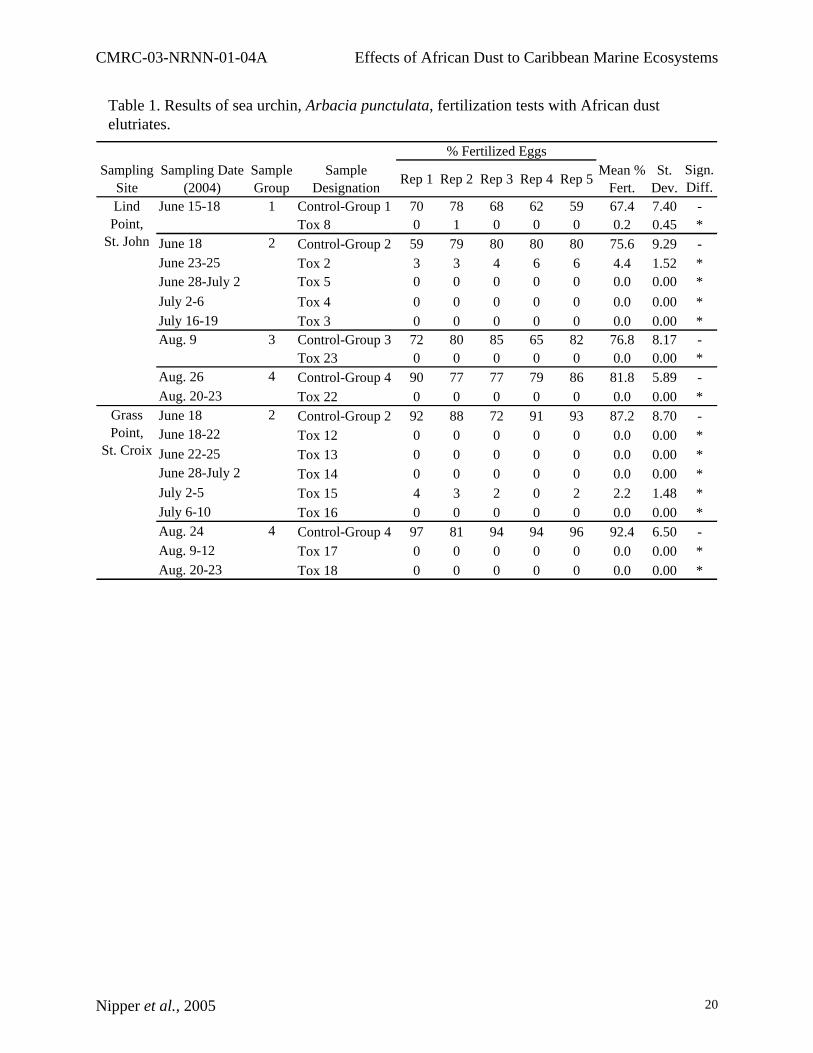
Elutriates prepared with the seven dust samples collected at each site were highly toxic to sea urchin fertilization success, with the mean fertilization rate ranging from 0 to 4.4%, whereas control elutriates prepared with blank filters exhibited fertilization rates between 67.4 and 92.4%. Mean normal embryological development in the dust elutriates ranged from 0 to 87.6%, with control development between 84.4 and 93%.
Two of the most toxic samples from each sampling site, which caused 100% inhibition of sea urchin fertilization and embryological development, and respective controls were selected for performance of additional toxicity tests with the copepod, Schizopera knabeni and the polychaete, Dinophilus gyrociliatus, and for toxicity identification evaluation (TIE) procedures. Survival of copepod ovigerous females was not significantly affected, but nauplii hatching and survival was strongly impaired. One hundred percent mortality was exhibited in the polychaete test. Dilution of the two samples from St. Croix to 25% resulted in polychaete survival at control levels, while egg production was still somewhat inhibited.
TIE procedures with the sea urchin fertilization test indicated that metals were responsible for the measured effects. Chemical analyses of the dust indicated elevated levels of several metals and metalloids relative to average crustal values, including copper, arsenic, molybdenum,
CMRC-03-NRNN-01-04A Effects of African Dust to Caribbean Marine Ecosystems
Nipper et al., 2005 6
silver, antimony, and barium. Copper levels were particularly high, with concentrations ranging from 4.9 mg/g to 11.2 mg/g. Copper concentrations measured in elutriates from such samples were an order of magnitude above toxic levels for most marine species, including the reported fertilization EC50 for A. punctulata. Therefore, the data suggests that copper was responsible for the toxicity observed in the analyzed dust samples, although we cannot state that the total copper measured in the samples was bioavailable. The sources of such elevated levels of copper are currently under investigation.
Microbial analyses of African dust samples collected in 2004 in the VI resulted in the isolation of a total of 174 bacterial colony forming units (CFU) and 162 fungal CFU (69.8%). Aspergillus sydowii, a known pathogen of gorgonians, was identified in some of these African dust samples. The data indicated not only that bacteria and fungi can, indeed, be transported alive to the Caribbean by African dust, but also that coral pathogens are present in the dust.
In the second year of this project we expect to collect a variety of seawater samples during a dust event, including sea surface microlayer (SSML), subsurface seawater, water from coral interstices, and sediment pore water, and perform toxicity tests in order to assess the actual loading and potential effects of the dust under field conditions. Analyses of dust elutriates, as presented in this report, will also be performed with samples from at least 2005 dust events, to confirm the data obtained so far, assess temporal variability of African dust quality, and pursue the identification of the source of elevated metals, particularly copper.
CMRC-03-NRNN-01-04A Effects of African Dust to Caribbean Marine Ecosystems
Nipper et al., 2005 7
INTRODUCTION Millions of tons of dust are transported annually from the African Sahara to the Americas
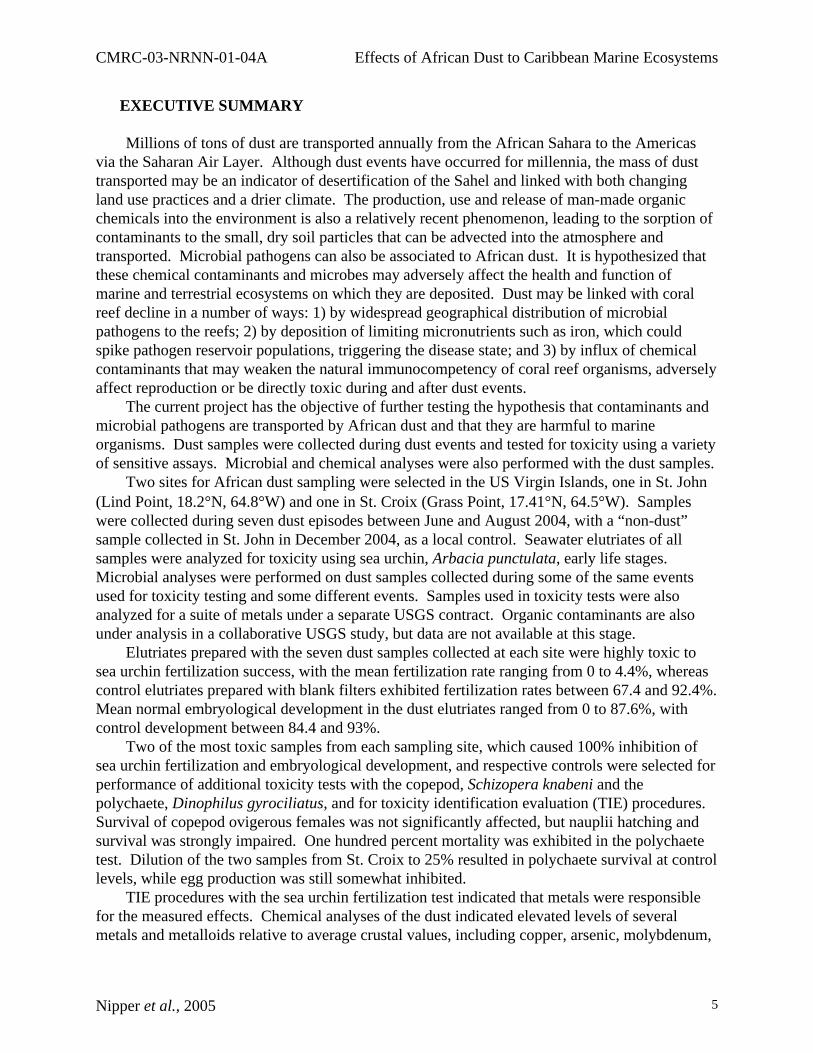
via the Saharan Air Layer (Figs. 1 and 2). Transiting the tropical north Atlantic, Charles Darwin (1845) described the conditions during an African dust event and the coating of dust on the HMS Beagle. Over a hundred years later, Delaney et al. (1967) and Prospero (1968) were the first to directly measure soil dust particles in the tropical North Atlantic atmosphere and to hypothesize that the trade winds transport dust from the Sahara to Barbados. Confirmation of the hypothesis came from satellite imagery and measurement of dust flux at Caribbean islands, the Bahamas, Miami (Florida) (e.g., Prospero, 1968, 1981; Prospero and Carlson, 1972; Savoie and Prospero, 1977; Prospero and Nees, 1986; Talbot et al., 1986) and at several National Parks in southeastern North America (Perry et al., 1997). Since the late 1960s, geologists and atmospheric chemists and physicists have studied the mineralogy, elemental composition, geologic processes, transport, deposition, optical properties, atmospheric chemistry, and particle size distribution of globally transported dust and the linkages with global climate. Figure 1. Sea WiFs satellite images of (A) African dust event in February 2000 and (B) dust
extending into the Caribbean in May, 1999. (Source: http://coastal.er.usgs.gov/african_dust/)
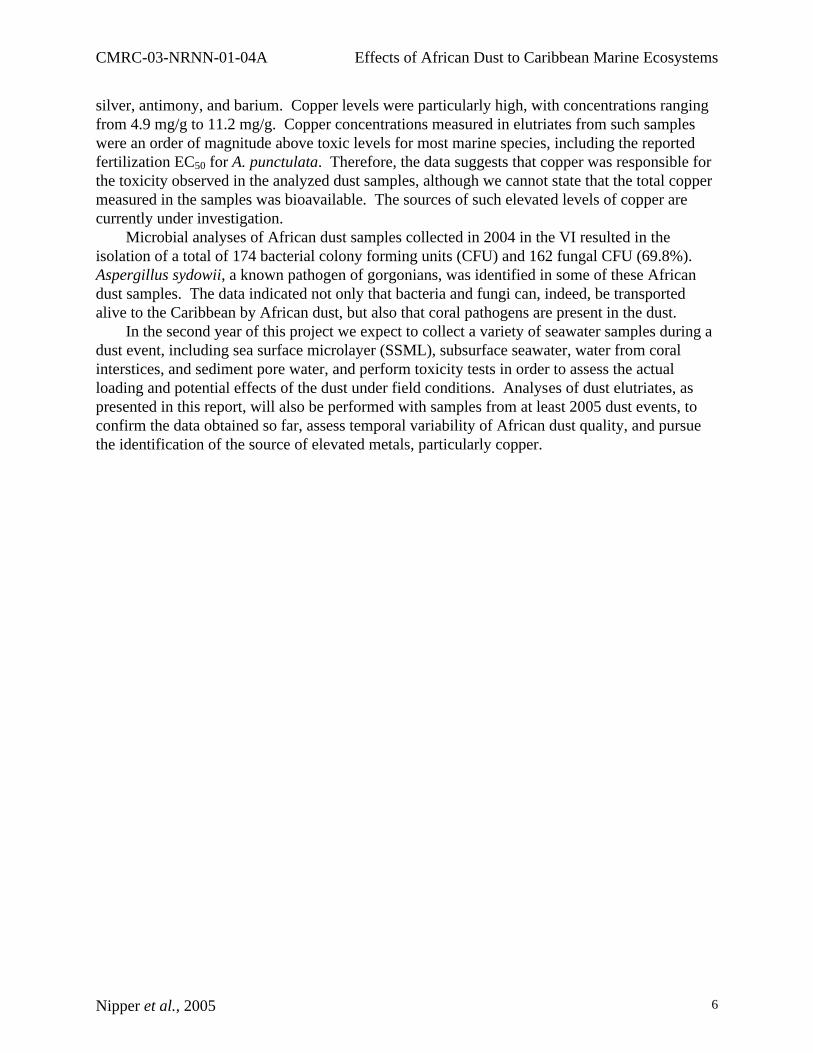
Figure 2. US Virgin Islands on a clear day (left) and during an African dust event (right).
A B
CMRC-03-NRNN-01-04A Effects of African Dust to Caribbean Marine Ecosystems
Nipper et al., 2005 8
Although dust events have occurred for millennia, the mass of dust transported may be an indicator of desertification of the Sahel (Prospero and Nees, 1977, 1986; Swap et al., 1996) and linked with both changing land use practices and a drier climate (e.g., Nickling and Gillies, 1993; Tegen and Fung, 1994, 1995; Tegen et al., 1996). Dust clouds may serve not only as a periodic source of nutrients for terrestrial plants and primary producers in nutrient depleted oceanic waters, but also as a medium for the global transport of microorganisms and chemical contaminants. The production, use and release of man-made organic chemicals into the environment is a relatively recent phenomenon. In West Africa, all forms of garbage are burned for fuel and to fertilize agricultural plots. Prior to the late 1980s, garbage consisted primarily of animal and plant waste, but its composition has fundamentally changed. Today, plastic bags, a variety of plastic products, tires and other anthropogenic refuse are routinely burned. Combustion of man-made materials is known to release hazardous contaminants. For example, burning of municipal or household waste containing various chlorinated materials, like polyvinyl chloride plastics, is a major source of polychlorinated dibenzo-p-dioxin and furan (PCDD/F) emissions to the atmosphere (Lemieux et al., 2000). These combustion practices also concentrate heavy metals. Organochlorine pesticides (e.g., DDT) are currently used in Africa against locust plagues, and newer generation pesticides (e.g., synthetic pyrethroids) are being increasingly applied in dust source regions (Raymond Smith, Ecole Americaine, Republic of Mali, pers. comm.). Many of these pesticides are known to volatilize or sorb to small clay particles, which can be transported over long distances. Antibiotics and pharmaceuticals are widely used to treat infections and the numerous diseases that occur in West Africa. Basic sanitary facilities such as pit toilets and sewage treatment are lacking, and a large river (Niger), the primary depository of waste, floods annually in a country with less than 2 cm of precipitation a year. The result is a stew of excreted antibiotics and pharmaceuticals, microorganisms, pesticides, combustion products, other organic compounds, contaminant breakdown products, and silt deposited on the floodplain. Chemical contaminants sorbed to the small, dry soil particles can be advected into the atmosphere and transported. Known or suspected compounds that are toxic, carcinogenic, mutagenic, or that act as endocrine disruptors may be carried sorbed on dust particles or in the gas phase in the dust air mass. These chemical contaminants might adversely affect the health and function of marine and terrestrial ecosystems on which the contaminants are deposited (e.g., see Solomon, 1998; Daughton and Ternes, 1999; Jones and de Voogt, 1999).
It has been proposed that African dust may be a significant factor in the widespread mortality of hermatypic corals throughout the Caribbean Region, which has been well documented in numerous studies in the past thirty years (Shinn et al., 2000; Garrison et al., 2003, 2005). Mechanisms by which African dust could affect coral reefs include the transport of microbial pathogens and of chemical contaminants. Dust may be linked with coral reef decline in a number of ways: 1) By widespread geographical distribution of microbial pathogens to the reefs; 2) by deposition of limiting micronutrients such as iron, which could spike pathogen reservoir populations, triggering the disease state; and 3) by influx of chemical contaminants that may weaken the natural immunocompetency of coral reef organisms, adversely affect reproduction or be directly toxic during and after dust events.
CMRC-03-NRNN-01-04A Effects of African Dust to Caribbean Marine Ecosystems
Nipper et al., 2005 9
OBJECTIVES
This project had the objective of further testing the hypothesis that contaminants and microbial pathogens are transported by African dust and that they are harmful to marine organisms. Dust samples were collected during dust events and tested for toxicity using a variety of sensitive assays. Microbial and chemical analyses of dust samples were performed in collaboration with the USGS Global Dust Project. The specific goals of the current project were:
1. To establish if contaminants associated with African dust are toxic to a variety of sensitive marine species.
2. To identify which contaminants were responsible for observed toxicity (if any) by conducting Phase I Toxicity Identification Evaluation (TIE) studies and chemical analyses of dust elutriates.
3. To determine whether photo-enhanced toxicity (photoactivation) occurred in the presence of UV exposure, if toxicity was observed and attributed to organic contaminants.
4. To identify and quantify chemical contaminants in African dust reaching the Virgin Islands during dust events (USGS study).
5. To identify bacteria and viruses associated with the dust samples and establish if they are known coral pathogens (in collaboration with a USGS study).
METHODS Dust Sampling and Processing
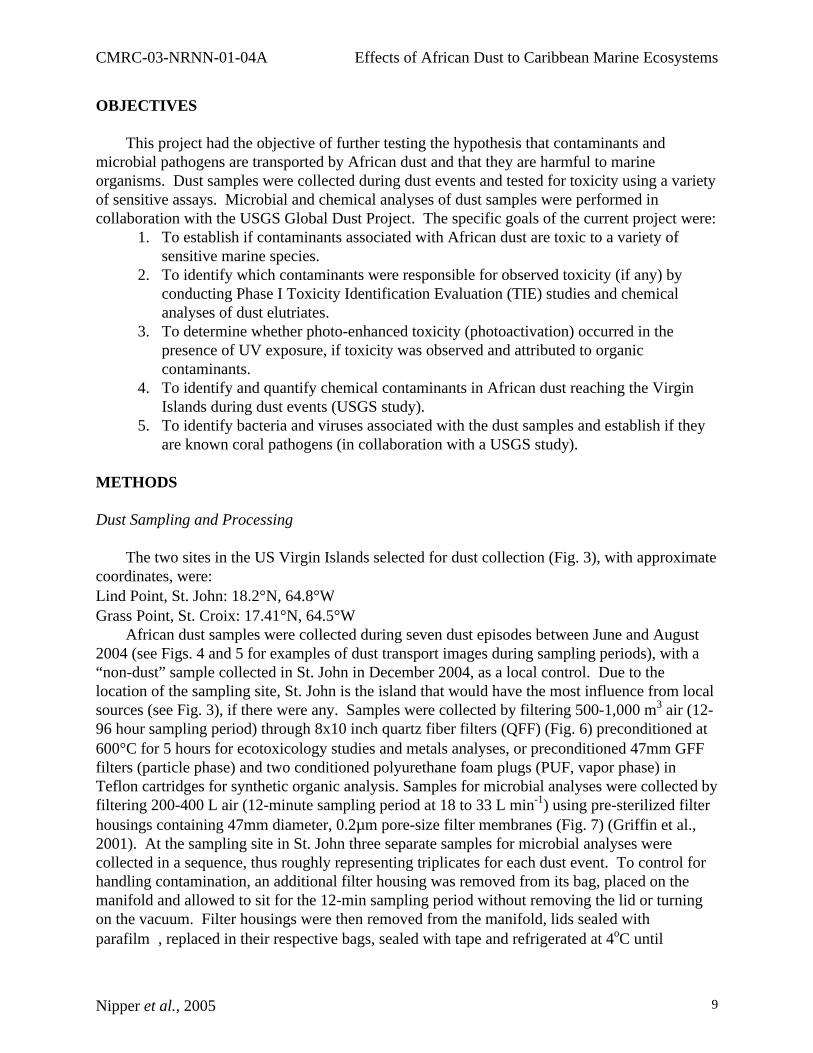
The two sites in the US Virgin Islands selected for dust collection (Fig. 3), with approximate coordinates, were: Lind Point, St. John: 18.2°N, 64.8°W Grass Point, St. Croix: 17.41°N, 64.5°W
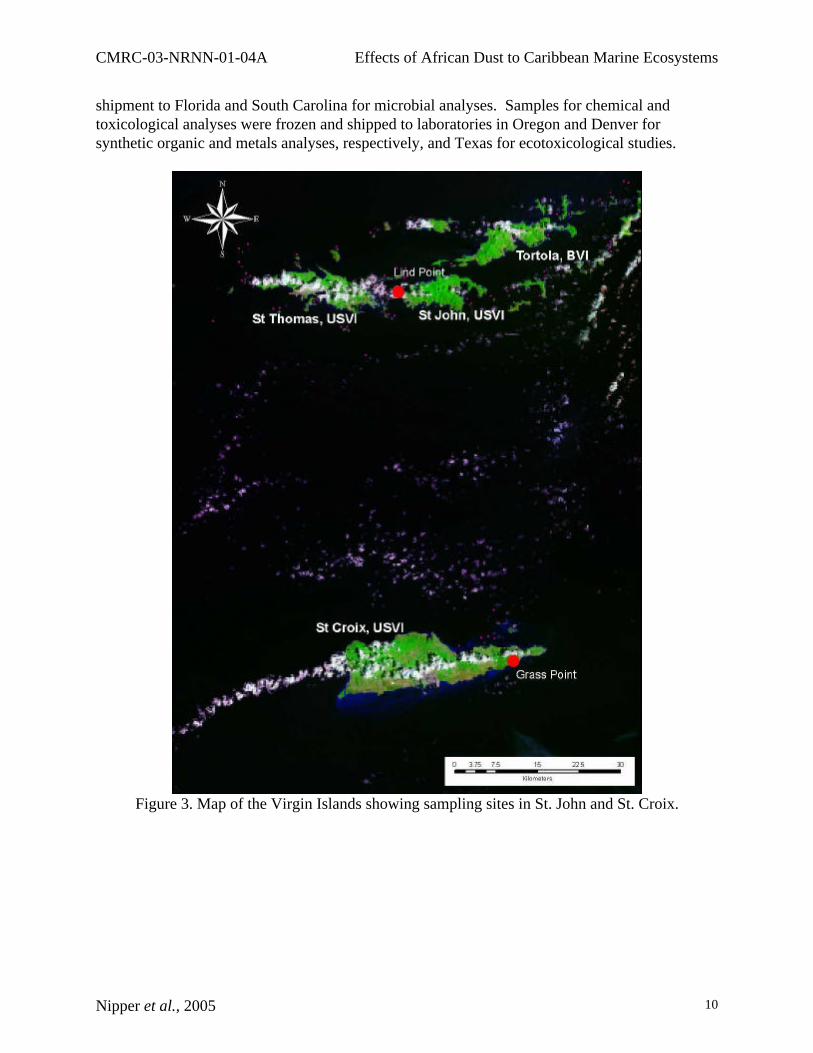
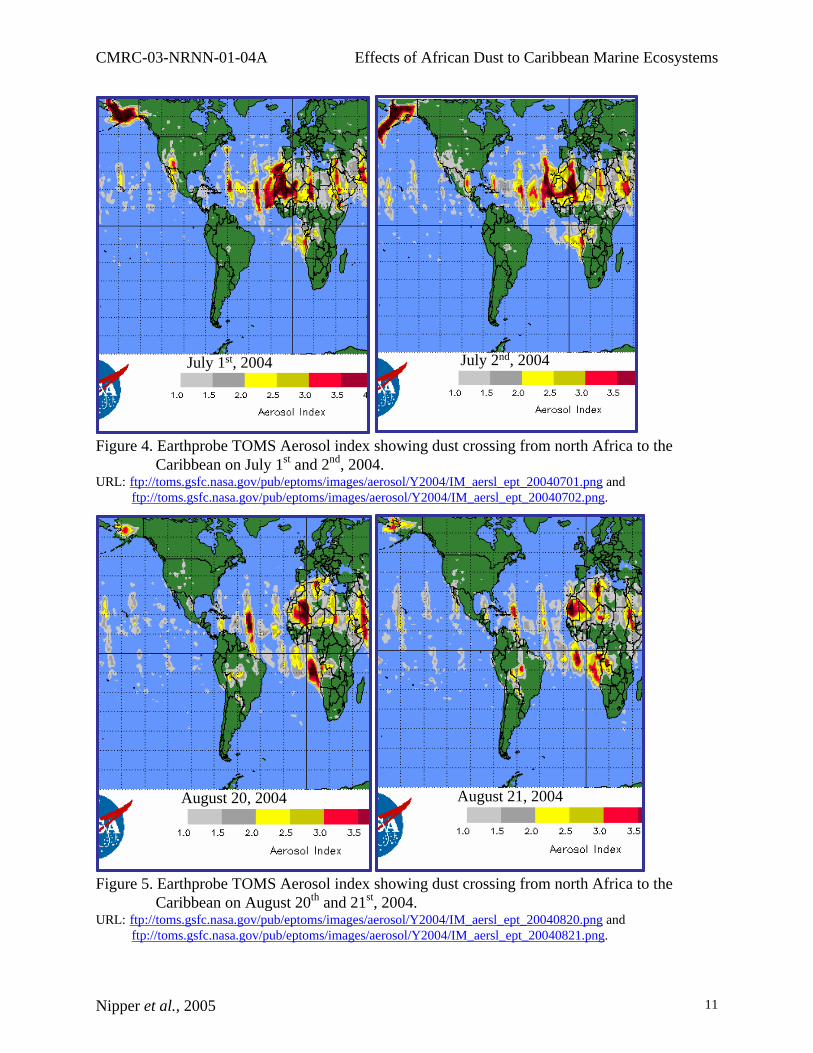
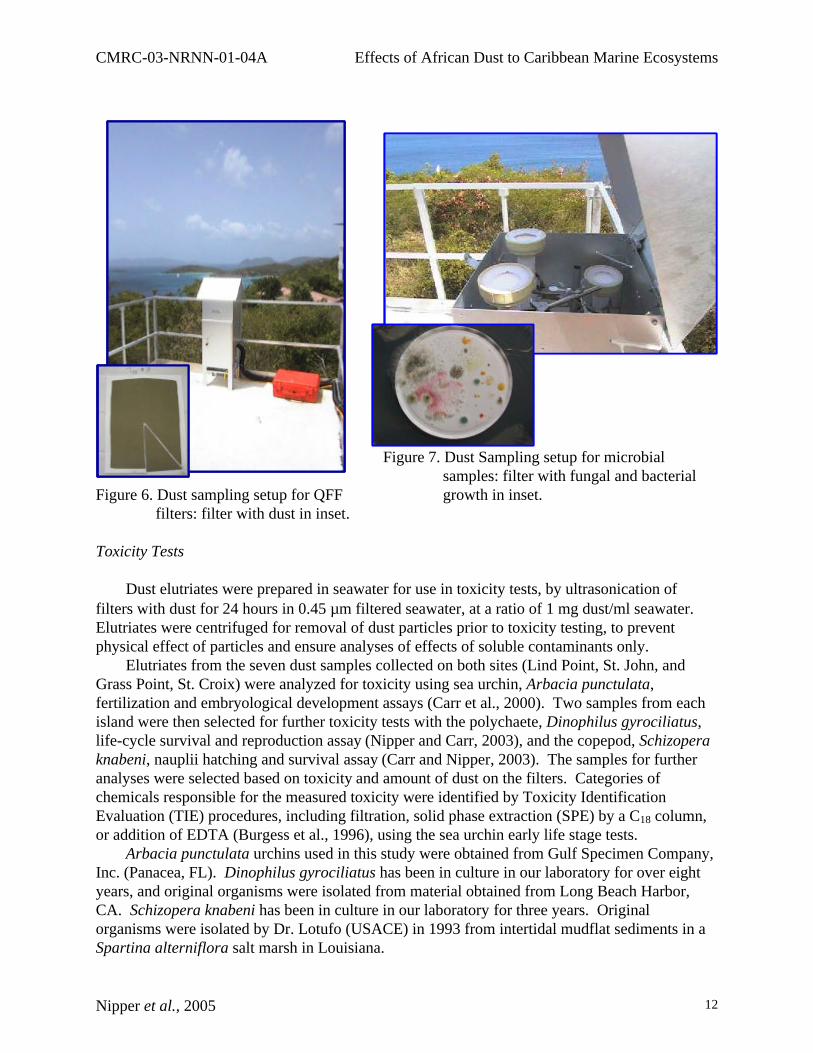
African dust samples were collected during seven dust episodes between June and August 2004 (see Figs. 4 and 5 for examples of dust transport images during sampling periods), with a “non-dust” sample collected in St. John in December 2004, as a local control. Due to the location of the sampling site, St. John is the island that would have the most influence from local sources (see Fig. 3), if there were any. Samples were collected by filtering 500-1,000 m3 air (12-96 hour sampling period) through 8x10 inch quartz fiber filters (QFF) (Fig. 6) preconditioned at 600°C for 5 hours for ecotoxicology studies and metals analyses, or preconditioned 47mm GFF filters (particle phase) and two conditioned polyurethane foam plugs (PUF, vapor phase) in Teflon cartridges for synthetic organic analysis. Samples for microbial analyses were collected by filtering 200-400 L air (12-minute sampling period at 18 to 33 L min-1) using pre-sterilized filter housings containing 47mm diameter, 0.2µm pore-size filter membranes (Fig. 7) (Griffin et al., 2001). At the sampling site in St. John three separate samples for microbial analyses were collected in a sequence, thus roughly representing triplicates for each dust event. To control for handling contamination, an additional filter housing was removed from its bag, placed on the manifold and allowed to sit for the 12-min sampling period without removing the lid or turning on the vacuum. Filter housings were then removed from the manifold, lids sealed with parafilm, replaced in their respective bags, sealed with tape and refrigerated at 4oC until
CMRC-03-NRNN-01-04A Effects of African Dust to Caribbean Marine Ecosystems
Nipper et al., 2005 10
shipment to Florida and South Carolina for microbial analyses. Samples for chemical and toxicological analyses were frozen and shipped to laboratories in Oregon and Denver for synthetic organic and metals analyses, respectively, and Texas for ecotoxicological studies.
Figure 3. Map of the Virgin Islands showing sampling sites in St. John and St. Croix.
CMRC-03-NRNN-01-04A Effects of African Dust to Caribbean Marine Ecosystems
Nipper et al., 2005 11
July 1st, 2004 July 2nd, 2004July 1st, 2004 July 2nd, 2004
Figure 4. Earthprobe TOMS Aerosol index showing dust crossing from north Africa to the
Caribbean on July 1st and 2nd, 2004. URL: ftp://toms.gsfc.nasa.gov/pub/eptoms/images/aerosol/Y2004/IM_aersl_ept_20040701.png and
ftp://toms.gsfc.nasa.gov/pub/eptoms/images/aerosol/Y2004/IM_aersl_ept_20040702.png.
August 20, 2004 August 21, 2004August 20, 2004 August 21, 2004
Figure 5. Earthprobe TOMS Aerosol index showing dust crossing from north Africa to the
Caribbean on August 20th and 21st, 2004. URL: ftp://toms.gsfc.nasa.gov/pub/eptoms/images/aerosol/Y2004/IM_aersl_ept_20040820.png and
ftp://toms.gsfc.nasa.gov/pub/eptoms/images/aerosol/Y2004/IM_aersl_ept_20040821.png.
CMRC-03-NRNN-01-04A Effects of African Dust to Caribbean Marine Ecosystems
Nipper et al., 2005 12
Figure 7. Dust Sampling setup for microbial samples: filter with fungal and bacterial Figure 6. Dust sampling setup for QFF growth in inset. filters: filter with dust in inset. Toxicity Tests
Dust elutriates were prepared in seawater for use in toxicity tests, by ultrasonication of filters with dust for 24 hours in 0.45 µm filtered seawater, at a ratio of 1 mg dust/ml seawater. Elutriates were centrifuged for removal of dust particles prior to toxicity testing, to prevent physical effect of particles and ensure analyses of effects of soluble contaminants only.
Elutriates from the seven dust samples collected on both sites (Lind Point, St. John, and Grass Point, St. Croix) were analyzed for toxicity using sea urchin, Arbacia punctulata, fertilization and embryological development assays (Carr et al., 2000). Two samples from each island were then selected for further toxicity tests with the polychaete, Dinophilus gyrociliatus, life-cycle survival and reproduction assay (Nipper and Carr, 2003), and the copepod, Schizopera knabeni, nauplii hatching and survival assay (Carr and Nipper, 2003). The samples for further analyses were selected based on toxicity and amount of dust on the filters. Categories of chemicals responsible for the measured toxicity were identified by Toxicity Identification Evaluation (TIE) procedures, including filtration, solid phase extraction (SPE) by a C18 column, or addition of EDTA (Burgess et al., 1996), using the sea urchin early life stage tests.
Arbacia punctulata urchins used in this study were obtained from Gulf Specimen Company, Inc. (Panacea, FL). Dinophilus gyrociliatus has been in culture in our laboratory for over eight years, and original organisms were isolated from material obtained from Long Beach Harbor, CA. Schizopera knabeni has been in culture in our laboratory for three years. Original organisms were isolated by Dr. Lotufo (USACE) in 1993 from intertidal mudflat sediments in a Spartina alterniflora salt marsh in Louisiana.
CMRC-03-NRNN-01-04A Effects of African Dust to Caribbean Marine Ecosystems
Nipper et al., 2005 13
In short, the salinity of the African dust elutriates was 30 + 1 ppt, and test temperature was 20 + 1°C. The sea urchin fertilization test involved exposure of the sperm for 30 minutes, followed by the addition of a predetermined number of eggs. After a total one-hour incubation period the test was terminated by the addition of 10% buffered formalin and the percentage of fertilized eggs was determined. The sea urchin embryological development test was executed in conjunction with the fertilization test, but eggs were pre-fertilized and then inserted into the exposure vials. The embryos were exposed to the test solutions for 48 hours prior to termination by the addition of 10% buffered formalin. Aliquots from each of the five replicates were examined microscopically to determine the percentage of embryos that developed normally to the echinopluteus stage. The polychaete (D. gyrociliatus) 7-day survival and reproduction test was conducted in 20 ml stender dishes containing four 1- to 2-day post-emergent females in 5 ml test solution per replicate, with 5 replicates per treatment. Each chamber was examined after 4 and 7 days. Mortality and number of eggs produced per surviving female were used as endpoints. The copepod, S. knabeni, 96-hour test was conducted in 20 ml glass scintillation vials with Teflon-lined caps containing five ovigerous females in 5 ml sample per replicate, with five replicates per treatment. At the end of the exposure period the number of surviving females was enumerated under a dissecting microscope and removed from the sample, which was then preserved with 4% formaldehyde containing rose Bengal. No less than two days after preservation and staining, the number of stained (alive at test end) nauplii in each vial was counted. The number of nauplii/stocked female was calculated for each replicate.
A reference toxicant test using sodium dodecyl sulfate (SDS) was conducted concurrently with each test series. Results of the tests were compared to control charts prepared using the results of previous tests conducted in our laboratory (Environment Canada, 1990). According to the control charts, the EC50 values for the sea urchin embryological development test should be between 1.6 and 7.0 mg/L, and for the fertilization success test, between 2.9 and 9.0 mg/L; the LC50 values for D. gyrociliatus should be between 2.2 to 8.0 mg/L, and the reproductive EC50, between 0.5 to 7.3 mg/L; and the LC50 values for S. knabeni should fall between 13.4 and 38.8 mg/L, and the hatching success EC50, between 6.0 and 13.8 mg/L.
Water quality measurements were performed with the elutriates used in the sea urchin and polychaete tests, including: dissolved oxygen (DO), measured with an YSI meter, model 59; pH and ammonia, measured with an Orion meter, model 290A, and the respective probes; and salinity, measured with a temperature-compensated Reichert refractometer. Unionized ammonia (expressed as nitrogen) concentrations (NH3) were calculated for each sample using the respective salinity, temperature, pH and total ammonia (NH3 + NH4
+) measurements. The result of each toxicity test with a dust elutriate was compared to its respective blank
control by one-tailed Student’s t-tests. Each TIE treatment was also compared to its respective control treatment by one-tailed Student’s t-tests. The reference toxicant test results using SDS were analyzed by the Trimmed Spearman-Karber method (Hamilton et al., 1977) with Abbott’s correction (Morgan, 1992), for calculation of LC50 with the copepod and polychaete survival endpoints and the EC50 with the copepod hatching success and polychaete reproduction endpoints. For the latter, the results in the various SDS treatments were treated as percentage of the control, for use of the Trimmed Spearman-Karber method. Chemical Analyses
CMRC-03-NRNN-01-04A Effects of African Dust to Caribbean Marine Ecosystems
Nipper et al., 2005 14
Dust samples collected on quartz-fiber filters were analyzed for a suite of elements by Inductively Coupled Plasma Mass Spectrometry (ICP-MS). These analyses were performed as part of the USGS Global Dust Project, but were kindly made available by Dr. Paul Lamothe (USGS, Denver, CO) to help with the interpretation of this project’s results. Prior to analyzing samples, a dual detector calibration and auto-lens adjustment was performed daily according to manufacturer’s recommendations. A multi-acid decomposition (a mixture of hydrochloric, nitric, perchloric, and hydrofluoric acids) was used to digest the samples and the instrument was calibrated using a 1% nitric acid blank solution and three multi-element standards to cover the mass range and generate the mass response curve. Concentrations of elements in the dust were established by applying the formula below to the analytical results:
Conc. in dust (ppm or %)= Sample vol. (mL) x ICP-MS element conc. in digestate (ppm or %)
Sample weight (g) The concentration of some metals with elevated levels in the dust, particularly copper, was
analyzed in the dust elutriates in seawater before and after SPE, in order to verify if copper levels in the elutriates were above toxic levels and if the C18 would have removed any copper from the samples (Mills et al., 1982). These analyses were performed by Albion Environmental, College Station, TX, as part of the current project. Analyses were performed by ICP-MS, following EPA method 1640 (USEPA, 1996).
Organic chemicals analyses of the dust are being performed by Oregon State University and USGS through the USGS Global Dust Project, and data are not available yet. Microbial Analyses
Microbial analyses by USGS were performed by culture on R2A medium (Fisher Scientific,
Atlanta, GA) (Reasoner and Geldreich, 1985). The sample filters were placed whole on R2A medium plates, sample side up, incubated in the dark at room temperature (~23oC) and monitored for growth over a 96-hour period. Fungal and bacterial colonies were isolated from each other by isolation streaking on to fresh plates of R2A. Once isolated, colonies were grown overnight at room temperature on a tabletop rocker set at low speed in Tryptic Soy Broth (Fisher Scientific, Atlanta, GA). The following day 1 ml of each culture was transferred to a sterile cryogenic storage tube containing 200 µl of sterile glycerol and stored at –70oC. Microbial analyses by the USC-A laboratory use a protocol and media specific for microorganisms capable of living in seawater. RESULTS Toxicity Tests and Chemistry
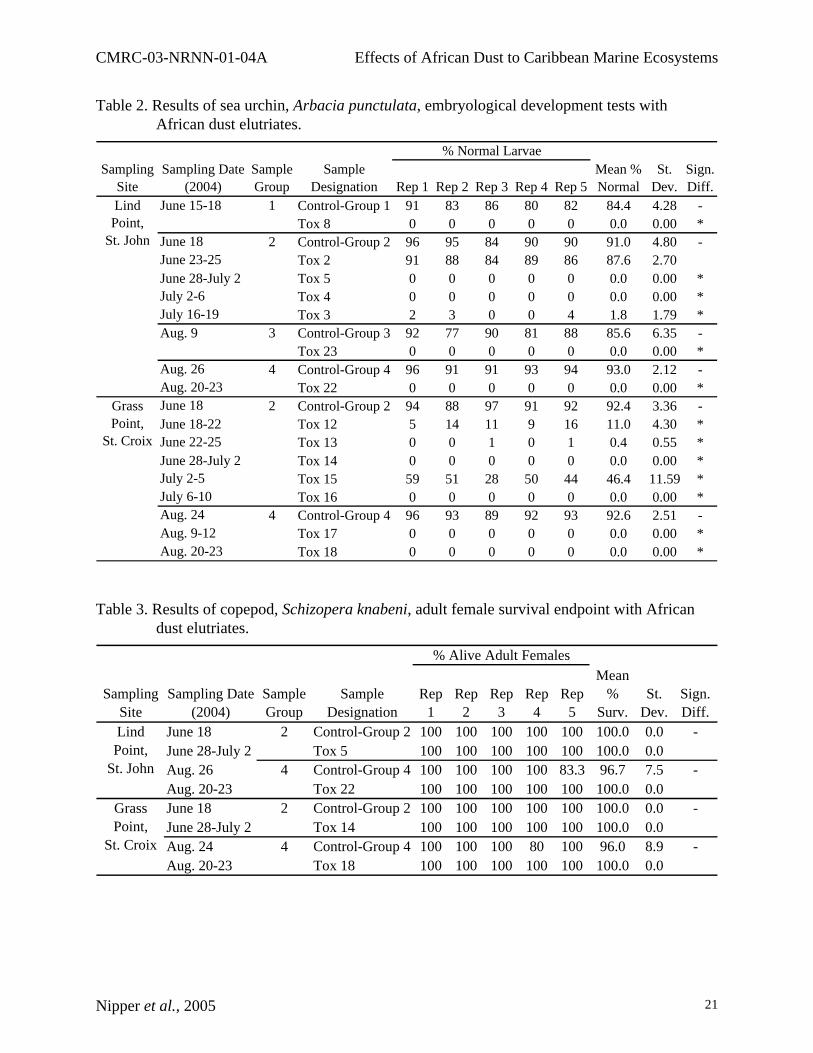
Elutriates prepared with the seven dust samples collected at each site were highly toxic to sea urchin fertilization success, with the mean fertilization rate ranging from 0 to 4.4%, whereas control elutriates prepared with blank filters exhibited fertilization rates between 67.4 and 92.4% (Table 1). Mean normal embryological development in the dust elutriates ranged from 0 to 87.6%, with control development between 84.4 and 93% (Table 2).
CMRC-03-NRNN-01-04A Effects of African Dust to Caribbean Marine Ecosystems
Nipper et al., 2005 15
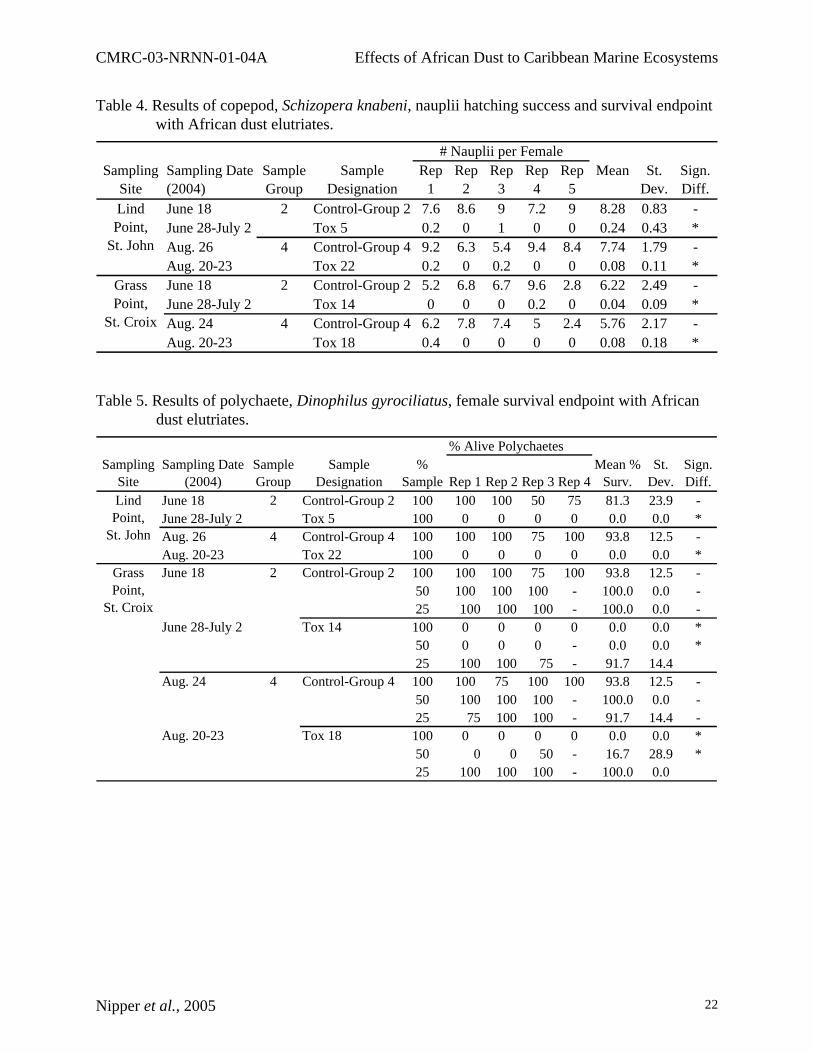
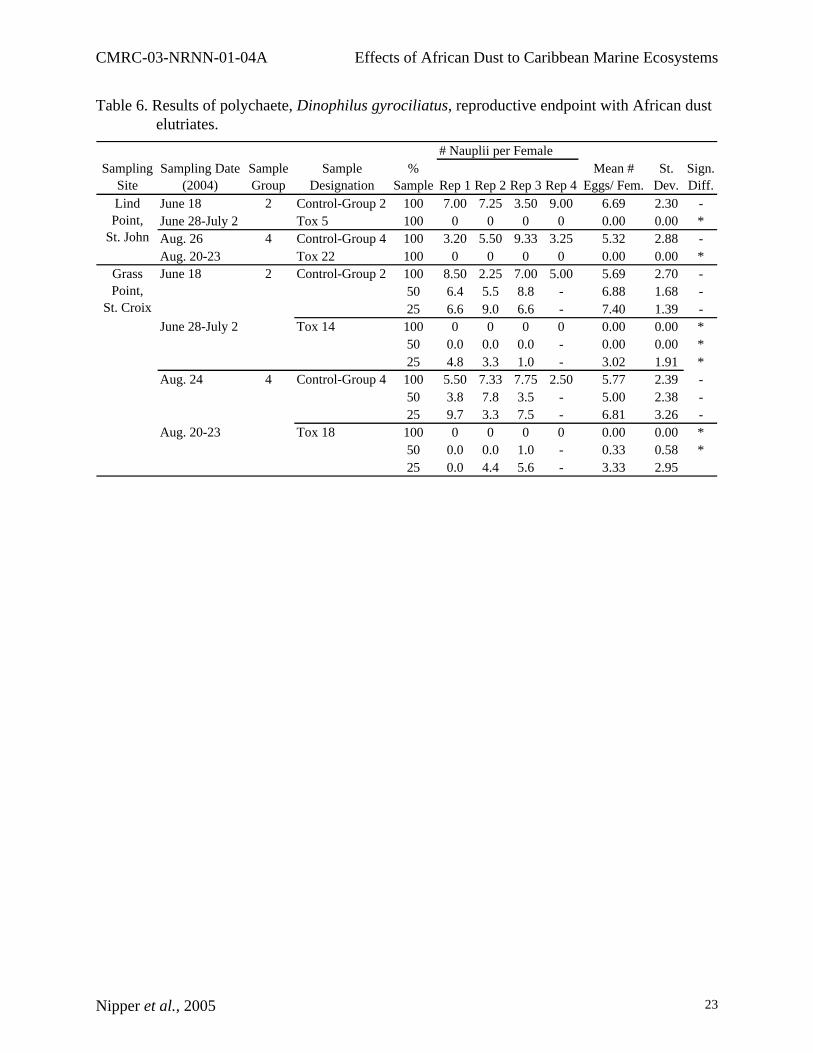
The dust samples collected on both islands (St. John and St. Croix) on June 28 and August 20, 2004, which exhibited 0% sea urchin fertilization and 0% normal embryos, were selected for testing with additional species and application of TIE procedures. Survival of copepod ovigerous females was not significantly affected in these samples (Table 3), but embryo hatching and survival was strongly impaired (Table 4). One hundred percent mortality was exhibited in the polychaete test (Table 5). Further polychaete tests were conducted with 50 and 25% dilutions of the elutriate from St. Croix samples. This resulted in significantly reduced survival and reproduction in both elutriates at 50% dilution, whereas at a 25% dilution survival was at control levels (Table 5), but egg production was still suppressed to <50% of the respective controls (Table 6).
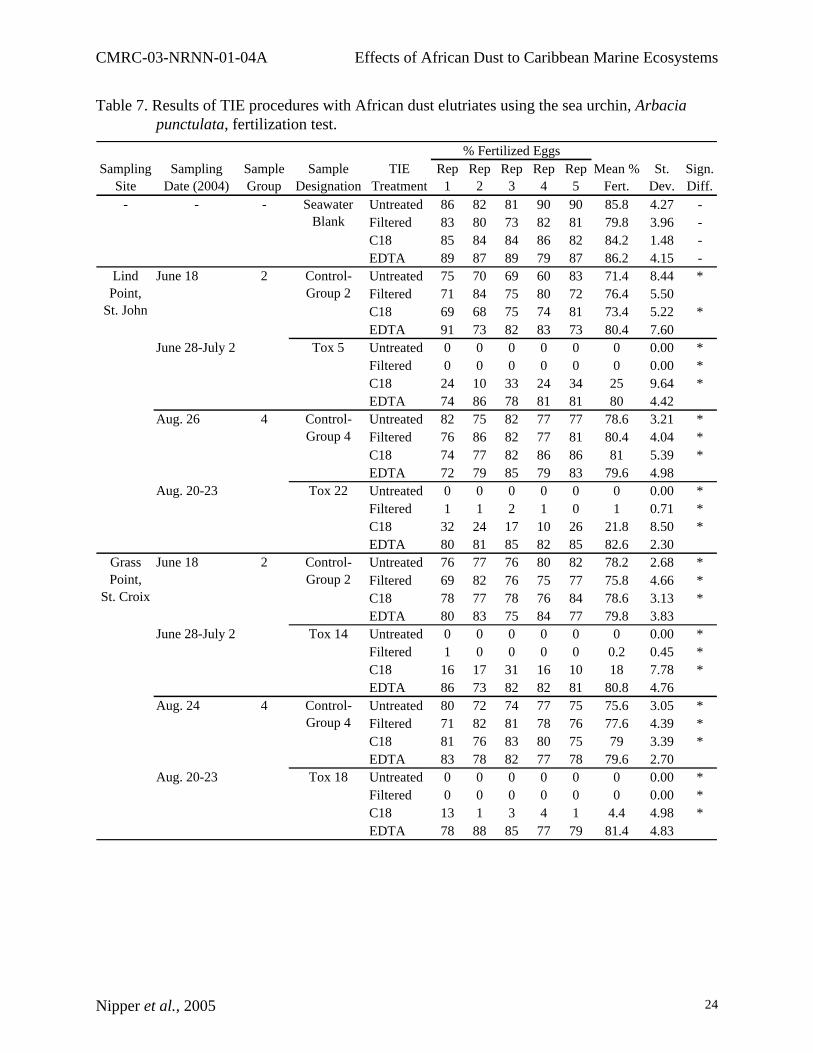
TIE procedures with the sea urchin fertilization test indicated that metals were responsible for the measured toxic effects. Fertilization success after the addition of EDTA to the samples ranged from 80 to 83%, similar to control levels, as opposed to the four baseline (untreated) dust elutriates (Tox 5, 22, 14 and 18) with no EDTA, which exhibited 0% fertilization (Table 7). Chemical analyses of the dust indicated elevated levels of several metals and metalloids in several samples, relative to average crustal values (http://education.jlab.org/itselemental/), including copper, arsenic, molybdenum, silver, antimony, and barium. Copper levels were particularly high, with concentrations ranging from 4.9 mg/g (sample Tox 14) to 11.2 mg/g (sample Tox 18). Copper concentrations measured in elutriates from samples 14 and 18, both from St. Croix, were 200 and 186 µg/L, respectively, an order of magnitude above toxic levels for most marine species, including the reported fertilization EC50 for A. punctulata, ranging from 6.1 to 12 µg/L (Nacci et al., 1986; Carr et al., 1996), and the marine acute and chronic water quality criteria of 4.8 and 3.1 µg/L, respectively (USEPA, 2002). Therefore, the data suggest that copper was responsible for the toxicity observed in the analyzed dust samples, although we cannot state that the total copper measured in the samples was bioavailable. Part or most of it may have been complexed and, therefore, not available to the organisms. The sources of such elevated levels of copper are currently under examination. Some species of polychaetes have been reported to have relatively reduced sensitivity to copper, with a lowest observed effect concentration (LOEC) of 500 µg/L for Ophryotrocha sp. and 100 µg/L for Ctenodrilus sp., for reproductive endpoints in 21- day exposures (Reish and Carr, 1978). This is coherent with the reduction in adverse effects to D. gyrociliatus in the elutriates diluted to 25 and 50%.
Additional TIE procedures included filtration and SPE by C18. Filtration did not reduce sample toxicity, and SPE by C18 increased fertilization from 4.4 to 25% in the different samples. Further chemical analyses of the elutriate from sample # 14 and of the same sample after SPE by C18 showed 25% copper removal by the C18 column. In this sample fertilization success increased 18% after the C18 treatment. This suggests that copper removal may have contributed to the increased fertilization rate after the C18 treatment, although this procedure primarily targets the removal of nonpolar organics. As a result of the conclusions achieved from the TIE data, no UV exposures were performed, since photo-enhanced toxicity is a known property of a variety of organic chemicals, but does not occur with metals.
Non-dust samples, i.e., filtered samples from a period when African dust was not present in the air, were collected at St. John and chemically analyzed for metals. The dust amount on this filter weighed 0.6 mg, as opposed to dust weights ranging from 20 to 70 mg on the filters from the African dust events used in the TIE study. Total copper measured on the “non-dust” filter was 27.7 µg, with total copper on the dust event filters used for TIEs ranging from 108 to 654 µg.
CMRC-03-NRNN-01-04A Effects of African Dust to Caribbean Marine Ecosystems
Nipper et al., 2005 16
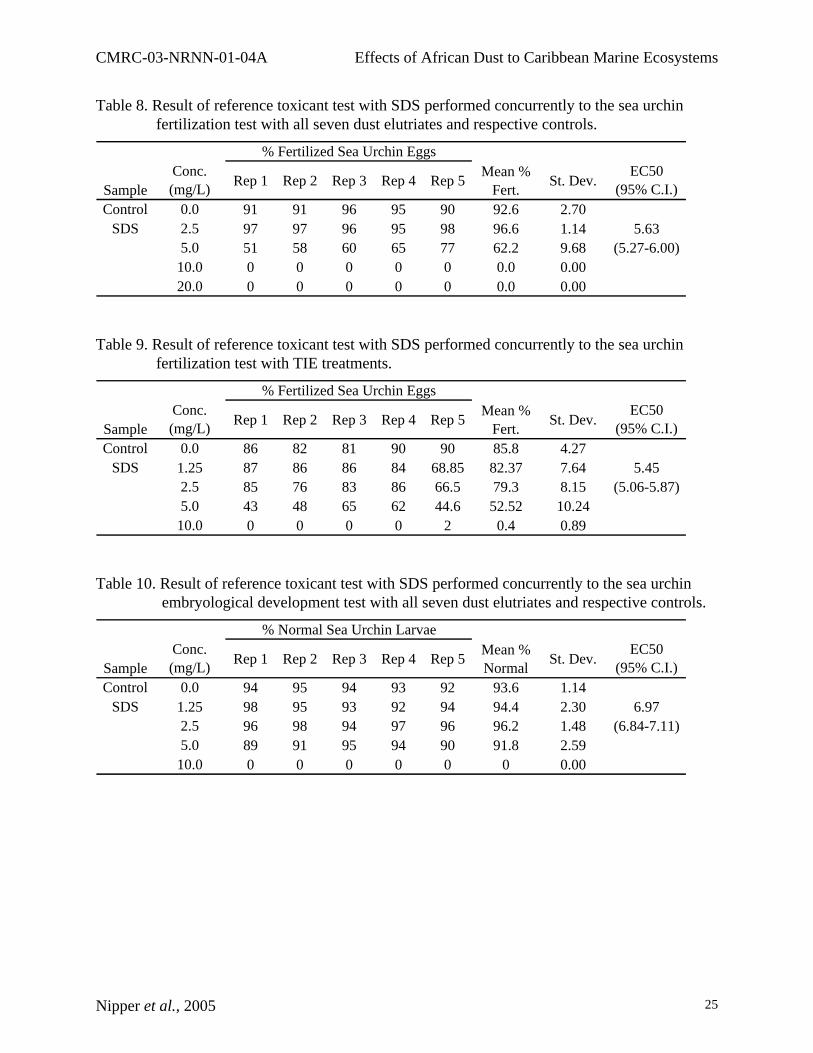
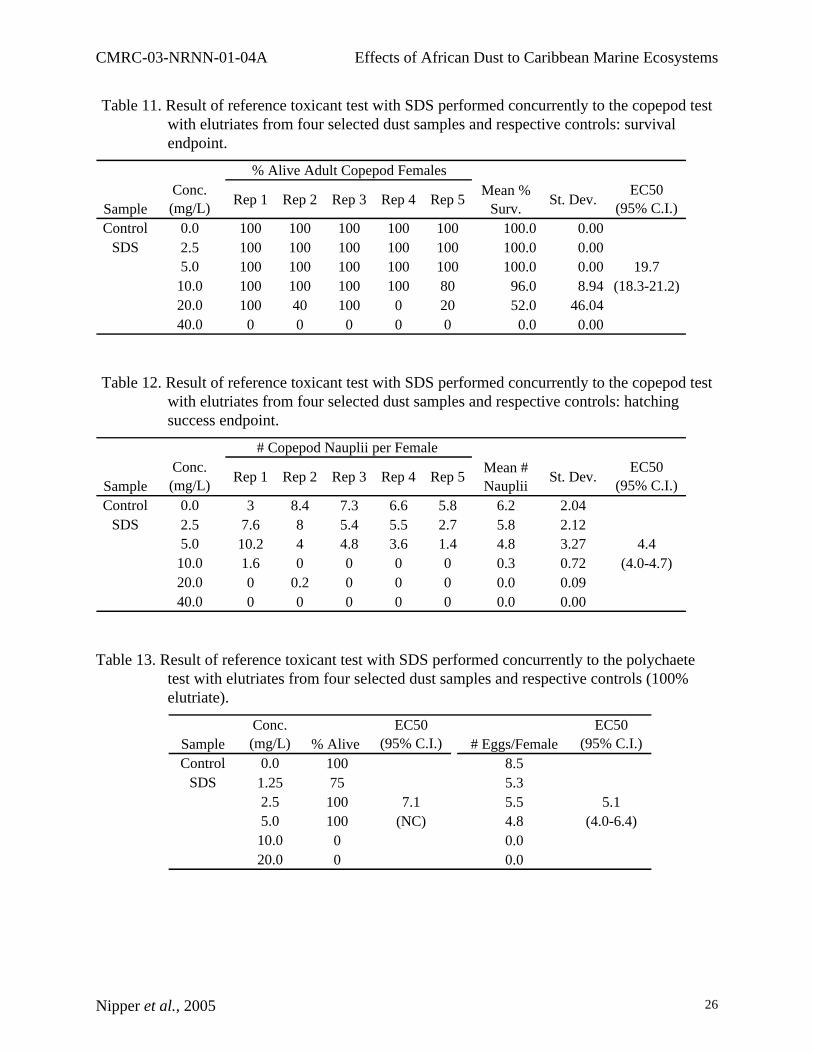
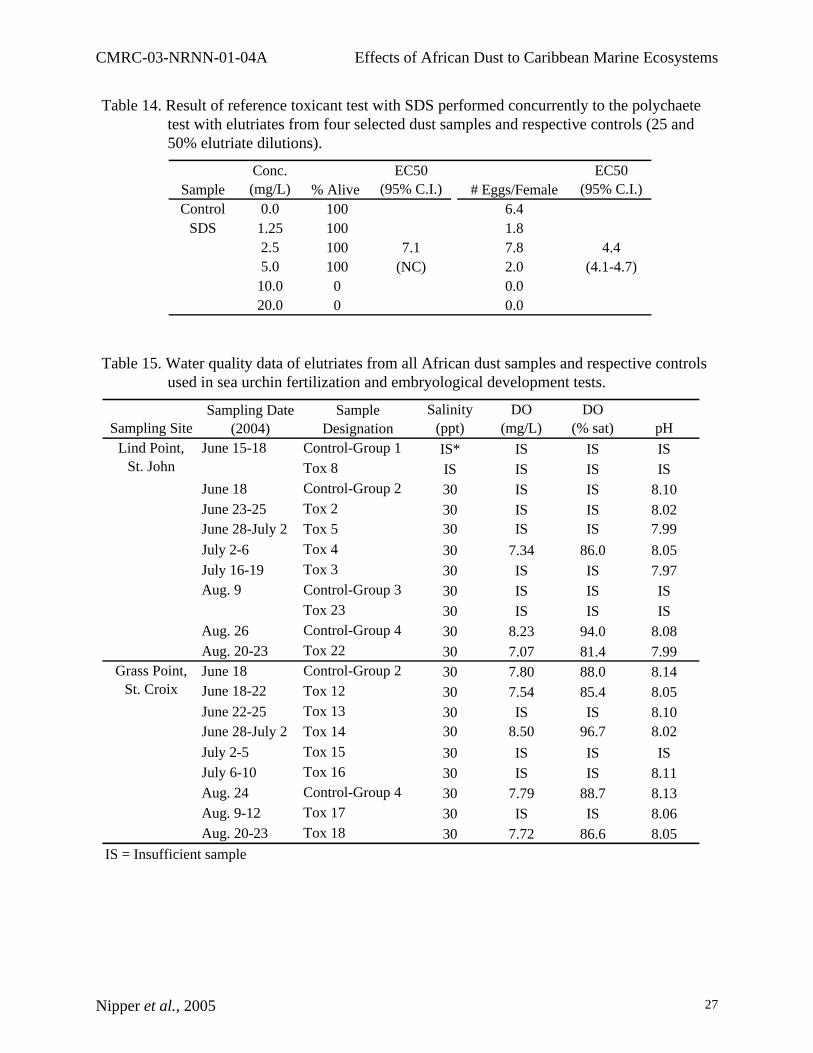
Toxicity test results with the reference toxicant, sodium dodecyl sulfate (SDS) were within the acceptable range (Tables 8-14) according to control charts prepared in our laboratory (Environment Canada, 1990), except for the copepod hatching success endpoint, which was a bit more sensitive than usual. Given the extremely high toxicity of the dust elutriates, we do not expect this slightly enhanced sensitivity of the copepod sublethal endpoint to have significantly affected the outcome of this experiment, or interpretation of the overall results.
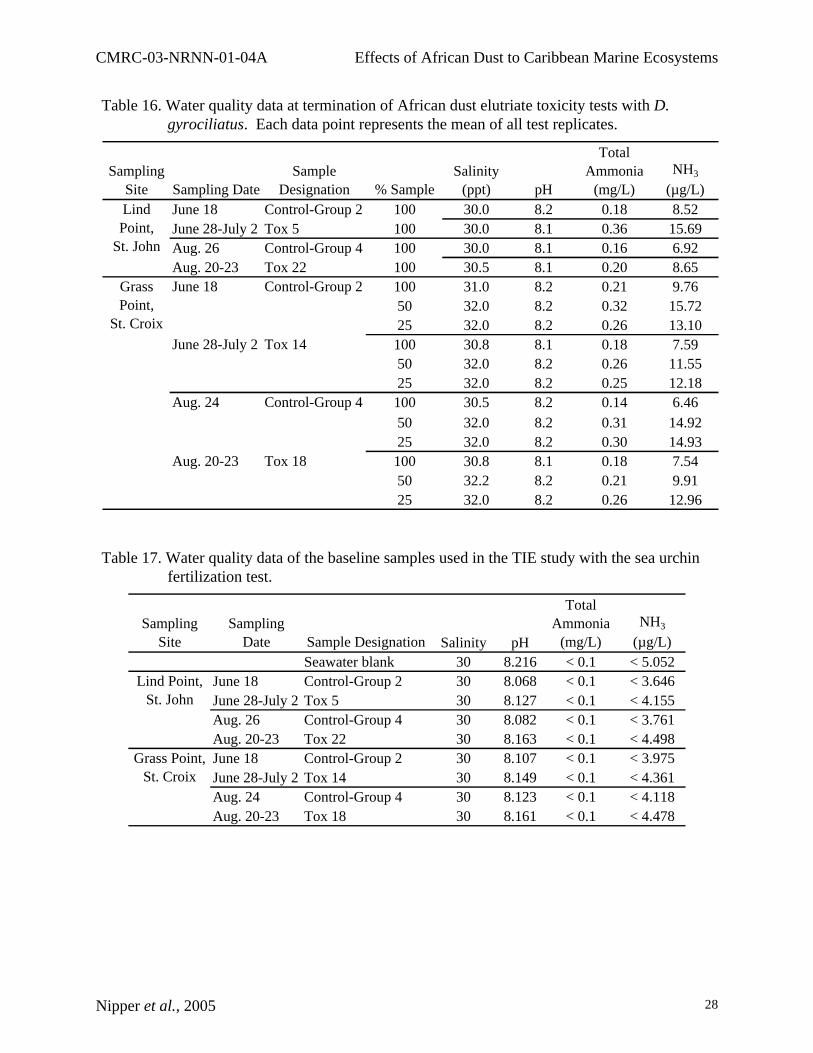
Water quality data from sea urchin and polychaete tests are presented in Tables 15-17. Due to the small volumes of sample we could prepare with the available dust, not all water quality measurements were done in all samples of all experiments. The measurements that were done suggest that water quality would not have interfered with the results of toxicity tests. DO was above 80% saturation in all samples in which it was measured (Table 15), and pH ranged from 7.97 to 8.22 (Tables 15-17). Total ammonia ranged from below detection (<0.1 mg/L) to 0.36 mg/L, with unionized ammonia ranging from below detection to 15.7 µg/L (Tables 16 and 17). Salinity was maintained at 31 + 1 ppt in all measured samples (Tables 15-17). All these measurements are well within the acceptable range and below toxic levels for all test organisms. Microbial Analyses
Table 18 lists the microbiology data acquired from the collection of air samples from St. Croix and St. John for 4 and 3 sampling dates, respectively. The determination of whether dust was impacting the sampling sites was made using visual, satellite aerosol image (NASA’s Earth Probe-TOMS), and aerosol model (US Navy’s NAAPS-Global Aerosol Model) data. The combination of visual, satellite image and model data indicated that dust was present at the sampling sites on all but one sampling dates. On those sampling dates where either the TOMS or NAAPS data indicated the presence of dust, a total of 174 bacterial colony forming units (CFU) (83.6%) out of a total of 208 bacterial CFU were isolated. For the same conditions, 162 fungal CFU (69.8%) out of a total of 232 fungal CFU were isolated. Aspergillus sydowii, a known pathogen of gorgonians (Alker et al., 2001) was identified in some of the samples. The data indicated not only that bacteria and fungi can, indeed, be transported alive to the Caribbean by African dust, but also that coral pathogens are present in the dust.
FUTURE PLANS
In the second year of this project we expect to collect a variety of seawater samples during a
dust event, including sea surface microlayer (SSML), subsurface seawater, water from coral interstices, and sediment pore water, and perform toxicity tests in order to assess the actual loading and potential effects of the dust under field conditions. Analyses of dust elutriates, as presented in this report, will also be performed with samples from at least 2005 dust events, to confirm the data obtained so far, assess temporal variability of African dust quality, and pursue the identification of the source of elevated metals, particularly copper.
ADDITIONAL PERSONNEL (Students, Other scientists, technicians, etc.):
CMRC-03-NRNN-01-04A Effects of African Dust to Caribbean Marine Ecosystems
Nipper et al., 2005 17
S. Caseau and C. Stengel (Virgin Islands National Park, St. John, US Virgin Islands); H. Tonnemacher and M. Peterson (St. Croix, USVI) GPS COORDINATES OF RESEARCH SITES: Lind Point, St. John: 18.2°N, 64.8°W Grass Point, St. Croix: 17.41°N, 64.5°W PAPERS PRESENTED BASED ON 2004 WORK: Poster presented at the 4th SETAC (Society of Environmental Toxicology and Chemistry) World Congress, Portland, OR, USA, 4-18 November, 2004 MANUSCRIPTS AND PUBLICATIONS: None so far REFERENCES Alker, AP, GW Smith and K Kim. 2001. Characterization of Aspergillus sydowii (Thom et
Church), a fungal pathogen of Caribbean sea fan corals. Hydrobiologia 460:105-111. Burgess, RM, KT Ho, GE Morrison, G Chapman and DL Denton. 1996. Marine toxicity
identification evaluation (TIE). Phase I guidance document, USEPA, EPA/600/R-96/054, 70 p. Carr, RS, DC Chapman, BJ Presley, JM Biedenbach, L Robertson, P Boothe, R Kilada, T Wade
and P Montagna. 1996. Sediment porewater toxicity assessment studies in the vicinity of offshore oil and gas production platforms in the Gulf of Mexico. Can. J. Fish. Aquat. Sci. 53:2618-2628.
Carr, RS, PA Montagna, JM Biedenbach, R Kalke, MC Kennicutt, R Hooten and G Cripe. 2000. Impact of storm-water outfalls on sediment quality in Corpus Christi Bay, Texas. Environ. Toxicol. Chem. 19:561-574.
Carr, RS and M Nipper. 2003. Assessment of environmental effects of ordnance compounds and their transformation products in coastal ecosystems. Final report prepared for Naval Facilities Engineering Service Center, Port Hueneme, CA. Center for Coastal Studies Report No. TAMU-CC-0303-CCS, TR-2234-NV, http://enviro.nfesc.navy.mil/erb/erb_a/restoration/fcs_area/uxo/tr-2234-ord.pdf.
Daughton, CG and TA Ternes. 1999. Pharmaceuticals and personal care products in the environment: agents of subtle change? Environ. Hlth. Perspect. 107:907-938.
Delaney, AC, DW Parkein, JJ Griffin, ED Goldberg and BEF Reimann. 1967. Airborne dust collected at Barbados. Geochim. Cosmochim. Acta 31:885-909.
Environment Canada. 1990. Guidance document on control of toxicity test precision using reference toxicants, EPS 1/RM/12. Environment Canada, Ottawa, Ontario, Canada.
Garrison, VH, EA Shinn, WT Foreman, DW Griffin, CW Holmes, CA Kellogg, MS Majewski, LL Richarson, KB Ritchie and GW Smith. 2003. African and Asian dust: from desert soils to coral reefs. Bioscience 53:469-479.
CMRC-03-NRNN-01-04A Effects of African Dust to Caribbean Marine Ecosystems
Nipper et al., 2005 18
Garrison, VH, EA Shinn, Holmes, C, Griffin, D. 2005. The Effects of Globally Transported African and Asian Dust on Coral Reef and Human Health. Online documentary available at http://coastal.er.usgs.gov/african_dust/.
Griffin, DW, VH Garrison, JR Herman and EA Shinn. 2001. African desert dust in the Caribbean atmosphere: Microbiology and public health. Aerobiologia 17:203-213.
Hamilton, MA, RC Russo and RV Thurston. 1978. Trimmed Spearman-Karber method for estimating median lethal concentrations on toxicity bioassays. Environmental Science and Technology 11(4):714-19; correction 12(7):417.
Jones, KC and P de Voogt. 1999. Persistent organic pollutants (POPS): state of the science. Environ. Pollut. 100:209-221.
Lemieux, PM, CC Lutes, JA Abbott and KM Aldous. 2000. Emissions of polychlorinated dibenzo-p-dioxins and polychlorinated dibenzofurans from the open burning of household waste in barrels. Environ. Sci. Technol. 34:377-385.
Mills, GL, AK Jr Hanson and JG Quinn. 1982. Chemical studies of copper -organic complexes isolated from estuarine waters using C18 reverse-phase liquid chromatography. Mar. Chem. 11:355-377.
Morgan, BJT. 1992. Analysis of Quantal Response Data. Chapman and Hall, London, England. Nacci, D, E Jackim and R Walsh. 1986. Comparative evaluation of three rapid marine toxicity
tests: sea urchin early embryo growth test, sea urchin sperm cell toxicity test and Microtox. Environ. Toxicol. Chem. 5:521-525.
Nickling, WG and JA Gillies. 1993. Dust emission and transport in Mali, West Africa. Sedimentology 40:859-868.
Nipper, M and RS Carr. 2003. Recent advances in the use of meiofaunal polychaetes for ecotoxicological assessments. Hydrobiologia 496:347-353.
Perry, KD, TA Cahill, RA Eldred and DD Dutcher. 1997. Long-range transport of North African dust to the eastern United States. J. Geophys. Res. 102:11225-11238.
Prospero, JM. 1968. Atmospheric dust studies on Barbados. Bull. Amer. Meteorolog. Soc. 49:645-652.
Prospero, JM. 1981. Arid regions as sources of mineral aerosols in the marine atmosphere. Geolog. Soc. Amer. Spec. Paper 186:71-86.
Prospero, JM and TN Carlson. 1972. Vertical and areal distribution of Saharan dust over the western equatorial North Atlantic Ocean. J. Geophys. Res. 77:5255-5265.
Prospero, JM and RT Nees. 1977. Dust concentration in the atmosphere of the Equatorial North Atlantic: possible relationship to the Sahelian drought. Science 196:1196-1198.
Prospero, JM and RT Nees. 1986. Impact of the North African drought and El Nino on mineral dust in the Barbados trade winds. Nature 320:735-738.
Reasoner, DJ and EE Geldreich. 1985. A new medium for the enumeration and subculture of bacteria from portable water. Appl. Environ. Microbiol. 49:1-7.
Reish, DJ and RS Carr. 1978. The effect of heavy metals on the survival, reproduction, development and life cycles for two species of polychaetous annelids. Mar. Pollut. Bull. 9:24-27
Savoie, DL and JM Prospero. 1977. Aerosol concentration statistics for the northern tropical Atlantic. J. Geophys. Res. 82:5954-5964.
Shinn, EA, GW Smith, JM Prospero, P Betzer, ML Hayes, VH Garrison and RT Barber. 2000. African dust and the demise of Caribbean coral reefs. Geophys. Res. Let. 27:3029-3032.
CMRC-03-NRNN-01-04A Effects of African Dust to Caribbean Marine Ecosystems
Nipper et al., 2005 19
Solomon, KR. 1998. Endocrine-modulating substances in the environment: the wildlife connection. Interna. J. Toxicol. 17:159-171.
Swap, R, S Ulanski, M Cobbett and M Garstang. 1996. Temporal and spatial characteristics of Saharan dust outbreaks. J. Geophys. Res. 101:4205-4220.
Talbot, RW, RC Harris, EV Browell, GL Gregory, KI Sebacher and SM Beck. 1986. Distribution and geochemistry of aerosols in the tropical north Atlantic troposphere: relationship to Saharan dust. J. Geophys. Res. 91:5173-5182.
Tegen, I and I Fung. 1994. Modeling of mineral dust in the atmosphere: sources, transport and optical thickness. J. Geophys. Res. 99:22897-22914.
Tegen, I and I Fung. 1995. Contribution to the atmospheric mineral aerosol load from land surface modification. J. Geophys. Res. 100:18707-18726.
Tegen, I, AA Lacis and I Fung. 1996. The influence on climate forcing of mineral dust disturbed soils. Nature 380:419-422.
USEPA. 1996. Method 1640: Determination of trace metals in ambient waters by online chelation preconcentration and inductively coupled plasma-mass spectrometry, USEPA, Office of Water, EPA-821-R-96-007, 45 p. URL: http://www.epa.gov/cgi-bin/claritgw.
USEPA. 2002. National recommended water quality criteria. USEPA Office of Water and Office of Science and Technology, EPA-822-R-02-047, 33 p. URL: http://www.epa.gov/waterscience/pc/revcom.pdf.
CMRC-03-NRNN-01-04A Effects of African Dust to Caribbean Marine Ecosystems
Nipper et al., 2005 20
Table 1. Results of sea urchin, Arbacia punctulata, fertilization tests with African dust elutriates.
% Fertilized EggsSampling
SiteSampling Date
(2004)Sample Group
Sample Designation
Rep 1 Rep 2 Rep 3 Rep 4 Rep 5Mean %
Fert. St.
Dev.Sign. Diff.
Control-Group 1 70 78 68 62 59 67.4 7.40 -Tox 8 0 1 0 0 0 0.2 0.45 *
June 18 Control-Group 2 59 79 80 80 80 75.6 9.29 -June 23-25 Tox 2 3 3 4 6 6 4.4 1.52 *June 28-July 2 Tox 5 0 0 0 0 0 0.0 0.00 *July 2-6 Tox 4 0 0 0 0 0 0.0 0.00 *July 16-19 Tox 3 0 0 0 0 0 0.0 0.00 *
Control-Group 3 72 80 85 65 82 76.8 8.17 -Tox 23 0 0 0 0 0 0.0 0.00 *
Aug. 26 Control-Group 4 90 77 77 79 86 81.8 5.89 -Aug. 20-23 Tox 22 0 0 0 0 0 0.0 0.00 *June 18 Control-Group 2 92 88 72 91 93 87.2 8.70 -June 18-22 Tox 12 0 0 0 0 0 0.0 0.00 *June 22-25 Tox 13 0 0 0 0 0 0.0 0.00 *June 28-July 2 Tox 14 0 0 0 0 0 0.0 0.00 *July 2-5 Tox 15 4 3 2 0 2 2.2 1.48 *July 6-10 Tox 16 0 0 0 0 0 0.0 0.00 *Aug. 24 Control-Group 4 97 81 94 94 96 92.4 6.50 -Aug. 9-12 Tox 17 0 0 0 0 0 0.0 0.00 *Aug. 20-23 Tox 18 0 0 0 0 0 0.0 0.00 *
1
3
4
Grass Point,
St. Croix
Aug. 9
2
4
Lind Point,
St. John
June 15-18
2
CMRC-03-NRNN-01-04A Effects of African Dust to Caribbean Marine Ecosystems
Nipper et al., 2005 21
Table 2. Results of sea urchin, Arbacia punctulata, embryological development tests with African dust elutriates.
% Normal LarvaeSampling
SiteSampling Date
(2004)Sample Group
Sample Designation Rep 1 Rep 2 Rep 3 Rep 4 Rep 5
Mean % Normal
St. Dev.
Sign. Diff.
Control-Group 1 91 83 86 80 82 84.4 4.28 -Tox 8 0 0 0 0 0 0.0 0.00 *
June 18 Control-Group 2 96 95 84 90 90 91.0 4.80 -June 23-25 Tox 2 91 88 84 89 86 87.6 2.70June 28-July 2 Tox 5 0 0 0 0 0 0.0 0.00 *July 2-6 Tox 4 0 0 0 0 0 0.0 0.00 *July 16-19 Tox 3 2 3 0 0 4 1.8 1.79 *
Control-Group 3 92 77 90 81 88 85.6 6.35 -Tox 23 0 0 0 0 0 0.0 0.00 *
Aug. 26 Control-Group 4 96 91 91 93 94 93.0 2.12 -Aug. 20-23 Tox 22 0 0 0 0 0 0.0 0.00 *June 18 Control-Group 2 94 88 97 91 92 92.4 3.36 -June 18-22 Tox 12 5 14 11 9 16 11.0 4.30 *June 22-25 Tox 13 0 0 1 0 1 0.4 0.55 *June 28-July 2 Tox 14 0 0 0 0 0 0.0 0.00 *July 2-5 Tox 15 59 51 28 50 44 46.4 11.59 *July 6-10 Tox 16 0 0 0 0 0 0.0 0.00 *Aug. 24 Control-Group 4 96 93 89 92 93 92.6 2.51 -Aug. 9-12 Tox 17 0 0 0 0 0 0.0 0.00 *Aug. 20-23 Tox 18 0 0 0 0 0 0.0 0.00 *
Grass Point,
St. Croix
2
4
Lind Point,
St. John
June 15-18 1
2
Aug. 9 3
4
Table 3. Results of copepod, Schizopera knabeni, adult female survival endpoint with African
dust elutriates.
% Alive Adult Females
Sampling Site
Sampling Date (2004)
Sample Group
Sample Designation
Rep 1
Rep 2
Rep 3
Rep 4
Rep 5
Mean %
Surv.St.
Dev.Sign. Diff.
June 18 Control-Group 2 100 100 100 100 100 100.0 0.0 -June 28-July 2 Tox 5 100 100 100 100 100 100.0 0.0Aug. 26 Control-Group 4 100 100 100 100 83.3 96.7 7.5 -Aug. 20-23 Tox 22 100 100 100 100 100 100.0 0.0June 18 Control-Group 2 100 100 100 100 100 100.0 0.0 -June 28-July 2 Tox 14 100 100 100 100 100 100.0 0.0Aug. 24 Control-Group 4 100 100 100 80 100 96.0 8.9 -Aug. 20-23 Tox 18 100 100 100 100 100 100.0 0.0
Lind Point,
St. John
2
4
Grass Point,
St. Croix
2
4
CMRC-03-NRNN-01-04A Effects of African Dust to Caribbean Marine Ecosystems
Nipper et al., 2005 22
Table 4. Results of copepod, Schizopera knabeni, nauplii hatching success and survival endpoint with African dust elutriates.
# Nauplii per FemaleSampling
SiteSampling Date (2004)
Sample Group
Sample Designation
Rep 1
Rep 2
Rep 3
Rep 4
Rep 5
Mean St. Dev.
Sign. Diff.
June 18 Control-Group 2 7.6 8.6 9 7.2 9 8.28 0.83 -June 28-July 2 Tox 5 0.2 0 1 0 0 0.24 0.43 *Aug. 26 Control-Group 4 9.2 6.3 5.4 9.4 8.4 7.74 1.79 -Aug. 20-23 Tox 22 0.2 0 0.2 0 0 0.08 0.11 *June 18 Control-Group 2 5.2 6.8 6.7 9.6 2.8 6.22 2.49 -June 28-July 2 Tox 14 0 0 0 0.2 0 0.04 0.09 *Aug. 24 Control-Group 4 6.2 7.8 7.4 5 2.4 5.76 2.17 -Aug. 20-23 Tox 18 0.4 0 0 0 0 0.08 0.18 *
Lind Point,
St. John
2
4
Grass Point,
St. Croix
2
4
Table 5. Results of polychaete, Dinophilus gyrociliatus, female survival endpoint with African
dust elutriates.
% Alive PolychaetesSampling
SiteSampling Date
(2004)Sample Group
Sample Designation
% Sample Rep 1 Rep 2 Rep 3 Rep 4
Mean % Surv.
St. Dev.
Sign. Diff.
June 18 Control-Group 2 100 100 100 50 75 81.3 23.9 -June 28-July 2 Tox 5 100 0 0 0 0 0.0 0.0 *Aug. 26 Control-Group 4 100 100 100 75 100 93.8 12.5 -Aug. 20-23 Tox 22 100 0 0 0 0 0.0 0.0 *
100 100 100 75 100 93.8 12.5 -50 100 100 100 - 100.0 0.0 -25 100 100 100 - 100.0 0.0 -
100 0 0 0 0 0.0 0.0 *50 0 0 0 - 0.0 0.0 *25 100 100 75 - 91.7 14.4
100 100 75 100 100 93.8 12.5 -50 100 100 100 - 100.0 0.0 -25 75 100 100 - 91.7 14.4 -
100 0 0 0 0 0.0 0.0 *50 0 0 50 - 16.7 28.9 *25 100 100 100 - 100.0 0.0
Lind Point,
St. John
2
4
2June 18
June 28-July 2
Grass Point,
St. Croix
Aug. 24
Aug. 20-23
4
Control-Group 2
Tox 14
Control-Group 4
Tox 18
CMRC-03-NRNN-01-04A Effects of African Dust to Caribbean Marine Ecosystems
Nipper et al., 2005 23
Table 6. Results of polychaete, Dinophilus gyrociliatus, reproductive endpoint with African dust elutriates.
# Nauplii per FemaleSampling
SiteSampling Date
(2004)Sample Group
Sample Designation
% Sample Rep 1 Rep 2 Rep 3 Rep 4
Mean # Eggs/ Fem.
St. Dev.
Sign. Diff.
June 18 Control-Group 2 100 7.00 7.25 3.50 9.00 6.69 2.30 -June 28-July 2 Tox 5 100 0 0 0 0 0.00 0.00 *Aug. 26 Control-Group 4 100 3.20 5.50 9.33 3.25 5.32 2.88 -Aug. 20-23 Tox 22 100 0 0 0 0 0.00 0.00 *
100 8.50 2.25 7.00 5.00 5.69 2.70 -50 6.4 5.5 8.8 - 6.88 1.68 -25 6.6 9.0 6.6 - 7.40 1.39 -
100 0 0 0 0 0.00 0.00 *50 0.0 0.0 0.0 - 0.00 0.00 *25 4.8 3.3 1.0 - 3.02 1.91 *
100 5.50 7.33 7.75 2.50 5.77 2.39 -50 3.8 7.8 3.5 - 5.00 2.38 -25 9.7 3.3 7.5 - 6.81 3.26 -
100 0 0 0 0 0.00 0.00 *50 0.0 0.0 1.0 - 0.33 0.58 *25 0.0 4.4 5.6 - 3.33 2.95
Lind Point,
St. John
2
Grass Point,
St. Croix
2
4
June 18 Control-Group 2
June 28-July 2 Tox 14
Aug. 24 4 Control-Group 4
Aug. 20-23 Tox 18
CMRC-03-NRNN-01-04A Effects of African Dust to Caribbean Marine Ecosystems
Nipper et al., 2005 24
Table 7. Results of TIE procedures with African dust elutriates using the sea urchin, Arbacia punctulata, fertilization test.
% Fertilized EggsSampling
SiteSampling
Date (2004)Sample Group
Sample Designation
TIE Treatment
Rep 1
Rep 2
Rep 3
Rep 4
Rep 5
Mean % Fert.
St. Dev.
Sign. Diff.
Untreated 86 82 81 90 90 85.8 4.27 -Filtered 83 80 73 82 81 79.8 3.96 -C18 85 84 84 86 82 84.2 1.48 -EDTA 89 87 89 79 87 86.2 4.15 -Untreated 75 70 69 60 83 71.4 8.44 *Filtered 71 84 75 80 72 76.4 5.50C18 69 68 75 74 81 73.4 5.22 *EDTA 91 73 82 83 73 80.4 7.60Untreated 0 0 0 0 0 0 0.00 *Filtered 0 0 0 0 0 0 0.00 *C18 24 10 33 24 34 25 9.64 *EDTA 74 86 78 81 81 80 4.42Untreated 82 75 82 77 77 78.6 3.21 *Filtered 76 86 82 77 81 80.4 4.04 *C18 74 77 82 86 86 81 5.39 *EDTA 72 79 85 79 83 79.6 4.98Untreated 0 0 0 0 0 0 0.00 *Filtered 1 1 2 1 0 1 0.71 *C18 32 24 17 10 26 21.8 8.50 *EDTA 80 81 85 82 85 82.6 2.30Untreated 76 77 76 80 82 78.2 2.68 *Filtered 69 82 76 75 77 75.8 4.66 *C18 78 77 78 76 84 78.6 3.13 *EDTA 80 83 75 84 77 79.8 3.83Untreated 0 0 0 0 0 0 0.00 *Filtered 1 0 0 0 0 0.2 0.45 *C18 16 17 31 16 10 18 7.78 *EDTA 86 73 82 82 81 80.8 4.76Untreated 80 72 74 77 75 75.6 3.05 *Filtered 71 82 81 78 76 77.6 4.39 *C18 81 76 83 80 75 79 3.39 *EDTA 83 78 82 77 78 79.6 2.70Untreated 0 0 0 0 0 0 0.00 *Filtered 0 0 0 0 0 0 0.00 *C18 13 1 3 4 1 4.4 4.98 *EDTA 78 88 85 77 79 81.4 4.83
Control-Group 2
Tox 14
2
4
June 18
June 28-July 2
Aug. 24
Aug. 20-23
Seawater Blank
-
Aug. 20-23
Lind Point,
St. John
4Aug. 26
--
Grass Point,
St. Croix
Control-Group 2
Tox 5
Control-Group 4
Tox 22
June 18
June 28-July 2
2
Control-Group 4
Tox 18
CMRC-03-NRNN-01-04A Effects of African Dust to Caribbean Marine Ecosystems
Nipper et al., 2005 25
Table 8. Result of reference toxicant test with SDS performed concurrently to the sea urchin fertilization test with all seven dust elutriates and respective controls.
% Fertilized Sea Urchin Eggs
SampleConc. (mg/L) Rep 1 Rep 2 Rep 3 Rep 4 Rep 5
Mean % Fert.
St. Dev.EC50
(95% C.I.)Control 0.0 91 91 96 95 90 92.6 2.70
2.5 97 97 96 95 98 96.6 1.14 5.635.0 51 58 60 65 77 62.2 9.68 (5.27-6.00)
10.0 0 0 0 0 0 0.0 0.0020.0 0 0 0 0 0 0.0 0.00
SDS
Table 9. Result of reference toxicant test with SDS performed concurrently to the sea urchin
fertilization test with TIE treatments.
% Fertilized Sea Urchin Eggs
SampleConc. (mg/L) Rep 1 Rep 2 Rep 3 Rep 4 Rep 5
Mean % Fert.
St. Dev.EC50
(95% C.I.)Control 0.0 86 82 81 90 90 85.8 4.27
1.25 87 86 86 84 68.85 82.37 7.64 5.452.5 85 76 83 86 66.5 79.3 8.15 (5.06-5.87)5.0 43 48 65 62 44.6 52.52 10.24
10.0 0 0 0 0 2 0.4 0.89
SDS
Table 10. Result of reference toxicant test with SDS performed concurrently to the sea urchin
embryological development test with all seven dust elutriates and respective controls.
% Normal Sea Urchin Larvae
SampleConc. (mg/L) Rep 1 Rep 2 Rep 3 Rep 4 Rep 5
Mean % Normal
St. Dev.EC50
(95% C.I.)Control 0.0 94 95 94 93 92 93.6 1.14
1.25 98 95 93 92 94 94.4 2.30 6.972.5 96 98 94 97 96 96.2 1.48 (6.84-7.11)5.0 89 91 95 94 90 91.8 2.59
10.0 0 0 0 0 0 0 0.00
SDS
CMRC-03-NRNN-01-04A Effects of African Dust to Caribbean Marine Ecosystems
Nipper et al., 2005 26
Table 11. Result of reference toxicant test with SDS performed concurrently to the copepod test with elutriates from four selected dust samples and respective controls: survival endpoint.
% Alive Adult Copepod Females
SampleConc. (mg/L) Rep 1 Rep 2 Rep 3 Rep 4 Rep 5
Mean % Surv.
St. Dev.EC50
(95% C.I.)Control 0.0 100 100 100 100 100 100.0 0.00
2.5 100 100 100 100 100 100.0 0.005.0 100 100 100 100 100 100.0 0.00 19.7
10.0 100 100 100 100 80 96.0 8.94 (18.3-21.2)20.0 100 40 100 0 20 52.0 46.0440.0 0 0 0 0 0 0.0 0.00
SDS
Table 12. Result of reference toxicant test with SDS performed concurrently to the copepod test
with elutriates from four selected dust samples and respective controls: hatching success endpoint.
# Copepod Nauplii per Female
SampleConc. (mg/L) Rep 1 Rep 2 Rep 3 Rep 4 Rep 5
Mean # Nauplii
St. Dev.EC50
(95% C.I.)Control 0.0 3 8.4 7.3 6.6 5.8 6.2 2.04
2.5 7.6 8 5.4 5.5 2.7 5.8 2.125.0 10.2 4 4.8 3.6 1.4 4.8 3.27 4.4
10.0 1.6 0 0 0 0 0.3 0.72 (4.0-4.7)20.0 0 0.2 0 0 0 0.0 0.0940.0 0 0 0 0 0 0.0 0.00
SDS
Table 13. Result of reference toxicant test with SDS performed concurrently to the polychaete
test with elutriates from four selected dust samples and respective controls (100% elutriate).
SampleConc. (mg/L) % Alive
EC50 (95% C.I.) # Eggs/Female
EC50 (95% C.I.)
Control 0.0 100 8.51.25 75 5.32.5 100 7.1 5.5 5.15.0 100 (NC) 4.8 (4.0-6.4)
10.0 0 0.020.0 0 0.0
SDS
CMRC-03-NRNN-01-04A Effects of African Dust to Caribbean Marine Ecosystems
Nipper et al., 2005 27
Table 14. Result of reference toxicant test with SDS performed concurrently to the polychaete test with elutriates from four selected dust samples and respective controls (25 and 50% elutriate dilutions).
SampleConc. (mg/L) % Alive
EC50 (95% C.I.) # Eggs/Female
EC50 (95% C.I.)
Control 0.0 100 6.41.25 100 1.82.5 100 7.1 7.8 4.45.0 100 (NC) 2.0 (4.1-4.7)
10.0 0 0.020.0 0 0.0
SDS
Table 15. Water quality data of elutriates from all African dust samples and respective controls
used in sea urchin fertilization and embryological development tests.
Sampling SiteSampling Date
(2004)Sample
DesignationSalinity
(ppt)DO
(mg/L)DO
(% sat) pHControl-Group 1 IS* IS IS ISTox 8 IS IS IS IS
June 18 Control-Group 2 30 IS IS 8.10June 23-25 Tox 2 30 IS IS 8.02June 28-July 2 Tox 5 30 IS IS 7.99July 2-6 Tox 4 30 7.34 86.0 8.05July 16-19 Tox 3 30 IS IS 7.97
Control-Group 3 30 IS IS ISTox 23 30 IS IS IS
Aug. 26 Control-Group 4 30 8.23 94.0 8.08Aug. 20-23 Tox 22 30 7.07 81.4 7.99June 18 Control-Group 2 30 7.80 88.0 8.14June 18-22 Tox 12 30 7.54 85.4 8.05June 22-25 Tox 13 30 IS IS 8.10June 28-July 2 Tox 14 30 8.50 96.7 8.02July 2-5 Tox 15 30 IS IS ISJuly 6-10 Tox 16 30 IS IS 8.11Aug. 24 Control-Group 4 30 7.79 88.7 8.13Aug. 9-12 Tox 17 30 IS IS 8.06Aug. 20-23 Tox 18 30 7.72 86.6 8.05
IS = Insufficient sample
Grass Point, St. Croix
Lind Point, St. John
June 15-18
Aug. 9
CMRC-03-NRNN-01-04A Effects of African Dust to Caribbean Marine Ecosystems
Nipper et al., 2005 28
Table 16. Water quality data at termination of African dust elutriate toxicity tests with D. gyrociliatus. Each data point represents the mean of all test replicates.
Sampling Site Sampling Date
Sample Designation % Sample
Salinity (ppt) pH
Total Ammonia
(mg/L)NH3
(µg/L)June 18 Control-Group 2 100 30.0 8.2 0.18 8.52June 28-July 2 Tox 5 100 30.0 8.1 0.36 15.69Aug. 26 Control-Group 4 100 30.0 8.1 0.16 6.92Aug. 20-23 Tox 22 100 30.5 8.1 0.20 8.65
100 31.0 8.2 0.21 9.7650 32.0 8.2 0.32 15.7225 32.0 8.2 0.26 13.10
100 30.8 8.1 0.18 7.5950 32.0 8.2 0.26 11.5525 32.0 8.2 0.25 12.18
100 30.5 8.2 0.14 6.4650 32.0 8.2 0.31 14.9225 32.0 8.2 0.30 14.93
100 30.8 8.1 0.18 7.5450 32.2 8.2 0.21 9.9125 32.0 8.2 0.26 12.96
Lind Point,
St. John
Grass Point,
St. Croix
Control-Group 2
Tox 14
Control-Group 4
Tox 18
June 18
June 28-July 2
Aug. 24
Aug. 20-23
Table 17. Water quality data of the baseline samples used in the TIE study with the sea urchin
fertilization test.
Sampling Site
Sampling Date Sample Designation Salinity pH
Total Ammonia
(mg/L)NH3
(µg/L)Seawater blank 30 8.216 < 0.1 < 5.052
June 18 Control-Group 2 30 8.068 < 0.1 < 3.646June 28-July 2 Tox 5 30 8.127 < 0.1 < 4.155Aug. 26 Control-Group 4 30 8.082 < 0.1 < 3.761Aug. 20-23 Tox 22 30 8.163 < 0.1 < 4.498June 18 Control-Group 2 30 8.107 < 0.1 < 3.975June 28-July 2 Tox 14 30 8.149 < 0.1 < 4.361Aug. 24 Control-Group 4 30 8.123 < 0.1 < 4.118Aug. 20-23 Tox 18 30 8.161 < 0.1 < 4.478
Lind Point, St. John
Grass Point, St. Croix
CMRC-03-NRNN-01-04A Effects of African Dust to Caribbean Marine Ecosystems
Nipper et al., 2005 29
Table 18. Microbial data from African dust samples collected in the US Virgin Islands. CFU: colony forming units.
Sampling site
Sampling Date (2004)
Sample Designation
Visual Conditions
NASA TOMS - dust presence
(Yes/No)
NAAPS - dust in µg m-3
Bacterial CFU per m3 air*
Fungal CFU per m3 air*
Dust 1 Non-Dust Yes 0.1-0.2 31.3 31.3Dust 2 Non-Dust Yes 0.1-0.2 94 39.2Dust 3 Non-Dust Yes 0.1-0.2 86.2 23.5Control Non-Dust - 0.1-0.2 0 0Dust 1 Non-Dust Yes 0 168.6 236.1Dust 2 Non-Dust Yes 0 86 200.7Dust 3 Non-Dust Yes 0 133.7 162.7Control Non-Dust - 0 0 1
Dust Dust Yes 0.2-0.4 9.9 19.8Control Dust - 0.2-0.4 0 0
Dust Dust Yes 0.1-0.2 671.7 138.3Control Dust - 0.1-0.2 0 0
Dust Dust Yes 0.4-0.8 0 19.8Control Dust - 0.4-0.8 0 0
Dust Non-Dust No 0.1-0.2 9.9 405Control Non-Dust - 0.1-0.2 0 0
Lind Point,
St. John
Grass Point,
St. Croix
June 19
Aug. 17
June 19
June 26
Aug. 21
Aug. 28