Embed Size (px)
Citation preview
A L L E N B A I L E Y & A S S O C I A T E S, I N C.
Annuity Mortality Tables
Douglas Brown, ASA, MAAA
A L L E N B A I L E Y & A S S O C I A T E S, I N C.
Annuity Mortality Tables
New Valuation Standards
Recent Experience Studies
A L L E N B A I L E Y & A S S O C I A T E S, I N C.
Valuation Standards
NAIC Model Rule #821
• Revisions adopted in December 2012 meeting.
• January 1, 2014 target implementation, subsequently postponed to Jan. 1, 2015.
• On track to be adopted by at least 28 states this year.
A L L E N B A I L E Y & A S S O C I A T E S, I N C.
Valuation Standards
• Structured Settlements: 1983 Table (a) (aka 1983 IAM Table) remains the standard.
• Individual Annuity & Pure Endowment: 2012 Individual Annuity Reserving (IAR) Table replaces the Annuity 2000 Mortality Table
• Group Annuity & Pure Endowment: 1983 GAM is no longer an option (must use the 1994 GAM, including projections).

A L L E N B A I L E Y & A S S O C I A T E S, I N C.
Valuation Standards
• No phase in period for statutory reserves.
• New table used for tax reserves once the new table is adopted in at least 26 states.
• IRC §807(d)(5) permits a three year transition period.
• Significant incentive to transition to new table for tax reserves as soon as possible.
A L L E N B A I L E Y & A S S O C I A T E S, I N C.
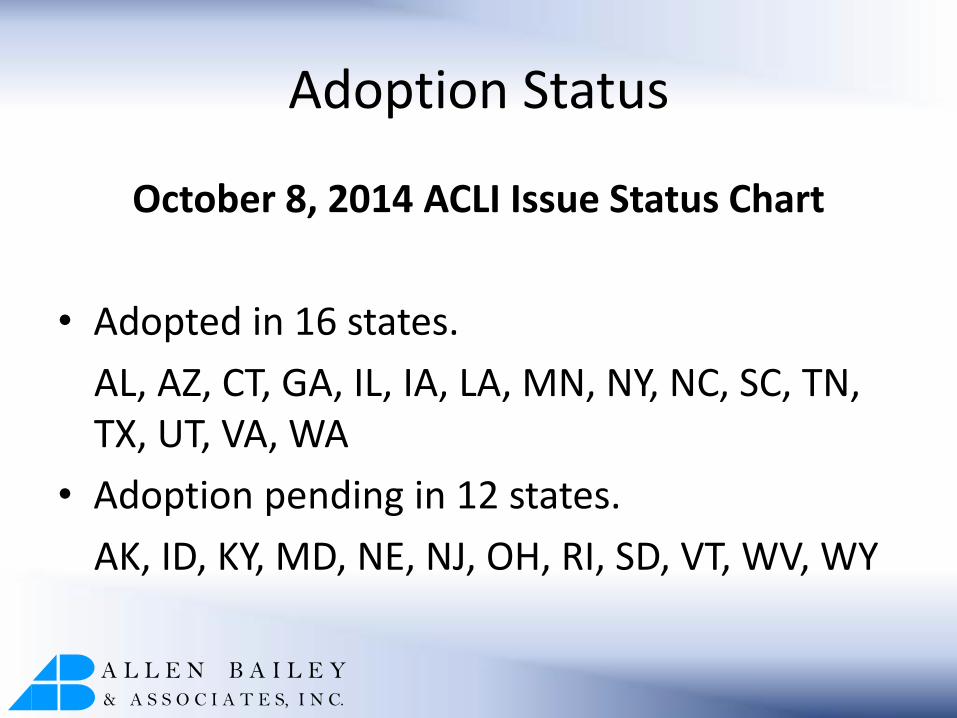
Adoption Status
October 8, 2014 ACLI Issue Status Chart
• Adopted in 16 states.
AL, AZ, CT, GA, IL, IA, LA, MN, NY, NC, SC, TN, TX, UT, VA, WA
• Adoption pending in 12 states.
AK, ID, KY, MD, NE, NJ, OH, RI, SD, VT, WV, WY
A L L E N B A I L E Y & A S S O C I A T E S, I N C.
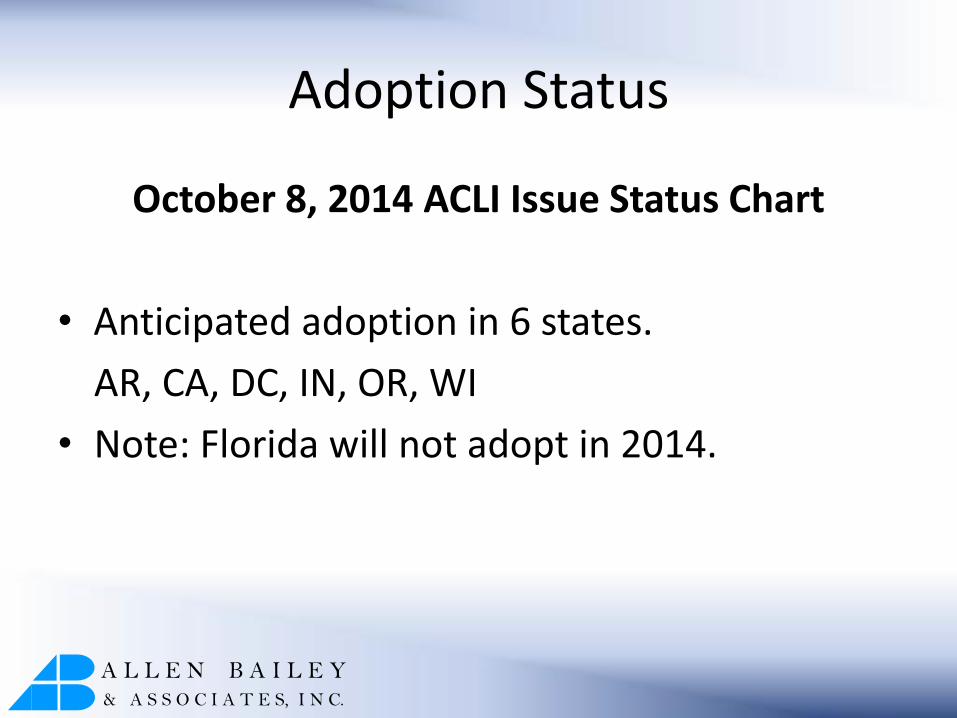
Adoption Status
October 8, 2014 ACLI Issue Status Chart
• Anticipated adoption in 6 states.
AR, CA, DC, IN, OR, WI
• Note: Florida will not adopt in 2014.

A L L E N B A I L E Y & A S S O C I A T E S, I N C.
2012 IAR Table
• 2012 IAM Basic Table Derived from experience data and trended to 2012.
• 2012 IAM Period Table 2012 IAM Basic Table with valuation loads (10%). Grades into Basic Table at end of table.
• Projection Scale G2 Improvement rates vary by gender and attained age. Max. 1.5% for males and 1.3% for females.
• Age Nearest Birthday

A L L E N B A I L E Y & A S S O C I A T E S, I N C.
2012 IAR
Interesting Observation
• 2012 IAM Basic Table: male mortality rates decrease between ages 33 and 36.
• 2012 IAM Period Table: male mortality rates are level between ages 33 and 38 to avoid decreasing rates.

A L L E N B A I L E Y & A S S O C I A T E S, I N C.
2012 IAR
2012 IAR Table
Generational table computed based on a combination of the 2012 IAM Period Table and Projection Scale G2, subject to specific rounding rules.
=2012 IAR Table mortality rate for a person age x in year 2012 + n
=2012 IAM Period Table mortality rate for a person age x
=Projection Scale G2 improvement rate for a person age x
nxx
n
x Gqq 2120122012
n
xq 2012
2012
xq
xG2
A L L E N B A I L E Y & A S S O C I A T E S, I N C.
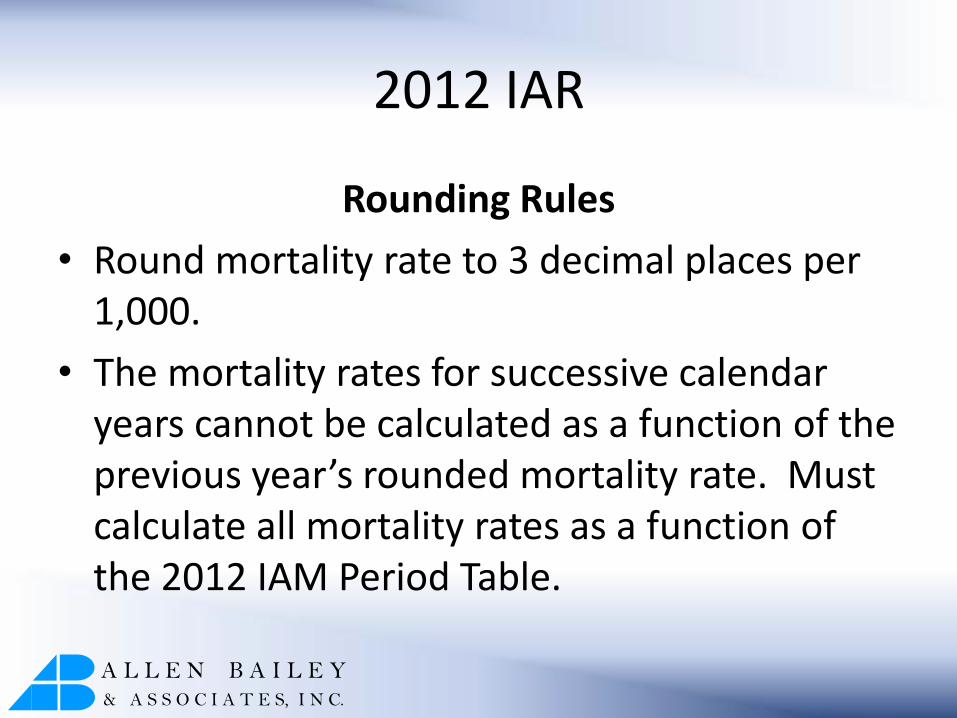
2012 IAR
Rounding Rules
• Round mortality rate to 3 decimal places per 1,000.
• The mortality rates for successive calendar years cannot be calculated as a function of the previous year’s rounded mortality rate. Must calculate all mortality rates as a function of the 2012 IAM Period Table.
A L L E N B A I L E Y & A S S O C I A T E S, I N C.
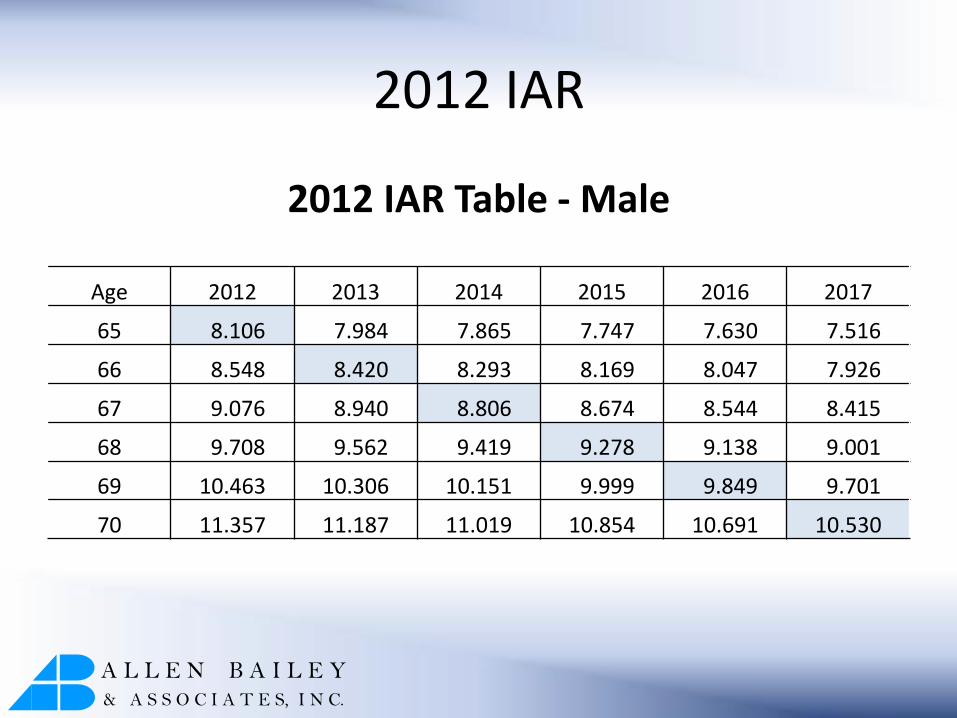
2012 IAR
2012 IAR Table - Male
Age 2012 2013 2014 2015 2016 2017
65 8.106 7.984 7.865 7.747 7.630 7.516
66 8.548 8.420 8.293 8.169 8.047 7.926
67 9.076 8.940 8.806 8.674 8.544 8.415
68 9.708 9.562 9.419 9.278 9.138 9.001
69 10.463 10.306 10.151 9.999 9.849 9.701
70 11.357 11.187 11.019 10.854 10.691 10.530
A L L E N B A I L E Y & A S S O C I A T E S, I N C.
Impact on Reserves
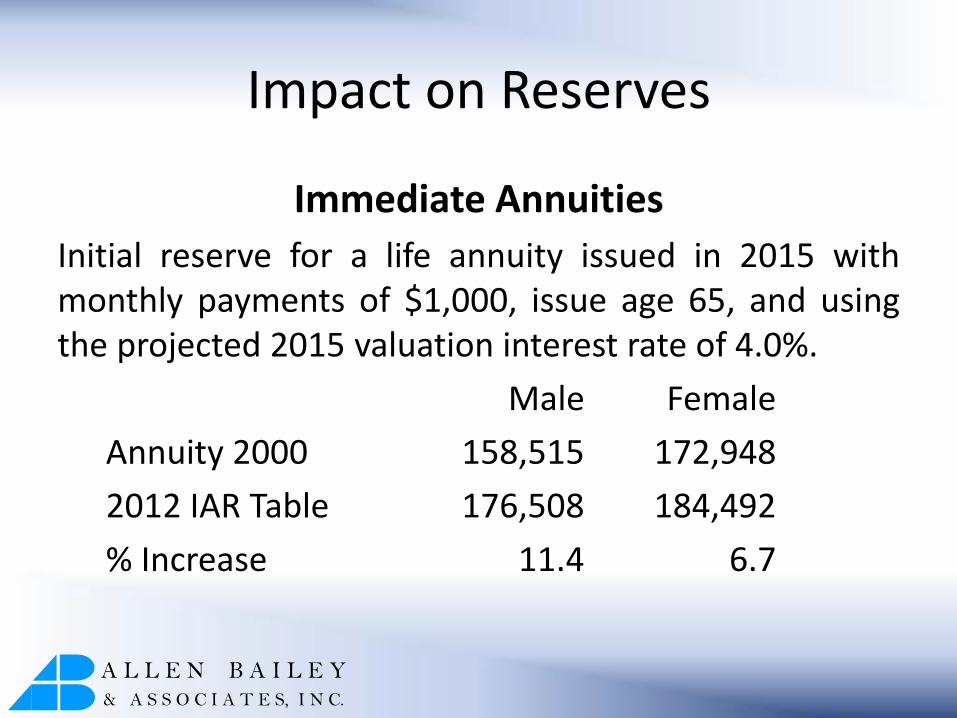
Immediate Annuities
Initial reserve for a life annuity issued in 2015 with monthly payments of $1,000, issue age 65, and using the projected 2015 valuation interest rate of 4.0%.
Male Female
Annuity 2000 158,515 172,948
2012 IAR Table 176,508 184,492
% Increase 11.4 6.7
A L L E N B A I L E Y & A S S O C I A T E S, I N C.
Impact on Reserves
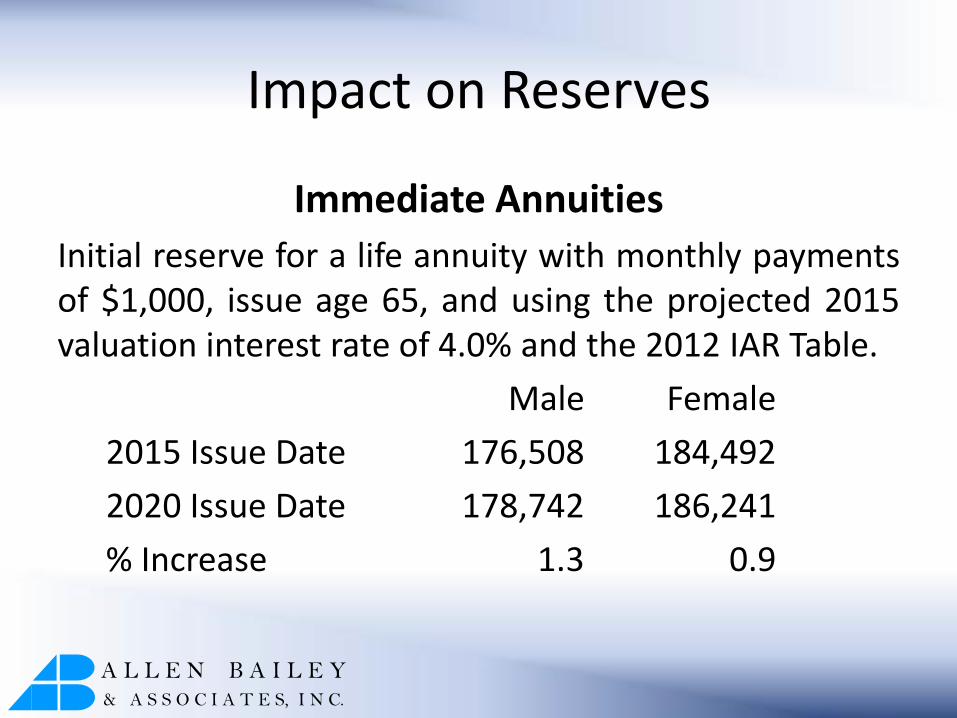
Immediate Annuities
Initial reserve for a life annuity with monthly payments of $1,000, issue age 65, and using the projected 2015 valuation interest rate of 4.0% and the 2012 IAR Table.
Male Female
2015 Issue Date 176,508 184,492
2020 Issue Date 178,742 186,241
% Increase 1.3 0.9
A L L E N B A I L E Y & A S S O C I A T E S, I N C.
Impact on Reserves
Fixed Deferred Annuities
Minimal impact on reserves for deferred annuities.
• Decrease present value of death benefits.
• Increase present value of future withdrawal and annuity benefits.

A L L E N B A I L E Y & A S S O C I A T E S, I N C.
Action Items
• Update valuation systems (deferred and immediate annuities).
• Review immediate annuity pricing – impact of increased reserves and adequacy of expected mortality basis.
• Update settlement option basis in annuity contracts.
• Update settlement option basis in life contracts.

A L L E N B A I L E Y & A S S O C I A T E S, I N C.
Settlement Option Basis
• Guaranteed settlement rate depends on age of annuitant and calendar year of settlement.
• Requires a change in the presentation of guaranteed settlement rate.
1) Remove settlement rates altogether and replace with a statement that values will be quoted upon request.
2) Provide a table of settlement factors based on the age of the annuitant named in the contract.
A L L E N B A I L E Y & A S S O C I A T E S, I N C.
Experience Studies
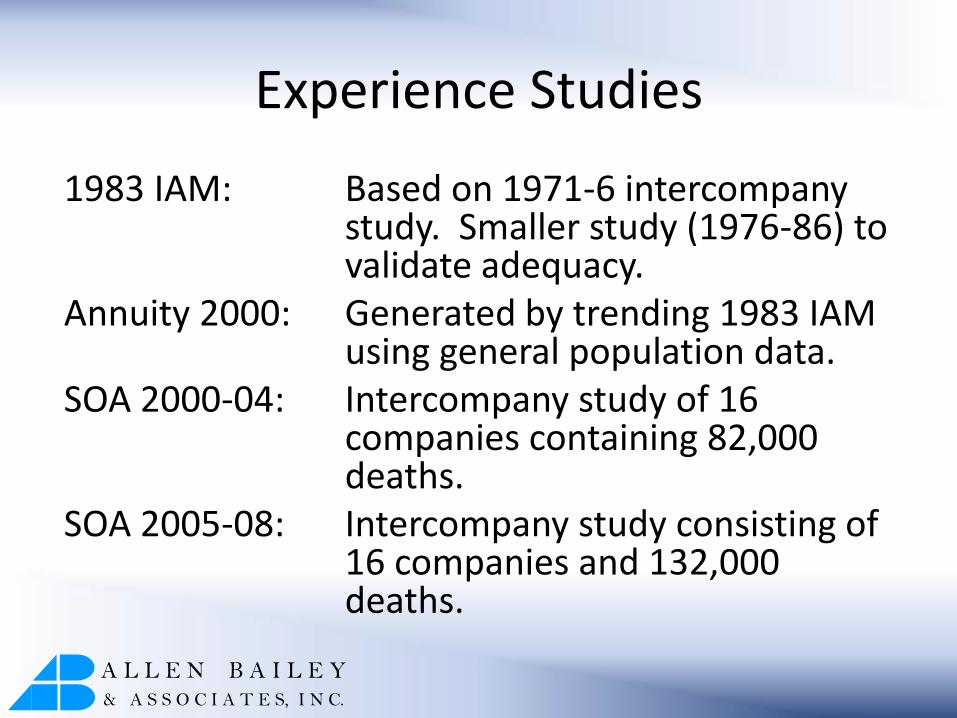
1983 IAM: Based on 1971-6 intercompany study. Smaller study (1976-86) to validate adequacy.
Annuity 2000: Generated by trending 1983 IAM using general population data.
SOA 2000-04: Intercompany study of 16 companies containing 82,000 deaths.
SOA 2005-08: Intercompany study consisting of 16 companies and 132,000 deaths.
A L L E N B A I L E Y & A S S O C I A T E S, I N C.
Experience Studies
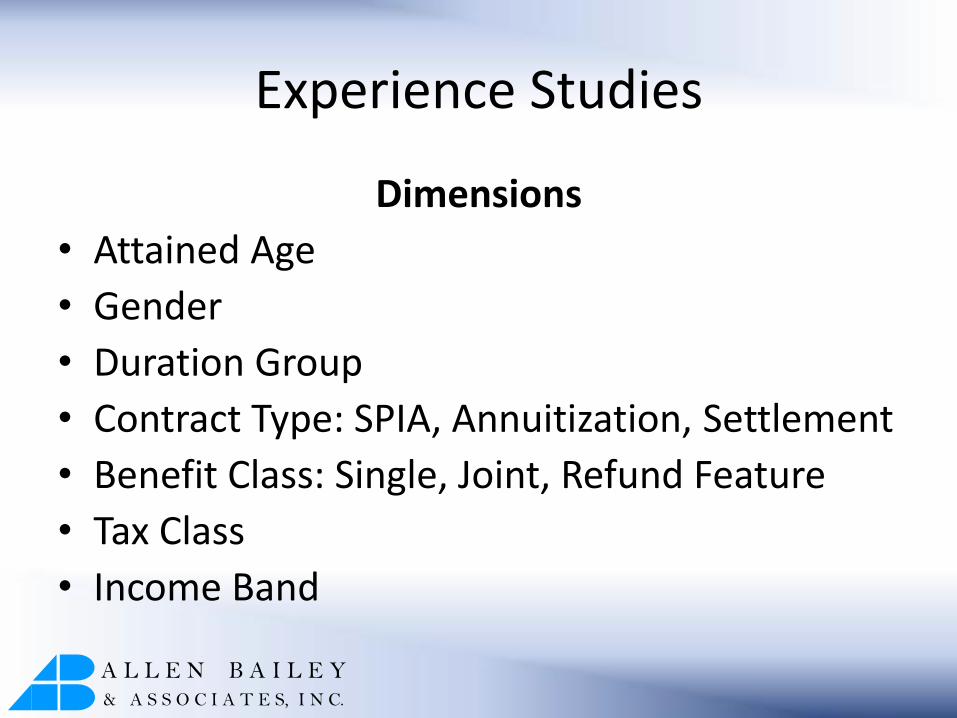
Dimensions
• Attained Age
• Gender
• Duration Group
• Contract Type: SPIA, Annuitization, Settlement
• Benefit Class: Single, Joint, Refund Feature
• Tax Class
• Income Band
A L L E N B A I L E Y & A S S O C I A T E S, I N C.
Experience Studies
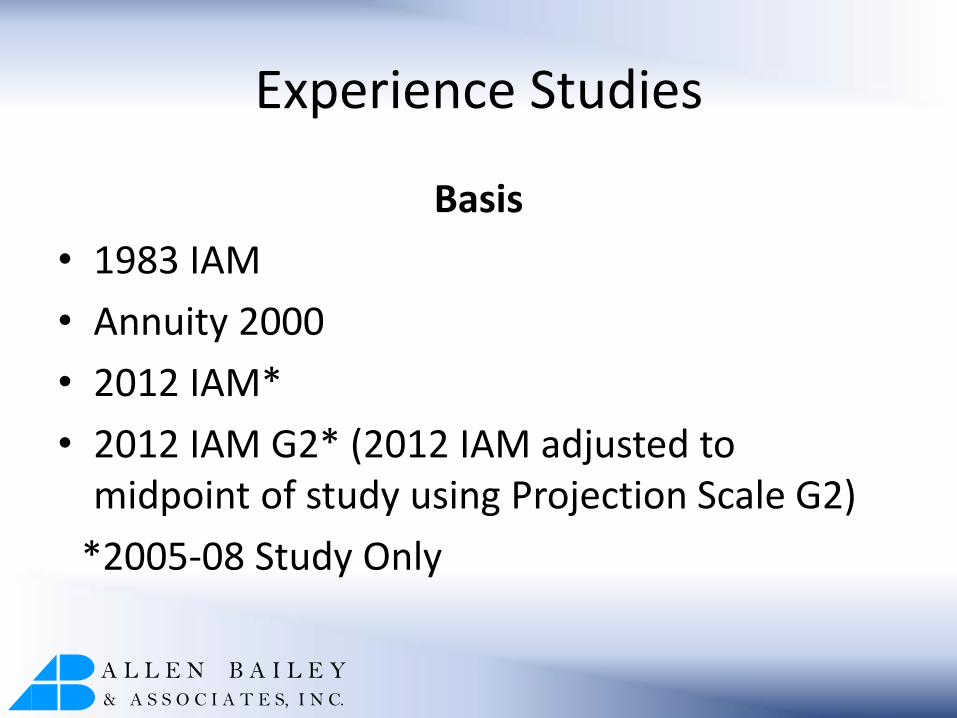
Basis
• 1983 IAM
• Annuity 2000
• 2012 IAM*
• 2012 IAM G2* (2012 IAM adjusted to midpoint of study using Projection Scale G2)
*2005-08 Study Only
A L L E N B A I L E Y & A S S O C I A T E S, I N C.
Experience Studies
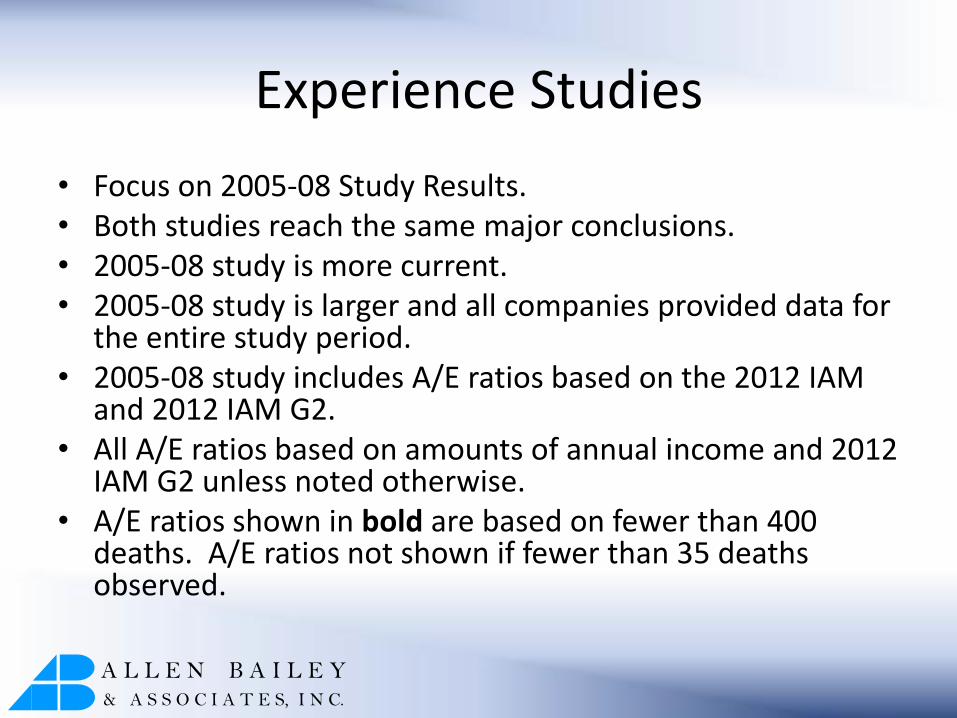
• Focus on 2005-08 Study Results. • Both studies reach the same major conclusions. • 2005-08 study is more current. • 2005-08 study is larger and all companies provided data for
the entire study period. • 2005-08 study includes A/E ratios based on the 2012 IAM
and 2012 IAM G2. • All A/E ratios based on amounts of annual income and 2012
IAM G2 unless noted otherwise. • A/E ratios shown in bold are based on fewer than 400
deaths. A/E ratios not shown if fewer than 35 deaths observed.
A L L E N B A I L E Y & A S S O C I A T E S, I N C.
Experience Studies
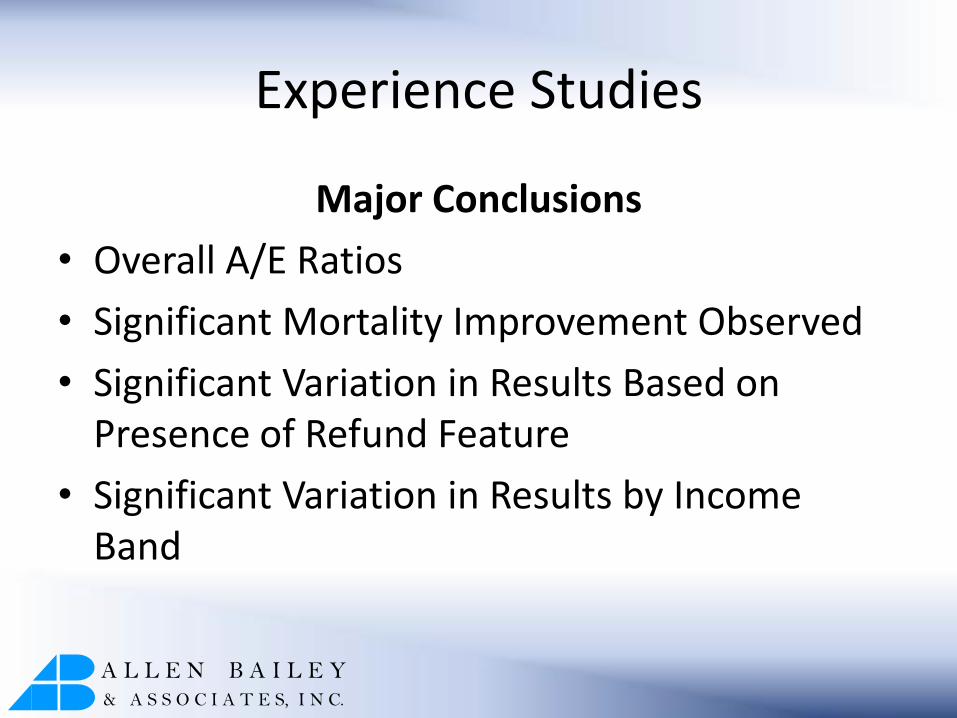
Major Conclusions
• Overall A/E Ratios
• Significant Mortality Improvement Observed
• Significant Variation in Results Based on Presence of Refund Feature
• Significant Variation in Results by Income Band

A L L E N B A I L E Y & A S S O C I A T E S, I N C.
Experience Studies
Overall A/E Ratios
• 2012 IAM G2: 1.046 (M) 1.040 (F)
• Annuity 2000: 0.895 (M) 0.932 (F)
• 1983 IAM: 0.726 (M) 0.825 (F)

A L L E N B A I L E Y & A S S O C I A T E S, I N C.
Experience Studies
Mortality Improvement
• Significant improvement observed in both studies.
• Annual improvement rate between 1983 and midpoint of 2005-08 (refund/non-refund):
• 1.35% to 1.58% for males
• 0.82% to 1.15% for females
A L L E N B A I L E Y & A S S O C I A T E S, I N C.
Experience Studies
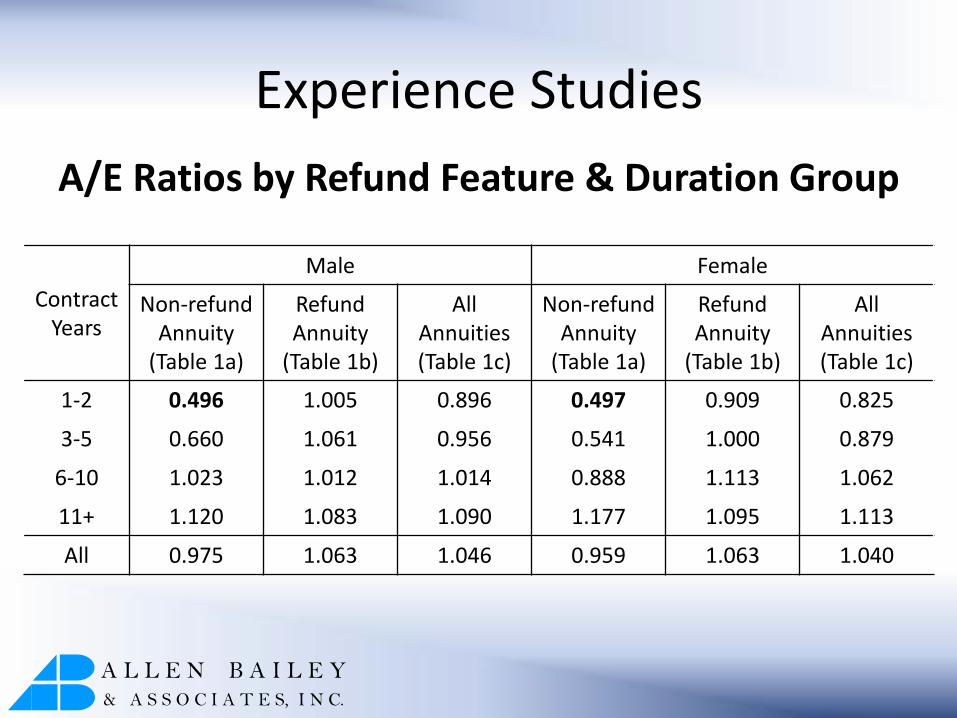
A/E Ratios by Refund Feature & Duration Group
Contract Years
Male Female
Non-refund Annuity
(Table 1a)
Refund Annuity
(Table 1b)
All Annuities (Table 1c)
Non-refund Annuity
(Table 1a)
Refund Annuity
(Table 1b)
All Annuities (Table 1c)
1-2 0.496 1.005 0.896 0.497 0.909 0.825
3-5 0.660 1.061 0.956 0.541 1.000 0.879
6-10 1.023 1.012 1.014 0.888 1.113 1.062
11+ 1.120 1.083 1.090 1.177 1.095 1.113
All 0.975 1.063 1.046 0.959 1.063 1.040

A L L E N B A I L E Y & A S S O C I A T E S, I N C.
Experience Studies A/E Ratios by Income Band (Table 2a)
Income Band Non-refund Annuities Refund Annuities
Male Female Male Female
<$2,500 1.240 1.203 1.217 1.152
$2,500 to $4,999 1.122 1.173 1.156 1.067
$5,000 to $7,499 1.081 1.097 1.124 1.059
$7,500 to $9,999 1.043 1.020 1.115 1.024
$10,000 to $14,999 1.053 1.036 1.060 1.041
$15,000 to $24,999 0.958 0.878 0.991 1.023
$25,000 to $49,999 0.931 0.746 0.907 0.991
≥$50,000 0.597 0.935 1.112
All 0.975 0.959 1.063 1.063