Embed Size (px)
Citation preview
Answer_MTP_Final_Syllabus 2016_Dec2017_Set 2
Academics Department, The Institute of Cost Accountants of India (Statutory Body under an Act of Parliament) Page 1
Paper 15 – Strategic Cost Management and Decision Making
Answer_MTP_Final_Syllabus 2016_Dec2017_Set 2
Academics Department, The Institute of Cost Accountants of India (Statutory Body under an Act of Parliament) Page 2
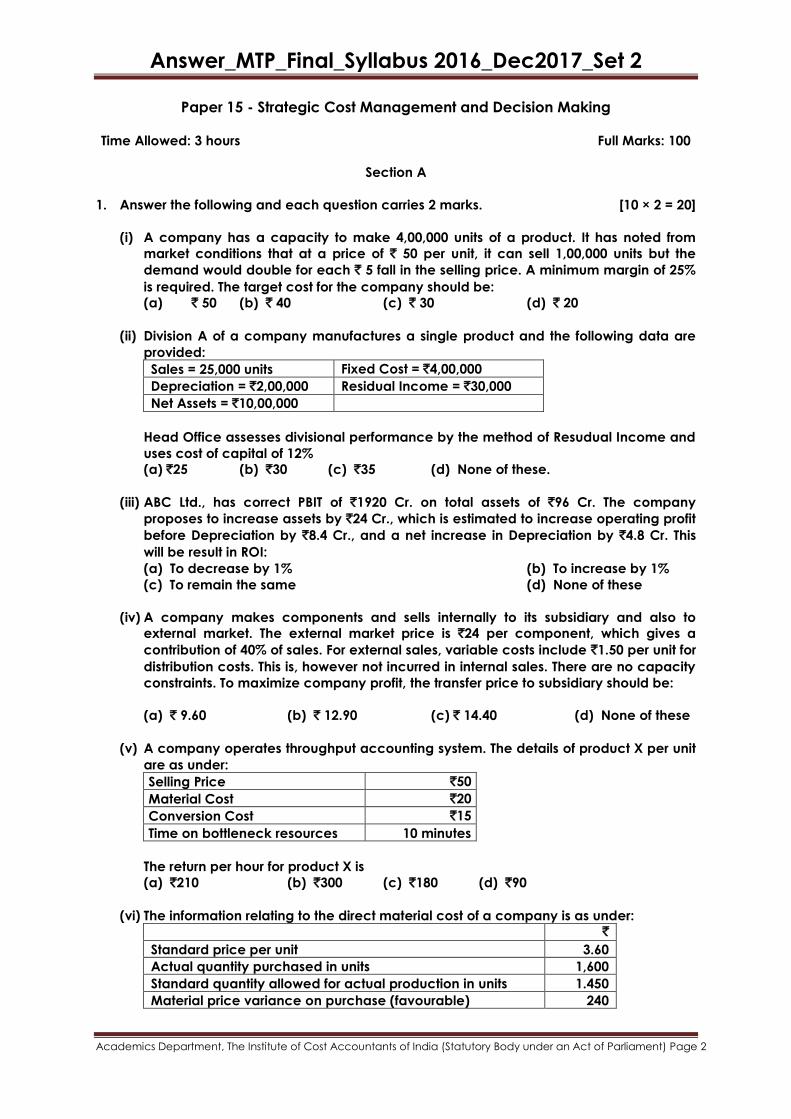
Paper 15 - Strategic Cost Management and Decision Making
Time Allowed: 3 hours Full Marks: 100
Section A
1. Answer the following and each question carries 2 marks. [10 × 2 = 20]
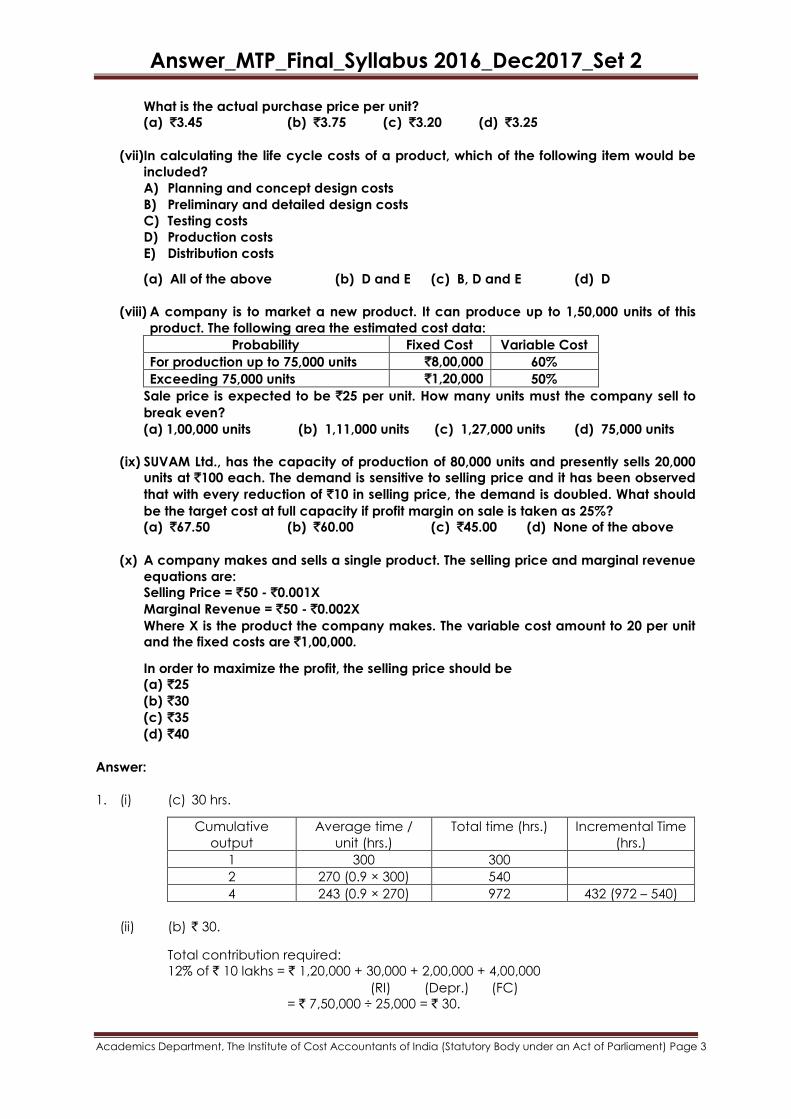
(i) A company has a capacity to make 4,00,000 units of a product. It has noted from
market conditions that at a price of ` 50 per unit, it can sell 1,00,000 units but the
demand would double for each ` 5 fall in the selling price. A minimum margin of 25%
is required. The target cost for the company should be:
(a) ` 50 (b) ` 40 (c) ` 30 (d) ` 20
(ii) Division A of a company manufactures a single product and the following data are
provided:
Sales = 25,000 units Fixed Cost = `4,00,000
Depreciation = `2,00,000 Residual Income = `30,000
Net Assets = `10,00,000
Head Office assesses divisional performance by the method of Resudual Income and
uses cost of capital of 12%
(a) `25 (b) `30 (c) `35 (d) None of these.
(iii) ABC Ltd., has correct PBIT of `1920 Cr. on total assets of `96 Cr. The company
proposes to increase assets by `24 Cr., which is estimated to increase operating profit
before Depreciation by `8.4 Cr., and a net increase in Depreciation by `4.8 Cr. This
will be result in ROI:
(a) To decrease by 1% (b) To increase by 1%
(c) To remain the same (d) None of these
(iv) A company makes components and sells internally to its subsidiary and also to
external market. The external market price is `24 per component, which gives a
contribution of 40% of sales. For external sales, variable costs include `1.50 per unit for
distribution costs. This is, however not incurred in internal sales. There are no capacity
constraints. To maximize company profit, the transfer price to subsidiary should be:
(a) ` 9.60 (b) ` 12.90 (c) ` 14.40 (d) None of these
(v) A company operates throughput accounting system. The details of product X per unit
are as under:
Selling Price `50
Material Cost `20
Conversion Cost `15
Time on bottleneck resources 10 minutes
The return per hour for product X is
(a) `210 (b) `300 (c) `180 (d) `90
(vi) The information relating to the direct material cost of a company is as under:
`
Standard price per unit 3.60
Actual quantity purchased in units 1,600
Standard quantity allowed for actual production in units 1.450
Material price variance on purchase (favourable) 240
Answer_MTP_Final_Syllabus 2016_Dec2017_Set 2
Academics Department, The Institute of Cost Accountants of India (Statutory Body under an Act of Parliament) Page 3
What is the actual purchase price per unit?
(a) `3.45 (b) `3.75 (c) `3.20 (d) `3.25
(vii)In calculating the life cycle costs of a product, which of the following item would be
included?
A) Planning and concept design costs
B) Preliminary and detailed design costs
C) Testing costs
D) Production costs
E) Distribution costs
(a) All of the above (b) D and E (c) B, D and E (d) D
(viii) A company is to market a new product. It can produce up to 1,50,000 units of this
product. The following area the estimated cost data:
Probability Fixed Cost Variable Cost
For production up to 75,000 units `8,00,000 60%
Exceeding 75,000 units `1,20,000 50%
Sale price is expected to be `25 per unit. How many units must the company sell to
break even?
(a) 1,00,000 units (b) 1,11,000 units (c) 1,27,000 units (d) 75,000 units
(ix) SUVAM Ltd., has the capacity of production of 80,000 units and presently sells 20,000
units at `100 each. The demand is sensitive to selling price and it has been observed
that with every reduction of `10 in selling price, the demand is doubled. What should
be the target cost at full capacity if profit margin on sale is taken as 25%?
(a) `67.50 (b) `60.00 (c) `45.00 (d) None of the above
(x) A company makes and sells a single product. The selling price and marginal revenue
equations are:
Selling Price = `50 - `0.001X
Marginal Revenue = `50 - `0.002X
Where X is the product the company makes. The variable cost amount to 20 per unit
and the fixed costs are `1,00,000.
In order to maximize the profit, the selling price should be
(a) `25
(b) `30
(c) `35
(d) `40
Answer:
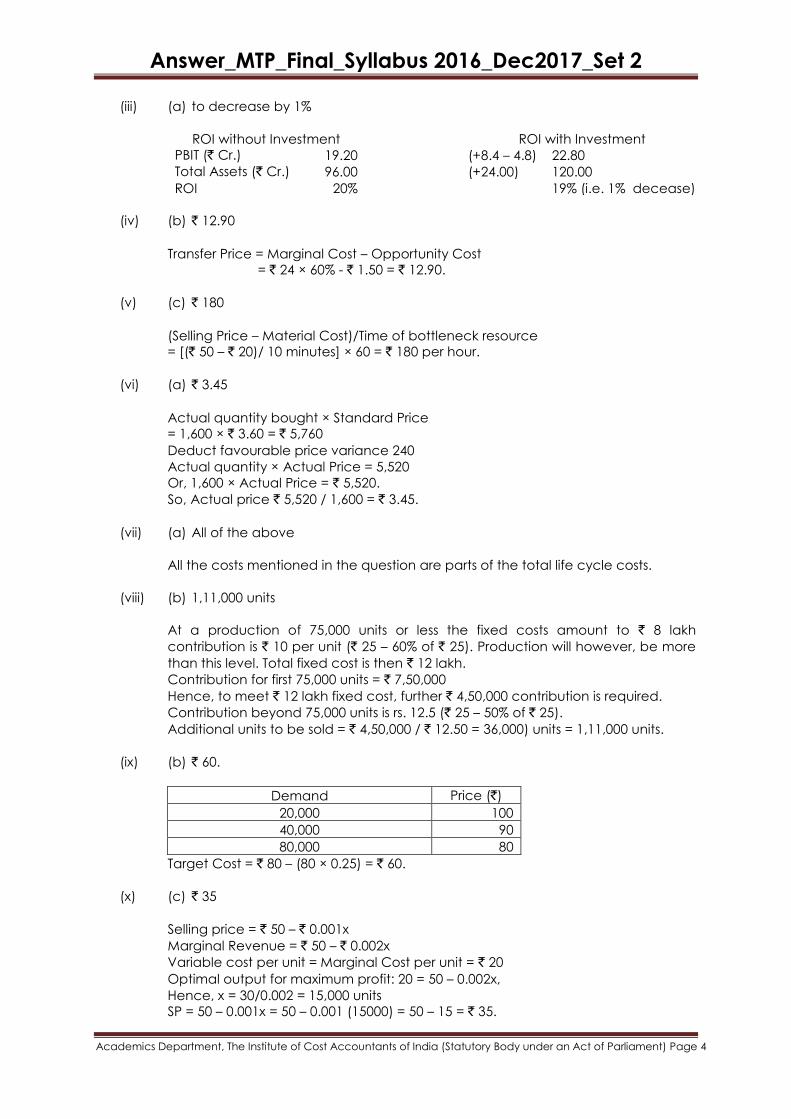
1. (i) (c) 30 hrs.
Cumulative
output
Average time /
unit (hrs.)
Total time (hrs.) Incremental Time
(hrs.)
1 300 300
2 270 (0.9 × 300) 540
4 243 (0.9 × 270) 972 432 (972 – 540)
(ii) (b) ` 30.
Total contribution required:
12% of ` 10 lakhs = ` 1,20,000 + 30,000 + 2,00,000 + 4,00,000
(RI) (Depr.) (FC)
= ` 7,50,000 ÷ 25,000 = ` 30.
Answer_MTP_Final_Syllabus 2016_Dec2017_Set 2
Academics Department, The Institute of Cost Accountants of India (Statutory Body under an Act of Parliament) Page 4
(iii) (a) to decrease by 1%
ROI without Investment ROI with Investment
PBIT (` Cr.) 19.20 (+8.4 – 4.8) 22.80
Total Assets (` Cr.) 96.00 (+24.00) 120.00
ROI 20% 19% (i.e. 1% decease)
(iv) (b) ` 12.90
Transfer Price = Marginal Cost – Opportunity Cost
= ` 24 × 60% - ` 1.50 = ` 12.90.
(v) (c) ` 180
(Selling Price – Material Cost)/Time of bottleneck resource
= [(` 50 – ` 20)/ 10 minutes] × 60 = ` 180 per hour.
(vi) (a) ` 3.45
Actual quantity bought × Standard Price
= 1,600 × ` 3.60 = ` 5,760
Deduct favourable price variance 240
Actual quantity × Actual Price = 5,520
Or, 1,600 × Actual Price = ` 5,520.
So, Actual price ` 5,520 / 1,600 = ` 3.45.
(vii) (a) All of the above
All the costs mentioned in the question are parts of the total life cycle costs.
(viii) (b) 1,11,000 units
At a production of 75,000 units or less the fixed costs amount to ` 8 lakh
contribution is ` 10 per unit (` 25 – 60% of ` 25). Production will however, be more
than this level. Total fixed cost is then ` 12 lakh.
Contribution for first 75,000 units = ` 7,50,000
Hence, to meet ` 12 lakh fixed cost, further ` 4,50,000 contribution is required.
Contribution beyond 75,000 units is rs. 12.5 (` 25 – 50% of ` 25).
Additional units to be sold = ` 4,50,000 / ` 12.50 = 36,000) units = 1,11,000 units.
(ix) (b) ` 60.
Demand Price (`)
20,000 100
40,000 90
80,000 80
Target Cost = ` 80 – (80 × 0.25) = ` 60.
(x) (c) ` 35
Selling price = ` 50 – ` 0.001x
Marginal Revenue = ` 50 – ` 0.002x
Variable cost per unit = Marginal Cost per unit = ` 20
Optimal output for maximum profit: 20 = 50 – 0.002x,
Hence, x = 30/0.002 = 15,000 units
SP = 50 – 0.001x = 50 – 0.001 (15000) = 50 – 15 = ` 35.
Answer_MTP_Final_Syllabus 2016_Dec2017_Set 2
Academics Department, The Institute of Cost Accountants of India (Statutory Body under an Act of Parliament) Page 5
Section B
Answer any five questions from Question No. 2 to 8
Each question carries 16 marks. [5 x 16 = 80]
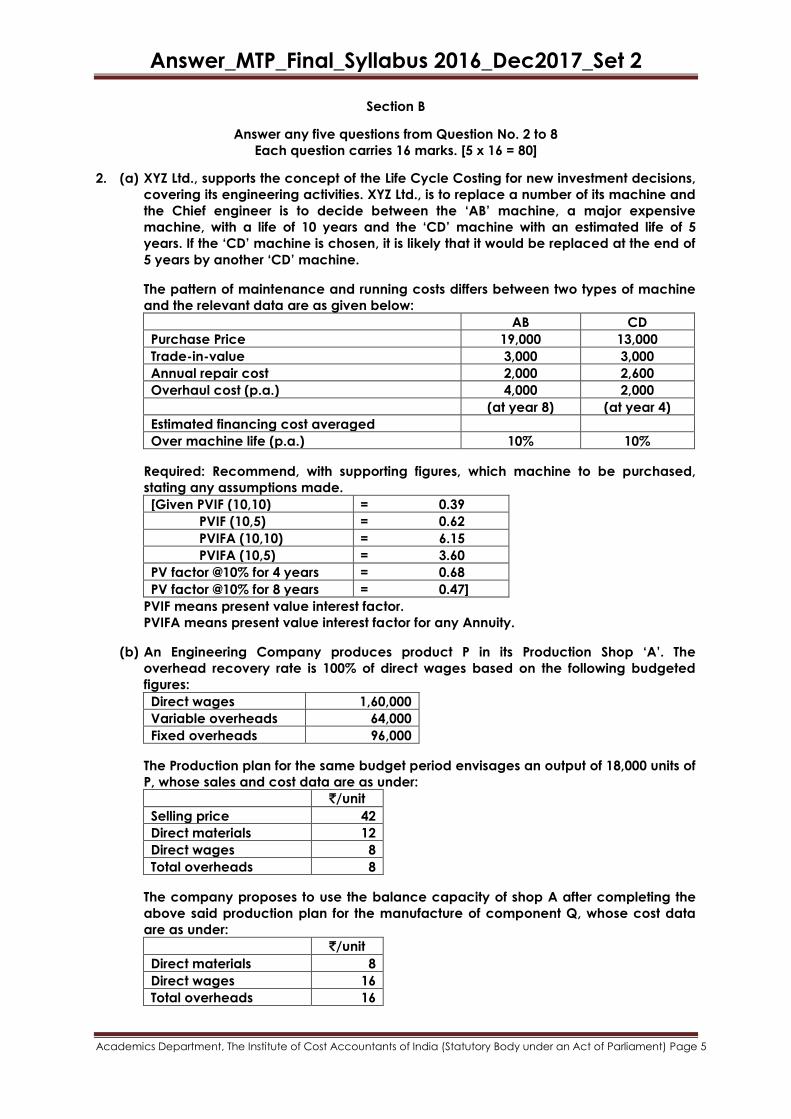
2. (a) XYZ Ltd., supports the concept of the Life Cycle Costing for new investment decisions,
covering its engineering activities. XYZ Ltd., is to replace a number of its machine and
the Chief engineer is to decide between the ‘AB’ machine, a major expensive
machine, with a life of 10 years and the ‘CD’ machine with an estimated life of 5
years. If the ‘CD’ machine is chosen, it is likely that it would be replaced at the end of
5 years by another ‘CD’ machine.
The pattern of maintenance and running costs differs between two types of machine
and the relevant data are as given below:
AB CD
Purchase Price 19,000 13,000
Trade-in-value 3,000 3,000
Annual repair cost 2,000 2,600
Overhaul cost (p.a.) 4,000 2,000
(at year 8) (at year 4)
Estimated financing cost averaged
Over machine life (p.a.) 10% 10%
Required: Recommend, with supporting figures, which machine to be purchased,
stating any assumptions made.
[Given PVIF (10,10) = 0.39
PVIF (10,5) = 0.62
PVIFA (10,10) = 6.15
PVIFA (10,5) = 3.60
PV factor @10% for 4 years = 0.68
PV factor @10% for 8 years = 0.47]
PVIF means present value interest factor.
PVIFA means present value interest factor for any Annuity.
(b) An Engineering Company produces product P in its Production Shop ‘A’. The
overhead recovery rate is 100% of direct wages based on the following budgeted
figures:
Direct wages 1,60,000
Variable overheads 64,000
Fixed overheads 96,000
The Production plan for the same budget period envisages an output of 18,000 units of
P, whose sales and cost data are as under:
`/unit
Selling price 42
Direct materials 12
Direct wages 8
Total overheads 8
The company proposes to use the balance capacity of shop A after completing the
above said production plan for the manufacture of component Q, whose cost data
are as under:
`/unit
Direct materials 8
Direct wages 16
Total overheads 16
Answer_MTP_Final_Syllabus 2016_Dec2017_Set 2
Academics Department, The Institute of Cost Accountants of India (Statutory Body under an Act of Parliament) Page 6
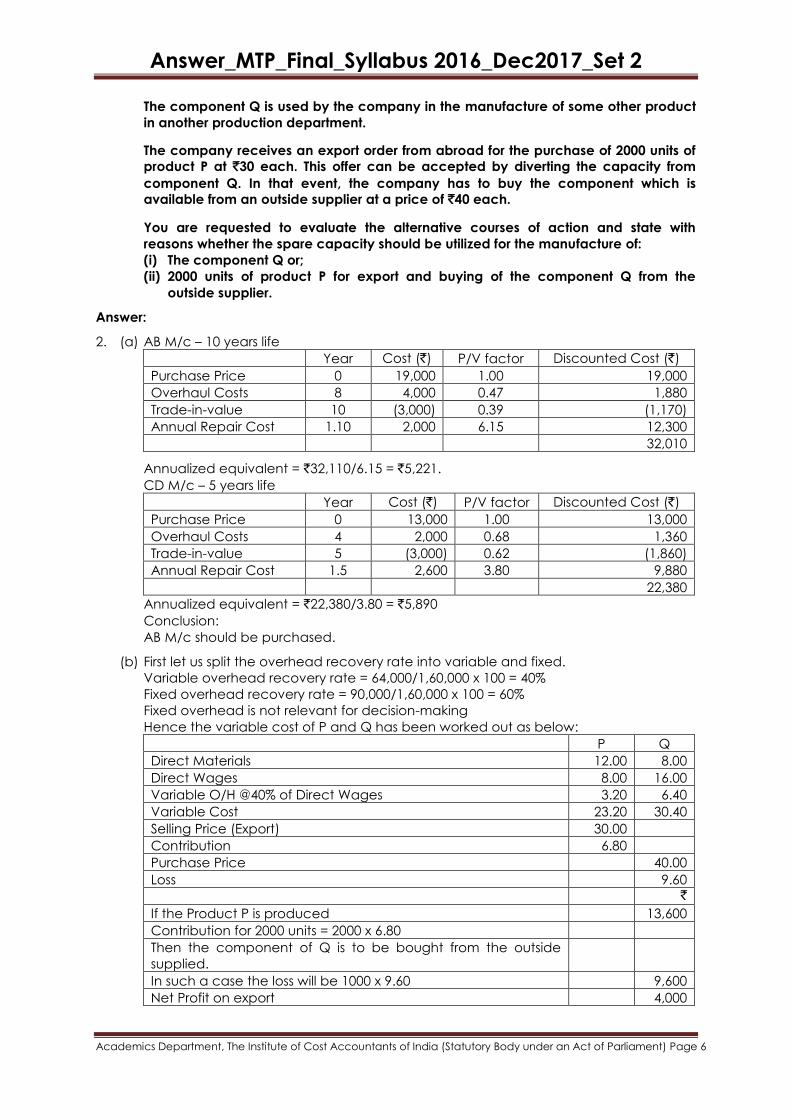
The component Q is used by the company in the manufacture of some other product
in another production department.
The company receives an export order from abroad for the purchase of 2000 units of
product P at `30 each. This offer can be accepted by diverting the capacity from
component Q. In that event, the company has to buy the component which is
available from an outside supplier at a price of `40 each.
You are requested to evaluate the alternative courses of action and state with
reasons whether the spare capacity should be utilized for the manufacture of:
(i) The component Q or;
(ii) 2000 units of product P for export and buying of the component Q from the
outside supplier.
Answer:
2. (a) AB M/c – 10 years life
Year Cost (`) P/V factor Discounted Cost (`)
Purchase Price 0 19,000 1.00 19,000
Overhaul Costs 8 4,000 0.47 1,880
Trade-in-value 10 (3,000) 0.39 (1,170)
Annual Repair Cost 1.10 2,000 6.15 12,300
32,010
Annualized equivalent = `32,110/6.15 = `5,221.
CD M/c – 5 years life
Year Cost (`) P/V factor Discounted Cost (`)
Purchase Price 0 13,000 1.00 13,000
Overhaul Costs 4 2,000 0.68 1,360
Trade-in-value 5 (3,000) 0.62 (1,860)
Annual Repair Cost 1.5 2,600 3.80 9,880
22,380
Annualized equivalent = `22,380/3.80 = `5,890
Conclusion:
AB M/c should be purchased.
(b) First let us split the overhead recovery rate into variable and fixed.
Variable overhead recovery rate = 64,000/1,60,000 x 100 = 40%
Fixed overhead recovery rate = 90,000/1,60,000 x 100 = 60%
Fixed overhead is not relevant for decision-making
Hence the variable cost of P and Q has been worked out as below:
P Q
Direct Materials 12.00 8.00
Direct Wages 8.00 16.00
Variable O/H @40% of Direct Wages 3.20 6.40
Variable Cost 23.20 30.40
Selling Price (Export) 30.00
Contribution 6.80
Purchase Price 40.00
Loss 9.60
`
If the Product P is produced 13,600
Contribution for 2000 units = 2000 x 6.80
Then the component of Q is to be bought from the outside
supplied.
In such a case the loss will be 1000 x 9.60 9,600
Net Profit on export 4,000
Answer_MTP_Final_Syllabus 2016_Dec2017_Set 2
Academics Department, The Institute of Cost Accountants of India (Statutory Body under an Act of Parliament) Page 7
Spare Capacity should be utilized for export of 2000 units of P. 1000 units of Q may be
bought from outside supplier. Then the net profit on export would be `4,000.
Direct wages ` / unit
P 8
Q 16
Hence for 1000 units of Q capacity, 2000 units of P can be manufactured.
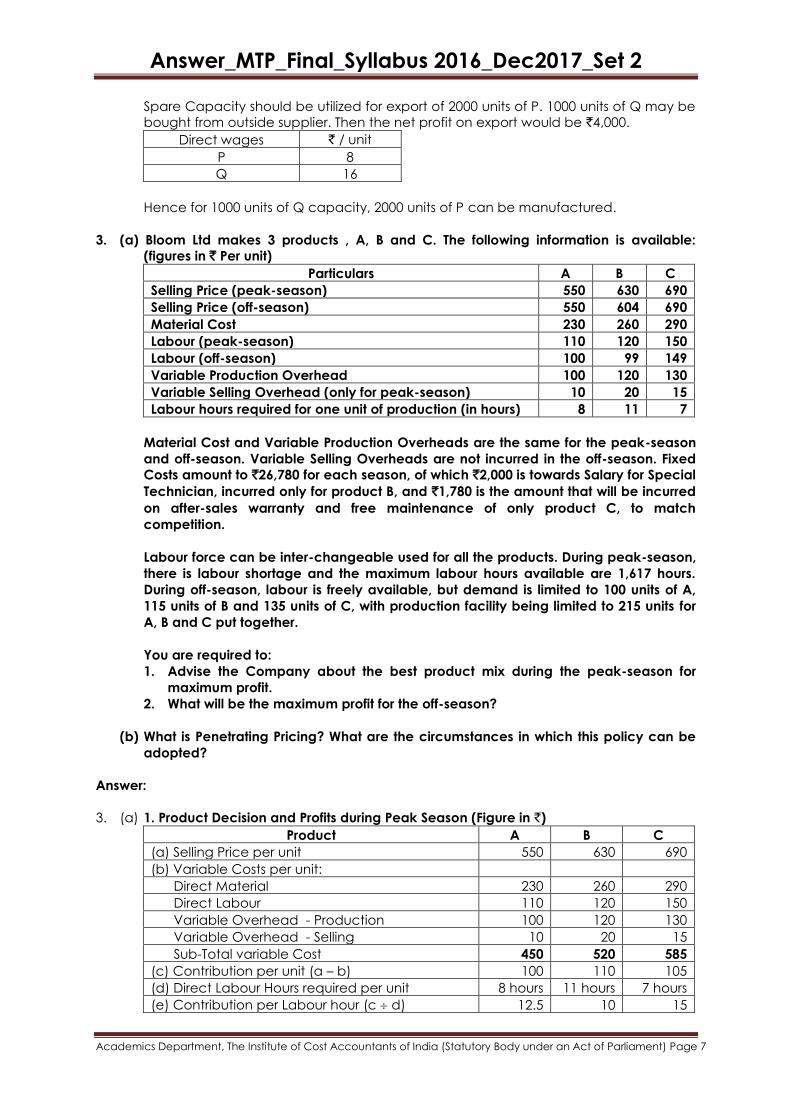
3. (a) Bloom Ltd makes 3 products , A, B and C. The following information is available:
(figures in ` Per unit)
Particulars A B C
Selling Price (peak-season) 550 630 690
Selling Price (off-season) 550 604 690
Material Cost 230 260 290
Labour (peak-season) 110 120 150
Labour (off-season) 100 99 149
Variable Production Overhead 100 120 130
Variable Selling Overhead (only for peak-season) 10 20 15
Labour hours required for one unit of production (in hours) 8 11 7
Material Cost and Variable Production Overheads are the same for the peak-season
and off-season. Variable Selling Overheads are not incurred in the off-season. Fixed
Costs amount to `26,780 for each season, of which `2,000 is towards Salary for Special
Technician, incurred only for product B, and `1,780 is the amount that will be incurred
on after-sales warranty and free maintenance of only product C, to match
competition.
Labour force can be inter-changeable used for all the products. During peak-season,
there is labour shortage and the maximum labour hours available are 1,617 hours.
During off-season, labour is freely available, but demand is limited to 100 units of A,
115 units of B and 135 units of C, with production facility being limited to 215 units for
A, B and C put together.
You are required to:
1. Advise the Company about the best product mix during the peak-season for
maximum profit.
2. What will be the maximum profit for the off-season?
(b) What is Penetrating Pricing? What are the circumstances in which this policy can be
adopted?
Answer:
3. (a) 1. Product Decision and Profits during Peak Season (Figure in `)
Product A B C
(a) Selling Price per unit 550 630 690
(b) Variable Costs per unit:
Direct Material 230 260 290
Direct Labour 110 120 150
Variable Overhead - Production 100 120 130
Variable Overhead - Selling 10 20 15
Sub-Total variable Cost 450 520 585
(c) Contribution per unit (a – b) 100 110 105
(d) Direct Labour Hours required per unit 8 hours 11 hours 7 hours
(e) Contribution per Labour hour (c d) 12.5 10 15
Answer_MTP_Final_Syllabus 2016_Dec2017_Set 2
Academics Department, The Institute of Cost Accountants of India (Statutory Body under an Act of Parliament) Page 8
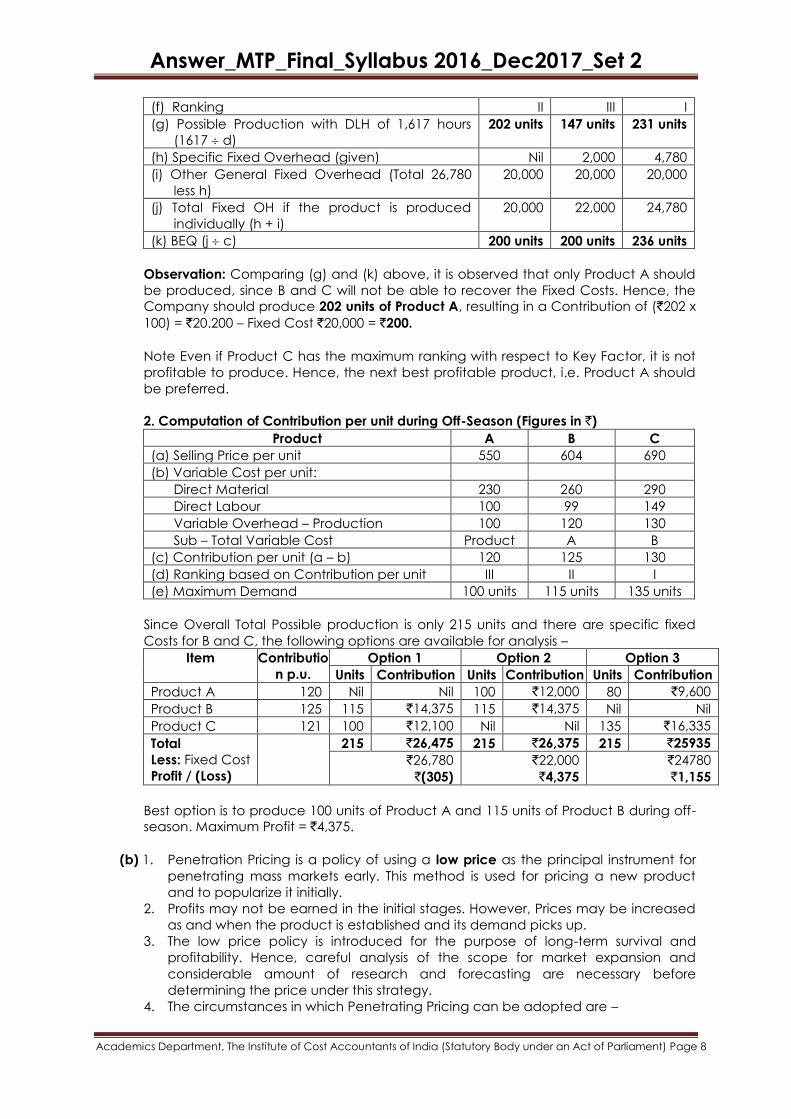
(f) Ranking II III I
(g) Possible Production with DLH of 1,617 hours
(1617 d)
202 units 147 units 231 units
(h) Specific Fixed Overhead (given) Nil 2,000 4,780
(i) Other General Fixed Overhead (Total 26,780
less h)
20,000 20,000 20,000
(j) Total Fixed OH if the product is produced
individually (h + i)
20,000 22,000 24,780
(k) BEQ (j c) 200 units 200 units 236 units
Observation: Comparing (g) and (k) above, it is observed that only Product A should
be produced, since B and C will not be able to recover the Fixed Costs. Hence, the
Company should produce 202 units of Product A, resulting in a Contribution of (`202 x
100) = `20.200 – Fixed Cost `20,000 = `200.
Note Even if Product C has the maximum ranking with respect to Key Factor, it is not
profitable to produce. Hence, the next best profitable product, i.e. Product A should
be preferred.
2. Computation of Contribution per unit during Off-Season (Figures in `)
Product A B C
(a) Selling Price per unit 550 604 690
(b) Variable Cost per unit:
Direct Material 230 260 290
Direct Labour 100 99 149
Variable Overhead – Production 100 120 130
Sub – Total Variable Cost Product A B
(c) Contribution per unit (a – b) 120 125 130
(d) Ranking based on Contribution per unit III II I
(e) Maximum Demand 100 units 115 units 135 units
Since Overall Total Possible production is only 215 units and there are specific fixed
Costs for B and C, the following options are available for analysis –
Item Contributio
n p.u.
Option 1 Option 2 Option 3
Units Contribution Units Contribution Units Contribution
Product A 120 Nil Nil 100 `12,000 80 `9,600
Product B 125 115 `14,375 115 `14,375 Nil Nil
Product C 121 100 `12,100 Nil Nil 135 `16,335
Total
Less: Fixed Cost
Profit / (Loss)
215 `26,475 215 `26,375 215 `25935
`26,780
`(305)
`22,000
`4,375
`24780
`1,155
Best option is to produce 100 units of Product A and 115 units of Product B during off-
season. Maximum Profit = `4,375.
(b) 1. Penetration Pricing is a policy of using a low price as the principal instrument for
penetrating mass markets early. This method is used for pricing a new product
and to popularize it initially.
2. Profits may not be earned in the initial stages. However, Prices may be increased
as and when the product is established and its demand picks up.
3. The low price policy is introduced for the purpose of long-term survival and
profitability. Hence, careful analysis of the scope for market expansion and
considerable amount of research and forecasting are necessary before
determining the price under this strategy.
4. The circumstances in which Penetrating Pricing can be adopted are –
Answer_MTP_Final_Syllabus 2016_Dec2017_Set 2
Academics Department, The Institute of Cost Accountants of India (Statutory Body under an Act of Parliament) Page 9
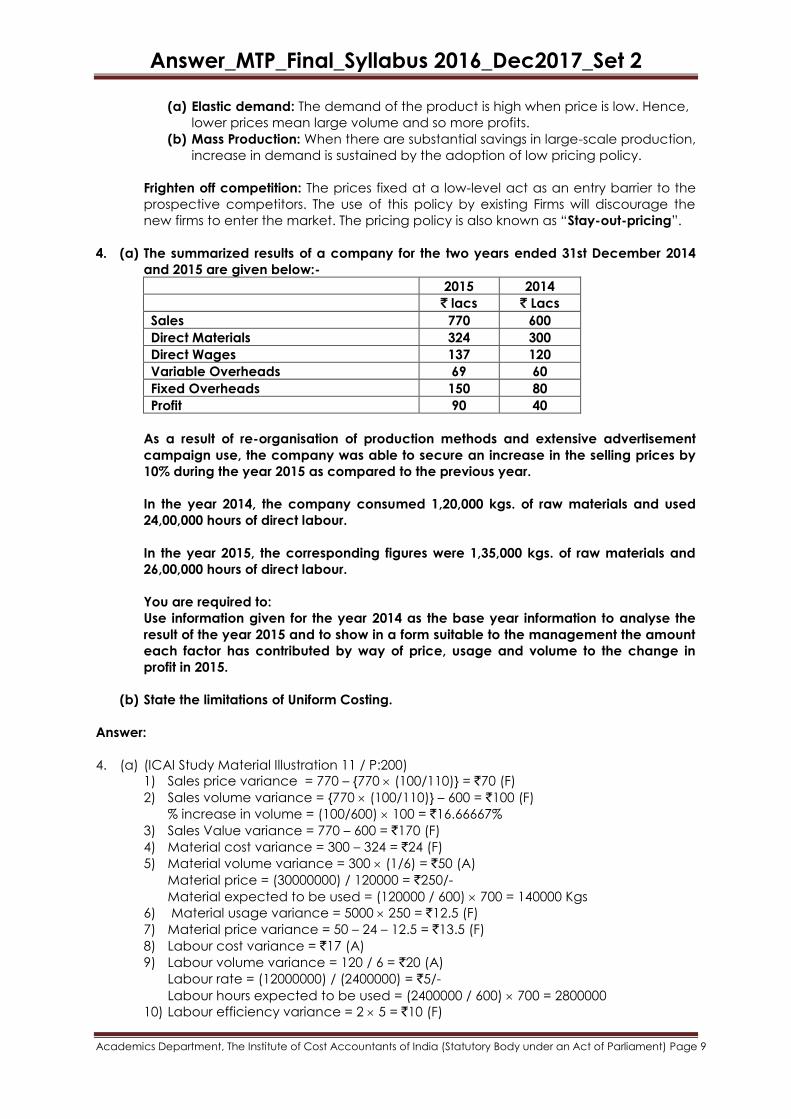
(a) Elastic demand: The demand of the product is high when price is low. Hence,
lower prices mean large volume and so more profits.
(b) Mass Production: When there are substantial savings in large-scale production,
increase in demand is sustained by the adoption of low pricing policy.
Frighten off competition: The prices fixed at a low-level act as an entry barrier to the
prospective competitors. The use of this policy by existing Firms will discourage the
new firms to enter the market. The pricing policy is also known as “Stay-out-pricing”.
4. (a) The summarized results of a company for the two years ended 31st December 2014
and 2015 are given below:-
2015 2014
` lacs ` Lacs
Sales 770 600
Direct Materials 324 300
Direct Wages 137 120
Variable Overheads 69 60
Fixed Overheads 150 80
Profit 90 40
As a result of re-organisation of production methods and extensive advertisement
campaign use, the company was able to secure an increase in the selling prices by
10% during the year 2015 as compared to the previous year.
In the year 2014, the company consumed 1,20,000 kgs. of raw materials and used
24,00,000 hours of direct labour.
In the year 2015, the corresponding figures were 1,35,000 kgs. of raw materials and
26,00,000 hours of direct labour.
You are required to:
Use information given for the year 2014 as the base year information to analyse the
result of the year 2015 and to show in a form suitable to the management the amount
each factor has contributed by way of price, usage and volume to the change in
profit in 2015.
(b) State the limitations of Uniform Costing.
Answer:
4. (a) (ICAI Study Material Illustration 11 / P:200)
1) Sales price variance = 770 – {770 (100/110)} = `70 (F)
2) Sales volume variance = {770 (100/110)} – 600 = `100 (F)
% increase in volume = (100/600) 100 = `16.66667%
3) Sales Value variance = 770 – 600 = `170 (F)
4) Material cost variance = 300 – 324 = `24 (F)
5) Material volume variance = 300 (1/6) = `50 (A)
Material price = (30000000) / 120000 = `250/-
Material expected to be used = (120000 / 600) 700 = 140000 Kgs
6) Material usage variance = 5000 250 = `12.5 (F)
7) Material price variance = 50 – 24 – 12.5 = `13.5 (F)
8) Labour cost variance = `17 (A)
9) Labour volume variance = 120 / 6 = `20 (A)
Labour rate = (12000000) / (2400000) = `5/-
Labour hours expected to be used = (2400000 / 600) 700 = 2800000
10) Labour efficiency variance = 2 5 = `10 (F)
Answer_MTP_Final_Syllabus 2016_Dec2017_Set 2
Academics Department, The Institute of Cost Accountants of India (Statutory Body under an Act of Parliament) Page 10
11) Labour rate variance = 20 – 17 – 10 = `7 (A)
12) VOH cost variance = `9 (A)
13) VOH volume variance = 60/6 = `10 (A)
14) VOH efficiency variance = 200000 2.5 = `5 (F)
15) VOH expenditure variance = 10 – 9 – 5= `4 (A)
16) FOH cost variance = `70 (A)
Profit reconciliation statement:
` In lakhs
Profit 40
(+) sales variance:
Price 70
Volume 100
Material variance:
Usage 12.50
Price 13.50
Labour variance-efficiency 10
VOH efficiency variance 5 211
251
(–) Material volume variance 50
Labour variance:
Volume 20
Rate 7
VOH variances:
Volume 10
Expenditure 4
FOH cost variance 70 161
Profit for 1988 90
(b) Limitations of Uniform Costing: (i) Uniform costing presumes the application of same principles and methods of
Costing in each of the member firms. But individual units generally differ in respect
of certain key factors and methods.
(ii) For smaller units the cost of installation and operation of Uniform Costing System
may be more than the benefits derived by them.
(iii) Uniform costing may create conditions that are likely to develop monopolistic
tendencies within the industry. Prices may be raised artificially and supplies
curtailed.
(iv) If complete agreement between the members is not forthcoming, the statistics
presented cannot be relied upon. This weakens the Uniform Costing System and
reduces its usefulness.
5. (a) A company can produce any of its 4 products, A, B, C and D. Only one product can
be produced in a production period and this has to be determined at the beginning
of the production run. The production Capacity is 1,000 hours. Whatever is produced
has to be sold and there is no Inventory build-up to be considered beyond the
production period. The following information is given:
Particulars A B C D
Selling Price (` Per unit) 40 50 60 70
Variable Cost (` Per unit) 30 20 20 30
No. of units that can be sold 1,000 600 900 600
No. of production hours required
per unit of product
1 hour 1 hour and
15 minutes
1 hour and
15 minutes
2 hours
What are the Opportunity Costs of A, B, C and D?
Answer_MTP_Final_Syllabus 2016_Dec2017_Set 2
Academics Department, The Institute of Cost Accountants of India (Statutory Body under an Act of Parliament) Page 11
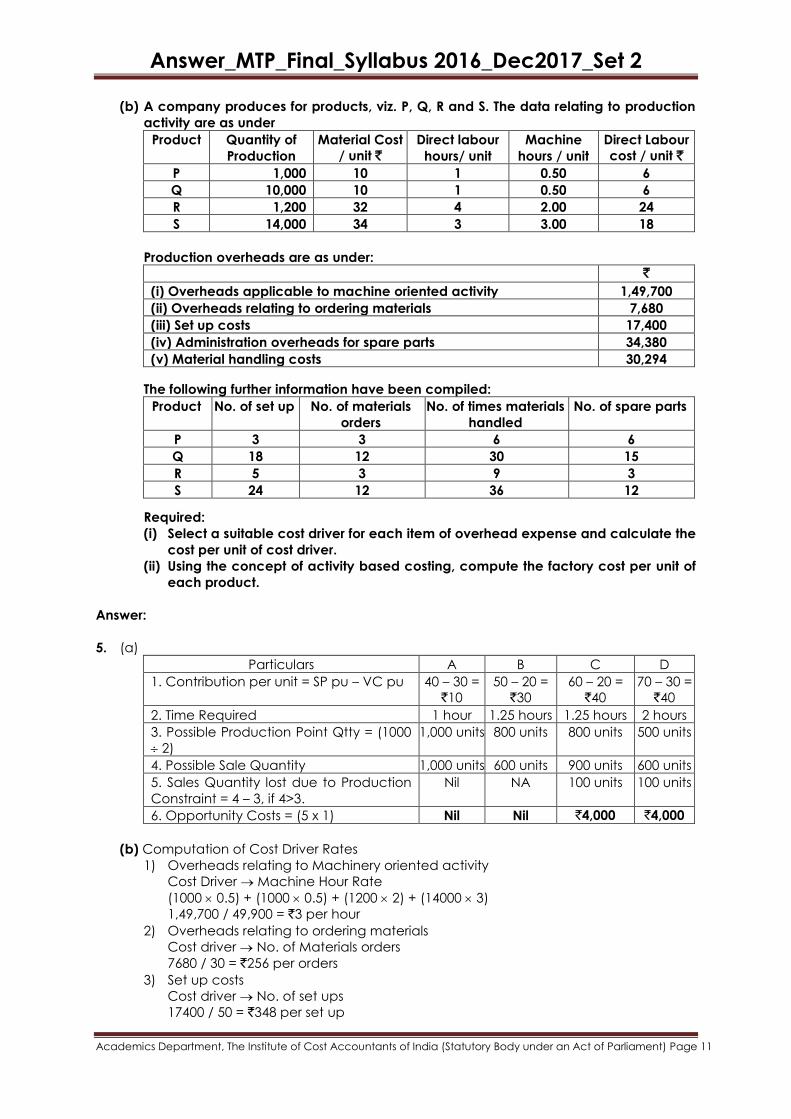
(b) A company produces for products, viz. P, Q, R and S. The data relating to production
activity are as under
Product Quantity of
Production
Material Cost
/ unit `
Direct labour
hours/ unit
Machine
hours / unit
Direct Labour
cost / unit `
P 1,000 10 1 0.50 6
Q 10,000 10 1 0.50 6
R 1,200 32 4 2.00 24
S 14,000 34 3 3.00 18
Production overheads are as under:
`
(i) Overheads applicable to machine oriented activity 1,49,700
(ii) Overheads relating to ordering materials 7,680
(iii) Set up costs 17,400
(iv) Administration overheads for spare parts 34,380
(v) Material handling costs 30,294
The following further information have been compiled:
Product No. of set up No. of materials
orders
No. of times materials
handled
No. of spare parts
P 3 3 6 6
Q 18 12 30 15
R 5 3 9 3
S 24 12 36 12
Required:
(i) Select a suitable cost driver for each item of overhead expense and calculate the
cost per unit of cost driver.
(ii) Using the concept of activity based costing, compute the factory cost per unit of
each product.
Answer:
5. (a)
Particulars A B C D
1. Contribution per unit = SP pu – VC pu 40 – 30 =
`10
50 – 20 =
`30
60 – 20 =
`40
70 – 30 =
`40
2. Time Required 1 hour 1.25 hours 1.25 hours 2 hours
3. Possible Production Point Qtty = (1000
2)
1,000 units 800 units 800 units 500 units
4. Possible Sale Quantity 1,000 units 600 units 900 units 600 units
5. Sales Quantity lost due to Production
Constraint = 4 – 3, if 4>3.
Nil NA 100 units 100 units
6. Opportunity Costs = (5 x 1) Nil Nil `4,000 `4,000
(b) Computation of Cost Driver Rates
1) Overheads relating to Machinery oriented activity
Cost Driver Machine Hour Rate
(1000 0.5) + (1000 0.5) + (1200 2) + (14000 3)
1,49,700 / 49,900 = `3 per hour
2) Overheads relating to ordering materials
Cost driver No. of Materials orders
7680 / 30 = `256 per orders
3) Set up costs
Cost driver No. of set ups
17400 / 50 = `348 per set up
Answer_MTP_Final_Syllabus 2016_Dec2017_Set 2
Academics Department, The Institute of Cost Accountants of India (Statutory Body under an Act of Parliament) Page 12
4) Administrative Overheads for spare parts
Cost driver No. of spare parts
34380 / 36 = `955 per spare part.
5) Material Handling costs
Cost driver No. of times materials handled
30294 / 81 = `374 per material handling
Computation of factory cost for each product
P Q R S
Materials 10.00 10.00 32.00 34.00
Labour 6.00 6.00 24.00 18.00
Overheads
Machine oriented activity 1.500 1.50 6.00 9.00
Ordering of Materials 0.768 0.31 0.64 0.22
Set up costs 1.044 0.63 1.45 0.60
Administrative Spare Parts 5.730 1.43 2.39 0.82
Material handling 2.244 11.29 1.12 4.99 2.81 13.29 0.96 11.60
Factory Cost (`) 27.29 20.99 69.29 63.60
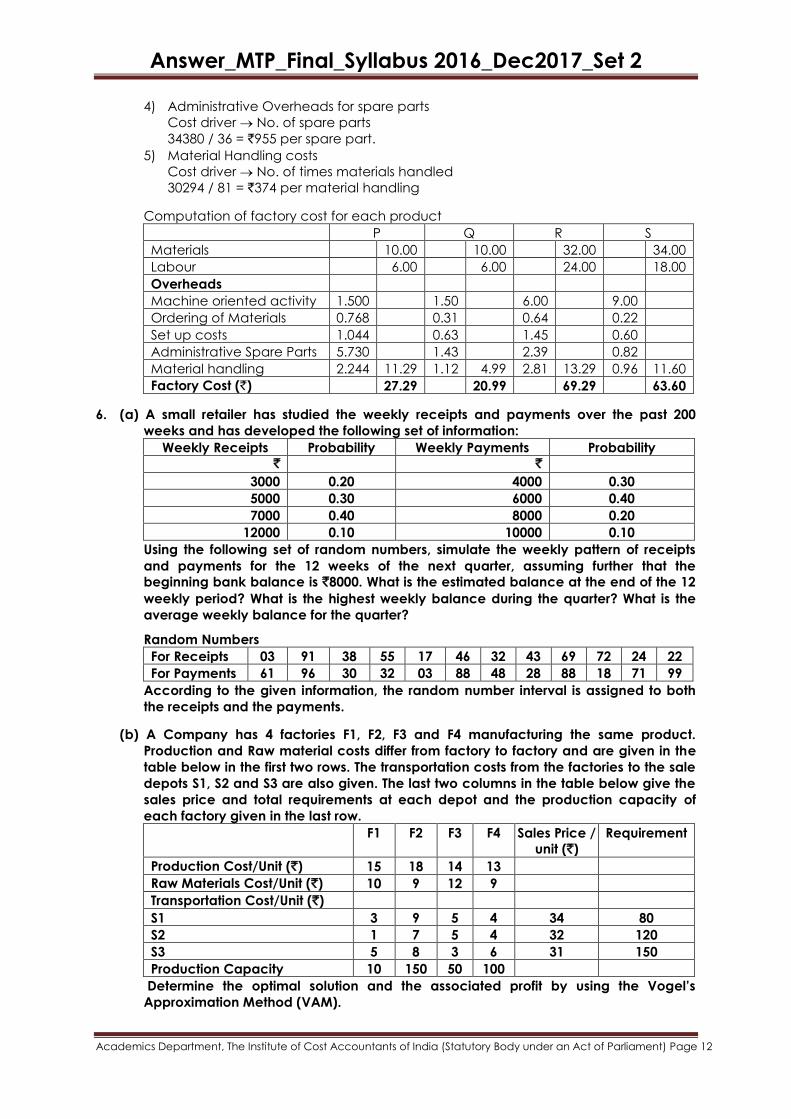
6. (a) A small retailer has studied the weekly receipts and payments over the past 200
weeks and has developed the following set of information:
Weekly Receipts Probability Weekly Payments Probability ` `
3000 0.20 4000 0.30
5000 0.30 6000 0.40
7000 0.40 8000 0.20
12000 0.10 10000 0.10
Using the following set of random numbers, simulate the weekly pattern of receipts
and payments for the 12 weeks of the next quarter, assuming further that the
beginning bank balance is `8000. What is the estimated balance at the end of the 12
weekly period? What is the highest weekly balance during the quarter? What is the
average weekly balance for the quarter?
Random Numbers
For Receipts 03 91 38 55 17 46 32 43 69 72 24 22
For Payments 61 96 30 32 03 88 48 28 88 18 71 99
According to the given information, the random number interval is assigned to both
the receipts and the payments.
(b) A Company has 4 factories F1, F2, F3 and F4 manufacturing the same product.
Production and Raw material costs differ from factory to factory and are given in the
table below in the first two rows. The transportation costs from the factories to the sale
depots S1, S2 and S3 are also given. The last two columns in the table below give the
sales price and total requirements at each depot and the production capacity of
each factory given in the last row.
F1 F2 F3 F4 Sales Price /
unit (`)
Requirement
Production Cost/Unit (`) 15 18 14 13
Raw Materials Cost/Unit (`) 10 9 12 9
Transportation Cost/Unit (`)
S1 3 9 5 4 34 80
S2 1 7 5 4 32 120
S3 5 8 3 6 31 150
Production Capacity 10 150 50 100
Determine the optimal solution and the associated profit by using the Vogel’s
Approximation Method (VAM).
Answer_MTP_Final_Syllabus 2016_Dec2017_Set 2
Academics Department, The Institute of Cost Accountants of India (Statutory Body under an Act of Parliament) Page 13
Answer:
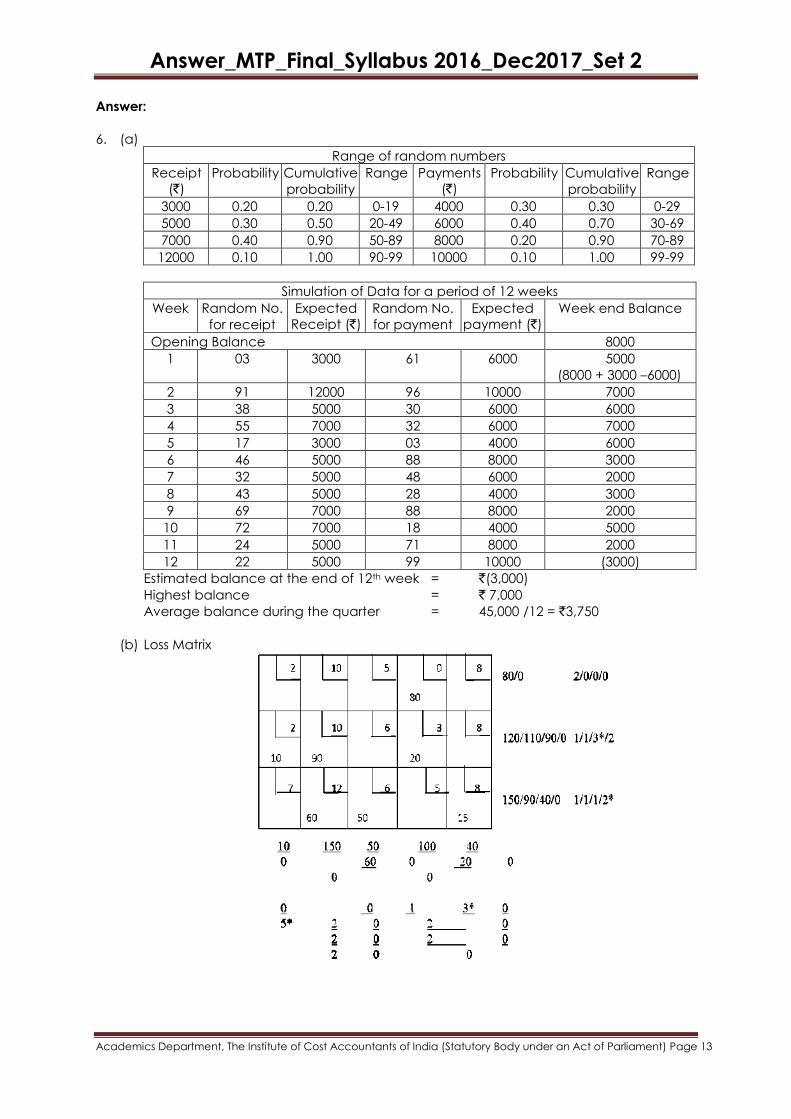
6. (a)
Range of random numbers
Receipt
(`)
Probability Cumulative
probability
Range Payments
(`)
Probability Cumulative
probability
Range
3000 0.20 0.20 0-19 4000 0.30 0.30 0-29
5000 0.30 0.50 20-49 6000 0.40 0.70 30-69
7000 0.40 0.90 50-89 8000 0.20 0.90 70-89
12000 0.10 1.00 90-99 10000 0.10 1.00 99-99
Simulation of Data for a period of 12 weeks
Week Random No.
for receipt
Expected
Receipt (`)
Random No.
for payment
Expected
payment (`)
Week end Balance
Opening Balance 8000
1 03 3000 61 6000 5000
(8000 + 3000 –6000)
2 91 12000 96 10000 7000
3 38 5000 30 6000 6000
4 55 7000 32 6000 7000
5 17 3000 03 4000 6000
6 46 5000 88 8000 3000
7 32 5000 48 6000 2000
8 43 5000 28 4000 3000
9 69 7000 88 8000 2000
10 72 7000 18 4000 5000
11 24 5000 71 8000 2000
12 22 5000 99 10000 (3000)
Estimated balance at the end of 12th week = `(3,000)
Highest balance = ` 7,000
Average balance during the quarter = 45,000 /12 = `3,750
(b) Loss Matrix
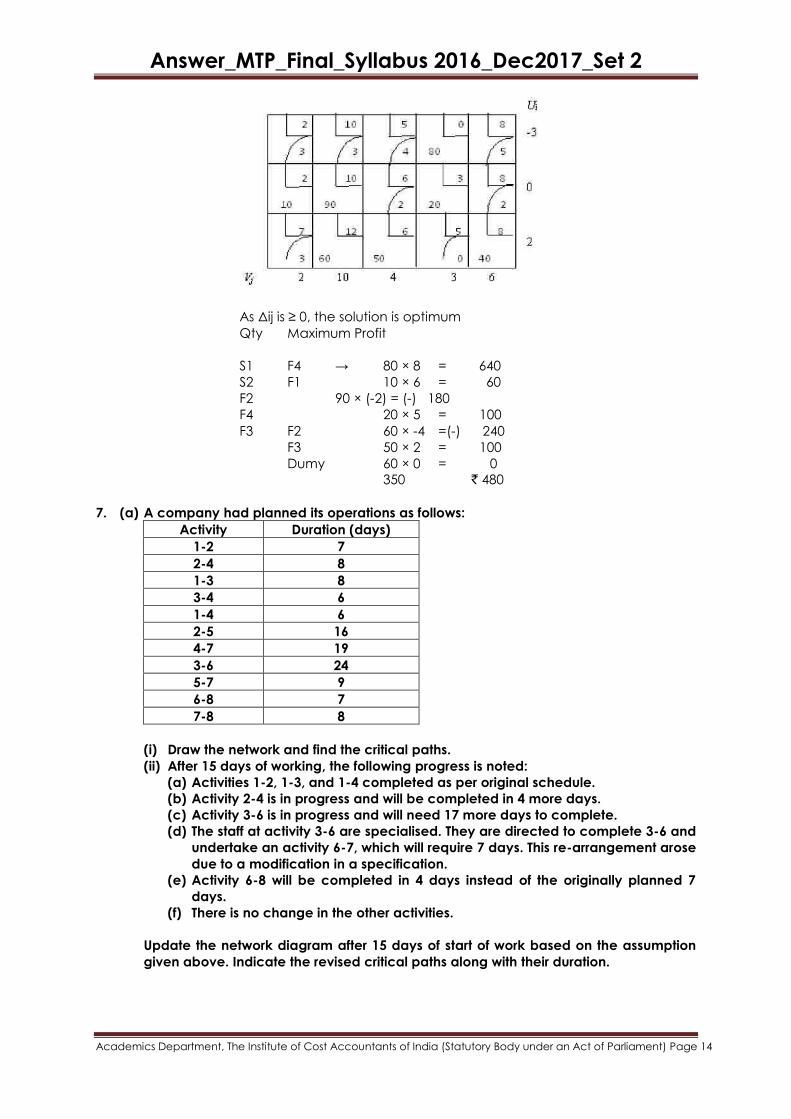
Answer_MTP_Final_Syllabus 2016_Dec2017_Set 2
Academics Department, The Institute of Cost Accountants of India (Statutory Body under an Act of Parliament) Page 14
As Δij is ≥ 0, the solution is optimum
Qty Maximum Profit
S1 F4 → 80 × 8 = 640
S2 F1 10 × 6 = 60
F2 90 × (-2) = (-) 180
F4 20 × 5 = 100
F3 F2 60 × -4 =(-) 240
F3 50 × 2 = 100
Dumy 60 × 0 = 0
350 ` 480
7. (a) A company had planned its operations as follows:
Activity Duration (days)
1-2 7
2-4 8
1-3 8
3-4 6
1-4 6
2-5 16
4-7 19
3-6 24
5-7 9
6-8 7
7-8 8
(i) Draw the network and find the critical paths.
(ii) After 15 days of working, the following progress is noted:
(a) Activities 1-2, 1-3, and 1-4 completed as per original schedule.
(b) Activity 2-4 is in progress and will be completed in 4 more days.
(c) Activity 3-6 is in progress and will need 17 more days to complete.
(d) The staff at activity 3-6 are specialised. They are directed to complete 3-6 and
undertake an activity 6-7, which will require 7 days. This re-arrangement arose
due to a modification in a specification.
(e) Activity 6-8 will be completed in 4 days instead of the originally planned 7
days.
(f) There is no change in the other activities.
Update the network diagram after 15 days of start of work based on the assumption
given above. Indicate the revised critical paths along with their duration.
Answer_MTP_Final_Syllabus 2016_Dec2017_Set 2
Academics Department, The Institute of Cost Accountants of India (Statutory Body under an Act of Parliament) Page 15
(b) A company manufactures items X1 and X2 which are sold at a profit of `35 per unit of
X1 and `25 per unit of X2. X1 requires 3 kgs of materials, 4 man-hours and 2 machine-
hours per unit. X2 requires 2kgs of materials, 3 man-hours and 2 machine-hours per
unit. During each production run, there are 350 kgs, of materials available, 600 man-
hours and 550 machine-hours for use.
Formulate under Simplex method of linear programming:
(i) The objective function and the linear constraints, and
(ii) The equations after introducing slack variables
(iii) What are the various methods of solving a linear programming problem?
Answer:
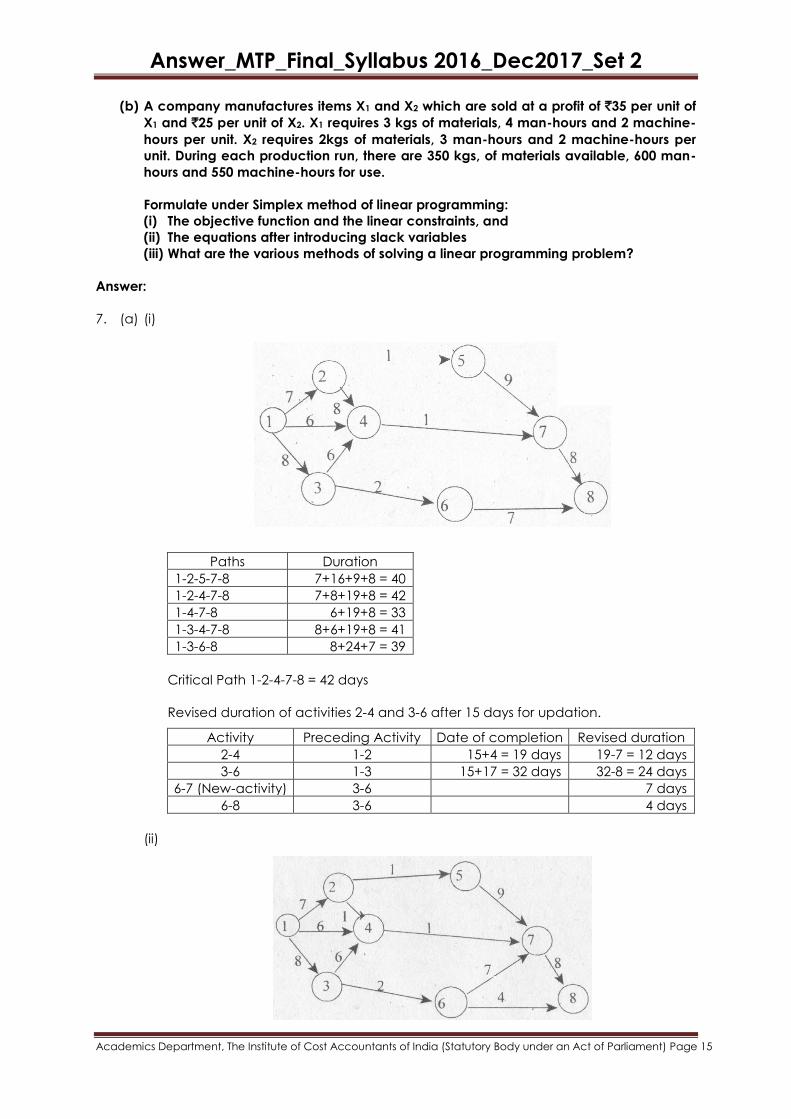
7. (a) (i)
Paths Duration
1-2-5-7-8 7+16+9+8 = 40
1-2-4-7-8 7+8+19+8 = 42
1-4-7-8 6+19+8 = 33
1-3-4-7-8 8+6+19+8 = 41
1-3-6-8 8+24+7 = 39
Critical Path 1-2-4-7-8 = 42 days
Revised duration of activities 2-4 and 3-6 after 15 days for updation.
Activity Preceding Activity Date of completion Revised duration
2-4 1-2 15+4 = 19 days 19-7 = 12 days
3-6 1-3 15+17 = 32 days 32-8 = 24 days
6-7 (New-activity) 3-6 7 days
6-8 3-6 4 days
(ii)
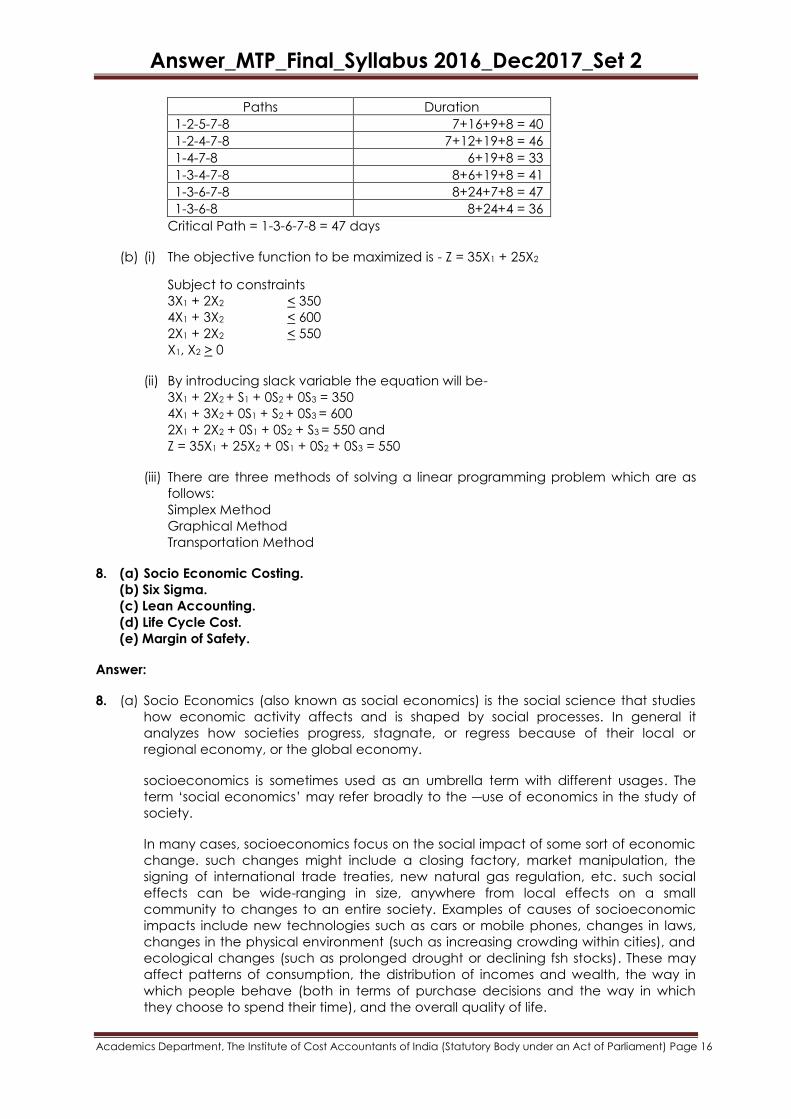
Answer_MTP_Final_Syllabus 2016_Dec2017_Set 2
Academics Department, The Institute of Cost Accountants of India (Statutory Body under an Act of Parliament) Page 16
Paths Duration
1-2-5-7-8 7+16+9+8 = 40
1-2-4-7-8 7+12+19+8 = 46
1-4-7-8 6+19+8 = 33
1-3-4-7-8 8+6+19+8 = 41
1-3-6-7-8 8+24+7+8 = 47
1-3-6-8 8+24+4 = 36
Critical Path = 1-3-6-7-8 = 47 days
(b) (i) The objective function to be maximized is - Z = 35X1 + 25X2
Subject to constraints
3X1 + 2X2 < 350
4X1 + 3X2 < 600
2X1 + 2X2 < 550
X1, X2 > 0
(ii) By introducing slack variable the equation will be-
3X1 + 2X2 + S1 + 0S2 + 0S3 = 350
4X1 + 3X2 + 0S1 + S2 + 0S3 = 600
2X1 + 2X2 + 0S1 + 0S2 + S3 = 550 and
Z = 35X1 + 25X2 + 0S1 + 0S2 + 0S3 = 550
(iii) There are three methods of solving a linear programming problem which are as
follows:
Simplex Method
Graphical Method
Transportation Method
8. (a) Socio Economic Costing.
(b) Six Sigma.
(c) Lean Accounting.
(d) Life Cycle Cost.
(e) Margin of Safety.
Answer:
8. (a) Socio Economics (also known as social economics) is the social science that studies
how economic activity affects and is shaped by social processes. In general it
analyzes how societies progress, stagnate, or regress because of their local or
regional economy, or the global economy.
socioeconomics is sometimes used as an umbrella term with different usages. The
term „social economics‟ may refer broadly to the ―use of economics in the study of
society.
In many cases, socioeconomics focus on the social impact of some sort of economic
change. such changes might include a closing factory, market manipulation, the
signing of international trade treaties, new natural gas regulation, etc. such social
effects can be wide-ranging in size, anywhere from local effects on a small
community to changes to an entire society. Examples of causes of socioeconomic
impacts include new technologies such as cars or mobile phones, changes in laws,
changes in the physical environment (such as increasing crowding within cities), and
ecological changes (such as prolonged drought or declining fsh stocks). These may
affect patterns of consumption, the distribution of incomes and wealth, the way in
which people behave (both in terms of purchase decisions and the way in which
they choose to spend their time), and the overall quality of life.
Answer_MTP_Final_Syllabus 2016_Dec2017_Set 2
Academics Department, The Institute of Cost Accountants of India (Statutory Body under an Act of Parliament) Page 17
Companies are increasingly interested in measuring socio-economic impact as part
of maintaining their license to operate, improving the business enabling environment,
strengthening their value chains, and fuelling product and service innovation.
(b) Six Sigma has two key methodologies: DMAIC and DMADV, both inspired by W.
Edwards Deming„s Plan-Do-Check-Act Cycle: DMAIC is used to improve an existing
business process, and DMADV is used to create new product or process designs for
predictable, defect-free performance.
DMAIC
Basic methodology consists of the following five (5) steps:
♦ Define the process improvement goals that are consistent with customer
demands and enterprise strategy.
♦ Measure the current process and collect relevant data for future comparison.
♦ Analyze to verify relationship and causality of factors. Determine what the
relationship is, and attempt to ensure that all factors have been considered.
♦ Improve or optimize the process based upon the analysis using techniques like
Design of Experiments.
♦ Control to ensure that any variances are corrected before they result in defects.
set up pilot runs to establish process capability, transition to production and
thereafter continuously measure the process and institute control mechanisms.
DMIADV
Basic methodology consists of the following five steps:
♦ Define the goals of the design activity that are consistent with customer demands
and enterprise strategy.
♦ Measure and identify CTQs (critical to qualities), product capabilities, production
process capability, and risk assessments.
♦ Analyze to develop and design alternatives, create high-level design and
evaluate design capability to select the best design.
♦ Design details, optimize the design, and plan for design verification. This phase
may require simulations.
♦ Verify the design, set up pilot runs, implement production process and handover
to process owners.
Some people have used dmaicr (Realize). Others contend that focusing on the
financial gains realized through Six Sigma is counter-productive and that said
financial gains are simply byproducts of a good process improvement.
(c) Lean Accounting: What we now call lean manufacturing was developed by Toyota
and other Japanese companies. Toyota executives claim that the famed Toyota
Production System was inspired by what they learned during visits to the Ford Motor
Company in the 1920s and developed by Toyota leaders such as Taiichi Ohno and
consultant Shigeo Shingo after World War II. As pioneer American and European
companies embraced lean manufacturing methods in the late 1980s, they
discovered that lean thinking must be applied to every aspect of the company
including the financial and management accounting processes.
Lean Accounting is the general term used for the changes required to a company‟s
accounting, control, measurement, and management processes to support lean
manufacturing and lean thinking. Most companies embarking on lean manufacturing
soon find that their accounting processes and management methods are at odds
with the lean changes they are making. The reason for this is that traditional
accounting and management methods were designed to support traditional
manufacturing; they are based upon mass production thinking. Lean manufacturing
breaks the rules of mass production, and so the traditional accounting and
management methods are (at best) unsuitable and usually actively hostile to the
lean changes the company is making.
Answer_MTP_Final_Syllabus 2016_Dec2017_Set 2
Academics Department, The Institute of Cost Accountants of India (Statutory Body under an Act of Parliament) Page 18
(d) Meaning of Life Cycle Costing
(i) Life Cycle Costing; aims at cost ascertainment of a product, project etc. over its
projected life.
(ii) It is a system that tracts and accumulates the actual costs and revenues
attributable to cost object (i.e.; product) from its inception to its abandonment.
(iii) Sometimes the terms; cradle-to-grave costing and womb-to-tomb costing convey
the meaning of fully capturing all costs associated with the product from its initial
to final stages.
(e) Margin of Safety: It is the sales point beyond the breakeven point. Margin of safety can be obtained by
subtracting break even sales from Total sales. It is useful to determine financial
soundness of business enterprise. If margin of safety is high, then the financial position
of the enterprise is sound.
Margin of Safety = Total Sales – Break Even Sales (1)
Total Sales = Break Even Sales + Margin of Safety Sales (2)
Margin of safety can also be computed as follows:
Margin of Safety = Profit / P/V ratio (3)
A relative measure to the margin of safety is its ratio to total sales. Margin of safety ratio is the ratio of Margin of safety sales to Total sales.
Margin of safety ratio = [Margin of safety / Total sales] x 100 (4)
Margin of safety ratio and Break even sales ratios are complements of each
other.


![Untitled-1 [sanshodhanchetana.com]sanshodhanchetana.com/issues/Dec2017/16.pdf · having layers as primary, secondary, tertiary, professional, vocational education etc. The most The](https://img.pdfslide.net/doc/110x75/5e0605ff0acfbd4d101ffd60/untitled-1-having-layers-as-primary-secondary-tertiary-professional-vocational.jpg)