Embed Size (px)
Citation preview
ANTARES: A Prototype Transient Broker System
Abhijit Saha,a Thomas Matheson,a Richard Snodgrass,b John Kececioglu,b
Gautham Narayan,a Robert Seaman,a Tim Jenness,c Tim Axelrodb
aNOAO, 950 N Cherry Avenue, Tucson, AZ 85719 USA;bUniversity of Arizona, Tucson, AZ 85721 USA;
cDepartment of Astronomy, Cornell University, Ithaca, NY, 14853, USA
ABSTRACT
The Arizona-NOAO Temporal Analysis and Response to Events System (ANTARES) is a joint project ofthe National Optical Astronomy Observatory and the Department of Computer Science at the Universityof Arizona. The goal is to build the software infrastructure necessary to process and filter alerts producedby time-domain surveys, with the ultimate source of such alerts being the Large Synoptic Survey Telescope(LSST). The antares broker will add value to alerts by annotating them with information from externalsources such as previous surveys from across the electromagnetic spectrum. In addition, the temporal historyof annotated alerts will provide further annotation for analysis. These alerts will go through a cascade of filtersto select interesting candidates. For the prototype, ‘interesting’ is defined as the rarest or most unusual alert,but future systems will accommodate multiple filtering goals. The system is designed to be flexible, allowingusers to access the stream at multiple points throughout the process, and to insert custom filters wherenecessary. We describe the basic architecture of antares and the principles that will guide development andimplementation.
Keywords: Time-domain alert analysis, Event broker, LSST, VOEvent, transient response, big-data
1. THE PROBLEM
1.1 Background
An increasing number of large area astronomy surveys that probe time-variable phenomena are producingcandidates that need rapid response follow-up (whether monitoring ongoing changes, or spectroscopic obser-vations to probe physical characteristics). Salient examples are: the Lick Observatory Supernova Search1∗,the Catalina Real-Time Transient Survey2†, the Panoramic Survey Telescope & Rapid Response System (Pan-STARRS)3‡, the Palomar Transient Factory (PTF and iPTF)4§, and the La Silla-Quest Variability Survey5¶.These surveys are discovering new transient phenomena that are already taxing the available follow-up capac-ity of telescope facilities world-wide. These projects have developed tools to filter their discoveries to focus onevents of interest to their research teams (e.g., supernovae, gamma-ray burst events, and so on), which cangather ancillary information about their ‘alerts’ from external catalogs, and use the available information toclassify the sources associated with their alerts. A leading example of this is SkyAlert6‖, a system that hassolved many of the astronomical issues associated with adding value to alerts. SkyAlert enables users to createfilters on alerts, including ancillary information on these alerts, in order to find relevant events. The PTFsystem also employs tools to identify interesting alerts.7 The scale of time-domain alert generation, though,is quickly increasing. The Zwicky Transient Facility8 (ZTF) will have more than 6 times the field-of-view
Further author information: (Send correspondence to A. Saha)A.Saha: E-mail: [email protected], Telephone: +1 520 318 8288
∗http://astro.berkeley.edu/bait/public html/kait.html†http://crts.caltech.edu/‡http://pan-starrs.ifa.hawaii.edu/public/§http://ptf.caltech.edu/iptf/¶http://hep.yale.edu/lasillaquest‖http://skyalert.org/
Observatory Operations: Strategies, Processes, and Systems V, edited by Alison B. Peck, Chris R. Benn, Robert L. Seaman, Proc. of SPIE Vol. 9080, 908000 © 2014 SPIE
CCC code: 0277-786X/14/$18 · doi: 10.1117/12.2056988
Proc. of SPIE Vol. 9149 914908-1
Downloaded From: http://proceedings.spiedigitallibrary.org/ on 08/29/2014 Terms of Use: http://spiedl.org/terms
of PTF, while time domain surveys with DECam on the Blanco telescope benefit not only from the 3 deg2
field-of-view, but the depth attainable with a 4m-class facility. Moreover, transients are generated across theelectromagnetic spectrum, from radio facilities such as LOFAR9∗∗ to high-energy space-based observatoriessuch as Fermi10††, making the overall problem that much more complex.
On the horizon for beginning operation in 2021, is the Large Synoptic Survey Telescope.11, 12 With its 10deg2 field-of-view and ∼6m collecting area, the transient detection rate leaps by orders of magnitude. LSSTwill detect (with 5σ significance) 103 − 104 alerts per image, or 106 − 107 per night. By going fainter, andcovering an area of over 18,000 square degrees, this 10 year long survey will probe an unprecedented volumeof space with a time cadence that can identify variability on time scales from tens of minutes to years. Duringthe survey operation, the LSST facility will issue alerts of celestial transient events using VOEvent and otherIVOA protocols.13, 14
1.2 Variable Event Alerts
An alert is a notice triggered when an image shows that something is significantly different with respect to anarchive image. A variable star may trigger an alert each and every time it is imaged: a supernova in a distantgalaxy will trigger repeatedly against an archive image from before it erupted. A moving object will be seentypically over erstwhile blank sky, and move to a different location at subsequent epochs, triggering alerts atall these different locations at each respective epoch. While most alerts will be yet another incremental datapoint for a celestial object already known to vary, among these multitudes will lurk objects the likes of whichhave never (or extremely rarely) been seen before.
Prompted by the potential importance of early detection of short lived transient phenomena, the LSSTsurvey will issue alerts with a latency of only about a minute. An alert contains essential information like thelocation on the sky, the passband in which the variability was detected, whether the change was in brightnessor in position, the magnitude of the change, and the epoch of that particular trigger. It may or may not(depending on the facility that issues it) contain ancillary information about whether it is a recurrent alert, ahistory of all alerts at that location in the sky, or other similar ancillary information.
A good fraction of alerts from LSST will be known variable stars or moving objects,15, 16 but hiddenamong them will be rare and interesting objects that have relatively short lifetimes. Only with additionalfollow-up will these objects reveal their nature. These could range from short-lived phases of stellar evolutionsuch as the final helium flash17, 18 to superluminous supernovae19 to electromagnetic counterparts of LIGOdetections.20, 21 Beyond these rare, but known or predicted, objects lies the great discovery space that awaitsLSST. The superluminous supernovae were essentially unknown fifteen years ago and the discovery of darkenergy was certainly surprising. Over its life, LSST will generate more than a billion alerts and some will becompletely unknown and unanticipated objects. Without the ability to rapidly sort through millions of alertseach night and winnow them down to a reasonable number that can be studied in detail, we will lose theserare and potentially extraordinarily interesting objects. The astronomical community is becoming more awareof the necessity of such a tool.22
1.3 Project Goals
We take note of (and are encouraged by) advanced methods for determining classification probabilities usingsmall numbers of time-series measurements (for instance23–25), using machine learning algorithms and tech-niques. They have been used to identify specific kinds of variables of interest to their respective investigations.Their successes notwithstanding, the alert rates that the LSST survey promises require us to look at theproblem a little differently:
• The alert broker needs to handle alert data volumes at the rate that LSST is capable of generating, i.e.thousands of alerts per minute. They need to be processed with a latency that does not make themstale: i.e. since LSST will produce alerts with a latency of ∼ 1 minute, the broker must process thosealerts without introducing significantly larger delays to the alert stream.
∗∗http://www.transientskp.org/††http://fermi.gsfc.nasa.gov/
Proc. of SPIE Vol. 9149 914908-2
Downloaded From: http://proceedings.spiedigitallibrary.org/ on 08/29/2014 Terms of Use: http://spiedl.org/terms
I
zliondmurlT1 bsisbgU noiisidilsD
Eisa xliob
T22J .
Agin \ zsgsmi 000,1
in9m91u2s9M n013E1dIIsJ951
Z3AATVIA' . . CzupOJ
noiisg9lggA
31s1s Isn-1six3 noiiz9gni
c 9luiE99
zmdiiloglA (b9iE1uD)
1
1
1
1
L23-191A s19mED
239jd0o-122A noiisiDozzA
nilloj b9i0r1nA
goloioJ bsjd0olnA (b9i6lU9) J
1
-1n9jdO0li2A 23191A b92sionnA
191120 129192X9
23791E 91U3699
w9 V1
n9jd0o1izA noi2spítím9bl
nOÌSsvilsa
noiiSSi1973S-1s11D zm11iiloglA (b9isluD)
1 i-1s1A
sDi1g9A gnUZ91E0D
8-1s1A bsbns2x3
lo xmonoxsT 2noüssi192)E1s11J
(bsisluD)
9ni1ii0 zizxIsnA 19)10-18
1
1 bsioionnA b9pz91DOJ
zi191A
melo
1191A
n01iOS119bO1Od0
21191A b9211930E1E110 9gsmi \ 000,1
Itni1s1o9dT znoibib919
1 á191A
gninislT
,zlonoizz9jol9 z12i3n9i)z n9Si1i]
gnilsili3 z991T
(b93E1uD)
b91911í1
23191A I IsvsJ I9gsmi
\ 001
9gD1111 SD 11D1z
noi1iziupDD
Isn19iX3 i-191A
219)1018
noiiovil94 91uí099 b9lnovbA gnilsili9 brio noi102i191)01011)
brio b919111í
21191D 192Dn
27-191A 11 I9v9J 198smi 1 0.1
$ri119i11 brio noiloxiieb01010 01111)
z19Çib1n9z9A
Dilduct brin
IisndmurlT in9md0E.73s951
23-191Á 19vobl
"91051 9d1i0 In-mg"
sgsmi \ 1.0
J
I4iI0S Ii1qA IS
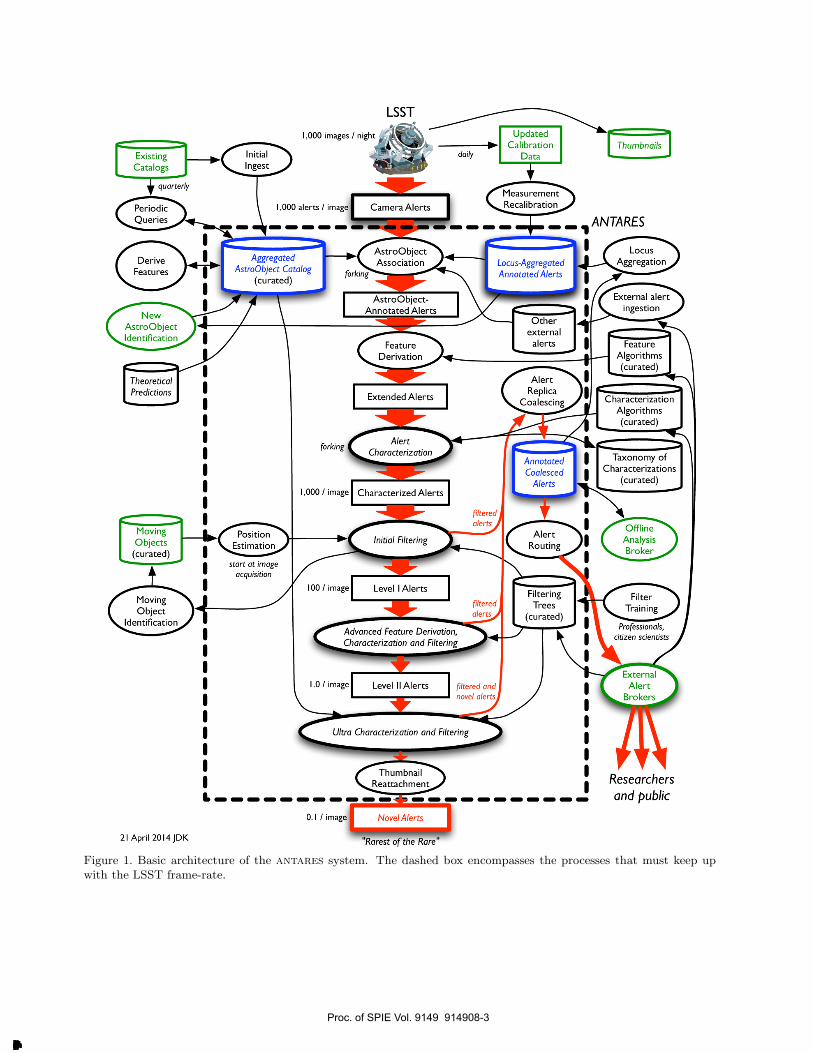
Figure 1. Basic architecture of the antares system. The dashed box encompasses the processes that must keep upwith the LSST frame-rate.
Proc. of SPIE Vol. 9149 914908-3
Downloaded From: http://proceedings.spiedigitallibrary.org/ on 08/29/2014 Terms of Use: http://spiedl.org/terms
• The alert broker needs to serve generic needs: i.e. its design should not be limited to identifying specificpre-defined kinds of celestial sources.
• It should store and archive all alerts, and be able to append contextual information for any celestialsourc(es) associated with that alert. It should be able to integrate results from any followup investigationof sources.
Achieving these goals requires the combined efforts of astronomers with experience in time-domain astron-omy, as well as computer scientists who can impose the design and methods necessary to achieve the necessaryend-to-end speed and scalability for dealing with LSST scale data rates and volumes.
2. DESIGN AND ARCHITECTURE OF ANTARES
2.1 Proto-type design considerations
The knowledge we have about an alert, such as brightness, change in flux, Galactic coordinates, eclipticcoordinates, distance to nearest galaxy, etc., constitute features that can probabilistically characterize alerts.We re-iterate that this is a broad characterization, not a specific classification: the latter will have to comefrom software systems further downstream. Because of the time-scale of LSST exposures, with a new imageevery ∼37 seconds, alerts must be processed rapidly to keep up with the data stream. Classification oftenrequires more complex analysis and usually a more complete light curve.23, 26
For the prototype, we have selected the challenging problem of identifying the rarest of time domainphenomena: those that are least like things we know. Alerts that appear to come from more commonplaceastronomical sources are diverted, but saved for further use. We will discuss later how antares is structuredso that it can be modified and applied to identify other kinds of phenomena, and thus become a generic tool.Identifying the ‘rarest of the rare’ leads us through the problem space that makes adapting to other needsrelatively straight-forward.
2.2 Architecture and Data Path
Figure 1 illustrates the main components of the antares architecture.27, 28 The overall design principles areopen source and open access. The software will be available for anyone to implement and our implementationwill be community driven. The alert stream can be tapped at many points throughout the system. In Figure 1alerts enter the system from the top center.
The first stages provide annotation that add contextual value to the alerts. Source association is a criticalstep to incorporate relevant astronomical knowledge for each alert. Catalogs of astronomical information, aswell as the LSST source catalog will be the basis for this source association. Examples include the 2MASSAll-Sky Data Release29‡‡, the Chandra Source Catalog30∗, the NRAO VLA Sky Survey31†, the Sloan DigitalSky Survey32‡, the NASA Extragalactic Database33§, and GAIA34¶, among many others. These externalcatalogs are collated and initially ingested to produce the Aggregated AstroObject Catalog, shown near thetop-left of Figure 1. This catalog will be updated from time to time with periodic queries to the externalcatalogs, and with new ‘AstroObjects’ from the episodic data releases of the LSST survey. Even the proximityto known sources can provide useful constraints.
A new alert is also tested for association with past alerts (from a database maintained by antares, andshown in the figure as Locus-Aggregated Annotated Alerts) and additionally from any other available externalalert data sources. The history of flux measurements, such as a light curve, will be valuable annotation. TheLocus-Aggregated Annotated Alerts is meant to be an efficient database that can be updated regularly is an
‡‡http://www.ipac.caltech.edu/2mass/releases/allsky/∗http://cxc.harvard.edu/csc/index.html†http://www.cv.nrao.edu/nvss/‡http://www.sdss.org/§http://ned.ipac.caltech.edu/¶http://sci.esa.int/science-e/www/area/index.cfm?fareaid=26
Proc. of SPIE Vol. 9149 914908-4
Downloaded From: http://proceedings.spiedigitallibrary.org/ on 08/29/2014 Terms of Use: http://spiedl.org/terms
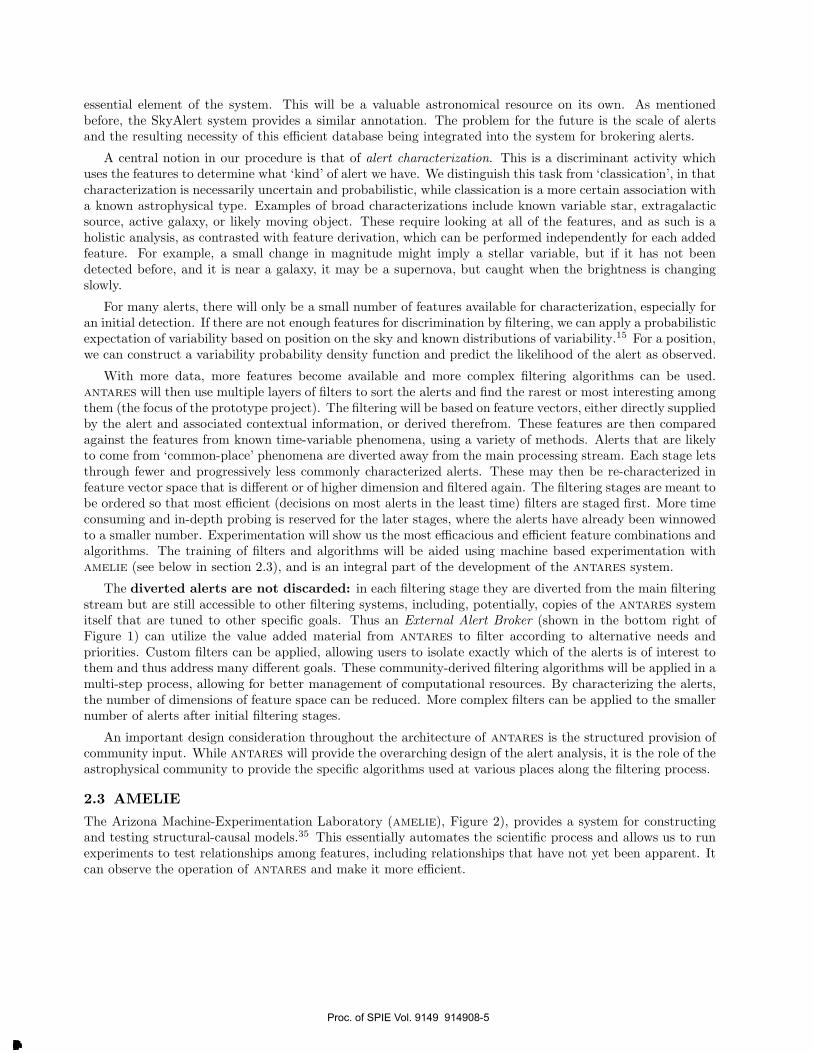
essential element of the system. This will be a valuable astronomical resource on its own. As mentionedbefore, the SkyAlert system provides a similar annotation. The problem for the future is the scale of alertsand the resulting necessity of this efficient database being integrated into the system for brokering alerts.
A central notion in our procedure is that of alert characterization. This is a discriminant activity whichuses the features to determine what ‘kind’ of alert we have. We distinguish this task from ‘classication’, in thatcharacterization is necessarily uncertain and probabilistic, while classication is a more certain association witha known astrophysical type. Examples of broad characterizations include known variable star, extragalacticsource, active galaxy, or likely moving object. These require looking at all of the features, and as such is aholistic analysis, as contrasted with feature derivation, which can be performed independently for each addedfeature. For example, a small change in magnitude might imply a stellar variable, but if it has not beendetected before, and it is near a galaxy, it may be a supernova, but caught when the brightness is changingslowly.
For many alerts, there will only be a small number of features available for characterization, especially foran initial detection. If there are not enough features for discrimination by filtering, we can apply a probabilisticexpectation of variability based on position on the sky and known distributions of variability.15 For a position,we can construct a variability probability density function and predict the likelihood of the alert as observed.
With more data, more features become available and more complex filtering algorithms can be used.antares will then use multiple layers of filters to sort the alerts and find the rarest or most interesting amongthem (the focus of the prototype project). The filtering will be based on feature vectors, either directly suppliedby the alert and associated contextual information, or derived therefrom. These features are then comparedagainst the features from known time-variable phenomena, using a variety of methods. Alerts that are likelyto come from ‘common-place’ phenomena are diverted away from the main processing stream. Each stage letsthrough fewer and progressively less commonly characterized alerts. These may then be re-characterized infeature vector space that is different or of higher dimension and filtered again. The filtering stages are meant tobe ordered so that most efficient (decisions on most alerts in the least time) filters are staged first. More timeconsuming and in-depth probing is reserved for the later stages, where the alerts have already been winnowedto a smaller number. Experimentation will show us the most efficacious and efficient feature combinations andalgorithms. The training of filters and algorithms will be aided using machine based experimentation withamelie (see below in section 2.3), and is an integral part of the development of the antares system.
The diverted alerts are not discarded: in each filtering stage they are diverted from the main filteringstream but are still accessible to other filtering systems, including, potentially, copies of the antares systemitself that are tuned to other specific goals. Thus an External Alert Broker (shown in the bottom right ofFigure 1) can utilize the value added material from antares to filter according to alternative needs andpriorities. Custom filters can be applied, allowing users to isolate exactly which of the alerts is of interest tothem and thus address many different goals. These community-derived filtering algorithms will be applied in amulti-step process, allowing for better management of computational resources. By characterizing the alerts,the number of dimensions of feature space can be reduced. More complex filters can be applied to the smallernumber of alerts after initial filtering stages.
An important design consideration throughout the architecture of antares is the structured provision ofcommunity input. While antares will provide the overarching design of the alert analysis, it is the role of theastrophysical community to provide the specific algorithms used at various places along the filtering process.
2.3 AMELIE
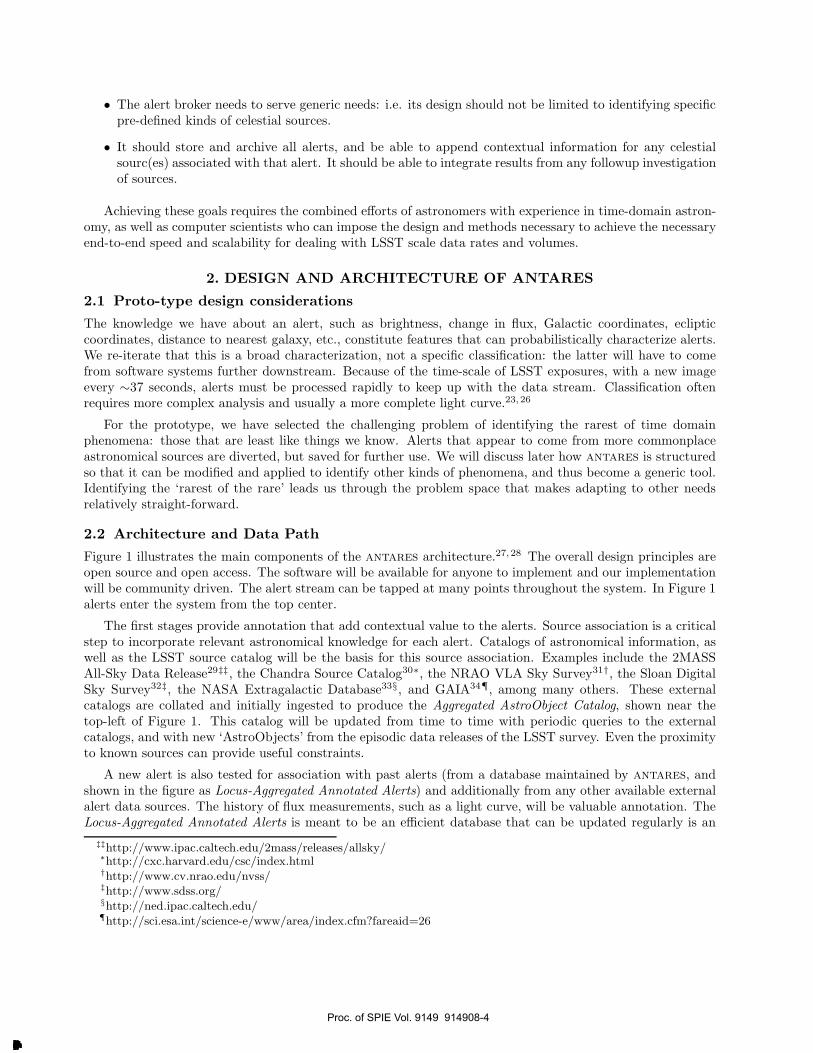
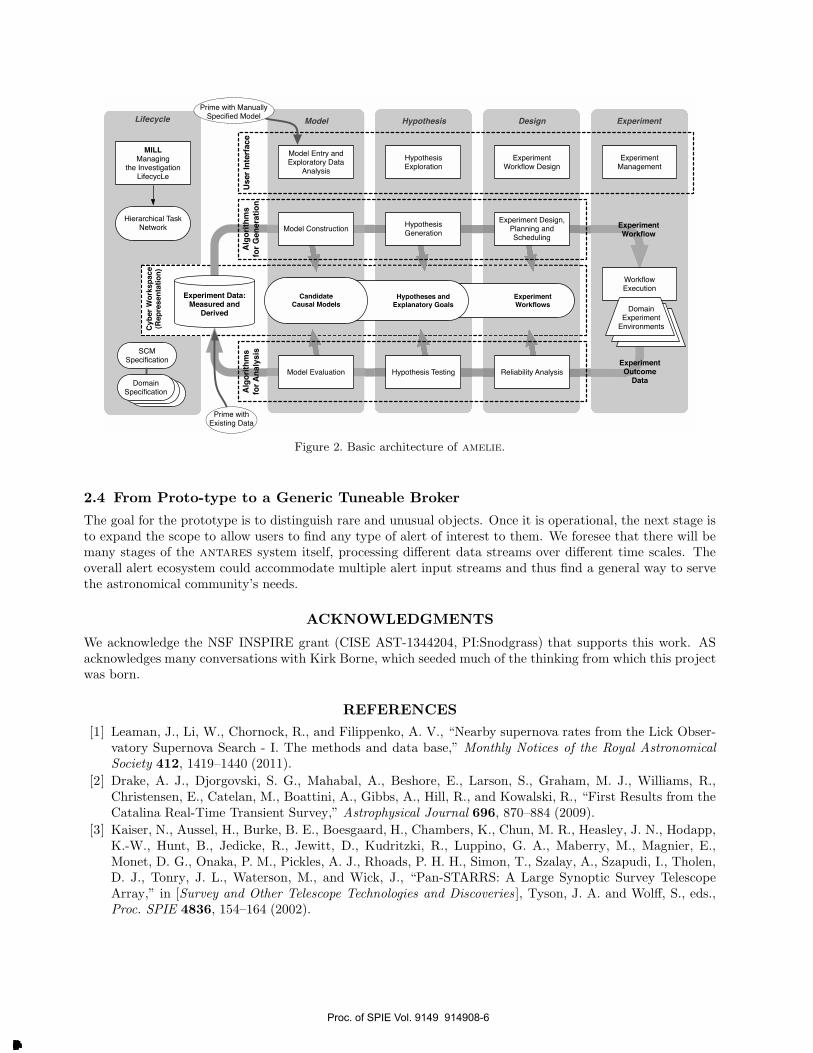
The Arizona Machine-Experimentation Laboratory (amelie), Figure 2), provides a system for constructingand testing structural-causal models.35 This essentially automates the scientific process and allows us to runexperiments to test relationships among features, including relationships that have not yet been apparent. Itcan observe the operation of antares and make it more efficient.
Proc. of SPIE Vol. 9149 914908-5
Downloaded From: http://proceedings.spiedigitallibrary.org/ on 08/29/2014 Terms of Use: http://spiedl.org/terms
r
t _L-1
JPrime with
Existing Data
WorkflowExecution
Experiment Data:Measured and
Derived
ExperimentOutcome
Data
Model Entry and Exploratory Data
Analysis
Hypothesis Exploration
Experiment Workflow Design
Experiment Management
Experiment Design, Planning and Scheduling
Model ConstructionHypothesisGeneration
Model Hypothesis Design Experiment
Us
er
Inte
rfa
ce
Cy
be
r W
ork
sp
ac
e(R
ep
res
en
tati
on
)
Alg
ori
thm
s
for
Ge
ne
rati
on
Model Evaluation Hypothesis Testing Reliability Analysis
Alg
ori
thm
s
for
An
aly
sis
CandidateCausal Models
Hypotheses and Explanatory Goals
ExperimentWorkflows
Hierarchical Task Network
MILLManaging
the InvestigationLifecycLe
Lifecycle
DomainSpecification
SCMSpecification
Prime with ManuallySpecified Model
ExperimentWorkflow
DomainExperiment
Environment
DomainExperiment
Environment
DomainExperiment
Environments
Figure 2. Basic architecture of amelie.
2.4 From Proto-type to a Generic Tuneable Broker
The goal for the prototype is to distinguish rare and unusual objects. Once it is operational, the next stage isto expand the scope to allow users to find any type of alert of interest to them. We foresee that there will bemany stages of the antares system itself, processing different data streams over different time scales. Theoverall alert ecosystem could accommodate multiple alert input streams and thus find a general way to servethe astronomical community’s needs.
ACKNOWLEDGMENTS
We acknowledge the NSF INSPIRE grant (CISE AST-1344204, PI:Snodgrass) that supports this work. ASacknowledges many conversations with Kirk Borne, which seeded much of the thinking from which this projectwas born.
REFERENCES
[1] Leaman, J., Li, W., Chornock, R., and Filippenko, A. V., “Nearby supernova rates from the Lick Obser-vatory Supernova Search - I. The methods and data base,” Monthly Notices of the Royal Astronomical
Society 412, 1419–1440 (2011).
[2] Drake, A. J., Djorgovski, S. G., Mahabal, A., Beshore, E., Larson, S., Graham, M. J., Williams, R.,Christensen, E., Catelan, M., Boattini, A., Gibbs, A., Hill, R., and Kowalski, R., “First Results from theCatalina Real-Time Transient Survey,” Astrophysical Journal 696, 870–884 (2009).
[3] Kaiser, N., Aussel, H., Burke, B. E., Boesgaard, H., Chambers, K., Chun, M. R., Heasley, J. N., Hodapp,K.-W., Hunt, B., Jedicke, R., Jewitt, D., Kudritzki, R., Luppino, G. A., Maberry, M., Magnier, E.,Monet, D. G., Onaka, P. M., Pickles, A. J., Rhoads, P. H. H., Simon, T., Szalay, A., Szapudi, I., Tholen,D. J., Tonry, J. L., Waterson, M., and Wick, J., “Pan-STARRS: A Large Synoptic Survey TelescopeArray,” in [Survey and Other Telescope Technologies and Discoveries ], Tyson, J. A. and Wolff, S., eds.,Proc. SPIE 4836, 154–164 (2002).
Proc. of SPIE Vol. 9149 914908-6
Downloaded From: http://proceedings.spiedigitallibrary.org/ on 08/29/2014 Terms of Use: http://spiedl.org/terms
[4] Law, N. M., Kulkarni, S. R., Dekany, R. G., Ofek, E. O., Quimby, R. M., Nugent, P. E., Surace, J.,Grillmair, C. C., Bloom, J. S., Kasliwal, M. M., Bildsten, L., Brown, T., Cenko, S. B., Ciardi, D., Croner,E., Djorgovski, S. G., van Eyken, J., Filippenko, A. V., Fox, D. B., Gal-Yam, A., Hale, D., Hamam, N.,Helou, G., Henning, J., Howell, D. A., Jacobsen, J., Laher, R., Mattingly, S., McKenna, D., Pickles, A.,Poznanski, D., Rahmer, G., Rau, A., Rosing, W., Shara, M., Smith, R., Starr, D., Sullivan, M., Velur,V., Walters, R., and Zolkower, J., “The Palomar Transient Factory: System Overview, Performance, andFirst Results,” Publications of the Astronomical Society of the Pacific 121, 1395–1408 (2009).
[5] Hadjiyska, E., Rabinowitz, D., Baltay, C., Ellman, N., Nugent, P., Zinn, R., Horowitz, B., McKinnon, R.,and Miller, L. R., “La Silla-QUEST Variability Survey in the Southern Hemisphere,” in [New Horizons in
Time-Domain Astronomy ], Griffin, E., Hanisch, R., and Seaman, R., eds., IAU Symposium 285, 324–326(2012).
[6] Williams, R. D., Djorgovski, S. G., Drake, A. J., Graham, M. J., and Mahabal, A., “Skyalert: Real-timeAstronomy for You and Your Robots,” in [Astronomical Data Analysis Software and Systems XVIII ],Bohlender, D. A., Durand, D., and Dowler, P., eds., Astronomical Society of the Pacific Conference
Series 411, 115 (2009).
[7] Bloom, J. S., Richards, J. W., Nugent, P. E., Quimby, R. M., Kasliwal, M. M., Starr, D. L., Poznanski,D., Ofek, E. O., Cenko, S. B., Butler, N. R., Kulkarni, S. R., Gal-Yam, A., and Law, N., “AutomatingDiscovery and Classification of Transients and Variable Stars in the Synoptic Survey Era,” PASP 124,1175–1196 (2012).
[8] Kulkarni, S. R., “Cosmic Explosions (Optical Transients),” ArXiv e-prints (2012). arXiv:1202.2381.
[9] van Haarlem, M. P., Wise, M. W., Gunst, A. W., Heald, G., McKean, J. P., Hessels, J. W. T., de Bruyn,A. G., Nijboer, R., Swinbank, J., Fallows, R., et al., “LOFAR: The LOw-Frequency ARray,” Astronomy
& Astrophysics 556, A2 (2013).
[10] Atwood, W. B., Abdo, A. A., Ackermann, M., Althouse, W., Anderson, B., Axelsson, M., Baldini, L.,Ballet, J., Band, D. L., Barbiellini, G., et al., “The Large Area Telescope on the Fermi Gamma-Ray SpaceTelescope Mission,” Astrophysical Journal 697, 1071–1102 (2009).
[11] Krabbendam, V. L. and Sweeney, D., “The Large Synoptic Survey Telescope Preliminary DesignOverview,” in [Ground-based and Airborne Telescopes III ], Stepp, L. M., Gilmozzi, R., and Hall, H. J.,eds., Proc. SPIE 7733 (2010).
[12] LSST Science Collaboration, Abell, P. A., Allison, J., Anderson, S. F., Andrew, J. R., Angel, J. R. P.,Armus, L., Arnett, D., Asztalos, S. J., Axelrod, T. S., et al., “LSST Science Book, Version 2.0,” ArXiv
e-prints (2009). arXiv:0912.0201.
[13] Williams, R. D. and Seaman, R., “VOEvent: Information Infrastructure for Real-Time Astronomy,” in[Astronomical Data Analysis Software and Systems XV ], Gabriel, C., Arviset, C., Ponz, D., and Enrique,S., eds., Astronomical Society of the Pacific Conference Series 351, 637 (2006).
[14] Seaman, R., Williams, R., Allan, A., Barthelmy, S., Bloom, J., Brewer, J., Denny, R., Fitzpatrick,M., Graham, M., Gray, N., Hessman, F., Marka, S., Rots, A., Vestrand, T., and Wozniak, P., “IVOARecommendation: Sky Event Reporting Metadata Version 2.0,” ArXiv e-prints (2011). arXiv:1110.0523.
[15] Ridgway, S. T., “How Many Galactic Variables will LSST Detect?,” in [American Astronomical Society
Meeting Abstracts #219 ], American Astronomical Society Meeting Abstracts 219, #156.12 (2012).
[16] Grav, T., Jedicke, R., Denneau, L., Chesley, S., Holman, M. J., and Spahr, T. B., “The Pan-STARRSSynthetic Solar System Model: A Tool for Testing and Efficiency Determination of the Moving ObjectProcessing System,” PASP 123, 423–447 (2011).
[17] Herwig, F., “Evolution of Asymptotic Giant Branch Stars,” ARAA 43, 435–479 (2005).
[18] Iben, Jr., I., Kaler, J. B., Truran, J. W., and Renzini, A., “On the Evolution of Those Nuclei of PlanetaryNebulae That Experience a Final Helium Shell Flash,” ApJ 264, 605–612 (1983).
[19] Gal-Yam, A., “Luminous Supernovae,” Science 337, 927 (2012).
[20] Sigg, D. and LIGO Scientific Collaboration, “Status of the LIGO detectors,” Classical and Quantum
Gravity 25(11), 114041 (2008).
[21] Nissanke, S., Kasliwal, M., and Georgieva, A., “Identifying Elusive Electromagnetic Counterparts toGravitational Wave Mergers: An End-to-end Simulation,” ApJ 767, 124 (2013).
Proc. of SPIE Vol. 9149 914908-7
Downloaded From: http://proceedings.spiedigitallibrary.org/ on 08/29/2014 Terms of Use: http://spiedl.org/terms
[22] Matheson, T., Fan, X., Green, R., McConnachie, A., Newman, J., Olsen, K., Szkody, P., and Wood-Vasey,W. M., “Spectroscopy in the Era of LSST,” ArXiv e-prints (2013). arXiv:1311.2496.
[23] Richards, J. W., Starr, D. L., Butler, N. R., Bloom, J. S., Brewer, J. M., Crellin-Quick, A., Higgins, J.,Kennedy, R., and Rischard, M., “On Machine-learned Classification of Variable Stars with Sparse andNoisy Time-series Data,” ApJ 733, 10 (2011).
[24] Angeloni, R., Contreras Ramos, R., Catelan, M., Dekany, I., Gran, F., Alonso-Garcıa, J., Hempel, M.,Navarrete, C., Andrews, H., Aparicio, A., Beamın, J. C., Berger, C., Borissova, J., Contreras Pena, C.,Cunial, A., de Grijs, R., Espinoza, N., Eyheramendy, S., Ferreira Lopes, C. E., Fiaschi, M., Hajdu,G., Han, J., He lminiak, K. G., Hempel, A., Hidalgo, S. L., Ita, Y., Jeon, Y.-B., Jordan, A., Kwon, J.,Lee, J. T., Martın, E. L., Masetti, N., Matsunaga, N., Milone, A. P., Minniti, D., Morelli, L., Murgas,F., Nagayama, T., Navarro, C., Ochner, P., Perez, P., Pichara, K., Rojas-Arriagada, A., Roquette, J.,Saito, R. K., Siviero, A., Sohn, J., Sung, H.-I., Tamura, M., Tata, R., Tomasella, L., Townsend, B.,and Whitelock, P., “The VVV Templates Project. Towards an Automated Classification of VVV Light-Curves. I. Building a database of stellar variability in the near-infrared,” Astronomy & Astrophysics in
press (2014). arXiv:1405.4517.
[25] Masci, F. J., Hoffman, D. I., Grillmair, C. J., and Cutri, R. M., “Automated Classification of PeriodicVariable Stars detected by the Wide-field Infrared Survey Explorer,” Astronomical Journal in press
(2014). arXiv:1402.0125.
[26] Graham, M. J., Djorgovski, S. G., Mahabal, A. A., Donalek, C., and Drake, A. J., “Machine-AssistedDiscovery of Relationships in Astronomy,” MNRAS 431, 2371–2384 (2013).
[27] Matheson, T., Saha, A., Snodgrass, R., and Kececioglu, J., “ANTARES: A Prototype Transient BrokerSystem,” in [American Astronomical Society Meeting ], American Astronomical Society Meeting Abstracts
223, #343.02 (2014).
[28] Matheson, T., Saha, A., Snodgrass, R., and Kececioglu, J., “ANTARES: The Arizona-NOAO Tempo-ral Analysis and Response to Events System,” in [Hot-Wiring the Transient Universe 3 ], Wozniak, P.,Graham, M., and Mahabal, A., eds. (2014).
[29] Skrutskie, M. F., Cutri, R. M., Stiening, R., Weinberg, M. D., Schneider, S., Carpenter, J. M., Beichman,C., Capps, R., Chester, T., Elias, J., Huchra, J., Liebert, J., Lonsdale, C., Monet, D. G., Price, S., Seitzer,P., Jarrett, T., Kirkpatrick, J. D., Gizis, J. E., Howard, E., Evans, T., Fowler, J., Fullmer, L., Hurt, R.,Light, R., Kopan, E. L., Marsh, K. A., McCallon, H. L., Tam, R., Van Dyk, S., and Wheelock, S., “TheTwo Micron All Sky Survey (2MASS),” Astronomical Journal 131, 1163–1183 (2006).
[30] Evans, I. N., Primini, F. A., Glotfelty, K. J., Anderson, C. S., Bonaventura, N. R., Chen, J. C., Davis,J. E., Doe, S. M., Evans, J. D., Fabbiano, G., Galle, E. C., Gibbs, II, D. G., Grier, J. D., Hain, R. M., Hall,D. M., Harbo, P. N., (Helen He, X., Houck, J. C., Karovska, M., Kashyap, V. L., Lauer, J., McCollough,M. L., McDowell, J. C., Miller, J. B., Mitschang, A. W., Morgan, D. L., Mossman, A. E., Nichols,J. S., Nowak, M. A., Plummer, D. A., Refsdal, B. L., Rots, A. H., Siemiginowska, A., Sundheim, B. A.,Tibbetts, M. S., Van Stone, D. W., Winkelman, S. L., and Zografou, P., “The Chandra Source Catalog,”Astrophysical Journal Supplement 189, 37–82 (2010).
[31] Condon, J. J., Cotton, W. D., Greisen, E. W., Yin, Q. F., Perley, R. A., Taylor, G. B., and Broderick,J. J., “The NRAO VLA Sky Survey,” Astronomical Journal 115, 1693–1716 (1998).
[32] Abazajian, K. N., Adelman-McCarthy, J. K., Agueros, M. A., Allam, S. S., Allende Prieto, C., An, D.,Anderson, K. S. J., Anderson, S. F., Annis, J., Bahcall, N. A., et al., “The Seventh Data Release of theSloan Digital Sky Survey,” Astrophysical Journal Supplement 182, 543–558 (2009).
[33] Helou, G., Madore, B. F., Schmitz, M., Bicay, M. D., Wu, X., and Bennett, J., “The NASA/IPACextragalactic database.,” in [Databases and On-line Data in Astronomy ], Albrecht, M. A. and Egret, D.,eds., Astrophysics and Space Science Library 171, 89–106 (1991).
[34] Cacciari, C., “GAIA: the mission and (some of) its scientific applications,” Memorie della Societ Astro-
nomica Italiana 80, 97 (2009).
[35] Morrison, C. and Snodgrass, R. T., “Computer Science Can Use More Science,” Communications of the
ACM 54, 36 (2011).
Proc. of SPIE Vol. 9149 914908-8
Downloaded From: http://proceedings.spiedigitallibrary.org/ on 08/29/2014 Terms of Use: http://spiedl.org/terms