Embed Size (px)
Citation preview

Anti-infectives: the evidence
base or lack thereof!
Andrew Lovering
Antimicrobial Reference Laboratory
North Bristol NHS Trust

Where is TDM useful?
Where exposure predicts toxicity – Aminoglycosides, vancomycin, colistin, ethambutol,
cycloserine, flucytosine, voriconazole
Where exposure predicts clinical cure or
resistance emergence – Teicoplanin, vancomycin, posaconazole, itraconazole
Where dose poorly predicts exposure – Physiological abnormalities, extra-corporeal support, oral
agents

Data Sources to Support TDM
Linking exposure to toxicity – Animal studies
– Case reports
– Clinical trials
Linking exposure to outcome – Case reports
– In vitro modelling
– In vivo modelling (animals)
– Clinical trials (confirmatory)
– In silico

Pharmacokinetics/Pharmacodynamics
Nicolau. 2008 Crit Care 12(Suppl 4):S2
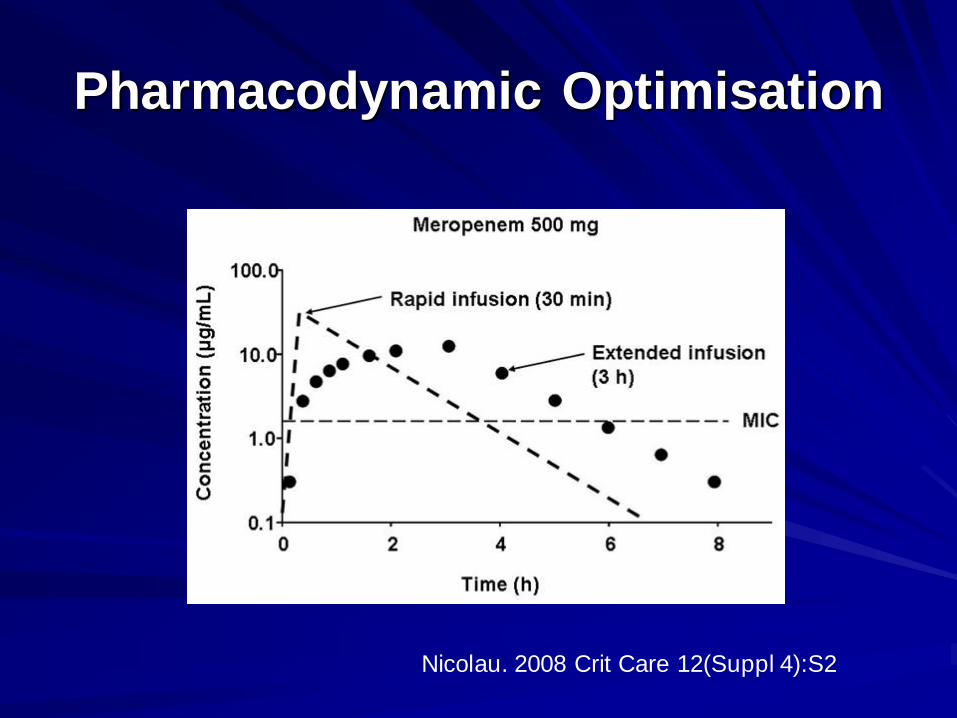
Pharmacodynamic Optimisation
Nicolau. 2008 Crit Care 12(Suppl 4):S2

The TDM Paradigm
0
2
4
6
8
10
12
14
16
0 20 40 60
Time (h)
Co
ncen
trati
on
(m
g/L
)
Gentamicin
0
1
2
3
4
5
6
7
8
9
0 10 20 30
Time (h)C
on
cen
trati
on
(m
g/L
)
Ciprofloxacin
Toxic Concentration Sub-therapeutic Concentration (E.coli)

TDM in Reality
Pascual A et al. Clin Infect Dis. 2012;55:381-390

TDM for Vancomycin
First isolated 1953 and approved 1958 – Pre 5-10 mg/L and Post 20-40 mg/L
Rybak et al. Jan 2009. (AJHSP 66:82-98)* – Pre dose after 4th dose
– Target exposure of AUC:MIC >400 (S.aureus)
– <10 mg/L promotes resistance
– 15-20 mg/L for isolate with MIC of 1mg/L
– Loading dose of 25-30 mg/kg in serious sepsis (ABW)
*Infectious Diseases Society of America
American Society of Health-System Pharmacists
Society of Infectious Diseases Pharmacists

Use of the 2009 Consensus
Guidelines
163 US hospital responses to survey
Most now only use trough levels
Most target levels >10 mg/L and 15-20
mg/L in complicated cases
Few hospitals use loading doses
Very few hospitals dose on the basis of
ABW
Davis . September 2013. Pharmacotherapy ePub.

Vancomycin Since 2009
Kullar (CID 2011); Brown (AAC 2012); Holmes (AAC
2013)
– AUC:MIC targets of 373-453
Casapao (AAC 2013); Jacob (IJAA 2013)
– High MIC (>1.5) associated with increased mortality and
treatment failure
VanHal (AAC 2013)
– Nephrotoxicity risk increases with trough concentration and
duration
Cianferoni (Infection 2013); Norton (JAC 2013)
– Continuous infusion levels >30 mg/L increase risk of AKI

Vancomycin TDM Post 2013
Consensus Guidelines II in draft (2014/5) – Reaffirm AUC:MIC of >400
– Confirm trough of 15-20mg/L and extend to children
– Loading algorithm for >2g and recommendations in
obesity
– Propose early monitoring (<24h)
– Propose dosing in dialysis
– Propose CI limit of 30 mg/L and closer monitoring
– Clarify link between exposure and nephrotoxicity
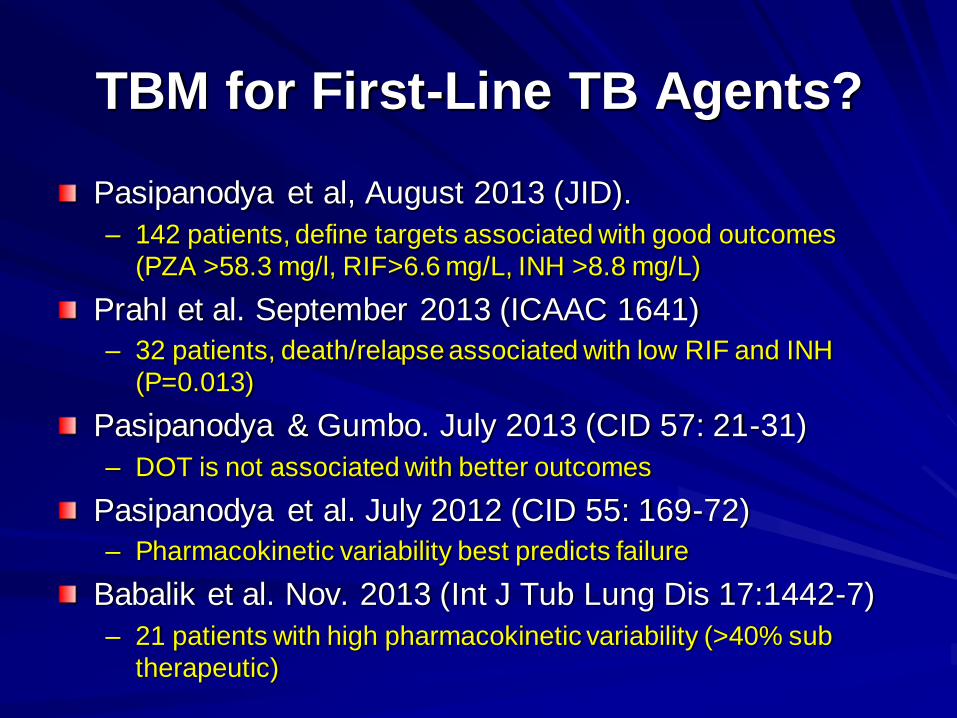
TBM for First-Line TB Agents?
Pasipanodya et al, August 2013 (JID).
– 142 patients, define targets associated with good outcomes
(PZA >58.3 mg/l, RIF>6.6 mg/L, INH >8.8 mg/L)
Prahl et al. September 2013 (ICAAC 1641)
– 32 patients, death/relapse associated with low RIF and INH
(P=0.013)
Pasipanodya & Gumbo. July 2013 (CID 57: 21-31)
– DOT is not associated with better outcomes
Pasipanodya et al. July 2012 (CID 55: 169-72)
– Pharmacokinetic variability best predicts failure
Babalik et al. Nov. 2013 (Int J Tub Lung Dis 17:1442-7)
– 21 patients with high pharmacokinetic variability (>40% sub
therapeutic)

Drug concentration levels predictive of optimal: 2-months and long-term outcomes, 142 patients
Drug Odds ratio (95% CI) for poor long-term outcome
Any one drug above threshold 7.57 (2.57 – 22.34)
Any two above threshold 2.65 (0.99 – 7.18)
All three above threshold *** Reference
Drug Odds ratio (95% CI) for poor long-term outcome
Any one drug above threshold 7.57 (2.57 – 22.34)
Any two above threshold 2.65 (0.99 – 7.18)
All three above threshold *** Reference
Drug Peak concentration threshold (mg/L): 2-months
Threshold AUC (mg*h/L) overall long-term outcomes
Pyrazinamide 58.3 363
Rifampin 6.6 13
Isoniazid 8.8 52
Drug Peak concentration threshold (mg/L): 2-months
Threshold AUC (mg*h/L) overall long-term outcomes
Pyrazinamide 58.3 363
Rifampin 6.6 13
Isoniazid 8.8 52
Pasipanodya et al 2013 JID
Drug Odds ratio (95% CI) for poor long-term outcome
Any one drug above threshold 7.57 (2.57 – 22.34)
Any two drugs above threshold 2.65 (0.99 – 7.18)
All three drugs above threshold Reference
Drug Odds ratio (95% CI) for poor long-term outcome
Any one drug above threshold 7.57 (2.57 – 22.34)
Any two drugs above threshold 2.65 (0.99 – 7.18)
All three drugs above threshold Reference
1

TDM for First-Line TB Agents
Pasipanodya et al. 2013. Journal Infectious Diseases

Evidence for TDM in TB
Identification of targets associated with good
outcomes
Confirmation that failure to reach the targets
results in treatment failure
Identification that a significant proportion of
patients have sub-therapeutic levels
Confirmation that TDM can correct sub-
therapeutic levels
No definitive RCT to show that TDM is
effective

Modelling of improved dosing in TB
Dose Optimization
n=25,000 (%)
Standard Therapy (ST)
n=25,000 (%)
Clinical measures Best-case scenario Best-case scenario
Cured 24,393 (98) 18,055 (73)
Cured-prolonged
treatments
15 (0.1) 4,486 (18)
Deaths 3 (0) 1,056 (4)

Antibiotics and Outcome in
Septic Shock
Kumar 2009. Chest 136: 1237-48

Therapeutic Drug Monitoring
– Beta Lactams 30 bed ICU over 11m
Adjusted levels 2x per week for patients
on intermittent or continuous infusion
Target 100% free drug 4-10 times mic
74.5% of patients outside range
– 50.4% below target
– 23.7% above target
Roberts. 2010. IJAA 36:332-339

TDM of Beta Lactams
Indication N Dose ↑ Dose↓
Bacteraemia 18 72% 17%
HAP 89 60% 25%
SSTI 16 50% 19%
Meningitis 17 47% 12%
CAP 47 32% 23%
Urosepsis 7 29% 57%
Roberts. 2010. IJAA 36:332-339

Outcomes of Extended or CI vs. Standard
IV Therapy – Systematic Review
1229 patients in 14 studies
Mainly non-randomised studies
Carbapenems or piperacillin/tazobactam
Moderate to severe sepsis
Mortality significantly (P<0.001) decreased
with extended or continuous infusion
– RR 0.59, 95% CI 0.41-0.83
Falagas. 2013. CID 56:272-282

BLING II: Continuous Infusion
vs. intermittent IV dosing Multicentre, double blind, double dummy
RCT
28 ICUs Australia/New Zealand
Severe sepsis treated with carbapenem or
piperacillin/tazobactam or
ticarcillin/clavulanate
420 recruitment powered to detect
difference in ICU free days
Due to report early 2014
Dulhunty. 2013. Crit Care Resus 15:179-85

Summary
Fundamental basis for dose optimisation of
many drugs established
Large literature base that is rapidly expanding
Systematic reviews and meta analyses
published, but few RCTs
Poor uptake and dissemination of knowledge
Lack of a mechanism to transfer knowledge to
the bedside