Embed Size (px)
Citation preview
U.S. Global Investors, Inc.7900 Callaghan Rd.San Antonio, TX 78229210.308.1234
Anticipate Before You ParticipateUnderstanding Market Volatility of Emerging Markets and Natural
Resources is Key to Managing Expectations
Frank E. HolmesChief Investment Officer
U.S. Global Investors, Inc.
%
%RISK
RET
UR
N
2www.usfunds.com
Multidisciplinary Focus
According to Morningstar, alpha is a measure of the difference between a fund’s actual returns and its expected performance, given its level of risk as measured by beta. A positive alpha indicates the fund has performed better than its beta would predict. In contrast, a negative alpha indicates the fund’s underperformance, given the expectations established by the fund’s beta. All MPT statistics (alpha, beta, and R-squared) are based on a least-squared regression of the fund’s return over Treasury bills (called excess return) and the excess returns of the fund’s benchmark index.
3www.usfunds.com
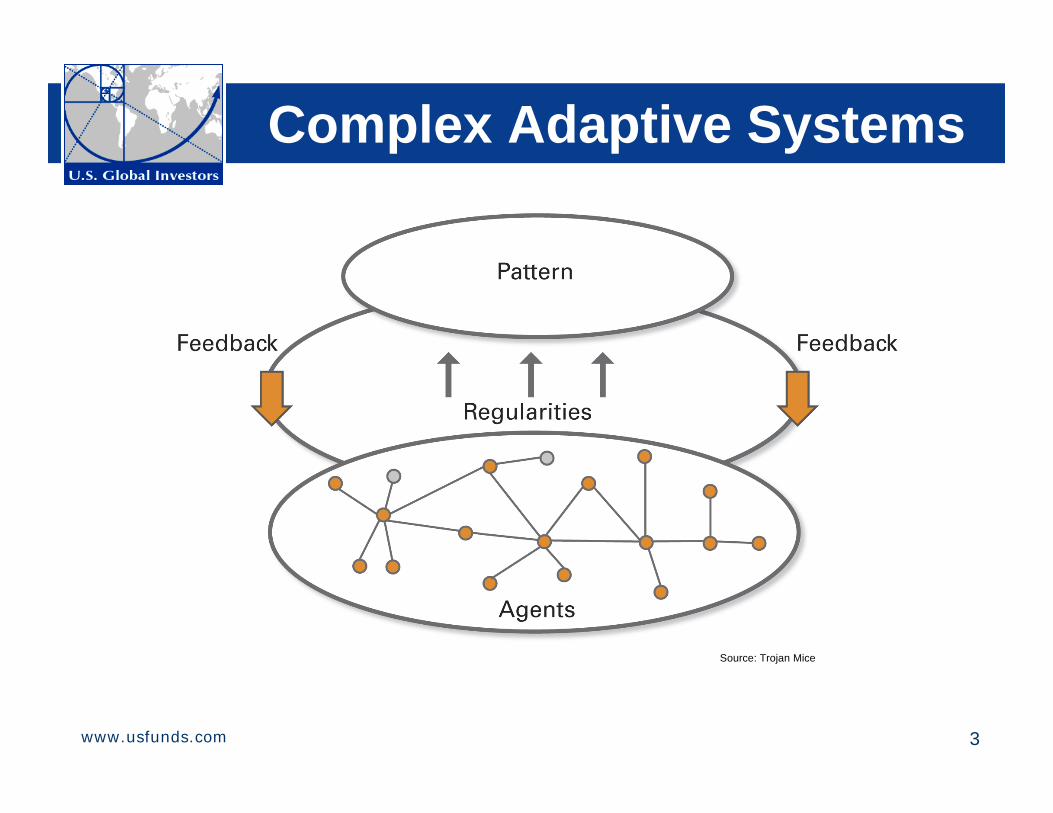
Complex Adaptive Systems
Source: Trojan Mice
4www.usfunds.com
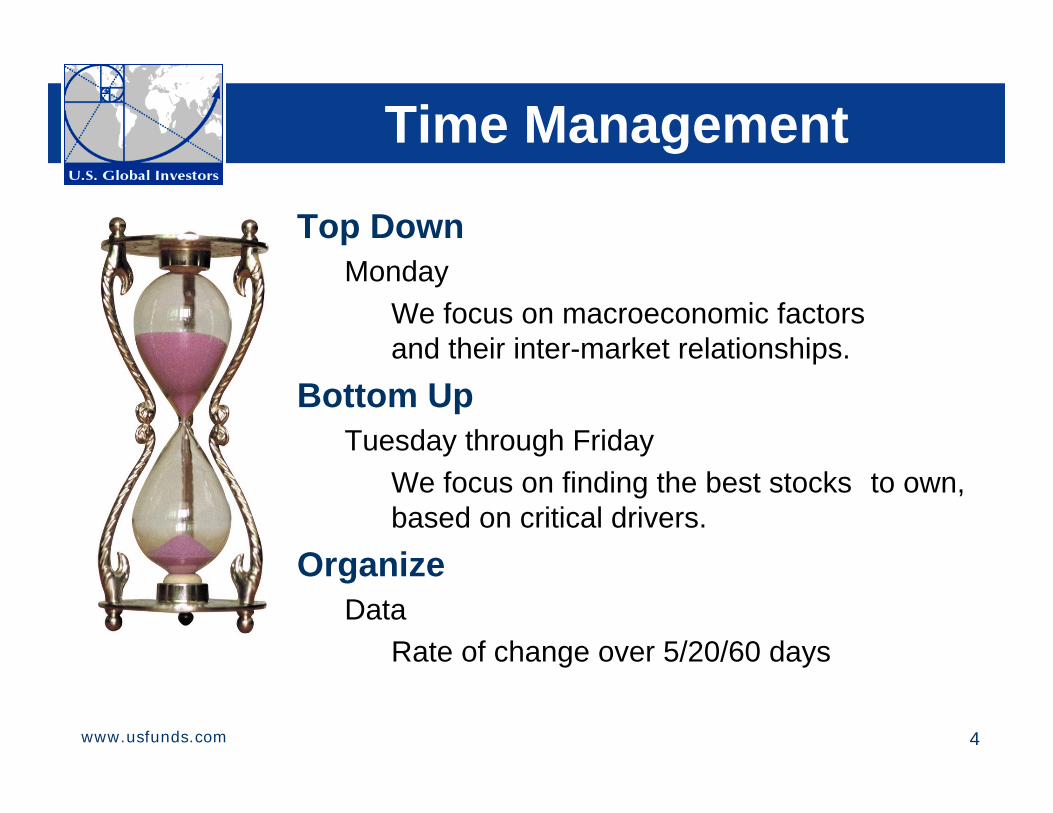
Time Management
Top DownMonday
We focus on macroeconomic factors and their inter-market relationships.
Bottom UpTuesday through Friday
We focus on finding the best stocks to own, based on critical drivers.
OrganizeData
Rate of change over 5/20/60 days
5www.usfunds.com
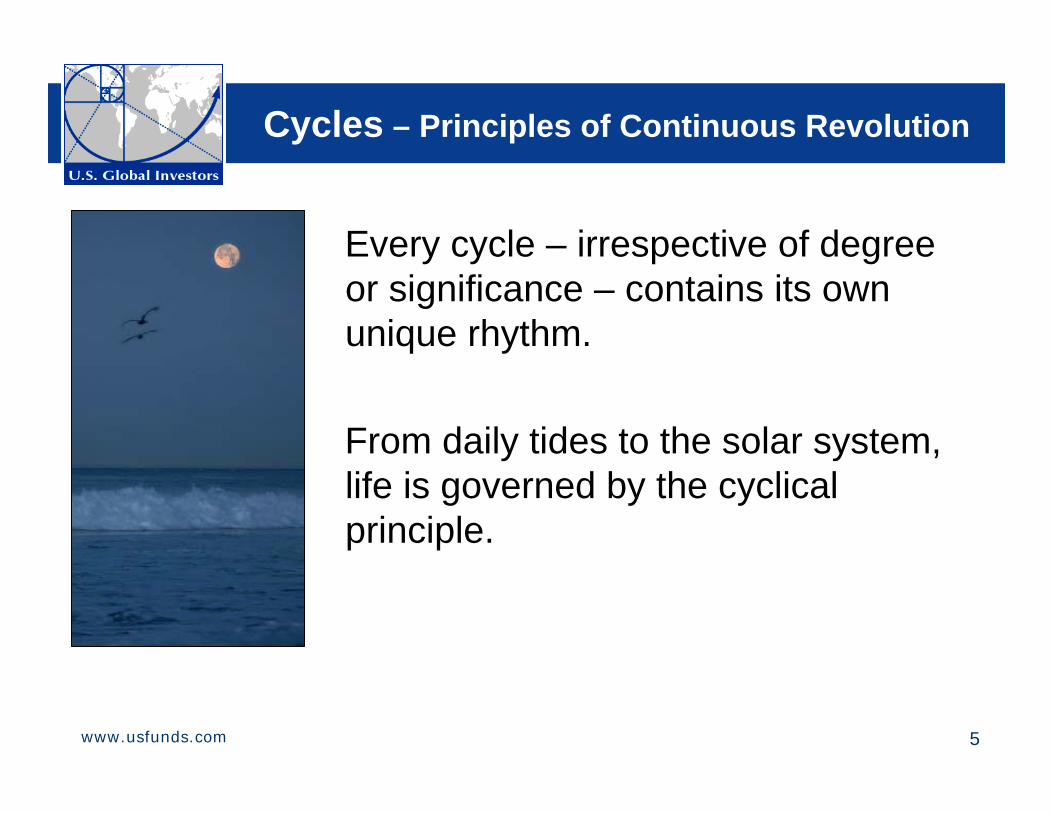
Cycles – Principles of Continuous Revolution
Every cycle – irrespective of degree or significance – contains its own unique rhythm.
From daily tides to the solar system, life is governed by the cyclical principle.
6www.usfunds.com
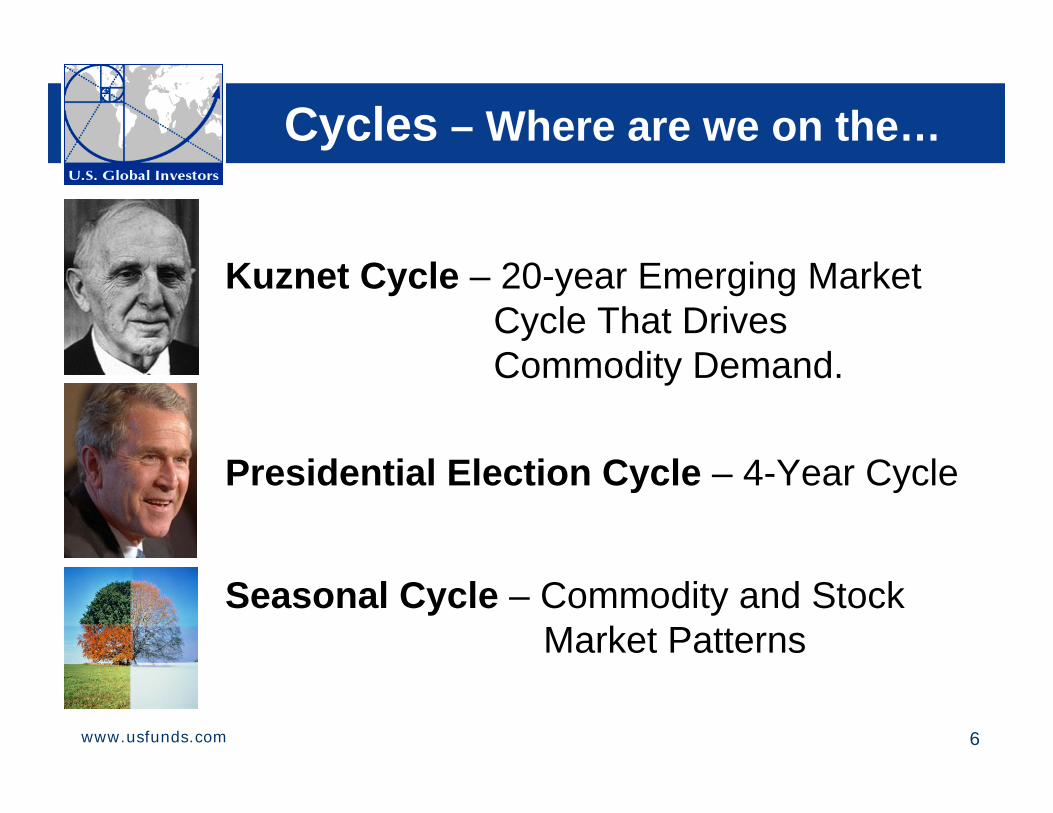
Cycles – Where are we on the…
Kuznet Cycle – 20-year Emerging Market Cycle That Drives Commodity Demand.
Presidential Election Cycle – 4-Year Cycle
Seasonal Cycle – Commodity and Stock Market Patterns
7www.usfunds.com
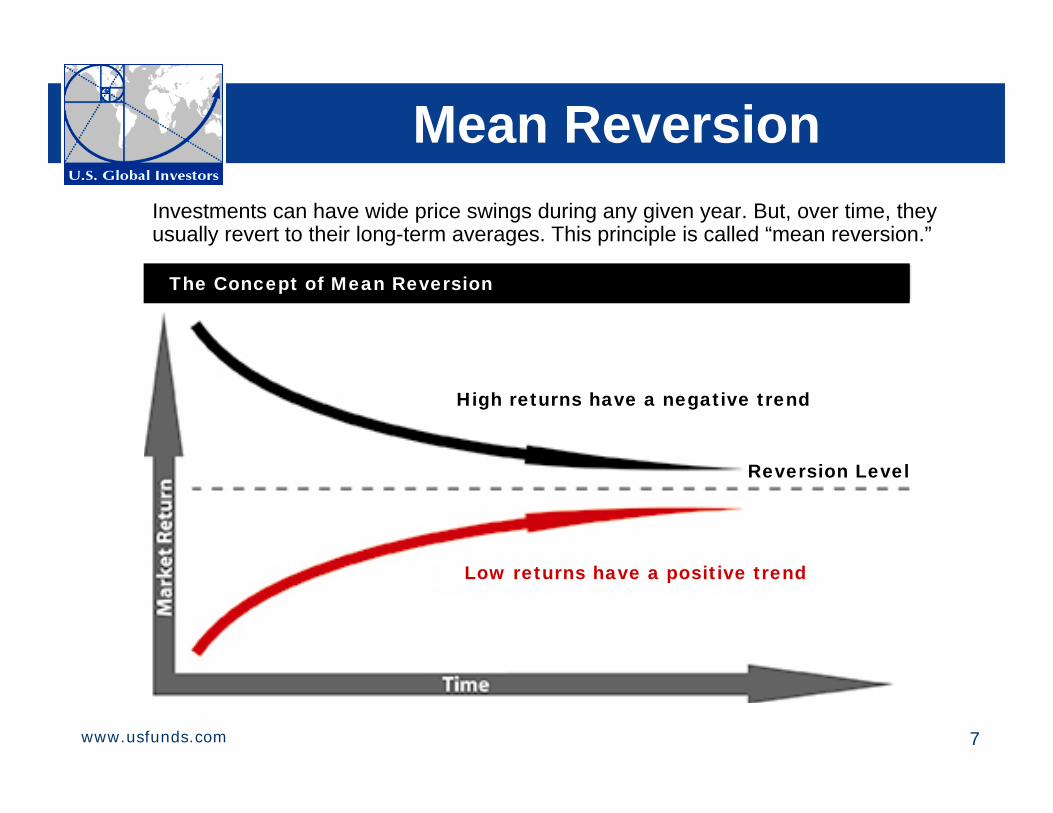
Mean ReversionInvestments can have wide price swings during any given year. But, over time, they usually revert to their long-term averages. This principle is called “mean reversion.”
The Concept of Mean Reversion
Low returns have a positive trend
High returns have a negative trend
Reversion Level
8www.usfunds.com
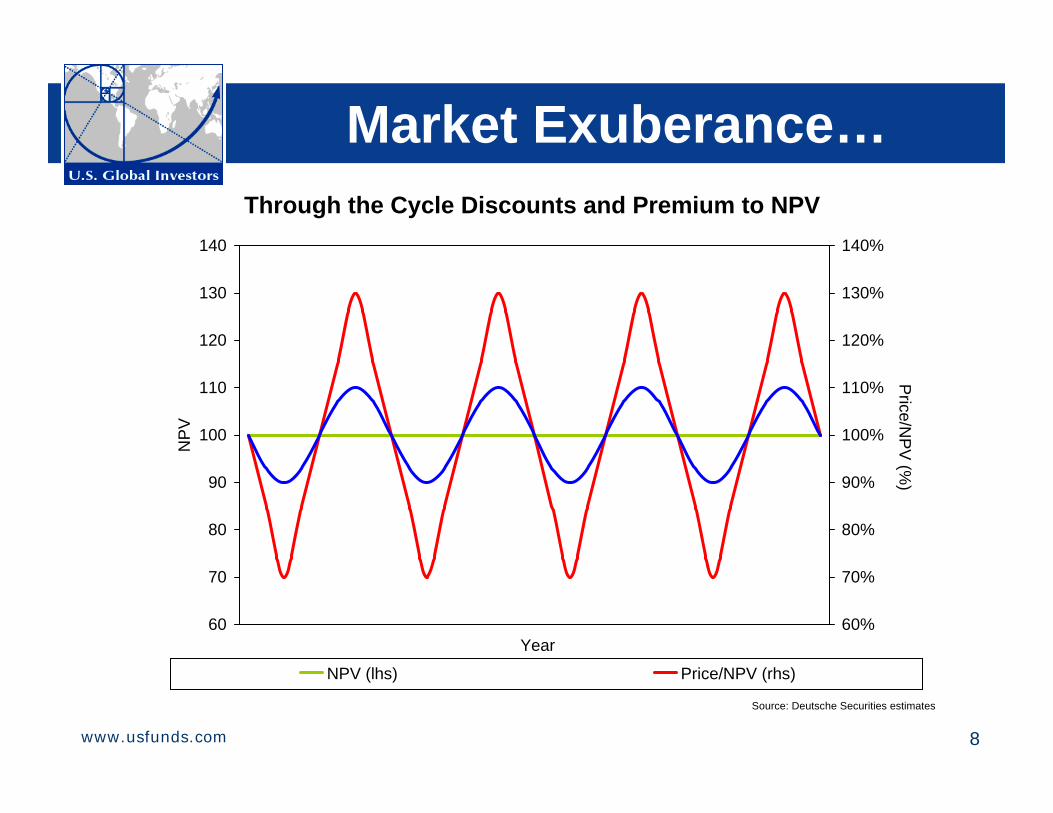
Market Exuberance…
Source: Deutsche Securities estimates
Through the Cycle Discounts and Premium to NPV
60
70
80
90
100
110
120
130
140
NP
V
60%
70%
80%
90%
100%
110%
120%
130%
140%
Year
Price/N
PV
(%)
NPV (lhs) Price/NPV (rhs)
9www.usfunds.com
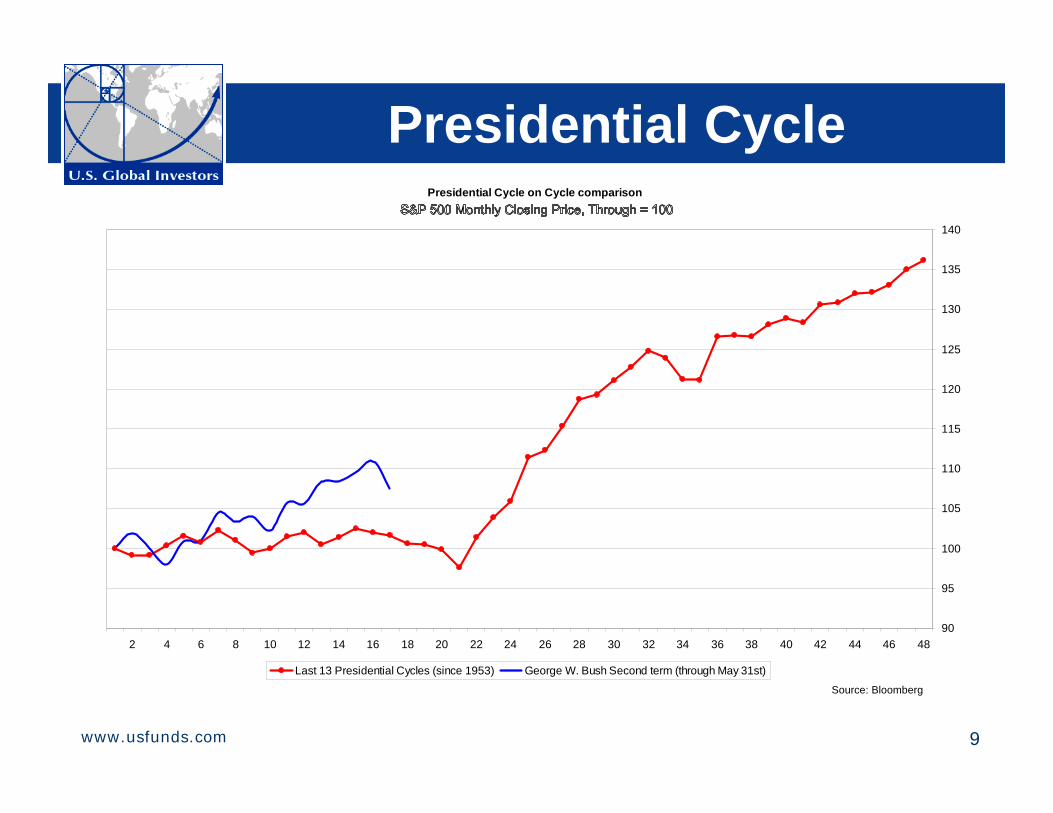
Presidential CyclePresidential Cycle on Cycle comparison
90
95
100
105
110
115
120
125
130
135
140
48464442403836343230282624222018161412108642
Last 13 Presidential Cycles (since 1953) George W. Bush Second term (through May 31st)
Source: Bloomberg
10www.usfunds.com
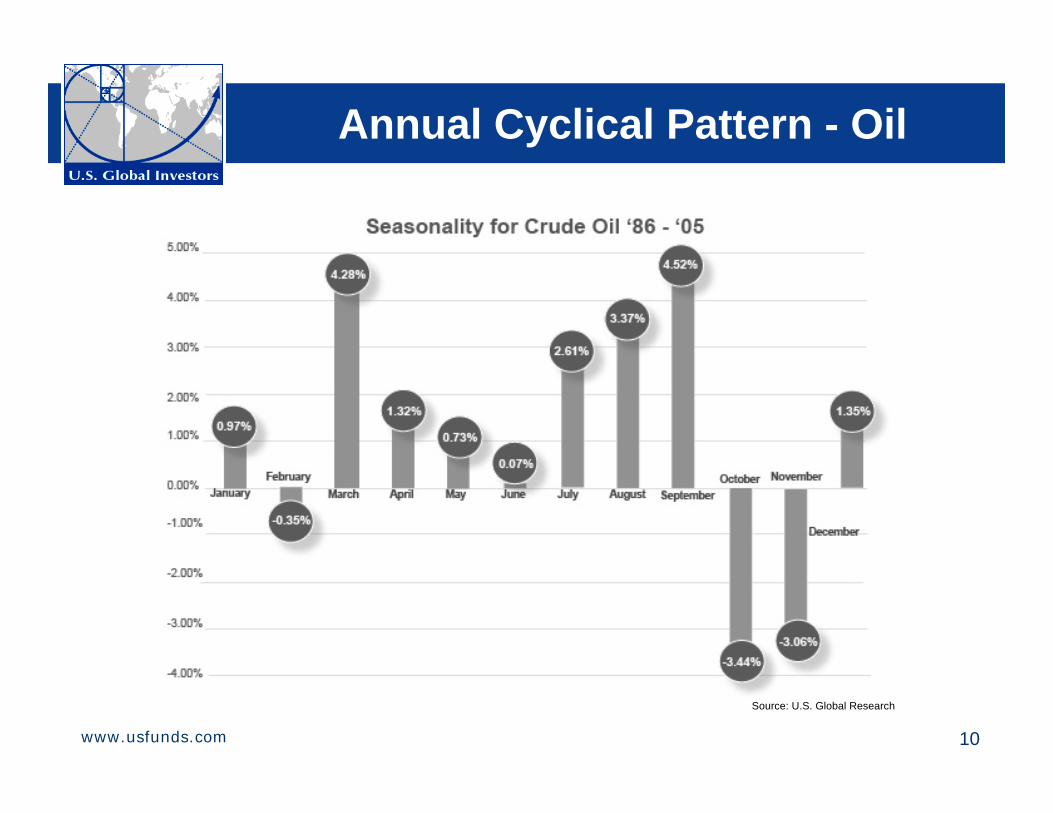
Annual Cyclical Pattern - Oil
Source: U.S. Global Research
11www.usfunds.com
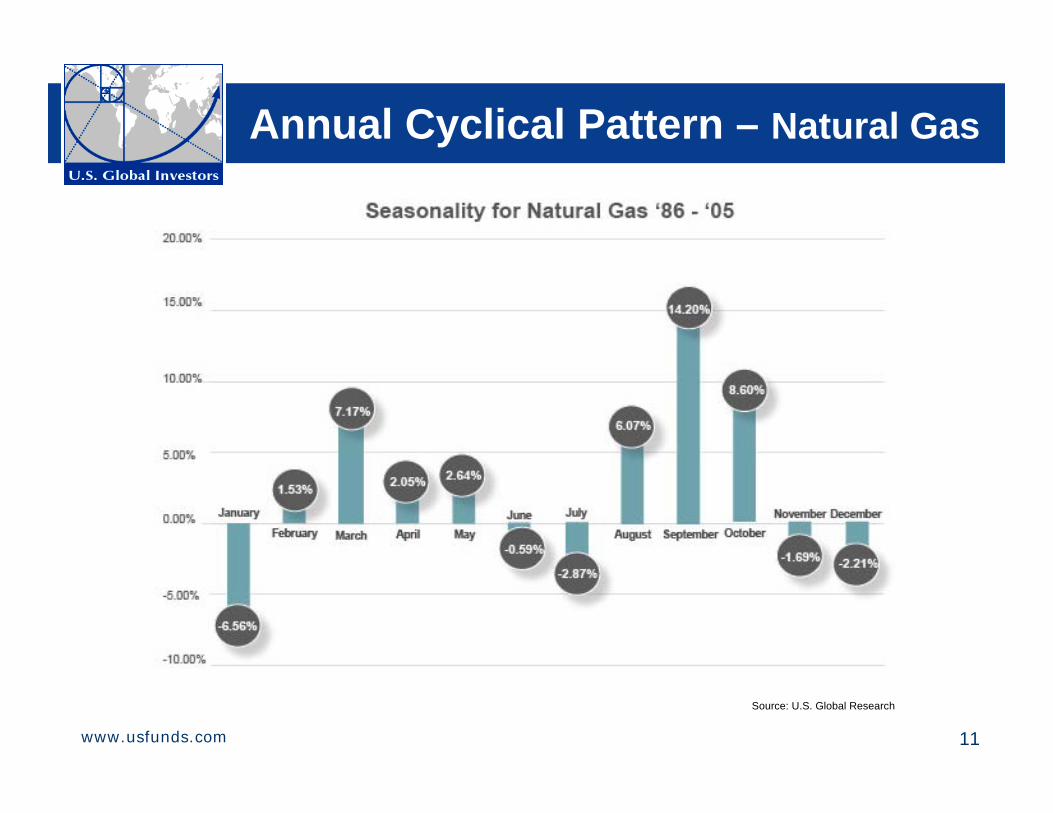
Annual Cyclical Pattern – Natural Gas
Source: U.S. Global Research
12www.usfunds.com
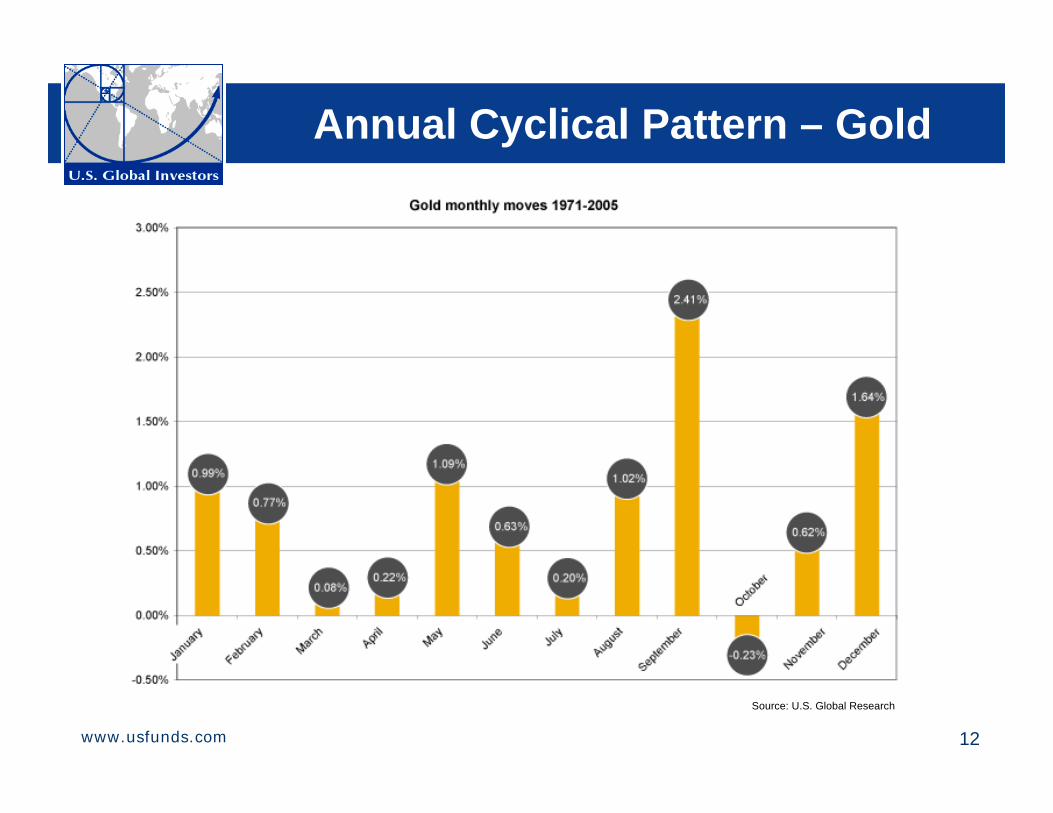
Annual Cyclical Pattern – Gold
Source: U.S. Global Research
13www.usfunds.com
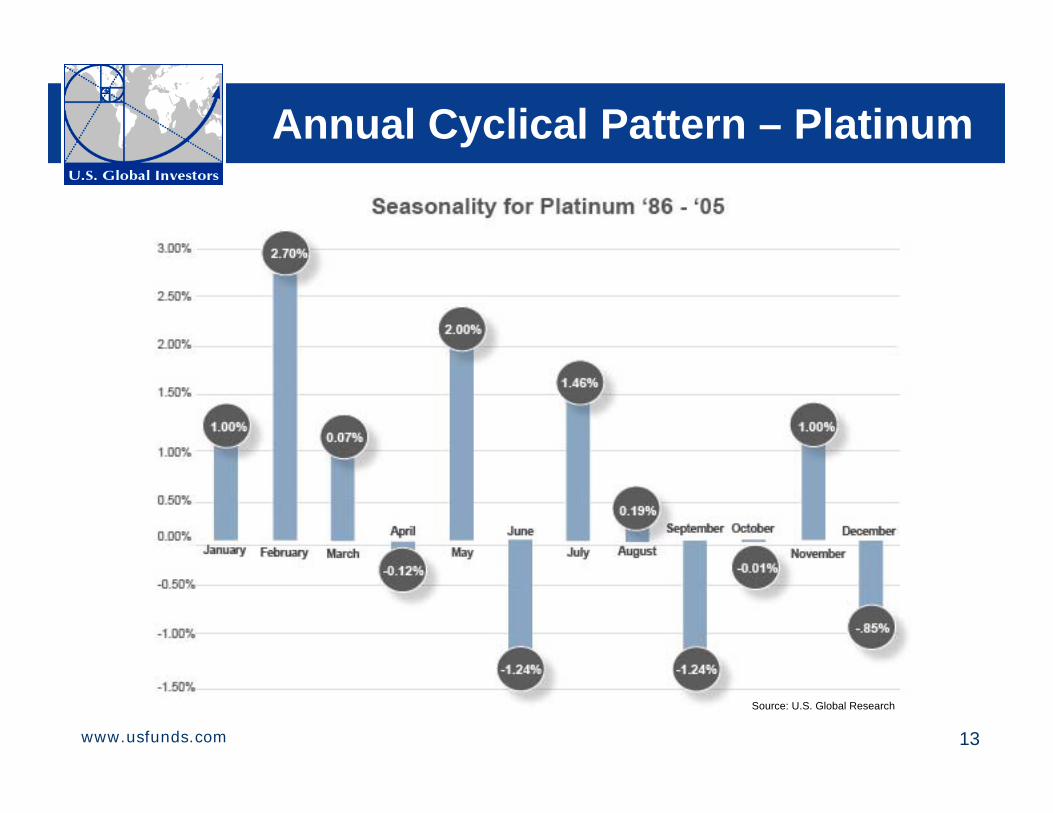
Annual Cyclical Pattern – Platinum
Source: U.S. Global Research
14www.usfunds.com
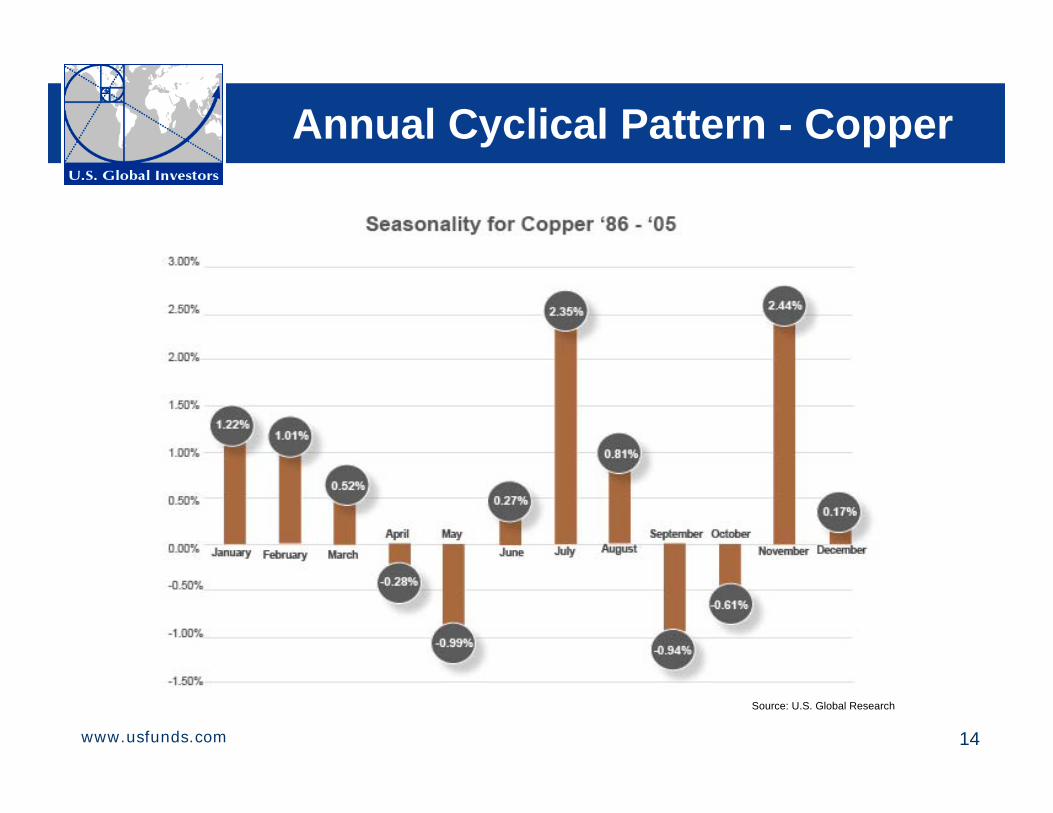
Annual Cyclical Pattern - Copper
Source: U.S. Global Research
15www.usfunds.com
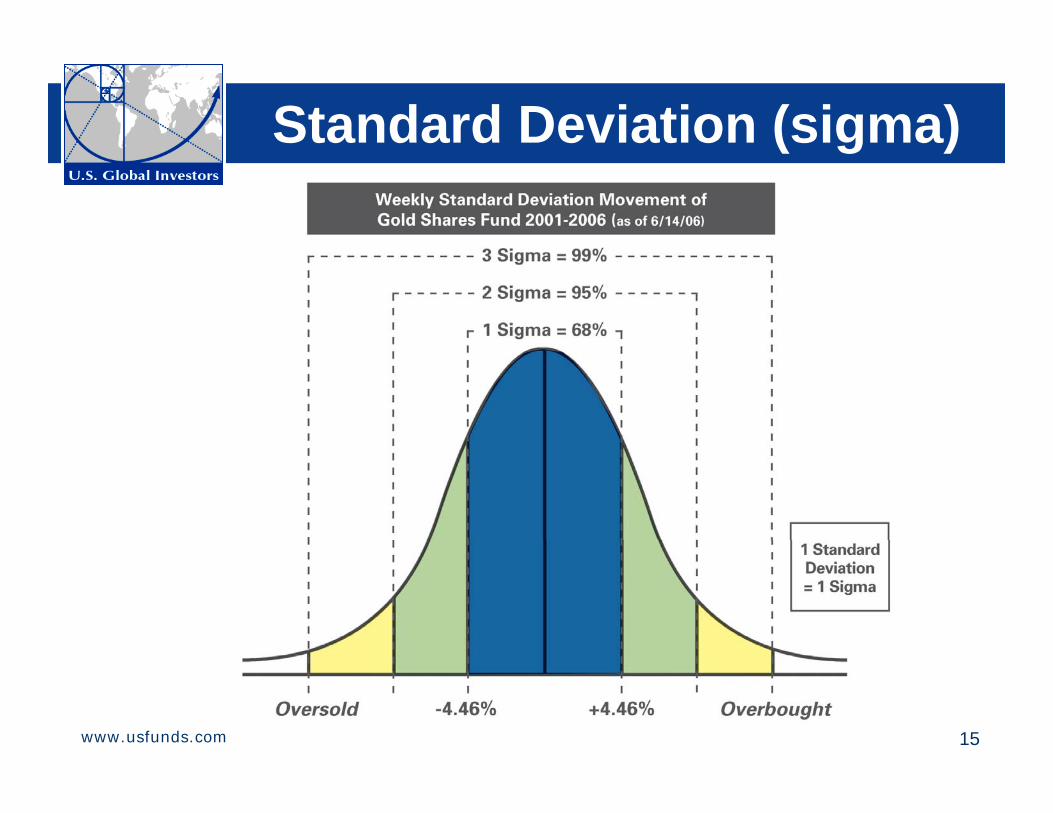
Standard Deviation (sigma)
16www.usfunds.com
-20.00%-15.00%-10.00%
-5.00%0.00%5.00%
10.00%15.00%20.00%25.00%30.00%
6/10
/200
3
8/10
/200
3
10/1
0/20
03
12/1
0/20
03
2/10
/200
4
4/10
/200
4
6/10
/200
4
8/10
/200
4
10/1
0/20
04
12/1
0/20
04
2/10
/200
5
4/10
/200
5
6/10
/200
5
8/10
/200
5
10/1
0/20
05
12/1
0/20
05
2/10
/200
6
4/10
/200
6
6/10
/200
6
Dev -1 Std Dev 1 Std Dev 2 Std Dev -2 Std Dev Mean
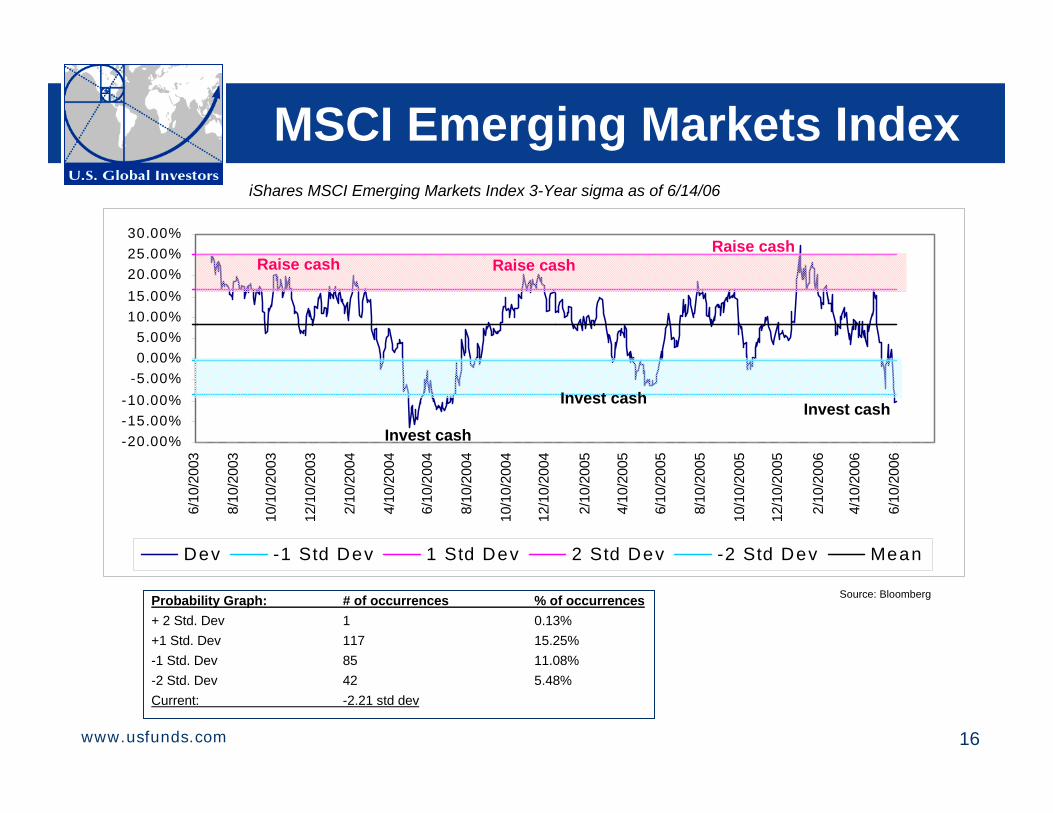
MSCI Emerging Markets Index
Invest cash
Raise cashRaise cash
iShares MSCI Emerging Markets Index 3-Year sigma as of 6/14/06
Invest cash
Probability Graph: # of occurrences % of occurrences+ 2 Std. Dev 1 0.13%+1 Std. Dev 117 15.25%-1 Std. Dev 85 11.08%-2 Std. Dev 42 5.48%Current: -2.21 std dev
Source: Bloomberg
Raise cash
Invest cash
17www.usfunds.com
-40.00%
-20.00%
0.00%
20.00%
40.00%
60.00%
80.00%6/
10/2
003
8/10
/200
3
10/1
0/20
03
12/1
0/20
03
2/10
/200
4
4/10
/200
4
6/10
/200
4
8/10
/200
4
10/1
0/20
04
12/1
0/20
04
2/10
/200
5
4/10
/200
5
6/10
/200
5
8/10
/200
5
10/1
0/20
05
12/1
0/20
05
2/10
/200
6
4/10
/200
6
6/10
/200
6
Dev -1 Std Dev 1 Std Dev 2 Std Dev -2 Std Dev Mean
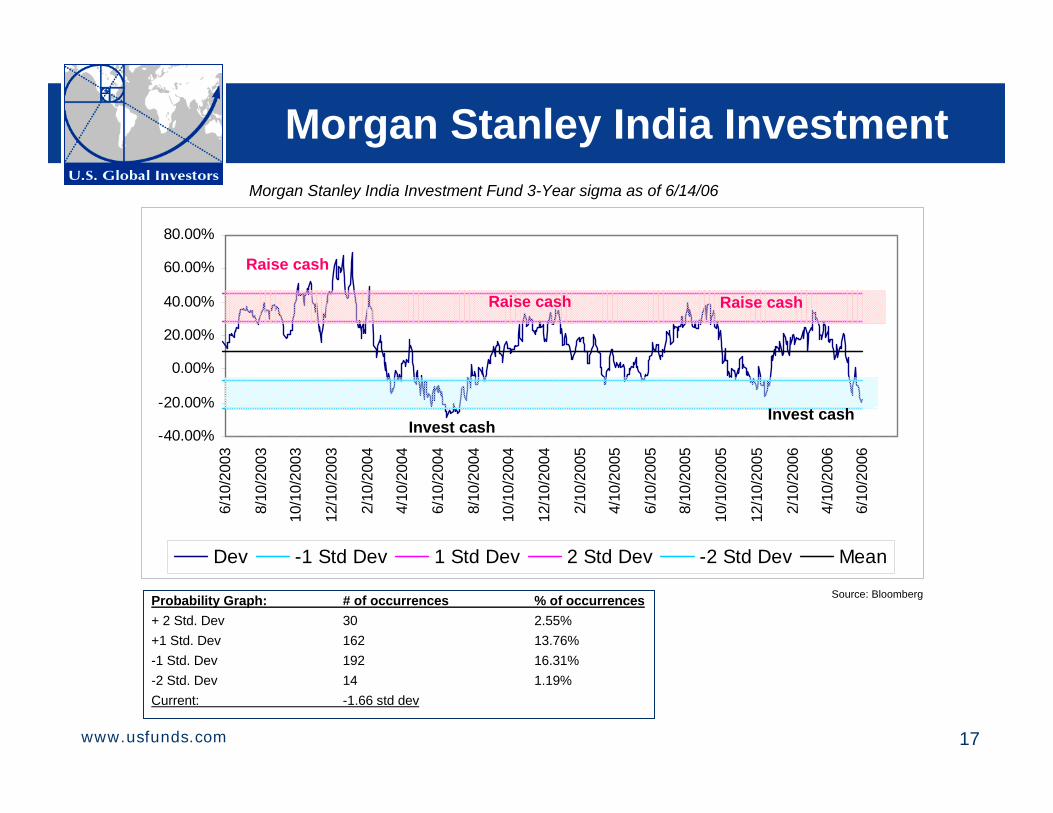
Morgan Stanley India Investment
Invest cash
Raise cash
Raise cash
Morgan Stanley India Investment Fund 3-Year sigma as of 6/14/06
Probability Graph: # of occurrences % of occurrences+ 2 Std. Dev 30 2.55%+1 Std. Dev 162 13.76%-1 Std. Dev 192 16.31%-2 Std. Dev 14 1.19%Current: -1.66 std dev
Source: Bloomberg
Raise cash
Invest cash
18www.usfunds.com
-3 0 .0 0 %
-2 0 .0 0 %
-1 0 .0 0 %
0 .0 0 %
1 0 .0 0 %
2 0 .0 0 %
3 0 .0 0 %
4 0 .0 0 %
5 0 .0 0 %
6/8/
2001
9/8/
2001
12/8
/200
1
3/8/
2002
6/8/
2002
9/8/
2002
12/8
/200
2
3/8/
2003
6/8/
2003
9/8/
2003
12/8
/200
3
3/8/
2004
6/8/
2004
9/8/
2004
12/8
/200
4
3/8/
2005
6/8/
2005
9/8/
2005
12/8
/200
5
3/8/
2006
6/8/
2006
D e v -1 S td D e v 1 S td D e v 2 S td D e v -2 S td D e v M e a n
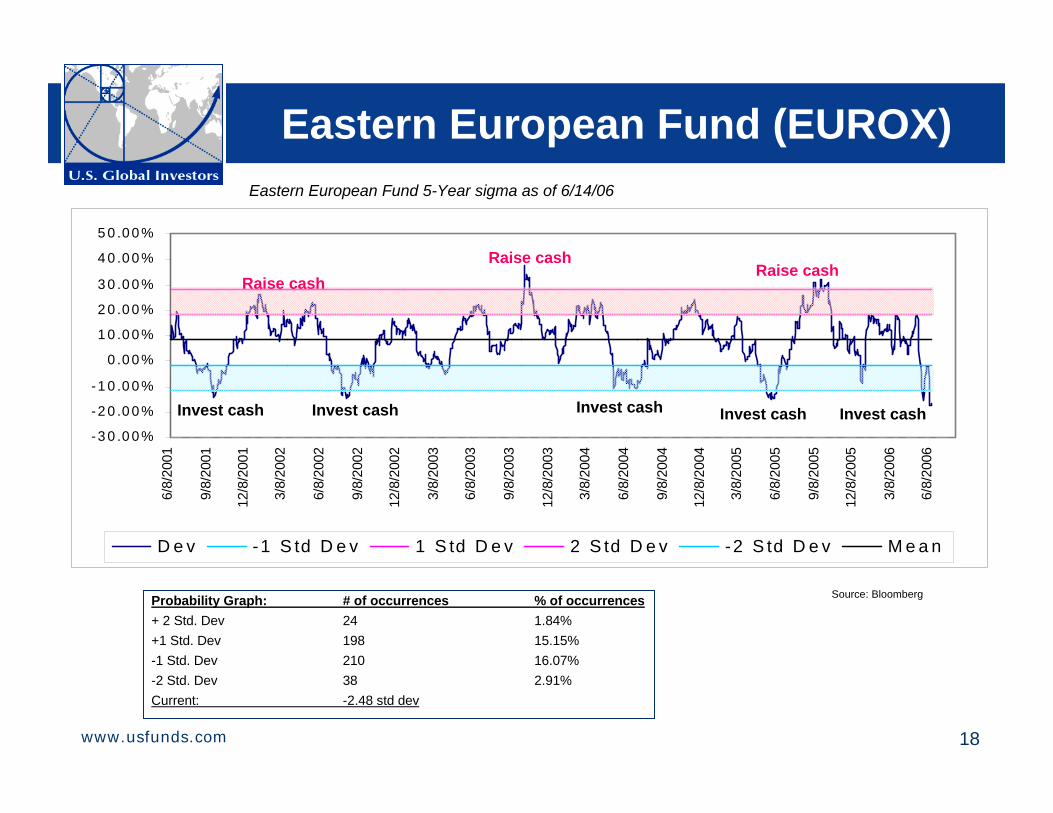
Eastern European Fund (EUROX)
Invest cash
Raise cashRaise cash
Eastern European Fund 5-Year sigma as of 6/14/06
Probability Graph: # of occurrences % of occurrences+ 2 Std. Dev 24 1.84%+1 Std. Dev 198 15.15%-1 Std. Dev 210 16.07%-2 Std. Dev 38 2.91%Current: -2.48 std dev
Source: Bloomberg
Raise cash
Invest cashInvest cashInvest cashInvest cash
19www.usfunds.com
-40 .00%
-30 .00%
-20 .00%
-10 .00%
0.00%
10 .00%
20 .00%
30 .00%
40 .00%
6/8/
2001
9/8/
2001
12/8
/200
1
3/8/
2002
6/8/
2002
9/8/
2002
12/8
/200
2
3/8/
2003
6/8/
2003
9/8/
2003
12/8
/200
3
3/8/
2004
6/8/
2004
9/8/
2004
12/8
/200
4
3/8/
2005
6/8/
2005
9/8/
2005
12/8
/200
5
3/8/
2006
6/8/
2006
D e v -1 S td D e v 1 S td D e v 2 S td D e v -2 S td D e v M e a n
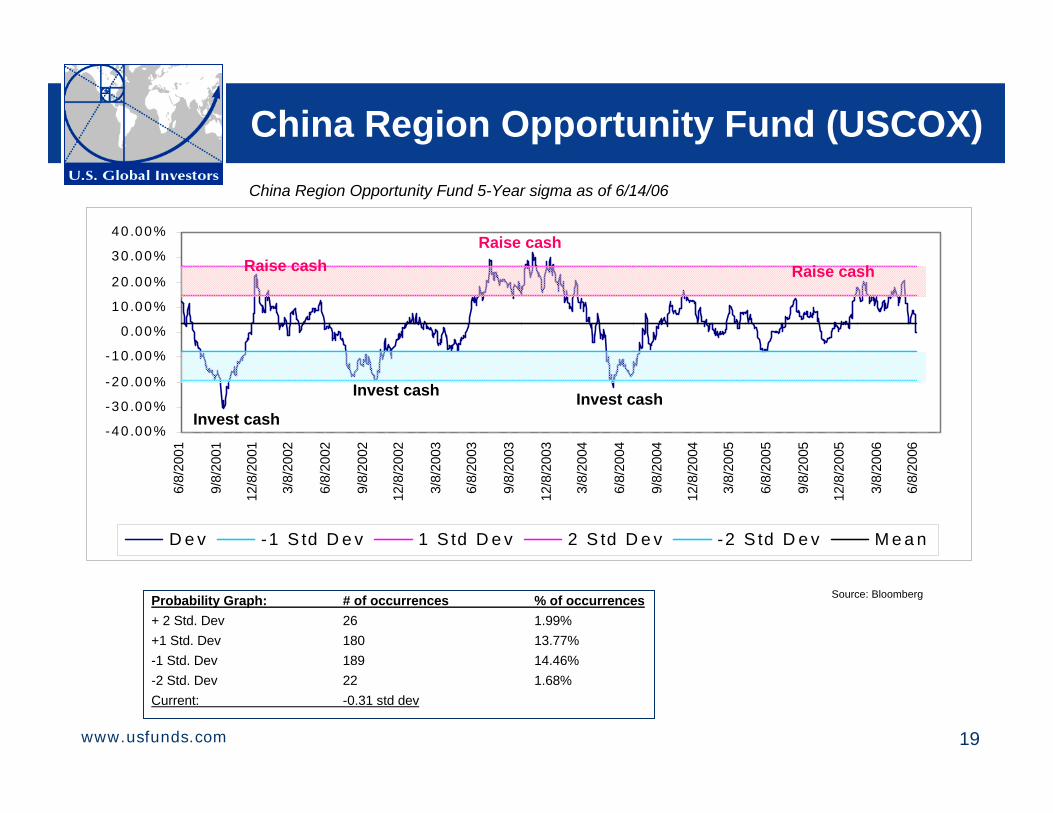
China Region Opportunity Fund (USCOX)
Raise cashRaise cash
China Region Opportunity Fund 5-Year sigma as of 6/14/06
Probability Graph: # of occurrences % of occurrences+ 2 Std. Dev 26 1.99%+1 Std. Dev 180 13.77%-1 Std. Dev 189 14.46%-2 Std. Dev 22 1.68%Current: -0.31 std dev
Source: Bloomberg
Raise cash
Invest cashInvest cash
Invest cash
20www.usfunds.com
-40 .00%
-30.00%
-20.00%
-10.00%
0.00%
10.00%
20.00%
30.00%
40.00%
6/8/
2001
9/8/
2001
12/8
/200
1
3/8/
2002
6/8/
2002
9/8/
2002
12/8
/200
2
3/8/
2003
6/8/
2003
9/8/
2003
12/8
/200
3
3/8/
2004
6/8/
2004
9/8/
2004
12/8
/200
4
3/8/
2005
6/8/
2005
9/8/
2005
12/8
/200
5
3/8/
2006
6/8/
2006
D e v -1 S td D e v 1 S td D e v 2 S td D e v -2 S td D e v M e a n
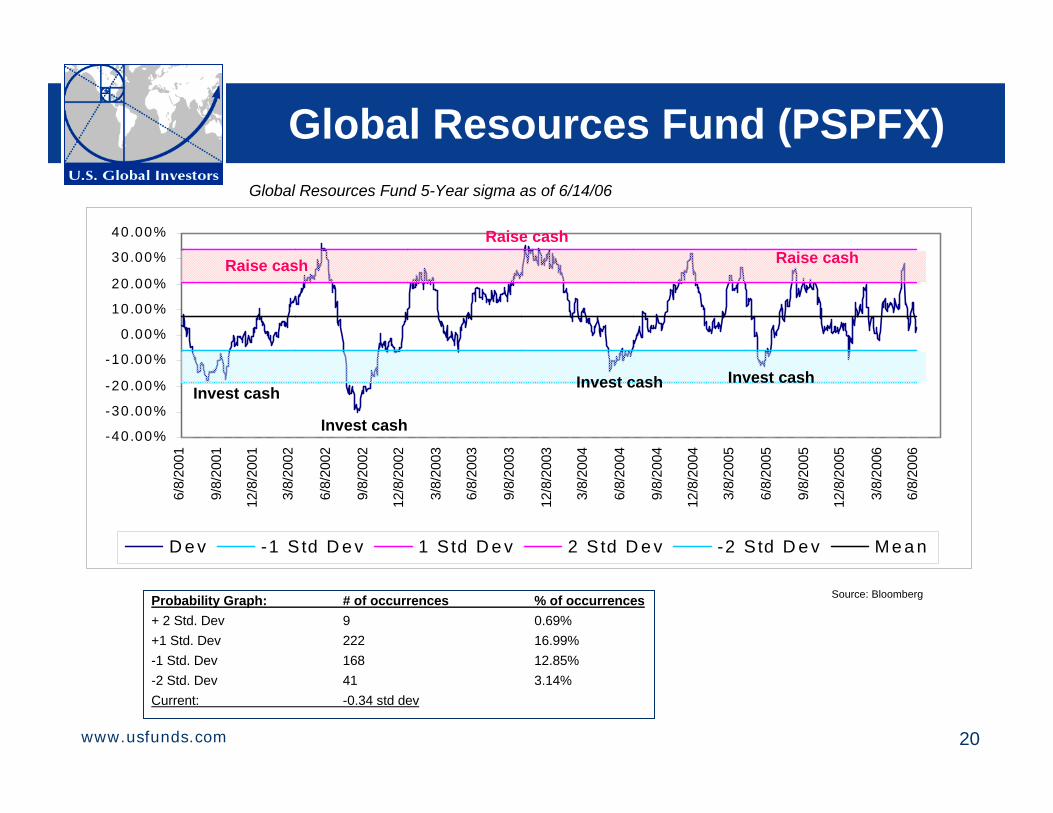
Global Resources Fund (PSPFX)
Raise cashRaise cash
Global Resources Fund 5-Year sigma as of 6/14/06
Probability Graph: # of occurrences % of occurrences+ 2 Std. Dev 9 0.69%+1 Std. Dev 222 16.99%-1 Std. Dev 168 12.85%-2 Std. Dev 41 3.14%Current: -0.34 std dev
Source: Bloomberg
Raise cash
Invest cash
Invest cash
Invest cashInvest cash
21www.usfunds.com
-15.00%
-10.00%
-5.00%
0.00%
5.00%
10.00%
6/18
/200
1
9/18
/200
1
12/1
8/20
01
3/18
/200
2
6/18
/200
2
9/18
/200
2
12/1
8/20
02
3/18
/200
3
6/18
/200
3
9/18
/200
3
12/1
8/20
03
3/18
/200
4
6/18
/200
4
9/18
/200
4
12/1
8/20
04
3/18
/200
5
6/18
/200
5
9/18
/200
5
12/1
8/20
05
3/18
/200
6
6/18
/200
6
Dev -1 Std Dev 1 Std Dev 2 Std Dev -2 Std Dev Mean
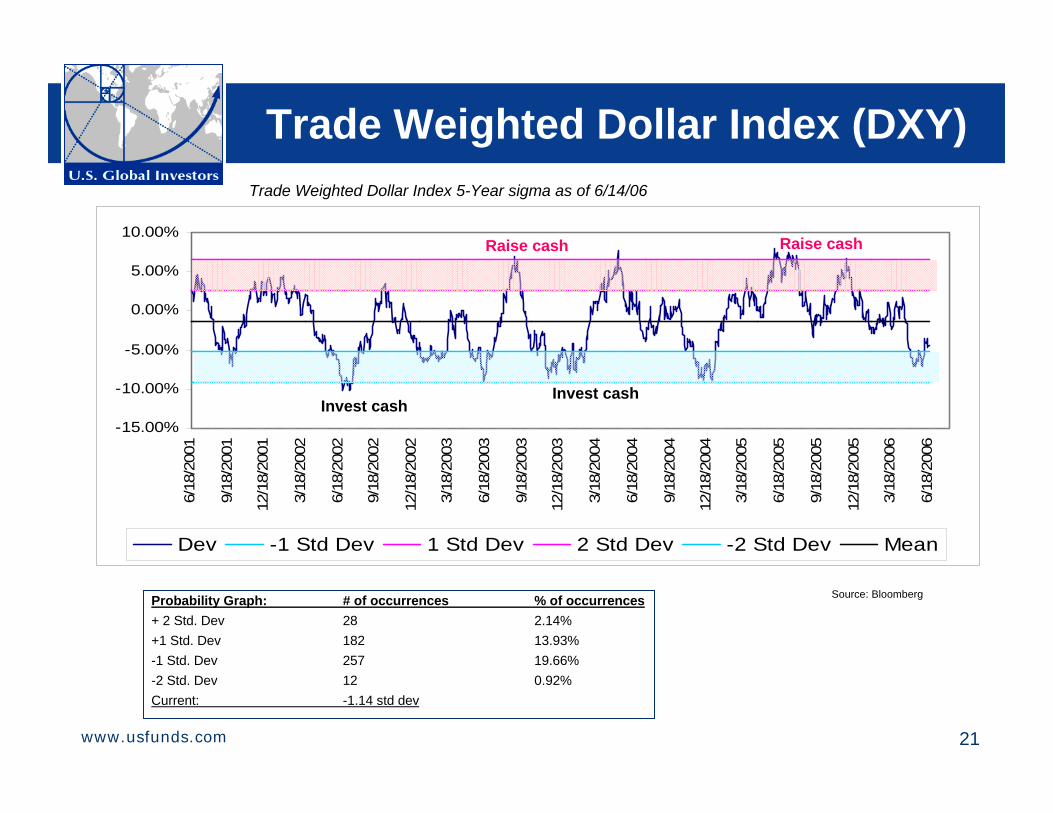
Trade Weighted Dollar Index (DXY)
Raise cash
Trade Weighted Dollar Index 5-Year sigma as of 6/14/06
Probability Graph: # of occurrences % of occurrences+ 2 Std. Dev 28 2.14%+1 Std. Dev 182 13.93%-1 Std. Dev 257 19.66%-2 Std. Dev 12 0.92%Current: -1.14 std dev
Source: Bloomberg
Raise cash
Invest cashInvest cash
22www.usfunds.com
-15.00%-10.00%-5.00%0.00%5.00%
10.00%15.00%20.00%25.00%30.00%35.00%
6/18
/200
1
9/18
/200
1
12/1
8/20
01
3/18
/200
2
6/18
/200
2
9/18
/200
2
12/1
8/20
02
3/18
/200
3
6/18
/200
3
9/18
/200
3
12/1
8/20
03
3/18
/200
4
6/18
/200
4
9/18
/200
4
12/1
8/20
04
3/18
/200
5
6/18
/200
5
9/18
/200
5
12/1
8/20
05
3/18
/200
6
6/18
/200
6
Dev -1 Std Dev 1 Std Dev 2 Std Dev -2 Std Dev Mean
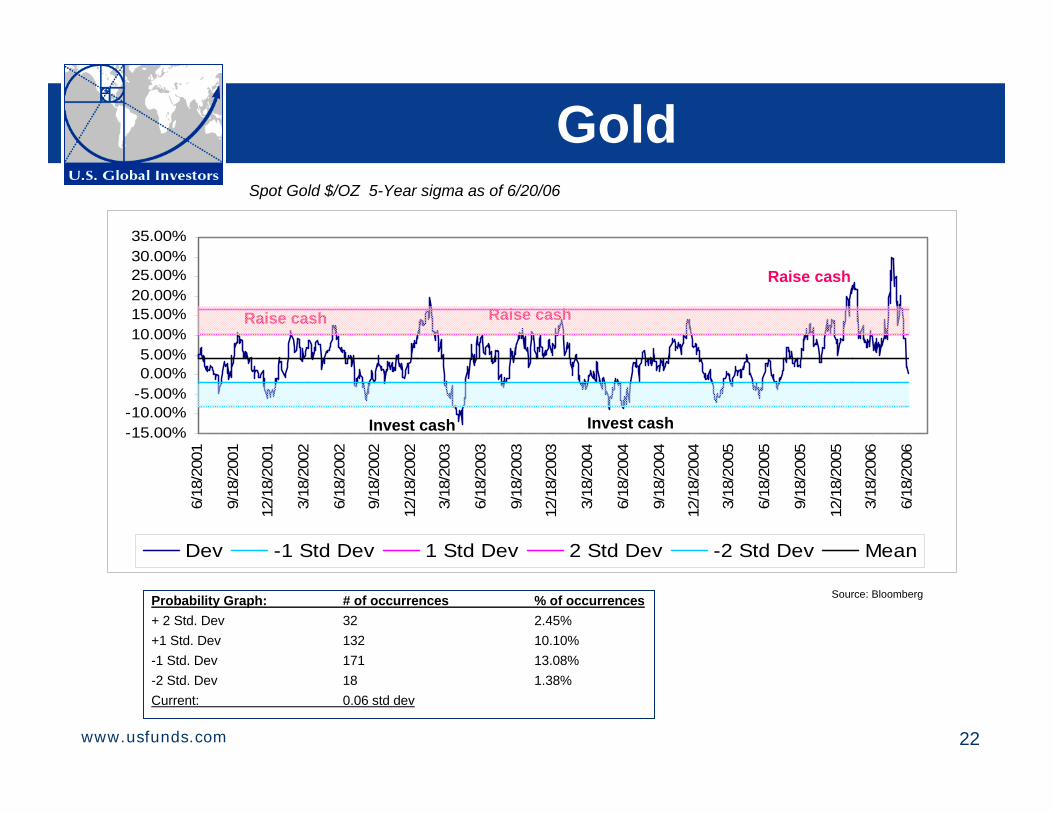
Gold
Invest cash
Raise cash
Raise cash
Spot Gold $/OZ 5-Year sigma as of 6/20/06
Probability Graph: # of occurrences % of occurrences+ 2 Std. Dev 32 2.45%+1 Std. Dev 132 10.10%-1 Std. Dev 171 13.08%-2 Std. Dev 18 1.38%Current: 0.06 std dev
Source: Bloomberg
Raise cash
Invest cash
23www.usfunds.com
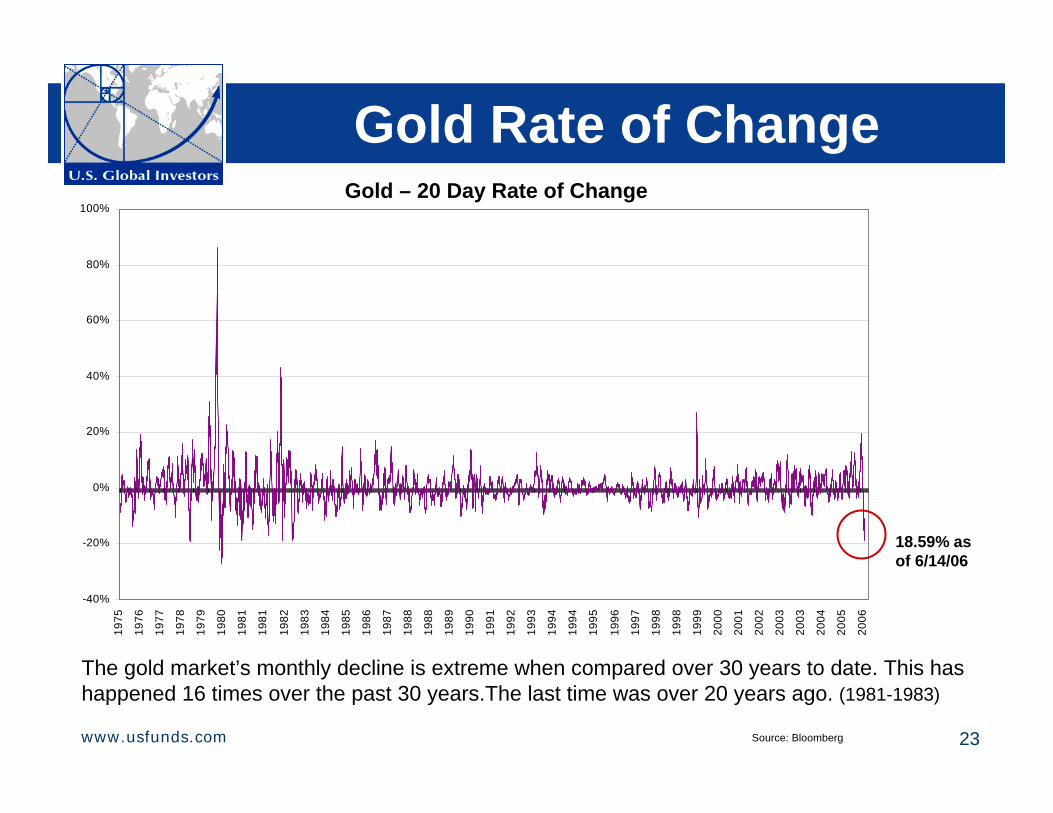
Gold Rate of Change
-40%
-20%
0%
20%
40%
60%
80%
100%
1975
1976
1977
1978
1979
1980
1981
1981
1982
1983
1984
1985
1986
1987
1988
1988
1989
1990
1991
1992
1993
1994
1994
1995
1996
1997
1998
1998
1999
2000
2001
2002
2003
2003
2004
2005
2006
The gold market’s monthly decline is extreme when compared over 30 years to date. This has happened 16 times over the past 30 years.The last time was over 20 years ago. (1981-1983)
Gold – 20 Day Rate of Change
18.59% as of 6/14/06
Source: Bloomberg
24www.usfunds.com
-40.00%-30.00%-20.00%-10.00%
0.00%10.00%20.00%30.00%40.00%50.00%60.00%
6/10
/200
3
8/10
/200
3
10/1
0/20
03
12/1
0/20
03
2/10
/200
4
4/10
/200
4
6/10
/200
4
8/10
/200
4
10/1
0/20
04
12/1
0/20
04
2/10
/200
5
4/10
/200
5
6/10
/200
5
8/10
/200
5
10/1
0/20
05
12/1
0/20
05
2/10
/200
6
4/10
/200
6
6/10
/200
6
Dev -1 Std Dev 1 Std Dev 2 Std Dev -2 Std Dev Mean
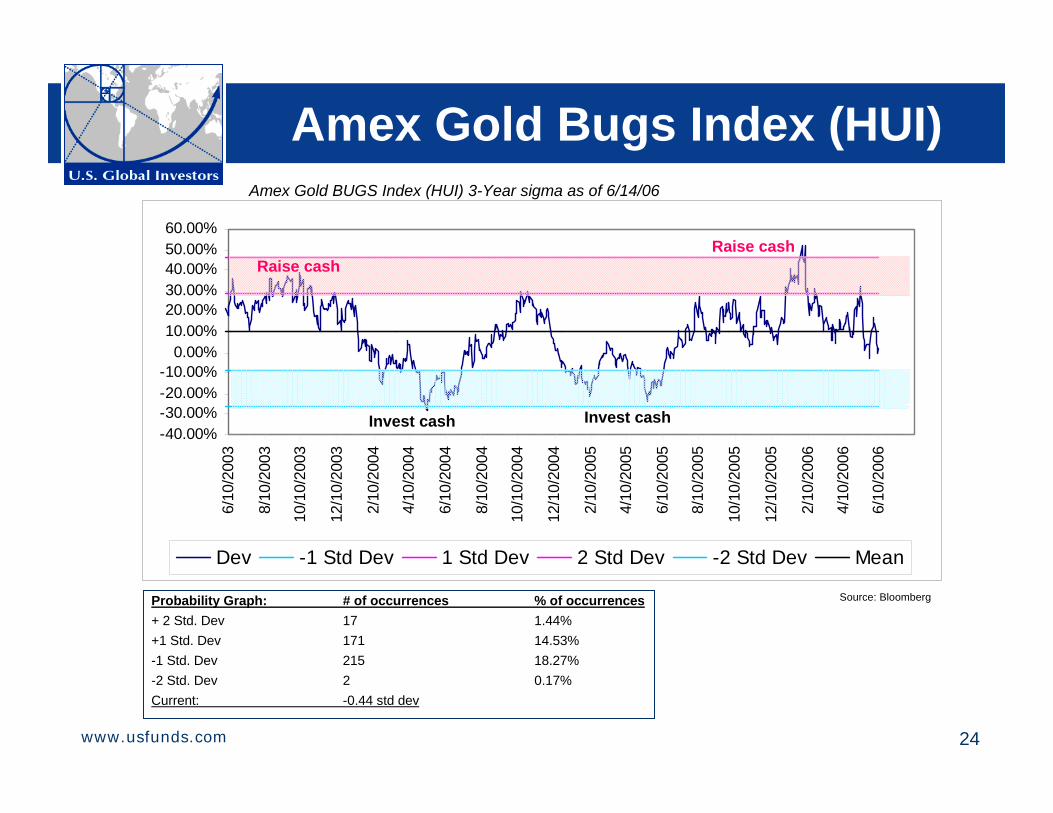
Amex Gold Bugs Index (HUI)
Invest cash
Raise cashRaise cash
Amex Gold BUGS Index (HUI) 3-Year sigma as of 6/14/06
Invest cash
Probability Graph: # of occurrences % of occurrences+ 2 Std. Dev 17 1.44%+1 Std. Dev 171 14.53%-1 Std. Dev 215 18.27%-2 Std. Dev 2 0.17%Current: -0.44 std dev
Source: Bloomberg
25www.usfunds.com
-30.00%
-20.00%
-10.00%
0.00%
10.00%
20.00%
30.00%
40.00%
50.00%
6/10
/200
3
8/10
/200
3
10/1
0/20
03
12/1
0/20
03
2/10
/200
4
4/10
/200
4
6/10
/200
4
8/10
/200
4
10/1
0/20
04
12/1
0/20
04
2/10
/200
5
4/10
/200
5
6/10
/200
5
8/10
/200
5
10/1
0/20
05
12/1
0/20
05
2/10
/200
6
4/10
/200
6
6/10
/200
6
Dev -1 Std Dev 1 Std Dev 2 Std Dev -2 Std Dev Mean
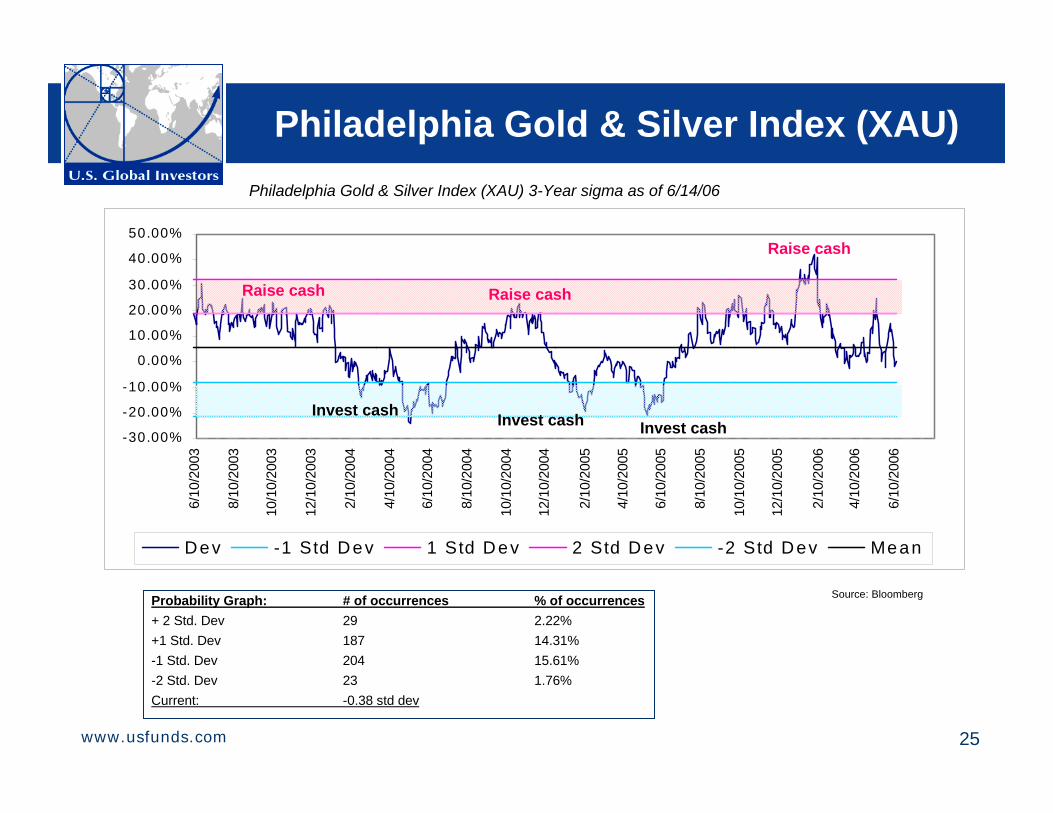
Philadelphia Gold & Silver Index (XAU)
Invest cash
Raise cash
Raise cash
Philadelphia Gold & Silver Index (XAU) 3-Year sigma as of 6/14/06
Probability Graph: # of occurrences % of occurrences+ 2 Std. Dev 29 2.22%+1 Std. Dev 187 14.31%-1 Std. Dev 204 15.61%-2 Std. Dev 23 1.76%Current: -0.38 std dev
Source: Bloomberg
Raise cash
Invest cashInvest cash
26www.usfunds.com
-60.00%-40.00%-20.00%
0.00%20.00%40.00%60.00%
80.00%100.00%
6/8/
2001
9/8/
2001
12/8
/200
1
3/8/
2002
6/8/
2002
9/8/
2002
12/8
/200
2
3/8/
2003
6/8/
2003
9/8/
2003
12/8
/200
3
3/8/
2004
6/8/
2004
9/8/
2004
12/8
/200
4
3/8/
2005
6/8/
2005
9/8/
2005
12/8
/200
5
3/8/
2006
6/8/
2006
Dev -1 Std Dev 1 Std Dev 2 Std Dev -2 Std Dev Mean
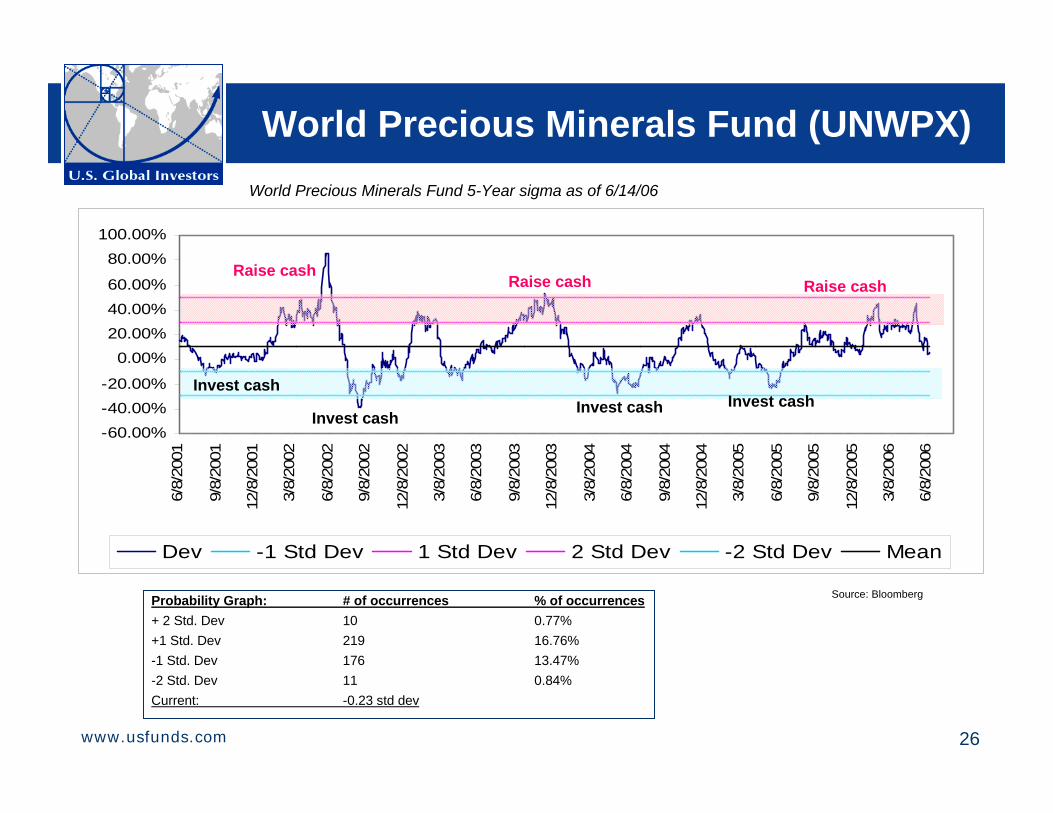
World Precious Minerals Fund (UNWPX)
Invest cash
Raise cashRaise cash
World Precious Minerals Fund 5-Year sigma as of 6/14/06
Probability Graph: # of occurrences % of occurrences+ 2 Std. Dev 10 0.77%+1 Std. Dev 219 16.76%-1 Std. Dev 176 13.47%-2 Std. Dev 11 0.84%Current: -0.23 std dev
Source: Bloomberg
Raise cash
Invest cashInvest cashInvest cash
27www.usfunds.com
-60 .00%
-40 .00%
-20 .00%
0.00%
20.00%
40.00%
60.00%
80.00%
100 .00%
6/8/
2001
9/8/
2001
12/8
/200
1
3/8/
2002
6/8/
2002
9/8/
2002
12/8
/200
2
3/8/
2003
6/8/
2003
9/8/
2003
12/8
/200
3
3/8/
2004
6/8/
2004
9/8/
2004
12/8
/200
4
3/8/
2005
6/8/
2005
9/8/
2005
12/8
/200
5
3/8/
2006
6/8/
2006
D e v -1 S td D e v 1 S td D e v 2 S td D e v -2 S td D e v M e a n
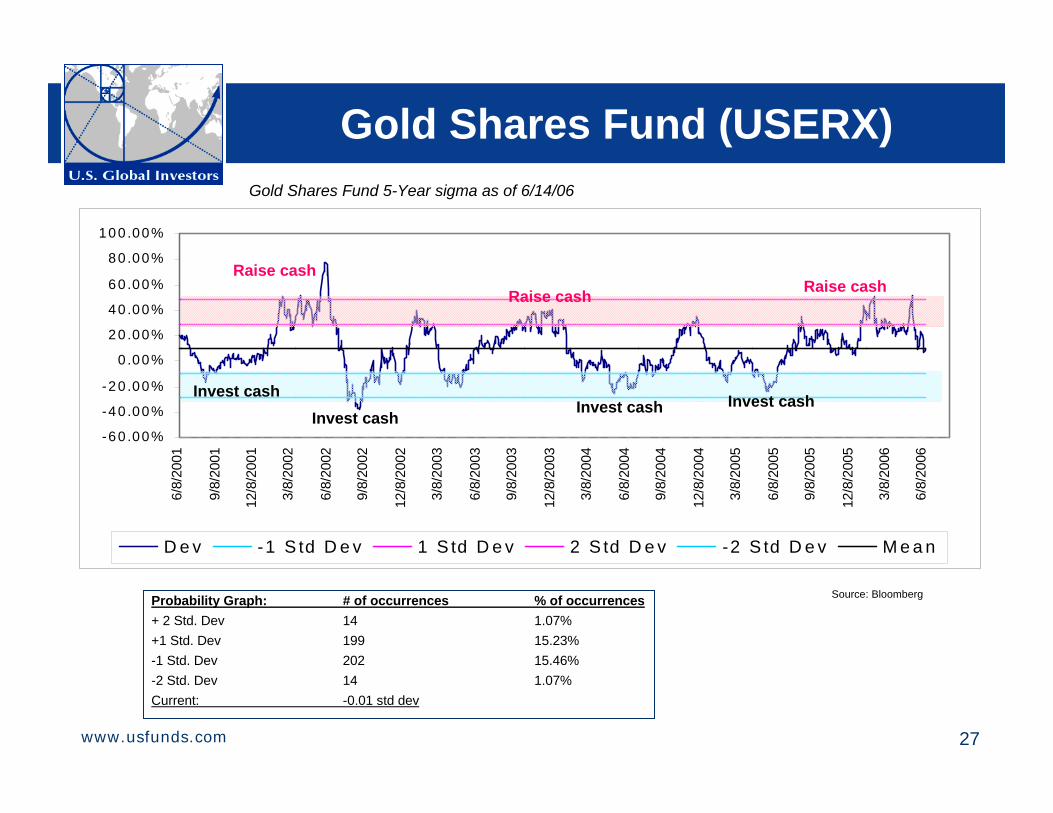
Gold Shares Fund (USERX)
Invest cash
Raise cashRaise cash
Gold Shares Fund 5-Year sigma as of 6/14/06
Probability Graph: # of occurrences % of occurrences+ 2 Std. Dev 14 1.07%+1 Std. Dev 199 15.23%-1 Std. Dev 202 15.46%-2 Std. Dev 14 1.07%Current: -0.01 std dev
Source: Bloomberg
Raise cash
Invest cashInvest cashInvest cash
28www.usfunds.com
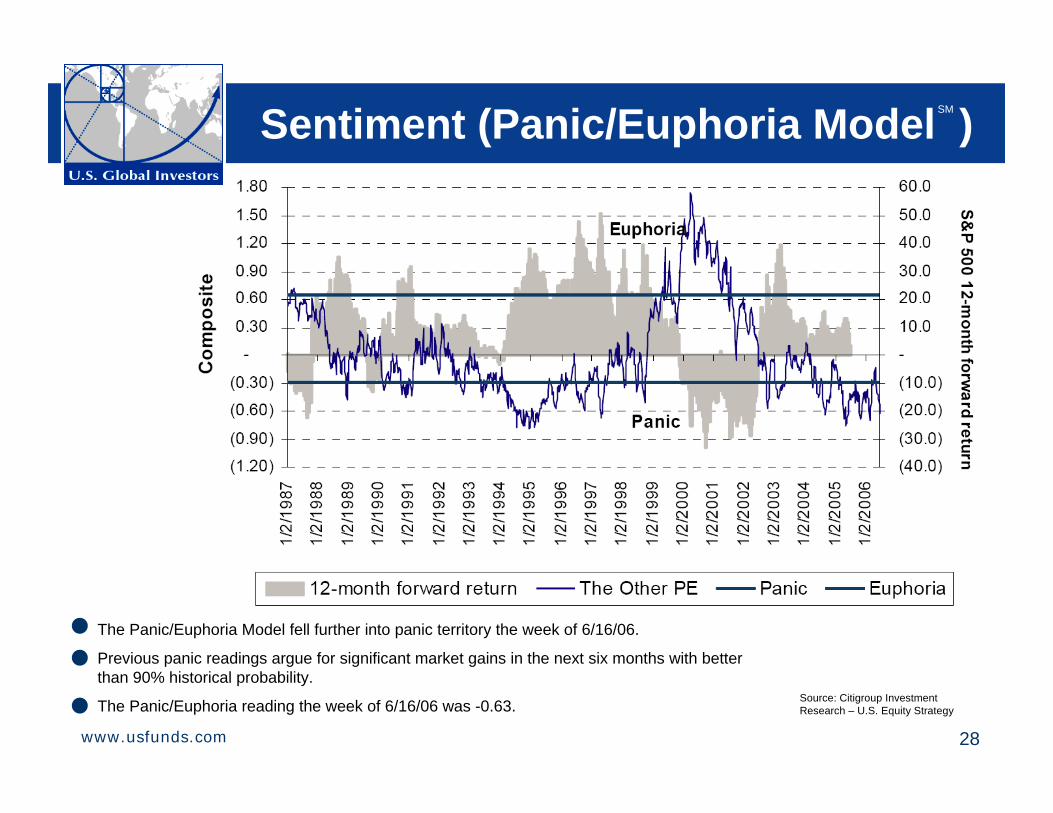
Sentiment (Panic/Euphoria Model )SM
The Panic/Euphoria Model fell further into panic territory the week of 6/16/06.
Previous panic readings argue for significant market gains in the next six months with better than 90% historical probability.
The Panic/Euphoria reading the week of 6/16/06 was -0.63. Source: Citigroup Investment Research – U.S. Equity Strategy
29www.usfunds.com
-30 .0 0%-25 .0 0%-20 .0 0%-15 .0 0%-10 .0 0%
-5 .0 0%0 .0 0%5 .0 0%
10 .0 0%15 .0 0%20 .0 0%25 .0 0%
6/8/
2001
9/8/
2001
12/8
/200
1
3/8/
2002
6/8/
2002
9/8/
2002
12/8
/200
2
3/8/
2003
6/8/
2003
9/8/
2003
12/8
/200
3
3/8/
2004
6/8/
2004
9/8/
2004
12/8
/200
4
3/8/
2005
6/8/
2005
9/8/
2005
12/8
/200
5
3/8/
2006
6/8/
2006
D e v -1 S td D e v 1 S td D e v 2 S td D e v -2 S td D e v M e a n
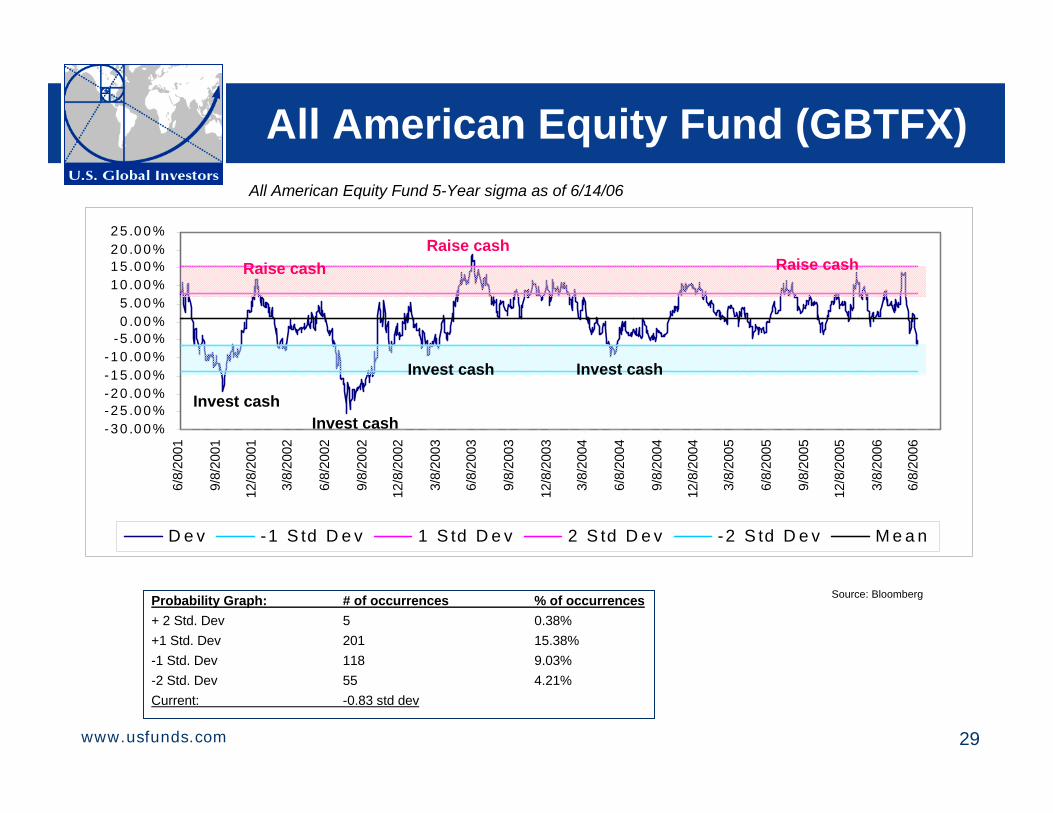
All American Equity Fund (GBTFX)
Invest cash
Raise cashRaise cash
All American Equity Fund 5-Year sigma as of 6/14/06
Probability Graph: # of occurrences % of occurrences+ 2 Std. Dev 5 0.38%+1 Std. Dev 201 15.38%-1 Std. Dev 118 9.03%-2 Std. Dev 55 4.21%Current: -0.83 std dev
Source: Bloomberg
Raise cash
Invest cashInvest cash
Invest cash
30www.usfunds.com
-30.00%-25.00%-20.00%-15.00%-10.00%-5.00%0.00%5.00%
10.00%15.00%20.00%25.00%
6/8/
2001
9/8/
2001
12/8
/200
1
3/8/
2002
6/8/
2002
9/8/
2002
12/8
/200
2
3/8/
2003
6/8/
2003
9/8/
2003
12/8
/200
3
3/8/
2004
6/8/
2004
9/8/
2004
12/8
/200
4
3/8/
2005
6/8/
2005
9/8/
2005
12/8
/200
5
3/8/
2006
6/8/
2006
Dev -1 Std Dev 1 Std Dev 2 Std Dev -2 Std Dev Mean
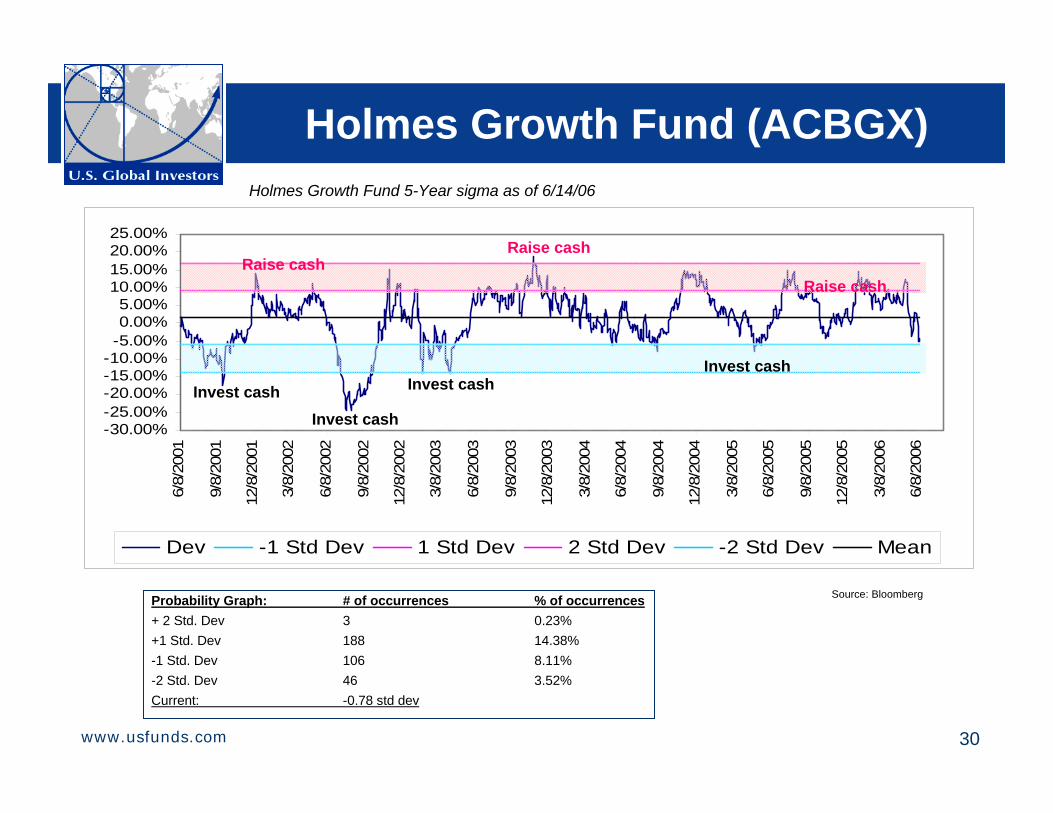
Holmes Growth Fund (ACBGX)
Invest cash
Raise cashRaise cash
Holmes Growth Fund 5-Year sigma as of 6/14/06
Probability Graph: # of occurrences % of occurrences+ 2 Std. Dev 3 0.23%+1 Std. Dev 188 14.38%-1 Std. Dev 106 8.11%-2 Std. Dev 46 3.52%Current: -0.78 std dev
Source: Bloomberg
Raise cash
Invest cashInvest cashInvest cash
31www.usfunds.com
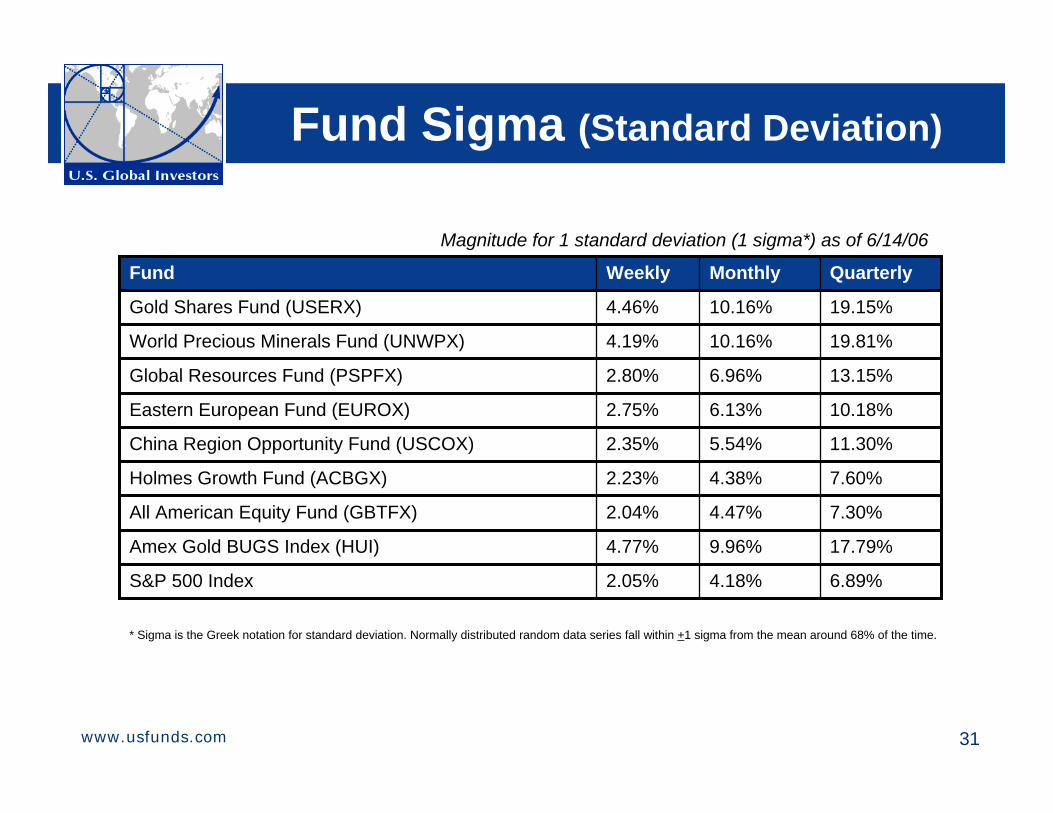
Fund Sigma (Standard Deviation)
6.89%4.18%2.05%S&P 500 Index
17.79%9.96%4.77%Amex Gold BUGS Index (HUI)
7.30%4.47%2.04%All American Equity Fund (GBTFX)
7.60%4.38%2.23%Holmes Growth Fund (ACBGX)
11.30%5.54%2.35%China Region Opportunity Fund (USCOX)
10.18%6.13%2.75%Eastern European Fund (EUROX)
13.15%6.96%2.80%Global Resources Fund (PSPFX)
19.81%10.16%4.19%World Precious Minerals Fund (UNWPX)
19.15%10.16%4.46%Gold Shares Fund (USERX)
QuarterlyMonthlyWeeklyFund
Magnitude for 1 standard deviation (1 sigma*) as of 6/14/06
* Sigma is the Greek notation for standard deviation. Normally distributed random data series fall within +1 sigma from the mean around 68% of the time.
32www.usfunds.com
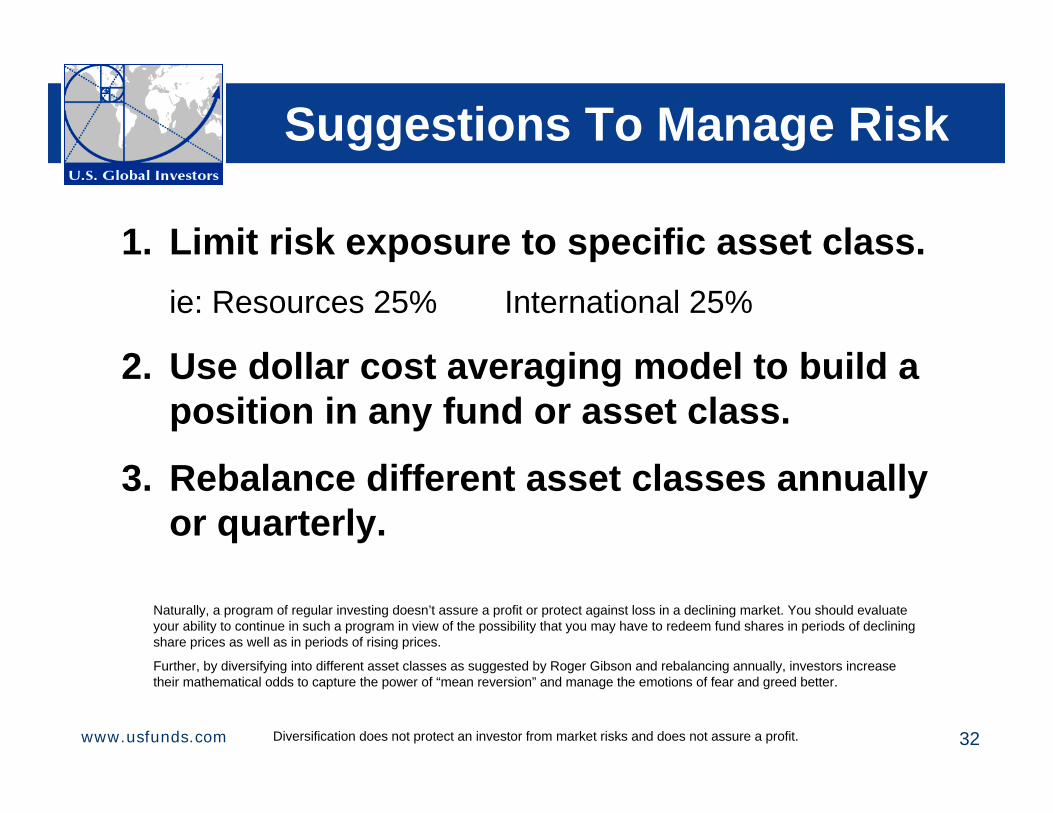
Suggestions To Manage Risk
1. Limit risk exposure to specific asset class.ie: Resources 25% International 25%
2. Use dollar cost averaging model to build a position in any fund or asset class.
3. Rebalance different asset classes annually or quarterly.
Naturally, a program of regular investing doesn’t assure a profit or protect against loss in a declining market. You should evaluate your ability to continue in such a program in view of the possibility that you may have to redeem fund shares in periods of declining share prices as well as in periods of rising prices.
Further, by diversifying into different asset classes as suggested by Roger Gibson and rebalancing annually, investors increase their mathematical odds to capture the power of “mean reversion” and manage the emotions of fear and greed better.
Diversification does not protect an investor from market risks and does not assure a profit.
33www.usfunds.com
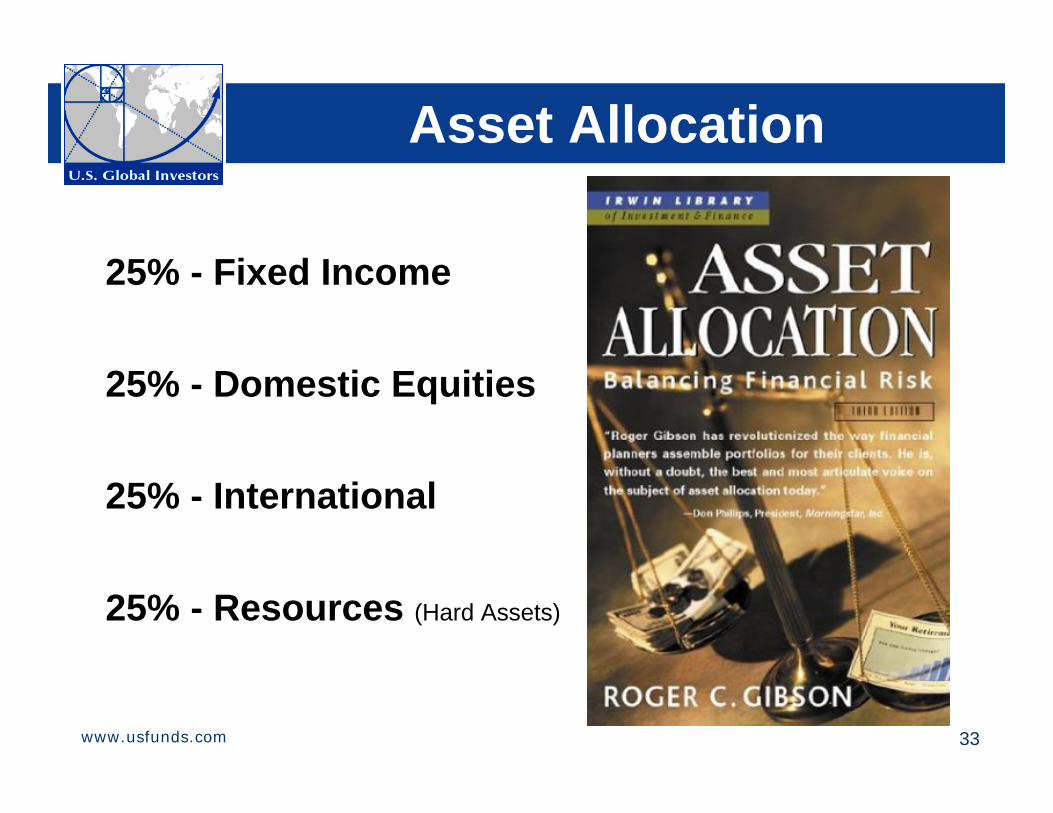
Asset Allocation
25% - Fixed Income
25% - Domestic Equities
25% - International
25% - Resources (Hard Assets)
34www.usfunds.com
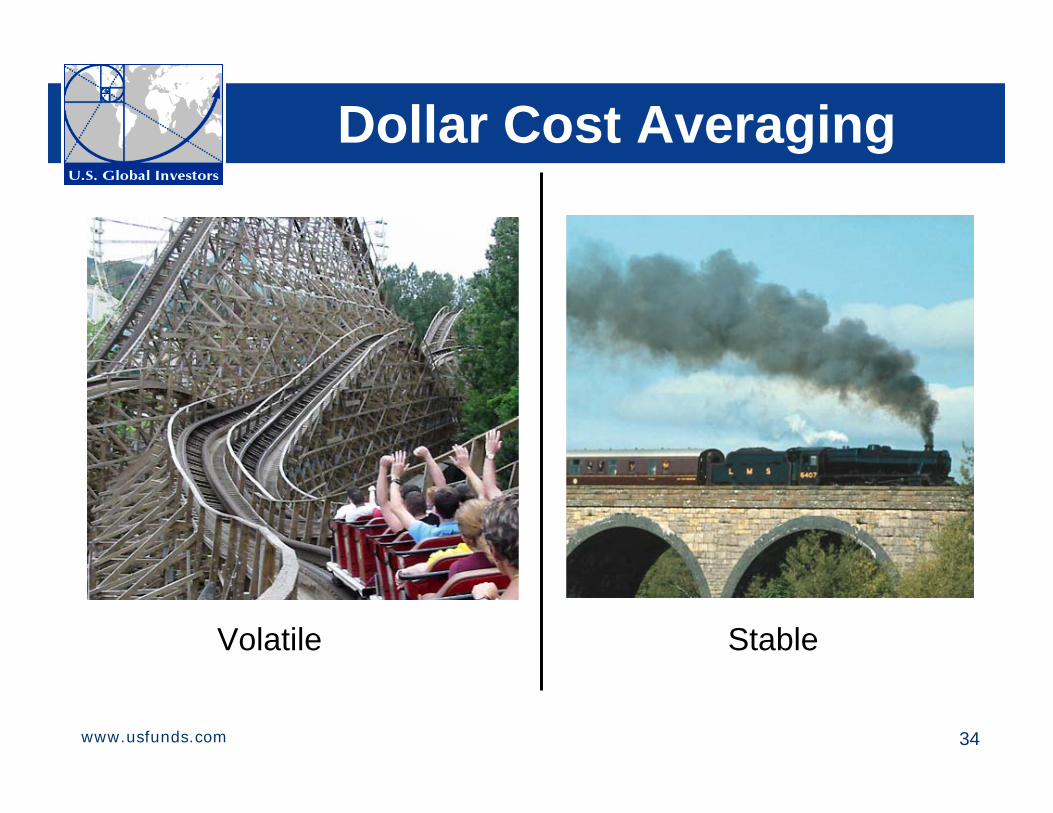
Dollar Cost Averaging
StableVolatile
35www.usfunds.com
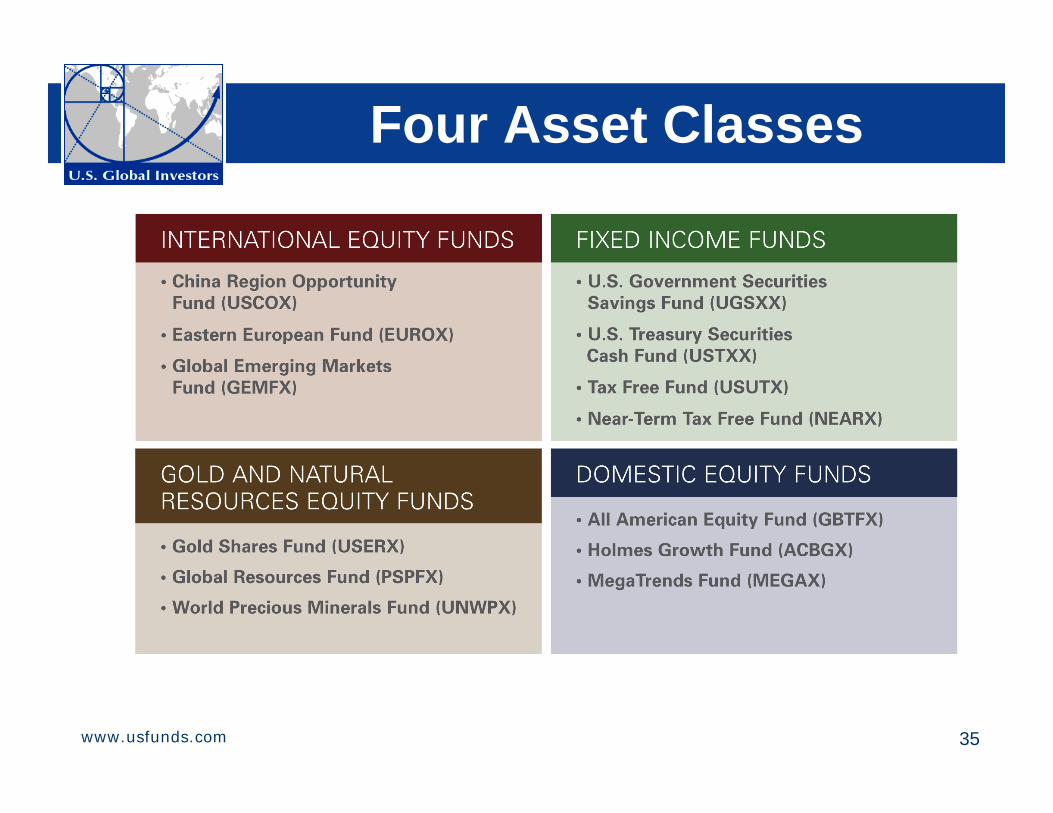
Four Asset Classes
36www.usfunds.com
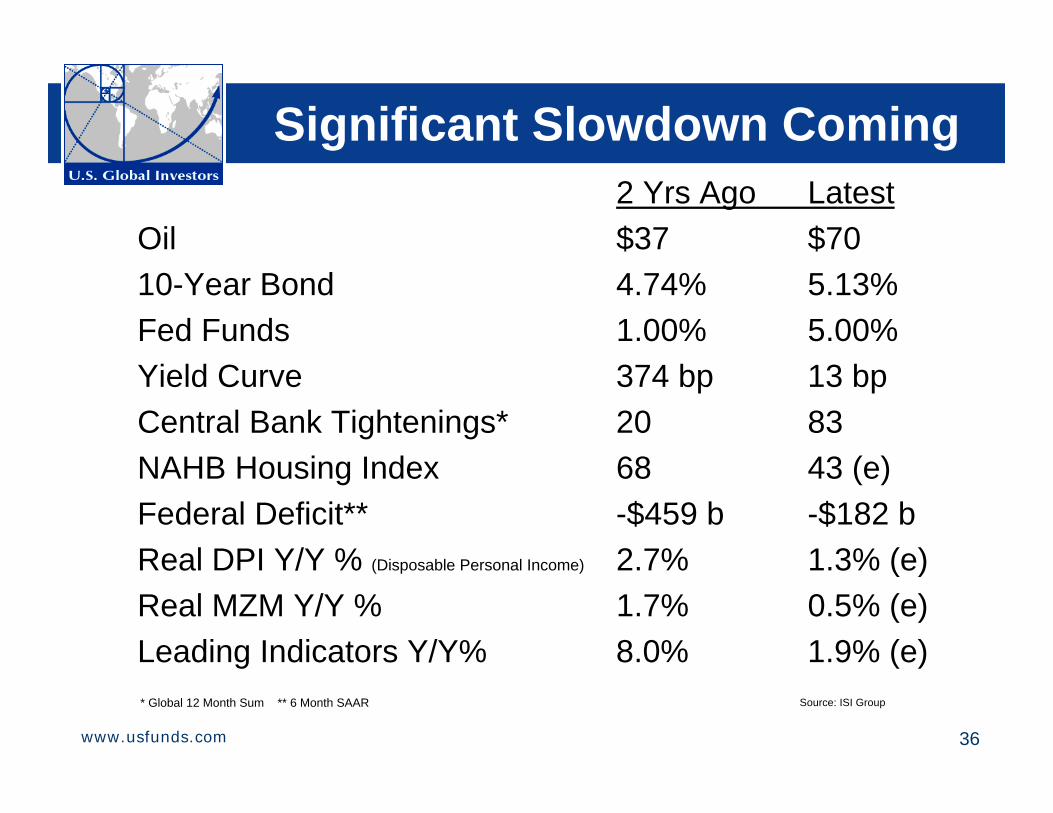
Significant Slowdown Coming2 Yrs Ago Latest
Oil $37 $7010-Year Bond 4.74% 5.13%Fed Funds 1.00% 5.00%Yield Curve 374 bp 13 bpCentral Bank Tightenings* 20 83NAHB Housing Index 68 43 (e)Federal Deficit** -$459 b -$182 bReal DPI Y/Y % (Disposable Personal Income) 2.7% 1.3% (e)Real MZM Y/Y % 1.7% 0.5% (e)Leading Indicators Y/Y% 8.0% 1.9% (e)
Source: ISI Group* Global 12 Month Sum ** 6 Month SAAR
37www.usfunds.com
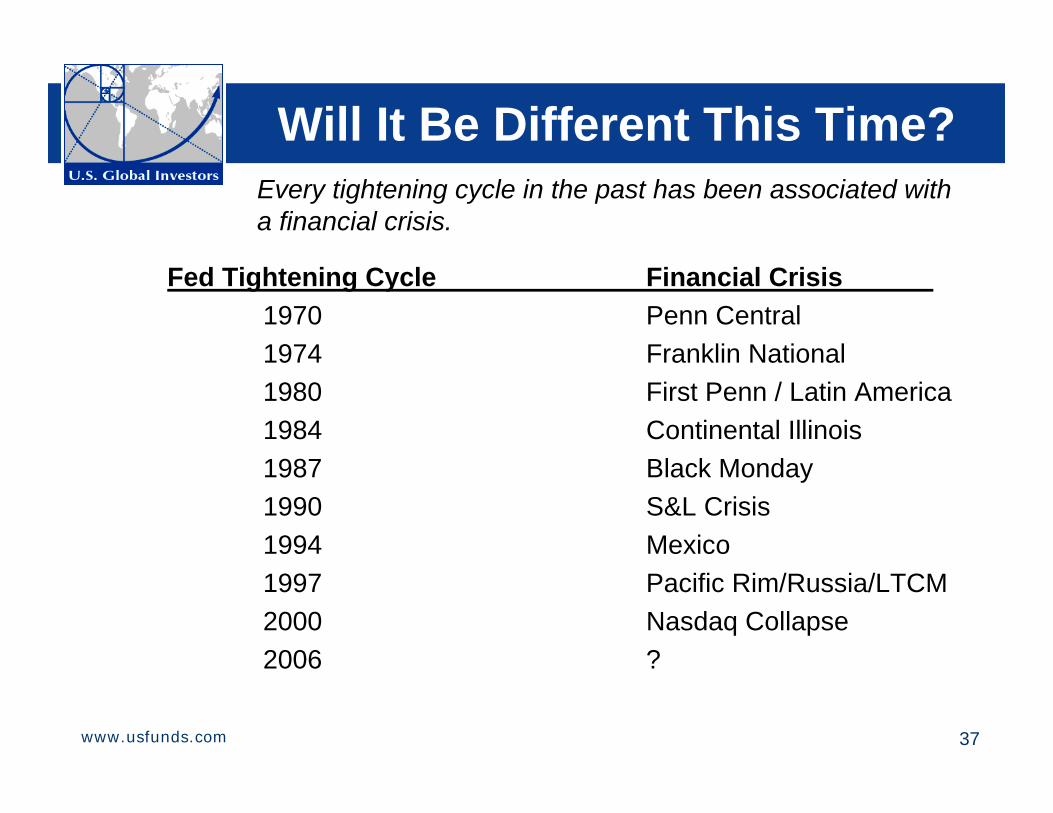
Will It Be Different This Time?
Fed Tightening Cycle Financial Crisis1970 Penn Central1974 Franklin National1980 First Penn / Latin America1984 Continental Illinois1987 Black Monday1990 S&L Crisis1994 Mexico1997 Pacific Rim/Russia/LTCM2000 Nasdaq Collapse2006 ?
Every tightening cycle in the past has been associated with a financial crisis.
38www.usfunds.com
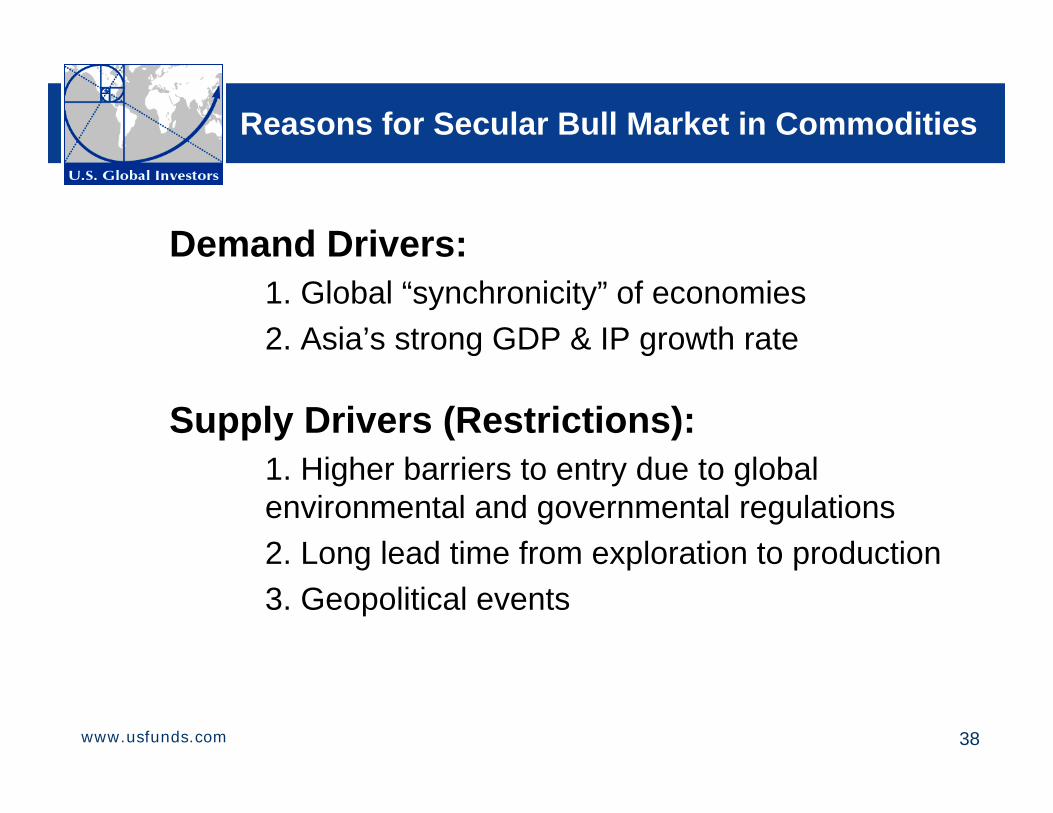
Reasons for Secular Bull Market in Commodities
Demand Drivers:1. Global “synchronicity” of economies2. Asia’s strong GDP & IP growth rate
Supply Drivers (Restrictions):1. Higher barriers to entry due to global environmental and governmental regulations2. Long lead time from exploration to production3. Geopolitical events
39www.usfunds.com
Bull Market Risks
40www.usfunds.com
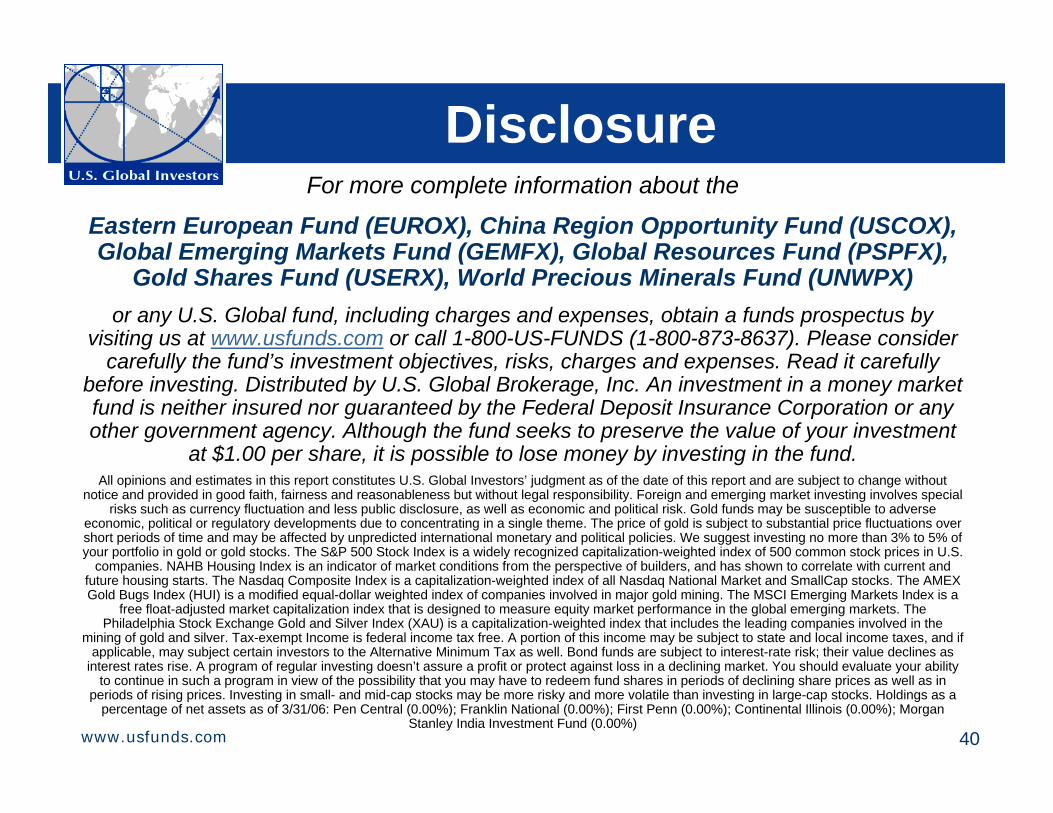
DisclosureFor more complete information about the
Eastern European Fund (EUROX), China Region Opportunity Fund (USCOX), Global Emerging Markets Fund (GEMFX), Global Resources Fund (PSPFX),
Gold Shares Fund (USERX), World Precious Minerals Fund (UNWPX)or any U.S. Global fund, including charges and expenses, obtain a funds prospectus by
visiting us at www.usfunds.com or call 1-800-US-FUNDS (1-800-873-8637). Please consider carefully the fund’s investment objectives, risks, charges and expenses. Read it carefully
before investing. Distributed by U.S. Global Brokerage, Inc. An investment in a money market fund is neither insured nor guaranteed by the Federal Deposit Insurance Corporation or any other government agency. Although the fund seeks to preserve the value of your investment
at $1.00 per share, it is possible to lose money by investing in the fund.All opinions and estimates in this report constitutes U.S. Global Investors’ judgment as of the date of this report and are subject to change without
notice and provided in good faith, fairness and reasonableness but without legal responsibility. Foreign and emerging market investing involves special risks such as currency fluctuation and less public disclosure, as well as economic and political risk. Gold funds may be susceptible to adverse
economic, political or regulatory developments due to concentrating in a single theme. The price of gold is subject to substantial price fluctuations over short periods of time and may be affected by unpredicted international monetary and political policies. We suggest investing no more than 3% to 5% of your portfolio in gold or gold stocks. The S&P 500 Stock Index is a widely recognized capitalization-weighted index of 500 common stock prices in U.S.
companies. NAHB Housing Index is an indicator of market conditions from the perspective of builders, and has shown to correlate with current and future housing starts. The Nasdaq Composite Index is a capitalization-weighted index of all Nasdaq National Market and SmallCap stocks. The AMEX Gold Bugs Index (HUI) is a modified equal-dollar weighted index of companies involved in major gold mining. The MSCI Emerging Markets Index is a
free float-adjusted market capitalization index that is designed to measure equity market performance in the global emerging markets. The Philadelphia Stock Exchange Gold and Silver Index (XAU) is a capitalization-weighted index that includes the leading companies involved in the
mining of gold and silver. Tax-exempt Income is federal income tax free. A portion of this income may be subject to state and local income taxes, and if applicable, may subject certain investors to the Alternative Minimum Tax as well. Bond funds are subject to interest-rate risk; their value declines as
interest rates rise. A program of regular investing doesn’t assure a profit or protect against loss in a declining market. You should evaluate your ability to continue in such a program in view of the possibility that you may have to redeem fund shares in periods of declining share prices as well as in
periods of rising prices. Investing in small- and mid-cap stocks may be more risky and more volatile than investing in large-cap stocks. Holdings as a percentage of net assets as of 3/31/06: Pen Central (0.00%); Franklin National (0.00%); First Penn (0.00%); Continental Illinois (0.00%); Morgan
Stanley India Investment Fund (0.00%)