Embed Size (px)
Citation preview

AoC Finance Conference, 9/10 June 2015
Growth opportunities in higher and further education?- fees and loans in higher education
Julian Gravatt, Assistant Chief Executive, AoC
@JulianGravatthttp://www.aoc.co.uk/funding-and-corporate-services/funding-and-finance/
reports-and-presentations

HE fees & loans – the politics
Higher education feesLabour government (re) introduced full-time fees in 1998 (after 25 years)Full-time fees rose from £1,200 (1988) to £9,000 (2012)Scotland abolished university fees in the 2000s in two stagesFull-time fee cap fixed at £9,000 since 2012Politically difficult to make big increases in the fee capFull-time HE fees might rise with inflation – but this affects HE loans
Student loansStudent loans started in 1990 on small scale, for maintenanceSince 1998, income-contingent loans cover 100% of feesTotal student loan debt £74 billion. Annual repayment <£2 bil.Annual outlays £14 bil. RAB charge (a measure of impairment) 45%

HE fees & loans – first principles
Objectives A self-governing & strong (“world class”) university system Everyone capable of benefitting should be able to attendSystem cover university costs (+3% surplus) via fees + HEFCEStudent loans in place to remove up-front fees & living costs
TensionsFees rose to the cap (now £9,000). No price competitionSystem expensive, resulting in average loan debt of £44,000Growing sense that universities have made lots of moneyWeaknesses in regulation (eg private colleges)Some poor “consumer protection” practices

HE student loan outlays
£ billions 2013-14 2014-15 2015-16 2016-17 2017-18 2018-19
Outlays 10.3 12.7 14.4 15.6 16.7 17.4
Repayments 1.8 2.1 2.3 2.5 2.5 2.6RAB charge@ 45% 4.6 5.7 6.5 7.0 7.5 7.8
2013-14 2014-15 2015-16 2016-17 2017-18 2018-19 0
2
4
6
8
10
12
14
16
18
20
Outlays Repayments RAB charge@ 45%
A £5.7 billionwrite off this year

Between 2011 and 2015, the overall HE budget has increased but there has been a cut in HEFCE grants, a freeze in research spending and an increase in tuition and maintenance loans.
The HE budget – up 26% in 4 years
Teaching Student Support
Research Total 0
5
10
15
20
25
Grants Loans Total
Teaching Student Support
Research Total 0
5
10
15
20
25
Grants Loans Total
Total HE spending in England in 2011-12 and 2015-16

The HE budget – up 26% in 4 years
2011-12 Teaching Student Support
Research Total RAB charge
Grants 4.6 1.3 4.6 10.5 2.1
Loans 2.6 4.4 - 7.0
Total 7.2 5.7 4.6 17.7
2013-14 Teaching Student Support
Research Total RAB charge
Grants 1.7 1.6 4.6 7.9 6.4
Loans 8.2 6.2 - 14.4
Total 9.9 7.8 4.6 22.3
Source: AoC summary of HEFCE grant letters for 2010 & 2014, BIS annual accounts

HE loans – the RAB charge
The 45% write-off is…An impairment charge on loans in government accountsEquivalent to 30 year’s of depreciation in 1 yearCharged up-front because loan terms are “soft”RAB for highest earning graduates is zeroGraduate salary forecasts down -> more write-offs in 2040sInterest rate assumptions make a big difference…
£ billions Interest rate
What graduates pay RPI 2.5%
..on higher incomes RPI +3% 5.5%
Cost of capital in RAB RPI + 2.2% 4.7%
UK 30 year borrowing rate 2.9%

HE loans – cutting government loan costs
Lots of discussion in recent years about how to cut loan costsLabour suggested £6,000 feesAlso higher interest rate (+1%) on income over £45k (eg 5.5%)Think tanks have suggested graduate equity contractsAlso penalties for universities with poor repayment records
More likely….Wait for an economic recovery to revise the forecastsRepayment threshold may not increase much from £21kStudent Loan Company big push on repayment
Risk for collegesReturn of some form of control of entry qualifications

* Official forecasts reported in a PQ
Student number controls Student number entry controls (Year 2 SNC = Year 1 SNC)High grades exemption (AAB+ in 2012, ABB+ in 2013, nothing in 2015)Core/Margin policies (20,000 in 2012, 5,000 in 2013)Flexibility range (3% in 2013, 6% in 2014)Private HEIs and Colleges new to HE (controls started in 2014)Removal of SNCs for most HE providers in 2015
Student number controls
2012-13
2013-14
2014-15
2015-16 2016-
Full-time entrants 312,000 345,000 360,000 390,000* ?
Average fee £7,700 £7,800 £7,900 £8,100* ?

Higher education rules of the game
A complex mesh of regulation and self-regulationCourses need to be validated (universities, Pearson, colleges with DAP)Fees over £6,000 need Offa approval,18 month in advanceAdmissions for full-timers dominated by UCAS with 12 month lead-inQuality assessment by QAA; adjudication by OIAConsumer protection reviewed by CMAAccess to student loans via HEFCELoan application managed by SLC which also pay grants, DSAs etcParallel data collection via ILR
Some general pointsHE is not for amateursYoung Universities Summit in 2014 focused on post-1964 institutions!

Know your market - College HE provision
Characteristics of English College higher education100,000 students in 280 colleges (range 100 to 3,500)Local, employer-led, technical, some niche50% full-time, 50% part-timec50% apply for one course/one institution (UCAS) 70% live within 25 miles of campusStudent cohort more disadvantaged than HE averagePartnerships with Universities long-standing & importantThe core/margin policy caused a shift to direct control

Overall College HE numbers have remained stable but there has been an increase in directly controlled full-time numbers
Know your market - College HE trends
2008-9 2012-3
Full Time Direct 31,000 44,000
Indirect 28,000 24,000
Full Time Sub-total 59,000 68,000
Part Time Direct 24,000 20,000
Indirect 33,000 18,000
Part Time Sub-total 56,000 38,000
117,000 106,000
% Direct 47% 60%

The demand for higher middle skills
Source: UKCES, Working Futures 2012-2022. Top left box sums SOC Major Groups 4 and 5; top right Major Groups 1 to 3; bottom left Major Groups 8 and 9; bottom right Major Groups 6 and 7.
Ana
lytic
al &
in
tera
ctiv
eM
anua
l tas
ks
Routine tasks Non-routine tasksManagers;
professionals; and technicians
+2,400k17% net increase in jobs
2012-2022
Care and leisure; sales and other
service
+600k11% net increase in jobs
2012-2022
Elementary;process and plant
operatives
-300k5% net decrease in jobs
2012-2022
Secretarial and clerical’ and skilled
trades
-800k5% net decrease in jobs
2012-2022

College HE strategies
The fundamentalsA longer-term HE plan , owned by Governors and SMT.Validation (university relationship, DAPs etc)Compliance (SLC, HEFCE, QAA, CMA)
Think about your studentsProgression up from Level 3 courses and access courses.Progression out to work or degree level study.Courses & fees influenced by marketing analysis.Look at FT, PT together. Avoid generic courses.Ensure that your advice & advertising is fair & truthful

24+ Advanced Learner Loans
Where we are nowLow public awarenessSuccessful implementation of systems in autumn 2013£220 mil allocated by SFA in 2013-14. Perhaps £120 mil used.Apprenticeships bombed. Access maintained. Some vocational Level 3s strong. Low use for Level 4sA few colleges have expanded but picture is mixed.C£300 mil allocated by SFA in 2014-15. Limited growthSome new providersColleges account for more than 60% of the market

FE loan supported enrolments by age group
24-29
30-39
40-49
50-59
60+
0 2,000 4,000 6,000 8,000 10,000 12,000 14,000 16,000
15,750
14,660
7,530
1,840
260
15,980
15,710
8,410
2,380
3102014/152013/14

FE loan supported enrolments by deprivation
1 (M
ost D
... 2 3 4 5 6 7 8 9
10 (L
east
...
0
1,000
2,000
3,000
4,000
5,000
6,000
7,0002013/14
2014/15
Num
ber o
f Lea
rner
s

FE loan supported enrolments by region
East of England
East Midlands
Greater London
North East
North West
South East
South West
West Midlands
Yorkshire and the Humber
0 1,0002,000
3,0004,000
5,0006,000
7,0008,000
9,00010,000
2014/152013/14

Most popular subject areasHealth, public services and care (16,000)Business, administration and law (5,500)
Education and training (5,500)
24+ Advanced Learner Loans
Top 5 Learning Aims 2013/14 2014/15
Diploma in Accounting (QCF) 3,590 3,930
Diploma in Specialist Support for Teaching and Learning in Schools (QCF) 1,850 2,660
Diploma for the Children and Young People's Workforce (QCF) 1,840 1,880
Certificate in Supporting Teaching and Learning in Schools (QCF) 1,650 1,900
Diploma in Therapeutic Counselling (QCF) 490 980

The consultation about FE loan extension
The proposals set out in June 2014 Option for BIS to extend FE loans in 2016-17- 19+ for all courses - Entitlements (100% funding) stay basic skills, first L2 & L3- Transfer of higher nationals from HE to FE system - Include FE loans in any sharia-compliant scheme
Will this happen? 60% RAB charge (reflecting low pay) is an obstacleMinisters are seeking quick savings after May 2015Competing demands on SLC for 2016 My guess: yes but not sure when and in what form!

Increasing loan activity
Some tipsA longer-term Level 3 & 4 plan , owned by Governors and SMT.Understand your market & the rules Different thinking & internal development fundsNecessary to analyse data on 2013-14 and 2014-15 take-upSFA encouraging new providers (eg HEIs, existing providers)Could colleges identify new partners?Employers shouldn’t be ruled out January starts as well as September starts?Pricing for loans can differ from 19-24 feesNeeds a cross-college approach
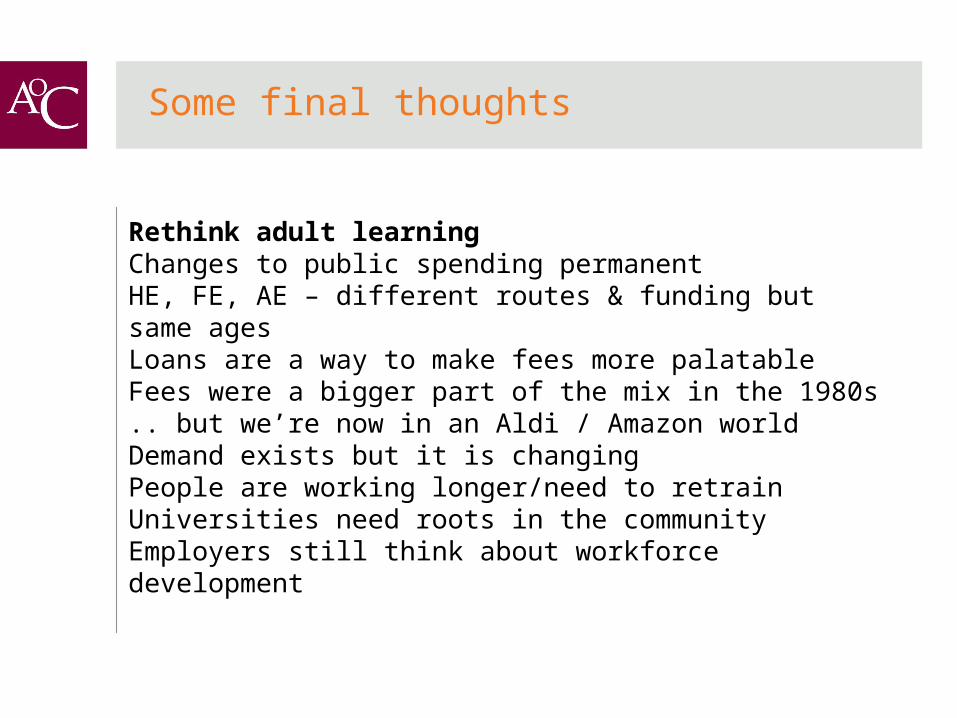
Some final thoughts
Rethink adult learning Changes to public spending permanentHE, FE, AE – different routes & funding but same agesLoans are a way to make fees more palatableFees were a bigger part of the mix in the 1980s.. but we’re now in an Aldi / Amazon worldDemand exists but it is changingPeople are working longer/need to retrainUniversities need roots in the communityEmployers still think about workforce development