Embed Size (px)
Citation preview

Aon ConsultingBenefi t Trends Survey
2009

As a Canadian leader in health and benefi ts consulting, Aon Canada has unparalleled access to the concerns, ideas and approaches to employee benefi ts of Canada’s leading organizations. Aon Consulting’s 2009 Canadian Benefi ts Trends Survey team collaborated with over 275 of these organizations to closely examine their top fi ve areas of concern: group benefi ts, retirement plans, talent management, communications and outsourcing.
Employers are increasingly caught in a double bind in their efforts to attract and retain top talent. On the one hand, competition for top talent is increasingly fi erce. On the other, staying ahead of the competition requires attractive, competitive benefi ts packages – while health-care costs continue to race upward.
This survey shines a bright light on how leading employers are addressing today’s most pressing benefi ts and talent management issues. We are confi dent you will fi nd the information in this report to be of value in shaping your future workplace.
Heading into 2009, the new economic climate only amplifi es the talent challenge. Organizations who address this challenge armed with the latest research, tools and approaches will certainly reap the rewards.
Sincerely,
Laura MenschSenior Vice PresidentNational Practice Leader, Health & Benefi tsAon Consulting Canada

3
2009 Aon Consulting’s Benefi t Trends Survey© Aon Consulting Inc. 2008 – All Rights Reserved
Executive SummaryFor the second time, Aon Consulting has surveyed leading employers across Canada to examine their benefi ts and talent management practices and challenges. In this report, we identify trends and offer insights to help Canadian business leaders develop successful strategies to shape their future workplace.
Survey respondents included 278 employers representing a wide variety of industries and nine Canadian provinces. Respondents were primarily HR or benefi ts managers.
The survey focused on fi ve areas of prime importance to employers: health care, retirement, talent management, communication and outsourcing, with a view to balancing rising benefi ts costs against the growing need to attract and engage top talent. Below are some of the key fi ndings:
Benefi t cost prevention and fl exible benefi ts partner with cost containmentEmployers continue their efforts to manage rising costs of health care. While classic containment methods • continue – 40% of respondents intend to search for a more competitive insurer – more advanced methods are also gaining strength; 49% have implemented or plan to implement proactive claims management; 58% are implementing enhanced disability management strategies.
Many of the benefi ts achievable through cost containment have now been realized; a growing number of • employers are looking to cost prevention. Wellness programs are increasingly popular: 46% of employers have implemented fl u shot programs; 46% plan to promote exercise/physical activity; 23% offer or plan to offer weight and lifestyle management programs.
Flexible benefi ts plans are gaining momentum as a method of managing benefi ts costs, through paying only • for what is chosen by each employee; 24% of employers intend to switch to fl ex plans; one-fi fth intend to introduce health care spending accounts.
Defi ned contribution plans at a crossroads?The trend towards defi ned contribution (DC) plans that has occurred since 2000 now appears to be slowing, • largely because of the recent extended period of historically low interest rates. The sharp decline in equity markets in late 2008 suggests few new defi ned contribution plans are likely to be introduced in the near future.
Almost one-fi fth (17%) of employers indicate that less than half of their eligible employees are enrolled in their • Group RRSP or DC plan. Less than 10% of employers believe their employees have a strong understanding of how to invest their Group RRSP or DC plan assets. This suggests a need for enhanced communication, yet more than half of employers (51%) currently do not offer investment advice to plan members.
Talent management: Time for a keener focus?With the talent market becoming ever more competitive – 84% of employers reported that the shortage • of talented resources would have the most signifi cant impact over the next one to three years – employers must become more effective at attracting and retaining top workers. Valued group benefi ts and retirement programs are critical tools to this end. The challenge is offering these plans when health care costs continue to rise signifi cantly.
Employers recognize that the war for talent is intensifying. How confi dent they are at dealing with that •

4
2009 Aon Consulting’s Benefi t Trends Survey© Aon Consulting Inc. 2008 – All Rights Reserved
challenge is another matter. While 57% attach great importance to workforce planning, only 11% feel they are doing a highly effective job.
Communication: needs more work Employers have effectively addressed the media side of the communication equation. Most use a range of • media, from traditional to new age, to meet the communications preferences of their diverse, intergenerational workforce.
Yet in terms of message, employee communication remains rooted in the past, when employers made • most benefi ts decisions and occasional messages were suffi cient. While employers have shifted considerable responsibility for decision-making to their employees, they often fail to provide the information employees need to make informed decisions.
Employers rank total compensation or rewards as one of the most important topics of communication with • their employees, and 95% of respondents who issued these statements reported they helped to increase employee understanding and appreciation. Nonetheless, only 30% of employers do provide their employees with these statements.
Outsourcing: a win-win solution Over 50% of employers are outsourcing their benefi ts and/or pension administration. Over 30% are • outsourcing absence management. Increasingly, employers are realizing that the best expertise and the greatest value-for-money in managing many HR initiatives lie with organizations dedicated to the management of human resources.
ConclusionsThe shortage of qualifi ed and skilled employees is expected to be the most impactful HR issue in the next three years. Given the economic environment and the rising costs of employee benefi ts, striking the balance between the competition for top talent and the associated costs will underpin virtually all talent and benefi t decisions moving forward.
Organizations can consider a variety of measures to effectively manage this challenge. A more concerted commitment to workforce planning is critical to directing recruitment and retention efforts. Proactive recruitment strategies for key positions and creative retention strategies can act as clear points of differentiation from the competition.
Benefi ts programs remain an important component of total rewards and can provide a competitive advantage if organizations evolve to innovative, sustainable and comprehensive programs that respond to a diverse workforce and changing healthcare landscape.
It is critical that employees clearly understand the value of their benefi ts and feel equipped to manage their benefi ts choices through informed decisions. Enhanced communication tools and processes will be required to convey the organization’s value proposition and, in turn, maximize employee satisfaction and retention – critical success factors in the context of an impending talent crunch.

5
2009 Aon Consulting’s Benefi t Trends Survey© Aon Consulting Inc. 2008 – All Rights Reserved
Table of Contents
Participants 7
Participant Demographics 8
Trends in Health & Benefi ts and Absence Management 11
Trends In Retirement 17
Trends in Talent Management 21
Trends Survey – Communication 24
Trends in Outsourcing 28
Talent Management 31
Benefi ts 41
Shaping the Workplace of the Future 55


7
2009 Aon Consulting’s Benefi t Trends Survey© Aon Consulting Inc. 2008 – All Rights Reserved
Participants7-Eleven Canada Inc.1. ABSA (The Pressure Equipment Safety Authority)2. Acclaim Health3. AFMQ4. Agence métropolitaine de transport5. AGF Management Ltd.6. Agropur coopérative7. Ainsworth8. Air France9. Air Liquide Canada10. Aker Chemetics11. Allan Breau et Associés Inc.12. Allegro Résidences13. AlternaSolutions Inc.14. Anonymous15. Aon Canada16. Apegga17. Apotex Inc.18. APTN (Aboriginal Peoples Television Network)19. Arcturus Realty Corporation20. Areva T&D21. Association minière du Québec22. AstraZeneca Canada Inc.23. Aviva Canada Inc.24. AXA Canada25. B. A. Robinson Co. Ltd.26. Banque Nationale27. Beckton Dickinson and Company28. Bellwoods Centres For Community Living Inc.29. Bentall Capital30. Bibliothèque et archives nationales du Québec31. Blockbuster Canada Co.32. BNP Paribas (Canada)33. Boehringer Ingelheim Canada Ltd.34. Boutique Jacob35. British Columbia Ferry Services Inc.36. Business Development Bank of Canada37. CAA Saskatchewan38. CAAT Pension Plan39. Cameco Corporation40. Camoplast41. Canada Mortgage and Housing Corporation42. Canada Post Corporation43. Canadian Baptist Ministries44. Canadian Medical Association45. Canadian Memorial Chiropractic College46. Canadian Pacifi c47. Central Heat48. Centrale des syndicats démocratiques49. City of Abbotsford50. City of Burlington51. City of Chilliwack52. City of Edmontoin53. City of Nanaimo54. City of Ottawa55. City of Vancouver56. CNIB57. COM DEV Ltd.58. Commission de la construction du Québec59. Commission scolaire des navigateurs60. Comnetix61. Computer Sciences Canada Inc.62. Conexus Credit Union63. Construction DJL Inc.64. Core-Mark International Inc.65. Corporation d’hébergement du Québec66. Cott Beverages67. CPL (Contract Pharmaceuticals Ltd. Canada)68. Croix Blue du Québec69. Custom House Ltd.70. DALSA71. Danier Leather Inc.72. Davies Ward Phillips & Vineberg LLP73. Dillon Consulting Ltd.74. District of Squamish75. Dover Industries Ltd.76. Ducks Unlimited Canada77. EB Games78. Ébénisterie Norclair Inc.79. Eli Lilly Canada Inc.80. Emballages Jean Cartier81. Emergis, a TELUS Company82. Enerfl ex Systems Ltd.83. Energy Resources Conservation Board84. Fairmont Hotels & Resorts85. Federated Coop86. Fédération des caisses Desjardins du Québec87. FedEx Trade Networks88. Fillmore Riley LLP89. Finning International90. First Data Corp91. Flint Energy Services Ltd.92. Flynn Canada93.
FMSQ94. Follett Corporation95. Fondaction CSN96. Fondation Jules et Paul-Émile Léger97. Forks North Portage98. Fountain Tire Ltd.99. Fournitures Funéraires Victoriaville Inc.100. Franklin Templeton Investments101. Fujifi lm Canada Inc.102. Gaz Métro103. GBO Inc.104. Gestion Universitas Inc.105. Gilead Sciences Inc.106. Goodwill Industries of Alberta107. Government of the Northwest Territories108. Gowling Lafl eur Henderson109. Graham Group Ltd.110. Grande Prairie Regional College111. Green Shield Canada112. Greystone Managed Investments Inc.113. Groupe Deschênes Inc.114. Groupe Induspac115. Groupe Michel Cadrin116. Groupe Sogides Inc.117. H. J. Heinz Company of Canada Ltd.118. Harry Rosen Inc.119. Harvard Developments Inc.120. Hays Specialist Recruitment (Canada) Inc.121. Holt Renfrew122. HOOPP123. Hydro-Québec124. Hyndman & Co. Ltd.125. I&D Management Services Ltd.126. Ice River Springs127. Industrial Alliance Pacifi c Life Insurance128. Industrielle Alliance129. ING Canada130. Ingram Micro131. Innovation Credit Union132. International Financial Data Services (IFDS)133. InterVISTAS134. Intral Inc.135. Investissements PSP136. Investors Group137. IP Applications138. Jacobs Canada Inc.139. JELD-WEN140. Kitchen Craft141. Knoll North America Corp.142. Kodak Canada Inc.143. Kodak Graphic Communications Canada Company144. Kontron Canada Inc.145. Kraft Canada146. L-3 Communications MAPPS147. L-3 Wescam148. La Coop fédérée149. La Presse150. Lac-Beauport151. Larco Hospitality Management152. Law Society of British Columbia153. Ledcor Industries Inc.154. Legal Aid Alberta155. LensCrafters Inc.156. Lilydale Inc.157. Loblaw Companies Ltd.158. Loto-Québec159. Lundbeck Canada160. L’Union vie161. M&M Meat Shops Ltd.162. Maestria163. Maestro Group164. Mancon Holdings Ltd.165. Manitoba Hydro166. Manitoba Liquor Control Commission167. MAPEI Inc.168. Mariposa Cruises169. Maritime Paper Products Ltd.170. Matrikon Inc.171. McCarthy Tétrault172. McMichael Canada Art Collection173. MDS Inc.174. Metro Richelieu175. Minden Gross Grafstein & Greenstein LLP176. Multi-Marques177. Nelson Education Ltd.178. NGF Canada Ltd.179. Northern Lights Health Region180. NSB Group181. Ogilvy Renault S.E.N.C.R.L., s.r.l. / LLP182. Olympus Canada Inc.183. Open Text Corporation184. Oracle Canada185. Oxford Properties Group 186.
Pacifi c Regeneration Technologies Inc.187. Paladin Labs Inc.188. Papiers CCT189. PCL Constructors190. Penn West Energy Trust191. Pentax Canada Inc.192. Pharmaceutical Product Development Inc.193. Piller Sausages194. Plastibec195. PLB International Inc.196. PMC Sierra197. Points International198. POS Pilot Plant199. Présentation de Marie200. Quadro Engineering201. Quebecor Media Inc.202. Quincaillerie Richelieu203. Quixtar Canada Corporation204. ratiopharm205. Reebok-CCM206. Régie de police Thérèse-De Blainville207. Reitmans208. Right To Play209. Rimrock Resort Hotel210. Rutherford Controls International Corp.211. SAHO (Saskatchewan Association of Health Organizations)212. Saskatoon Airport Authority213. SaskEnergy Inc.214. Sears Canada215. Securit216. Selectpath217. Service Inspired Restaurants Corporation218. SFK Pulp219. SGEU LTD Plan220. SGI Canada221. Shepherd Village222. SHEPP223. Sherritt International224. SickKids Foundation225. Sierra Systems226. Sifton Properties Ltd.227. Société de transport de Laval228. Spinrite L.P.229. SSQ Assurances générales Inc.230. St Paul’s Fire & Travelers Guarantee Company231. STAS Inc.232. Steinbach Credit Union233. Stikeman Elliott LLP234. Sybase Canada235. TD Meloche Monnex236. Teachers Retirement Allowances Fund237. Teachers’ Superannuation Commission238. Teck Cominco Ltd.239. Tecsult240. Teknion241. TFNPP242. The DATA Group of Companies243. The Dominion of Canada General Insurance Company244. The McElhanney Group Ltd.245. The Wawanesa Mutual Insurance Company246. The Winnipeg Art Gallery247. Thrifty Foods248. Thunder Bay Port Authority249. Torys LLP250. Tourism Saskatchewan251. Trudeau Corporation252. Trylon TSF253. UBE Automotive254. United Farmers of Alberta255. United Way Windsor/Essex County256. Université Sainte-Anne257. University of British Columbia258. Uranium One Inc.259. Vancouver Port Authority260. Veltri Canada Glencoe261. Ventra Plastics Kitchener262. Ville de Baie-Comeau263. Ville de Bécancour264. Ville de Boisbriand265. Ville de Bromont266. Ville de Chambly267. Ville de Hampstead268. Ville de Montréal269. Ville de Rivière-du-Loup270. Ville d’Otterburn Park271. Viterra272. Westminster Savings273. Westmount City274. Winners Merchants International275. Winnipeg School Division276. Workers’ Compensation Board of Nova Scotia277. Yamaha Motor Canada Ltd.278.

8
2009 Aon Consulting’s Benefi t Trends Survey© Aon Consulting Inc. 2008 – All Rights Reserved
Participant Demographics278 employers responded to Aon Consulting’s 2009 Canadian Benefi ts Trends Survey. The following is a profi le of the respondents:
Respondents represented a variety of industry groups: manufacturing (12.6%), retail/wholesale/distribution (12.6%), • fi nance/insurance/real estate (13%), public sector (12%), professional services (10.1%), health sciences (3.6%), media/information/technology (4.7%) and all other private sector (28%).
Organizations from all provinces participated, except Prince Edward Island.•
Information was gathered about fi ve employee groups: executives, salaried employees, hourly unionized workers, hourly • non-unionized workers and retirees.
The respondents were largely HR or benefi ts managers responsible for compensation and benefi ts for their organizations.•
Sample Characteristics
Participating organization distribution by industry
Other 28.8%
Finance/Insurance/Real Estate 15.1%
Health Sciences 3.6%
Manufacturing 12.6%
Media/Information Technology 4.7%
Public Sector 11.9%
Retail/Wholesale/Distribution 12.6%
Professional Services 10.1%
Not reported 0.7%
100%
Participant Profi le
Organization headcount by province
# Org’s Avg.*Percentiles
25th 50th 75th
Atlantic provinces 75 293 7 49 126
Ontario 164 1296 51 262 786
Quebec 151 1406 49 245 550
Western provinces 161 1513 75 278 956
Territories 15 398 6 9 97
Total number of employees 272 2577 164 477 1523
* Please note the average in this section is being heavily weighted by multiple orgs.

9
2009 Aon Consulting’s Benefi t Trends Survey© Aon Consulting Inc. 2008 – All Rights Reserved
Annual revenue
More than $5 billion 7.9%
At least $1 billion, but less than $5 billion 14.7%
At least $500 million, but less than $1 billion 9.0%
At least $100 million, but less than $500 million 22.3%
At least $50 million, but less than $100 million 8.6%
At least $10 million, but less than $50 million 17.6%
$10 million or less 13.3%
Not reported 6.5%
100%
Percentage of workforce that is part-time
100% 0.7%
75%-99% 2.2%
50%-74% 5.4%
25%-49% 9.4%
1%-24% 66.5%
0% 15.8%
Not reported 0.4%
100%
Percentage of workforce that is union
100% 1.1%
75%-99% 18.7%
50%-74% 8.6%
25%-49% 9.2%
1%-24% 11.5%
0% 51.1%
Not reported —
100%


11
2009 Aon Consulting’s Benefi t Trends Survey© Aon Consulting Inc. 2008 – All Rights Reserved
Trends in Health & Benefi ts and Absence Management
Managing the cost of benefi ts and absenteeism without compromising employee satisfactionDetermining the optimal way to manage benefi ts and absenteeism costs continues to be a challenge for employers. Benefi ts programs are a key component of total rewards and an important incentive used to attract talent. In an attempt to control the cost of these programs without reducing their competitive advantage, many employers are increasingly focusing on strategies to improve health and productivity rather than relying solely on cost shifting.
Managing benefi ts program costs With benefi ts programs and their related costs reaching an annual average per capita cost for active employees of almost $3,400 in 2008, employers are continuing to seek ways to better manage these costs. For example, nearly 40% of survey respondents intend to search for a more competitive insurer/claims administrator in 2008 and beyond. Almost half (49%) of respondents have either implemented or plan to implement proactive claims management, while 58% are implementing enhanced disability management strategies.
Other key approaches employers have taken to deal with their escalating benefi ts costs include:
Increasing the employee contribution (28%) or fi xing the employer contribution (28%) •
Controlling the usage of paramedical services by introducing a combined maximum for practitioners (28%) and per visit • limits (25%)
Changing from company-paid to employee-paid long-term disability coverage (22%)•
Reducing reimbursement levels (21%) and introducing or increasing plan deductibles (24%)•
Controlling prescription drug costs by introducing a dispensing fee cap (20%), a controlled formulary (23%), or a per • prescription deductible (22%)
Aon perspectiveHuman Resources (HR) and Finance executives continue to be challenged by health care costs that are increasing much faster than the rate of general infl ation. At the same time, employers understand that they need to offer competitive benefi ts programs that meet their employees’ needs and expectations if they are to attract and retain hard-to-fi nd talent. Short-term fi xes to the design of traditional plans are not enough to contain future health costs. Employers recognize that they need to be innovative in developing and implementing sustainable, comprehensive health strategies and benefi ts programs that fi t within and are refl ective of their total compensation and HR strategy.

12
2009 Aon Consulting’s Benefi t Trends Survey© Aon Consulting Inc. 2008 – All Rights Reserved
Employers continue reducing retirees’ coverageOver 40% of respondents offer coverage to their retirees (35% offer extended health care and 28% offer life insurance). Reducing the fi nancial impact of retiree coverage, through cost shifting and/or cost avoidance, continues to be a benefi t trend in 2008 and beyond. Respondents that offer retiree coverage will attempt to control the rising cost of retiree benefi ts by:
Increasing the retiree contribution (32%)•
Reducing life insurance coverage (27%) and medical coverage (29%)•
Eliminating life insurance coverage (32%) and medical coverage (30%)•
Aon perspectiveGiven the increasing concern about their growing post-retirement liability, it is not surprising that many respondents are considering reducing or eliminating coverage for retirees, or changing from a defi ned benefi t to a defi ned contribution program. Furthermore, retiree benefi ts offer the least “payback” to the organization. While the cost of employee benefi ts may be balanced, at least in part, by the advantage the benefi ts program provides to the organization in attracting talent and building employee satisfaction and productivity, retiree benefi ts contribute minimal advantages in these areas, all of which suggests the trend towards reducing or eliminating coverage for retirees will continue. (Read more on defi ned benefi t and defi ned contribution plans in the Retirement section of this report).
Maximizing choice: fl exible benefi t (Flex) plansToday’s employees, especially younger ones, tend not to feel the same long-term commitment to their employers as their predecessors did. However, employers must still invest in competitive benefi ts programs for their employees if they are to be able to attract talented workers. Furthermore, in today’s multi-generational workforce (i.e. Generation X, Generation Y, etc.) employees have a wide range of benefi ts expectations; they are looking for benefi ts programs that are suffi ciently fl exible to adapt to their specifi c circumstances.
Given the diversity of these needs, coupled with the changing health care landscape (i.e. services being delisted by provincial health care plans) and the increasing cost of benefi ts, a growing number of employers either offer or plan to introduce fl exible benefi ts plans (fl ex plans) in addition to offering employee-paid optional benefi ts. While just 12% of respondents have already implemented fl ex plans in place of traditional plans (i.e. plans that offer no options to employees), almost one-quarter (24%) of them intend to switch to fl ex plans in 2008 or later.
Another emerging trend to reduce current benefi t costs is to offer a health care spending account, which provides employees with even greater levels of fl exibility. One-fi fth of respondents intend to introduce health care spending accounts in 2008 and later.

13
2009 Aon Consulting’s Benefi t Trends Survey© Aon Consulting Inc. 2008 – All Rights Reserved
Employers focusing on employee health and wellness
The attention employers have paid to controlling their health care costs has led to a growing appreciation of the value that improved employee health has on reducing health, disability and absenteeism costs, as well as increasing workforce productivity. Forty-six percent of respondents have implemented fl u shot programs, 35% promote exercise/physical activity and 29% have implemented smoking cessation programs. Looking forward, 52% of respondents intend to offer fl u shot programs, 46% will promote exercise/physical activity and 35% will offer smoking cessation programs. In addition, almost one-quarter (23%) of respondents either offer or plan to offer weight management and online lifestyle management programs. Increasingly, employers are also looking to better understand and defi ne the health risk profi le of their employee population through integrated analyses that include drug, health, disability, absence and self-reported health data.
This emphasis on wellness programs suggests that employers are focused on more than just cost-cutting or cost shifting; they are also willing to invest in the development of a healthier and more productive workforce. Employers recognize that programs that focus on improved nutrition, fi tness, stress management, work-life balance and healthier lifestyle choices can help minimize their direct and indirect costs.
Aon perspectiveIncreasingly, employers are improving cost control, enhancing employee satisfaction and better meeting employee needs by shifting from a traditional benefi ts plan to a fl ex plan.
Many employers continue to reduce coverage levels and shift additional portions of their program costs to their employees as their primary strategy for managing rising benefi ts costs. Some employers are also looking to control mid- and long-term costs through programs that help employees adopt better lifestyle habits (e.g.,smoking cessation programs). Through health and wellness programs, organizations can determine employee health risk profi les. The goal is to minimize adverse changes in the health status of their employees, thus reducing the number of future costly chronic benefi ts users.
Employers continue to improve absence management practicesFour out of ten respondents report that their total direct cost of absenteeism is below 2.9% of payroll. The remaining 60% of respondents have absenteeism costs that are either in line with or higher than the Canadian average (3.5% of payroll, according to Statistics Canada, June 2008). Over 50% of respondents manage their non-occupational short-term disability absences internally; others use an insurer or disability management organization.
Currently, almost 70% of respondents track unscheduled absences and sick leave within their absence management data, though less than 15% of them actually follow up on the disability or absence costs related to employees’ chronic conditions. By 2009, however, 60% of respondents plan to implement ways of tracking and evaluating incidental absences. About one-quarter (24%) of respondents plan to implement absence and disability performance indicators through a “dashboard” approach, which provides information on these indicators to management.

14
2009 Aon Consulting’s Benefi t Trends Survey© Aon Consulting Inc. 2008 – All Rights Reserved
Aon perspectiveRecent research confi rms that a proactive approach to helping employees (especially those with mental health issues) in the return to work process can have a signifi cant effect on these employees’ return to pre-disability function and performance on the job. To contain costs and better manage scarce talent, many respondents (close to 60%) are seeking to improve their disability management. More than half of the respondents intend to implement formal return to work processes for occupational and non-occupational (disability) absences by 2009.
An area that is still yet to be widely developed is the management dashboard. Best practices for sustaining regular attendance and containing absence costs include providing the organization’s top management with the factual metrics it needs to make informed decisions that support the relevant initiatives of the organization’s HR and operational managers. Just 15% of respondents provide their senior management with performance indicators related to absence or disability issues.
If you have implemented a global strategy for your pension and benefi t programs, what is your primary business objective?
What changes have you implemented or are you looking to implement for your future retirees’ coverage?
(Indicate all that apply)

15
2009 Aon Consulting’s Benefi t Trends Survey© Aon Consulting Inc. 2008 – All Rights Reserved
For your absence management programs, what practices have you implemented or do you intend to implement?
(Indicate all that apply)
For which of the following areas does your organization track current status/results and maintain specifi c benchmarks or targets through the use of a voluntary anonymous Health Risk Assessment Tool or Absence Management Data?


17
2009 Aon Consulting’s Benefi t Trends Survey© Aon Consulting Inc. 2008 – All Rights Reserved
Trends In Retirement
Shift away from defi ned benefi t pension plans slowsDespite the fact many organizations have moved away from defi ned benefi t (DB) pension plans in recent years, DB plans are far from extinct in Canada. Today, 43% of survey respondents continue to offer DB pension plans, while 36% offer Defi ned Contribution (DC) pension plans. The most popular retirement plans are Group RRSPs, which are offered by 49% of respondents. Some respondents have more than one type of retirement plan in place, while one in ten respondents indicates they do not offer any type of retirement plan to their employees.
The trend away from DB plans appears to be abating. Over three-quarters (77%) of respondents with DB plans have made no signifi cant changes to their plan in the past two years. Of those that have made changes, 15% have closed their plan to new entrants, 4% have reduced the level of benefi ts in the plan and 4% have frozen benefi ts. Looking ahead, 80% of respondents with DB plans do not expect to make signifi cant changes to their plans in the next two years; 10% will maintain their DB plan but reduce the benefi t level, 8% will close their plan to new entrants and just 2% intend to freeze benefi ts.
It is interesting to note that, while the popularity of DB plans has waned recently, most supplementary employee retirement plans (SERPs) still use a DB format. Almost three-quarters (73%) of respondents with SERPs have a DB SERP.
What type of retirement plans does your organization currently offer?
Indicate all that apply

18
2009 Aon Consulting’s Benefi t Trends Survey© Aon Consulting Inc. 2008 – All Rights Reserved
Aon perspectiveWhile there has been a transition away from DB plans to DC plans since 2000, it has largely taken the form of a DB freeze whereby the organization maintains its DB plan for employees’ past service and puts a DC plan in place for employees’ future service. A key reason why DB plans have not been eliminated altogether can be attributed to the current extended period of historically low interest rates. Plan sponsors are reluctant to lock in their returns at low rates by settling their DB liabilities.
Following the sharp decline in equity returns experienced in late 2008, even those organizations that have frozen their DB plans will be burdened with skyrocketing solvency amortization payments starting in 2009. While the coming year may not be the best time to settle remaining DB liabilities, it might be the right time for employers that have been waiting to eliminate DB plans entirely to develop a plan with an expected timeline for action.
Defi ned contribution plansDefi ned contribution plans include pension plans, deferred profi t-sharing plans and group registered retirement savings plans. While there has been a signifi cant increase in the number of DC plans since 2000, most plans have a number of issues that need to be addressed if the plans are to meet the expectations of their sponsors and the employees enrolled in them. These issues include plan governance as well as employee communications about the plans and how to participate in them. It seems likely that DC plans, and the DC industry in general, are unlikely to fully “mature” for some time.
DC plan governance
Although the Guidelines for Capital Accumulation Plans (CAP Guidelines) were fi nalized in May 2004 and came into effect (albeit on a voluntary basis) after December 31, 2005, 51% of respondents indicate that they are either not compliant with the CAP Guidelines or do not know whether they are.
The most common governance function that survey respondents have put in place related to their DC plans is a formal committee to oversee investments (62% of respondents have such a committee), while just 14% of respondents undertake a full independent review of fees and expenses.
Employee communication and participation
Almost one-quarter (22%) of respondents indicate that less than half of their eligible employees are enrolled in their DC plan. The most common reason employees do not participate in the plan is that they cannot afford it. Other reasons include they are not aware of the plan, they do not understand how to enroll in the plan, or they do not know how to select investment options.
The low levels of employee awareness about DC plans suggest the existence of signifi cant communication issues related to these plans. Indeed, more than four out of fi ve respondents (81%) believe their employees have either little or very little understanding of how to invest their DC accounts. This low level of understanding may, in part, be refl ective of the fact that most respondents (60%) do not offer investment advice to DC plan members. As a result, an employer’s choice of a default fund for those employees who, for whatever reason, do not choose their own investment option becomes an important matter. In the past, a money market fund was typically the default

19
2009 Aon Consulting’s Benefi t Trends Survey© Aon Consulting Inc. 2008 – All Rights Reserved
investment fund. Survey responses show the most common default fund today to be a balanced fund (41% of respondents) followed by a money market fund (29% of respondents).
Employer contributions to DC plans
Almost half of respondents (47%) compute employer contributions to their DC plan on the basis of matching the contributions of their employees, 23% make contributions unrelated to employee contributions and 25% make contributions based on some combination of the two. Of the employers that match their employees’ contributions, 70% fully match their employees’ contributions and almost half of respondents (49%) report that their maximum employer match results in an employer contribution of 6% or more of pay.
Most respondents indicate they will maintain their current contributions levels. Less than 1% of respondents intend to reduce their contribution levels, while 7% plan to increase contributions.
Aon perspective DC plans do not appear to have evolved signifi cantly. Since 2004, there has been an extensive push for improved plan governance, however, many pension committees continue to place their focus solely on investments. While investment performance is important, for some plans, the level of employee participation is a major issue which must be addressed if plan participants are to have any chance of a comfortable retirement. Furthermore, employer contributions alone are rarely high enough to meet most plan participants’ expectations. Plan participants who do not understand that and do not add their own contributions will fi nd it diffi cult to attain the level of retirement income they want.
Given plan participants’ minimal understanding of investment concepts and low utilization of the common modeling tools available, it appears that many participants do not fully understand the way their DC plans work, including the contributions and investment choices they are expected to make.


21
2009 Aon Consulting’s Benefi t Trends Survey© Aon Consulting Inc. 2008 – All Rights Reserved
Trends in Talent Management
The talent crunch is fast approachingEnsuring that they have, and will continue to have, the qualifi ed talent needed for success is a critical and increasingly diffi cult challenge facing most organizations. Almost all respondents (99%) identify an aging consumer and an aging workforce as their largest risk factors. Not surprisingly, in light of the shifting demographics and scarcity of talent, most respondents (57%) attach great importance to workforce planning, but just 11% of them feel they are doing a highly effective job at it.
Of the following major human capital challenges, which do you think are going to have the most signifi cant impact on your organization in the next 1-3 years?
Indicate all that apply
Most respondents (84%) say the shortage of qualifi ed and skilled employees will be their most impactful HR issue over the next three years. More than four out of fi ve respondents recognize the importance of meeting their talent/skill needs at senior leadership levels, at management levels and for key professional positions. Respondents are concerned about the impact a leadership shortage will have on their organization’s ability to deliver desired customer service levels, meet revenue growth targets and profi tability targets, and act innovatively.
Recruiting is a challenge…and reactiveDespite their concern about the risks of not having suffi cient talent, many organizations remain in a reactive mode when it comes to talent recruitment and selection. Less than one-quarter (23%) of respondents continuously recruit for hard-to-fi ll positions or feel their organization is effective in meeting its talent/skill needs at management levels. Even fewer (12%) believe their organizations are effective in meeting talent/skill needs for key professional positions.
22
2009 Aon Consulting’s Benefi t Trends Survey© Aon Consulting Inc. 2008 – All Rights Reserved
Organizations recognize their talent needs, but can they address them effectively?Respondents identify a number of talent-related areas they consider of importance, many of which they expect to become even more signifi cant in the future. Yet respondents are not highly confi dent in their organization’s ability to address these issues effectively.
Talent recruitment and selection process: Most respondents (85%) rank their talent recruitment and selection process as being either very important or extremely important, and more than three-quarters (77%) anticipate an increase in their talent needs over the next three to fi ve years. However, less than one-quarter (23%) of respondents believe they are doing an effective job in their recruiting and selection practices.
Talent retention: When it comes to ensuring that an organization has the talent it needs to succeed, retaining existing talent goes hand-in-hand with recruiting talent. Given that most respondents recognize the need to recruit talent as a priority, it is not surprising to see that most (81%) feel retention is either very important or extremely important. Most respondents (69%) also feel talent retention will become even more important in the future. Nevertheless, just 22% of respondents believe their retention strategies are effective.
Talent management and succession planning: Given the aging of the workforce, we see that almost 80% of respondents expect their talent management and succession planning needs to increase in the future. However, just over one-third (36%) of them feel their organizations are currently very effective in this area.
Innovation and creativity required to be competitive: Talented employees are important to an organization’s ability to innovate and be creative in order to be competitive. Almost three-quarters (73%) of respondents believe they will need to increase their practices to promote innovation and creativity, but just 18% of them currently consider their organizations very effective in these practices.
Employee training and development: Training and development is important for developing the skills and abilities of current employees and is a key incentive for attracting talent. Recognizing that, most respondents (64%) expect their employee training and development needs will increase signifi cantly, yet just 21% of them feel that their current practices in this area are very effective.
Aon’s perspectiveFor the next few years, it will be critical for organizations to have the ability to attract and retain talent. Organizations recognize that having the talent they need to succeed is not only one of their top challenges, but will become an even more diffi cult one in the future. Yet few organizations believe they are currently very effective in meeting this challenge. The issue, therefore, is: will they be able to become more effective, and effective enough, in executing their talent strategies over the next few years?
Organizations seeking to distinguish themselves from the competition and win the war for talent will clearly need to adopt and execute highly effective, innovative and proactive strategies, especially when it comes to recruiting talent for key positions, and designing and implementing creative staff retention and succession planning initiatives. Employee training and development and the ties that employees maintain with their managers are two of the largest factors affecting retention. The more effective an organization is in addressing these and other retention factors, the more successful it will be in sustaining an ability to retain key talent. The key to that success is the ability to fi rst attract and develop managers who will focus on developing employees, and mobilize and inspire their organization’s workforce.


24
2009 Aon Consulting’s Benefi t Trends Survey© Aon Consulting Inc. 2008 – All Rights Reserved
Trends Survey – Communication
Organizations use a range of media to communicate with employeesTraditional print media continues to be the most popular method of communicating benefi ts, HR and organizational information to employees. Two-thirds of respondents provide their employees with intranet access to this information. Seventeen percent offer communications through the internet which allows employees to access the information from home and share it with their spouses and partners. Many respondents (78%) also use face-to-face meetings for communicating such information.
How does your organization currently communicate benefi ts, HR and organizational information to employees?
Indicate all that apply
Face-to-face communication not always well supportedMore than two-thirds of respondents use employee meetings or town hall meetings to communicate organizational, HR and benefi ts information. Three-quarters of respondents feel managers have a moderate to very signifi cant role in the communication process, but few organizations provide their managers with tools to support the communication effort. Just 18% of respondents provide their managers with talking points, presentations or other materials to help ensure messages are delivered consistently across the organization; about one-third (32%) only “sometimes” provide their managers with such tools.
What role do managers play in helping you communicate the value of your employer value proposition?

25
2009 Aon Consulting’s Benefi t Trends Survey© Aon Consulting Inc. 2008 – All Rights Reserved
Communicating the employer value propositionOver two-thirds of respondents use personal interaction (e.g. employee focus groups, small group meetings and one-on-one interviews) to gain employees’ feedback about benefi t and organizational issues.
Respondents rank total compensation or rewards as one of the most important topics of communication with employees. Over half (53%) rank it as being either very important or extremely important, second only to information about the company’s mission, vision and values (60% rank that as very important or extremely important). Still, fewer than 30% of respondents provide employees with annual total compensation or rewards statements, though an additional 43% of respondents plan to provide such statements in the future.
Organizations that provide statements fi nd them to be a valuable tool in helping to communicate total compensation. Over 95% of respondents report that the statements helped increase employee understanding and appreciation of the employer’s fi nancial contribution to their total compensation. Almost one-third (32%) said the statements contributed to higher levels of employee engagement and that they had a positive impact on employee retention (30%).
Please identify how important the topics listed below are for your organization to communicate.

26
2009 Aon Consulting’s Benefi t Trends Survey© Aon Consulting Inc. 2008 – All Rights Reserved
Aon perspective With today’s diverse, intergenerational workforce, it is not surprising that organizations employ a wide range of media to match their employees’ differing communication preferences. Given the increasing numbers of younger, highly technology-fl uent workers, there is a growing use of web-based, self-service tools. Organizations are moving from static content web sites to integrated HR Portals that have increased transactional capabilities, personalized decision making tools, benefi ts and pension modelers and interactive wellness components.
Despite the increase in new age media, the oldest form of communication, face-to-face communication, remains popular and is still the most direct and intimate form of communication. Organizations understand the value of direct interaction with employees, which provides immediate feedback and a forum of information exchange.
Despite this, organizations do not appear to fully appreciate or take full advantage of the power of face-to-face communication. Managers are often left on their own to structure and deliver key messages and technical information with little training or tools to help them. Without effective tools to support them, the value and benefi t of live meetings will only be as good as the interpersonal, communication and technical skills of each individual manager.


28
2009 Aon Consulting’s Benefi t Trends Survey© Aon Consulting Inc. 2008 – All Rights Reserved
Trends in Outsourcing
Outsourcing growing in popularityGrowing numbers of organizations are outsourcing their benefi ts administration and absence management functions. Just over one-quarter (27%) of respondents to Aon’s Benefi t Trends Survey in 2006 reported outsourcing benefi ts administration; today, more than half of respondents do so. Similarly, the number of organizations that outsource absence management has jumped to 29% of respondents from only 17% two years ago.
About two-thirds (65%) of respondents outsource some form of retirement plan administration (both DB and DC) and one-fi fth have outsourced direct contact with their employees through a benefi ts call centre. These numbers are relatively unchanged from 2006.
The top reasons for outsourcing, unchanged since Aon’s last survey, are: access to expertise, to improve service and quality, to allow the organization to focus on its core competencies, and to allow the organization to focus on strategic issues. In addition, respondents report other benefi ts gained by outsourcing one or more of their HR functions. These include improvements in service (cited by half of respondents), improved quality (40%), a better ability to focus on strategic activities (one-third) and reduced costs (26%).
Organizations that do not plan to outsource any of their HR functions in 2009 will not do so because outsourcing is not a management priority or because the organization has suffi cient in-house expertise to handle its own needs. Organizations that are considering outsourcing some HR functions suggest that they are most likely to outsource absence management and recruitment activities.
Aon perspective No matter how well designed an HR program may be, it will only succeed if it is supported by integrated, effective solutions. Organizations increasingly recognize that the best expertise in terms of effi ciency, quality and cost-effectiveness for administering many of their HR programs lies with organizations that make HR administration a primary business activity. While some organizations have that capability in-house, a growing number are turning to outsourcing as their best choice for HR administration. As the complexity of HR administration issues increases (a refl ection, for example, of the wider range of individual choices and options available to each employee), it would appear that fewer and fewer organizations will have the capability of effectively administering all their HR programs internally.

29
2009 Aon Consulting’s Benefi t Trends Survey© Aon Consulting Inc. 2008 – All Rights Reserved
Which of the following reasons listed below were the most important leading to your outsourcing decision?
Indicate all that apply
Which outcomes has your organization achieved?
Indicate all that apply

Are you readyto shape the future of your workplacethrough benefi ts and talent management?

31
2009 Aon Consulting’s Benefi t Trends Survey© Aon Consulting Inc. 2008 – All Rights Reserved
Talent Management
HUMAN CAPITAL RISK AND CHALLENGES
What do you perceive as the greatest human capital risks facing your organization? (Indicate all that 1. apply.)
Aging consumers and workforce 98.5%
Healthcare and benefi ts costs 97.0%
Regulatory and compliance risks 92.9%
Industry consolidation/transition 91.4%
Emerging markets 89.8%
Of the following major human capital challenges, which do you think are going to have the most 2. signifi cant impact on your organization in the next 1-3 years? (Indicate all that apply)
Shortage of qualifi ed and skilled resources 84.2%
Increasing cost of benefi ts 59.7%
Changing demographics 57.1%
Absenteeism and productivity 41.4%
Correct and full implementation of corporate guidelines 16.1%
Regional/geographic diversity 15.8%
Outsourcing/Offshoring 9.9%

32
2009 Aon Consulting’s Benefi t Trends Survey© Aon Consulting Inc. 2008 – All Rights Reserved
LEADERSHIP AND TALENT MANAGEMENT
Using the scales provided, please rate both how important each item is to your organization and how 3. effective your organization is at delivering each.
Important
Rank* ExtremelyImportant
VeryImportant Important Somewhat
ImportantNot
Important
Ability to meet talent/skill needs at senior leadership level
1 44.2% 40.4% 11.3% 1.9% 1.5%
Compliance with applicable policies, procedures, laws and ethics
2 39.6% 35.5% 21.5% 2.3% 0.4%
Talent retention 3 36.6% 44.2% 15.5% 3.0% 0.4%
Talent recruiting and selection process - 34.7% 50.6% 12.5% 1.9% —
Communication - 34.7% 46.8% 14.7% 2.3% 0.4%
Employer branding (reputation in marketplace)
- 34.7% 37.7% 16.2% 6.0% 3.0%
Ability to meet talent/skill needs at management level
- 29.8% 54.0% 14.3% 1.5% —
Employee engagement - 26.8% 46.8% 23.0% 1.5% 1.5%
Ability to meet talent/skill needs for key professional positions
- 26.4% 55.8% 15.5% 1.5% —
Total rewards system - 23.0% 54.3% 18.1% 3.4% 0.8%
Innovation and creativity required to be competitive
- 23.0% 39.2% 22.6% 6.4% 7.2%
Talent management and succession planning
- 19.2% 47.2% 25.3% 5.3% 1.5%
Employee training & development - 18.9% 49.4% 25.7% 5.3% 0%
Performance management - 18.5% 49.4% 24.9% 4.5% 1.9%
High potential talent identifi cation - 17.4% 43.0% 30.2% 6.0% 1.5%
Workforce planning in light of demographic shifts & talent shortages
- 13.6% 43.0% 29.1% 10.6% 3.4%
New employee on-boarding - 13.2% 46.4% 31.3% 6.4% 1.9%
Design of HR administrative processes - 10.6% 31.3% 38.5% 15.8% 3.0%
Mergers and acquisitions facilitation - 10.6% 12.5% 11.3% 15.1% 44.2%
Large-scale organizational change - 9.4% 21.1% 26.4% 20.4% 17.7%
Ability to meet talent/skill needs at entry level
- 9.1% 34.3% 42.6% 11.7% 1.9%
HR cost reduction - 3.8% 16.2% 37.0% 27.2% 14.0%
Outsourcing HR functions - 0.8% 3.4% 11.7% 23.8% 57.7%
* Ranked by “Extremely Important”

33
2009 Aon Consulting’s Benefi t Trends Survey© Aon Consulting Inc. 2008 – All Rights Reserved
Effectiveness
Rank* ExtremelyEffective
VeryEffective Effective Somewhat
EffectiveNot
Effective
Outsourcing HR functions 1 18.8% 39.5% 35.2% 4.6% 1.1%
Mergers and acquisitions facilitation 2 11.5% 28.4% 33.7% 18.0% 6.5%
Large-scale organizational change 3 8.4% 42.1% 38.3% 10.3% —
Talent management and succession planning
- 6.9% 29.1% 44.1% 15.3% 3.4%
High potential talent identifi cation - 5.7% 26.4% 39.8% 23.4% 4.2%
Employer branding (reputation in marketplace)
- 4.2% 21.8% 39.8% 28.0% 5.7%
Employee engagement - 4.2% 6.1% 34.9% 12.6% 29.1%
New employee on-boarding - 3.8% 28.7% 41.4% 17.6% 4.6%
Performance management - 3.1% 28.0% 51.3% 16.5% 1.1%
Talent retention - 3.1% 18.8% 48.3% 23.8% 5.7%
Design of HR administrative processes - 3.1% 18.4% 40.2% 27.6% 8.4%
Innovation and creativity required to be competitive
- 3.1% 14.6% 53.3% 21.1% 3.4%
Total rewards system - 2.7% 34.5% 46.4% 14.6% 1.5%
Communication - 2.7% 23.0% 43.7% 24.1% 4.6%
Employee training & development - 2.7% 19.2% 48.7% 23.4% 5.4%
Ability to meet talent/skill needs at senior leadership level
- 2.3% 22.2% 44.1% 25.3% 5.7%
HR cost reduction - 2.3% 15.7% 26.8% 17.6% 23.8%
Ability to meet talent/skill needs at entry level
- 1.5% 28.0% 45.2% 20.3% 4.6%
Compliance with applicable policies, procedures, laws and ethics
- 1.1% 24.9% 54.0% 18.8% 0.8%
Talent recruiting and selection process - 1.1% 21.8% 55.6% 19.9% 0.8%
Ability to meet talent/skill needs at management level
- 0.8% 21.8% 44.1% 26.4% 5.7%
Ability to meet talent/skill needs for key professional positions
- 0.8% 11.1% 39.1% 26.8% 14.2%
Workforce planning in light of demographic shifts & talent shortages
- 0.4% 10.7% 36.8% 38.3% 11.9%
* Ranked by “Extremely Effective”

34
2009 Aon Consulting’s Benefi t Trends Survey© Aon Consulting Inc. 2008 – All Rights Reserved
Consider the next 3-5 years. Using the scale provided, indicate if needs in each area will increase, 4. decrease, or stay the same.
Rank* IncreaseSubstantially Increase Stay the
Same Decrease DecreaseSubstantially
Talent retention 1 14.3% 54.3% 27.2% 3.0% 0.4%
Talent management and succession planning 2 14.0% 65.3% 19.2% 0.4% 0.4%
Talent recruiting and selection process 3 13.6% 63.8% 20.8% 1.1% 0.4%
Communication - 13.2% 61.1% 23.4% — 0.4%
Workforce planning in light of demographic shifts & talent shortages
- 11.7% 58.9% 26.4% 1.1% 0.4%
Ability to meet talent/skill needs for key professional positions
- 11.3% 53.2% 31.3% 3.0% 0.4%
Employee engagement - 10.9% 53.2% 33.6% 1.1% 0.4%
Ability to meet talent/skill needs at management level
- 10.2% 53.2% 32.8% 3.0% 0.4%
Employee training & development - 9.8% 54.3% 34.0% 0.8% 0.4%
Innovation and creativity required to be competitive
- 9.4% 63.0% 24.2% 0.4% —
Employer branding (reputation in marketplace)
- 9.4% 51.7% 36.2% — 0.4%
Ability to meet talent/skill needs at senior leadership level
- 9.1% 43.0% 43.8% 3.0% —
High potential talent identifi cation - 8.3% 53.6% 36.2% 0.4% 0.4%
Performance management - 6.8% 52.1% 39.2% — 0.4%
Ability to meet talent/skill needs at entry level - 6.0% 35.8% 54.0% 3.8% —
New employee on-boarding - 4.9% 45.3% 48.3% 0.4% 0.4%
Total rewards system - 4.2% 69.4% 24.9% 0.8% 0.4%
Large-scale organizational change - 4.2% 26.0% 58.9% 5.3% 0.8%
Compliance with applicable policies, procedures, laws and ethics
- 3.8% 34.0% 61.1% — —
Design of HR administrative processes - 3.4% 44.5% 48.7% 1.1% 0.4%
HR cost reduction - 2.6% 18.9% 70.9% 4.2% 1.1%
Mergers and acquisitions facilitation - 2.3% 15.1% 62.6% 5.3% 3.8%
Outsourcing HR functions - 0.8% 8.3% 76.6% 7.5% 2.3%
* Ranked by “Increase Substantially”

35
2009 Aon Consulting’s Benefi t Trends Survey© Aon Consulting Inc. 2008 – All Rights Reserved
Which one of the following potential results of a leadership shortage most concerns you?5.
Reduced ability to meet revenue growth goals 21.2%
Reduced ability to innovate 11.9%
Reduced ability to meet profi tability targets 21.2%
Reduced ability to deliver desired customer service levels 30.6%
None of the above 8.6%
Not reported 6.5%
100%
For hard-to-fi ll positions, which of the following best describes your recruiting approach? 6.
Same as for other positions 12.6%
We recruit applicants for hard-to-fi ll positions when they become open 56.1%
We continuously recruit for hard-to-fi ll positions to establish a pool of candidates 23.0%
Does not apply; we do not have hard-to-fi ll positions 2.2%
Not reported 6.1%
100%
Over the last two years, when you were not successful in hiring your top recruits, what was the main 7. reason?
They go elsewhere for pay that they perceive is higher 34.9%
They go elsewhere for benefi ts that they perceive are better 1.8%
They go elsewhere for long term incentive/equity compensation they perceive is better 5.4%
They go elsewhere for career development opportunities they perceive are better 12.6%
They go elsewhere for perceived work/life advantages 6.8%
We hire the majority of our top recruits 31.3%
Not reported 7.2%
100%
36
2009 Aon Consulting’s Benefi t Trends Survey© Aon Consulting Inc. 2008 – All Rights Reserved
COMMUNICATIONS
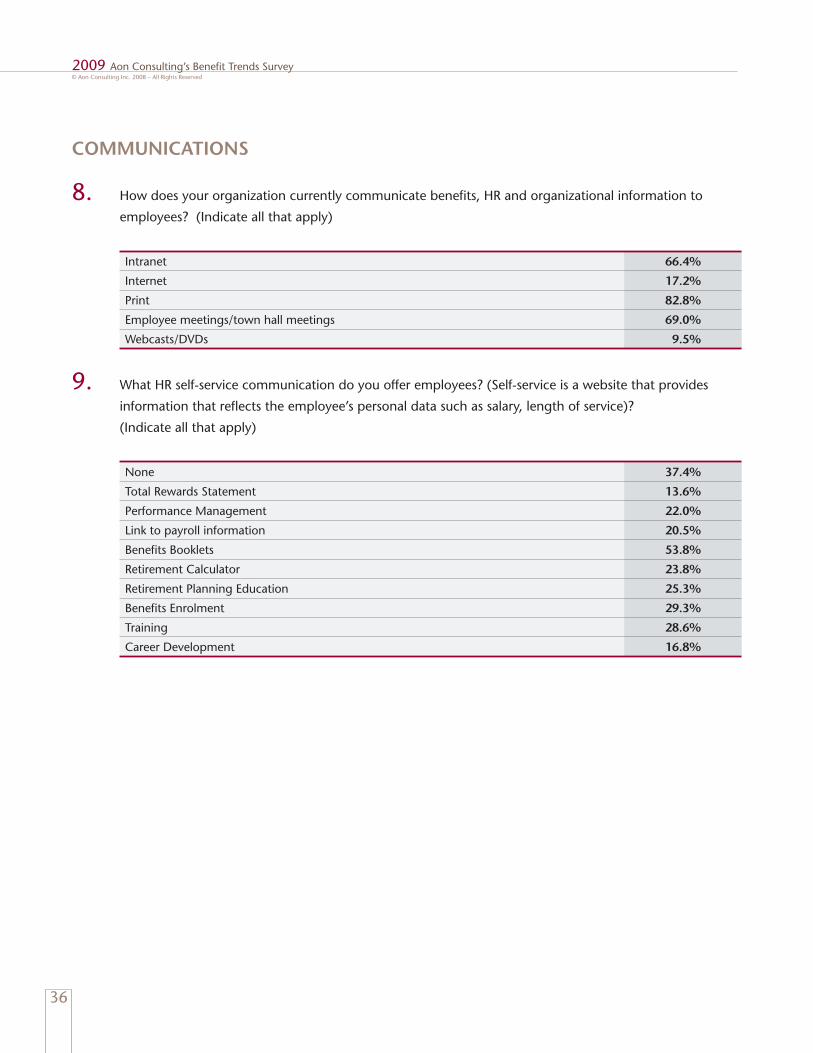
How does your organization currently communicate benefi ts, HR and organizational information to 8. employees? (Indicate all that apply)
Intranet 66.4%
Internet 17.2%
Print 82.8%
Employee meetings/town hall meetings 69.0%
Webcasts/DVDs 9.5%
What HR self-service communication do you offer employees? (Self-service is a website that provides 9. information that refl ects the employee’s personal data such as salary, length of service)?
(Indicate all that apply)
None 37.4%
Total Rewards Statement 13.6%
Performance Management 22.0%
Link to payroll information 20.5%
Benefi ts Booklets 53.8%
Retirement Calculator 23.8%
Retirement Planning Education 25.3%
Benefi ts Enrolment 29.3%
Training 28.6%
Career Development 16.8%

37
2009 Aon Consulting’s Benefi t Trends Survey© Aon Consulting Inc. 2008 – All Rights Reserved
Please identify how important the topics listed below are for your organization to communicate.10.
Rank* ExtremelyImportant
VeryImportant Important Somewhat
ImportantNot
Important
Company mission, vision and values 1 19.0% 41.3% 28.3% 8.6% 2.2%
Employer branding 2 11.5% 27.9% 33.8% 19.7% 4.8%
Total compensation or rewards 3 10.8% 42.4% 33.1% 9.3% 3.0%
Organizational change - 8.9% 37.9% 30.9% 14.9% 4.8%
HR policies and programs - 7.1% 34.6% 44.6% 11.5% 1.1%
Performance management - 6.7% 43.1% 37.9% 10.4% 0.7%
Benefi ts programs - 6.3% 36.1% 51.3% 5.2% 1.1%
Employer Value Proposition - 6.3% 32.3% 39.0% 16.4% 3.0%
Health and wellness - 5.2% 25.3% 46.8% 16.0% 5.2%
Career development and training - 4.1% 32.0% 47.2% 13.8% 1.9%
Organizational development - 4.1% 32.0% 40.5% 15.2% 4.1%
Executive benefi t programs - 2.6% 15.2% 37.9% 20.8% 17.8%
Financial and/or retirement planning - 2.2% 16.7% 42.4% 24.5% 11.2%
* Ranked by “Extremely Important”
How do you solicit employee feedback regarding benefi t and organizational issues? 11. (Indicate all that apply)
Employee focus groups or small group meetings 41.0%
Employee surveys 58.7%
One-on-one interviews with managers 28.4%
We do not solicit feedback 23.6%
What role do managers play in helping you communicate the value of your employer value proposition?12.
Very signifi cant role 18.3%
Signifi cant role 34.2%
Moderate role 22.3%
Some role 10.8%
Very little role 10.8%
Not reported 3.6%
100%

38
2009 Aon Consulting’s Benefi t Trends Survey© Aon Consulting Inc. 2008 – All Rights Reserved
How frequently does your organization provide tools (talking points, presentations, email/letters) to help 13. managers communicate your employer value proposition or value of your total rewards package?
Very often 1.8%
Often 15.8%
Sometimes 32.4%
Infrequently 33.5%
Not at all 13.3%
Not reported 3.2%
100%
Does your organization provide employees with annual total compensation or total rewards statements?14.
Yes, online and print 5.0%
Yes, online only 3.2%
Yes, print only 20.1%
No, but we are considering it for the future 42.8%
No future plans to provide statements 26.6%
Not reported 2.2%
100%
If you provide statements, which of the following outcomes are you able to measure? 15. (Indicate all that apply)
Positive impact on employee retention 30.4%
Higher levels of employee engagement 31.6%
Increased employee savings activity or participation 15.2%
Increased participation in voluntary plans 20.3%
Increased understanding and appreciation of the fi nancial contribution made by your organization towards total compensation
96.2%

39
2009 Aon Consulting’s Benefi t Trends Survey© Aon Consulting Inc. 2008 – All Rights Reserved
HR OUTSOURCING
Which of the following administration functions does your organization currently outsource? 16. (Indicate all that apply)
Pension administration 65.2%
Benefi ts administration 52.5%
Absence management (Short Term Disability and/or Workers Compensation) 29.1%
Employee benefi ts call center 19.1%
Annual enrollment 9.9%
Profi t sharing plan administration 5.7%
Recruitment selection and processing 19.1%
Which of the following reasons listed below were the most important leading to your outsourcing 17. decision? (Indicate all that apply)
Access to expertise 76.1%
Focus on core competencies 23.2%
Focus on strategic issues rather than transactional business 23.2%
HR process redesign reengineering 4.3%
Improve service and quality 33.3%
Access to leading edge technology platforms 21.7%
Lack of internal technology support 15.2%
Reduce costs 21.7%
Shift from fi xed costs to variable costs 4.3%
Which outcomes has your organization achieved? (Indicate all that apply) 18.
Improved analytics 15.8%
Improved cost management 25.9%
Improved quality 40.3%
Improved service 49.6%
Increased ability to focus on strategic versus administrative functions 33.8%
None of the above 16.5%

40
2009 Aon Consulting’s Benefi t Trends Survey© Aon Consulting Inc. 2008 – All Rights Reserved
Why are you not currently outsourcing any HR functions? (Indicate all that apply)19.
Not a priority at the moment 57.5%
Belief that savings will be limited 33.9%
Loss of operational control 37.8%
Loss of in-house expertise 36.2%
Excessive effort required 9.4%
HR activities are critical to your business success 36.2%
Can execute activities better than other vendors 29.9%
Your organization’s HR needs are too unique for outsourcing 18.9%
Effect on employee morale and company culture 28.3%
Concerns over service disruption 21.3%
If you intend to outsource HR functions within the next 1-3 years, which of the following administration 20. functions will your organization consider outsourcing? (Indicate all that apply)
Pension administration 7.2%
Benefi ts administration 4.5%
Absence management (Short Term Disability and Workers Compensation) 6.3%
Employee benefi ts call center 6.3%
Annual enrollment 0.9%
Profi t sharing plan administration 0.9%
Recruitment selection and processing 9.0%
None of the above 77.5%

41
2009 Aon Consulting’s Benefi t Trends Survey© Aon Consulting Inc. 2008 – All Rights Reserved
Benefi ts
If you have implemented a global strategy for your pension and benefi t programs, what is your primary 21. business objective?
Cost savings due to uncontrolled increases or budgetary requirements 15.8%
Compliance with accounting, regulatory, corporate-based standards 4.0%
Ability to direct the programs to align with business objectives and strategies 20.1%
Consistency of benefi t packages and total rewards offered 34.2%
Not reported 26.3%
100%
HEALTH & BENEFITS
What changes did you implement in 2007 or earlier; are implementing in 2008; or are planning to 22. implement in the future to reduce costs or improve the quality of the coverages? (Indicate all that apply)
2007 and earlier 2008 2009 or later
Flu shot program 44.0% 2.4% 5.2%
Introduction of Pay Direct or Differed Drug Card 41.6% 3.6% 8.4%
Search for more competitive insurer/claims administrator
38.4% 21.2% 18.0%
Introduction of or increases in Optional Life Insurance 32.4% 2.8% 4.8%
Promote exercise/physical activity 28.4% 6.8% 11.2%
Smoking cessation program 25.6% 3.6% 6.0%
Prescription drugs 24.4% 13.2% 12.0%
Claims management 24.4% 13.2% 11.6%
Disability management 22.8% 20.4% 14.8%
Eligibility – employees and dependents 20.4% 8.4% 10.8%
Convert from insured to self-insured 20.0% 2.4% 7.2%
Introduction of Voluntary AD&D Insurance 18.0% 0.8% 4.0%
Introduction of combined maximums for paramedical practitioners
17.6% 3.6% 6.4%
Increased employee contribution through plan design 16.8% 4.8% 14.4%
Introduction of per visit limits on paramedical practitioners
16.8% 1.6% 6.4%
Fixed employer contribution 15.6% 3.6% 8.4%
Introduction of mandatory generic substitution 14.8% 1.6% 10.4%
Change from Company paid to Employee paid LTD 14.4% 1.6% 6.0%

42
2009 Aon Consulting’s Benefi t Trends Survey© Aon Consulting Inc. 2008 – All Rights Reserved
2007 and earlier 2008 2009 or later
Reduction of benefi ts and introduction of a Health Care Spending Account
14.0% 4.0% 16.4%
Increased employee contribution through payroll deduction
12.4% 6.0% 10.0%
Introduction of a Critical Illness coverage 12.4% 2.8% 15.6%
Introduction of a fee and margin cap 12.0% 2.0% 6.4%
Introduction of controlled Formulary 12.0% 1.6% 9.2%
Moving from a traditional plan (no option) to a fl exible plan
11.6% 3.6% 20.4%
On-site fi tness centre 11.6% 0.8% 6.8%
Weight management/obesity program 10.4% 2.4% 10.0%
Introduction/increase in per prescription deductible 9.6% 2.0% 10.0%
Introduction of tiered reimbursement level 9.6% 1.2% 11.2%
Reduction of reimbursement levels 9.2% 2.8% 8.8%
Online lifestyle management programs 8.8% 3.6% 10.8%
Telephonic health care coaching 8.8% 1.2% 6.4%
Introduction of fi xed/lagging dental fee guide 8.8% 0.4% 4.4%
Introduction/Increase plan deductibles 8.4% 2.8% 12.4%
Introduction of a Long-term Care coverage 8.4% 0.8% 8.4%
Introduction of Prior Authorization 8.4% 0.4% 6.0%
Health risk appraisals (HRAs) 7.6% 5.2% 12.8%
Biometric screening (e.g., cholesterol, blood sugar) 7.6% 2.0% 9.2%
Introduction of a lifetime maximum 7.2% 2.0% 6.8%
Change from Employee paid to Company paid LTD 7.2% 0.4% 7.2%
Decrease in amount of Company Paid Life Insurance 6.0% 2.4% 6.8%
Convert from self-insured to insured 4.8% 1.2% 4.0%
Offer incentives such as an increase in Health Care Spending Account for employees participating in company wellness initiatives
4.8% 2.0% 10.0%
Disease management (e.g., heart disease, diabetes, asthma, other)
4.0% 2.8% 12.0%
Measure program success/ROI (metrics) 4.0% 1.6% 10.0%
Reduction of benefi t frequency maximums 3.6% 1.6% 0.8%
43
2009 Aon Consulting’s Benefi t Trends Survey© Aon Consulting Inc. 2008 – All Rights Reserved
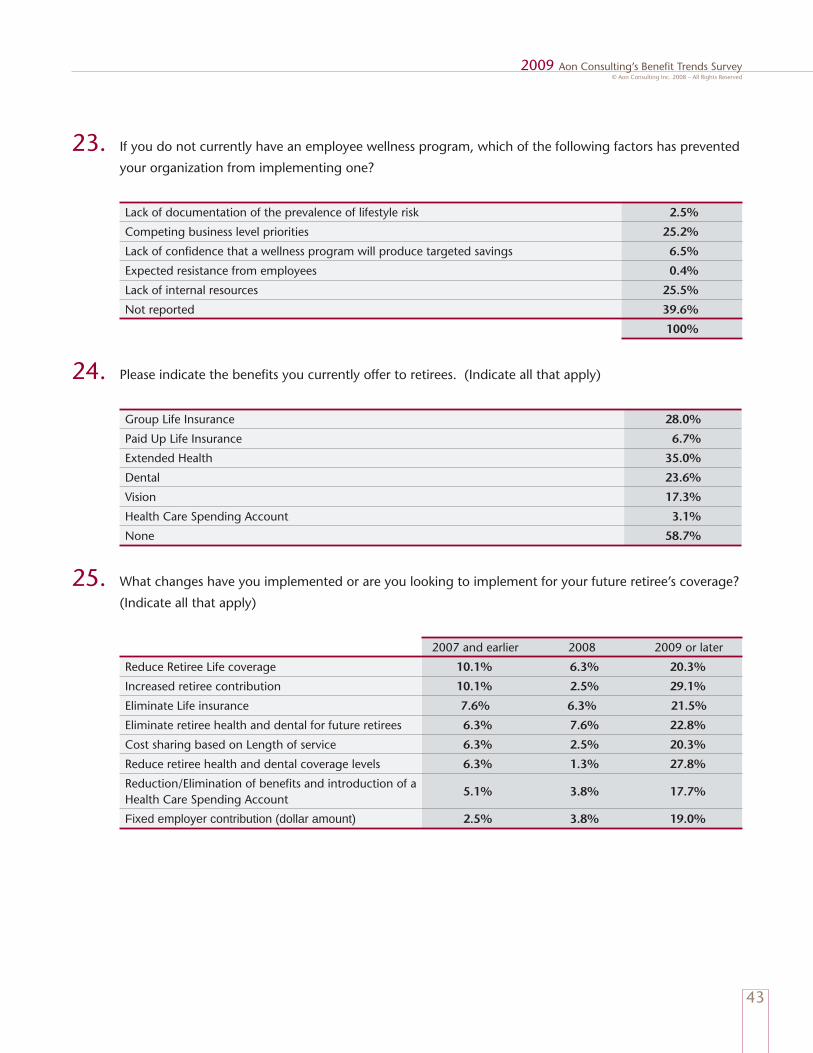
If you do not currently have an employee wellness program, which of the following factors has prevented 23. your organization from implementing one?
Lack of documentation of the prevalence of lifestyle risk 2.5%
Competing business level priorities 25.2%
Lack of confi dence that a wellness program will produce targeted savings 6.5%
Expected resistance from employees 0.4%
Lack of internal resources 25.5%
Not reported 39.6%
100%
Please indicate the benefi ts you currently offer to retirees. (Indicate all that apply)24.
Group Life Insurance 28.0%
Paid Up Life Insurance 6.7%
Extended Health 35.0%
Dental 23.6%
Vision 17.3%
Health Care Spending Account 3.1%
None 58.7%
What changes have you implemented or are you looking to implement for your future retiree’s coverage? 25. (Indicate all that apply)
2007 and earlier 2008 2009 or later
Reduce Retiree Life coverage 10.1% 6.3% 20.3%
Increased retiree contribution 10.1% 2.5% 29.1%
Eliminate Life insurance 7.6% 6.3% 21.5%
Eliminate retiree health and dental for future retirees 6.3% 7.6% 22.8%
Cost sharing based on Length of service 6.3% 2.5% 20.3%
Reduce retiree health and dental coverage levels 6.3% 1.3% 27.8%
Reduction/Elimination of benefi ts and introduction of a Health Care Spending Account
5.1% 3.8% 17.7%
Fixed employer contribution (dollar amount) 2.5% 3.8% 19.0%

44
2009 Aon Consulting’s Benefi t Trends Survey© Aon Consulting Inc. 2008 – All Rights Reserved
What is your expected total annual per capita benefi ts cost by line of coverage? (Indicate all that apply)26.
2007 Estimated 2008 What % is Company Paid
Basic Life and AD&D $282 $281 86.7%
Dependent Life $26 $27 85.6%
Short Term Disability (paid by Carrier) $460 $514 92.9%
Long Term Disability $626 $642 84.4%
Extended Health (including Drugs & Vision) $1 381 $1 449 82.5%
Dental $796 $826 82.6%
Health Spending Account $320 $505 100.0%
Total per capita Cost Active Employees $3 245 $3 391 76.1%
Retirees (All benefi ts combined) $1 966 $2 084 88.9%
ABSENCE MANAGEMENT
As a percentage of payroll, what do you think the total direct cost of your absenteeism (excluding 27. holidays) are for your organization?
1-2.9% 30.2%
3-4.9% 26.3%
5-6.9% 11.9%
7-8.9% 5.8%
>9% 4.7%
Not reported 21.6%
100%
45
2009 Aon Consulting’s Benefi t Trends Survey© Aon Consulting Inc. 2008 – All Rights Reserved
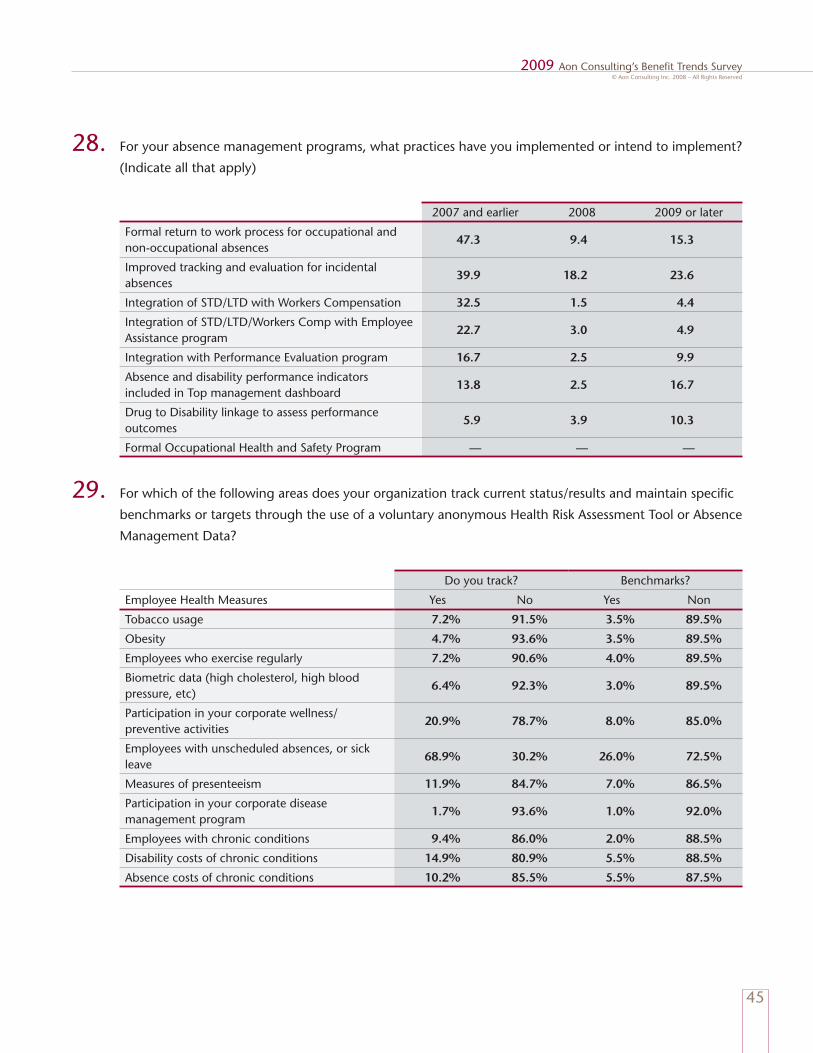
For your absence management programs, what practices have you implemented or intend to implement? 28. (Indicate all that apply)
2007 and earlier 2008 2009 or later
Formal return to work process for occupational and non-occupational absences
47.3 9.4 15.3
Improved tracking and evaluation for incidental absences
39.9 18.2 23.6
Integration of STD/LTD with Workers Compensation 32.5 1.5 4.4
Integration of STD/LTD/Workers Comp with Employee Assistance program
22.7 3.0 4.9
Integration with Performance Evaluation program 16.7 2.5 9.9
Absence and disability performance indicators included in Top management dashboard
13.8 2.5 16.7
Drug to Disability linkage to assess performance outcomes
5.9 3.9 10.3
Formal Occupational Health and Safety Program — — —
For which of the following areas does your organization track current status/results and maintain specifi c 29. benchmarks or targets through the use of a voluntary anonymous Health Risk Assessment Tool or Absence
Management Data?
Do you track? Benchmarks?
Employee Health Measures Yes No Yes Non
Tobacco usage 7.2% 91.5% 3.5% 89.5%
Obesity 4.7% 93.6% 3.5% 89.5%
Employees who exercise regularly 7.2% 90.6% 4.0% 89.5%
Biometric data (high cholesterol, high blood pressure, etc)
6.4% 92.3% 3.0% 89.5%
Participation in your corporate wellness/preventive activities
20.9% 78.7% 8.0% 85.0%
Employees with unscheduled absences, or sick leave
68.9% 30.2% 26.0% 72.5%
Measures of presenteeism 11.9% 84.7% 7.0% 86.5%
Participation in your corporate disease management program
1.7% 93.6% 1.0% 92.0%
Employees with chronic conditions 9.4% 86.0% 2.0% 88.5%
Disability costs of chronic conditions 14.9% 80.9% 5.5% 88.5%
Absence costs of chronic conditions 10.2% 85.5% 5.5% 87.5%

46
2009 Aon Consulting’s Benefi t Trends Survey© Aon Consulting Inc. 2008 – All Rights Reserved
Who manages your Non-occupational Short Term Disability Absences?30.
Internal department 54.0%
Carrier who provides STD program 21.6%
Carrier that provides your LTD program 7.9%
Independent disability management fi rm 4.7%
Not reported 11.9%
100%
How long do you extend Medical and Dental benefi ts to disabled employees in receipt of LTD payments?31.
Up to 2 years 26.3%
Up to 5 years 1.8%
To age 65 55.0%
No extension 4.7%
Not reported 11.9%
100%
RETIREMENT
What type of retirement plans does your organization currently offer? (Indicate all that apply) 32.
Defi ned benefi t plan 43.0%
Registered Defi ned contribution plan 36.3%
Group Registered Retirement Savings Plan 49.0%
Deferred Profi t Sharing Plan 10.0%
Profi t Sharing Plan 4.4%
Hybrid (DB and DC) 3.2%
Employee stock purchase plan 10.8%
Executive nonqualifi ed benefi t plans 15.9%
Tax Deferred Savings Account (not a retirement plan) 12.7%
None 9.6%

47
2009 Aon Consulting’s Benefi t Trends Survey© Aon Consulting Inc. 2008 – All Rights Reserved
If your organization offers a Group RRSP or DC plan, what percentage of eligible employees are enrolled 33. in the plan?
75-100% 46.8%
50-74% 13.5%
25-49% 8.6%
Less that 25% 8.6%
Do not sponsor a Group RRSP Plan 13.1%
Not reported 9.5%
100%
What reasons do you attribute to employees not participating? (Indicate all that apply) 34.
Not aware of plan 14.7%
Can’t afford it 61.2%
Don’t understand how to enroll 15.5%
Don’t know how to select investment options 28.4%
No company match 14.7%
What is the method of calculating your employer contribution?35.
Employer contribution for all employees 18.5%
Employer matching the contribution for employees who participate 37.4%
Combination of employer required and matching contribution 19.8%
No employer contribution 6.3%
Other 4.5%
Not reported 13.5%
100%
If you have a matching contribution, indicate at which level the employer matches the employee 36. contribution.
100% 48.2%
75% 2.7%
50% 11.7%
25% 2.3%
Less than 25% 4.5%
Not reported 30.6%
100%

48
2009 Aon Consulting’s Benefi t Trends Survey© Aon Consulting Inc. 2008 – All Rights Reserved
What is your maximum employer match?37.
<2% 7.2%
3% 16.2%
4% 7.2%
5% 20.7%
6% 8.6%
>6% 12.6%
Not reported 27.5%
100%
Are you planning on increasing, decreasing or keeping the same amount of employer cost related to your 38. DC retirement plans?
Increase the employer contribution level (DC Plans) 7.2%
Decrease the employer contribution level 1.8%
Keep the contributions the same but change other aspects of the plan 14.9%
N/A, we currently have no plans to change the benefi ts 56.3%
Not reported 19.8%
100%
In your opinion, to what extent do employees in your organization understand how to invest their 39. defi ned contribution or Group RRSP or DC plan assets?
Very great extent 1.4%
Great extent 10.4%
Some extent 50.5%
Little extent 12.6%
Very little extent 5.4%
Not reported 19.8%
100%
Do you offer investment advice to plan members?40.
Yes 33.8%
No 50.9%
Not reported 15.3%
100%

49
2009 Aon Consulting’s Benefi t Trends Survey© Aon Consulting Inc. 2008 – All Rights Reserved
How many investment options does your plan offer?41.
1-9 27.0%
10-14 18.9%
15-18 9.5%
19 or above 19.8%
Not reported 24.8%
100%
What is your default investment fund? 42.
Asset allocation fund 7.7%
A target date retirement fund 5.9%
A fi xed income fund 6.3%
A balanced fund 27.0%
Money Market fund 18.9%
Not reported 34.2%
100%
Do you offer Target Date Funds?43.
Yes 13.5%
No 59.9%
Not reported 26.6%
100%
Does your employer direct the investment of any contributions?44.
Yes 7.2%
No 71.6%
Not reported 21.2%
100%

50
2009 Aon Consulting’s Benefi t Trends Survey© Aon Consulting Inc. 2008 – All Rights Reserved
If45. you offer personalized web-based retirement planning tools, what percentage of your participants
would you estimate used them in the past year?
Between 75% and 100% 0.9%
Between 50% and 74% 5.0%
Between 25% and 49% 16.2%
Less than 25% 27.9%
We do not offer personalized web-based retirement planning tools 27.0%
Not reported 23.0%
100%
Rank the following factors that you consider important in the delivery of services to plan members.46.
Member decision-making tools 38.6%
Competitive fees 28.3%
Enhanced participant website and/or phone support 16.9%
Flexible approach to investment funds 10.2%
DEFINED BENEFIT PLANS
Would your organization consider offering a registered defi ned benefi t pension plan if:47.
The cost of the program was predictable each year 1.1%
Senior management’s benefi t would not be limited by the regulatory limits —
No, we would not consider it 2.5%
We already offer a defi ned benefi t pension plan 33.5%
Not reported 62.9%
100%
If you offer a defi ned benefi t plan, what type of plan do you offer? (Indicate all that apply) 48.
Traditional fi nal average pay plan 75.0%
Traditional career average pay plan 17.2%
Traditional fl at dollar plan 2.6%

51
2009 Aon Consulting’s Benefi t Trends Survey© Aon Consulting Inc. 2008 – All Rights Reserved
If you have made signifi cant changes to your defi ned benefi t plan design in the past two years, what 49. changes did you make? (Indicate all that apply)
Froze benefi ts 3.4%
No longer allow new entrants 13.8%
Decreased the level of benefi ts 2.6%
Changed from a fi nal average pay plan to a career average plan —
No signifi cant changes in the past two years 68.1%
If you are considering a signifi cant change to your defi ned benefi t plan in the next two years, what is the 50. primary reason?
Level of cost 8.6%
Volatility of cost 8.6%
Lack of employee appreciation 0.9%
Other reason 10.3%
Not reported 71.6%
100%
If you are planning to make signifi cant changes to your defi ned benefi t plan in the future, what changes 51. are you considering? (Indicate all that apply)
Freeze benefi ts 1.7%
No longer allow new entrants 6.0%
Provide the same type of plan, but decrease the level of benefi ts 6.0%
Change from a fi nal average pay plan to a career average plan 0.9%
No, we will not make any signifi cant changes 60.3%

52
2009 Aon Consulting’s Benefi t Trends Survey© Aon Consulting Inc. 2008 – All Rights Reserved
INVESTMENT, GOVERNANCE AND SERP
What changes are you considering for your defi ned benefi t plan’s investments? (Indicate all that apply) 52.
We are considering changes to address potential future volatility 8.3%
We have decided to change our equity concentration 4.9%
We have decided to change the duration of our bonds to more closely match our liabilities 6.3%
We have moved to an interest rate hedging strategy 1.0%
We have added new asset classes to increase diversifi cation 5.8%
We continue to monitor our assets and liabilities 18.0%
We are not considering any changes to our investment strategy 32.5%
N/A, we do not offer a defi ned benefi t plan 47.6%
What is your current bond investment benchmarked against? 53.
A broad market index such as DEX Universe (Duration of 6yrs) 14.0%
A longer duration benchmark such as DEX Long (Duration of 12 yrs) 4.7%
Benchmarked to our actual pension liabilities 6.5%
Other 22.7%
Not reported 52.2%
100%
Which of the following governance practices do you follow? 54.
Formally appointed committee that oversees the investments regularly 36.0%
Full independent review of fees and expenses 7.9%
Clear separation of the plan Fiduciary and plan Sponsor functions 14.0%
Not reported 42.1%
100%
Are you compliant with the CAP Guidelines in managing your DC or Group RRSP Plans?55.
Yes 43.2%
No 3.2%
Don’t know 41.4%
Not reported 12.6%
100%

53
2009 Aon Consulting’s Benefi t Trends Survey© Aon Consulting Inc. 2008 – All Rights Reserved
What is the nature of any supplemental arrangement (SERP)?56.
Defi ned Benefi t plan 20.5%
Defi ned contribution plan 5.4%
Other 2.2%
Not applicable 45.0%
Not reported 27.0%
100%
How do you provide security of SERP benefi ts for members?57.
No security 15.5%
Full pre-funding 6.5%
Partial funding 3.6%
Letter of intent 3.6%
Other 12.2%
Not reported 58.6%
100%


55
2009 Aon Consulting’s Benefi t Trends Survey© Aon Consulting Inc. 2008 – All Rights Reserved
Shaping the Workplace of the FutureLarge or small, global or local, every organization must build, lead and inspire its employees to achieve objectives that create value. Aon’s full spectrum of human capital services provides you with a range of comprehensive – and fully customizable – human resource solutions to meet all of your people’s needs.
Health and Benefi ts We partner with you to develop and implement a sustainable, comprehensive, forward-looking program that aligns with your total compensation and human resources strategy. Let us help you reduce the costs of employee absenteeism and disability, maximize tax effectiveness, and maintain full compliance with regulatory and legislative requirements – while minimizing the administrative and fi nancial burdens of managing your plan.
Workers’ Compensation
Canada’s diverse provincial regulations make managing workers’ compensation programs a complex task. We will help you manage the high costs associated with occupational disability benefi ts by supporting you to implement strategies that manage risk, minimize administrative costs and enhance your health and safety profi le.
Retirement Retirement plans are key to attracting, retaining and motivating talent. We can support you in developing programs that meet your organizational objectives, are valued by employees, are cost and tax effective, are properly funded and meet all regulatory requirements and fi duciary obligations.
Investment Consulting
Every Aon investment consultant has access to our continually updated network of proprietary global investment research, a pool of knowledge that few fi rms can match. We leverage this knowledge to help you strategically align your investment goals with your asset allocation, implement a comprehensive investment strategy by identifying superior asset managers, ensure compliance, and educate your employees on investment topics.
Human Capital
Benchmarking and Survey Services
Aon creates, implements and delivers compensation surveys in a variety of industry sectors that provide the information organizations need to strike a balance between competitive employee compensation and cost management.
Our surveys serve as invaluable benchmarks whenever you seek to:
establish the current market competitiveness of your compensation program•
develop pay structures and levels•
analyze pay trends and establish pay practices•
examine pay issues to diagnose problems and identify solutions•

56
2009 Aon Consulting’s Benefi t Trends Survey© Aon Consulting Inc. 2008 – All Rights Reserved
Communication
Strategic communication is increasingly recognized as a critical factor in helping employees to comprehend and work towards business objectives. Aon is an acknowledged and award-winning industry leader in creating strategic communication solutions to meet your human resource and organizational needs.
Compensation
Aon will assist you in developing total compensation programs that reward employees for helping your organization to excel. We are experts in helping you fi nd and maintain the delicate balance between tangible rewards and intangible recognition.
Financial Planning
Aon offers independent fi nancial planning services with the goal of preparing employees/plan members to make informed decisions about their retirement. As we do not sell fi nancial products, our clients can be assured of receiving independent and unbiased consulting information. Our popular small group sessions are facilitated by Aon’s fi nancial planning experts and cover a range of retirement issues from fi nancial strategies to lifestyle coaching.
Recruitment Strategies
For over 25 years Aon recruiters have been consistently improving candidate quality and reducing early turnover while lowering our clients’ costs. Our approach to managing the key components of the hiring process ensures that you will realize signifi cant cost savings and improve quality while alleviating the administrative burden on your team. Available individually or in bundled packages, Aon offers:
Full life-cycle recruitment•
Innovative candidate sourcing•
Proprietary selection and assessment tools•
OutsourcingToday’s business reality requires organizations to become ever more effi cient and responsive in managing employee benefi t programs. We offer bundled consulting, technology and outsourcing expertise that will help you enhance benefi t plan management processes and improve returns from your investments. We offer a full array of advanced integrated absence management, benefi ts and pension administration services that enable you to focus on your organization’s strategic initiatives while reducing costs and improving service levels.
About Aon ConsultingAon Consulting is among Canada’s leading integrated human capital consulting and outsourcing fi rms. More than 800 professionals located in 12 offi ces are shaping the workplace of the future through benefi ts, talent management and rewards strategies and solutions.
For more information about the services we offer, please call 1.877.292.2714 or visit us at www.aon.com

Want to know more?Ask your Aon consultant
1.877.292.2714 www.aon.com

© Aon Consulting Inc. 2009 – All Rights Reserved.