Embed Size (px)
Citation preview
Compensation Programs and Practices Survey
A Report by WorldatWork,
Underwritten by Aon Hewitt
August 2016
About WorldatWork® – The Total Rewards Association
WorldatWork (www.worldatwork.org) is a nonprofit human resources association for
professionals and organizations focused on compensation, benefits, work-life effec-
tiveness and total rewards – strategies to attract, motivate and retain an engaged and
productive workforce. WorldatWork and its affiliates provide comprehensive education,
certification, research, advocacy and community, enhancing careers of professionals
and, ultimately, achieving better results for the organizations they serve. WorldatWork
has more than 65,000 members and subscribers worldwide; 80 percent of Fortune 500
companies employ a WorldatWork member. Founded in 1955, WorldatWork is affiliated
with more than 70 local human resources associations and has offices in Scottsdale,
Ariz., and Washington, D.C.
WorldatWork Society of Certified Professionals® is the certifying body for six presti-
gious designations: the Certified Compensation Professional® (CCP®), Certified Benefits
Professional® (CBP), Global Remuneration Professional (GRP®), Work-Life Certified
Professional® (WLCP®), Certified Sales Compensation Professional (CSCP)™ and
Certified Executive Compensation Professional (CECP)™.
The WorldatWork group of registered marks also includes: workspan and WorldatWork
Journal.
Contact:
WorldatWork Customer Relations
14040 N. Northsight Blvd.
Scottsdale, Arizona USA
85260-3601
Toll free: 877-951-9191
Fax 480-483-8352
©2016 WorldatWork Any laws, regulations or other legal requirements noted in this publication are, to the best of the publisher’s knowledge, accurate and current
as of this report’s publishing date. WorldatWork is providing this information with the understanding that WorldatWork is not engaged, directly or by implication, in
rendering legal, accounting or other related professional services. You are urged to consult with an attorney, accountant or other qualified professional concerning
your own specific situation and any questions that you may have related to that.
No portion of this publication may be reproduced in any form without express written permission from WorldatWork.
About Aon Hewitt
Aon Hewitt empowers organizations and individuals to secure a better future through
innovative talent, retirement and health solutions. We advise, design and execute a
wide range of solutions that enable clients to cultivate talent to drive organizational
and personal performance and growth, navigate retirement risk while providing new
levels of financial security, and redefine health solutions for greater choice,
affordability and wellness. Aon Hewitt is the global leader in human resource
solutions, with over 35,000 professionals in 90 countries serving more than 20,000
clients worldwide across 100+ solutions.
For more information on Aon Hewitt, please visit aonhewitt.com
Compensation Programs and Practices WorldatWork 1
Introduction & Methodology
This report summarizes the results of a May 2016 survey of WorldatWork members to gather
information about trends in compensation programs and practices. This survey focuses on the
prevalence of base and variable pay programs as well as common practices used to administer and
communicate these programs in today’s workplace.
On May 18, 2016, survey invitations were sent electronically to 5,404 WorldatWork members.
Participants were randomly selected U.S. and international WorldatWork members who have
designated compensation and benefits in their titles.
The survey closed on June 3, 2016 with 660 responses, a 12% response rate. The dataset was
cleaned and analyzed using statistical software. Any duplicate records were removed, resulting in a
final dataset of 600 responses. Data comparisons with any relevant, statistically significant differences
are noted in this report.
The demographics of the survey sample and the respondents are similar to the WorldatWork
membership as a whole. The typical WorldatWork member works at the managerial level or higher in
the headquarters of a large company in North America.
The frequencies or response distributions listed in the report show the number of times or percentage
of times a value appears in a dataset. Due to rounding, frequencies of data responses provided in this
survey may not total 100%.
WorldatWork conducted similar compensation practices surveys in 2014, 2012, 2010 and 2003. These
reports can be viewed on the WorldatWork website. Where possible, historical comparisons from data
gathered in the previous survey are shown.
Compensation Programs and Practices WorldatWork 2
Table of Figures
Demographics
Figure 1: Sector .............................................................................................................................................. 4
Figure 2: Organization size ............................................................................................................................ 4
Figure 3: Industry ........................................................................................................................................... 5
Figure 4: Voluntary turnover ........................................................................................................................... 5
Figure 5: Region ............................................................................................................................................. 5
Compensation Philosophy
Figure 6: Compensation philosophy .............................................................................................................. 10
Figure 7: Employee understanding of the compensation philosophy ............................................................ 10
Figure 8: Labor market comparison ............................................................................................................... 10
Figure 9: Relative value of jobs ..................................................................................................................... 10
Figure 10: Variable pay prevalence ................................................................................................................ 11
Figure 11: Types of variable pay plans .......................................................................................................... 11
Figure 12: Variable pay labor market comparison .......................................................................................... 12
Individual Base Salary Determination
Figure 13: Base salary increase determinations ........................................................................................... 12
Figure 14: Employee performance rating systems ....................................................................................... 12
Figure 14a: Employee performance ranking ................................................................................................. 13
Figure 14b: Salary increases tied to employee performance ........................................................................ 13
Figure 15: Typical variation in salary increases ............................................................................................. 13
Figure 16: Method for determining increases ................................................................................................ 14
Figure 17: Number of performance ratings levels/categories ......................................................................... 14
Figure 18: Employee distribution across performance categories .................................................................. 14
Figure 19: FLSA requirements exemptions .................................................................................................... 15
Figure 20: Portion of U.S. positions/jobs that maintain FLSA exemption status ............................................ 15
Base Salary Structure Design
Figure 21: Assessment of the market value of jobs ........................................................................................ 15
Figure 22: Formal salary structures ................................................................................................................ 16
Figure 23: Adjustment of base salary structures for employees ..................................................................... 16
Figure 23a: Multiple salary structures............................................................................................................. 17
Figure 24: Number of separate structures ..................................................................................................... 17
Figure 25: Definition/identification of separate structures ............................................................................... 18
Figure 26: Salary grades and/or broadbands ................................................................................................. 18
Figure 26a: Typical range spreads for hourly positions .................................................................................. 19
Figure 26b: Typical range spreads for salaried positions ............................................................................... 19
Compensation Programs and Practices WorldatWork 3
Figure 26c: Typical range spreads for executive positions ............................................................................. 20
Figure 27: General midpoint progression ...................................................................................................... 20
Figure 28: Types of salary increases and/or adjustments awarded................................................................ 20
Pay Program Communications
Figure 29: Individual salary information shared with employees .................................................................... 21
Figure 30: Employee communication approaches (past 12 months) .............................................................. 21
Figure 31: Frequency of employee communications about individual pay ..................................................... 22
Figure 32: Approach to communicating individual pay increases .................................................................. 22
Evaluation of Salary Policies and Practices
Figure 33: Salary program effectiveness ........................................................................................................ 22
Compensation Data Administration and Analysis
Figure 34: Compensation-related employee data system(s) .......................................................................... 23
Figure 35: How system was acquired............................................................................................................. 23
Figure 36: Methods to analyze compensation-related data ............................................................................ 24
Figure 37: Types of analyses performed ........................................................................................................ 24
Global Practices
Figure 38: Compensation philosophy and variations by global regions .......................................................... 25
Figure 39: Administration of variable pay programs by global regions ........................................................... 25
Figure 40: Types of variable pay programs by global regions ........................................................................ 26
Figure 41: Performance management program consistency ......................................................................... 26
Compensation Programs and Practices WorldatWork 4
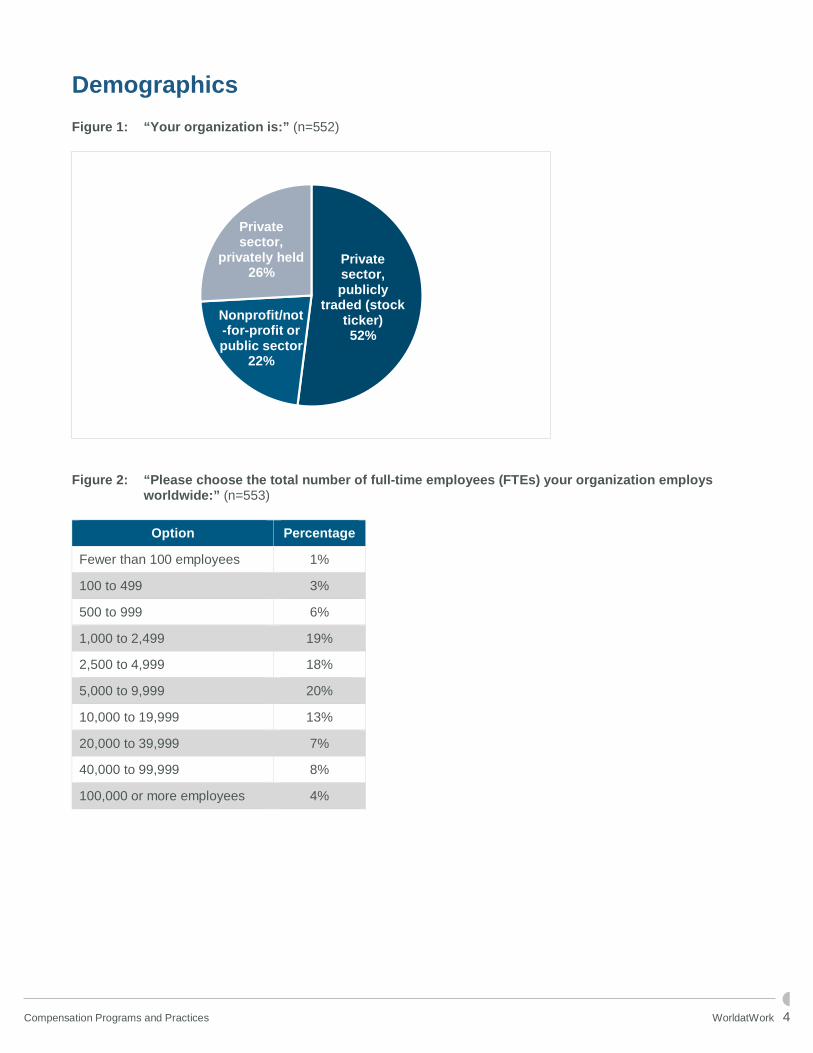
Demographics
Figure 1: “Your organization is:” (n=552)
Figure 2: “Please choose the total number of full-time employees (FTEs) your organization employs
worldwide:” (n=553)
Option Percentage
Fewer than 100 employees 1%
100 to 499 3%
500 to 999 6%
1,000 to 2,499 19%
2,500 to 4,999 18%
5,000 to 9,999 20%
10,000 to 19,999 13%
20,000 to 39,999 7%
40,000 to 99,999 8%
100,000 or more employees 4%
Private sector, publicly
traded (stock ticker)52%
Nonprofit/not-for-profit or public sector
22%
Private sector,
privately held26%
Compensation Programs and Practices WorldatWork 5
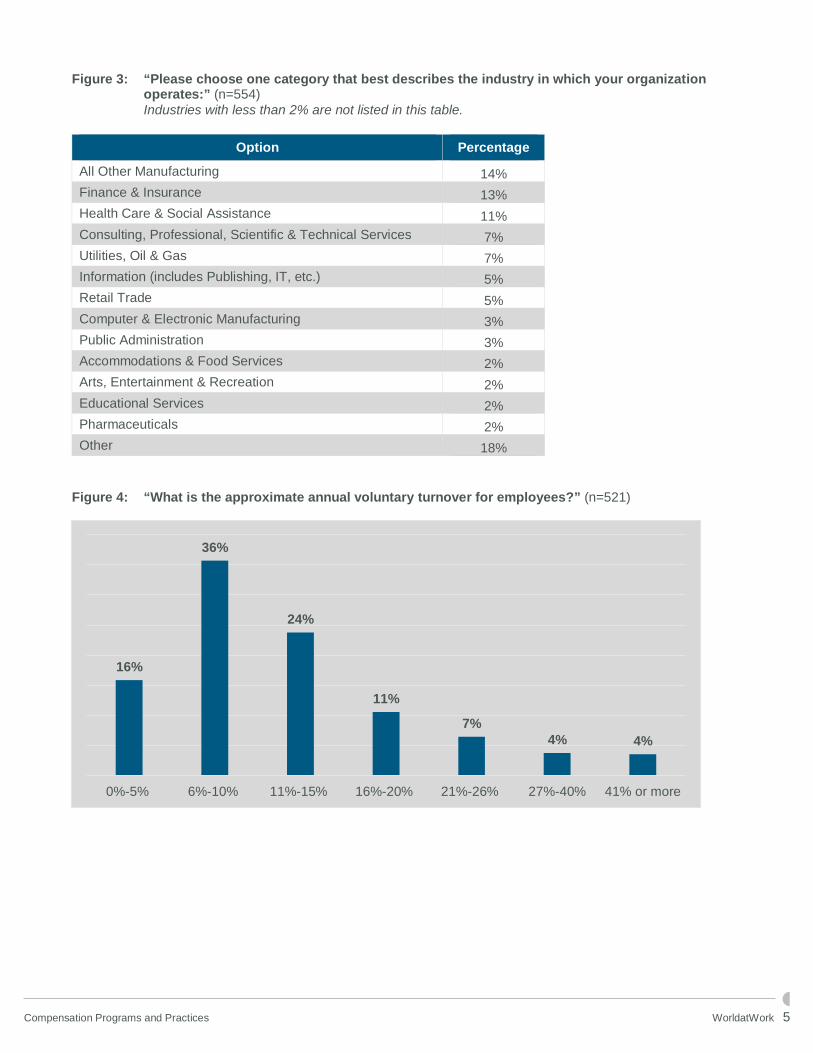
Figure 3: “Please choose one category that best describes the industry in which your organization operates:” (n=554)
Industries with less than 2% are not listed in this table.
Option Percentage
All Other Manufacturing 14%
Finance & Insurance 13%
Health Care & Social Assistance 11%
Consulting, Professional, Scientific & Technical Services 7%
Utilities, Oil & Gas 7%
Information (includes Publishing, IT, etc.) 5%
Retail Trade 5%
Computer & Electronic Manufacturing 3%
Public Administration 3%
Accommodations & Food Services 2%
Arts, Entertainment & Recreation 2%
Educational Services 2%
Pharmaceuticals 2%
Other 18%
Figure 4: “What is the approximate annual voluntary turnover for employees?” (n=521)
16%
36%
24%
11%
7%
4% 4%
0%-5% 6%-10% 11%-15% 16%-20% 21%-26% 27%-40% 41% or more
Compensation Programs and Practices WorldatWork 6
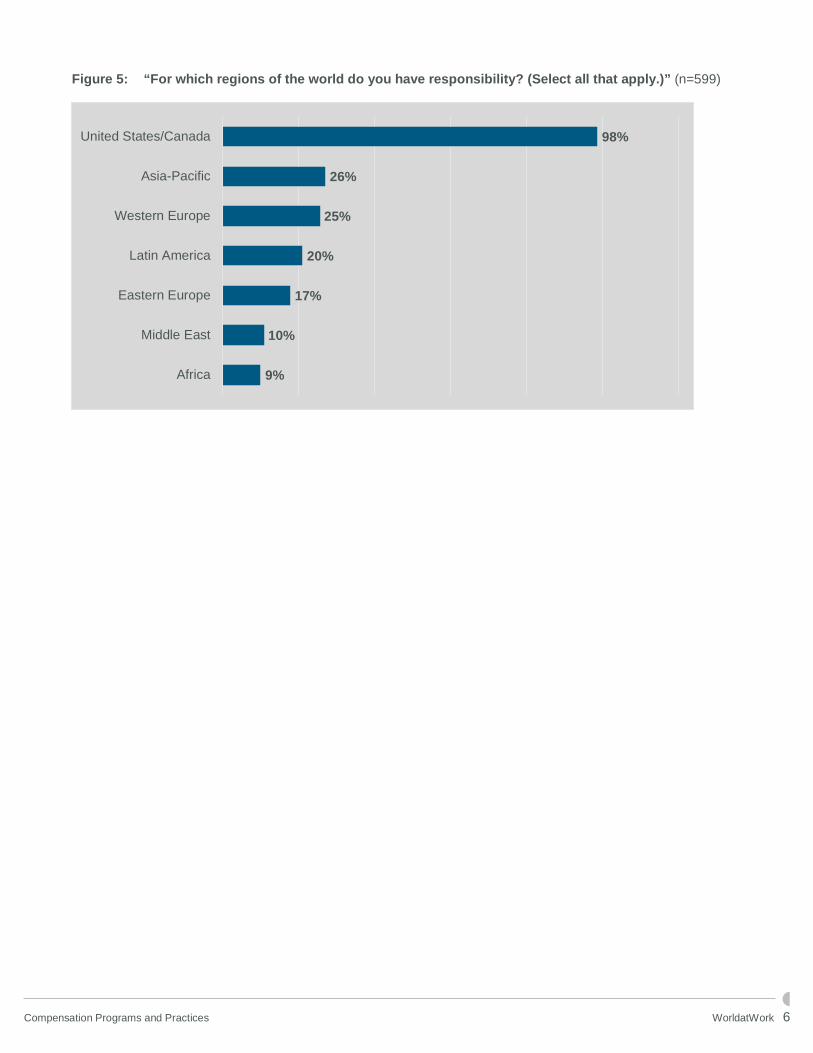
Figure 5: “For which regions of the world do you have responsibility? (Select all that apply.)” (n=599)
9%
10%
17%
20%
25%
26%
98%
Africa
Middle East
Eastern Europe
Latin America
Western Europe
Asia-Pacific
United States/Canada
Compensation Programs and Practices WorldatWork 7
Executive Summary
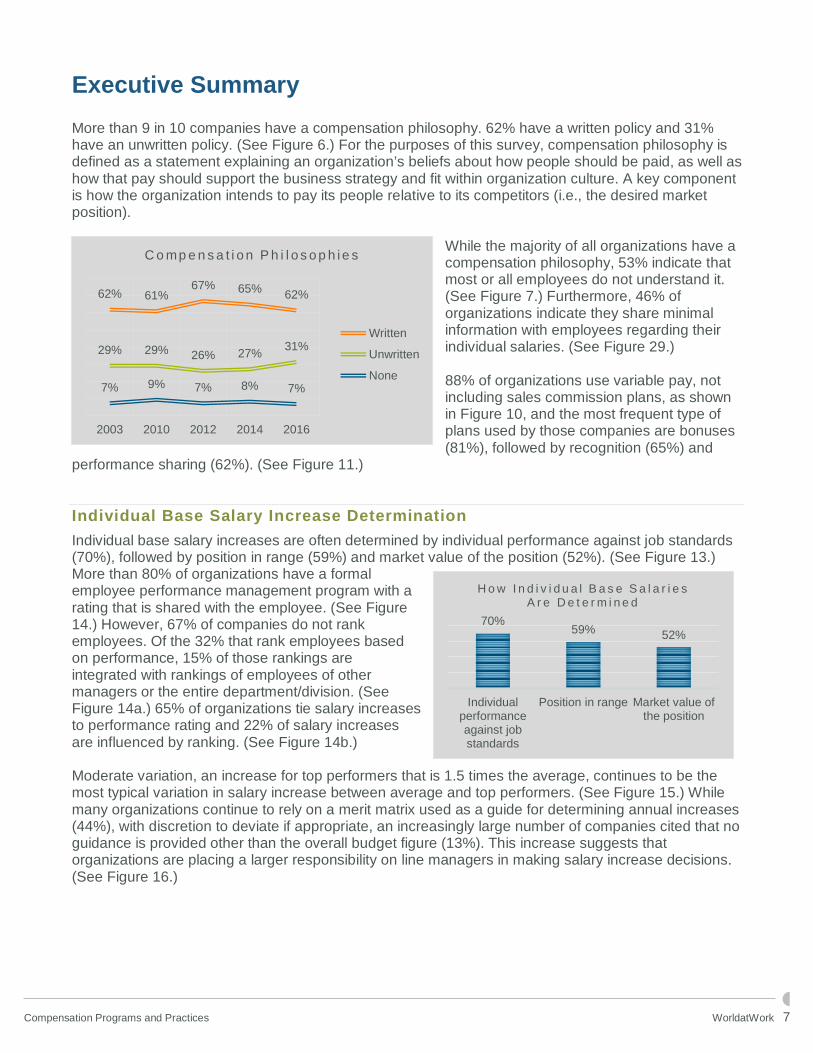
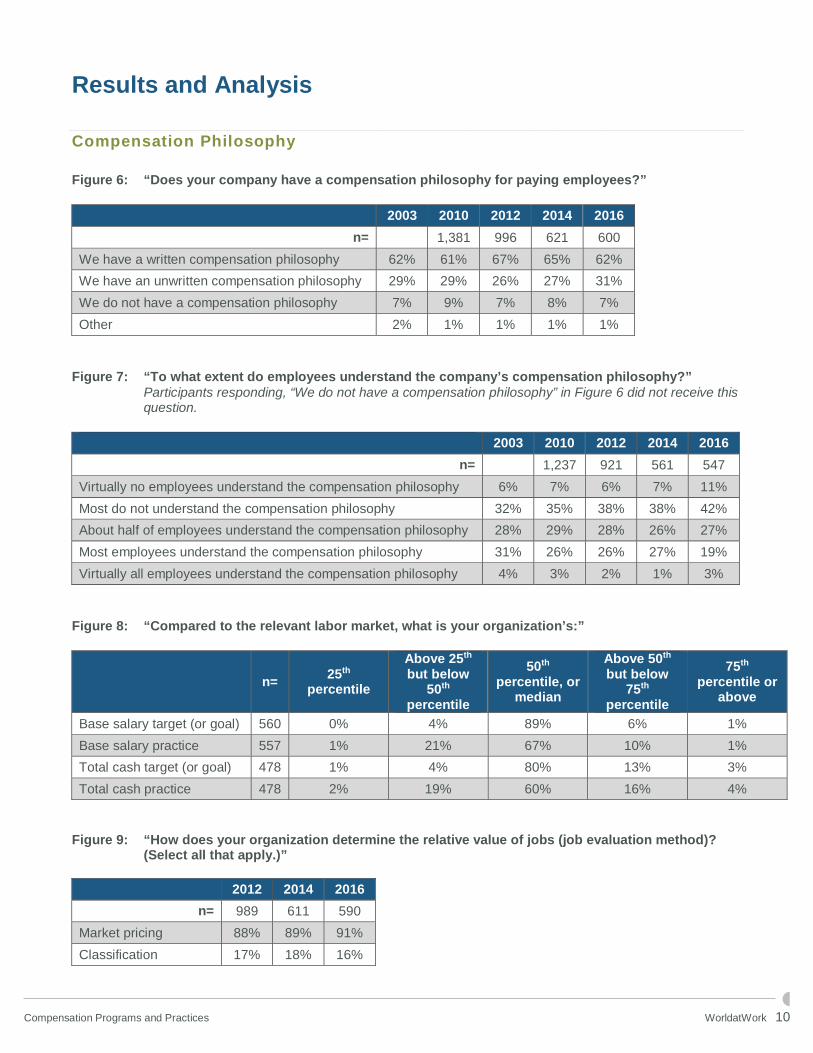
More than 9 in 10 companies have a compensation philosophy. 62% have a written policy and 31% have an unwritten policy. (See Figure 6.) For the purposes of this survey, compensation philosophy is defined as a statement explaining an organization’s beliefs about how people should be paid, as well as how that pay should support the business strategy and fit within organization culture. A key component is how the organization intends to pay its people relative to its competitors (i.e., the desired market position).
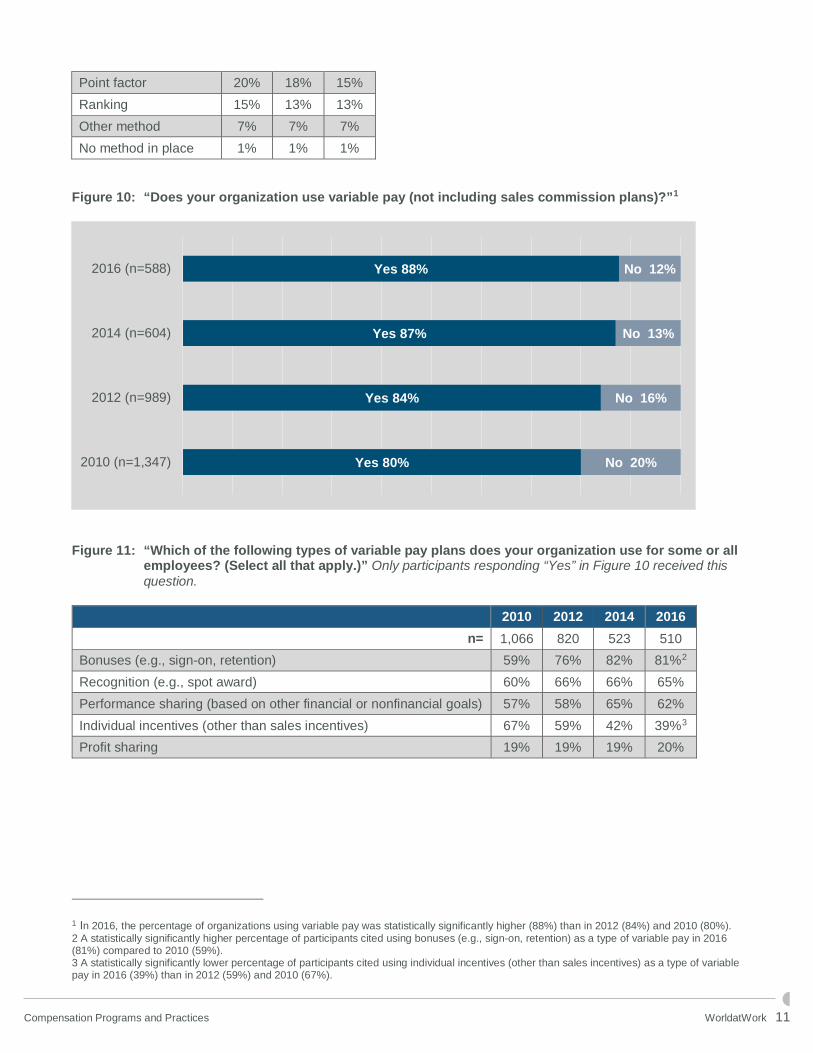
While the majority of all organizations have a compensation philosophy, 53% indicate that most or all employees do not understand it. (See Figure 7.) Furthermore, 46% of organizations indicate they share minimal information with employees regarding their individual salaries. (See Figure 29.) 88% of organizations use variable pay, not including sales commission plans, as shown in Figure 10, and the most frequent type of plans used by those companies are bonuses (81%), followed by recognition (65%) and
performance sharing (62%). (See Figure 11.)
Individual Base Salary Increase Determination
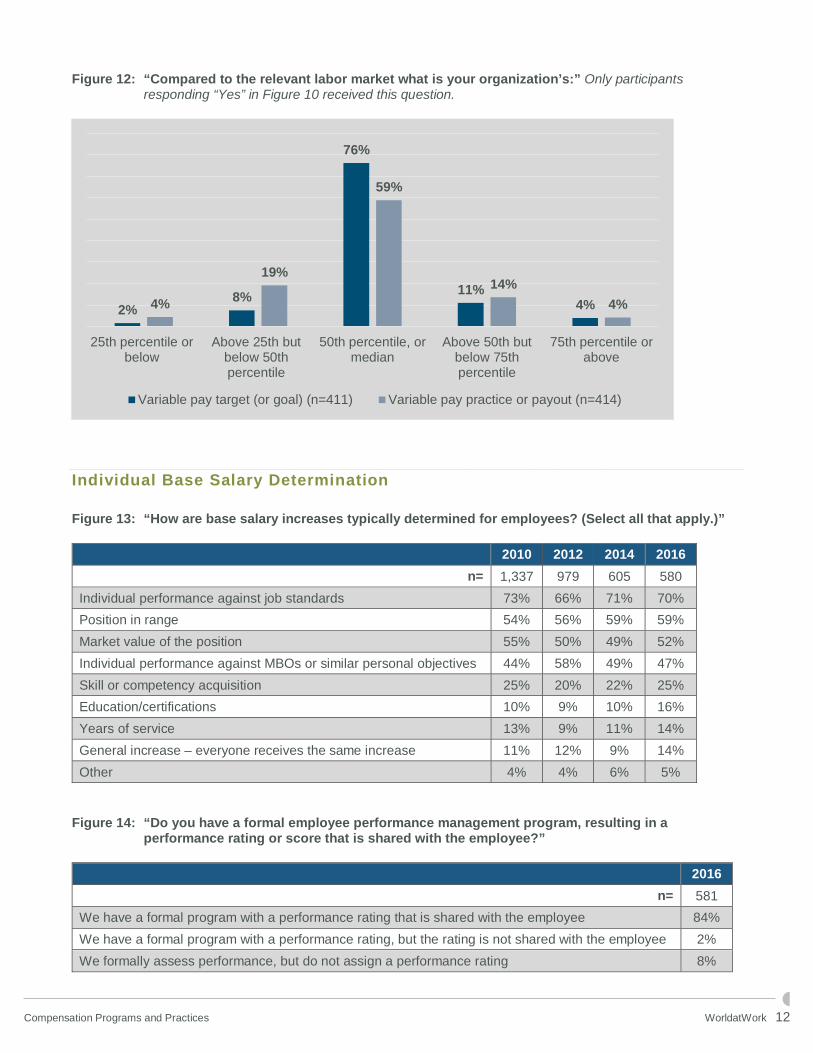
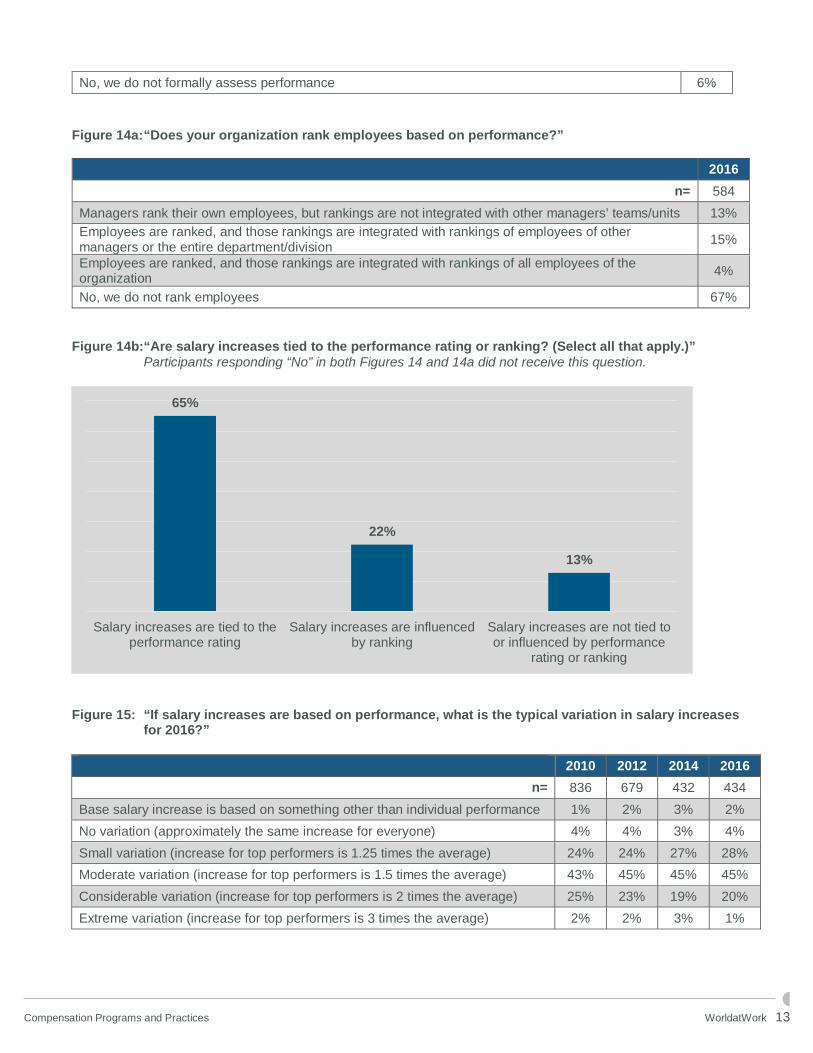
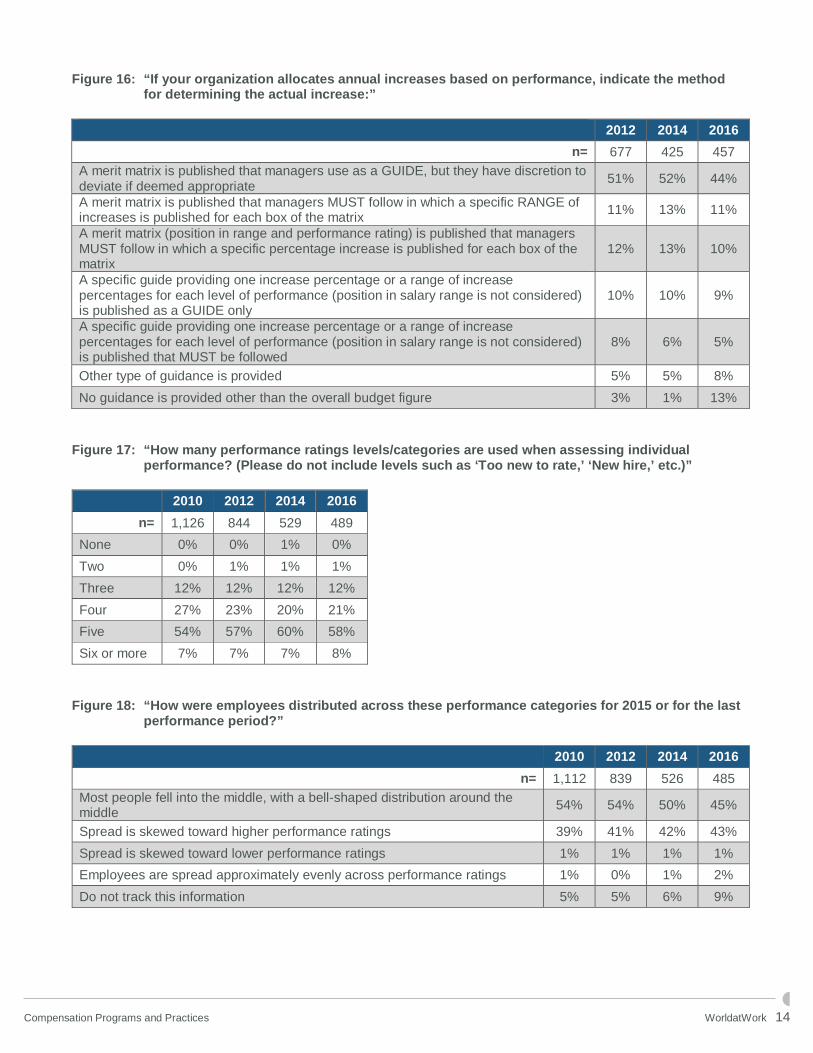
Individual base salary increases are often determined by individual performance against job standards (70%), followed by position in range (59%) and market value of the position (52%). (See Figure 13.) More than 80% of organizations have a formal employee performance management program with a rating that is shared with the employee. (See Figure 14.) However, 67% of companies do not rank employees. Of the 32% that rank employees based on performance, 15% of those rankings are integrated with rankings of employees of other managers or the entire department/division. (See Figure 14a.) 65% of organizations tie salary increases to performance rating and 22% of salary increases are influenced by ranking. (See Figure 14b.) Moderate variation, an increase for top performers that is 1.5 times the average, continues to be the most typical variation in salary increase between average and top performers. (See Figure 15.) While many organizations continue to rely on a merit matrix used as a guide for determining annual increases (44%), with discretion to deviate if appropriate, an increasingly large number of companies cited that no guidance is provided other than the overall budget figure (13%). This increase suggests that organizations are placing a larger responsibility on line managers in making salary increase decisions. (See Figure 16.)
70%59% 52%
Individualperformanceagainst jobstandards
Position in range Market value ofthe position
H o w I n d i v i d u a l B a s e S a l a r i e s A r e D e t e r m i n e d
62% 61%67% 65%
62%
29% 29% 26% 27%31%
7% 9% 7% 8% 7%
2003 2010 2012 2014 2016
C o mp e n s a t i o n P h i l o s o p h ie s
Written
Unwritten
None
Compensation Programs and Practices WorldatWork 8
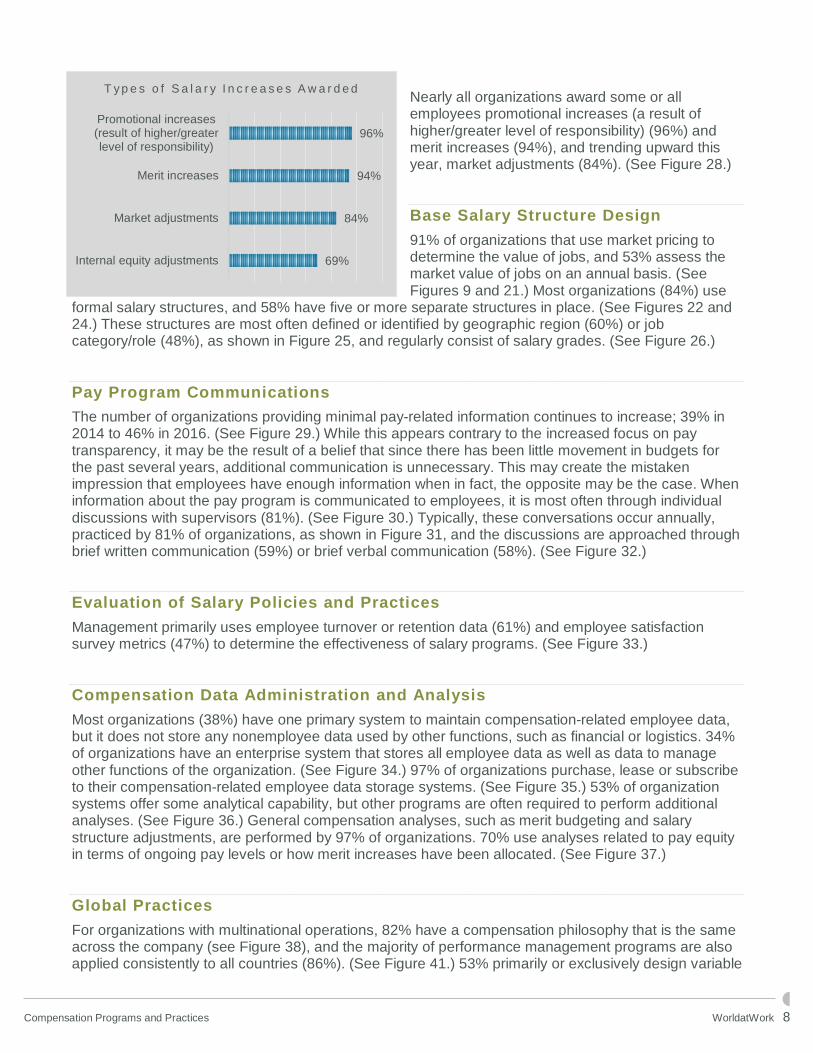
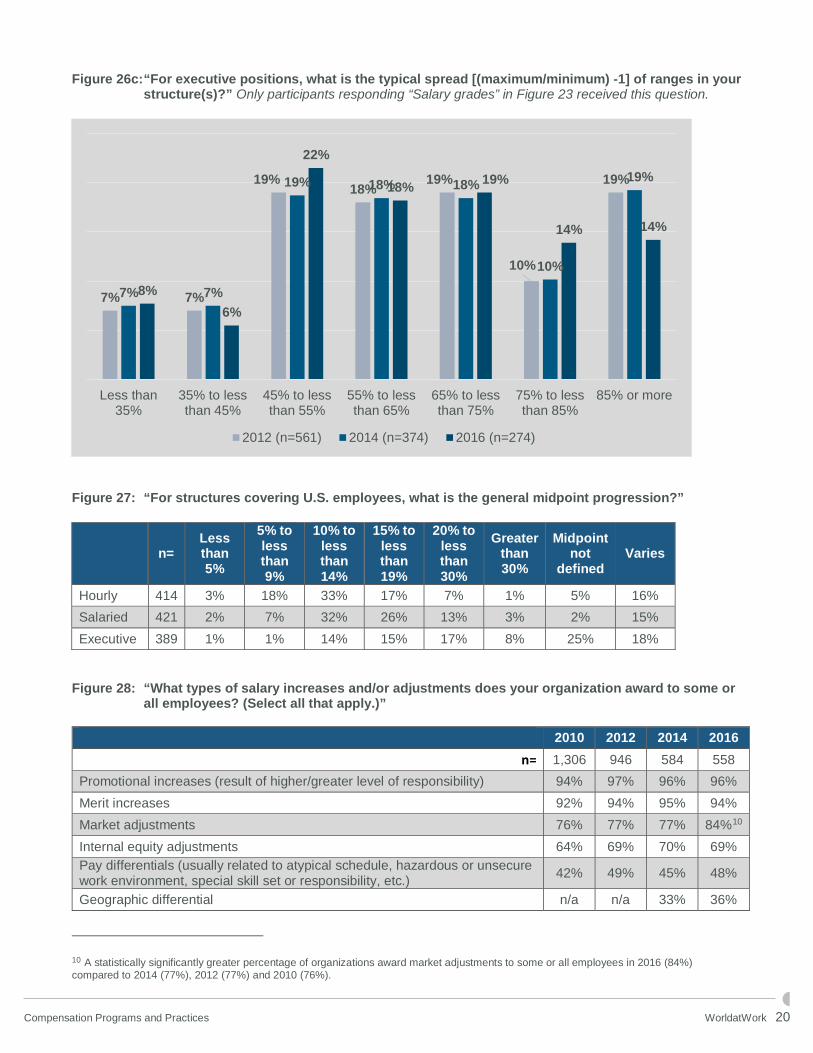
Nearly all organizations award some or all employees promotional increases (a result of higher/greater level of responsibility) (96%) and merit increases (94%), and trending upward this year, market adjustments (84%). (See Figure 28.)
Base Salary Structure Design
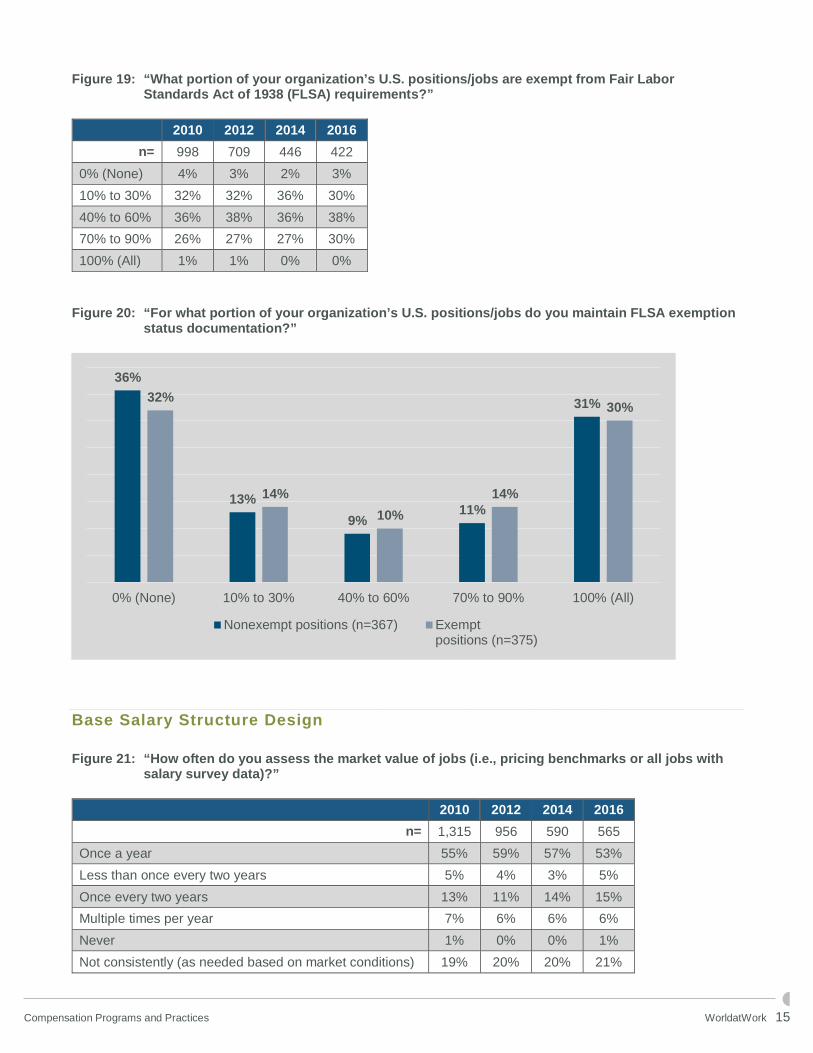
91% of organizations that use market pricing to determine the value of jobs, and 53% assess the market value of jobs on an annual basis. (See Figures 9 and 21.) Most organizations (84%) use
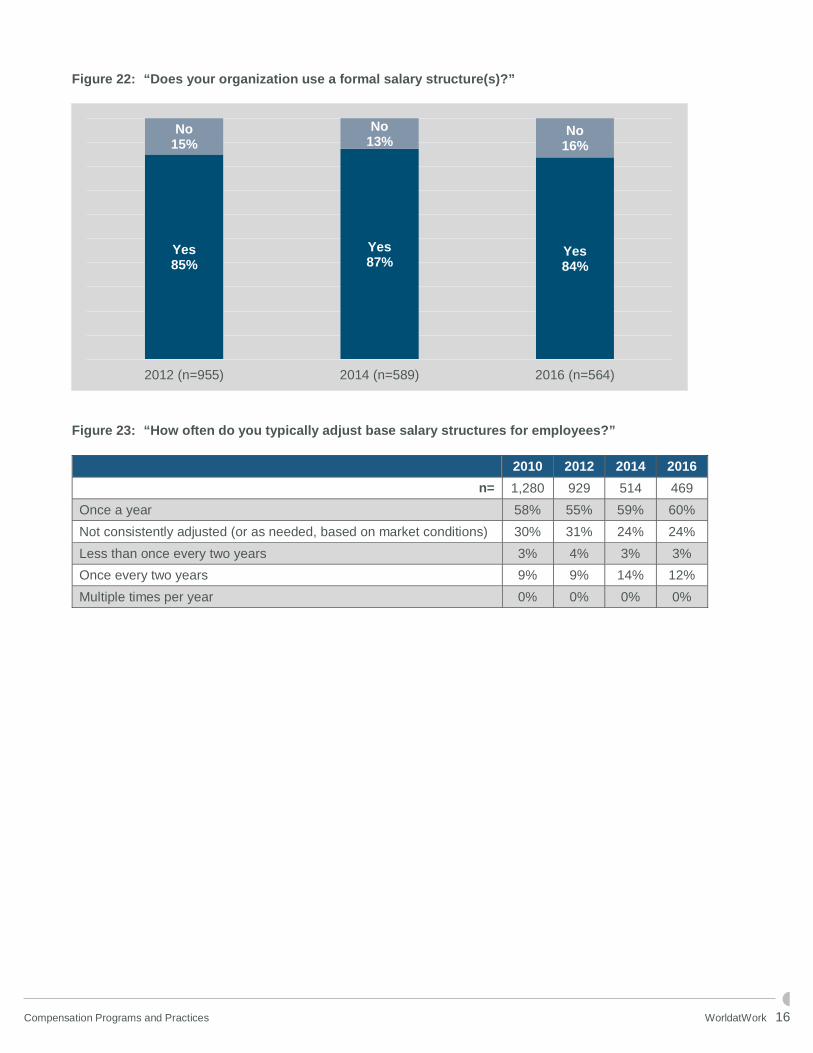
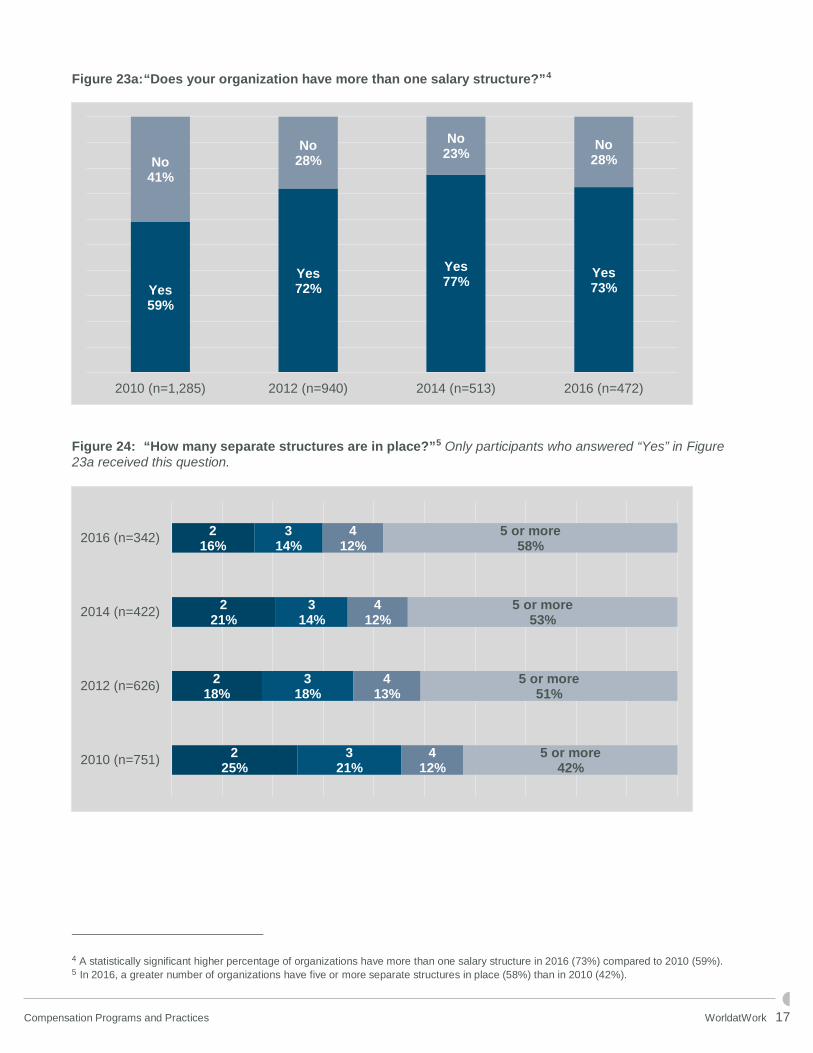
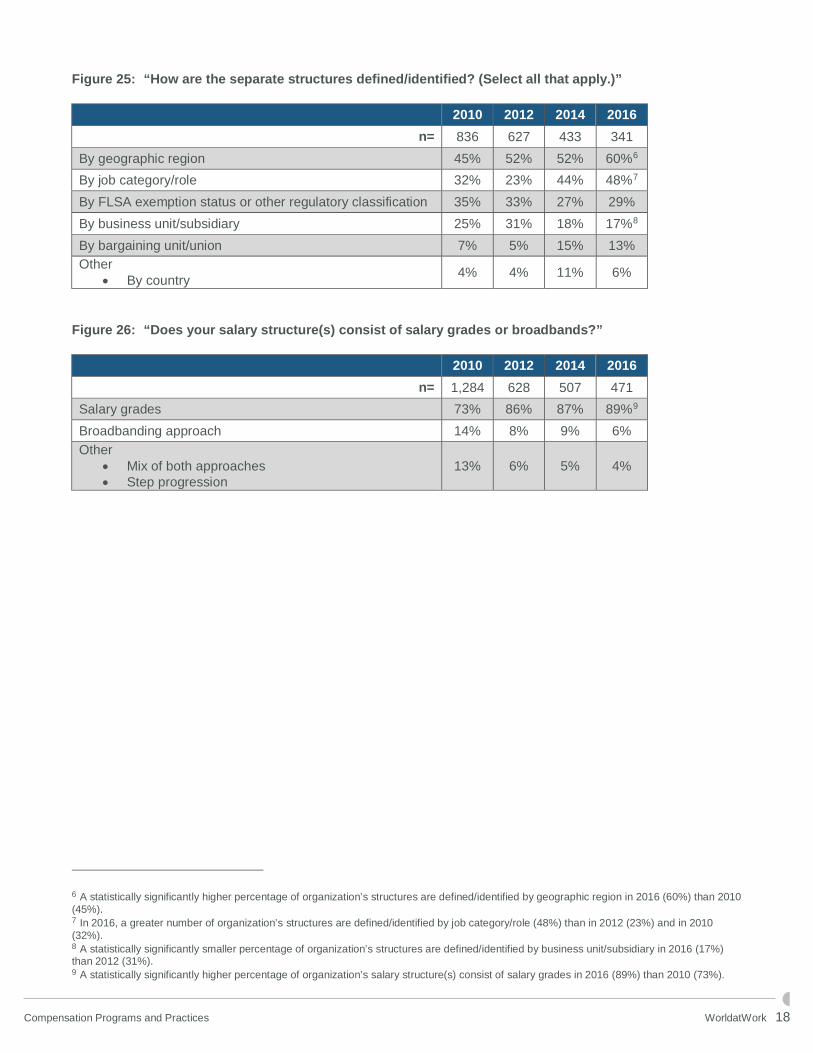
formal salary structures, and 58% have five or more separate structures in place. (See Figures 22 and 24.) These structures are most often defined or identified by geographic region (60%) or job category/role (48%), as shown in Figure 25, and regularly consist of salary grades. (See Figure 26.)
Pay Program Communications
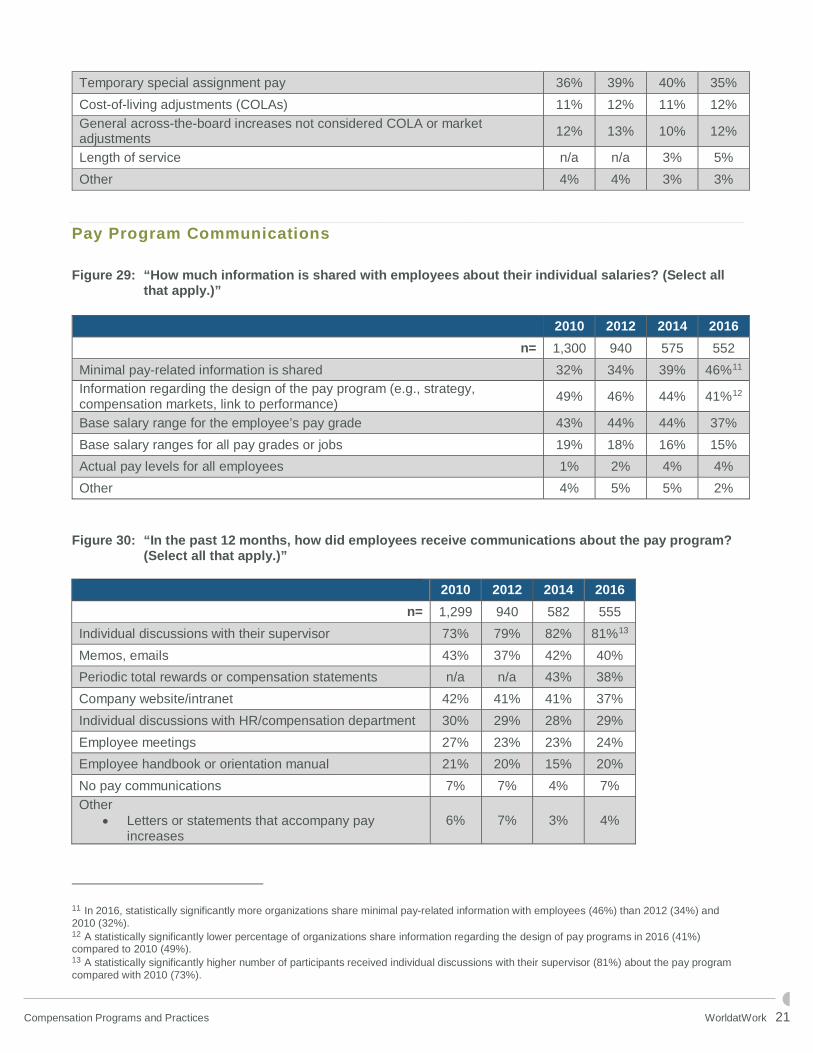
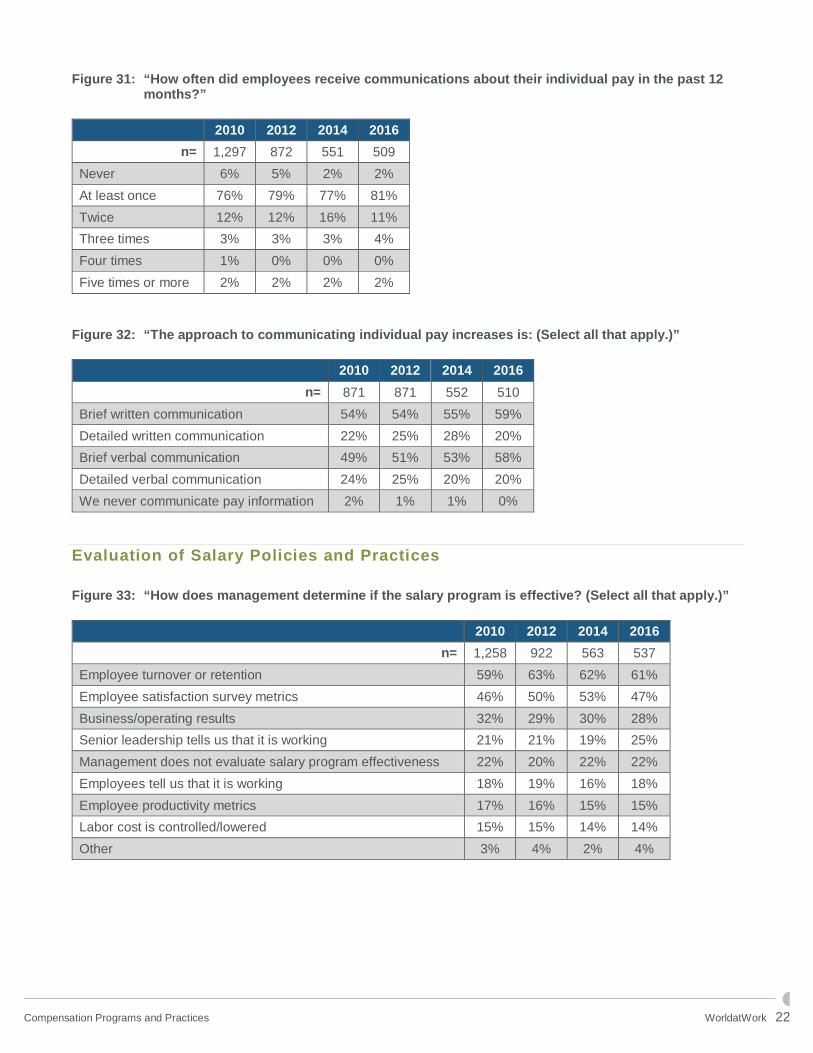
The number of organizations providing minimal pay-related information continues to increase; 39% in 2014 to 46% in 2016. (See Figure 29.) While this appears contrary to the increased focus on pay transparency, it may be the result of a belief that since there has been little movement in budgets for the past several years, additional communication is unnecessary. This may create the mistaken impression that employees have enough information when in fact, the opposite may be the case. When information about the pay program is communicated to employees, it is most often through individual discussions with supervisors (81%). (See Figure 30.) Typically, these conversations occur annually, practiced by 81% of organizations, as shown in Figure 31, and the discussions are approached through brief written communication (59%) or brief verbal communication (58%). (See Figure 32.)
Evaluation of Salary Policies and Practices
Management primarily uses employee turnover or retention data (61%) and employee satisfaction survey metrics (47%) to determine the effectiveness of salary programs. (See Figure 33.)
Compensation Data Administration and Analysis
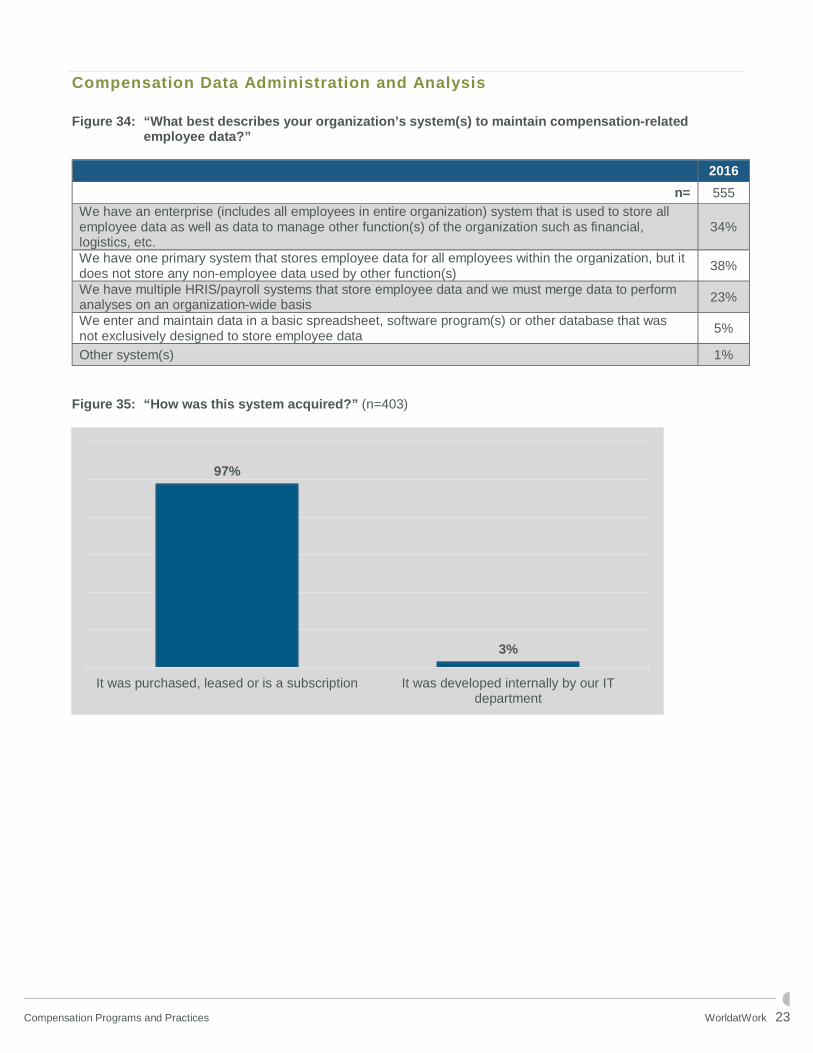
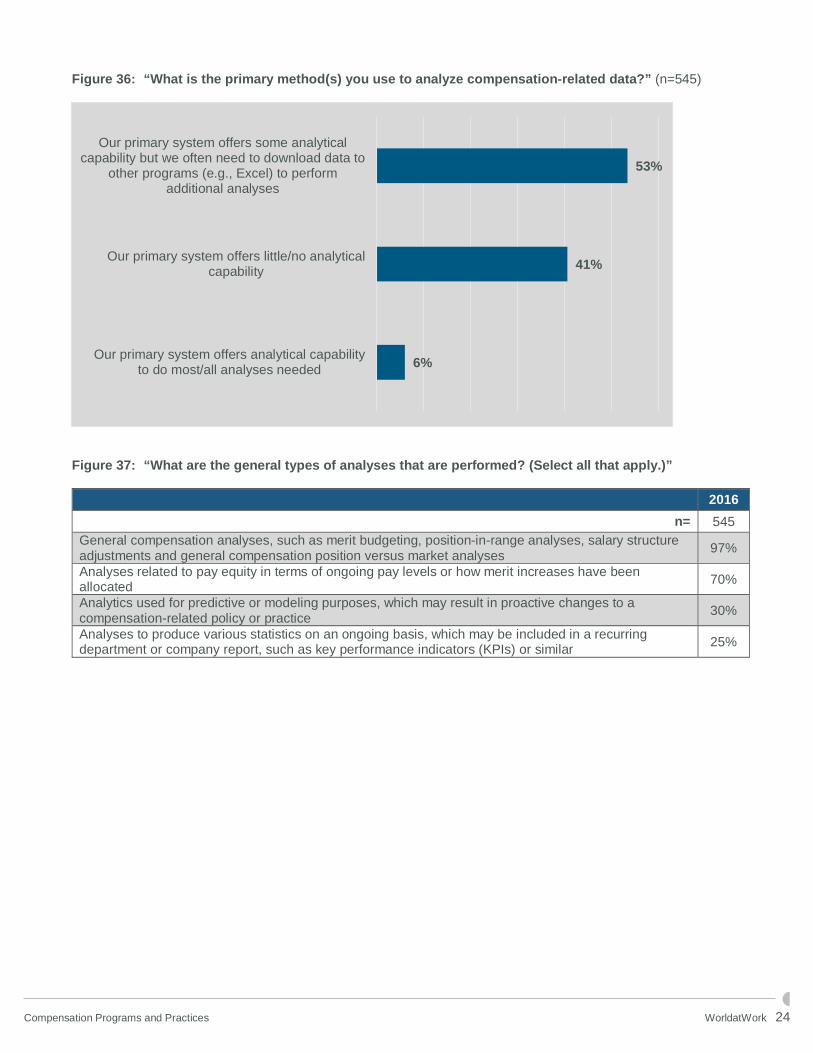
Most organizations (38%) have one primary system to maintain compensation-related employee data, but it does not store any nonemployee data used by other functions, such as financial or logistics. 34% of organizations have an enterprise system that stores all employee data as well as data to manage other functions of the organization. (See Figure 34.) 97% of organizations purchase, lease or subscribe to their compensation-related employee data storage systems. (See Figure 35.) 53% of organization systems offer some analytical capability, but other programs are often required to perform additional analyses. (See Figure 36.) General compensation analyses, such as merit budgeting and salary structure adjustments, are performed by 97% of organizations. 70% use analyses related to pay equity in terms of ongoing pay levels or how merit increases have been allocated. (See Figure 37.)
Global Practices
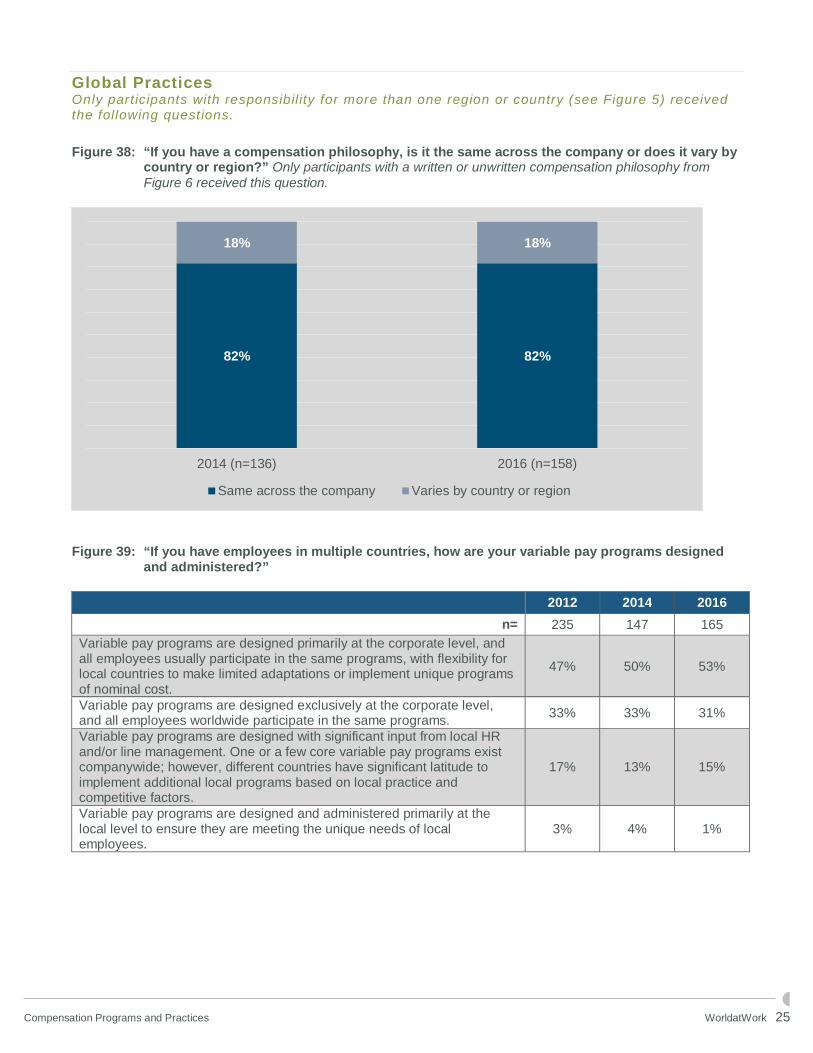
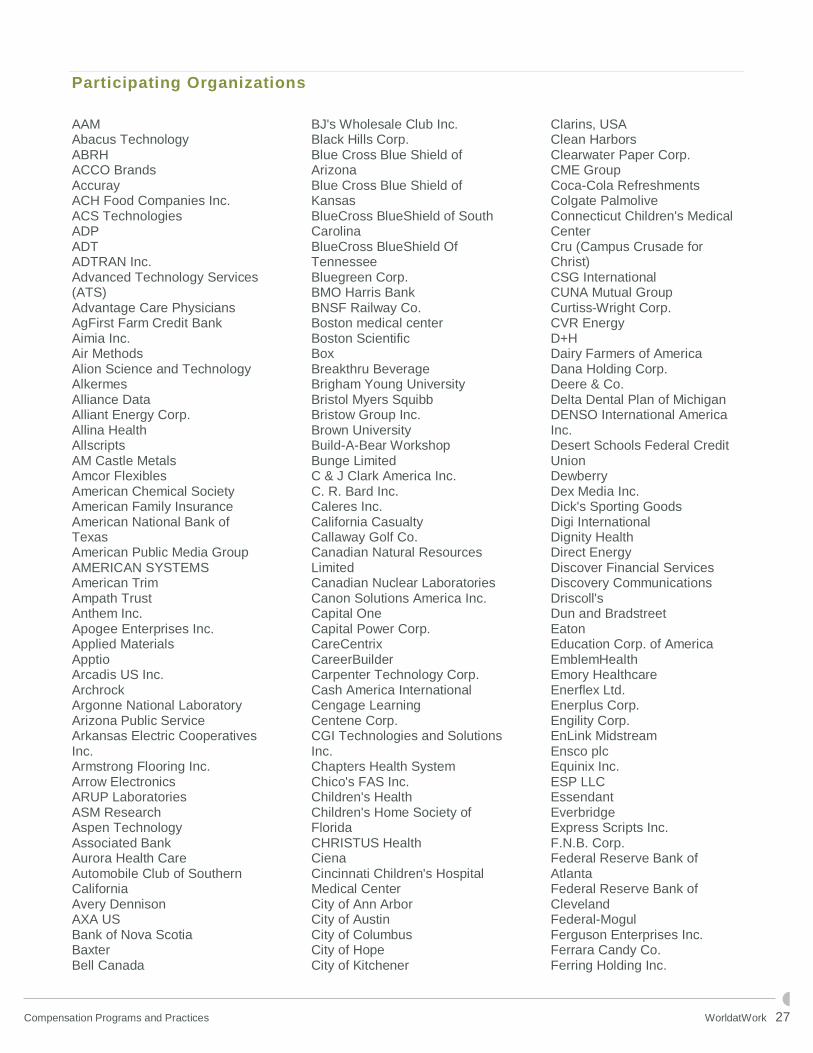
For organizations with multinational operations, 82% have a compensation philosophy that is the same across the company (see Figure 38), and the majority of performance management programs are also applied consistently to all countries (86%). (See Figure 41.) 53% primarily or exclusively design variable
96%
94%
84%
69%
Promotional increases(result of higher/greaterlevel of responsibility)
Merit increases
Market adjustments
Internal equity adjustments
T y p e s o f S a l a r y I n c r e a s e s A w a r d e d

Compensation Programs and Practices WorldatWork 9
pay programs at the corporate level, although 47% do allow for limited adaptation at the local level. (See Figure 39.)
Compensation Programs and Practices WorldatWork 10
Results and Analysis
Compensation Philosophy
Figure 6: “Does your company have a compensation philosophy for paying employees?”
2003 2010 2012 2014 2016
n= 1,381 996 621 600
We have a written compensation philosophy 62% 61% 67% 65% 62%
We have an unwritten compensation philosophy 29% 29% 26% 27% 31%
We do not have a compensation philosophy 7% 9% 7% 8% 7%
Other 2% 1% 1% 1% 1%
Figure 7: “To what extent do employees understand the company’s compensation philosophy?”
Participants responding, “We do not have a compensation philosophy” in Figure 6 did not receive this question.
2003 2010 2012 2014 2016
n= 1,237 921 561 547
Virtually no employees understand the compensation philosophy 6% 7% 6% 7% 11%
Most do not understand the compensation philosophy 32% 35% 38% 38% 42%
About half of employees understand the compensation philosophy 28% 29% 28% 26% 27%
Most employees understand the compensation philosophy 31% 26% 26% 27% 19%
Virtually all employees understand the compensation philosophy 4% 3% 2% 1% 3%
Figure 8: “Compared to the relevant labor market, what is your organization’s:”
n= 25th
percentile
Above 25th but below
50th percentile
50th percentile, or
median
Above 50th but below
75th percentile
75th percentile or
above
Base salary target (or goal) 560 0% 4% 89% 6% 1%
Base salary practice 557 1% 21% 67% 10% 1%
Total cash target (or goal) 478 1% 4% 80% 13% 3%
Total cash practice 478 2% 19% 60% 16% 4%
Figure 9: “How does your organization determine the relative value of jobs (job evaluation method)?
(Select all that apply.)”
2012 2014 2016
n= 989 611 590
Market pricing 88% 89% 91%
Classification 17% 18% 16%
Compensation Programs and Practices WorldatWork 11
Point factor 20% 18% 15%
Ranking 15% 13% 13%
Other method 7% 7% 7%
No method in place 1% 1% 1%
Figure 10: “Does your organization use variable pay (not including sales commission plans)?”1
Figure 11: “Which of the following types of variable pay plans does your organization use for some or all
employees? (Select all that apply.)” Only participants responding “Yes” in Figure 10 received this question.
2010 2012 2014 2016
n= 1,066 820 523 510
Bonuses (e.g., sign-on, retention) 59% 76% 82% 81%2
Recognition (e.g., spot award) 60% 66% 66% 65%
Performance sharing (based on other financial or nonfinancial goals) 57% 58% 65% 62%
Individual incentives (other than sales incentives) 67% 59% 42% 39%3
Profit sharing 19% 19% 19% 20%
1 In 2016, the percentage of organizations using variable pay was statistically significantly higher (88%) than in 2012 (84%) and 2010 (80%). 2 A statistically significantly higher percentage of participants cited using bonuses (e.g., sign-on, retention) as a type of variable pay in 2016 (81%) compared to 2010 (59%). 3 A statistically significantly lower percentage of participants cited using individual incentives (other than sales incentives) as a type of variable pay in 2016 (39%) than in 2012 (59%) and 2010 (67%).
Yes 88%
Yes 87%
Yes 84%
Yes 80%
No 12%
No 13%
No 16%
No 20%
2016 (n=588)
2014 (n=604)
2012 (n=989)
2010 (n=1,347)
Compensation Programs and Practices WorldatWork 12
Figure 12: “Compared to the relevant labor market what is your organization’s:” Only participants responding “Yes” in Figure 10 received this question.
Individual Base Salary Determination
Figure 13: “How are base salary increases typically determined for employees? (Select all that apply.)”
2010 2012 2014 2016
n= 1,337 979 605 580
Individual performance against job standards 73% 66% 71% 70%
Position in range 54% 56% 59% 59%
Market value of the position 55% 50% 49% 52%
Individual performance against MBOs or similar personal objectives 44% 58% 49% 47%
Skill or competency acquisition 25% 20% 22% 25%
Education/certifications 10% 9% 10% 16%
Years of service 13% 9% 11% 14%
General increase – everyone receives the same increase 11% 12% 9% 14%
Other 4% 4% 6% 5%
Figure 14: “Do you have a formal employee performance management program, resulting in a
performance rating or score that is shared with the employee?”
2016
n= 581
We have a formal program with a performance rating that is shared with the employee 84%
We have a formal program with a performance rating, but the rating is not shared with the employee 2%
We formally assess performance, but do not assign a performance rating 8%
2%8%
76%
11%4%4%
19%
59%
14%
4%
25th percentile orbelow
Above 25th butbelow 50thpercentile
50th percentile, ormedian
Above 50th butbelow 75thpercentile
75th percentile orabove
Variable pay target (or goal) (n=411) Variable pay practice or payout (n=414)
Compensation Programs and Practices WorldatWork 13
No, we do not formally assess performance 6%
Figure 14a: “Does your organization rank employees based on performance?”
2016
n= 584
Managers rank their own employees, but rankings are not integrated with other managers’ teams/units 13%
Employees are ranked, and those rankings are integrated with rankings of employees of other managers or the entire department/division
15%
Employees are ranked, and those rankings are integrated with rankings of all employees of the organization
4%
No, we do not rank employees 67%
Figure 14b: “Are salary increases tied to the performance rating or ranking? (Select all that apply.)”
Participants responding “No” in both Figures 14 and 14a did not receive this question.
Figure 15: “If salary increases are based on performance, what is the typical variation in salary increases
for 2016?”
2010 2012 2014 2016
n= 836 679 432 434
Base salary increase is based on something other than individual performance 1% 2% 3% 2%
No variation (approximately the same increase for everyone) 4% 4% 3% 4%
Small variation (increase for top performers is 1.25 times the average) 24% 24% 27% 28%
Moderate variation (increase for top performers is 1.5 times the average) 43% 45% 45% 45%
Considerable variation (increase for top performers is 2 times the average) 25% 23% 19% 20%
Extreme variation (increase for top performers is 3 times the average) 2% 2% 3% 1%
65%
22%
13%
Salary increases are tied to theperformance rating
Salary increases are influencedby ranking
Salary increases are not tied toor influenced by performance
rating or ranking
Compensation Programs and Practices WorldatWork 14
Figure 16: “If your organization allocates annual increases based on performance, indicate the method for determining the actual increase:”
2012 2014 2016
n= 677 425 457
A merit matrix is published that managers use as a GUIDE, but they have discretion to deviate if deemed appropriate
51% 52% 44%
A merit matrix is published that managers MUST follow in which a specific RANGE of increases is published for each box of the matrix
11% 13% 11%
A merit matrix (position in range and performance rating) is published that managers MUST follow in which a specific percentage increase is published for each box of the matrix
12% 13% 10%
A specific guide providing one increase percentage or a range of increase percentages for each level of performance (position in salary range is not considered) is published as a GUIDE only
10% 10% 9%
A specific guide providing one increase percentage or a range of increase percentages for each level of performance (position in salary range is not considered) is published that MUST be followed
8% 6% 5%
Other type of guidance is provided 5% 5% 8%
No guidance is provided other than the overall budget figure 3% 1% 13%
Figure 17: “How many performance ratings levels/categories are used when assessing individual
performance? (Please do not include levels such as ‘Too new to rate,’ ‘New hire,’ etc.)”
2010 2012 2014 2016
n= 1,126 844 529 489
None 0% 0% 1% 0%
Two 0% 1% 1% 1%
Three 12% 12% 12% 12%
Four 27% 23% 20% 21%
Five 54% 57% 60% 58%
Six or more 7% 7% 7% 8%
Figure 18: “How were employees distributed across these performance categories for 2015 or for the last
performance period?”
2010 2012 2014 2016
n= 1,112 839 526 485
Most people fell into the middle, with a bell-shaped distribution around the middle
54% 54% 50% 45%
Spread is skewed toward higher performance ratings 39% 41% 42% 43%
Spread is skewed toward lower performance ratings 1% 1% 1% 1%
Employees are spread approximately evenly across performance ratings 1% 0% 1% 2%
Do not track this information 5% 5% 6% 9%
Compensation Programs and Practices WorldatWork 15
Figure 19: “What portion of your organization’s U.S. positions/jobs are exempt from Fair Labor Standards Act of 1938 (FLSA) requirements?”
2010 2012 2014 2016
n= 998 709 446 422
0% (None) 4% 3% 2% 3%
10% to 30% 32% 32% 36% 30%
40% to 60% 36% 38% 36% 38%
70% to 90% 26% 27% 27% 30%
100% (All) 1% 1% 0% 0%
Figure 20: “For what portion of your organization’s U.S. positions/jobs do you maintain FLSA exemption
status documentation?”
Base Salary Structure Design
Figure 21: “How often do you assess the market value of jobs (i.e., pricing benchmarks or all jobs with
salary survey data)?”
2010 2012 2014 2016
n= 1,315 956 590 565
Once a year 55% 59% 57% 53%
Less than once every two years 5% 4% 3% 5%
Once every two years 13% 11% 14% 15%
Multiple times per year 7% 6% 6% 6%
Never 1% 0% 0% 1%
Not consistently (as needed based on market conditions) 19% 20% 20% 21%
36%
13%
9%11%
31%32%
14%
10%
14%
30%
0% (None) 10% to 30% 40% to 60% 70% to 90% 100% (All)
Nonexempt positions (n=367) Exemptpositions (n=375)
Compensation Programs and Practices WorldatWork 16
Figure 22: “Does your organization use a formal salary structure(s)?”
Figure 23: “How often do you typically adjust base salary structures for employees?”
2010 2012 2014 2016
n= 1,280 929 514 469
Once a year 58% 55% 59% 60%
Not consistently adjusted (or as needed, based on market conditions) 30% 31% 24% 24%
Less than once every two years 3% 4% 3% 3%
Once every two years 9% 9% 14% 12%
Multiple times per year 0% 0% 0% 0%
Yes84%
Yes87%
Yes85%
No16%
No13%
No15%
2016 (n=564)2014 (n=589)2012 (n=955)
Compensation Programs and Practices WorldatWork 17
Figure 23a: “Does your organization have more than one salary structure?”4
Figure 24: “How many separate structures are in place?”5 Only participants who answered “Yes” in Figure 23a received this question.
4 A statistically significant higher percentage of organizations have more than one salary structure in 2016 (73%) compared to 2010 (59%). 5 In 2016, a greater number of organizations have five or more separate structures in place (58%) than in 2010 (42%).
Yes73%
Yes77%
Yes72%Yes
59%
No28%
No23%
No28%No
41%
2016 (n=472)2014 (n=513)2012 (n=940)2010 (n=1,285)
216%
221%
218%
225%
314%
314%
318%
321%
412%
412%
413%
412%
5 or more58%
5 or more53%
5 or more51%
5 or more42%
2016 (n=342)
2014 (n=422)
2012 (n=626)
2010 (n=751)
Compensation Programs and Practices WorldatWork 18
Figure 25: “How are the separate structures defined/identified? (Select all that apply.)”
2010 2012 2014 2016
n= 836 627 433 341
By geographic region 45% 52% 52% 60%6
By job category/role 32% 23% 44% 48%7
By FLSA exemption status or other regulatory classification 35% 33% 27% 29%
By business unit/subsidiary 25% 31% 18% 17%8
By bargaining unit/union 7% 5% 15% 13%
Other
• By country 4% 4% 11% 6%
Figure 26: “Does your salary structure(s) consist of salary grades or broadbands?”
2010 2012 2014 2016
n= 1,284 628 507 471
Salary grades 73% 86% 87% 89%9
Broadbanding approach 14% 8% 9% 6%
Other
• Mix of both approaches
• Step progression
13% 6% 5% 4%
6 A statistically significantly higher percentage of organization’s structures are defined/identified by geographic region in 2016 (60%) than 2010
(45%). 7 In 2016, a greater number of organization’s structures are defined/identified by job category/role (48%) than in 2012 (23%) and in 2010
(32%). 8 A statistically significantly smaller percentage of organization’s structures are defined/identified by business unit/subsidiary in 2016 (17%) than 2012 (31%). 9 A statistically significantly higher percentage of organization’s salary structure(s) consist of salary grades in 2016 (89%) than 2010 (73%).
Compensation Programs and Practices WorldatWork 19
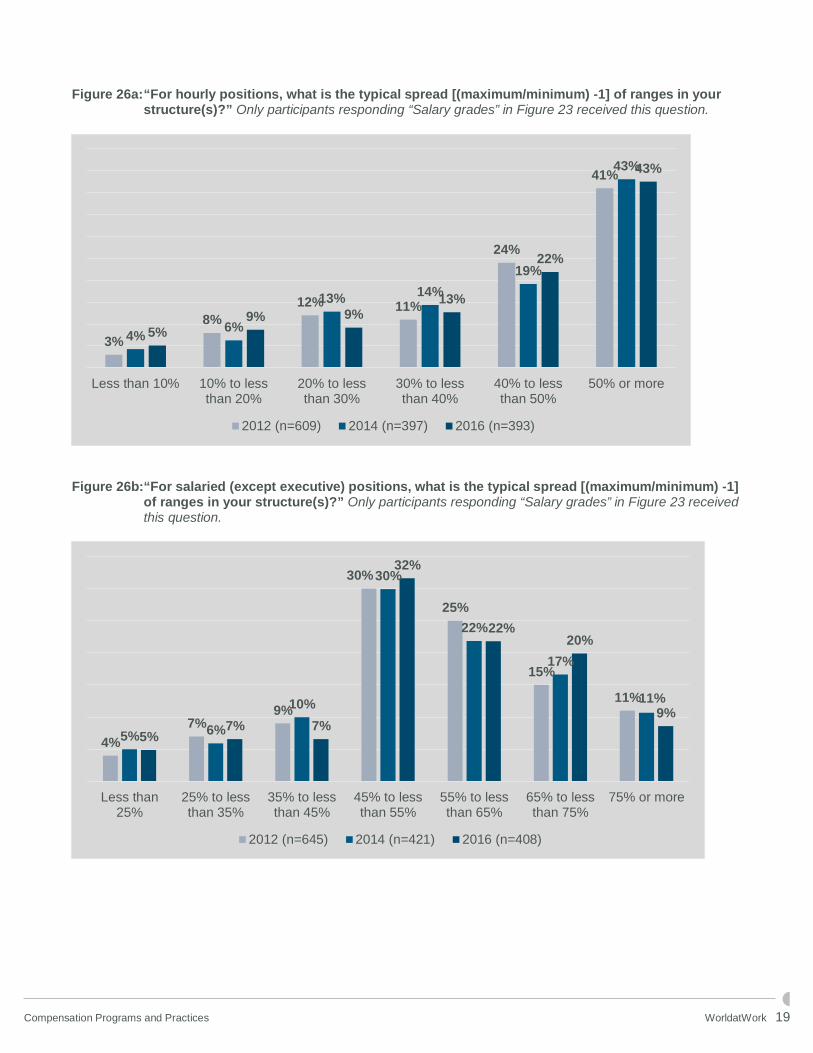
Figure 26a: “For hourly positions, what is the typical spread [(maximum/minimum) -1] of ranges in your
structure(s)?” Only participants responding “Salary grades” in Figure 23 received this question.
Figure 26b: “For salaried (except executive) positions, what is the typical spread [(maximum/minimum) -1]
of ranges in your structure(s)?” Only participants responding “Salary grades” in Figure 23 received this question.
3%
8%
12% 11%
24%
41%
4%6%
13%14%
19%
43%
5%
9% 9%13%
22%
43%
Less than 10% 10% to lessthan 20%
20% to lessthan 30%
30% to lessthan 40%
40% to lessthan 50%
50% or more
2012 (n=609) 2014 (n=397) 2016 (n=393)
4%
7%9%
30%
25%
15%
11%
5% 6%
10%
30%
22%
17%
11%
5%7% 7%
32%
22%20%
9%
Less than25%
25% to lessthan 35%
35% to lessthan 45%
45% to lessthan 55%
55% to lessthan 65%
65% to lessthan 75%
75% or more
2012 (n=645) 2014 (n=421) 2016 (n=408)
Compensation Programs and Practices WorldatWork 20
Figure 26c: “For executive positions, what is the typical spread [(maximum/minimum) -1] of ranges in your structure(s)?” Only participants responding “Salary grades” in Figure 23 received this question.
Figure 27: “For structures covering U.S. employees, what is the general midpoint progression?”
n= Less than 5%
5% to less than 9%
10% to less than 14%
15% to less than 19%
20% to less than 30%
Greater than 30%
Midpoint not
defined Varies
Hourly 414 3% 18% 33% 17% 7% 1% 5% 16%
Salaried 421 2% 7% 32% 26% 13% 3% 2% 15%
Executive 389 1% 1% 14% 15% 17% 8% 25% 18%
Figure 28: “What types of salary increases and/or adjustments does your organization award to some or
all employees? (Select all that apply.)”
2010 2012 2014 2016
n= 1,306 946 584 558
Promotional increases (result of higher/greater level of responsibility) 94% 97% 96% 96%
Merit increases 92% 94% 95% 94%
Market adjustments 76% 77% 77% 84%10
Internal equity adjustments 64% 69% 70% 69%
Pay differentials (usually related to atypical schedule, hazardous or unsecure work environment, special skill set or responsibility, etc.)
42% 49% 45% 48%
Geographic differential n/a n/a 33% 36%
10 A statistically significantly greater percentage of organizations award market adjustments to some or all employees in 2016 (84%)
compared to 2014 (77%), 2012 (77%) and 2010 (76%).
7% 7%
19%18%
19%
10%
19%
7% 7%
19% 18% 18%
10%
19%
8%
6%
22%
18%19%
14% 14%
Less than35%
35% to lessthan 45%
45% to lessthan 55%
55% to lessthan 65%
65% to lessthan 75%
75% to lessthan 85%
85% or more
2012 (n=561) 2014 (n=374) 2016 (n=274)
Compensation Programs and Practices WorldatWork 21
Temporary special assignment pay 36% 39% 40% 35%
Cost-of-living adjustments (COLAs) 11% 12% 11% 12%
General across-the-board increases not considered COLA or market adjustments
12% 13% 10% 12%
Length of service n/a n/a 3% 5%
Other 4% 4% 3% 3%
Pay Program Communications
Figure 29: “How much information is shared with employees about their individual salaries? (Select all that apply.)”
2010 2012 2014 2016
n= 1,300 940 575 552
Minimal pay-related information is shared 32% 34% 39% 46%11
Information regarding the design of the pay program (e.g., strategy, compensation markets, link to performance)
49% 46% 44% 41%12
Base salary range for the employee’s pay grade 43% 44% 44% 37%
Base salary ranges for all pay grades or jobs 19% 18% 16% 15%
Actual pay levels for all employees 1% 2% 4% 4%
Other 4% 5% 5% 2%
Figure 30: “In the past 12 months, how did employees receive communications about the pay program?
(Select all that apply.)”
2010 2012 2014 2016
n= 1,299 940 582 555
Individual discussions with their supervisor 73% 79% 82% 81%13
Memos, emails 43% 37% 42% 40%
Periodic total rewards or compensation statements n/a n/a 43% 38%
Company website/intranet 42% 41% 41% 37%
Individual discussions with HR/compensation department 30% 29% 28% 29%
Employee meetings 27% 23% 23% 24%
Employee handbook or orientation manual 21% 20% 15% 20%
No pay communications 7% 7% 4% 7%
Other
• Letters or statements that accompany pay increases
6% 7% 3% 4%
11 In 2016, statistically significantly more organizations share minimal pay-related information with employees (46%) than 2012 (34%) and
2010 (32%). 12 A statistically significantly lower percentage of organizations share information regarding the design of pay programs in 2016 (41%) compared to 2010 (49%). 13 A statistically significantly higher number of participants received individual discussions with their supervisor (81%) about the pay program
compared with 2010 (73%).
Compensation Programs and Practices WorldatWork 22
Figure 31: “How often did employees receive communications about their individual pay in the past 12 months?”
2010 2012 2014 2016
n= 1,297 872 551 509
Never 6% 5% 2% 2%
At least once 76% 79% 77% 81%
Twice 12% 12% 16% 11%
Three times 3% 3% 3% 4%
Four times 1% 0% 0% 0%
Five times or more 2% 2% 2% 2%
Figure 32: “The approach to communicating individual pay increases is: (Select all that apply.)”
2010 2012 2014 2016
n= 871 871 552 510
Brief written communication 54% 54% 55% 59%
Detailed written communication 22% 25% 28% 20%
Brief verbal communication 49% 51% 53% 58%
Detailed verbal communication 24% 25% 20% 20%
We never communicate pay information 2% 1% 1% 0%
Evaluation of Salary Policies and Practices
Figure 33: “How does management determine if the salary program is effective? (Select all that apply.)”
2010 2012 2014 2016
n= 1,258 922 563 537
Employee turnover or retention 59% 63% 62% 61%
Employee satisfaction survey metrics 46% 50% 53% 47%
Business/operating results 32% 29% 30% 28%
Senior leadership tells us that it is working 21% 21% 19% 25%
Management does not evaluate salary program effectiveness 22% 20% 22% 22%
Employees tell us that it is working 18% 19% 16% 18%
Employee productivity metrics 17% 16% 15% 15%
Labor cost is controlled/lowered 15% 15% 14% 14%
Other 3% 4% 2% 4%
Compensation Programs and Practices WorldatWork 23
Compensation Data Administration and Analysis
Figure 34: “What best describes your organization’s system(s) to maintain compensation-related
employee data?”
2016
n= 555
We have an enterprise (includes all employees in entire organization) system that is used to store all employee data as well as data to manage other function(s) of the organization such as financial, logistics, etc.
34%
We have one primary system that stores employee data for all employees within the organization, but it does not store any non-employee data used by other function(s)
38%
We have multiple HRIS/payroll systems that store employee data and we must merge data to perform analyses on an organization-wide basis
23%
We enter and maintain data in a basic spreadsheet, software program(s) or other database that was not exclusively designed to store employee data
5%
Other system(s) 1%
Figure 35: “How was this system acquired?” (n=403)
97%
3%
It was purchased, leased or is a subscription It was developed internally by our ITdepartment
Compensation Programs and Practices WorldatWork 24
Figure 36: “What is the primary method(s) you use to analyze compensation-related data?” (n=545)
Figure 37: “What are the general types of analyses that are performed? (Select all that apply.)”
2016
n= 545
General compensation analyses, such as merit budgeting, position-in-range analyses, salary structure adjustments and general compensation position versus market analyses
97%
Analyses related to pay equity in terms of ongoing pay levels or how merit increases have been allocated
70%
Analytics used for predictive or modeling purposes, which may result in proactive changes to a compensation-related policy or practice
30%
Analyses to produce various statistics on an ongoing basis, which may be included in a recurring department or company report, such as key performance indicators (KPIs) or similar
25%
53%
41%
6%
Our primary system offers some analyticalcapability but we often need to download data to
other programs (e.g., Excel) to performadditional analyses
Our primary system offers little/no analyticalcapability
Our primary system offers analytical capabilityto do most/all analyses needed
Compensation Programs and Practices WorldatWork 25
Global Practices Only participants with responsibil ity for more than one region or country (see Figure 5) received the following questions. Figure 38: “If you have a compensation philosophy, is it the same across the company or does it vary by
country or region?” Only participants with a written or unwritten compensation philosophy from Figure 6 received this question.
Figure 39: “If you have employees in multiple countries, how are your variable pay programs designed and administered?”
2012 2014 2016
n= 235 147 165
Variable pay programs are designed primarily at the corporate level, and all employees usually participate in the same programs, with flexibility for local countries to make limited adaptations or implement unique programs of nominal cost.
47% 50% 53%
Variable pay programs are designed exclusively at the corporate level, and all employees worldwide participate in the same programs.
33% 33% 31%
Variable pay programs are designed with significant input from local HR and/or line management. One or a few core variable pay programs exist companywide; however, different countries have significant latitude to implement additional local programs based on local practice and competitive factors.
17% 13% 15%
Variable pay programs are designed and administered primarily at the local level to ensure they are meeting the unique needs of local employees.
3% 4% 1%
82%82%
18%18%
2016 (n=158)2014 (n=136)
Same across the company Varies by country or region
Compensation Programs and Practices WorldatWork 26
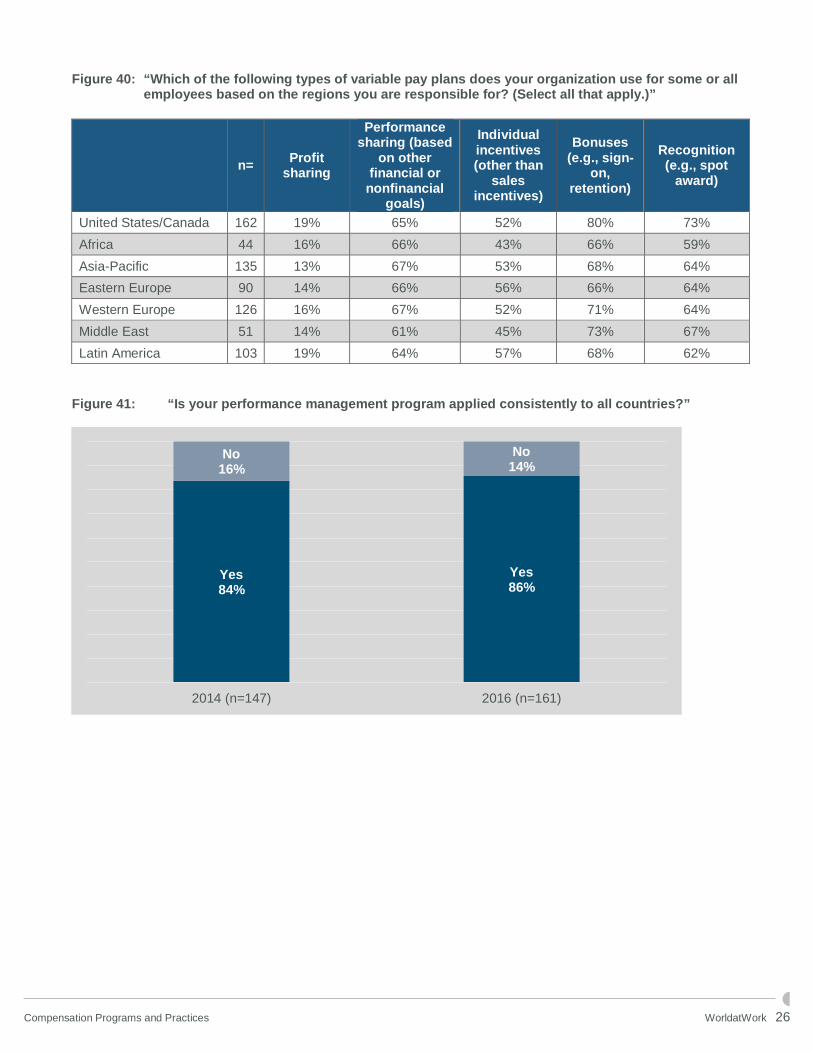
Figure 40: “Which of the following types of variable pay plans does your organization use for some or all employees based on the regions you are responsible for? (Select all that apply.)”
n= Profit
sharing
Performance sharing (based
on other financial or
nonfinancial goals)
Individual incentives (other than
sales incentives)
Bonuses (e.g., sign-
on, retention)
Recognition (e.g., spot
award)
United States/Canada 162 19% 65% 52% 80% 73%
Africa 44 16% 66% 43% 66% 59%
Asia-Pacific 135 13% 67% 53% 68% 64%
Eastern Europe 90 14% 66% 56% 66% 64%
Western Europe 126 16% 67% 52% 71% 64%
Middle East 51 14% 61% 45% 73% 67%
Latin America 103 19% 64% 57% 68% 62%
Figure 41: “Is your performance management program applied consistently to all countries?”
Yes86%
Yes84%
No14%
No16%
2016 (n=161)2014 (n=147)
Compensation Programs and Practices WorldatWork 27
Participating Organizations
AAM Abacus Technology ABRH ACCO Brands Accuray ACH Food Companies Inc. ACS Technologies ADP ADT ADTRAN Inc. Advanced Technology Services (ATS) Advantage Care Physicians AgFirst Farm Credit Bank Aimia Inc. Air Methods Alion Science and Technology Alkermes Alliance Data Alliant Energy Corp. Allina Health Allscripts AM Castle Metals Amcor Flexibles American Chemical Society American Family Insurance American National Bank of Texas American Public Media Group AMERICAN SYSTEMS American Trim Ampath Trust Anthem Inc. Apogee Enterprises Inc. Applied Materials Apptio Arcadis US Inc. Archrock Argonne National Laboratory Arizona Public Service Arkansas Electric Cooperatives Inc. Armstrong Flooring Inc. Arrow Electronics ARUP Laboratories ASM Research Aspen Technology Associated Bank Aurora Health Care Automobile Club of Southern California Avery Dennison AXA US Bank of Nova Scotia Baxter Bell Canada
BJ's Wholesale Club Inc. Black Hills Corp. Blue Cross Blue Shield of Arizona Blue Cross Blue Shield of Kansas BlueCross BlueShield of South Carolina BlueCross BlueShield Of Tennessee Bluegreen Corp. BMO Harris Bank BNSF Railway Co. Boston medical center Boston Scientific Box Breakthru Beverage Brigham Young University Bristol Myers Squibb Bristow Group Inc. Brown University Build-A-Bear Workshop Bunge Limited C & J Clark America Inc. C. R. Bard Inc. Caleres Inc. California Casualty Callaway Golf Co. Canadian Natural Resources Limited Canadian Nuclear Laboratories Canon Solutions America Inc. Capital One Capital Power Corp. CareCentrix CareerBuilder Carpenter Technology Corp. Cash America International Cengage Learning Centene Corp. CGI Technologies and Solutions Inc. Chapters Health System Chico's FAS Inc. Children's Health Children's Home Society of Florida CHRISTUS Health Ciena Cincinnati Children's Hospital Medical Center City of Ann Arbor City of Austin City of Columbus City of Hope City of Kitchener
Clarins, USA Clean Harbors Clearwater Paper Corp. CME Group Coca-Cola Refreshments Colgate Palmolive Connecticut Children's Medical Center Cru (Campus Crusade for Christ) CSG International CUNA Mutual Group Curtiss-Wright Corp. CVR Energy D+H Dairy Farmers of America Dana Holding Corp. Deere & Co. Delta Dental Plan of Michigan DENSO International America Inc. Desert Schools Federal Credit Union Dewberry Dex Media Inc. Dick's Sporting Goods Digi International Dignity Health Direct Energy Discover Financial Services Discovery Communications Driscoll's Dun and Bradstreet Eaton Education Corp. of America EmblemHealth Emory Healthcare Enerflex Ltd. Enerplus Corp. Engility Corp. EnLink Midstream Ensco plc Equinix Inc. ESP LLC Essendant Everbridge Express Scripts Inc. F.N.B. Corp. Federal Reserve Bank of Atlanta Federal Reserve Bank of Cleveland Federal-Mogul Ferguson Enterprises Inc. Ferrara Candy Co. Ferring Holding Inc.
Compensation Programs and Practices WorldatWork 28
Fidelity Investments Fike Corp. First Financial Bank FirstEnergy Corp. Florida Blue FOCUS Brands Foresters Financial Forsythe Technology Inc. Fossil Group Inc. Freeman Freeport LNG Development, L.P. FTD Inc. Galderma GameStop Gannett Gap Inc. Geisinger Health System Gemological Institute of America General Electric General Mills Inc. Genworth Financial Gillette Children's Specialty Healthcare Glanbia Performance Nutrition Glens Falls Hospital Goodwill Industries of Southeastern WI Google Government of Alberta Government of British Columbia Graybar Electric Co. Great Canadian Gaming Corp. Group Health Cooperative of South Central Wisconsin GRUPO KUO Halcon Resources Hancock Holding Co. Harrisburg Area Community College Hawaii Employers Council HDR Inc. Helzberg Diamonds Hennepin Healthcare System Hess Hilti North America HMS Horace Mann Companies HSN HubSpot ICW Group Idaho National Laboratory IDEXX Laboratories Ignite Restaurant Group IHS Ikea IM Flash Technologies Imperial Supplies Incyte Corp.
Indeed.com Independence Blue Cross Insight Enterprises Insight Performance Inc. Insitu Institute of Electrical and Electronics Engineers Intact Financial Corp. Integra Life Sciences Intelligrated Intermedix Corporation LLC International Development Research Centre of Canada International Paper Intrawest Invitation Homes Ixia J. J. Keller & Associates Inc. J.R. Simplot Company Jackson health system Johns Manville Kabam Inc. Kelly Services Kelsey-Seybold Clinic Kforce KONE Inc. L Brands Inc. L-3 Communications Aerospace Systems Lancaster General Health Land O'Lakes Landis&Gyr Lehigh Hanson Inc. Lennox International Inc. Level 3 Communications LexisNexis Risk Solutions Liberty Mutual Insurance LifeWay Christian Resources Lincoln Financial Group Lionbridge Technologies London Health Sciences Centre Los Alamos National Laboratory Lovelace Health System LPL Financial Lumentum LVMH Moet Hennessy Louis Vuitton Inc. LyondellBasell Industries Magellan Health Inc. Magellan Midstream Partners MAHLE Management Sciences for Health (MSH) Manhattan Associates Inc. Manulife Financial Maricopa Community College District Maritz Holdings Inc. Martin Marietta
Mary Kay Inc. Mattel Inc. McCormick & Company Inc. Media General Inc. Meijer Inc. Memphis Light Gas and Water Division Merrill Corp. MFS Investments MGIC MGM Resorts International Microsoft Corp. MidMichigan Health MillerCoors Miraca Life Sciences Moody's Moog Inc. Mosaic MSA Murphy USA National Exchange Carriers Association National Radio Astronomy Observatory National Rural Electric Cooperative Association NAV CANADA Navient NCI Building Systems Nebraska Public Power District Nestle Purina PetCare Co. Neustar New York Community Bancorp Inc. NFI Nike Inc. NiSource Inc. Nordson Corp. Northwell Health Nu Skin Enterprises Nuance Communications NuStar Energy L.P. Office Depot Inc. OhioHealth Oncor Electric Delivery One Call Care Management OneAmerica Financial Partners Inc. ONEOK Inc. Oracle Owens Corning Owensboro Health Pacific Dental Services Pacificorp Panera Bread Paycor Pembina Pipelines Penn State Hershey Medical Center
Compensation Programs and Practices WorldatWork 29
Perkins Coie Pharmavite Pinnacle Foods PNC PNM Resources Inc. Polaris Industries Inc. Population Council Port of Seattle PPD ProHealth Care Inc. ProQuest Protective Life Public Service Enterprise Group Quad Graphics Qualcomm Quantum Corp. RAND Corp. Raytheon Co. Regeneron Pharmaceuticals Inc. Regions Hospital Reinsurance Group of America Republic Airways Holdings Research Now RingCentral Roche Diagnostics Corp. Roche Pharma Rockwell Automation Rowan Royal Bank of Canada Ryder System Inc. Saint Luke's Health System Salesforce Sanofi Savannah River Nuclear Solutions LLC Save the Children US Savers Inc. SC Johnson & Son Inc. SCANA SCI Scientific Research Corp. Seagate Seattle Children's Hospital Shamrock Foods Co. Siemens Healthineers Siemens US Snap-on Inc. Sonic Corp. Southern Co. Southern New Hampshire Health Splunk
Sprouts Farmers Market SPX Corp. SRC Inc. SRI St. Jude Medical St. Louis County Government St. Luke's Health System StanCorp Financial Group StandardAero Stanford Health Care State Auto STIHL Inc. STMicroelectronics Inc. Superior Energy Services Symantec Symetra Syniverse Technologies Teacher Retirement System of Texas Tennessee Valley Authority Terracon Consultants Inc. Texas Children's Hospital Textron The Allstate Corp. The Auto Club Group The Boeing Co. The Brick Group Ltd. The Children's Mercy Hosptial The Compensation Depot The E.W. Scripps Co. The Estee Lauder Co. The Hain Celestial Group The Marcus Corp. The Maschhoffs The MITRE Corp. The National Academies of Sciences, Engineering and Medicine The Port Authority of NY & NJ The Queen's Medical Center The Rockefeller Group The TJX Companies Inc. The Trustmark Co. The Walt Disney Co. Thomson Reuters Toray Plastics (America) Inc. Tower International Toyota Boshoku America Tribune Publishing Truven Health Analytics, an IBM Co. TTCU The Credit Union Tufts Health Plan
Tupperware Brands Corp. Twentieth Century Fox U.S. Bancorp UBS UCB UCSF UFA UMass Memorial UNFI Unicomer Unilever Union Bank & Trust Union County Local Government United Services Automobile Association (USAA) Univar University of Florida Health-Shands University of Massachusetts Medical School University of Minnesota Physicians University of Toronto University of Vermont Medical Center US Pharmacopoeia USG Corp. Vectren Corp. Vencore Verisign Inc. Virtua Health Vulcan Materials Co. Walt Disney Parks and Resorts Wellmark Blue Cross Blue Shield Wells Enterprises Westfield Group Whirlpool Corp. Whole Foods Market Wind River Systems Wolters Kluwer Wood Group Mustang Workplace Safety & Insurance Board WVU Hospitals Wycliffe Bible Translators Inc. Xactly Corp. Xcel Energy Xero Xerox Canada Ltd. Zoetis Inc. Zurich Insurance NA
Zurich North America