Embed Size (px)
Citation preview
AP Statistics 1-Day Workshop, Fall 2019 Page 1 of 42
AP Statistics 1-Day Workshop Dave Ferris, College Board Consultant
[email protected] www.noblestatman.com
AP Statistics Course and Exam Description, page 7
The AP Statistics course introduces students to the major concepts and tools for collecting, analyzing, and
drawing conclusions from data. There are four themes evident in the content, skills, and assessment in the AP
Statistics course: exploring data, sampling and experimentation, probability and simulation, and statistical
inference. Students use technology, investigations, problem solving, and writing as they build conceptual
understanding.
AP Statistics 1-Day Workshop, Fall 2019 Page 2 of 42
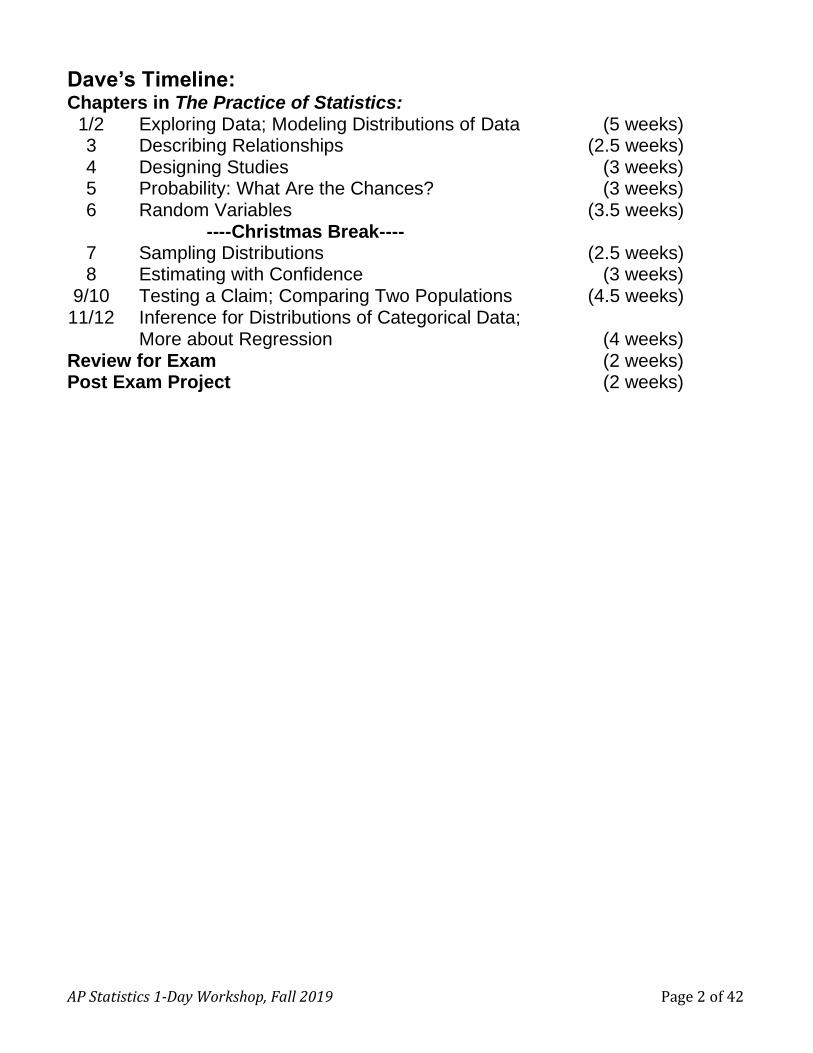
Dave’s Timeline: Chapters in The Practice of Statistics: 1/2 Exploring Data; Modeling Distributions of Data (5 weeks) 3 Describing Relationships (2.5 weeks) 4 Designing Studies (3 weeks) 5 Probability: What Are the Chances? (3 weeks) 6 Random Variables (3.5 weeks) ----Christmas Break---- 7 Sampling Distributions (2.5 weeks) 8 Estimating with Confidence (3 weeks) 9/10 Testing a Claim; Comparing Two Populations (4.5 weeks) 11/12 Inference for Distributions of Categorical Data; More about Regression (4 weeks) Review for Exam (2 weeks) Post Exam Project (2 weeks)

AP Statistics 1-Day Workshop, Fall 2019 Page 3 of 42
Trick or Treat!
Fun size M&M’s and Skittles NAME___________________________ 1. Question: How many MM’s are there in a Fun Size bag? Guess:_________ Graph the class guesses on the back side of this sheet. 2. Number of M&M’s in your bag: _________ 3. Make a dot plot of the class data on the back side of this sheet. 4. What was the population of interest? 5. What was the sample? 6. What was the observational unit (subject)? 7. So how many M&M’s are in a fun size bag? 8. Do you think the typical number of Skittles in a Fun Size bag is more than the typical number
of M&M’s in a Fun Size bag? Explain. 9. Number of Skittles in your bag: _________ 10. Make a dot plot of the class data on the back side of this sheet. 11. So how many Skittles are in a fun size bag?

AP Statistics 1-Day Workshop, Fall 2019 Page 4 of 42
12. Compare and contrast the three distributions in context. Be sure to talk about the shapes, centers, spreads and outliers.
Dot plot of class guesses:
Dot plot of class bags of M&M’s:
Dot plot of class bags of Skittles:

AP Statistics 1-Day Workshop, Fall 2019 Page 5 of 42
2018 AP Statistics Exam Exploring Data
5. The following histograms summarize the teaching year for the teachers at two high schools, A and B.
Teaching year is recorded as an integer, with first-year teachers recorded as 1, second-year teachers
recorded as 2, and so on. Both sets of data have a mean teaching year of 8.2, with data recorded from
200 teachers at High School A and 221 teachers at High School B. On the histograms, each interval
represents possible integer values from the left endpoint up to but not including the right endpoint.
(a) The median teaching year for one high school is 6, and the median teaching year for the other high
school is 7. Identify which high school has each median and justify your answer.
(b) An additional 18 teachers were not included with the data recorded from the 200 teachers at High
School A. The mean teaching year of the 18 teachers is 2.5. What is the mean teaching year for all
218 teachers at High School A?
(c) The standard deviation of the teaching year for the 221 teachers at High School B is 7.2. If one
teacher is selected at random from High School B, what is the probability that the teaching year
for the selected teacher will be within 1 standard deviation of the mean of 8.2 ? Justify your
answer.

AP Statistics 1-Day Workshop, Fall 2019 Page 6 of 42
FRAPPY! NAME____________________________________
Comparing Distributions: 2015 #1
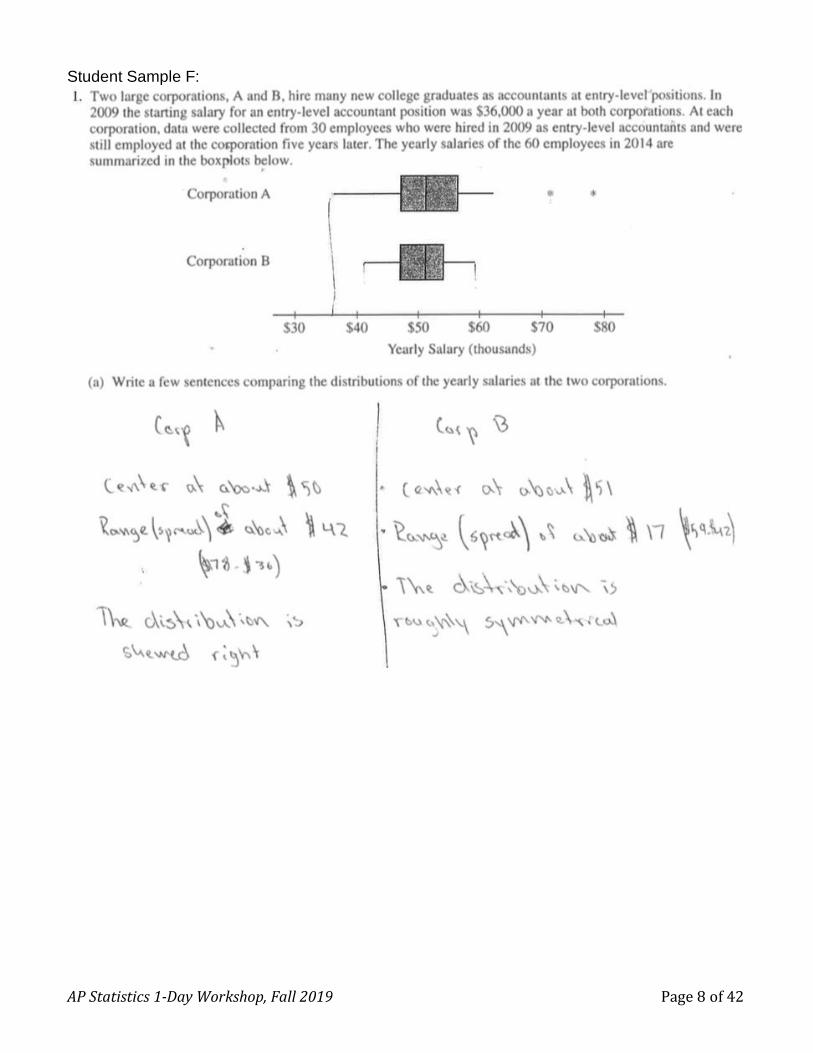
(b) Suppose both corporations offered you a job for $36,000 a year as an entry-level accountant.
(i) Based on the boxplots, give one reason why you might choose to accept the job at corporation A.
(ii) Based on the boxplots, give one reason why you might choose to accept the job at corporation B.

AP Statistics 1-Day Workshop, Fall 2019 Page 7 of 42
FRAPPY! NAME____________________________________ Student Solutions: 2015 #1 Student Sample C:
AP Statistics 1-Day Workshop, Fall 2019 Page 8 of 42
Student Sample F:

AP Statistics 1-Day Workshop, Fall 2019 Page 9 of 42
Solutions and Scoring Guidelines:

AP Statistics 1-Day Workshop, Fall 2019 Page 10 of 42
2017 AP Statistics Exam:

AP Statistics 1-Day Workshop, Fall 2019 Page 11 of 42
AP Statistics Exam General Information:
• The AP Statistics Exam is Friday, May 15, 2019 from 12-4 PM
• There are ______ multiple choice questions on the AP Statistics Exam.
• There are ______ free response questions on the AP Statistics Exam.
• Each part weighs 50% (scaled to _______ points each)
• Students have ______ minutes for each section of the exam.
• #_____ of the Free Response part is called the Investigative Task.
• Students should reserve about _____ minutes to complete this problem.
• It is worth _____ of the free response section, or _____ of the entire test!
• It typically covers several ________ _______________.
• It typically introduces something _________.
• Students should have a strategy:
1. S___________/s________ the entire test, and r_______ problems.
2. Find the two _________________ and do those first (≈20 minutes)
3. Then do #6 (up to 25 minutes)
4. Then spend the rest of your time (≈45 minutes) on the last three.
The investigative Task is designed to _________________ you. Try to _________________
read, think and give your best answers.
________ credit earned on the Investigative Task will help your overall score!
Mean scores on recent Investigative Tasks (2013-2018): ____________________________
AP Statistics 1-Day Workshop, Fall 2019 Page 12 of 42
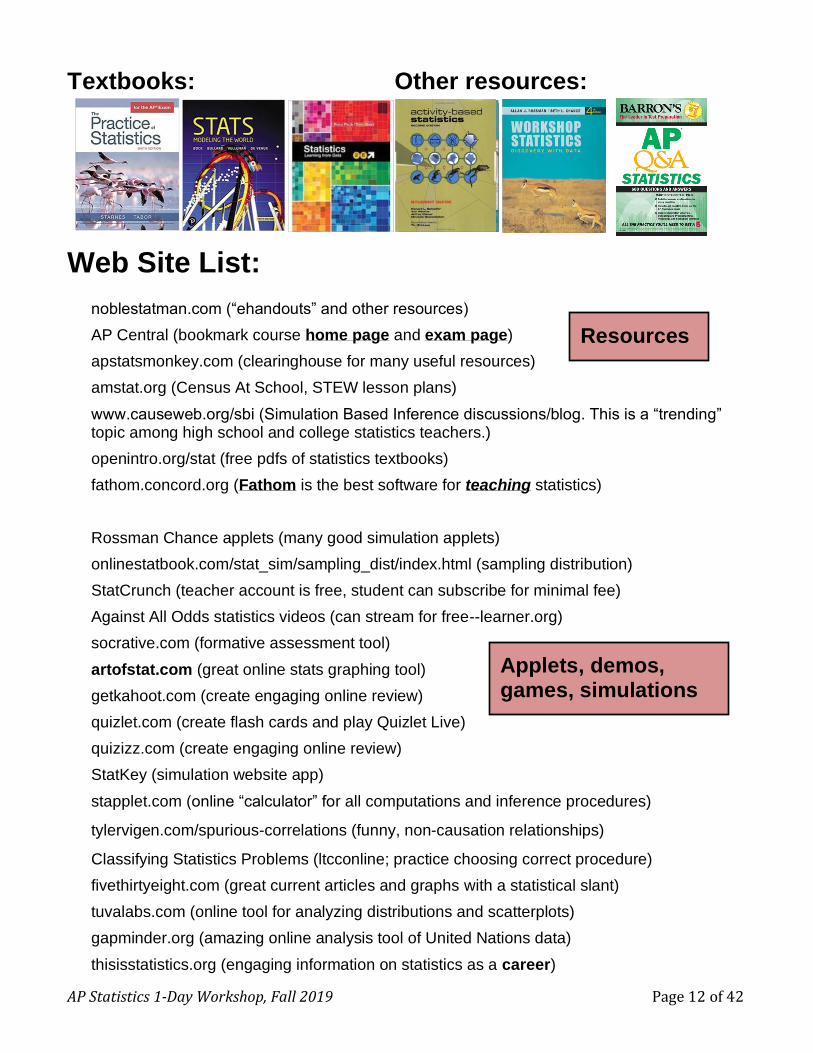
Textbooks: Other resources:
Web Site List:
noblestatman.com (“ehandouts” and other resources)
AP Central (bookmark course home page and exam page)
apstatsmonkey.com (clearinghouse for many useful resources)
amstat.org (Census At School, STEW lesson plans)
www.causeweb.org/sbi (Simulation Based Inference discussions/blog. This is a “trending” topic among high school and college statistics teachers.)
openintro.org/stat (free pdfs of statistics textbooks)
fathom.concord.org (Fathom is the best software for teaching statistics)
Rossman Chance applets (many good simulation applets)
onlinestatbook.com/stat_sim/sampling_dist/index.html (sampling distribution)
StatCrunch (teacher account is free, student can subscribe for minimal fee)
Against All Odds statistics videos (can stream for free--learner.org)
socrative.com (formative assessment tool)
artofstat.com (great online stats graphing tool)
getkahoot.com (create engaging online review)
quizlet.com (create flash cards and play Quizlet Live)
quizizz.com (create engaging online review)
StatKey (simulation website app)
stapplet.com (online “calculator” for all computations and inference procedures)
tylervigen.com/spurious-correlations (funny, non-causation relationships)
Classifying Statistics Problems (ltcconline; practice choosing correct procedure)
fivethirtyeight.com (great current articles and graphs with a statistical slant)
tuvalabs.com (online tool for analyzing distributions and scatterplots)
gapminder.org (amazing online analysis tool of United Nations data)
thisisstatistics.org (engaging information on statistics as a career)
Resources
Applets, demos, games, simulations
AP Statistics 1-Day Workshop, Fall 2019 Page 13 of 42
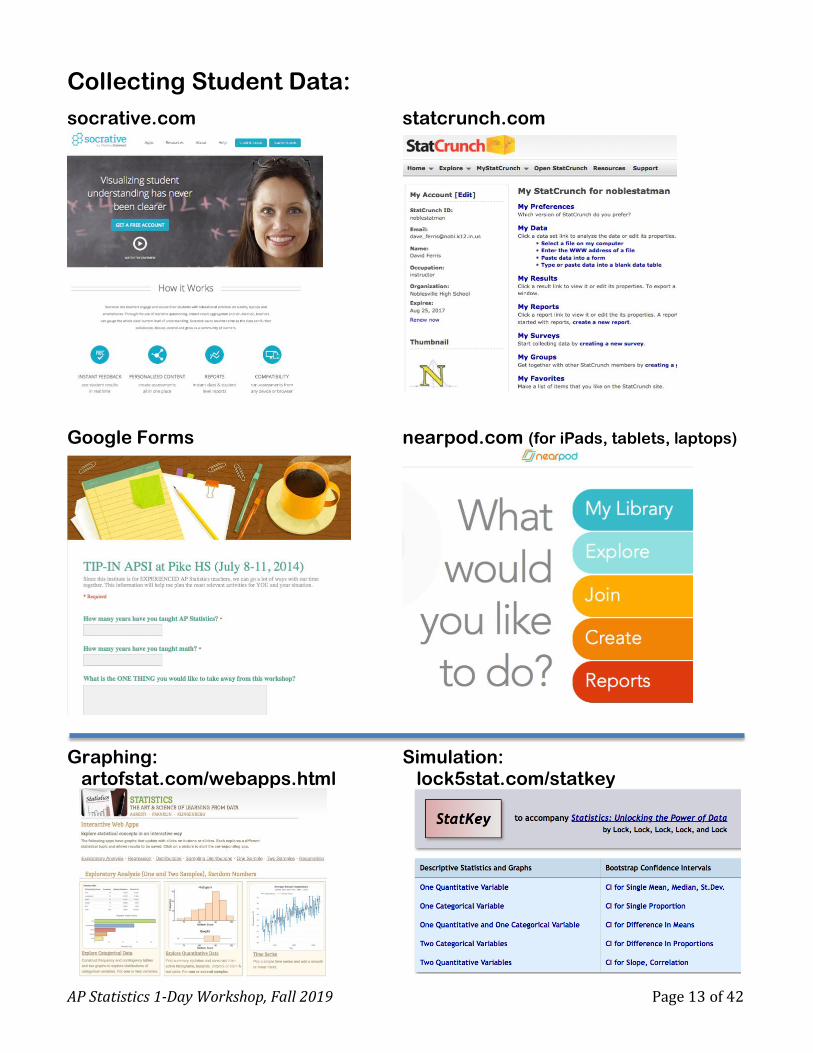
Collecting Student Data:
socrative.com statcrunch.com
Google Forms nearpod.com (for iPads, tablets, laptops)
Graphing: Simulation: artofstat.com/webapps.html lock5stat.com/statkey

AP Statistics 1-Day Workshop, Fall 2019 Page 14 of 42
Age Guessing Activity
1. Guess the ages of the following people, and put your guess in this column:
Name: Actual Age: Your Guess:
Barack Obama __________ __________
Harrison Ford __________ __________
Bill Gates __________ __________
Johnny Depp __________ __________
Bono __________ __________
Alex Trebek __________ __________
Oprah Winfrey __________ __________
Miley Cyrus __________ __________
Donald Trump __________ __________
J. K. Rowling __________ __________
Mick Jagger __________ __________
Mark Zuckerberg __________ __________
2. Put the actual ages of each person in the first column.
3. Type both lists into your calculator. (Actual ages in L1, your guesses in L2.)
4. Make a scatterplot for these two lists. (x-axis is L1, y-axis is L2)
5. Calculate r: __________
6. Describe below what you discovered about your age guesses:

AP Statistics 1-Day Workshop, Fall 2019 Page 15 of 42
Commonly Asked Regression Questions
(as seen on previous AP Statistics exams) 1. Describe the association in context. 2. Is a linear model appropriate to describe this relationship? Explain. 3. Write the equation for the linear model on this data. 4. Explain the meaning of the slope in this linear model 5. Explain the meaning of the y-intercept in this linear model 6. Find the value and explain the meaning of the correlation coefficient. 7. Find the value of and interpret r-squared 8. a. Using the linear model, predict _____________ when ____________ is ___________. b. Calculate and interpret the residual for this data point. 9. Comment on any outliers present. Fully describe their effect on analyses, if any. 10. Interpret regression and model information from a computer printout.

AP Statistics 1-Day Workshop, Fall 2019 Page 16 of 42
2016 AP Statistics Exam
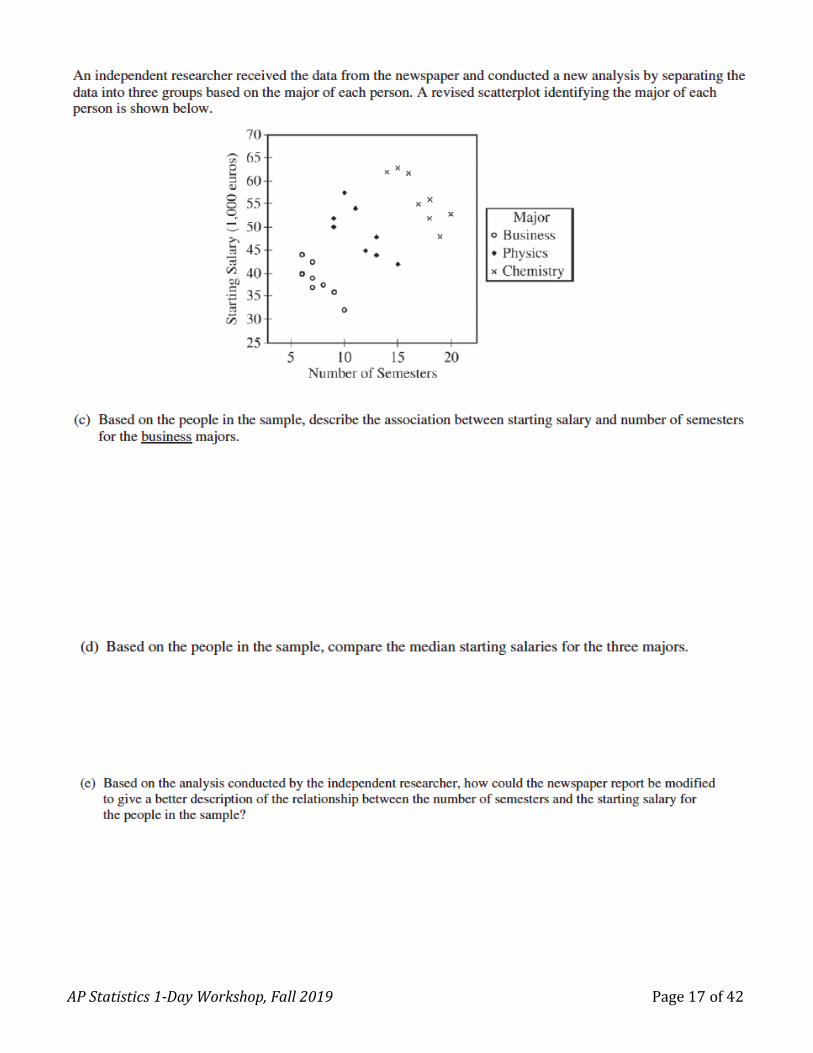
AP Statistics 1-Day Workshop, Fall 2019 Page 17 of 42

AP Statistics 1-Day Workshop, Fall 2019 Page 18 of 42
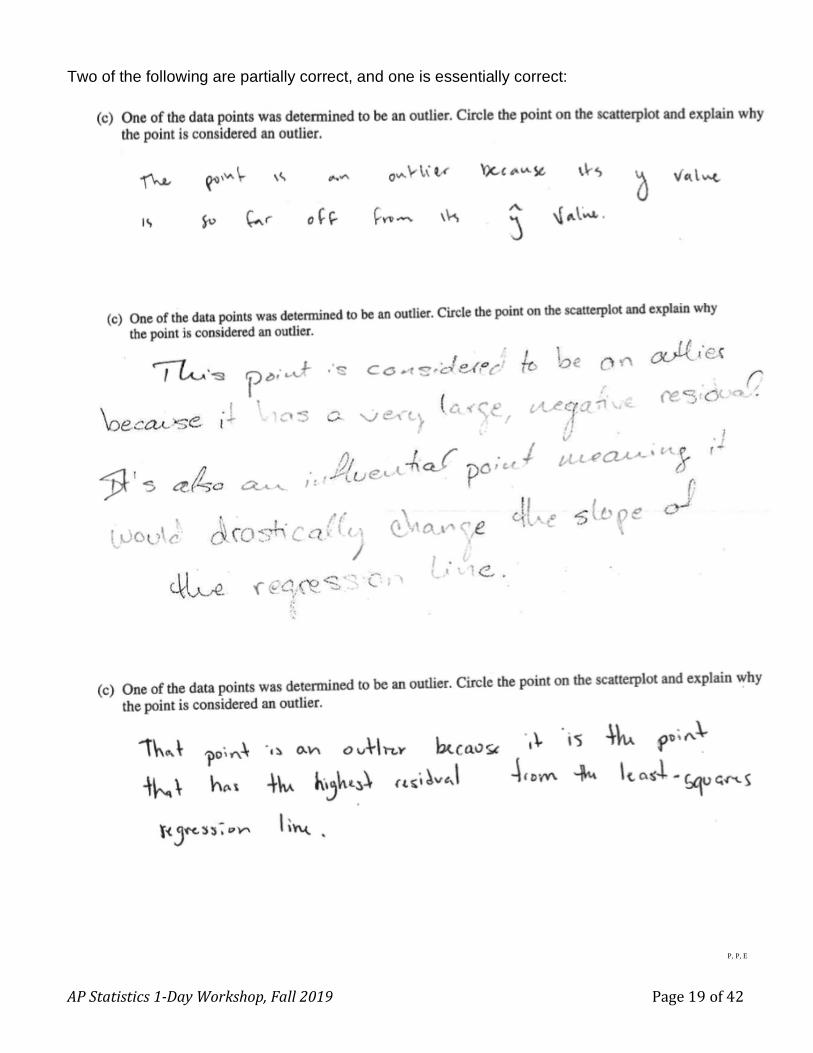
Communication nuance from the 2018 Exam. **Examine Part (c)…
1. The manager of a grocery store selected a random sample of 11 customers to investigate the
relationship between the number of customers in a checkout line and the time to finish checkout. As
soon as the selected customer entered the end of a checkout line, data were collected on the number of
customers in line who were in front of the selected customer and the time, in seconds, until the selected
customer was finished with the checkout. The data are shown in the following scatterplot along with
the corresponding least-squares regression line and computer output.
(a) Identify and interpret in context the estimate of the intercept for the least-squares regression line.
(b) Identify and interpret in context the coefficient of determination, r 2 .
(c) One of the data points was determined to be an outlier. Circle the point on the scatterplot and
explain why the point is considered an outlier.
AP Statistics 1-Day Workshop, Fall 2019 Page 19 of 42
Two of the following are partially correct, and one is essentially correct:
P, P, E

AP Statistics 1-Day Workshop, Fall 2019 Page 20 of 42
Outliers (Departures from Linearity) in the CED: ESSENTIAL KNOWLEDGE DAT-1.I.1 An outlier in regression is a point that does not follow the general trend shown in the rest of
the data and has a large residual when the Least Squares Regression Line (LSRL) is calculated. DAT-1.I.2 A high-leverage point in regression has a substantially larger or smaller x-value than the
other observations have. DAT-1.I.3 An influential point in regression is any point that, if removed, changes the relationship
substantially. Examples include much different slope, y-intercept, and/or correlation. Outliers and high leverage points are often influential.
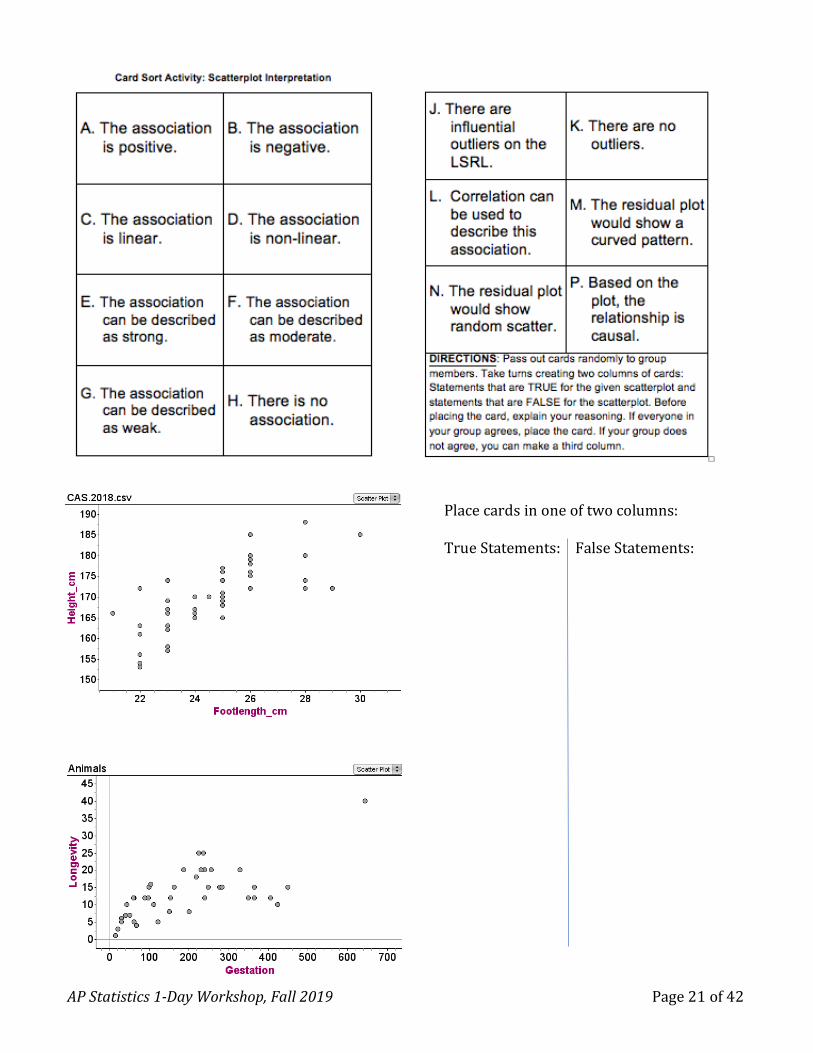
AP Statistics 1-Day Workshop, Fall 2019 Page 21 of 42
Place cards in one of two columns: True Statements: False Statements:
AP Statistics 1-Day Workshop, Fall 2019 Page 22 of 42
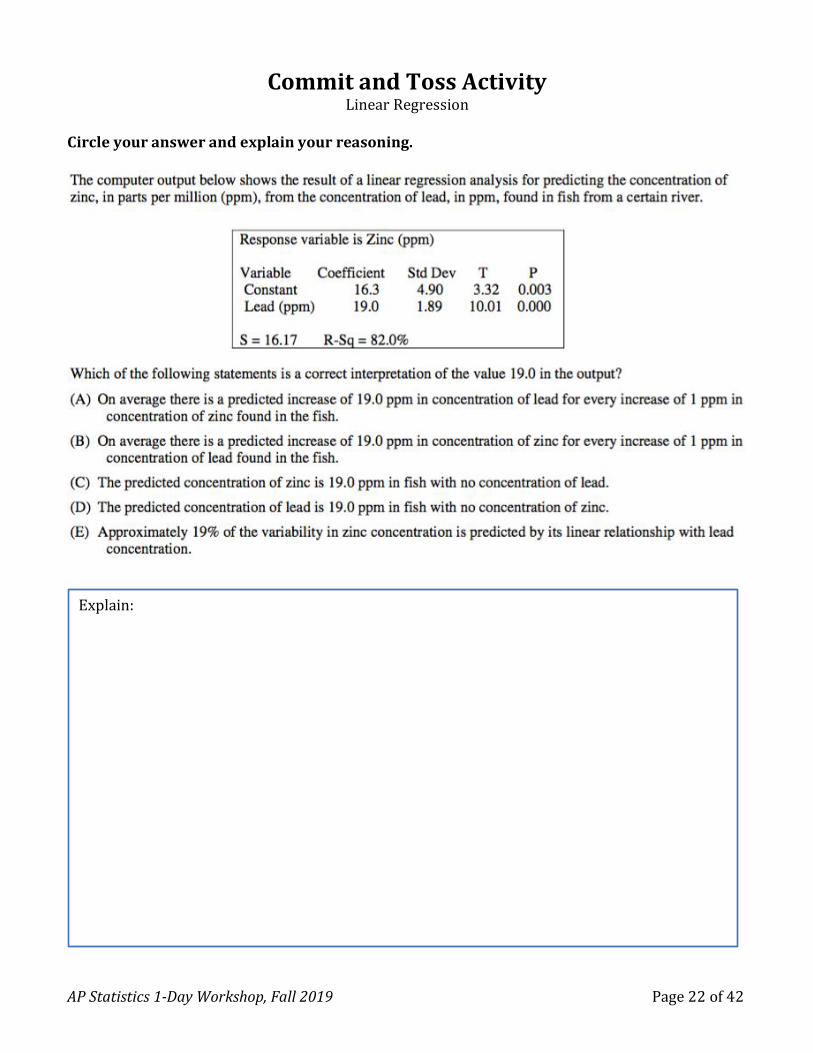
Commit and Toss Activity Linear Regression
Circle your answer and explain your reasoning.
Explain:

AP Statistics 1-Day Workshop, Fall 2019 Page 23 of 42
Sampling Activity
AP Statistics 1-Day Workshop, Fall 2019 Page 24 of 42
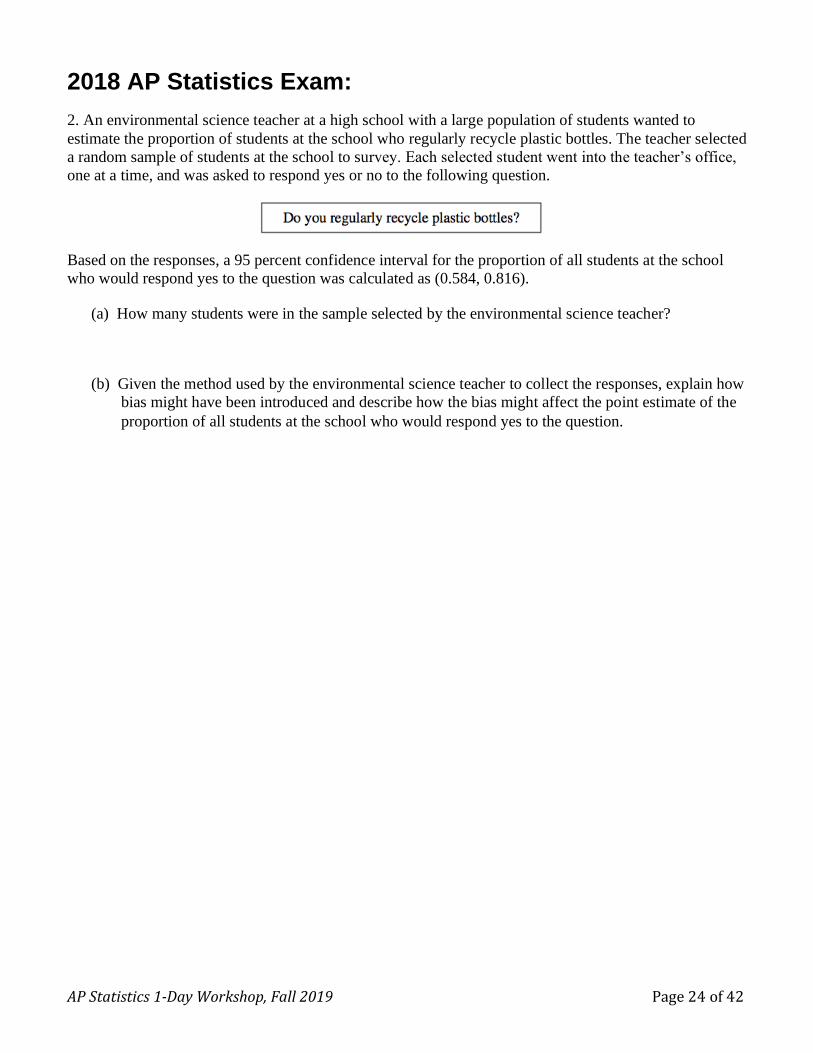
2018 AP Statistics Exam:
2. An environmental science teacher at a high school with a large population of students wanted to
estimate the proportion of students at the school who regularly recycle plastic bottles. The teacher selected
a random sample of students at the school to survey. Each selected student went into the teacher’s office,
one at a time, and was asked to respond yes or no to the following question.
Based on the responses, a 95 percent confidence interval for the proportion of all students at the school
who would respond yes to the question was calculated as (0.584, 0.816).
(a) How many students were in the sample selected by the environmental science teacher?
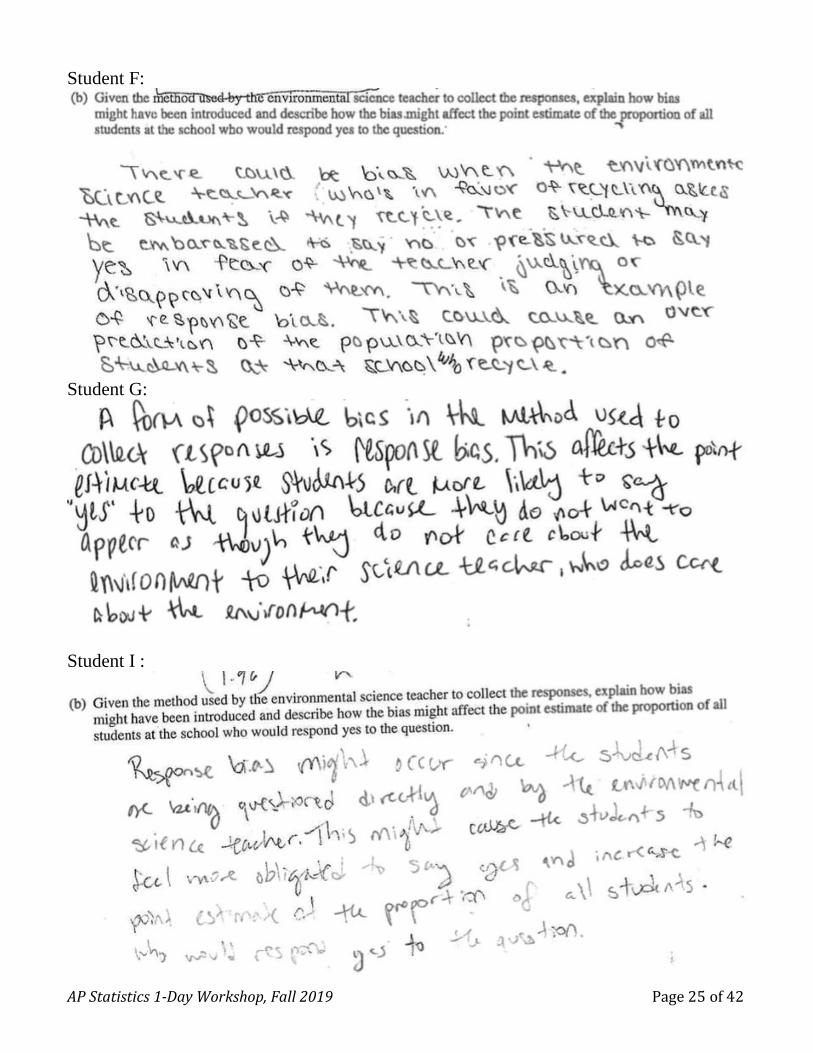
(b) Given the method used by the environmental science teacher to collect the responses, explain how
bias might have been introduced and describe how the bias might affect the point estimate of the
proportion of all students at the school who would respond yes to the question.
AP Statistics 1-Day Workshop, Fall 2019 Page 25 of 42
Student F:
Student G:
Student I :
AP Statistics 1-Day Workshop, Fall 2019 Page 26 of 42
Probability:
1. BIG vs. small Game:
1. Two players, “BIG” and “small,” play a game with a single die.
2. It does not matter who rolls the single die each time (players could alternate).
3. If a 5 or 6 is rolled on the die, “BIG” receives that number of points. If 1, 2, 3, or 4 is
rolled, “small” gets that number of points.
4. The first player to 20 points wins the game. Play 10 games and record the results.
5. Is this game fair? If not, who has the advantage? Explain.
2. Casino Match War Activity:
Each student has a deck. Shuffle each deck. Students deal--simultaneously--one card at a
time onto two piles. What is the probability that there will be an EXACT (suit and value)
match by the time they reach the 52nd pair of dealt cards?
3. Flip a coin 30 times and record the result. Let “Heads” represent one step forward and “Tails” one step backwards. The class stands shoulder to shoulder, facing the same direction. Each time the teacher claps and calls out a step, the class follows their “flip-determined steps.” After 30 steps, what will the class look like? After 50 steps? 100? 100,000? 1,000,000,000?
4. “Win-a-bag-o:” Each student writes down their prediction for ten coin flips. Trade papers.
Teacher flips a fair coin. If a student accurately predicts the ten flips, they win a large bag of candy to be enjoyed the rest of the period (or shared, if they choose). If no one wins (Ha!), try this variation: Have each student create five prediction lists. Trade papers. Teacher flips a coin ten times. See who wins. If no one still has won the candy (snicker…), try this: The entire class collaborates on the first flip only. Then those who predicted the first flip correctly collaborate on the second flip. Those that predict correctly collaborate on the third flip, etc., until someone predicts all 10 flips correctly.
5. If no one STILL has not won the bag of candy, you could give it to the winner of the Lowest
Number Wins game. The instructions are simple: "I want everyone to write down a whole number and their name on a slip of paper and hand it to me. The person who writes down the lowest number that nobody else wrote down wins."
5. Roll two standard dice. Let X = the roll on which you get “doubles.” 1. What is E(X)? (“On which roll will you typically get the first doubles?”)
2. On which roll is it most likely to get doubles? The 3rd? The 6th?
3. WITP that X = 3? (You get your first double on the 3rd roll.)
4. WITPO getting doubles BY the 3rd roll?
5. P(X > 3 rolls)
6. Simulate this situation.

AP Statistics 1-Day Workshop, Fall 2019 Page 27 of 42
2018 AP Statistics Exam:
Very nice probability problem. “Students earning 3s could answer part of the question, students earning 4
could answer most, and students earning 5s, all of it.” –Trevor Packer
3. Approximately 3.5 percent of all children born in a certain region are from multiple births (that is,
twins, triplets, etc.). Of the children born in the region who are from multiple births, 22 percent are left-
handed. Of the children born in the region who are from single births, 11 percent are left-handed.
(a) What is the probability that a randomly selected child born in the region is left-handed?
(b) What is the probability that a randomly selected child born in the region is a child from a multiple
birth, given that the child selected is left-handed?
(c) A random sample of 20 children born in the region will be selected. What is the probability that the
sample will have at least 3 children who are left-handed?
AP Statistics 1-Day Workshop, Fall 2019 Page 28 of 42
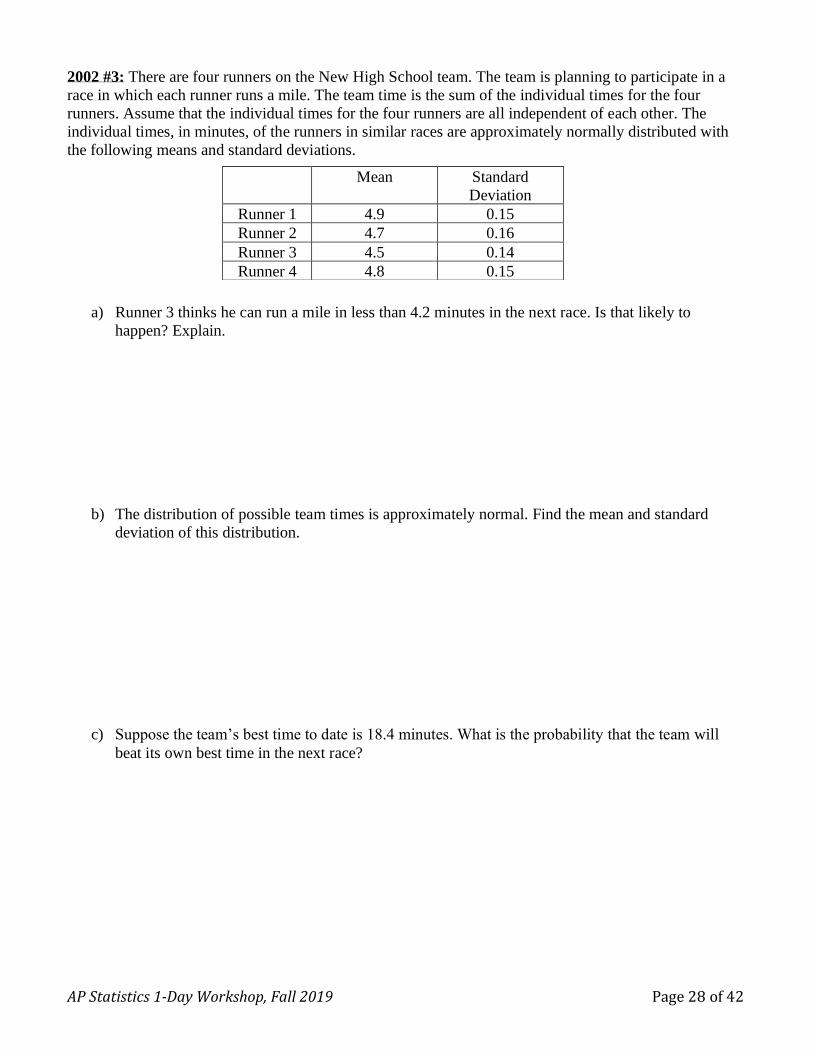
2002 #3: There are four runners on the New High School team. The team is planning to participate in a
race in which each runner runs a mile. The team time is the sum of the individual times for the four
runners. Assume that the individual times for the four runners are all independent of each other. The
individual times, in minutes, of the runners in similar races are approximately normally distributed with
the following means and standard deviations.
a) Runner 3 thinks he can run a mile in less than 4.2 minutes in the next race. Is that likely to
happen? Explain.
b) The distribution of possible team times is approximately normal. Find the mean and standard
deviation of this distribution.
c) Suppose the team’s best time to date is 18.4 minutes. What is the probability that the team will
beat its own best time in the next race?
Mean Standard
Deviation
Runner 1 4.9 0.15
Runner 2 4.7 0.16
Runner 3 4.5 0.14
Runner 4 4.8 0.15

AP Statistics 1-Day Workshop, Fall 2019 Page 29 of 42
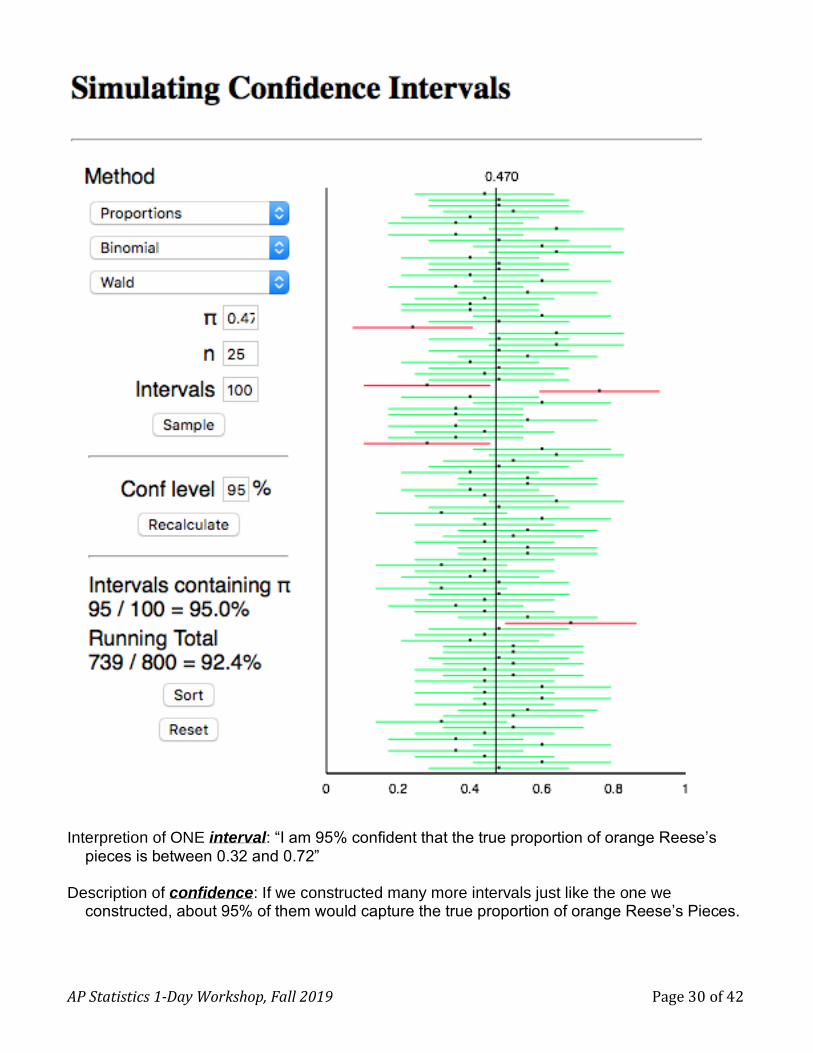
Reese’s Pieces Applet: Sampling Distribution of Can be used in conjunction with Activity 13-1 in Workshop Statistics: Discovery with Data
Allan J. Rossman and Beth L. Chance
According to mathematicians who studied this a bit more deeply, the mean of a sampling distribution of sample proportions (i.e. the distribution of ’s) is always _____ (where
_____ is the TRUE population proportion.) The standard deviation of this sampling distribution of ’s is ____________.
AP Statistics 1-Day Workshop, Fall 2019 Page 30 of 42
Interpretion of ONE interval: “I am 95% confident that the true proportion of orange Reese’s
pieces is between 0.32 and 0.72” Description of confidence: If we constructed many more intervals just like the one we
constructed, about 95% of them would capture the true proportion of orange Reese’s Pieces.

AP Statistics 1-Day Workshop, Fall 2019 Page 31 of 42
2015 #2: To increase business, the owner of a restaurant is running a promotion in which a customer’s bill can be randomly selected to receive a discount. When a customer’s bill is printed, a program in the cash register randomly determines whether the customer will receive a discount on the bill. The program was written to generate a discount with a probability of 0.2, that is, giving 20 percent of the bills a discount in the long run. However, the owner is concerned that the program has a mistake that results in the program not generating the intended long-run proportion of 0.2.
The owner selected a random sample of bills and found that only 15 percent of them received discounts. A
confidence interval for p, the proportion of bills that will receive a discount in the long run, is 0.15 ± 0.06. All
conditions for inference were met.
(a) Consider the confidence interval 0.15 ± 0.06.
(i) Does the confidence interval provide convincing statistical evidence that the program is not working as
intended? Justify your answer.
(ii) Does the confidence interval provide convincing statistical evidence that the program generates the
discount with a probability of 0.2 ? Justify your answer.
A second random sample of bills was taken that was four times the size of the original sample. In the second
sample 15 percent of the bills received the discount.
(b) Determine the value of the margin of error based on the second sample of bills that would be used to
compute an interval for p with the same confidence level as that of the original interval.
(c) Based on the margin of error in part (b) that was obtained from the second sample, what do you conclude
about whether the program is working as intended? Justify your answer.

AP Statistics 1-Day Workshop, Fall 2019 Page 32 of 42
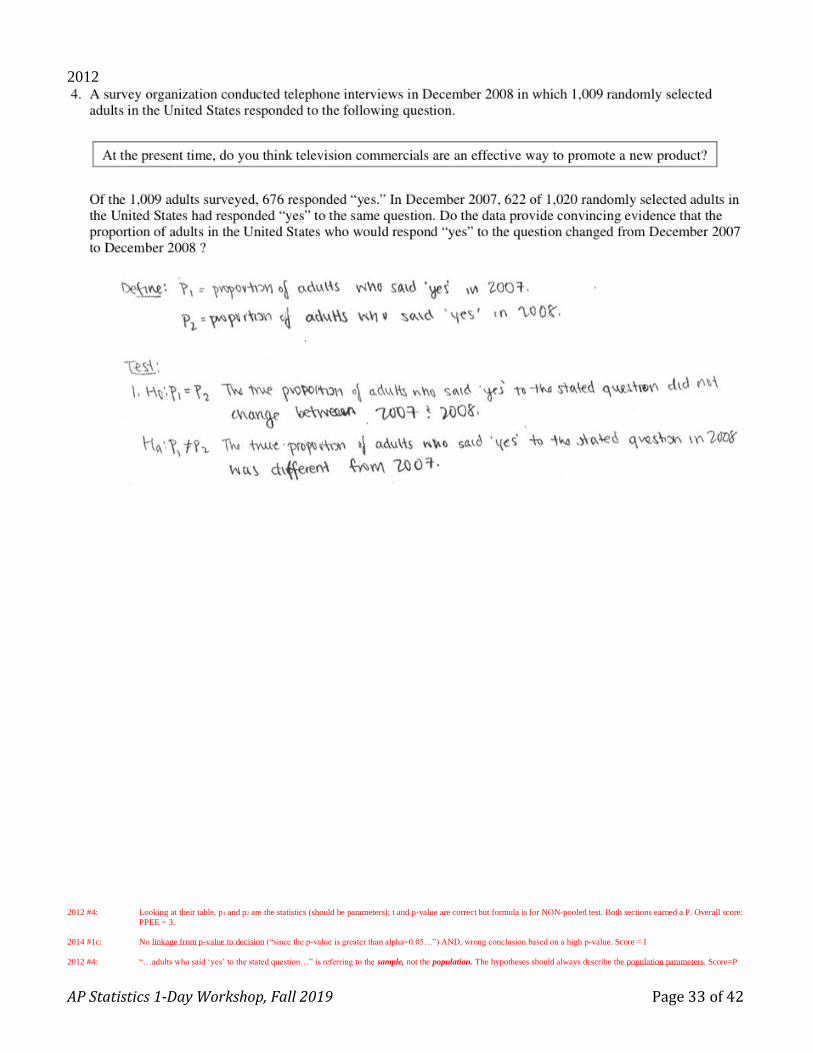
Hypothesis Test Student Samples: 2012 #4
2014 #1
AP Statistics 1-Day Workshop, Fall 2019 Page 33 of 42
2012
2012 #4: Looking at their table, p1 and p2 are the statistics (should be parameters); t and p-value are correct but formula is for NON-pooled test. Both sections earned a P. Overall score:
PPEE = 3.
2014 #1c: No linkage from p-value to decision (“since the p-value is greater than alpha=0.05…”) AND, wrong conclusion based on a high p-value. Score = I
2012 #4: “…adults who said ‘yes’ to the stated question…” is referring to the sample, not the population. The hypotheses should always describe the population parameters. Score=P

AP Statistics 1-Day Workshop, Fall 2019 Page 34 of 42
Errors and Power Practice Problem: (from BVD, 3e, p.503, #34)
A potter has a 40% breakage rate during kiln firing, so she buys more expensive clay. She fires 10 pieces and will decide to use the new clay if at most one of them
breaks.
a) Suppose the new clay is no better. What is the probability she is convinced to switch?
b) Suppose the new clay can reduce breakage to 20%. WITP that her test will not detect the improvement?
c) How can she improve the power of her test?
Desmos Demo for 2018 #6: desmos.com/calculator/onat3s3fyd
AP Statistics 1-Day Workshop, Fall 2019 Page 35 of 42
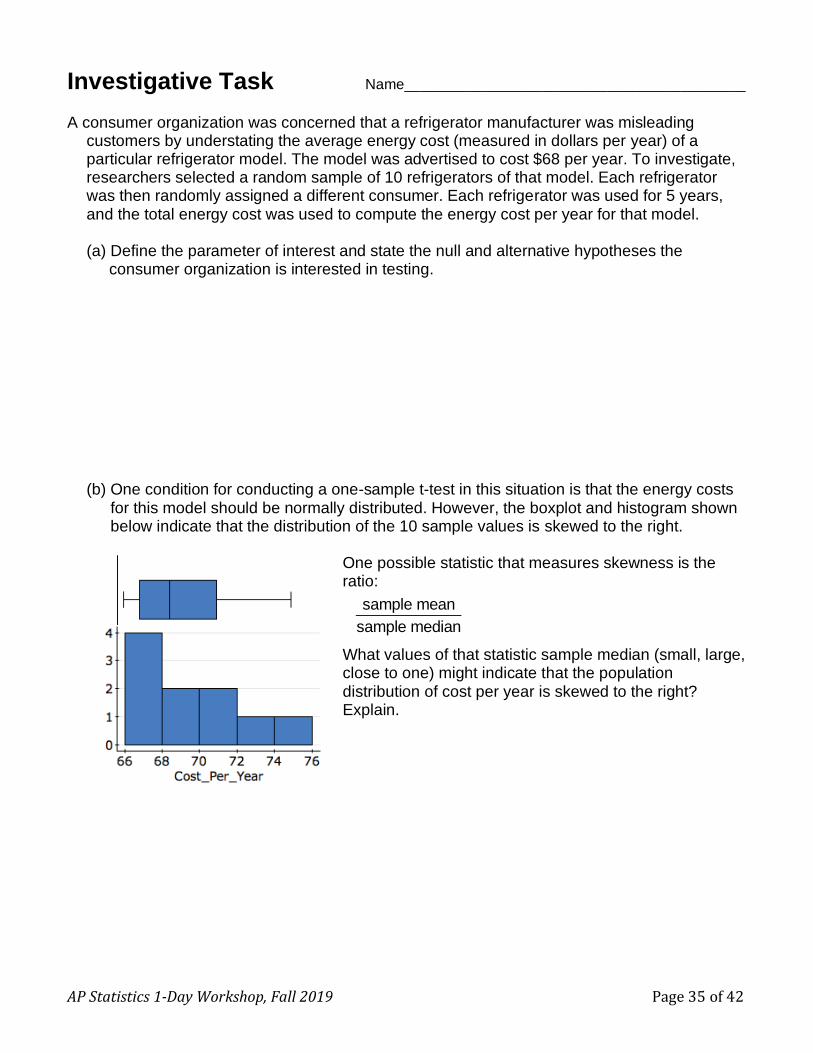
Investigative Task Name__________________________________________
A consumer organization was concerned that a refrigerator manufacturer was misleading
customers by understating the average energy cost (measured in dollars per year) of a particular refrigerator model. The model was advertised to cost $68 per year. To investigate, researchers selected a random sample of 10 refrigerators of that model. Each refrigerator was then randomly assigned a different consumer. Each refrigerator was used for 5 years, and the total energy cost was used to compute the energy cost per year for that model.
(a) Define the parameter of interest and state the null and alternative hypotheses the
consumer organization is interested in testing.
(b) One condition for conducting a one-sample t-test in this situation is that the energy costs for this model should be normally distributed. However, the boxplot and histogram shown below indicate that the distribution of the 10 sample values is skewed to the right.
One possible statistic that measures skewness is the ratio: What values of that statistic sample median (small, large, close to one) might indicate that the population distribution of cost per year is skewed to the right? Explain.
sample mean
sample median
AP Statistics 1-Day Workshop, Fall 2019 Page 36 of 42
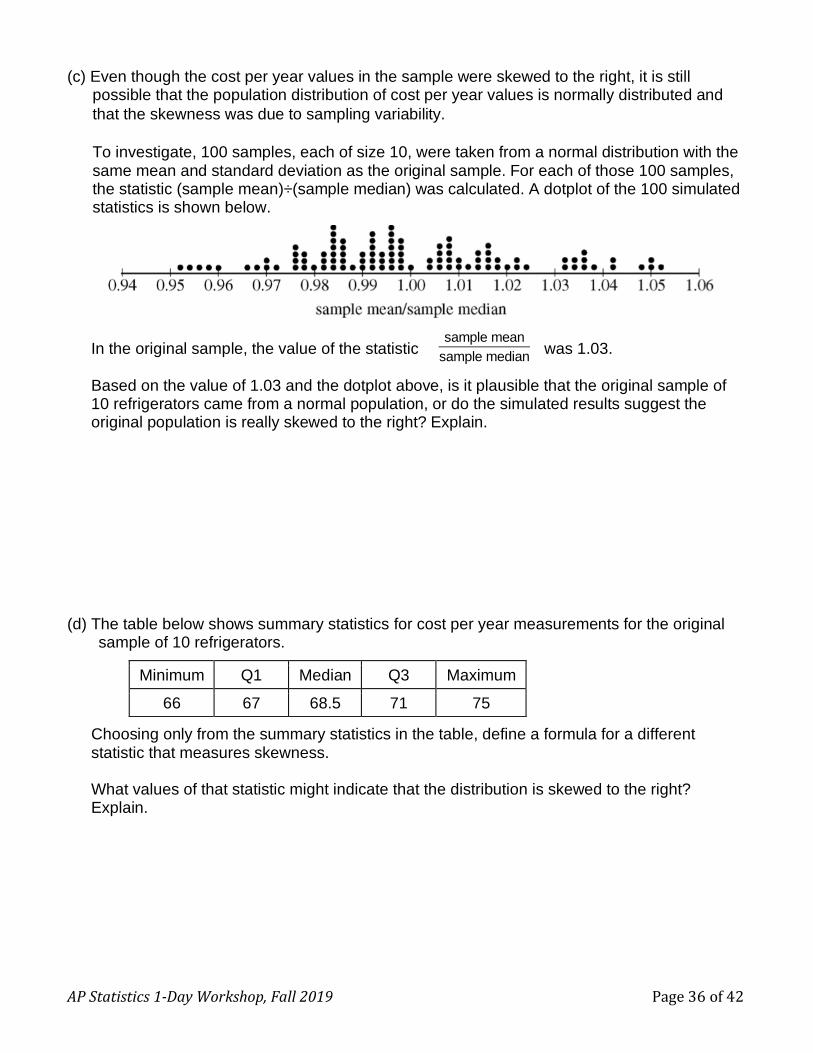
(c) Even though the cost per year values in the sample were skewed to the right, it is still possible that the population distribution of cost per year values is normally distributed and
that the skewness was due to sampling variability.
To investigate, 100 samples, each of size 10, were taken from a normal distribution with the same mean and standard deviation as the original sample. For each of those 100 samples, the statistic (sample mean)÷(sample median) was calculated. A dotplot of the 100 simulated statistics is shown below.
In the original sample, the value of the statistic was 1.03. Based on the value of 1.03 and the dotplot above, is it plausible that the original sample of 10 refrigerators came from a normal population, or do the simulated results suggest the original population is really skewed to the right? Explain.
(d) The table below shows summary statistics for cost per year measurements for the original
sample of 10 refrigerators.
Choosing only from the summary statistics in the table, define a formula for a different statistic that measures skewness. What values of that statistic might indicate that the distribution is skewed to the right? Explain.
Minimum Q1 Median Q3 Maximum
66 67 68.5 71 75
sample mean
sample median

AP Statistics 1-Day Workshop, Fall 2019 Page 37 of 42
Solutions:
AP Statistics Exam General Info: 40MC, 6FR, 50%, 90min, #6, 20-25min, ¼, 1/8, big topics, new Scout/scan/rank, easiest, stretch, calmly, think, ANY
FRAPPY! Student Samples Commentary Comparing Distributions: 2015 #1
#1: Two Corporations (Comparing Boxplots, Interpreting in Context)
Comments from John Bennett: One issue that seemed to be repeated over and over was a "shoot oneself in the foot" syndrome. On both parts, students would often list several different statistics in sort of a "shotgun" approach, and if any of those sited statistics was wrong, we were instructed to drop that component one letter (from an E to a P, or P to an I). Another problem was correctly comparing the boxplots in A. Students often just listed the quartiles, but didn't compare them (using larger than, less than, etc.) when appropriate. This would NOT get them credit for the individual components for part A. Many students used the mean to comment on center but mean can't be determined from a box plot. Also, context needs to be about the DATA. Students often mentioned the Corporations, but never applied context to the data (salaries, dollars, etc) and lost credit.
C: EP(√√√X)=3 No explanation of relevance (“earn more money…”) on Part b-ii. F: IE=2 The “$” is the only part scored correct on Part a (context). There are no explicit
comparisons of center, spread or outliers. (Complete shape information cannot be determined from a boxplot, so any mention of shape is disregarded.)
Video comments: http://www.youtube.com/watch?v=YQ9kPdAonpU
The mean score on this problem was 2.24 (out of 4)
Floyd Bullard’s Beads Activity (for showing power and errors) “I hand each student (or group) an opaque bag of 200 colored beads, of which the proportion of blue
beads is between 0.00 and 1.00, and they range by 0.05. (So there are 21 bags.) A card inside each bag tells what fraction of the beads are blue, but they aren't to take the card out and look at it, and they are not to look in the bags.
Then each student/group is to draw 20 beads at random and, using those beads, test the null hypothesis that their bag contains 50% blues against the null hypothesis that it doesn't. They don't have to do a write-up or anything, or check conditions, etc.; I actually want this part go to go pretty fast, so they're encouraged to just use their calculator to perform the test. I ask them to write down whether their test rejected the null hypothesis at the alpha=0.05 level.
Then they return their beads to their bags, and take another random sample, and do the same: write down whether the test rejects HO or not. And they do this over and over again until they've collected 15 samples.
Analysis: several possibilities. Write down on the board how many times each student/group rejected HO and how many times they did not reject HO. Reveal the actual % blue in each bag , and discuss what type of errors were made as well as the frequency of those errors. Then discuss power. Power should be higher for bags where the null proportion was farther away from the actual proportion."
AP Statistics 1-Day Workshop, Fall 2019 Page 38 of 42
Age Guessing: Barack Obama 8/4/61
Harrison Ford 7/13/42
Bill Gates 10/28/55
Johnny Depp 6/9/63
Bono 5/10/60
Alex Trebek 7/22/40
Oprah Winfrey 1/29/54
Miley Cyrus 11/23/92
Donald Trump 6/14/46
J. K. Rowling 7/31/65
Mick Jagger 7/26/43
Mark Zuckerberg 5/14/84
Pottery Problem Answers: a) P(X=0) + P(X=1) = 0.0464 b) P(X≥2) = 0.6242 c) Increase number of pieces fired or
lower her standard of “proof” (saying 0, 1, or 2 broken will convince her the new clay is better).
Tommy John and P-Values (from the book, What is a P-value, Anyway?)
In a scientific paper describing a clinical trial
comparing a new pain drug with a placebo, the
authors wrote something like this: “Although
there was no difference in baseline age
between the groups (p = 0.458), controls were
significantly more likely to be male (p =
0.000).”
This statement is worse than Tommy John’s
worst day because there are actually four errors
in this sentence (or maybe even 4½). See if you
can find them. (answers on next page)
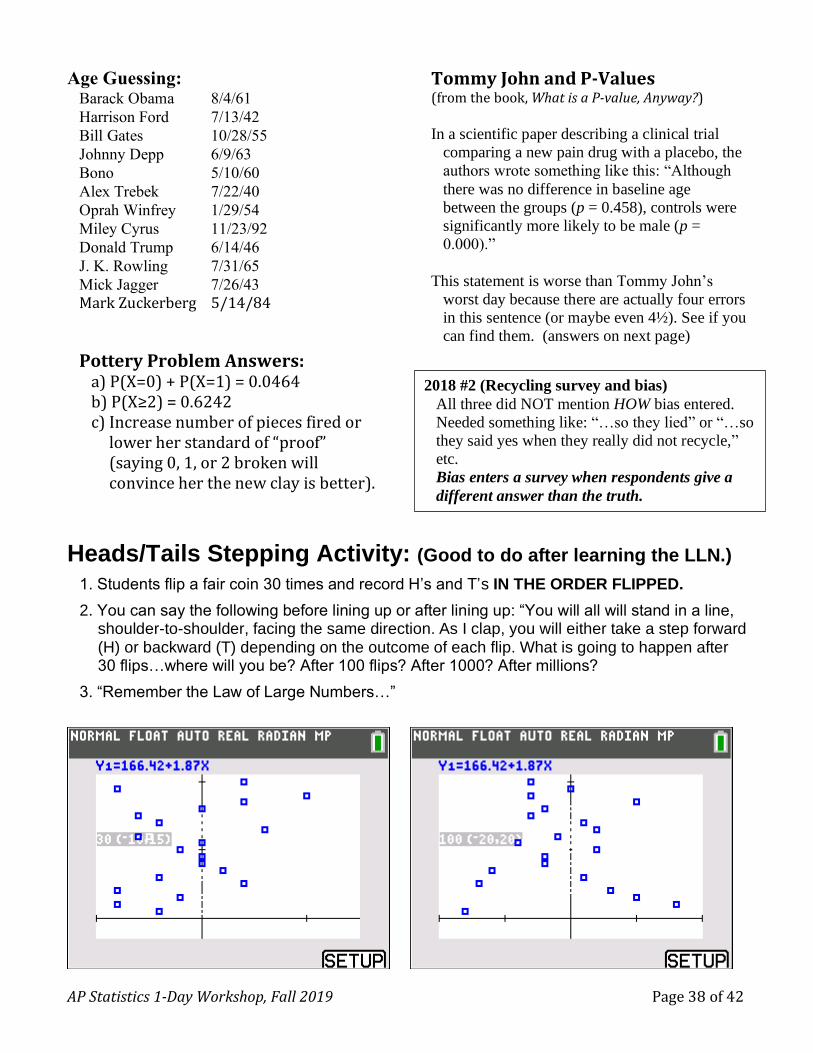
Heads/Tails Stepping Activity: (Good to do after learning the LLN.)
1. Students flip a fair coin 30 times and record H’s and T’s IN THE ORDER FLIPPED.
2. You can say the following before lining up or after lining up: “You will all will stand in a line, shoulder-to-shoulder, facing the same direction. As I clap, you will either take a step forward (H) or backward (T) depending on the outcome of each flip. What is going to happen after 30 flips…where will you be? After 100 flips? After 1000? After millions?
3. “Remember the Law of Large Numbers…”
2018 #2 (Recycling survey and bias)
All three did NOT mention HOW bias entered.
Needed something like: “…so they lied” or “…so
they said yes when they really did not recycle,”
etc.
Bias enters a survey when respondents give a
different answer than the truth.

AP Statistics 1-Day Workshop, Fall 2019 Page 39 of 42
Solution to Investigative Task:
≈ 2009 #6: (data set was changed to refrigerators instead of mpg of cars) Part (a): The parameter of interest is population mean cost per year (in dollars) of a particular model
of refrigerator. H0: $68
HA: $68
Part (b): If the distribution is right-skewed, one would expect the mean to be greater than the median.
Therefore the ratio should be large (greater than 1).
Part (c): Because we are testing for right-skewness, the estimated p-value will be the proportion of the simulated statistics that are greater than or equal to the observed value of 1.03. The dotplot shows that 14 of the 100 values are more than 1.03. Because this simulated p-value (0.14) is larger than any reasonable significance level, we do not have convincing evidence that the original population is skewed to the right and conclude that it is plausible that the original sample came from a normal population. Part (d):
One possible statistic is . If the distribution is right-skewed, one would expect
the distance from the median to the maximum to be larger than the distance from the median to the minimum; thus the ratio should be greater than one. Answers to Tommy John problem:
1. Accepting the null hypothesis 2. Giving a p-value for baseline differences between random groups (p-values test hypotheses). 3. Inappropriate levels of precision (what do the 5 and 8 tell us?) 4. Reporting a p-value = 0. 4½: Why were they measuring baseline ages anyway? All patients will be in the trial over the same time period.
Mean scores on recent Investigative Tasks (2013-2018): 2.14, 1.29, 1.08, 1.61, 0.99, 0.35

AP Statistics 1-Day Workshop, Fall 2019 Page 40 of 42
2019 AP Statistics Exam Commentary: https://www.totalregistration.net/AP-Exam-Registration-Service/AP-Exam-Score-Distributions.php?year=2019
Exam Score: 5 4 3 2 1
Statistics 14.5% 18.0% 26.7% 19.7% 21.1%
• In AP Statistics this year, there was an increase in high performance and a significant decline in low performance, even as teachers expanded access to 4,000 more students. The result: more 5s, fewer 1s; in the middle, increases in 2s & 3s, decreases in 4s.
• 10 students so far this year, out of ~225,000 worldwide, achieved all 100/100 points possible on this year’s exam. (Last year: 1 student got a perfect score.)
• Multiple-choice: as is always the case, students scored much higher on questions about sampling & experimentation than about probability & simulation and statistical inference; to increase 3s,4s,5s, the free, new resources will provide help with these topics.
• Free-response questions: students generally scored best on Q2 (sampling & experimentation): https://apstudents.collegeboard.org/sites/default/files/2019-05/ap19-frq-statistics.pdf
• AP Statistics Q3 (probability & simulation) can be used to predict your score: it’s a tough 3-part question, so generally: students who can answer 1 part are earning a 3, students answering 2 parts are earning a 4, and students answering all parts correctly are earning a 5.
• AP Statistics Q6 (statistical inference) is the most difficult on the test, designed to identify A and B students in college; students who can answer part a are often receiving a 4; students who can answer more than part a are
often receiving a 5.
AP Statistics 1-Day Workshop, Fall 2019 Page 41 of 42
Mr. Ferris’s Lesson Plan Cycle: _______ Topic #:________ Section:___________ Title:__________________________
Enduring Understandings:
Learning Objectives:
Hook: Plans:
Practice:

AP Statistics 1-Day Workshop, Fall 2019 Page 42 of 42
Checkpoint 10Where do the colors of the Course Skills show up in the Unit at a Glance?
Checkpoint 1What do the three‐letter abbreviations above each colored box represent in the Course at a Glance?
Checkpoint 3Which unit has the most topics?
Which unit has the least?
Checkpoint 4What is the information at the bottom
of each column telling you?
Checkpoint 2How many units are there for the entire year? Why do you think they are sequenced in this order?
Checkpoint 8Under each unit title, there are percentages: What are they percentages of?
Checkpoint 6What is the range of class periods shown for Unit 5? Why do you think these are given as a range?
Checkpoint 9What is the relationship between the Unit at a Glance table and the Course at a Glance?
Checkpoint 5What do you think is measured on the Personal Progress Checks (PPC)?
Checkpoint 7How is the spiraling of skills displayed across the units?