Embed Size (px)
Citation preview
AP STATISTICS SUMMER ASSIGNMENT 2016 EXPLORING AND UNDERSTANDING DATA
TEXTBOOK: STATS, MODELING THE WORLD, 3RD EDITION CALCULATOR: TI-NSPIRE CX-CAS CLASS BINDER RECOMMENDED FOR OUTLINES AND ASSIGNMENTS
Welcome to AP Statistics! Statistics is a course that is required of college majors including health sciences, social sciences, economics, business, and criminal justice, to name a few. It is different than any other math class you have taken thus far. It is an applied math with its own set of terminology, symbols, skills, and concepts. It involves reading comprehension skills, along with mathematical, verbal, and writing skills. You will learn to collect and analyze data, think critically, and make well-substantiated conclusions supported by appropriate calculations and visuals. As you think of your future, I would like for you to consider looking at The American Statistics Association, Career Center @ http://www.amstat.org/careers/whatisstatistics.cfm.
~~~~~~~~~~~~~~~~~~~~~~~~~~~~~~~~~~~~~~~~~~~~~~~~~~~~~~~~~~~~
The summer packet is an extensive assignment and should not be left for the last few days of summer as the reading, outlines, vocabulary and exercises are time-consuming.
• You will be expected to read the chapters listed, including Examples, Math Boxes, TI Tips, Just Checking, What Can Go Wrong, Reality Checks, What Have We Learned, and Skills provided in each chapter of the Statistics textbook.
• If you do not have the physical textbook, links to the chapter pdfs have been provided. **If you are an International student, you may want to download these pdfs to a flash-drive and/or computer before you return home.
• Fill out the attached Chapter Outlines and Write and Define all Vocabulary
• An accompanying website with extra notes and videos is provided to assist you in understanding the basics of data.
• Become familiar with the Statistics function on your TI-Inspire CX-CAS (There are useful videos on Youtube)
• Complete the exercises attached
This packet is DUE the FIRST AP Statistics class. It will be graded based on 100 points and will count towards the first quarter.
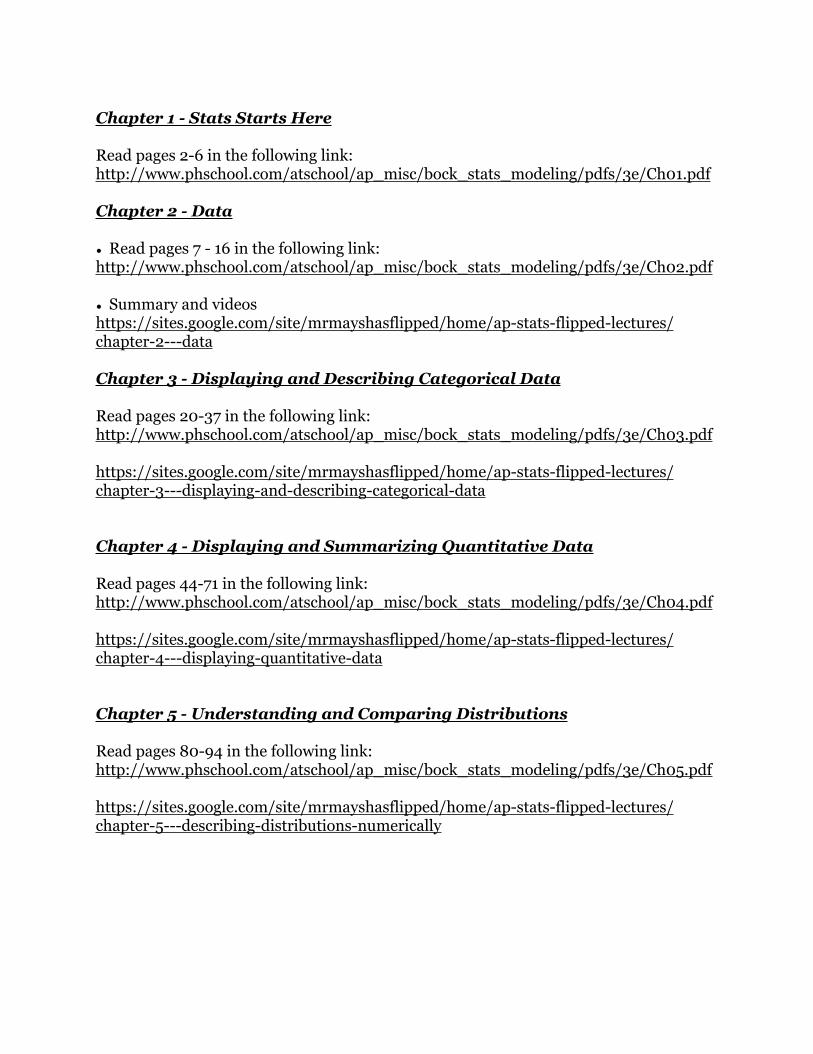
Chapter 1 - Stats Starts Here
Read pages 2-6 in the following link: http://www.phschool.com/atschool/ap_misc/bock_stats_modeling/pdfs/3e/Ch01.pdf
Chapter 2 - Data
• Read pages 7 - 16 in the following link: http://www.phschool.com/atschool/ap_misc/bock_stats_modeling/pdfs/3e/Ch02.pdf
• Summary and videos https://sites.google.com/site/mrmayshasflipped/home/ap-stats-flipped-lectures/chapter-2---data
Chapter 3 - Displaying and Describing Categorical Data
Read pages 20-37 in the following link: http://www.phschool.com/atschool/ap_misc/bock_stats_modeling/pdfs/3e/Ch03.pdf
https://sites.google.com/site/mrmayshasflipped/home/ap-stats-flipped-lectures/chapter-3---displaying-and-describing-categorical-data
Chapter 4 - Displaying and Summarizing Quantitative Data
Read pages 44-71 in the following link: http://www.phschool.com/atschool/ap_misc/bock_stats_modeling/pdfs/3e/Ch04.pdf
https://sites.google.com/site/mrmayshasflipped/home/ap-stats-flipped-lectures/chapter-4---displaying-quantitative-data
Chapter 5 - Understanding and Comparing Distributions
Read pages 80-94 in the following link: http://www.phschool.com/atschool/ap_misc/bock_stats_modeling/pdfs/3e/Ch05.pdf
https://sites.google.com/site/mrmayshasflipped/home/ap-stats-flipped-lectures/chapter-5---describing-distributions-numerically
Stats: Modeling the World - Bock, Velleman, & DeVeaux
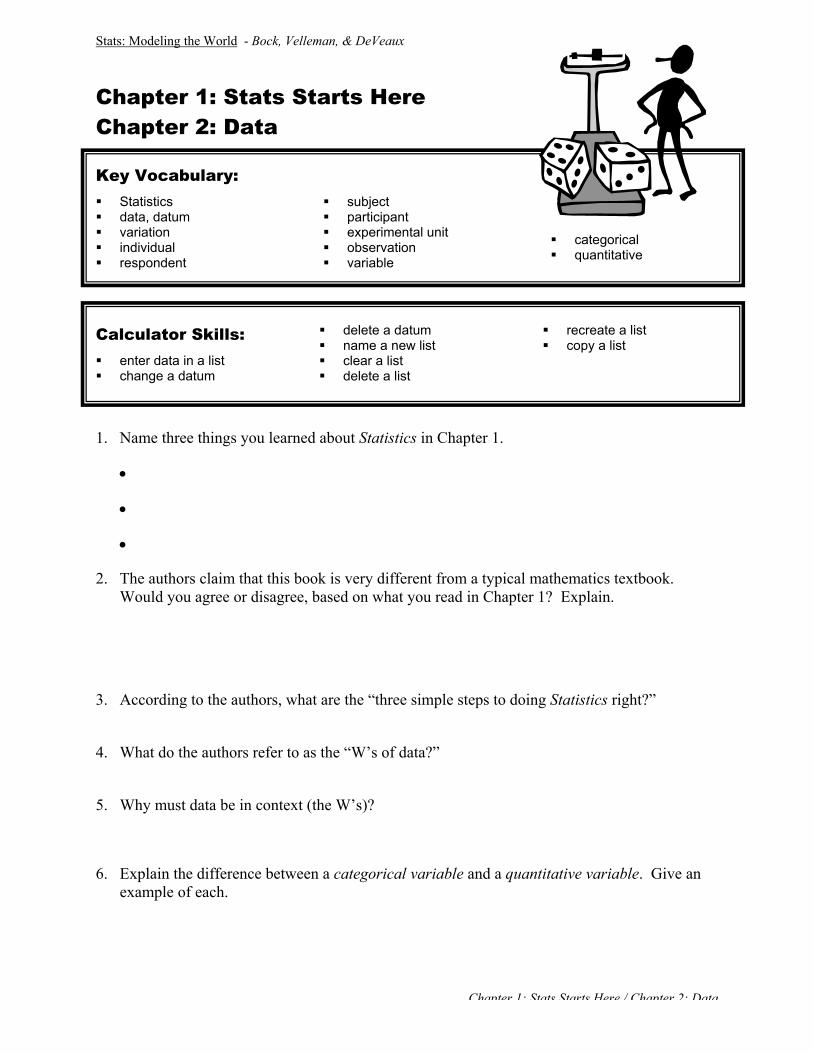
Chapter 1: Stats Starts Here Chapter 2: Data
Key Vocabulary: � Statistics � data, datum � variation � individual � respondent
� subject � participant � experimental unit � observation � variable
� categorical � quantitative
Calculator Skills: � enter data in a list � change a datum
� delete a datum � name a new list � clear a list � delete a list
� recreate a list � copy a list
1. Name three things you learned about Statistics in Chapter 1.
�
�
�
2. The authors claim that this book is very different from a typical mathematics textbook. Would you agree or disagree, based on what you read in Chapter 1? Explain.
3. According to the authors, what are the “three simple steps to doing Statistics right?”
4. What do the authors refer to as the “W’s of data?”
5. Why must data be in context (the W’s)?
6. Explain the difference between a categorical variable and a quantitative variable. Give an example of each.
Chapter 1: Stats Starts Here / Chapter 2: Data
Stats: Modeling the World - Bock, Velleman, & DeVeaux
Chapter 3: Displaying and Describing Categorical Data
Key Vocabulary: � frequency table � relative frequency table � distribution � bar chart � pie chart
� contingency table � marginal distribution � conditional distribution � independent � segmented bar chart
� Simpson’s Paradox
1. According to the authors, what are the three rules of data analysis?
2. Explain the difference between a frequency table and a relative frequency table.
3. When is it appropriate to use a bar chart?
4. When is it appropriate to use a pie chart?
5. When is it appropriate to use a contingency table?
6. What does a marginal distribution show?
7. When is it appropriate to look at a conditional distribution?
8. What does it mean for two variables to be independent?
9. How does a segmented bar chart compare to a pie chart?
10. Explain what is meant by Simpson’s Paradox.
Chapter 3: Displaying and Describing Categorical Data
Stats: Modeling the World - Bock, Velleman, & DeVeaux
Chapter 4: Displaying Quantitative Data
Key Vocabulary: � distribution � histogram � relative frequency
histogram � stem-and-leaf display � dotplot � shape � center
� spread � mode � unimodal � bimodal � multimodal � uniform � symmetric � tail
� skewed � outliers � gaps � time plot � re-expressing data
Calculator Skills: � display a histogram � SortA (
1. What is meant by a distribution? 2. Explain the difference between a histogram and a relative frequency histogram. 3. In what ways are histograms similar to stem-and-leaf displays? 4. Name some advantages and disadvantages of stem-and-leaf displays. 5. When is it more appropriate to use a histogram rather than a stem-and-leaf display? 6. Name some advantages and disadvantages of dotplots. 7. When describing a distribution, what three things should you always mention? 8. What should you look for when describing the shape of a distribution? 9. In general, what is meant by the center of a distribution?
Chapter 3: Displaying and Describing Categorical Data
Stats: Modeling the World - Bock, Velleman, & DeVeaux
10. In general, what is meant by the spread of a distribution? 11. When is it appropriate to use a time plot to display quantitative data? 12. What is meant by re-expressing or transforming data? What is the purpose of re-expressing
or transforming data?
Chapter 3: Displaying and Describing Categorical Data
Stats: Modeling the World - Bock, Velleman, & DeVeaux
Chapter 5: Describing Distributions Numerically
Key Vocabulary: � center � spread � midrange � median � range
� quartile � interquartile range � percentile � five-number summary � boxplot
� mean � standard deviation � variance
Calculator Skills: � boxplot
� modified boxplot � 1-Var Stats
1. Explain the difference between range and interquartile range. Why is the interquartile
range often a better measure of the spread of a distribution? 2. What are some advantages of boxplots? 3. What are some disadvantages of boxplots? 4. When is it more appropriate to use the mean as a measure of center rather than the median?
Why? 5. When is it more appropriate to use the median as a measure of center rather than the mean?
Why? 6. When do the mean and median have the same value? 7. Describe the relationship between variance and standard deviation.
Chapter 5: Describing Distributions Numerically
AP Statistics Summer Math Packet
Name: Date:
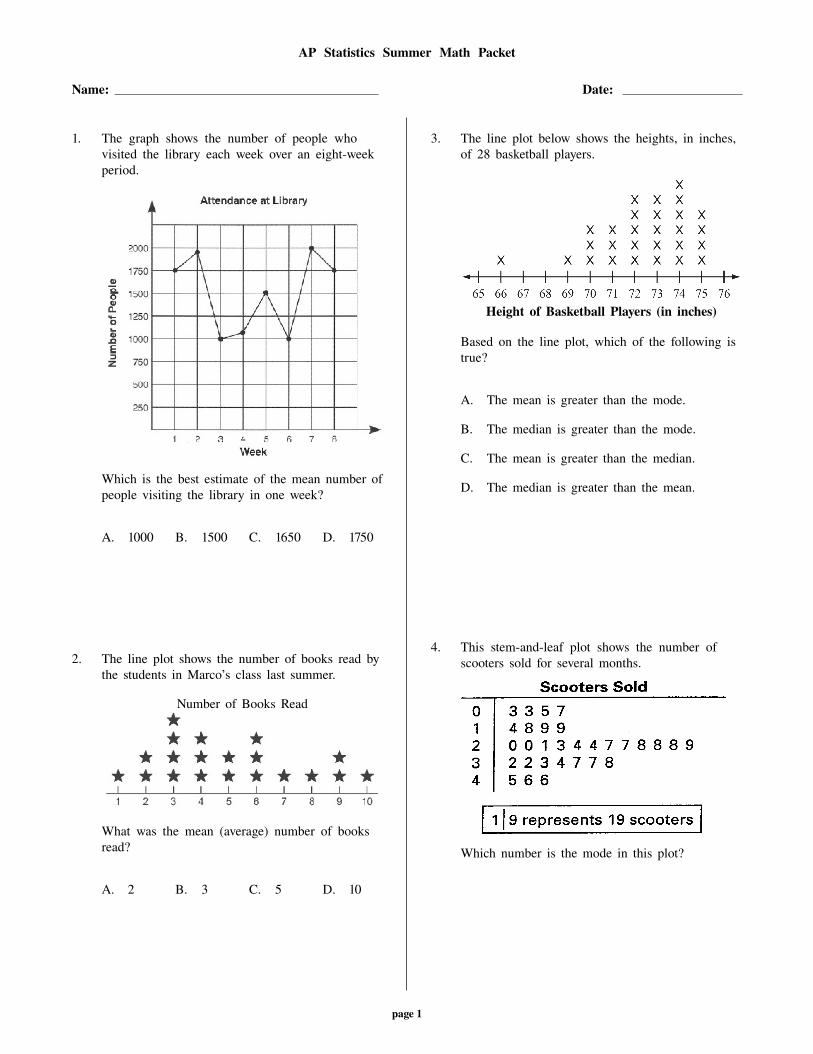
1. The graph shows the number of people whovisited the library each week over an eight-weekperiod.
Which is the best estimate of the mean number ofpeople visiting the library in one week?
A. 1000 B. 1500 C. 1650 D. 1750
2. The line plot shows the number of books read bythe students in Marco’s class last summer.
Number of Books Read
What was the mean (average) number of booksread?
A. 2 B. 3 C. 5 D. 10
3. The line plot below shows the heights, in inches,of 28 basketball players.
Height of Basketball Players (in inches)
Based on the line plot, which of the following istrue?
A. The mean is greater than the mode.
B. The median is greater than the mode.
C. The mean is greater than the median.
D. The median is greater than the mean.
4. This stem-and-leaf plot shows the number ofscooters sold for several months.
Which number is the mode in this plot?
page 1
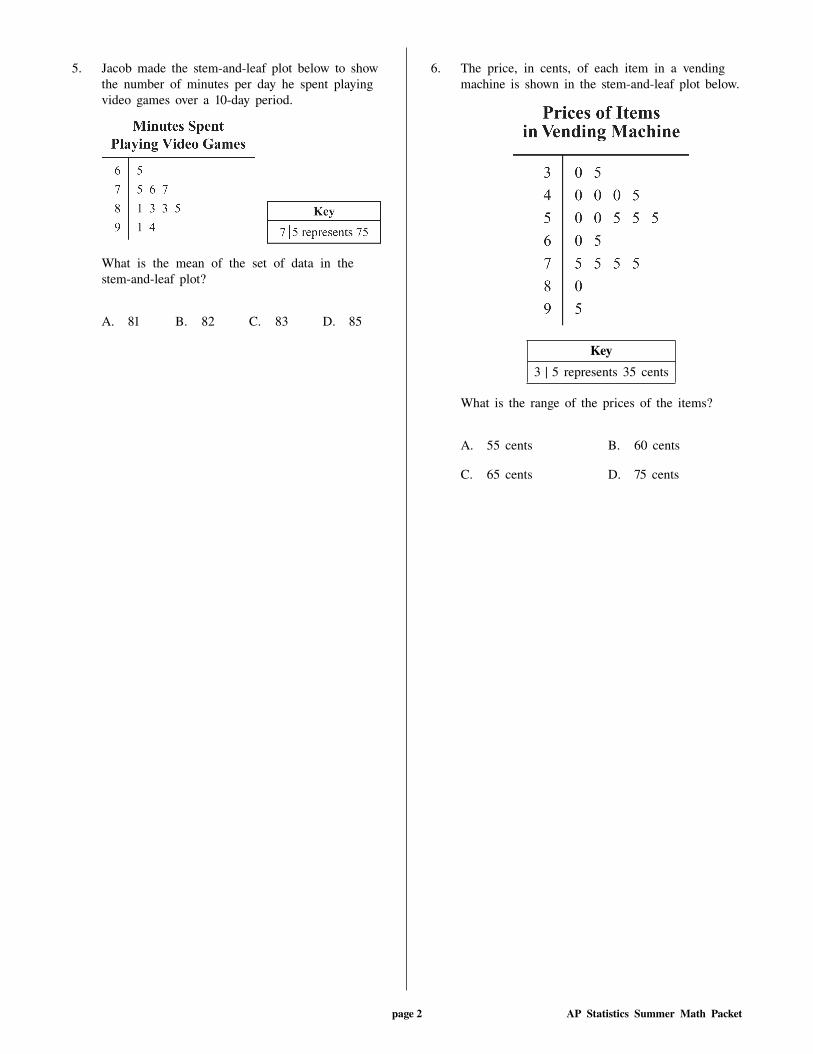
5. Jacob made the stem-and-leaf plot below to showthe number of minutes per day he spent playingvideo games over a 10-day period.
What is the mean of the set of data in thestem-and-leaf plot?
A. 81 B. 82 C. 83 D. 85
6. The price, in cents, of each item in a vendingmachine is shown in the stem-and-leaf plot below.
Key
3 | 5 represents 35 cents
What is the range of the prices of the items?
A. 55 cents B. 60 cents
C. 65 cents D. 75 cents
page 2 AP Statistics Summer Math Packet
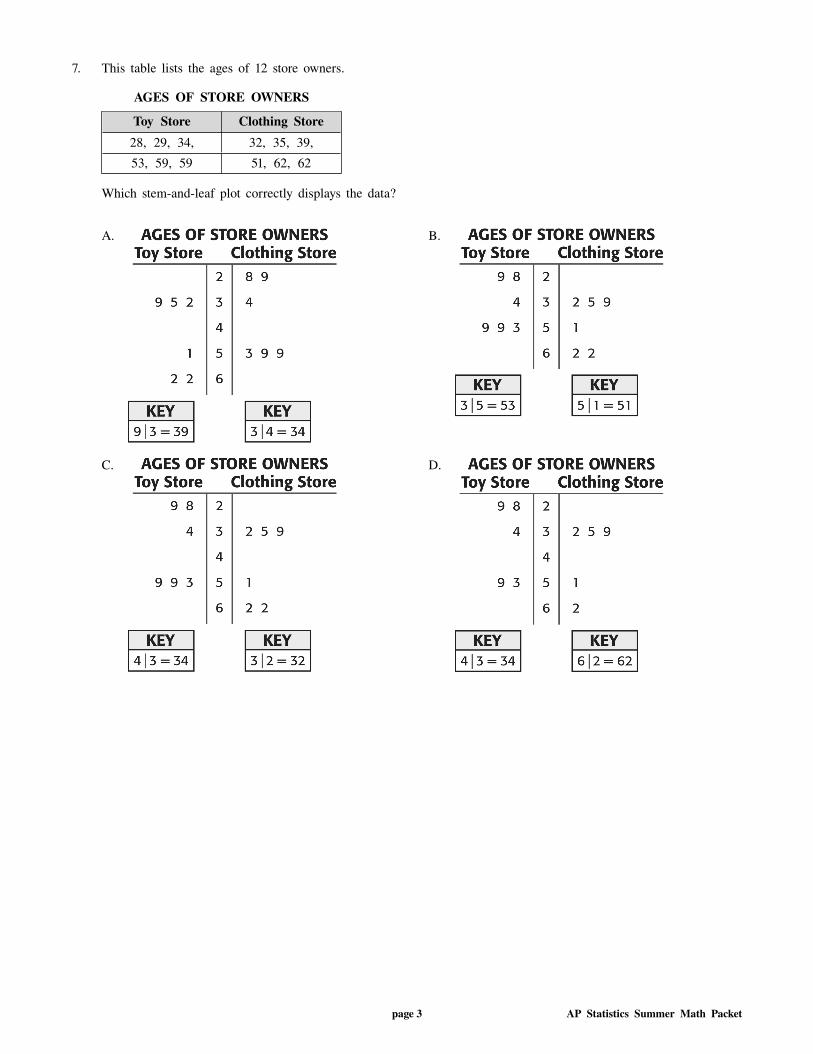
7. This table lists the ages of 12 store owners.
AGES OF STORE OWNERS
Toy Store Clothing Store
28, 29, 34, 32, 35, 39,
53, 59, 59 51, 62, 62
Which stem-and-leaf plot correctly displays the data?
A. B.
C. D.
page 3 AP Statistics Summer Math Packet
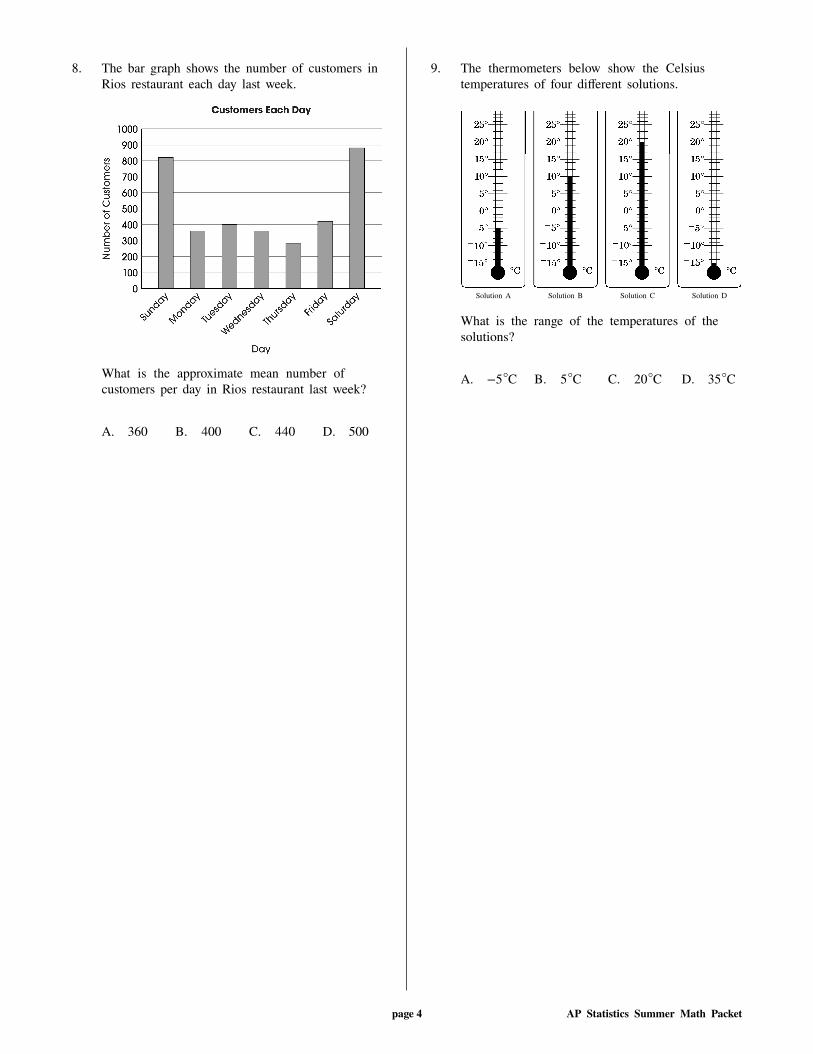
8. The bar graph shows the number of customers inRios restaurant each day last week.
What is the approximate mean number ofcustomers per day in Rios restaurant last week?
A. 360 B. 400 C. 440 D. 500
9. The thermometers below show the Celsiustemperatures of four di!erent solutions.
Solution A Solution B Solution C Solution D
What is the range of the temperatures of thesolutions?
A. !5"C B. 5"C C. 20"C D. 35"C
page 4 AP Statistics Summer Math Packet
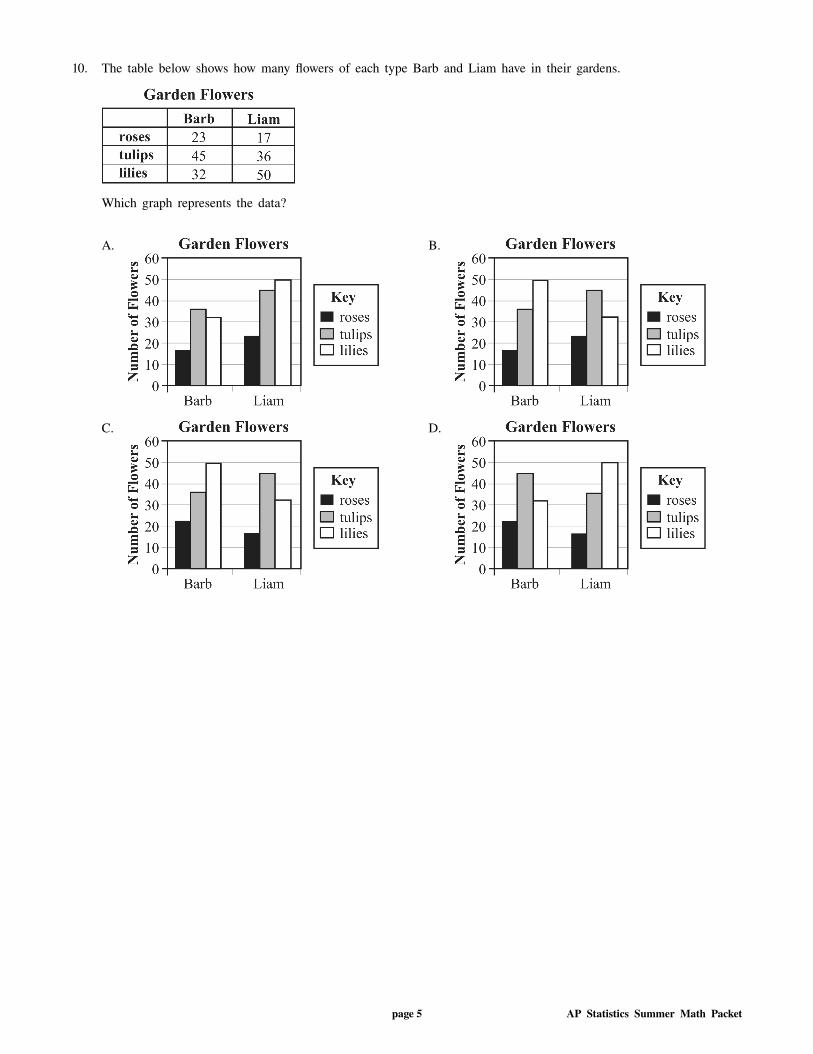
10. The table below shows how many flowers of each type Barb and Liam have in their gardens.
Which graph represents the data?
A. B.
C. D.
page 5 AP Statistics Summer Math Packet
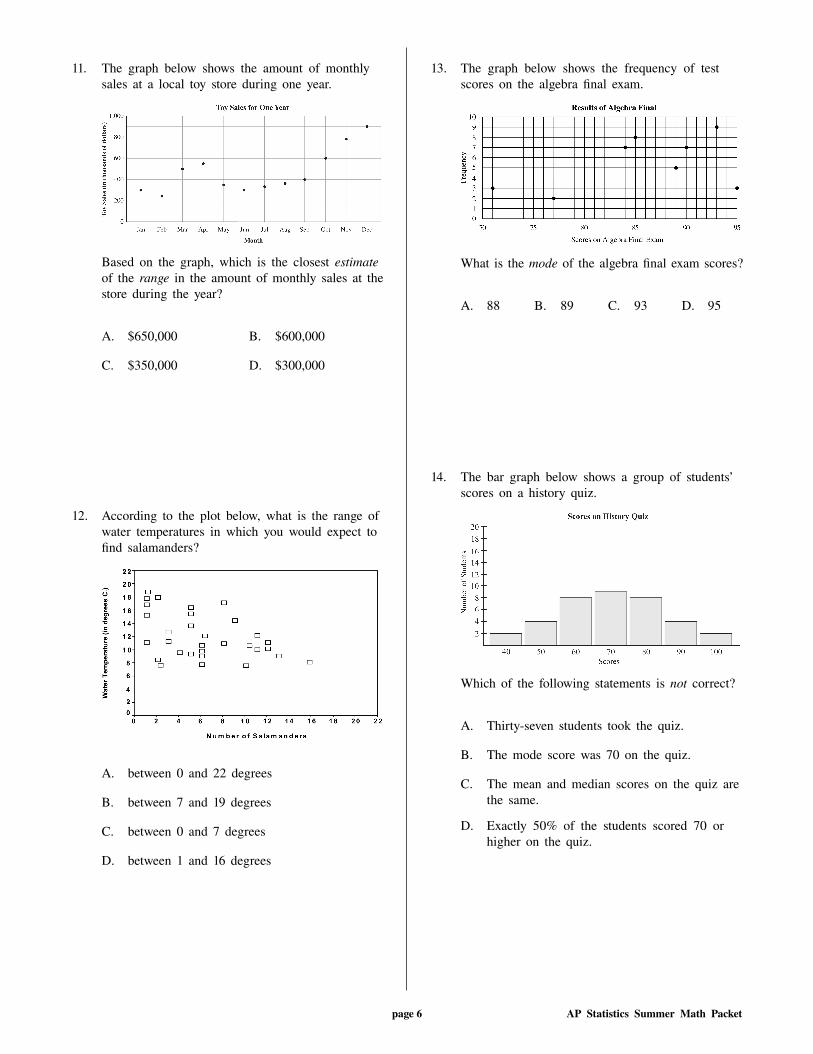
11. The graph below shows the amount of monthlysales at a local toy store during one year.
Based on the graph, which is the closest estimateof the range in the amount of monthly sales at thestore during the year?
A. $650,000 B. $600,000
C. $350,000 D. $300,000
12. According to the plot below, what is the range ofwater temperatures in which you would expect tofind salamanders?
A. between 0 and 22 degrees
B. between 7 and 19 degrees
C. between 0 and 7 degrees
D. between 1 and 16 degrees
13. The graph below shows the frequency of testscores on the algebra final exam.
What is the mode of the algebra final exam scores?
A. 88 B. 89 C. 93 D. 95
14. The bar graph below shows a group of students’scores on a history quiz.
Which of the following statements is not correct?
A. Thirty-seven students took the quiz.
B. The mode score was 70 on the quiz.
C. The mean and median scores on the quiz arethe same.
D. Exactly 50% of the students scored 70 orhigher on the quiz.
page 6 AP Statistics Summer Math Packet
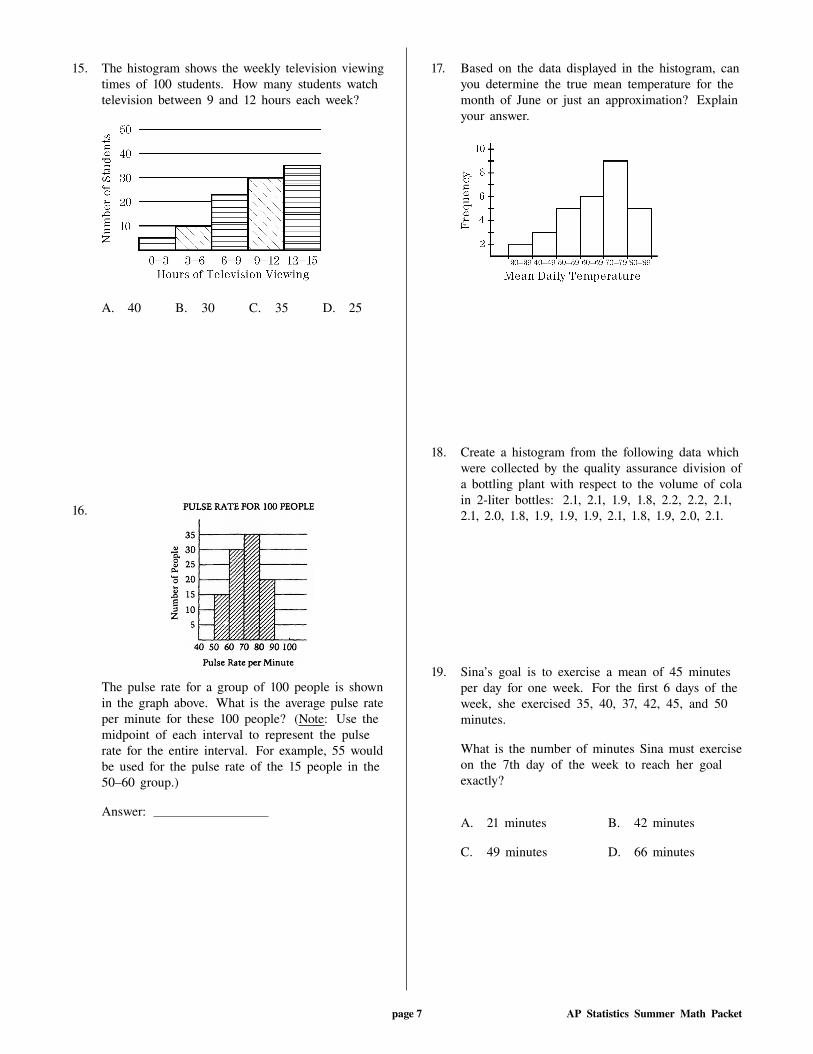
15. The histogram shows the weekly television viewingtimes of 100 students. How many students watchtelevision between 9 and 12 hours each week?
A. 40 B. 30 C. 35 D. 25
16.
The pulse rate for a group of 100 people is shownin the graph above. What is the average pulse rateper minute for these 100 people? (Note: Use themidpoint of each interval to represent the pulserate for the entire interval. For example, 55 wouldbe used for the pulse rate of the 15 people in the50–60 group.)
Answer:
17. Based on the data displayed in the histogram, canyou determine the true mean temperature for themonth of June or just an approximation? Explainyour answer.
18. Create a histogram from the following data whichwere collected by the quality assurance division ofa bottling plant with respect to the volume of colain 2-liter bottles: 2.1, 2.1, 1.9, 1.8, 2.2, 2.2, 2.1,2.1, 2.0, 1.8, 1.9, 1.9, 1.9, 2.1, 1.8, 1.9, 2.0, 2.1.
19. Sina’s goal is to exercise a mean of 45 minutesper day for one week. For the first 6 days of theweek, she exercised 35, 40, 37, 42, 45, and 50minutes.
What is the number of minutes Sina must exerciseon the 7th day of the week to reach her goalexactly?
A. 21 minutes B. 42 minutes
C. 49 minutes D. 66 minutes
page 7 AP Statistics Summer Math Packet
20. While summarizing payroll reports for hercompany, Ms. Walthers noticed that the meansalary in the firm was $32,500 while the mediansalary was only $28,200. What must be trueregarding paychecks at this company?
A. There is at least one paycheck that issignificantly less than the median payrollamount.
B. There is at least one paycheck that issignificantly greater than the median payrollamount.
C. All paychecks in the company are relativelysimilar.
D. The mode must be between $28,200 and$32,500.
21. An antique dealer bought 5 di!erent antiques andhad them appraised.
• The least expensive antique was appraisedat $75.00.
• The range of appraisals was $300.00.
• The mode was $75.00.
• The median was $205.00.
• The mean (average) was $210.00.
What were the appraisals on each of the5 antiques? Show your work or explain how youfound your answer.
22. There are 10 people in an elevator, four womenand six men.
The average weight of the women is 120 pounds,and the average weight of the men is 180 pounds.
What is the average weight of the ten people inthe elevator? Show how you found your answerand explain your thinking.
23. Mr. Young wrote five numbers on the board in hisclassroom. After class, one of the numbers waserased. Four of the five numbers are shown below.
18 25 30 17 ?
If the median of the five numbers that Mr. Youngwrote on the board was 18, which of the followingcould be true?
A. The number that was erased was greaterthan 30.
B. The mode of the five numbers Mr. Youngwrote on the board was 24.
C. The mean of the five numbers Mr. Youngwrote on the board was 22.6.
D. The number that was erased was less than orequal to 18.
page 8 AP Statistics Summer Math Packet
24. The cholesterol levels of 5 people are shown inthe chart below.
Cholesterol Levels
Person CholesterolLevel
1 203
2 188
3 205
4 215
5 212
If the cholesterol level of person 4 decreases from215 to 210, how will the median of the data bea!ected?
A. The median will increase.
B. The median will decrease.
C. The median will stay the same.
D. There is not enough information given todetermine how the median is a!ected.
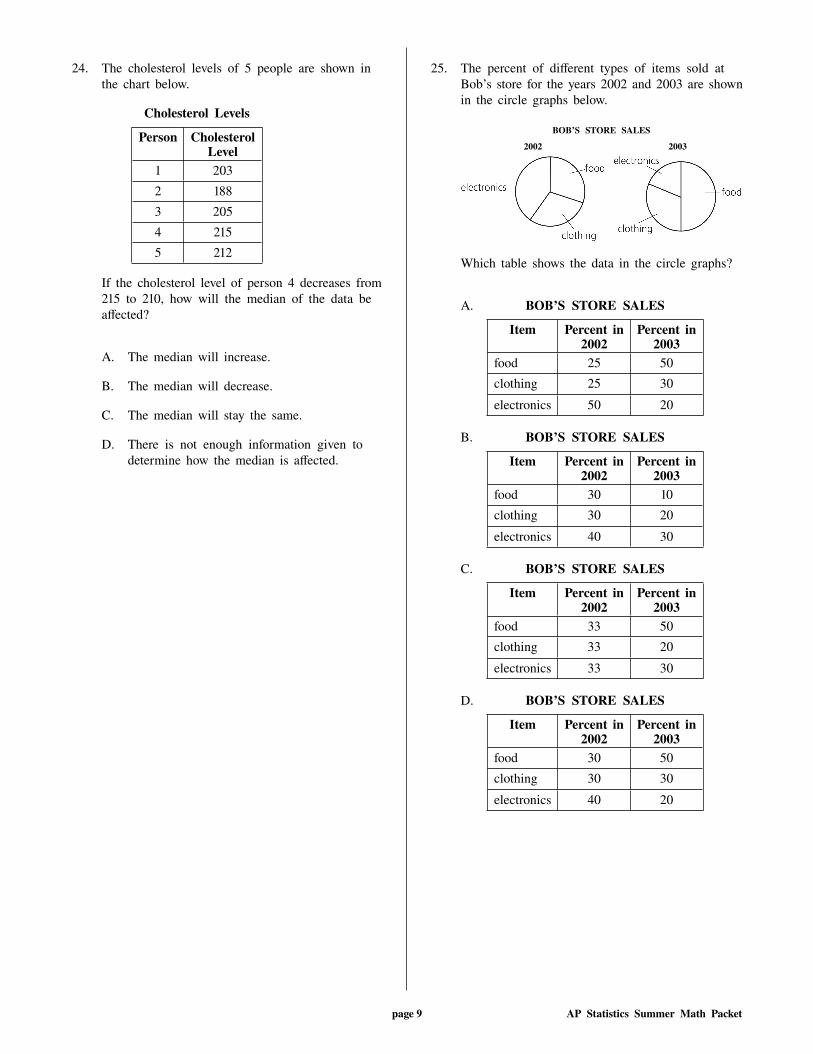
25. The percent of di!erent types of items sold atBob’s store for the years 2002 and 2003 are shownin the circle graphs below.
BOB’S STORE SALES
2002 2003
Which table shows the data in the circle graphs?
A. BOB’S STORE SALES
Item Percent in2002
Percent in2003
food 25 50
clothing 25 30
electronics 50 20
B. BOB’S STORE SALES
Item Percent in2002
Percent in2003
food 30 10
clothing 30 20
electronics 40 30
C. BOB’S STORE SALES
Item Percent in2002
Percent in2003
food 33 50
clothing 33 20
electronics 33 30
D. BOB’S STORE SALES
Item Percent in2002
Percent in2003
food 30 50
clothing 30 30
electronics 40 20
page 9 AP Statistics Summer Math Packet
26. A local jeweler began a sale on Monday. It was70% o! the ticket price. The following Friday headvertised an additional 35% o! the original ticketprice. Do you find this hard to believe? Explain.
27. Last week Robin did 30 sit-ups in one minute.Today, she did 45 in one minute. Her coach toldher she had improved 150%. Is this correct?Explain.
28. An election involving four candidates for mayorhas been held. Of the following, which is thebest way to present the percentage of votes eachcandidate received?
A. Circle graph B. Box plot
C. Scatterplot D. Histogram
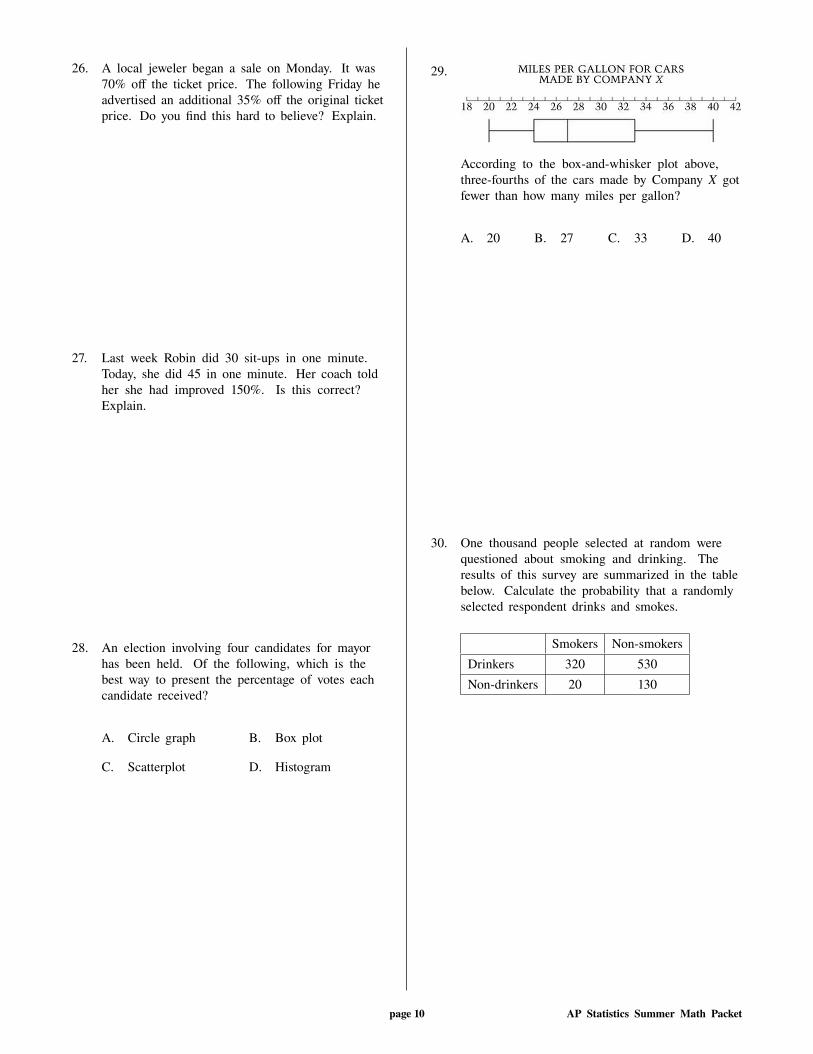
29.
According to the box-and-whisker plot above,three-fourths of the cars made by Company X gotfewer than how many miles per gallon?
A. 20 B. 27 C. 33 D. 40
30. One thousand people selected at random werequestioned about smoking and drinking. Theresults of this survey are summarized in the tablebelow. Calculate the probability that a randomlyselected respondent drinks and smokes.
Smokers Non-smokers
Drinkers 320 530
Non-drinkers 20 130
page 10 AP Statistics Summer Math Packet