Embed Size (px)
DESCRIPTION
- PowerPoint PPT Presentation
Citation preview
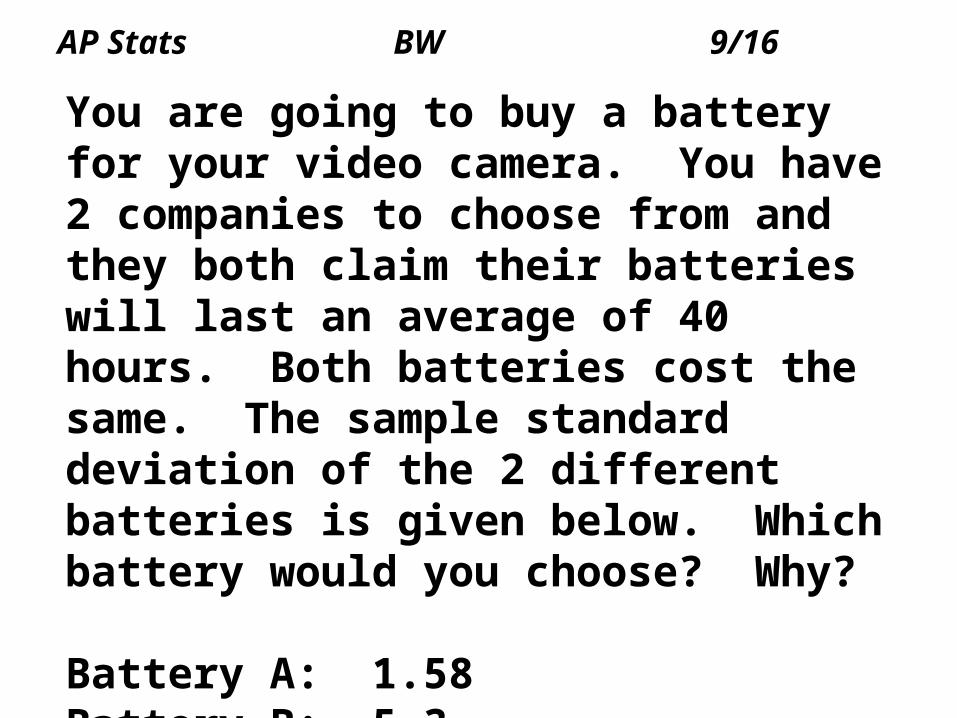
AP Stats BW 9/16You are going to buy a battery for your video camera. You have 2 companies to choose from and they both claim their batteries will last an average of 40 hours. Both batteries cost the same. The sample standard deviation of the 2 different batteries is given below. Which battery would you choose? Why?
Battery A: 1.58Battery B: 5.3
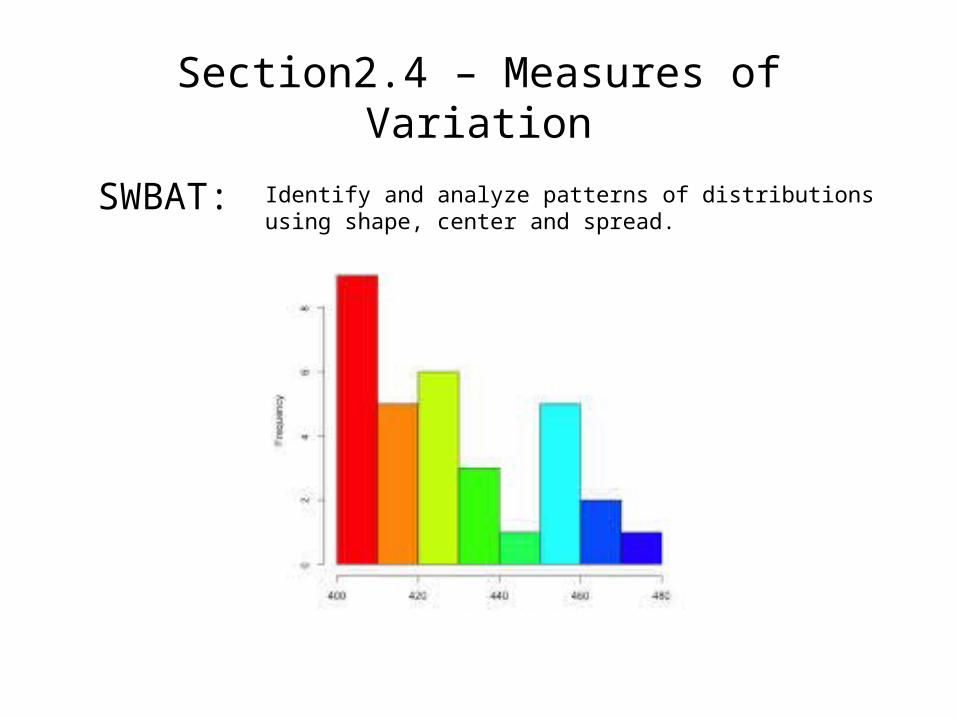
Section2.4 – Measures of Variation
SWBAT: Identify and analyze patterns of distributions using shape, center and spread.

Measures of VariationVariation is the general term for SPREAD in a data set
Standard Deviation is used to measure spread associated with mean
Deviation is how much a value in a data set differs from the mean
value: SAMPLE: (x- ) or POPULTATION: (x – μ)
Variance is the average squared distance a data value is from the
mean value.
The 5-number summary is used to measure spread associated with the median.
STANDARD DEVIATION
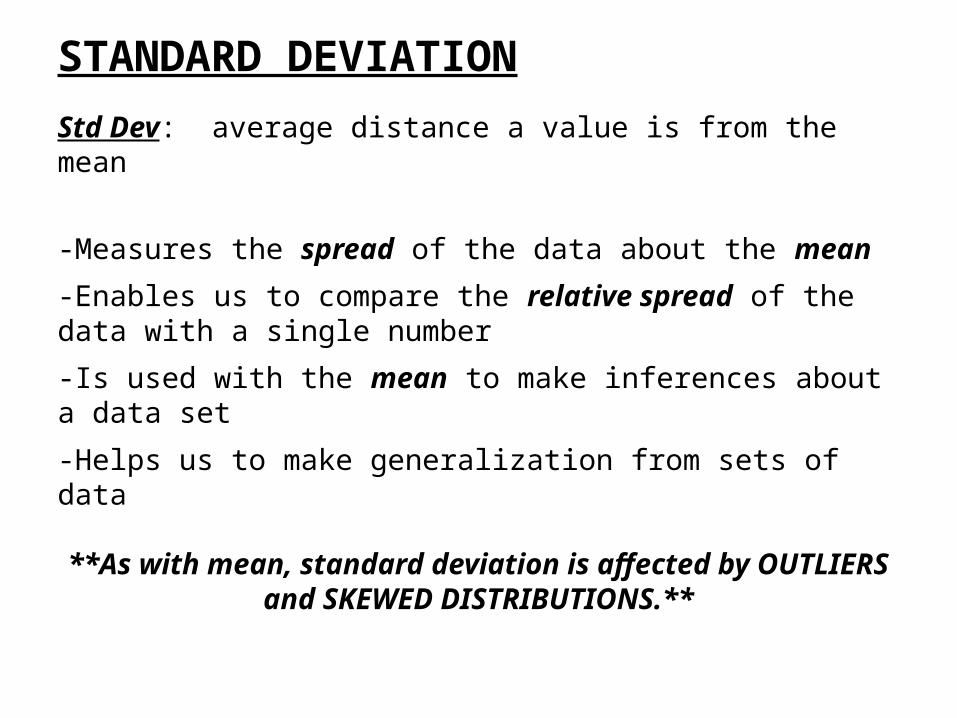
Std Dev: average distance a value is from the mean
-Measures the spread of the data about the mean
-Enables us to compare the relative spread of the data with a single number
-Is used with the mean to make inferences about a data set
-Helps us to make generalization from sets of data
**As with mean, standard deviation is affected by OUTLIERS and SKEWED DISTRIBUTIONS.**
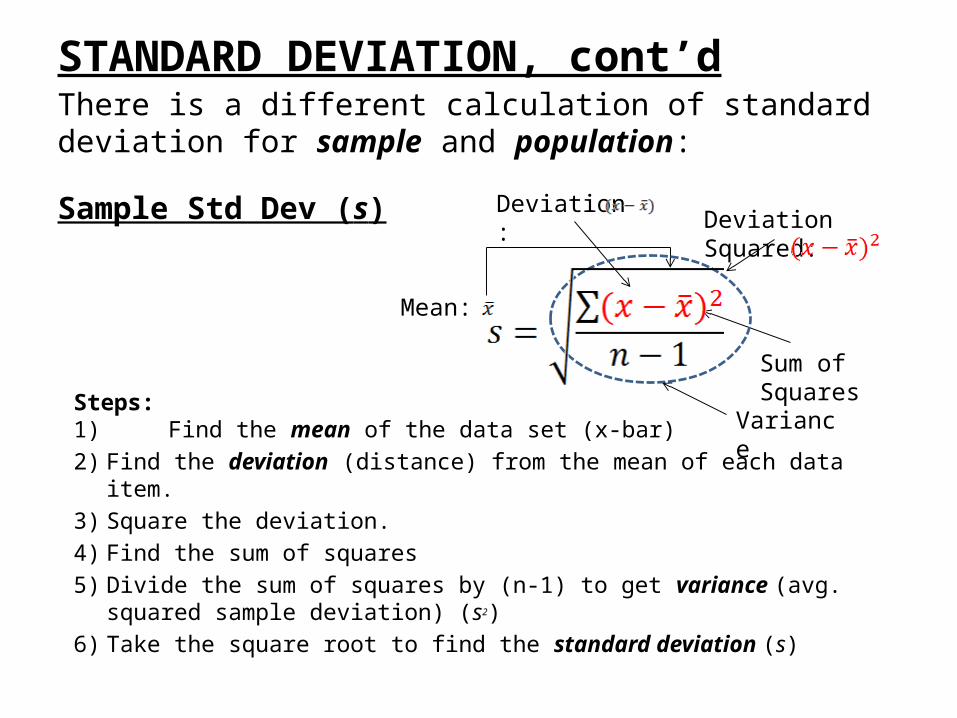
STANDARD DEVIATION, cont’dThere is a different calculation of standard deviation for sample and population:
Sample Std Dev (s)
Steps:1) Find the mean of the data set (x-bar)2) Find the deviation (distance) from the mean of each data item.3) Square the deviation.4) Find the sum of squares5) Divide the sum of squares by (n-1) to get variance (avg. squared sample
deviation) (s2)6) Take the square root to find the standard deviation (s)
Deviation :
Sum of Squares
Deviation Squared:
Mean:
Variance
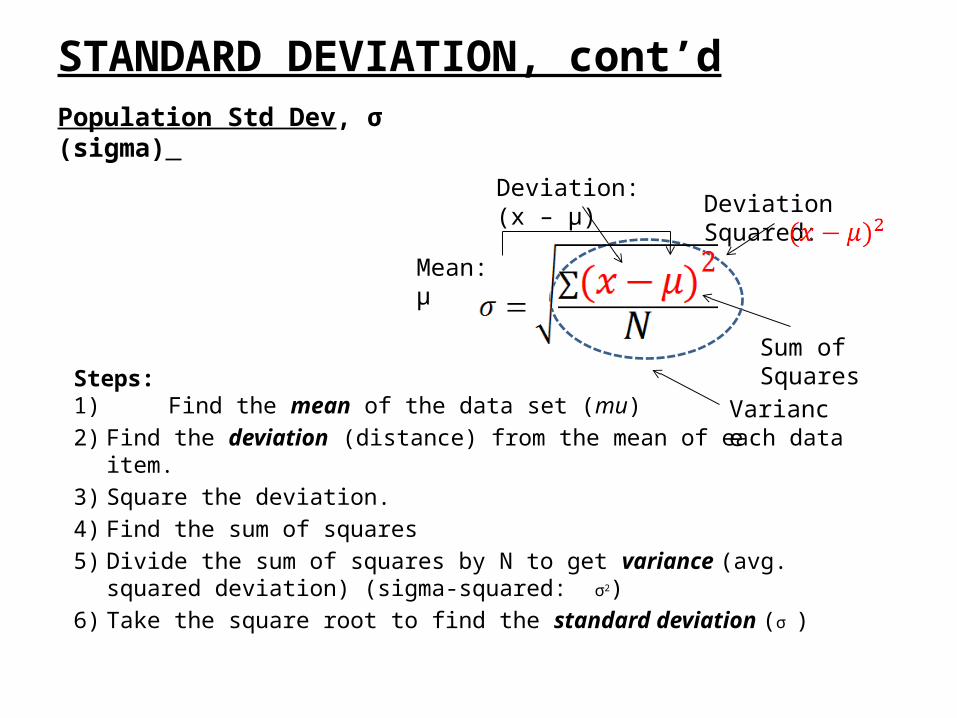
STANDARD DEVIATION, cont’dPopulation Std Dev, σ (sigma)
Steps:1) Find the mean of the data set (mu)2) Find the deviation (distance) from the mean of each data item.3) Square the deviation.4) Find the sum of squares5) Divide the sum of squares by N to get variance (avg. squared deviation)
(sigma-squared: σ2)6) Take the square root to find the standard deviation (σ )
Deviation: (x – μ)
Sum of Squares
Mean: μ
Variance
Deviation Squared:
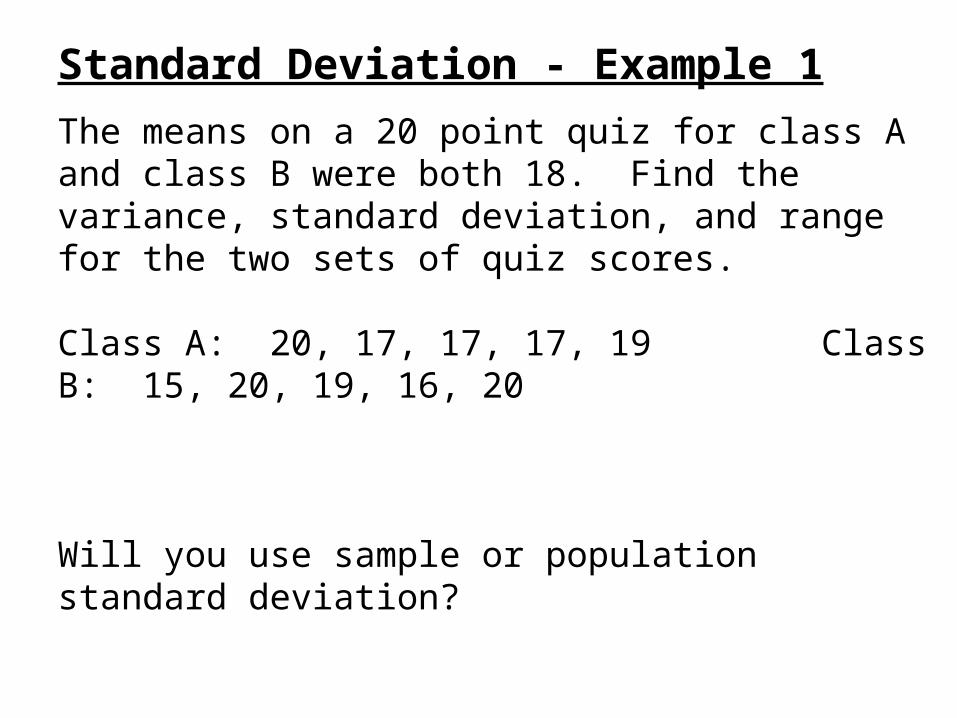
Standard Deviation - Example 1
The means on a 20 point quiz for class A and class B were both 18. Find the variance, standard deviation, and range for the two sets of quiz scores.
Class A: 20, 17, 17, 17, 19 Class B: 15, 20, 19, 16, 20
Will you use sample or population standard deviation?
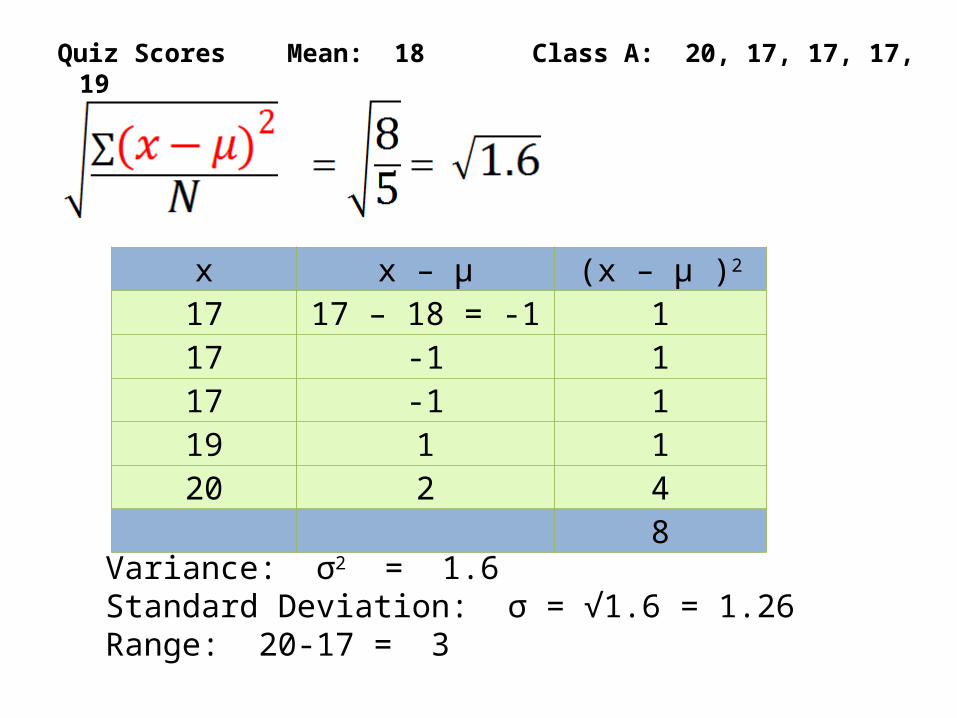
Quiz Scores Mean: 18 Class A: 20, 17, 17, 17, 19
x x – μ (x – μ )2
17 17 – 18 = -1 117 -1 117 -1 119 1 120 2 4
8
Variance: σ2 = 1.6Standard Deviation: σ = √1.6 = 1.26Range: 20-17 = 3

YOU TRY… Mean: 18 Class B: 15, 20, 19, 16, 20
x x – μ (x – μ )2
15 15 – 18 = -3 916 -2 419 1 120 2 420 2 4
22
Variance: σ2 = 4.4Standard Deviation: σ = √4.4 = 2.097Range: 20-15 = 5
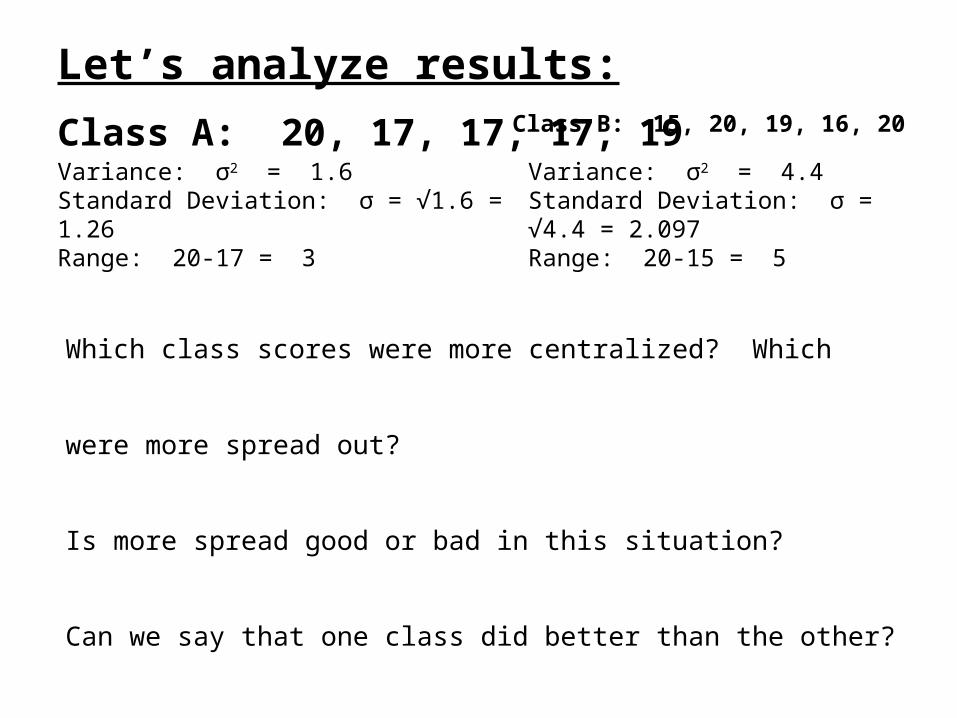
Let’s analyze results:
Class A: 20, 17, 17, 17, 19Variance: σ2 = 1.6Standard Deviation: σ = √1.6 = 1.26Range: 20-17 = 3
Class B: 15, 20, 19, 16, 20Variance: σ2 = 4.4Standard Deviation: σ = √4.4 = 2.097Range: 20-15 = 5
Which class scores were more centralized? Which were more spread out?
Is more spread good or bad in this situation?
Can we say that one class did better than the other?
Standard Deviation, cont’d:
Facts about Standard Deviation:
• If Std Dev is small, the data has little spread (ie the majority of points fall very near the mean).
• As the observations become more spread out about the mean, the Std Dev increases.
• If Std Dev = 0, there is no spread. This ONLY happens when ALL data items are the SAME VALUE.
• The Std Dev is significantly affected by outliers and skewed distributions.

Facts about Standard Deviation, cont’d:• Std Dev is important to correctly interpret data. For
example, in physical sciences, a lower Std Dev for the same measurement implies higher precision for the experiment.
• When interpreting MEAN, you MUST also indicate the standard deviation.
Our quiz scores from previous slides is an example of why.
Another example: let’s say mean weather over a day in two cities is 240C. However, if the Std Dev is very large, it means likely extremes of temperatures exist (really hot during day/but cold at night like desert). On the other hand, if Std Dev is small, it means a fairly uniform temp throughout day (like coastal region).
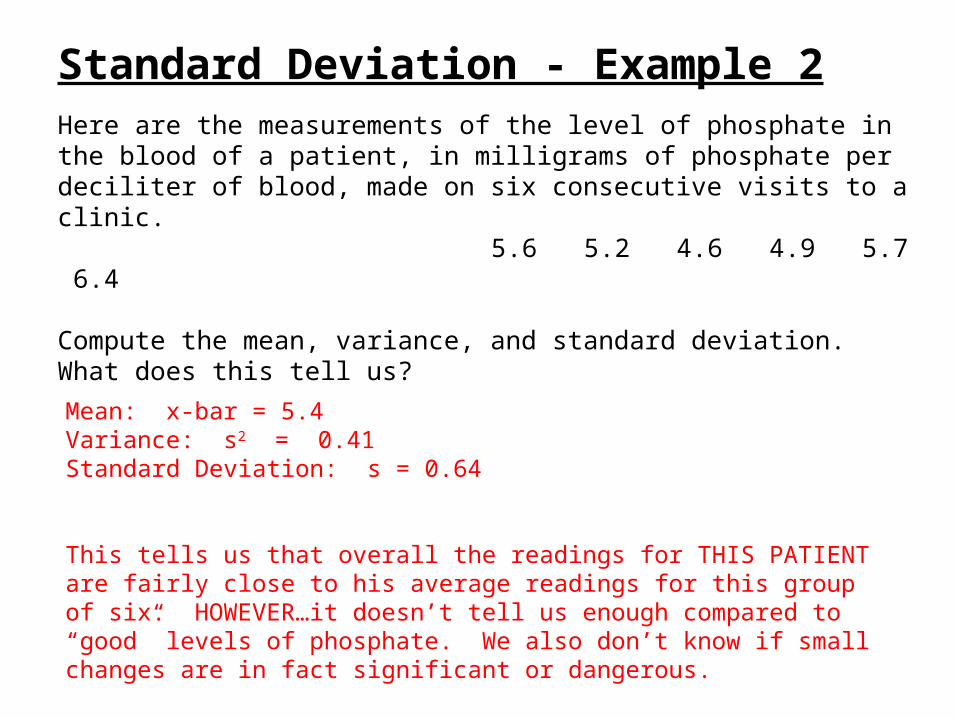
Standard Deviation - Example 2Here are the measurements of the level of phosphate in the blood of a patient, in milligrams of phosphate per deciliter of blood, made on six consecutive visits to a clinic. 5.6 5.2 4.6 4.9 5.7 6.4
Compute the mean, variance, and standard deviation. What does this tell us?Mean: x-bar = 5.4Variance: s2 = 0.41Standard Deviation: s = 0.64
This tells us that overall the readings for THIS PATIENT are fairly close to his average readings for this group of six. HOWEVER…it doesn’t tell us enough compared to “good” levels of phosphate. We also don’t know if small changes are in fact significant or dangerous.
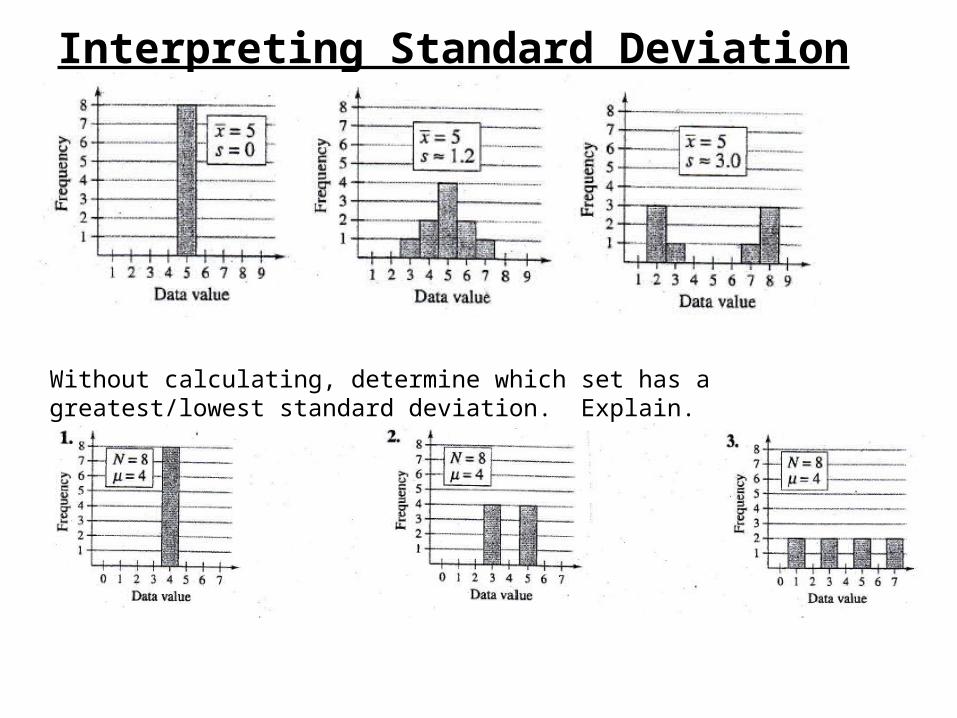
Interpreting Standard Deviation
Without calculating, determine which set has a greatest/lowest standard deviation. Explain.
HOMEWORK:P 92. 1, 3, (show work), 6-10all, 14-17all and worksheet for Std Dev.