Embed Size (px)
Citation preview
APD Final Report
Professor Papalambros
Group 10
Dayo Adebayo
Ali Khanzadi
Alexander Thompson
Fall 2010
1
Nomenclature ............................................................................................................................................... 4
1 INTRODUCTION/DEFINITION OF NEED ................................................................................................. 5
1.1 THE USERS ..................................................................................................................................... 5
1.1.1 Surveying the user ................................................................................................................ 5
1.2 THE BUYERS ................................................................................................................................... 5
1.3 THE SELLERS .................................................................................................................................. 6
1.4 THE MAINTAINERS ........................................................................................................................ 6
1.5 THE DISPOSERS ............................................................................................................................. 6
2 PREVIOUS DESIGNS ............................................................................................................................... 7
3 DESIGN OBJECTIVES .............................................................................................................................. 9
4 ANTICIPATED DESIGN PROCESS .......................................................................................................... 10
4.1 LEGAL REQUIREMENTS AND SAFETY CONCERNS ....................................................................... 12
5 CONCEPT GENERATION, SELECTION, AND ENGINEERING REQUIREMENT ......................................... 12
5.1 OTHER DESIGNED PROTOTYPES: ................................................................................................. 14
5.2 CONCEPT GENERATION: ............................................................................................................. 14
6 PROPOSED CONCEPT .......................................................................................................................... 15
6.1 COMPONENTS ............................................................................................................................. 17
7 ENGINEERING FUNCTIONALITY ANALYSIS .......................................................................................... 18
7.1 Ergonomic analysis & optimization: ............................................................................................ 18
7.1.1 Ergonomic Optimization model .......................................................................................... 20
7.2 Mechanical Model ...................................................................................................................... 23
7.2.1 Approach ............................................................................................................................. 23
7.2.2 Determining Sheer Force, Moment, Deflection, and Bending Stress Profiles for Handlebar
Component ......................................................................................................................................... 26
7.2.3 Braketree Failure ................................................................................................................. 28
7.2.4 The Kinematic Problem ....................................................................................................... 29
8 EMOTIONAL AND AESTHETIC ANALYSIS ............................................................................................. 30
9 MICROECONOMIC ANALYSIS .............................................................................................................. 30
10 MARKETING ANALYSIS .................................................................................................................... 33
10.1 The Conjoined Optimization Solution ......................................................................................... 32
10.1.1 Method................................................................................................................................ 32
2
10.1.2 Results ................................................................................................................................. 33
11 CONCLUSION ................................................................................................................................... 33
12 REFERENCES .................................................................................................................................... 34
13 APPENDICES .................................................................................................................................... 35
13.1 Appendix A .................................................................................................................................. 35
13.2 Appendix B .................................................................................................................................. 37
13.3 Appendix C .................................................................................................................................. 39
13.4 Appendix D .................................................................................................................................. 40
13.5 Appendix C .................................................................................................................................. 41
13.6 Appendix D .................................................................................................................................. 42
13.7 Appendix E .................................................................................................................................. 45
13.7.1 Survey Response ................................................................................................................. 45
13.7.2 CBC System Multinomial Logit Estimation ......................................................................... 45
13.8 Appendix F .................................................................................................................................. 47
13.9 Appendix G .................................................................................................................................. 48
13.10 APPENDIX H ............................................................................................................................. 49
13.11 APPENDIX I .............................................................................................................................. 50
13.12 APPENDIX J .............................................................................................................................. 51
13.13 APPENDIX K ............................................................................................................................. 52
3
Abstract
One of the requirements for Analytical Product Design class was to come up with a design, not
necessarily a totally new invention, but could be a modification to existing product. In all, the end
product must be reasonable and marketable. As a team, we decided to design a mechanical vehicle
control system mainly for handicap individuals that can make use of their hands, but are unfortunate to
have lost voluntarily control of their legs. Most part of this device will be made from a metal alloy
machined into different parts and joined/fastened together by welding, or with bolts and nuts. The final
product must also satisfy our set objectives, particularly portability; and meet feasible requirements of
our proposed customers. Thus far we have derived ergonomic, mechanical, and economic models for
our hand control design, and made refinements to that design.
4
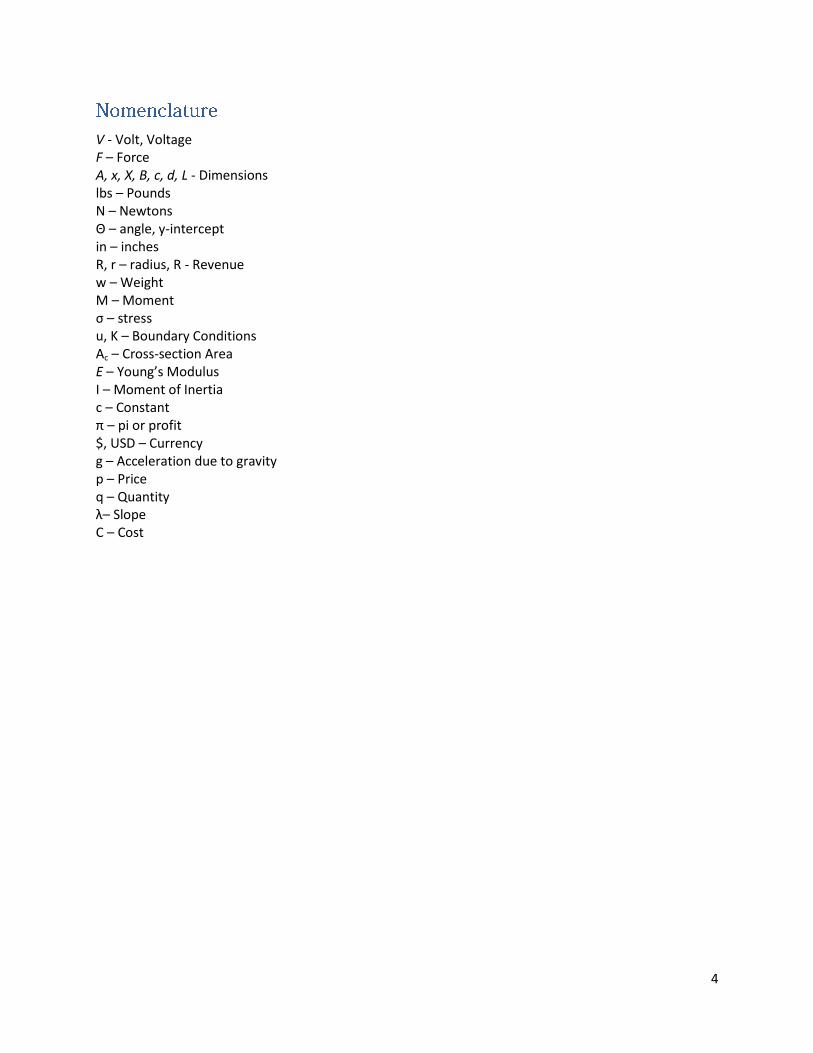
V - Volt, Voltage F – Force A, x, X, B, c, d, L - Dimensions lbs – Pounds N – Newtons Θ – angle, y-intercept in – inches R, r – radius, R - Revenue w – Weight M – Moment σ – stress u, K – Boundary Conditions Ac – Cross-section Area E – Young’s Modulus I – Moment of Inertia c – Constant π – pi or profit $, USD – Currency g – Acceleration due to gravity p – Price q – Quantity λ– Slope C – Cost
5
Upon the event of injury or disease, either traumatic or otherwise, anyone can happen into a condition
of physical handicap requiring an adaptive change in perhaps most of the devices that they encounter
regularly in order to maintain a reasonable level of facility. For those who have lost the use of their legs
but who can still use their hands there should be no need for them to also lose their ability to drive as
well. It is from this viewpoint that we have chosen to improve upon the design of aftermarket hand
controls used for acceleration and breaking in vehicles having automatic transmissions.
1.1 THE USERS
Since the users of this device will be those limited to the use of their hands for driving they will expect
that this device will allow them to drive their vehicles at the same or similar capacity as that of a normal
driver. The users will have a lifestyle that necessitates or allows them to drive a car. They will want to be
mobile, and they will want the handcontrols to be useful to them while driving, but not obtrusive to
other drivers of the vehicle who are not handicapped and who won’t need to use modified driving
controls. If the users encounter a situation when they need to drive another vehicle they will want the
handcontrols in their vehicle to be easily removed and mounted in the other vehicle without damaging
it, and they will want the handcontrols to still work safely and reliably. Because the user might want to
drive every single day multiple times a day and the handcontrols will need to work perfectly every single
time they will have to successfully withstand hundreds of thousands to millions of usage cycles.
1.1.1 Surveying the user
To better understand the overall notion of the kind of product people consider the handcontrols to be,
what features they are expected to have, their expected utility, and how much the user might be willing
to pay for them an online survey was conducted of members of the class (see Appendix D for full list of
questions). Results of the survey’s CBC matrix responses (shown in Appendix E) indicated as expected
that people would want the most immediately intuitive product to use and one that cost the least to
buy. However, it was surprising that people wanted controls that are built into the vehicle permanently
instead of the portable controls we are designing. It is though that people interpreted the statement
“Built-in to vehicle” as a measure of the device’s dependability and overall level of fit and finish with
people not knowing that there are already good dependable designs of high fit and finish that can be
(albeit difficulty) moved from one vehicle to another. Thus respondent answers given will be highly
dependent upon the connotation of the question as written in a survey.
1.2 THE BUYERS
The buyers of the handcontrols won’t just be end users though; they will also be the retail sellers of the
product although the end-user would still have the option to buy directly from the manufacturer. Retail
sellers would have to be specialized. They would likely have experience selling and installing other
aftermarket vehicle modifications. Also gift giving is a common practice in most countries so it would be
profitable to have a way to have a relative or friend purchase handcontrols for someone else, and be
able to surprise them with the controls and training.
6
1.3 THE SELLERS
Because the eventual end user likely will not know the full range of mobility options available to them it
will be of significant importance that driver rehabilitation specialists be made readily available to match
the actual consumer with the best product on the market for their disability. As “adaptive vehicle
control products are commonly prescribed by rehabilitation centers and installed by mobility equipment
dealers and installers who specialize in vehicle modifications”[1] it would be common for a driver
rehabilitation specialist to assess an entire range of vehicle modifications including those allowing for
easy vehicle ingress and egress and in each case our handcontrols would have to be part of a seamlessly
integrated solution. This places great responsibility upon the sellers of our product to ensure that people
understand whether our product is the best option for them, and then to ensure that they receive all
the proper licensing and training necessary to operate the handcontrols in coordination with any other
vehicle modifications that they may have in a safe and effective manner. Also because, depending upon
the degree of the mobility issue, the insurance coverage available, and the high cost of other models of
handcontrols currently all of that training and advice should be available for a low or nonexistent cost to
the end-user. Once the user has determined what the best option is though, they should not be
restricted to buying from some particular specialty retailer if they can obtain the controls cheaper from
our company directly. Thus, maintaining a reasonable system of suppliers, distributors, retailers, and
driver rehabilitation specialists will be of particular importance and difficulty.
1.4 THE MAINTAINERS Further, because end users will have to assess the continued proper functioning of controls they should
have recourse if at a certain point the controls begin to fail. This is further complicated by the fact the
controls may have originally been purchased by the user, and paid for by their insurance company so
that if they should need to purchase a new pair sooner than their insurance will allow they may unable
to do so. Therefore, devising an appropriate warranty period won’t be just a matter of testing the
controls and coming up with a statistical model for their probability of failure, but will also include
ensuring that the insurance companies will be likely to cover the controls if they break outside of that
warranty period.
Also when the controls do break they will have to be either shipped back to the manufacturer to be
repaired or taken back to the specialty retailer that installed them to be inspected, removed, and either
fixed onsite or be sent back to the manufacturer.
1.5 THE DISPOSERS
Which leads to the issue of who and how will the controls be disposed of once they can no longer be
repaired, or once the user decides to move onto another model. After so much initial effort by the user
to choose and acquire the controls likely they will have a life cycle of at least five years. After that time,
if there are new controls on the market it should be easy for the user to upgrade to the new controls at
a reduced cost if their current controls are still under warranty. At that point they would simply pay an
upfront cost, possibly covered by their health insurance company, and then be sent a new or
refurbished pair of controls. They would then have to remove, or have the original mobility retailer
remove the controls, install the new ones and send their old set back to the manufacturer.
7
In order for the controls to have been put under warranty the original user must have provided
the purchase date and their address so that information could be used along with other data that might
be collected as a survey when the old controls are sent back to the manufacturer. The manufacturer
should then perform a failure and other analysis on the returned pair to determine how well they have
maintained their functionality and safety at the end of their lifecycle. Those analysis combined with data
from the user should help in determining how to improve upon the design and maintenance of the
controls as well as the training provided to the end-user.
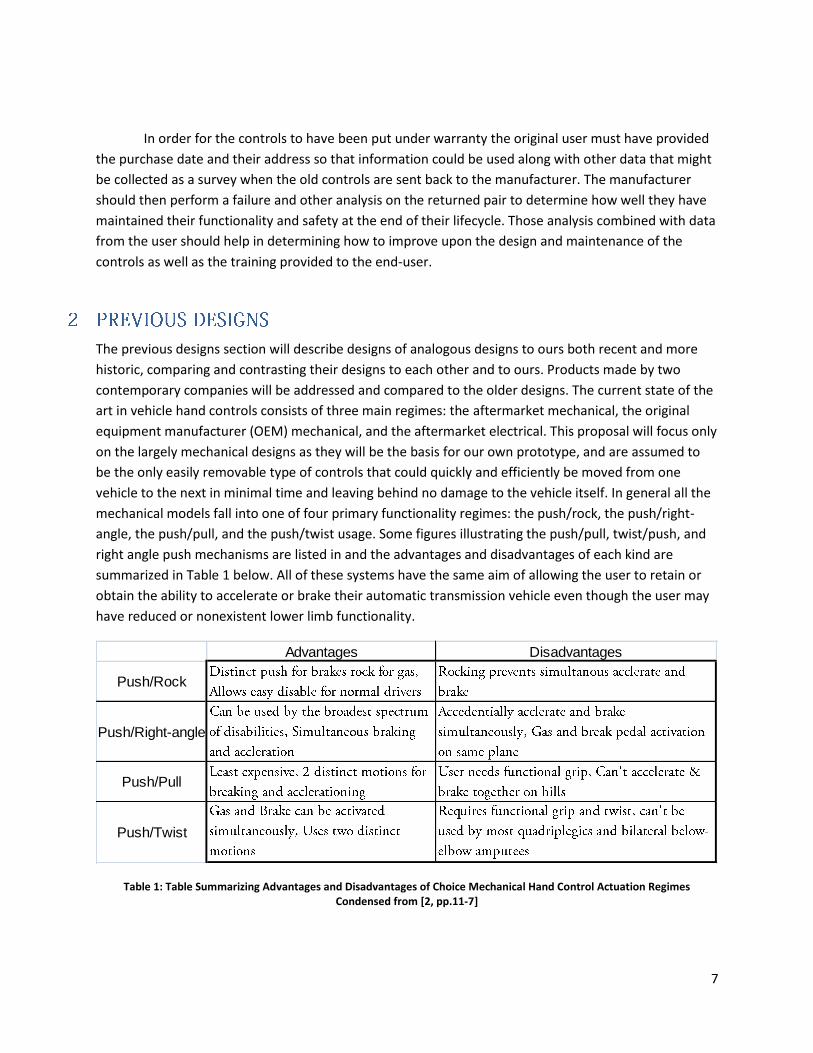
The previous designs section will describe designs of analogous designs to ours both recent and more
historic, comparing and contrasting their designs to each other and to ours. Products made by two
contemporary companies will be addressed and compared to the older designs. The current state of the
art in vehicle hand controls consists of three main regimes: the aftermarket mechanical, the original
equipment manufacturer (OEM) mechanical, and the aftermarket electrical. This proposal will focus only
on the largely mechanical designs as they will be the basis for our own prototype, and are assumed to
be the only easily removable type of controls that could quickly and efficiently be moved from one
vehicle to the next in minimal time and leaving behind no damage to the vehicle itself. In general all the
mechanical models fall into one of four primary functionality regimes: the push/rock, the push/right-
angle, the push/pull, and the push/twist usage. Some figures illustrating the push/pull, twist/push, and
right angle push mechanisms are listed in and the advantages and disadvantages of each kind are
summarized in Table 1 below. All of these systems have the same aim of allowing the user to retain or
obtain the ability to accelerate or brake their automatic transmission vehicle even though the user may
have reduced or nonexistent lower limb functionality.
Advantages Disadvantages
Push/Rock
Push/Right-angle
Push/Pull
Push/Twist
Table 1: Table Summarizing Advantages and Disadvantages of Choice Mechanical Hand Control Actuation Regimes Condensed from [2, pp.11-7]
8
Hand controls and other vehicle modifications are not a recent concern or invention of motor
vehicle modifiers. It is likely the case that once the automobile became an item affordable to not just
the most wealthy that there have been individuals who would need to have their vehicle modified in
order for them to drive it. World War II brought about a time when there would be wide availability of
vehicles for personal use once the war ended, but that would also have left a great number of
servicemen with lower limb and other mobility deficiencies that without vehicle modification would
render them incapable of driving. A Final Report on Vehicle Controls for Disabled Veterans[3] which was
published in 1945 just as the war was ending details the Brooks and Stevens Hand Control designed by a
Milwaukee resident Harry A. Krueger and another design by Stone Controls Inc. of Baltimore Maryland,
the “Stone Full Power Car Control. They are distinct from current hand controls in that they consists of
essentially a second smaller steering wheel centered beneath the actual one that one could push
forward for breaks or pull inward for gas using only a few fingers. They would work even while turning
the vehicle, and solves not only the problem of lower limb deficiencies, but would have also allowed
people with limited use of one of their hands to still drive as well. Even in 1945 Krueger expected that
“most postwar cars would have…automatic shift” and on page 21 of the Report[3] he himself can be seen
sitting on his legs in a vehicle with clutch, accelerator, and break removed to demonstrate his design.
The Stone Controls design utilized “full power brakes, clutch and throttle, operated by vacuum cylinders
and a hydraulic systems which are in turn controlled by valves”[3, p.24]. Stone even set the controls up so
that they “can be locked out easily and the car operated conventionally” [3, p.24], something that many
other designs don’t even mention as a feature, and that even today’s drivers appreciate to prevent
damage to their vehicles and others by accidental or disastrous usage by another driver who shouldn’t
be using the modified controls.
However, the steering ring design was not the only early mechanical variety of hand controls. The left
and right of steering wheel mounted “hand throttle” [3, p.76-7] allowed accelerator control via a long rod
connected via levers and springs to the carburetor. It is worth noting that the veterans who tested this
device found that the right hand le interfered with gearshifting when using hooks or artificial limbs.
Although, there may be even older and perhaps more sophisticated designs going back before the early
1940’s these designs show a level of mechanical integration with the vehicle itself that gradually
became lost as cars became less and less custom built highly particular crafts and more and more a
collection of standardized parts that become the manufactured vehicle. A “Double-Wheel Automotive
Hand Control System”[4] design similar to Krueger’s and the Stone design described above appears to
break the trend of lowered integration over time with a design that basically copies the 1940 double
wheel designs exactly in 1976 except just updated with a more modern late 1970’s servo system to
control the acceleration and braking in an automatic transmission car.
Two modern day controls that are manufactured by a company called SureGrip Hand Controls and
Veigel use basically the same design. Veigel does however claim on their website
http://www.mobilityproductsdesign.com/products.asp that they make hand controls that are quick and
easy to remove from the vehicle. Upon looking at their installation manuals it is obvious that all of the
dash mounted models will only be fully removed and installed in another vehicle by, not only someone
who is certified to do so, but it appears that it would take quite some time as well. A more compact
9
shifter like control (the 4100CL The Classic Hand Control by Veigel) appears as if it can be quickly and
easily removed, but the manufacturer provides no instruction manuals to verify installation difficulty.
SureGrip (http://www.suregrip-hvl.com/) manufactures the rock/pull controls profiled in Table 1. In
every design profiled here, including the ones who claim that they can be easily and quickly removed the
reality is that they in fact cannot. Even when borrowing from the state of the art mechanical hand
control designs today one will find the same principles in devices designed 60 years ago, but what will
define a necessary device is the need for people of all types to be as mobile and flexible as they have
ever been. The device which truly allows them to best achieve that goal facilitates the movement in
their lives.
One of the things we cherish most in life is freedom (independence), but most handicaps do not have
the opportunity to live independently as most of us as they tend to rely on people and loved ones to
assist them with day-to-day activities. Our objective as a team is to design a product that will minimize
or eliminate one of the burdens handicaps experience, travelling/mobility. Based on our research and
survey, we decided to build a vehicle hand control mechanism, which must satisfy the following
criterion:
We are determined to make this product as cost efficient as possible and easily affordable by
our consumers. Cheaper than what our competitors are offering for similar products in the
market - average prices of $1200 without sacrificing functionality and safety. This will be
achieved by carefully surveying our proposed customers, taking their suggestions into
consideration.
Compact and easily collapsible.
Light weight. Less than 25lbs.
10
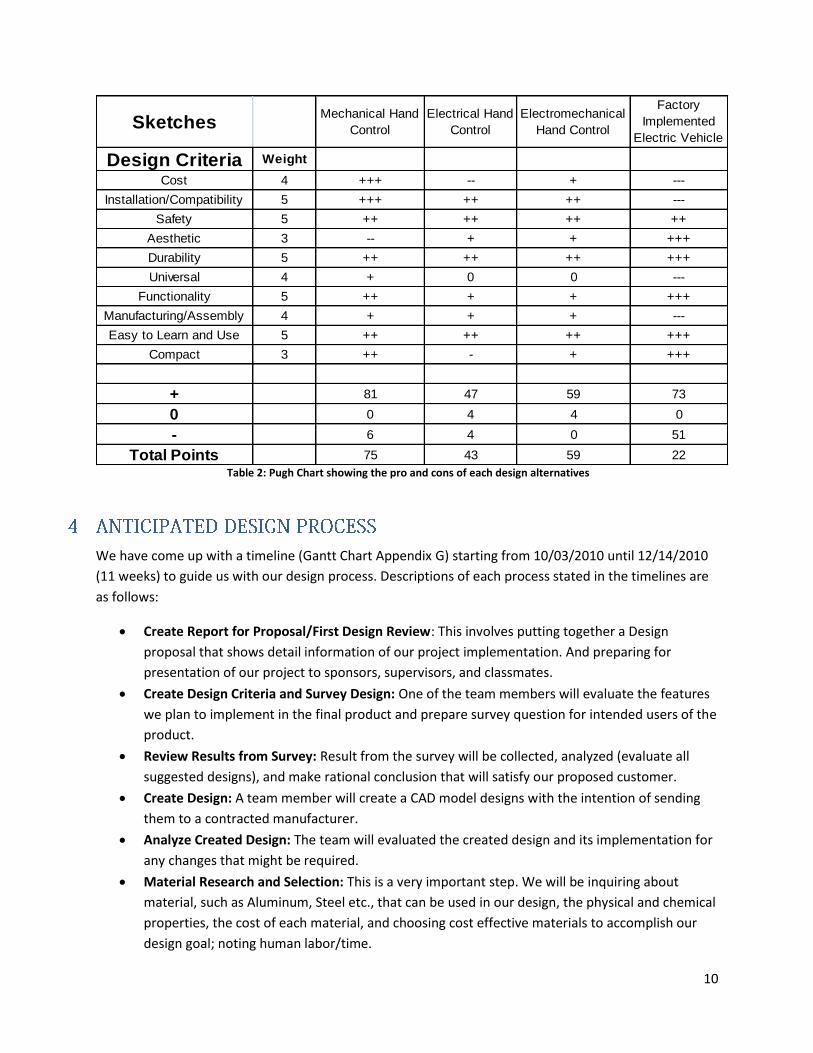
SketchesMechanical Hand
Control
Electrical Hand
Control
Electromechanical
Hand Control
Factory
Implemented
Electric Vehicle
Control SystemDesign Criteria Weight
Cost 4 +++ -- + ---
Installation/Compatibility 5 +++ ++ ++ ---
Safety 5 ++ ++ ++ ++
Aesthetic 3 -- + + +++
Durability 5 ++ ++ ++ +++
Universal 4 + 0 0 ---
Functionality 5 ++ + + +++
Manufacturing/Assembly 4 + + + ---
Easy to Learn and Use 5 ++ ++ ++ +++
Compact 3 ++ - + +++
+ 81 47 59 73
0 0 4 4 0
- 6 4 0 51
Total Points 75 43 59 22
Table 2: Pugh Chart showing the pro and cons of each design alternatives
We have come up with a timeline (Gantt Chart Appendix G) starting from 10/03/2010 until 12/14/2010
(11 weeks) to guide us with our design process. Descriptions of each process stated in the timelines are
as follows:
Create Report for Proposal/First Design Review: This involves putting together a Design
proposal that shows detail information of our project implementation. And preparing for
presentation of our project to sponsors, supervisors, and classmates.
Create Design Criteria and Survey Design: One of the team members will evaluate the features
we plan to implement in the final product and prepare survey question for intended users of the
product.
Review Results from Survey: Result from the survey will be collected, analyzed (evaluate all
suggested designs), and make rational conclusion that will satisfy our proposed customer.
Create Design: A team member will create a CAD model designs with the intention of sending
them to a contracted manufacturer.
Analyze Created Design: The team will evaluated the created design and its implementation for
any changes that might be required.
Material Research and Selection: This is a very important step. We will be inquiring about
material, such as Aluminum, Steel etc., that can be used in our design, the physical and chemical
properties, the cost of each material, and choosing cost effective materials to accomplish our
design goal; noting human labor/time.
11
Ergonomic Optimization: Will find the optimal relationship between all the functional lengths of
the components of the mechanism.
Mechanical Optimization: Use beam and buckling equations to determine how failure is related
to minimum material and cost.
Microeconomics: Defining the economic realities relate with manufacturing and selling a
product by studying how well objective functions/variables will maximize profit.
Build a Beta-Prototype: A design prototype will be built to demonstrate to sponsors, supervisors
and classmates what to expect from the final product with respect to aesthetic and functions.
Review Final Design: After analyzing the results from the survey, we will again asses our final
design to make sure it is feasible and will satisfy our proposed customer’s reasonable
requirements.
Create a Marketing Model: Refine the demand model that was generated from earlier from
microeconomic analysis, and looking at the impact on design decisions.
Assembly of Model: Putting together the pieces we machined from the previous step; make it
appear as aesthetic as possible.
Create Business Opportunities: Redefine business objectives, product description, market
analysis, and Capital and personal resources.
Create Financial Data: Generate capital equipment supply list, breakeven analysis, and three-
year summary revenue and cost projections
Analyze and Test Final Design Model: Physically evaluate our final designed product and we will
install our product in various vehicle to run test and asses results to ensure all objectives are
satisfied.
Create Technical Analysis and Benchmarking: Research on existing patents and evaluate stated
objectives with respect to the final design.
Other issues we will be working on to ensure the perfection of our design are:
Create Report for Progress/Second Design Review: As the semester goes on, we are required to present the progress of our project stating difficulties encountered or changes we might have made from the previous presentation. Our team will have to prepare this presentation to account for the alteration made if any.
Create Business Plan: We will have to construct ways of how to market our product to suppliers and end-user. And perform dry test on our product. Results or survey from dry test will be weigh to predict expected performance and reactions from our consumers.
Create Final Report: The final report we give the detail information of things we did to accomplish the final design.
Create Design Exposition Poster: This is steps involves marketing/showcasing our final design.
One of the design prototypes we thought of was to build an electrical hand control system. This system
will make use of two electrical actuators, each attached to the brake pedal and gas pedal. We had in
mind we might need to use two different types of actuators based on the force per pound each can push
on, depth and the speed since we realized most vehicles have brake and gas pedals that vary in the
amount of force required to trigger each.
12
These actuators were suppose to be connected to two wireless or wired controls, one for the brake
pedal and the other for the gas pedal; mounted on the steering wheel, center console, or where it can
be easily reached by the driver; and powered by the in-car 12V cigarette lighter socket.
Our concerns with this prototype was staying within budget, and maintaining functionality and safety
while operating a vehicle. We learnt we might exceed our stated budget because both actuators needed
will cost about $240.00 without considering switches, wiring, power adaptor etc., The significant part of
the design is electrical, but all members in the team are more comfortable with mechanical things, Will
require car modification.
In case of an unexpected incident such as unanticipated (quick) braking and quick deactivation the gas
pedal, finding a quick response variable switch to counter such incident could be an issue. Using surveys
and the Pugh Chart we were able to narrow our final decision.
4.1 LEGAL REQUIREMENTS AND SAFETY CONCERNS
Although there are currently no federal laws governing hand control manufacturing in the United States,
but The Society of Automotive Engineers came up with SAE Standard J1903 – Recommended Practice
Automotive Adaptive Driver Controls published in August 2001 on hand control usage and safety
assessment.
Vehicle hand controls are strictly restricted to physically challenged individuals who cannot control gas
and brake pedals traditionally with their feet except in the case of training by an able person. Prior to
getting a vehicle hand control a driver rehabilitation specialist, preferably a certified one, accesses an
individual on how well the individual is able to operate secondary controls such as turn signals while
operating the hand control. If individual passes the evaluation, the rehabilitation specialist then and
prescribe a vehicle hand. This is a guideline that was mandated by National Mobility Equipment Dealers
Association (NMEDA). The individual must be effectively trained on how to operate the device that s/he
will be using. The vehicle must be in good mechanical condition. Also a proper state license with
necessary restriction is required.
Most vehicle hand control installation involves tampering with knee bolster’s airbags (below the
baseboard/steering) if equipped with one which helps to prevent severe injury to the legs in case of
crash. It is highly recommended to discuss this safety concerns with installer if there could be ways to
install the device without having to disable/tamper with the airbags.
Based on a research conducted by the team there are several existing solutions for a driving aid system.
Some of these systems are stated below:
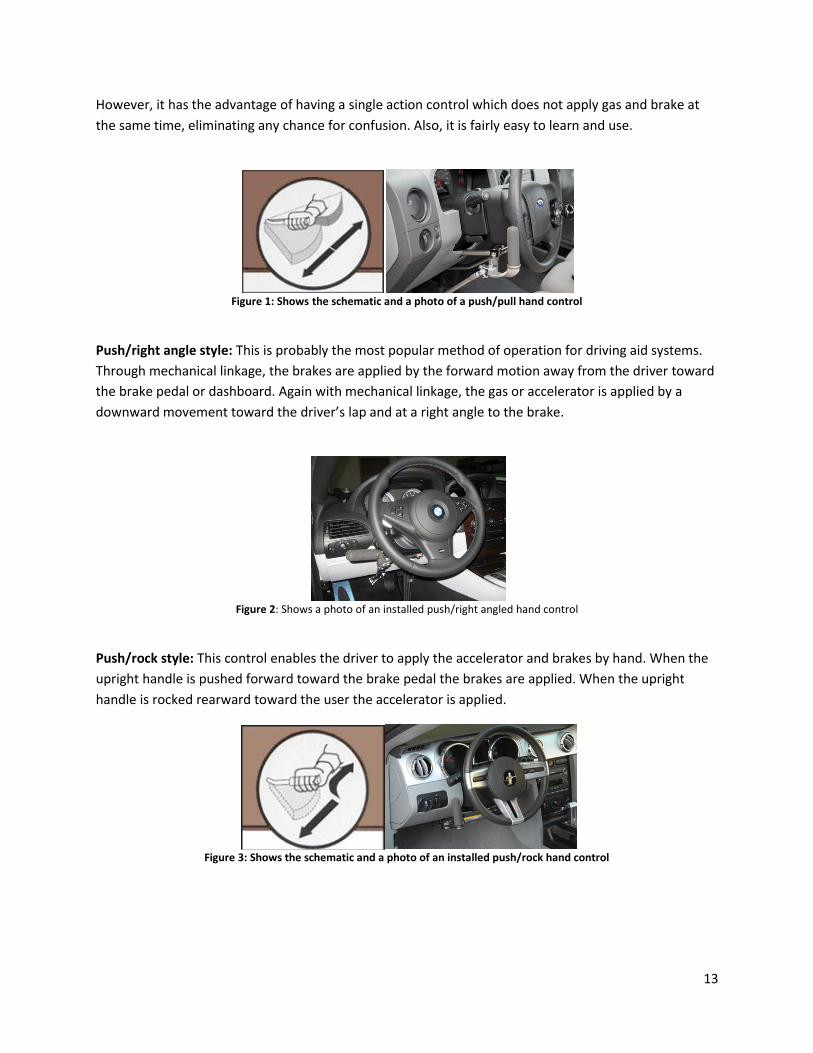
Push/Pull system: Push/Pull Hand Control operates by pushing down the handle toward the floor for
brake and pull back for acceleration. This system uses a somewhat complex mechanical linkage.
13
However, it has the advantage of having a single action control which does not apply gas and brake at
the same time, eliminating any chance for confusion. Also, it is fairly easy to learn and use.
Figure 1: Shows the schematic and a photo of a push/pull hand control
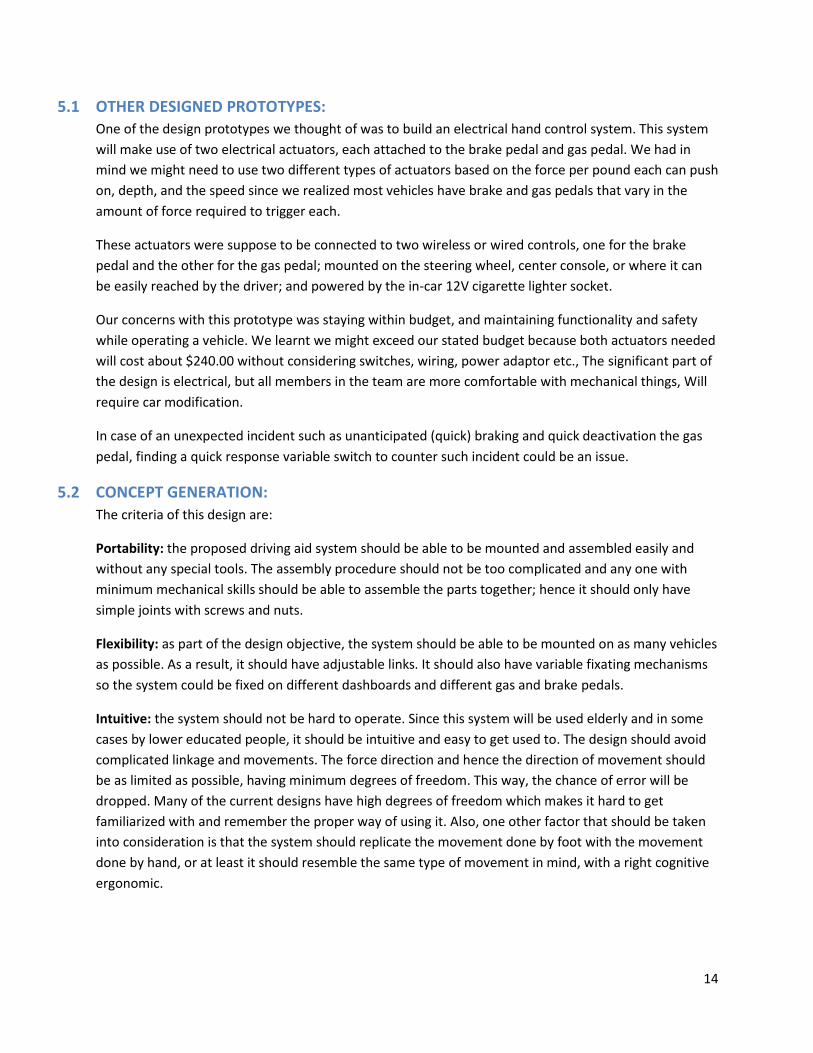
Push/right angle style: This is probably the most popular method of operation for driving aid systems.
Through mechanical linkage, the brakes are applied by the forward motion away from the driver toward
the brake pedal or dashboard. Again with mechanical linkage, the gas or accelerator is applied by a
downward movement toward the driver’s lap and at a right angle to the brake.
Figure 2: Shows a photo of an installed push/right angled hand control
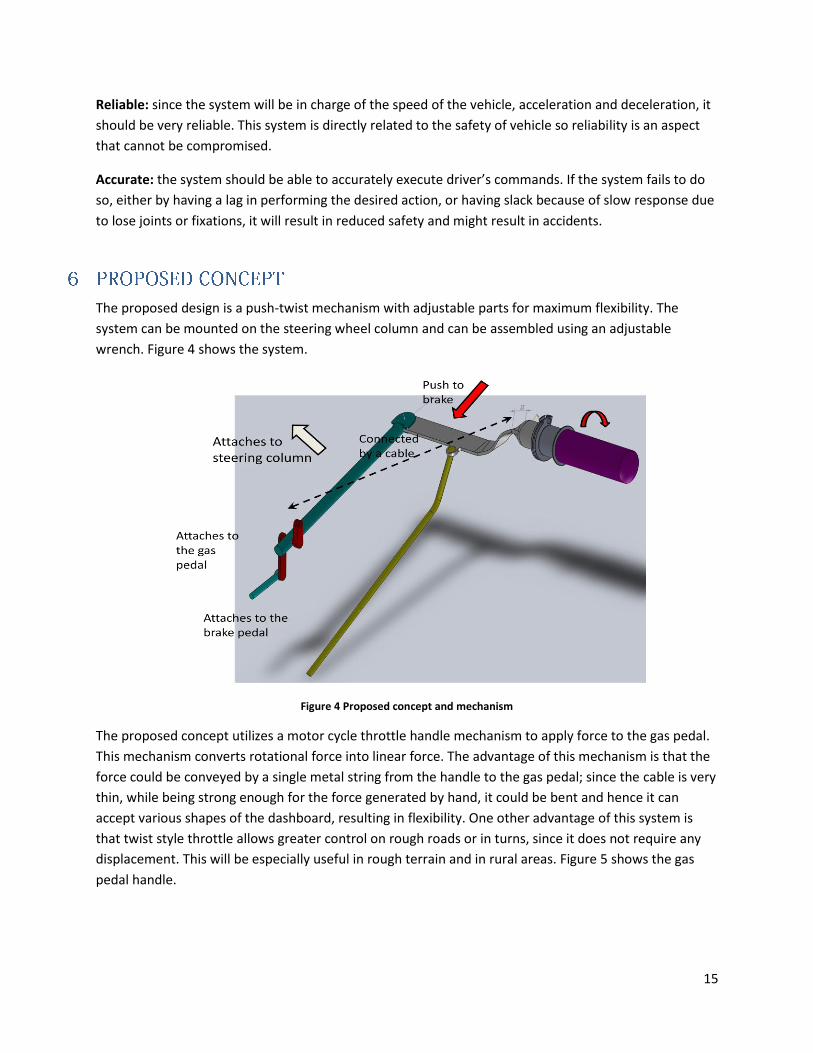
Push/rock style: This control enables the driver to apply the accelerator and brakes by hand. When the
upright handle is pushed forward toward the brake pedal the brakes are applied. When the upright
handle is rocked rearward toward the user the accelerator is applied.
Figure 3: Shows the schematic and a photo of an installed push/rock hand control
14
5.1 OTHER DESIGNED PROTOTYPES:
One of the design prototypes we thought of was to build an electrical hand control system. This system
will make use of two electrical actuators, each attached to the brake pedal and gas pedal. We had in
mind we might need to use two different types of actuators based on the force per pound each can push
on, depth, and the speed since we realized most vehicles have brake and gas pedals that vary in the
amount of force required to trigger each.
These actuators were suppose to be connected to two wireless or wired controls, one for the brake
pedal and the other for the gas pedal; mounted on the steering wheel, center console, or where it can
be easily reached by the driver; and powered by the in-car 12V cigarette lighter socket.
Our concerns with this prototype was staying within budget, and maintaining functionality and safety
while operating a vehicle. We learnt we might exceed our stated budget because both actuators needed
will cost about $240.00 without considering switches, wiring, power adaptor etc., The significant part of
the design is electrical, but all members in the team are more comfortable with mechanical things, Will
require car modification.
In case of an unexpected incident such as unanticipated (quick) braking and quick deactivation the gas
pedal, finding a quick response variable switch to counter such incident could be an issue.
5.2 CONCEPT GENERATION:
The criteria of this design are:
Portability: the proposed driving aid system should be able to be mounted and assembled easily and
without any special tools. The assembly procedure should not be too complicated and any one with
minimum mechanical skills should be able to assemble the parts together; hence it should only have
simple joints with screws and nuts.
Flexibility: as part of the design objective, the system should be able to be mounted on as many vehicles
as possible. As a result, it should have adjustable links. It should also have variable fixating mechanisms
so the system could be fixed on different dashboards and different gas and brake pedals.
Intuitive: the system should not be hard to operate. Since this system will be used elderly and in some
cases by lower educated people, it should be intuitive and easy to get used to. The design should avoid
complicated linkage and movements. The force direction and hence the direction of movement should
be as limited as possible, having minimum degrees of freedom. This way, the chance of error will be
dropped. Many of the current designs have high degrees of freedom which makes it hard to get
familiarized with and remember the proper way of using it. Also, one other factor that should be taken
into consideration is that the system should replicate the movement done by foot with the movement
done by hand, or at least it should resemble the same type of movement in mind, with a right cognitive
ergonomic.
15
Reliable: since the system will be in charge of the speed of the vehicle, acceleration and deceleration, it
should be very reliable. This system is directly related to the safety of vehicle so reliability is an aspect
that cannot be compromised.
Accurate: the system should be able to accurately execute driver’s commands. If the system fails to do
so, either by having a lag in performing the desired action, or having slack because of slow response due
to lose joints or fixations, it will result in reduced safety and might result in accidents.
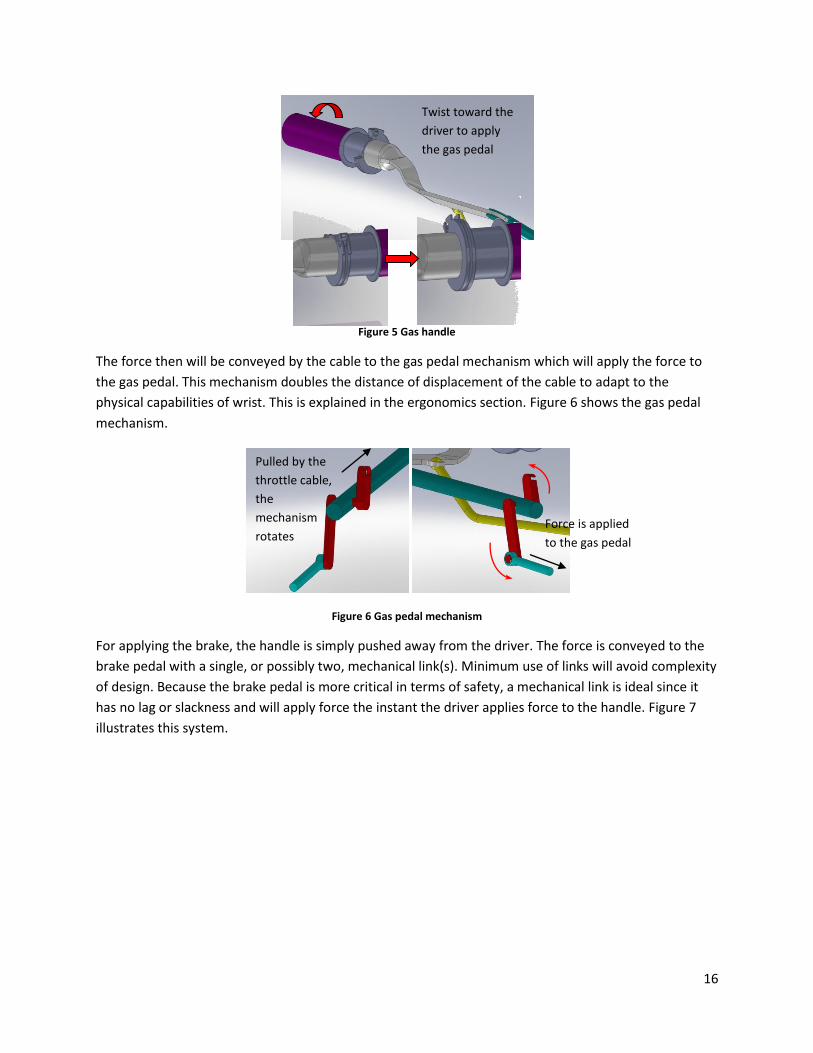
The proposed design is a push-twist mechanism with adjustable parts for maximum flexibility. The
system can be mounted on the steering wheel column and can be assembled using an adjustable
wrench. Figure 4 shows the system.
Figure 4 Proposed concept and mechanism
The proposed concept utilizes a motor cycle throttle handle mechanism to apply force to the gas pedal.
This mechanism converts rotational force into linear force. The advantage of this mechanism is that the
force could be conveyed by a single metal string from the handle to the gas pedal; since the cable is very
thin, while being strong enough for the force generated by hand, it could be bent and hence it can
accept various shapes of the dashboard, resulting in flexibility. One other advantage of this system is
that twist style throttle allows greater control on rough roads or in turns, since it does not require any
displacement. This will be especially useful in rough terrain and in rural areas. Figure 5 shows the gas
pedal handle.
16
Figure 5 Gas handle
The force then will be conveyed by the cable to the gas pedal mechanism which will apply the force to
the gas pedal. This mechanism doubles the distance of displacement of the cable to adapt to the
physical capabilities of wrist. This is explained in the ergonomics section. Figure 6 shows the gas pedal
mechanism.
Figure 6 Gas pedal mechanism
For applying the brake, the handle is simply pushed away from the driver. The force is conveyed to the
brake pedal with a single, or possibly two, mechanical link(s). Minimum use of links will avoid complexity
of design. Because the brake pedal is more critical in terms of safety, a mechanical link is ideal since it
has no lag or slackness and will apply force the instant the driver applies force to the handle. Figure 7
illustrates this system.
Twist toward the
driver to apply
the gas pedal
Pulled by the
throttle cable,
the
mechanism
rotates Force is applied
to the gas pedal
17
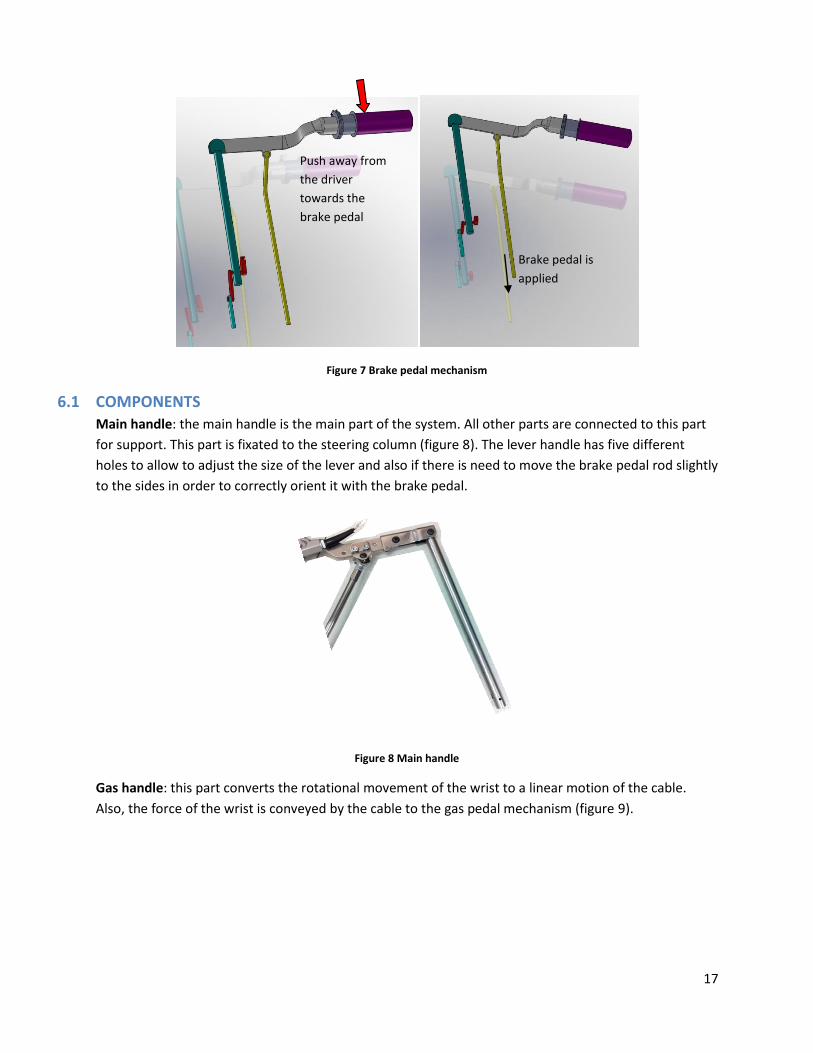
Figure 7 Brake pedal mechanism
6.1 COMPONENTS Main handle: the main handle is the main part of the system. All other parts are connected to this part
for support. This part is fixated to the steering column (figure 8). The lever handle has five different
holes to allow to adjust the size of the lever and also if there is need to move the brake pedal rod slightly
to the sides in order to correctly orient it with the brake pedal.
Figure 8 Main handle
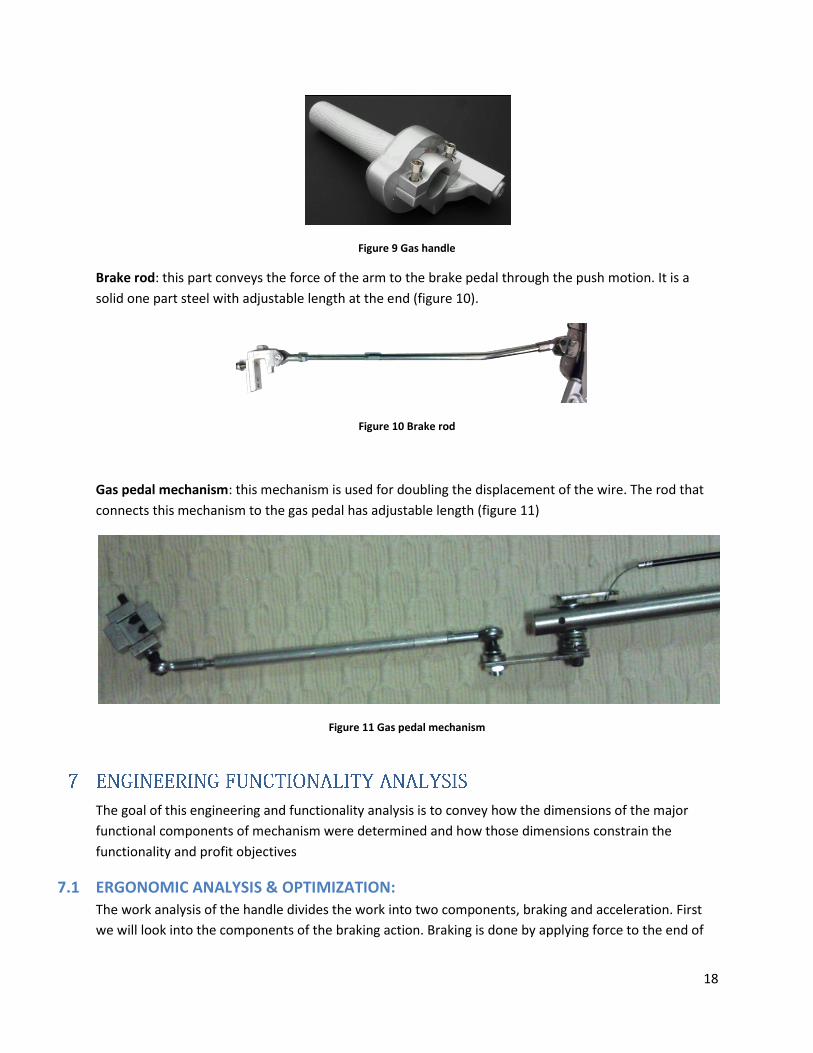
Gas handle: this part converts the rotational movement of the wrist to a linear motion of the cable.
Also, the force of the wrist is conveyed by the cable to the gas pedal mechanism (figure 9).
Push away from
the driver
towards the
brake pedal
Brake pedal is
applied
18
Figure 9 Gas handle
Brake rod: this part conveys the force of the arm to the brake pedal through the push motion. It is a
solid one part steel with adjustable length at the end (figure 10).
Figure 10 Brake rod
Gas pedal mechanism: this mechanism is used for doubling the displacement of the wire. The rod that
connects this mechanism to the gas pedal has adjustable length (figure 11)
Figure 11 Gas pedal mechanism
The goal of this engineering and functionality analysis is to convey how the dimensions of the major
functional components of mechanism were determined and how those dimensions constrain the
functionality and profit objectives
7.1 ERGONOMIC ANALYSIS & OPTIMIZATION:
The work analysis of the handle divides the work into two components, braking and acceleration. First
we will look into the components of the braking action. Braking is done by applying force to the end of
19
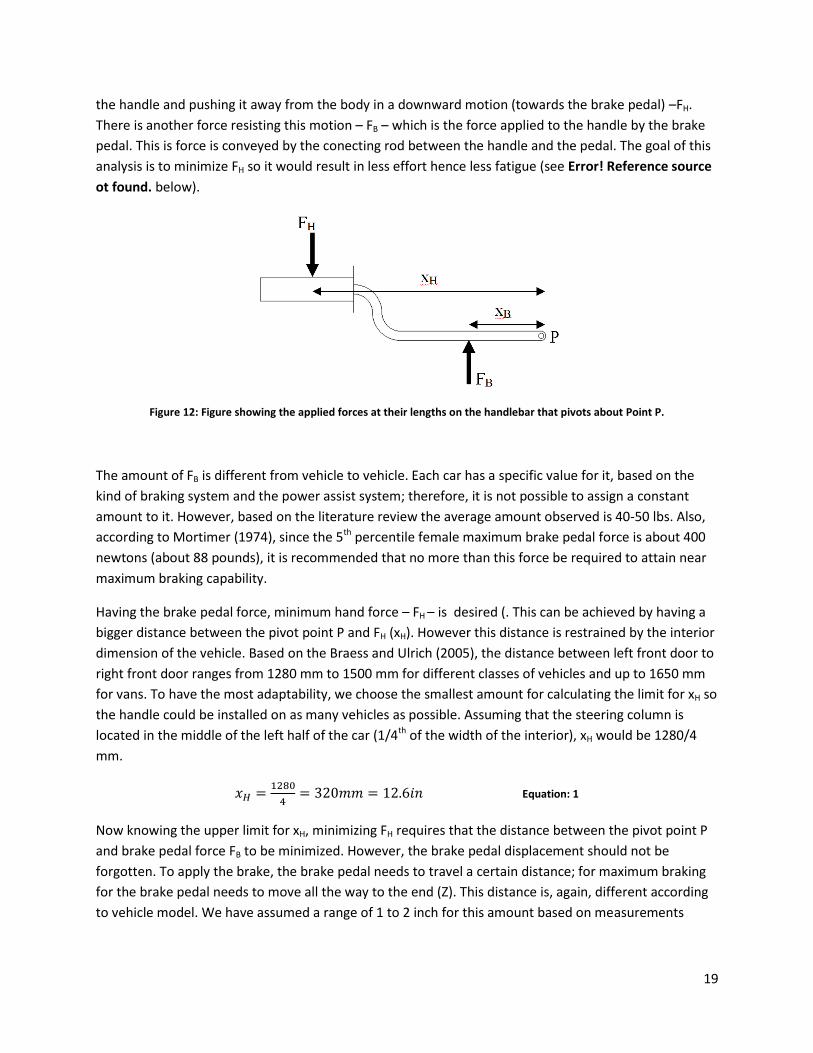
the handle and pushing it away from the body in a downward motion (towards the brake pedal) –FH.
There is another force resisting this motion – FB – which is the force applied to the handle by the brake
pedal. This is force is conveyed by the conecting rod between the handle and the pedal. The goal of this
analysis is to minimize FH so it would result in less effort hence less fatigue (see Error! Reference source
ot found. below).
Figure 12: Figure showing the applied forces at their lengths on the handlebar that pivots about Point P.
The amount of FB is different from vehicle to vehicle. Each car has a specific value for it, based on the
kind of braking system and the power assist system; therefore, it is not possible to assign a constant
amount to it. However, based on the literature review the average amount observed is 40-50 lbs. Also,
according to Mortimer (1974), since the 5th percentile female maximum brake pedal force is about 400
newtons (about 88 pounds), it is recommended that no more than this force be required to attain near
maximum braking capability.
Having the brake pedal force, minimum hand force – FH – is desired (. This can be achieved by having a
bigger distance between the pivot point P and FH (xH). However this distance is restrained by the interior
dimension of the vehicle. Based on the Braess and Ulrich (2005), the distance between left front door to
right front door ranges from 1280 mm to 1500 mm for different classes of vehicles and up to 1650 mm
for vans. To have the most adaptability, we choose the smallest amount for calculating the limit for xH so
the handle could be installed on as many vehicles as possible. Assuming that the steering column is
located in the middle of the left half of the car (1/4th of the width of the interior), xH would be 1280/4
mm.
Equation: 1
Now knowing the upper limit for xH, minimizing FH requires that the distance between the pivot point P
and brake pedal force FB to be minimized. However, the brake pedal displacement should not be
forgotten. To apply the brake, the brake pedal needs to travel a certain distance; for maximum braking
for the brake pedal needs to move all the way to the end (Z). This distance is, again, different according
to vehicle model. We have assumed a range of 1 to 2 inch for this amount based on measurements
20
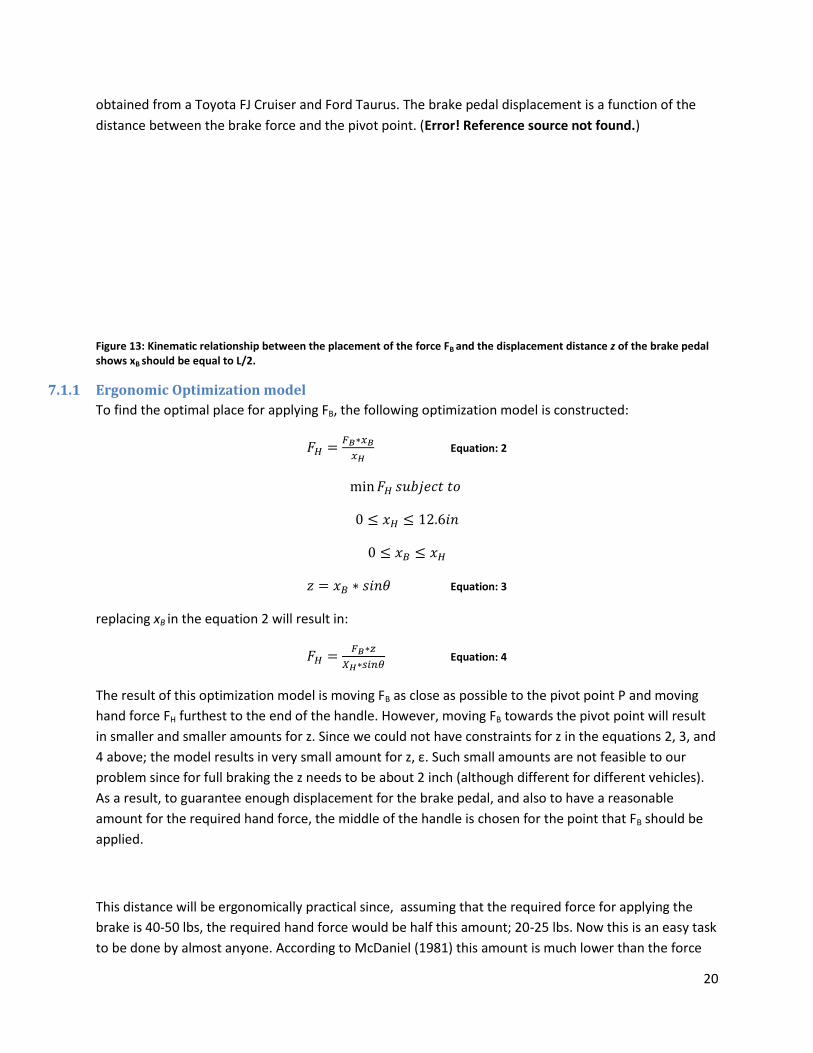
obtained from a Toyota FJ Cruiser and Ford Taurus. The brake pedal displacement is a function of the
distance between the brake force and the pivot point. (Error! Reference source not found.)
Figure 13: Kinematic relationship between the placement of the force FB and the displacement distance z of the brake pedal shows xB should be equal to L/2.
7.1.1 Ergonomic Optimization model
To find the optimal place for applying FB, the following optimization model is constructed:
Equation: 2
Equation: 3
replacing xB in the equation 2 will result in:
Equation: 4
The result of this optimization model is moving FB as close as possible to the pivot point P and moving
hand force FH furthest to the end of the handle. However, moving FB towards the pivot point will result
in smaller and smaller amounts for z. Since we could not have constraints for z in the equations 2, 3, and
4 above; the model results in very small amount for z, ε. Such small amounts are not feasible to our
problem since for full braking the z needs to be about 2 inch (although different for different vehicles).
As a result, to guarantee enough displacement for the brake pedal, and also to have a reasonable
amount for the required hand force, the middle of the handle is chosen for the point that FB should be
applied.
This distance will be ergonomically practical since, assuming that the required force for applying the
brake is 40-50 lbs, the required hand force would be half this amount; 20-25 lbs. Now this is an easy task
to be done by almost anyone. According to McDaniel (1981) this amount is much lower than the force
21
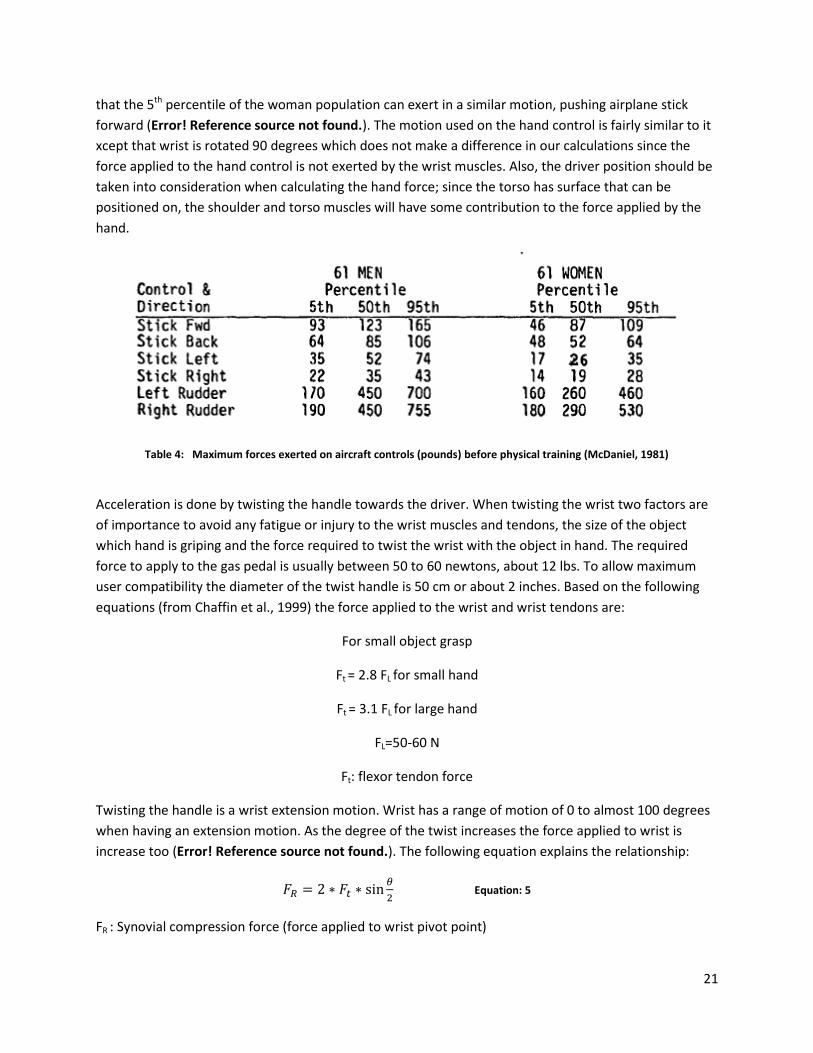
that the 5th percentile of the woman population can exert in a similar motion, pushing airplane stick
forward (Error! Reference source not found.). The motion used on the hand control is fairly similar to it
xcept that wrist is rotated 90 degrees which does not make a difference in our calculations since the
force applied to the hand control is not exerted by the wrist muscles. Also, the driver position should be
taken into consideration when calculating the hand force; since the torso has surface that can be
positioned on, the shoulder and torso muscles will have some contribution to the force applied by the
hand.
Table 4: Maximum forces exerted on aircraft controls (pounds) before physical training (McDaniel, 1981)
Acceleration is done by twisting the handle towards the driver. When twisting the wrist two factors are
of importance to avoid any fatigue or injury to the wrist muscles and tendons, the size of the object
which hand is griping and the force required to twist the wrist with the object in hand. The required
force to apply to the gas pedal is usually between 50 to 60 newtons, about 12 lbs. To allow maximum
user compatibility the diameter of the twist handle is 50 cm or about 2 inches. Based on the following
equations (from Chaffin et al., 1999) the force applied to the wrist and wrist tendons are:
For small object grasp
Ft = 2.8 FL for small hand
Ft = 3.1 FL for large hand
FL=50-60 N
Ft: flexor tendon force
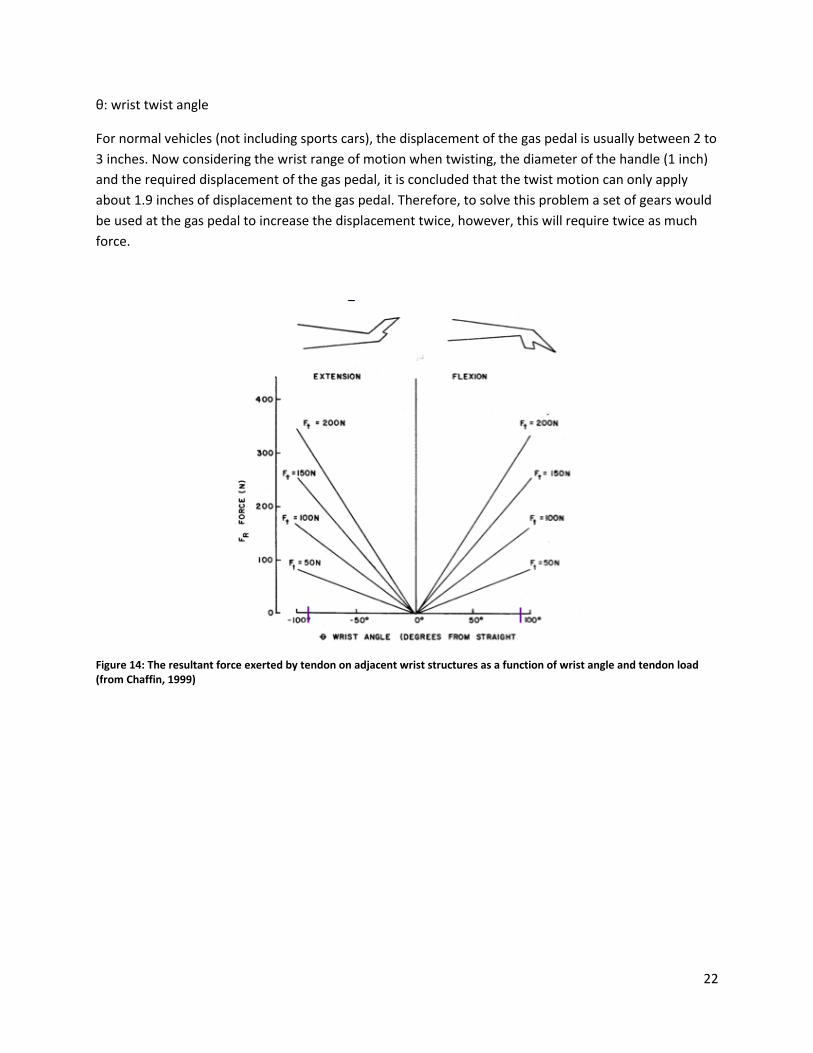
Twisting the handle is a wrist extension motion. Wrist has a range of motion of 0 to almost 100 degrees
when having an extension motion. As the degree of the twist increases the force applied to wrist is
increase too (Error! Reference source not found.). The following equation explains the relationship:
Equation: 5
FR : Synovial compression force (force applied to wrist pivot point)
22
θ: wrist twist angle
For normal vehicles (not including sports cars), the displacement of the gas pedal is usually between 2 to
3 inches. Now considering the wrist range of motion when twisting, the diameter of the handle (1 inch)
and the required displacement of the gas pedal, it is concluded that the twist motion can only apply
about 1.9 inches of displacement to the gas pedal. Therefore, to solve this problem a set of gears would
be used at the gas pedal to increase the displacement twice, however, this will require twice as much
force.
Figure 14: The resultant force exerted by tendon on adjacent wrist structures as a function of wrist angle and tendon load (from Chaffin, 1999)
23
7.2 MECHANICAL MODEL
7.2.1 Approach
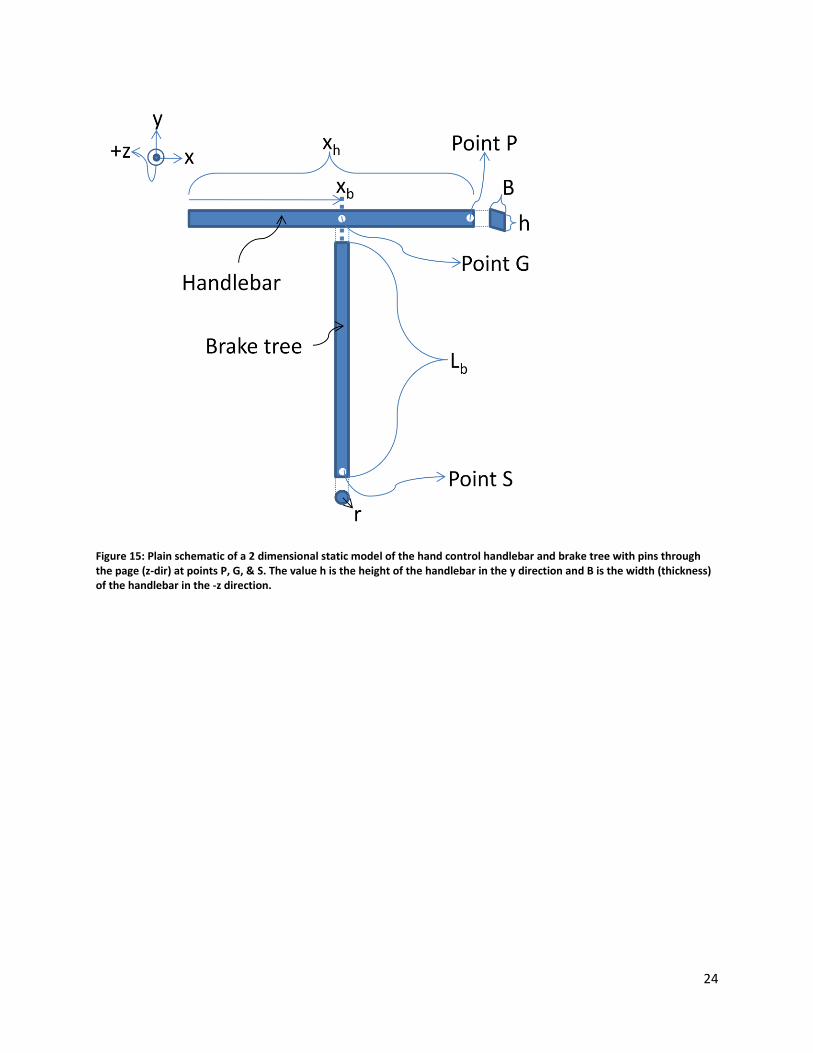
Now that the dimensions and functionality of the major braking and acceleration components have
been identified from a practical user ergonomic standpoint the purpose of this mechanical model will be
to determine the appropriate material to use based on the strength and yield characteristics needed for
the design, and reasonable thicknesses (B) and radii (r) handlebar of the main components of the hand
controls. Also a reasonable location of the placement of the brake tree connection to the handlebar will
be derived from a mechanical standpoint. The basic schematic is shown in Error! Reference source not
ound. below, and assumes that the handlebar component experiences the Euler-Bernoulli beam
deflection in the positive and negative y direction. This means that the components are assumed initially
straight before forces are applied, and that they are made of the same isotropic materials with no
defects or holes. The brake tree component is assumed to be a 2 force member pinned at points G and
S. The connection of the brake tree to the brake pedal through a clamp fixture (not shown) occurs at
point S. Essentially the user would depress the handle bar in the negative y direction near xb = 0 and that
force would transmit through the mechanism pushing down the brake (in the –y-dir) at point S. The
forces encountered by the components under such usage are displayed in Error! Reference source not
ound..
24
Figure 15: Plain schematic of a 2 dimensional static model of the hand control handlebar and brake tree with pins through the page (z-dir) at points P, G, & S. The value h is the height of the handlebar in the y direction and B is the width (thickness) of the handlebar in the -z direction.
25
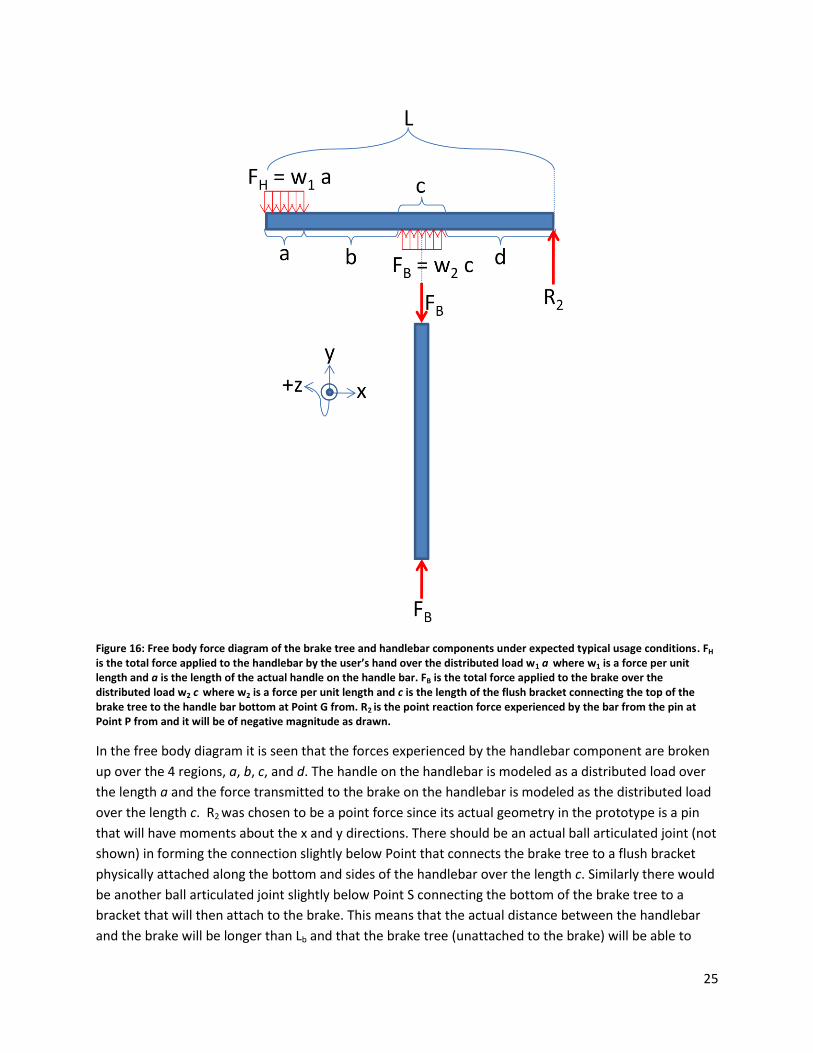
Figure 16: Free body force diagram of the brake tree and handlebar components under expected typical usage conditions. FH is the total force applied to the handlebar by the user’s hand over the distributed load w1 a where w1 is a force per unit length and a is the length of the actual handle on the handle bar. FB is the total force applied to the brake over the distributed load w2 c where w2 is a force per unit length and c is the length of the flush bracket connecting the top of the brake tree to the handle bar bottom at Point G from. R2 is the point reaction force experienced by the bar from the pin at Point P from and it will be of negative magnitude as drawn.
In the free body diagram it is seen that the forces experienced by the handlebar component are broken
up over the 4 regions, a, b, c, and d. The handle on the handlebar is modeled as a distributed load over
the length a and the force transmitted to the brake on the handlebar is modeled as the distributed load
over the length c. R2 was chosen to be a point force since its actual geometry in the prototype is a pin
that will have moments about the x and y directions. There should be an actual ball articulated joint (not
shown) in forming the connection slightly below Point that connects the brake tree to a flush bracket
physically attached along the bottom and sides of the handlebar over the length c. Similarly there would
be another ball articulated joint slightly below Point S connecting the bottom of the brake tree to a
bracket that will then attach to the brake. This means that the actual distance between the handlebar
and the brake will be longer than Lb and that the brake tree (unattached to the brake) will be able to
26
(over about 160 degrees) pivot freely without experiencing moments in the x, y, or z directions. Thus the
brake tree can move in all three dimensions, but only 2 of those dimensions (assumed to contain the
majority of the deflection) will be modeled.
First the force, moment, deflection, and bending stress profiles for the handlebar are obtained to
determine conditions for failure in that component. Then the maximum stress until buckling is evaluated
for the brake tree component. A relationship between the yield stress of the material used for the
handlebar and the thickness B is derived as a function of the maximum bending moment and is utilized
to find an optimal relationship between B and material based on cost.
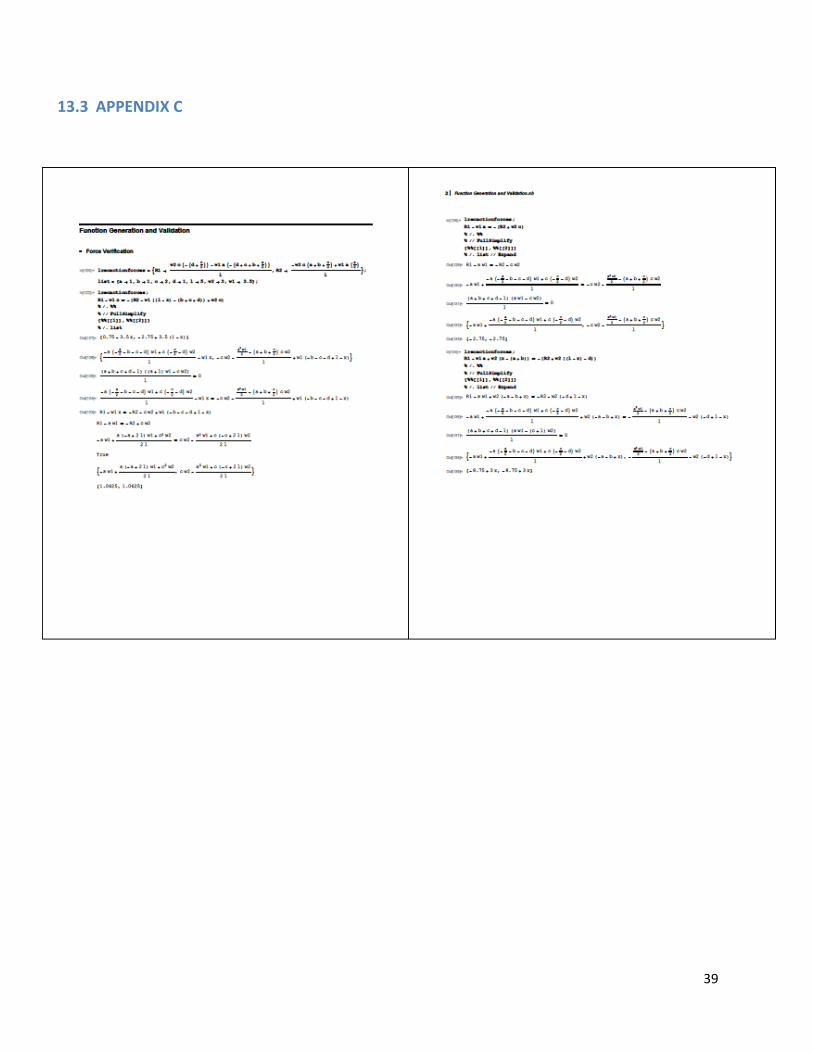
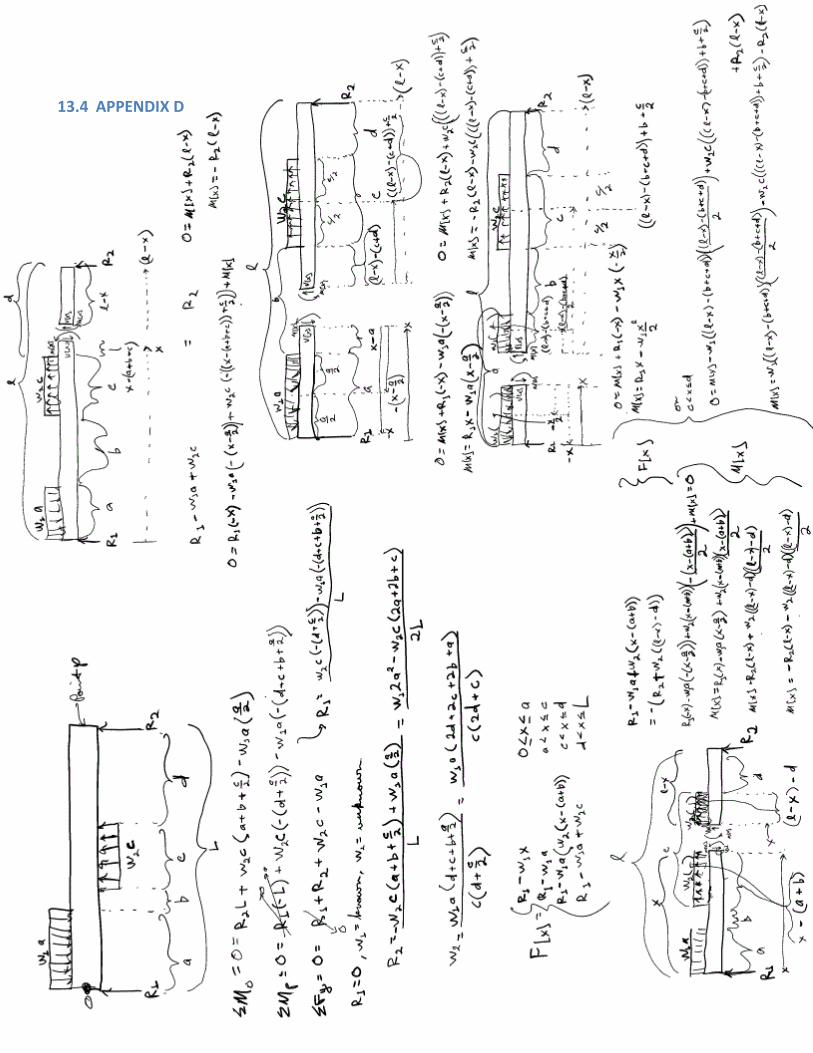
7.2.2 Determining Sheer Force, Moment, Deflection, and Bending Stress Profiles for Handlebar
Component
All of the beam equations were derived by a method of sections (see the complete and detailed method
in appendix D and computer numeric verification of the force and moment equations in appendix C.
Note that appendix C uses the symbol and direction convention of Error! Reference source not found.
ith the exceptions that the length of the handlebar section in appendix D is equivalent to L in Error!
Reference source not found. and that R1 is set to 0. In short the sheer force equation F[x], is determined
by the method of sections and similarly is the bending moment equation, M[x]. The bending moment
equation is then integrated twice with the proper boundary conditions giving a deflection equation (the
full process is explained in detail in Appendix).
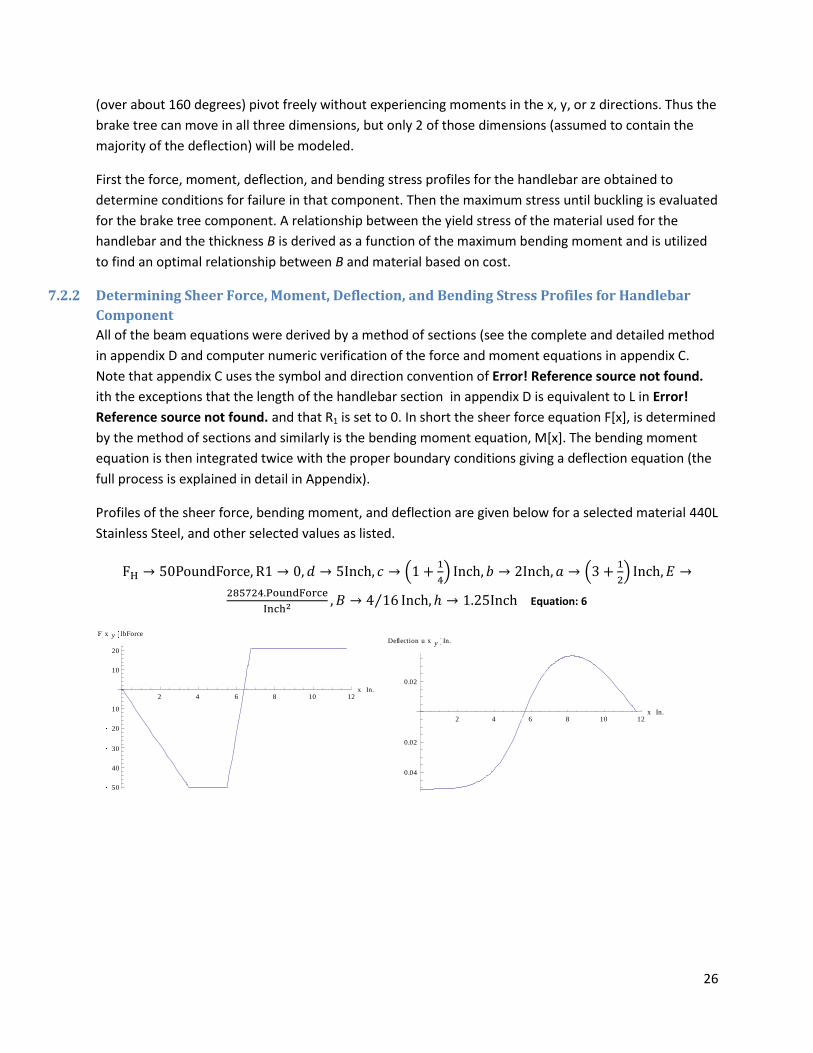
Profiles of the sheer force, bending moment, and deflection are given below for a selected material 440L
Stainless Steel, and other selected values as listed.
Equation: 6
2 4 6 8 10 12x In.
50
40
30
20
10
10
20
F x y lbForce
2 4 6 8 10 12x In.
0.04
0.02
0.02
Deflection u x y In.
27
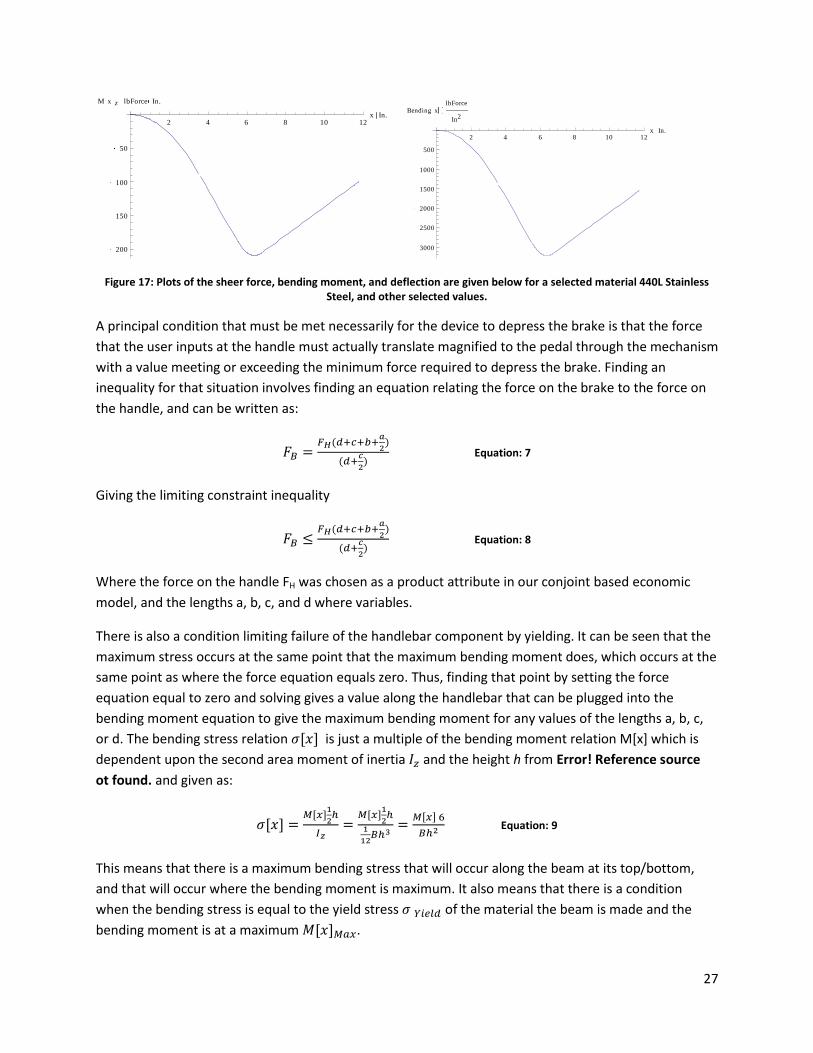
Figure 17: Plots of the sheer force, bending moment, and deflection are given below for a selected material 440L Stainless Steel, and other selected values.
A principal condition that must be met necessarily for the device to depress the brake is that the force
that the user inputs at the handle must actually translate magnified to the pedal through the mechanism
with a value meeting or exceeding the minimum force required to depress the brake. Finding an
inequality for that situation involves finding an equation relating the force on the brake to the force on
the handle, and can be written as:
Equation: 7
Giving the limiting constraint inequality
Equation: 8
Where the force on the handle FH was chosen as a product attribute in our conjoint based economic
model, and the lengths a, b, c, and d where variables.
There is also a condition limiting failure of the handlebar component by yielding. It can be seen that the
maximum stress occurs at the same point that the maximum bending moment does, which occurs at the
same point as where the force equation equals zero. Thus, finding that point by setting the force
equation equal to zero and solving gives a value along the handlebar that can be plugged into the
bending moment equation to give the maximum bending moment for any values of the lengths a, b, c,
or d. The bending stress relation is just a multiple of the bending moment relation M[x] which is
dependent upon the second area moment of inertia and the height h from Error! Reference source
ot found. and given as:
Equation: 9
This means that there is a maximum bending stress that will occur along the beam at its top/bottom,
and that will occur where the bending moment is maximum. It also means that there is a condition
when the bending stress is equal to the yield stress of the material the beam is made and the
bending moment is at a maximum .
2 4 6 8 10 12x In.
200
150
100
50
M x z lbForce In.
2 4 6 8 10 12x In.
3000
2500
2000
1500
1000
500
Bending xlbForce
In2
28
Equation: 10
The second constraint inequality.
7.2.3 Braketree Failure
The user will also notice significant deflection in the brake tree component of the mechanism (shown
labeled in Error! Reference source not found. on page Error! Bookmark not defined.) if its crossectional
area is too small (equivalent to saying its crosssectional radius is too small) then the tree will begin
to buckle. The brake tree in this model is assumed to have circular area perpendicular to the direction of
loading (-y dir) of constant crossectional radius r and made up of a single isotropic material. Thus the
relationship between the maximum force that can be withstood before buckling , the second
moment area of inertia , and the brake tree length is
Equation: 11
Equation: 12
Equation: 13
Equation: 14
E, is the Young’s modulus of the brake tree material and K is a factor dependent upon the boundary
conditions of the loading, which for two pins is equal to 1. This gives an equation for the maximum
stress before buckling
π
Equation: 15
Equation: 16
which must be checked against the yield strength of the material ( )
Similarly for the brake tree there is a relationship between the material (its young’s modulus E) that is
used, a smallest radius r, and the buckling stress that is given by Equation 15. As the radius
becomes infinitely small the buckling stress that can be withstood does as well until it reaches a point
that the brake tree cannot withstand the force FB without buckling.
29
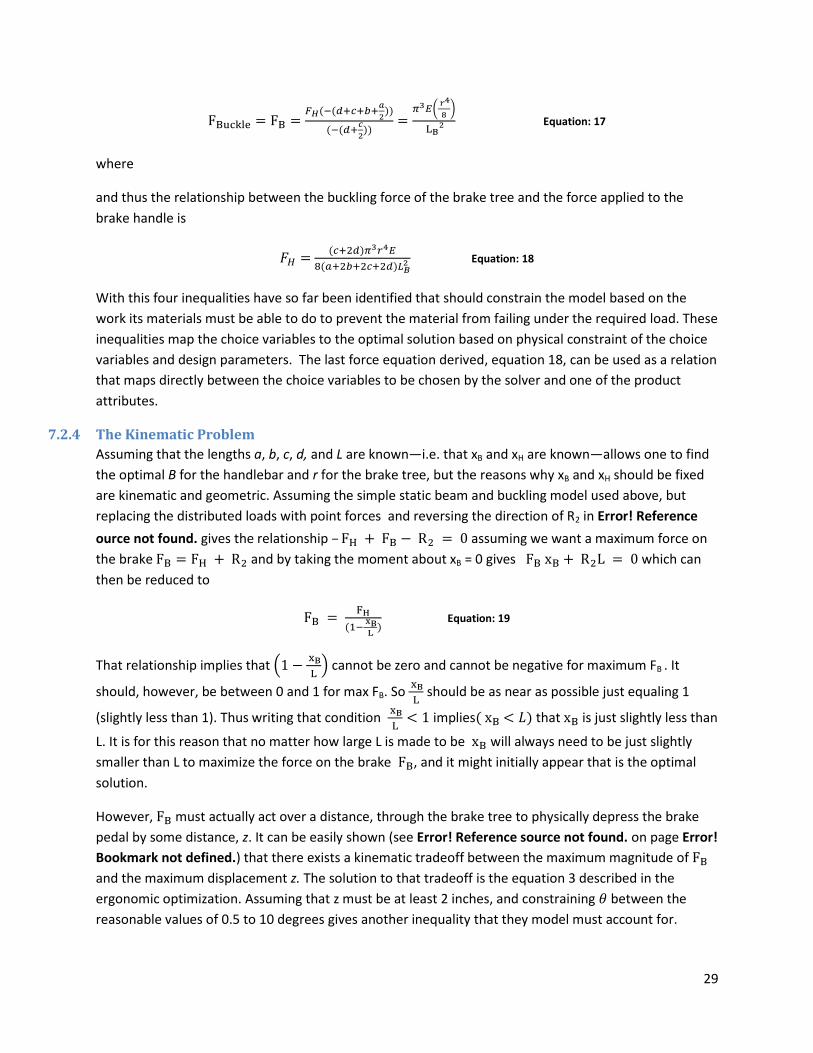
Equation: 17
where
and thus the relationship between the buckling force of the brake tree and the force applied to the
brake handle is
Equation: 18
With this four inequalities have so far been identified that should constrain the model based on the
work its materials must be able to do to prevent the material from failing under the required load. These
inequalities map the choice variables to the optimal solution based on physical constraint of the choice
variables and design parameters. The last force equation derived, equation 18, can be used as a relation
that maps directly between the choice variables to be chosen by the solver and one of the product
attributes.
7.2.4 The Kinematic Problem
Assuming that the lengths a, b, c, d, and L are known—i.e. that xB and xH are known—allows one to find
the optimal B for the handlebar and r for the brake tree, but the reasons why xB and xH should be fixed
are kinematic and geometric. Assuming the simple static beam and buckling model used above, but
replacing the distributed loads with point forces and reversing the direction of R2 in Error! Reference
ource not found. gives the relationship – assuming we want a maximum force on
the brake and by taking the moment about xB = 0 gives which can
then be reduced to
Equation: 19
That relationship implies that
cannot be zero and cannot be negative for maximum FB . It
should, however, be between 0 and 1 for max FB. So
should be as near as possible just equaling 1
(slightly less than 1). Thus writing that condition
implies that is just slightly less than
L. It is for this reason that no matter how large L is made to be will always need to be just slightly
smaller than L to maximize the force on the brake , and it might initially appear that is the optimal
solution.
However, must actually act over a distance, through the brake tree to physically depress the brake
pedal by some distance, z. It can be easily shown (see Error! Reference source not found. on page Error!
Bookmark not defined.) that there exists a kinematic tradeoff between the maximum magnitude of
and the maximum displacement z. The solution to that tradeoff is the equation 3 described in the
ergonomic optimization. Assuming that z must be at least 2 inches, and constraining between the
reasonable values of 0.5 to 10 degrees gives another inequality that they model must account for.
30
Also because the lengths a, b, c, and d may tend to be driven by the model either to 0 or to very large
values to satisfy the stress constraints they must be bound by some inequality:
Equation: 20
One of the main goals we had in mind when designing our product was to make a device that will be portable and cheap to consumers compare to similar or competitors’ products, without sacrificing functionality. Based on the survey results from prospective users of our product, we conclude they are not interested in the beauty or show off of the product, rather they wanted something that will not be financially inconvenient if they had to purchase from their pocket, and a product that will be reliable. The best practice to meet their emotional satisfaction is to make sure suit what proposed consumer have requested from the survey we collected, and by achieving our stated objectives without jeopardizing safety. Accomplishing these will give our customers the relieve knowing they are independently mobile.
The focal objective for producing a vehicle hand control device is to maximize profit. Based on our research, we found that there are;
250,000 Americans currently living with spinal cord injury
11,000 new cases each year
58.8% are employed
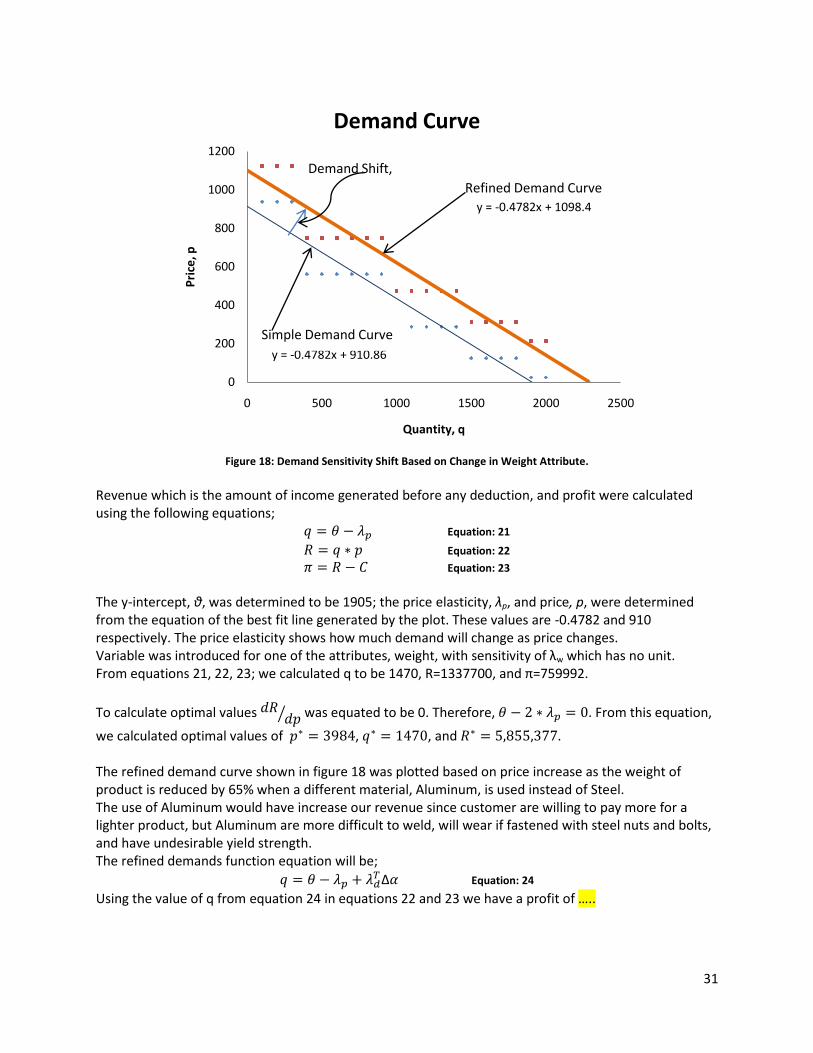
52% (130,000) are paraplegic From these numbers and percentages, we could assume76,440 paraplegics; 5,720 new cases of paraplegic each year; and based on the trend for the past few years, it is also safe to assume this numbers will continue to increase as human population increases. Using results collected from survey analyses, we created a demand function plot shown in figure 18 below. Detailed table is shown in appendix H. Survey population was scaled to market size.
31
Figure 18: Demand Sensitivity Shift Based on Change in Weight Attribute.
Revenue which is the amount of income generated before any deduction, and profit were calculated using the following equations;
Equation: 21
Equation: 22 Equation: 23
The y-intercept, θ, was determined to be 1905; the price elasticity, λp, and price, p, were determined from the equation of the best fit line generated by the plot. These values are -0.4782 and 910 respectively. The price elasticity shows how much demand will change as price changes. Variable was introduced for one of the attributes, weight, with sensitivity of λw which has no unit. From equations 21, 22, 23; we calculated q to be 1470, R=1337700, and π=759992.
To calculate optimal values was equated to be 0. Therefore, . From this equation,
we calculated optimal values of , , and . The refined demand curve shown in figure 18 was plotted based on price increase as the weight of product is reduced by 65% when a different material, Aluminum, is used instead of Steel. The use of Aluminum would have increase our revenue since customer are willing to pay more for a lighter product, but Aluminum are more difficult to weld, will wear if fastened with steel nuts and bolts, and have undesirable yield strength. The refined demands function equation will be;
Equation: 24
Using the value of q from equation 24 in equations 22 and 23 we have a profit of …..
y = -0.4782x + 910.86
y = -0.4782x + 1098.4
0
200
400
600
800
1000
1200
0 500 1000 1500 2000 2500
Pri
ce, p
Quantity, q
Demand Curve
Refined Demand Curve
Simple Demand Curve
Demand Shift,
32
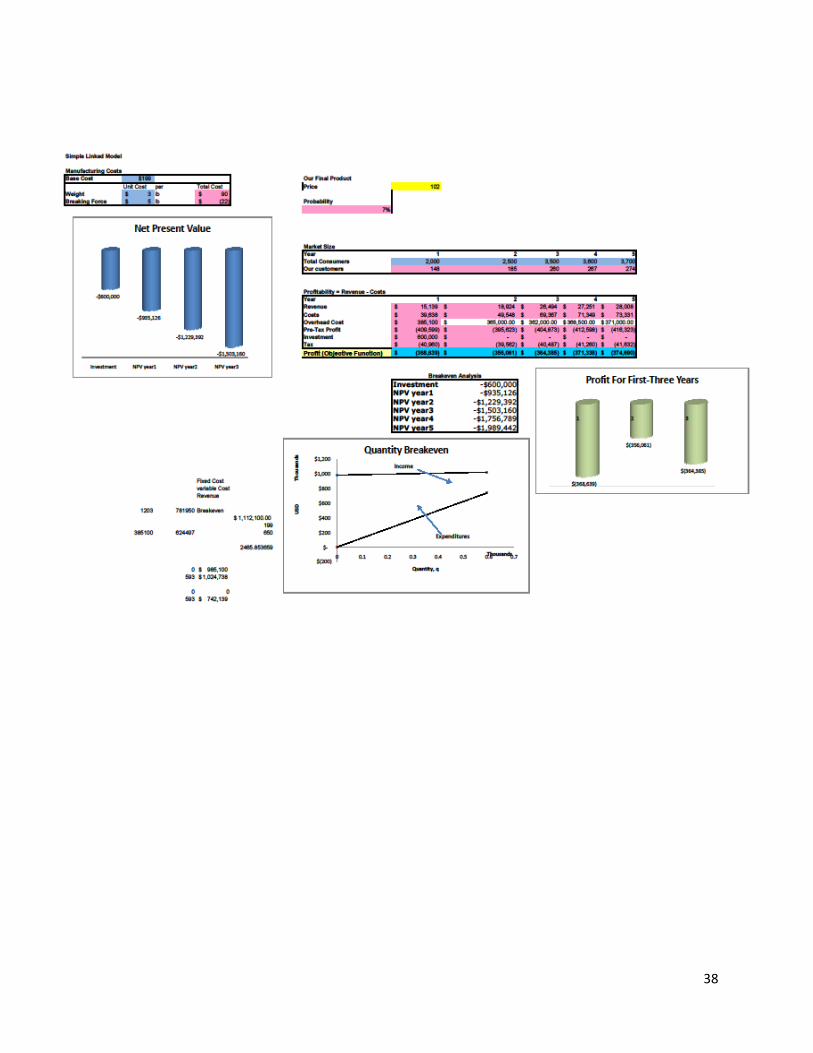
To obtain a more precise Net Present Value, we analyzed the CBC values. Using a spline function created in Microsoft Excel. We derived 60% (1203) of the market size (2000) will choose our product over competitors’. Values for subsequent years are shown in table 5.
Year 1 2 3
Market Size 2000 2500 3500
Our Customer (60%) 1203 1504 2106
Revenue (USD) 782,225 977,781 1,368,893
Costs (USD) 187,132 233,915 327,481
Overhead Cost (USD) 385,100 365,000 362,000
Pre-Tax Profit (USD) 209,993 378,866 679,412
Investment (USD) 600,000 0 0
Tax-10% (USD) 20,999 37,887 67,941
Profit (USD) 188,993 340,979 611,471 Table 5: Cost and Profit Analysis for the First-Three Years
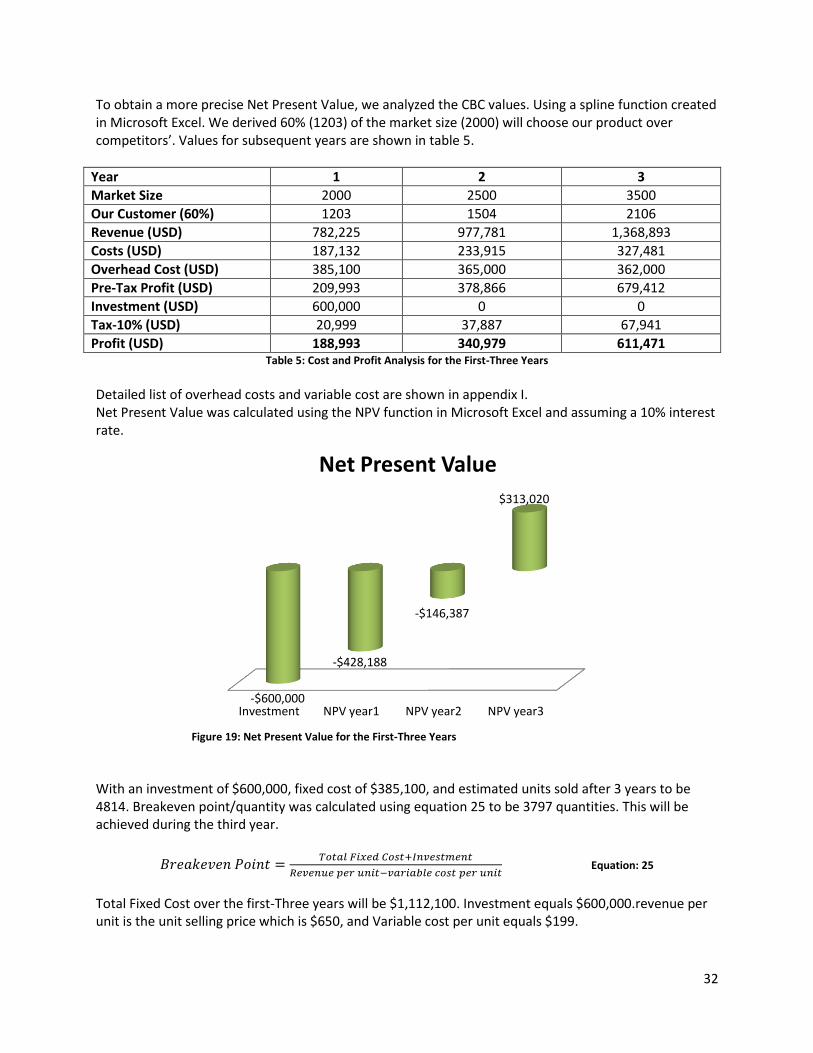
Detailed list of overhead costs and variable cost are shown in appendix I. Net Present Value was calculated using the NPV function in Microsoft Excel and assuming a 10% interest rate.
Figure 19: Net Present Value for the First-Three Years
With an investment of $600,000, fixed cost of $385,100, and estimated units sold after 3 years to be 4814. Breakeven point/quantity was calculated using equation 25 to be 3797 quantities. This will be achieved during the third year.
Equation: 25
Total Fixed Cost over the first-Three years will be $1,112,100. Investment equals $600,000.revenue per unit is the unit selling price which is $650, and Variable cost per unit equals $199.
Investment NPV year1 NPV year2 NPV year3-$600,000
-$428,188
-$146,387
$313,020
Net Present Value
33
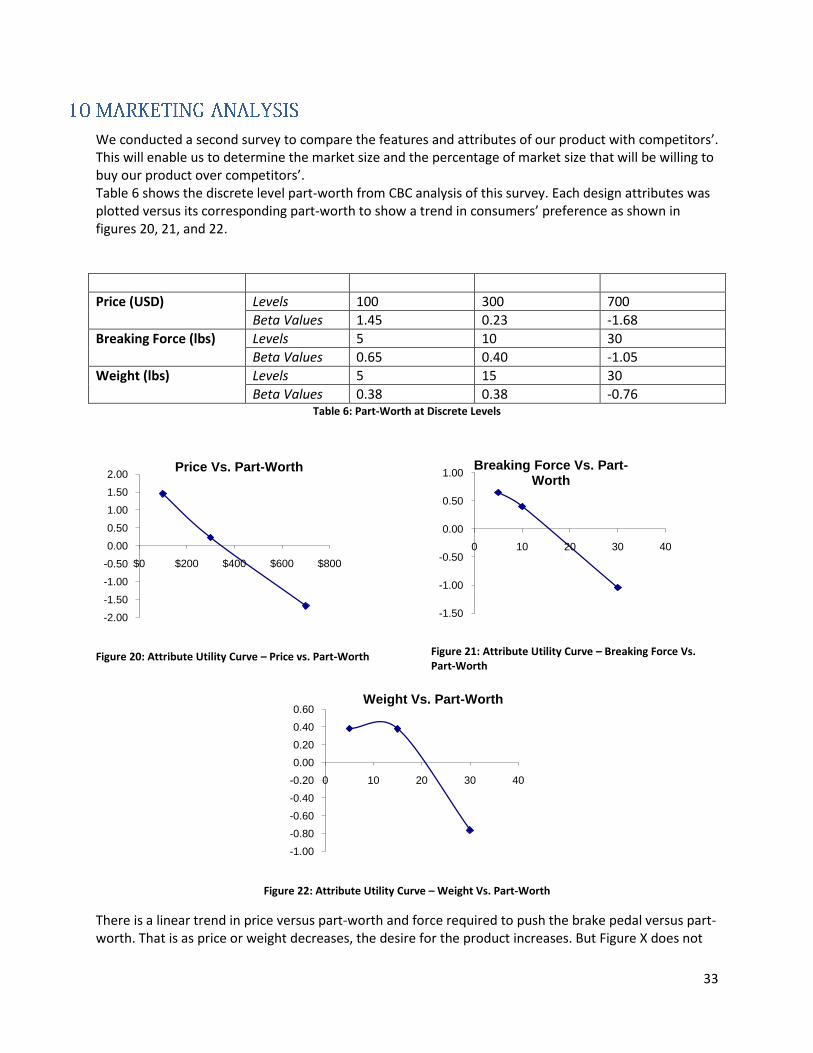
We conducted a second survey to compare the features and attributes of our product with competitors’. This will enable us to determine the market size and the percentage of market size that will be willing to buy our product over competitors’. Table 6 shows the discrete level part-worth from CBC analysis of this survey. Each design attributes was plotted versus its corresponding part-worth to show a trend in consumers’ preference as shown in figures 20, 21, and 22.
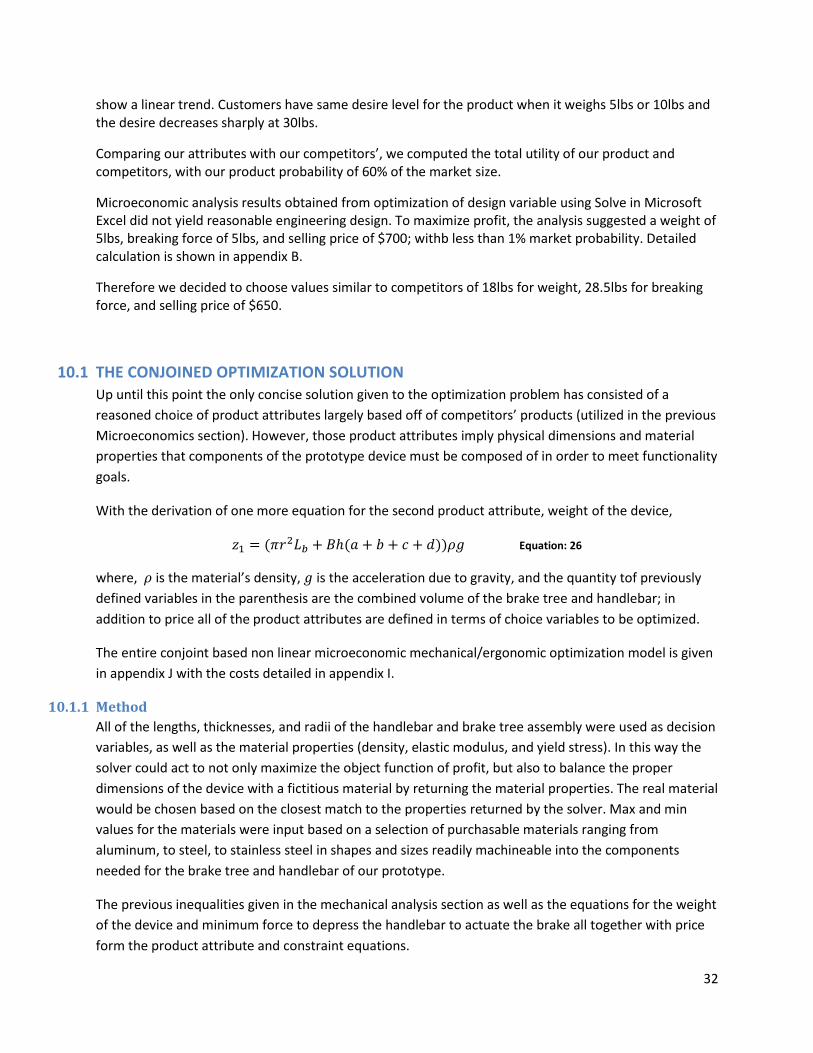
Price (USD) Levels 100 300 700
Beta Values 1.45 0.23 -1.68
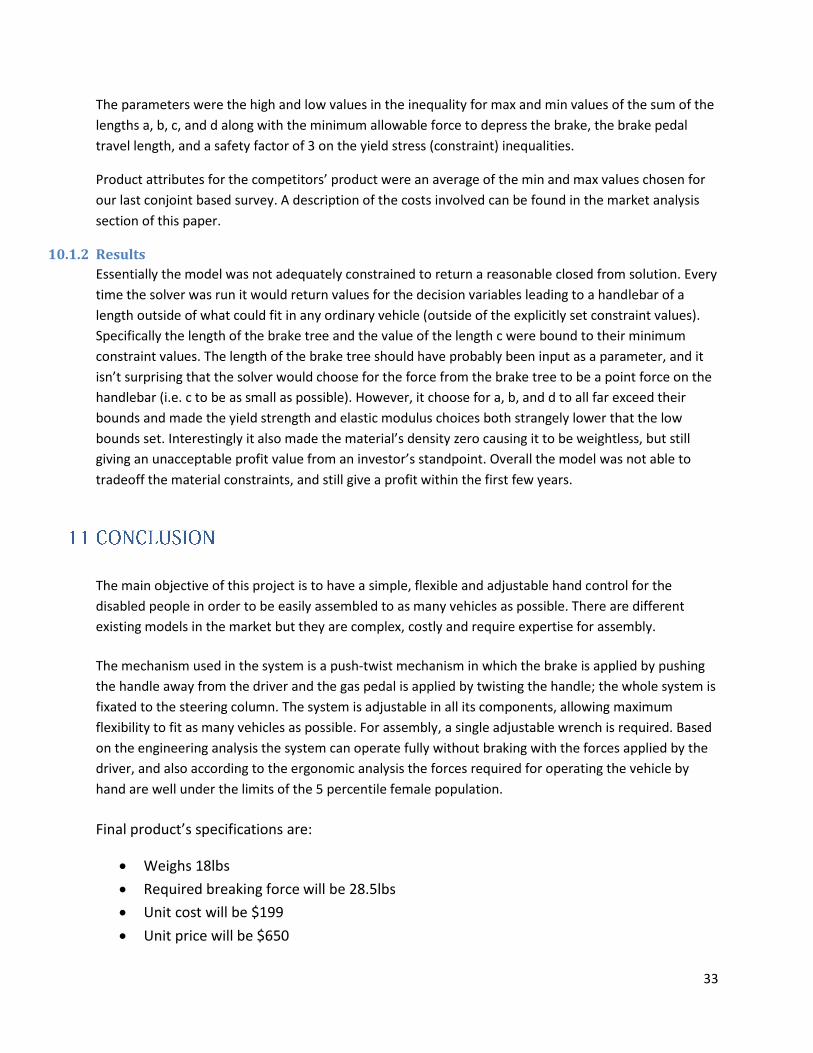
Breaking Force (lbs) Levels 5 10 30
Beta Values 0.65 0.40 -1.05
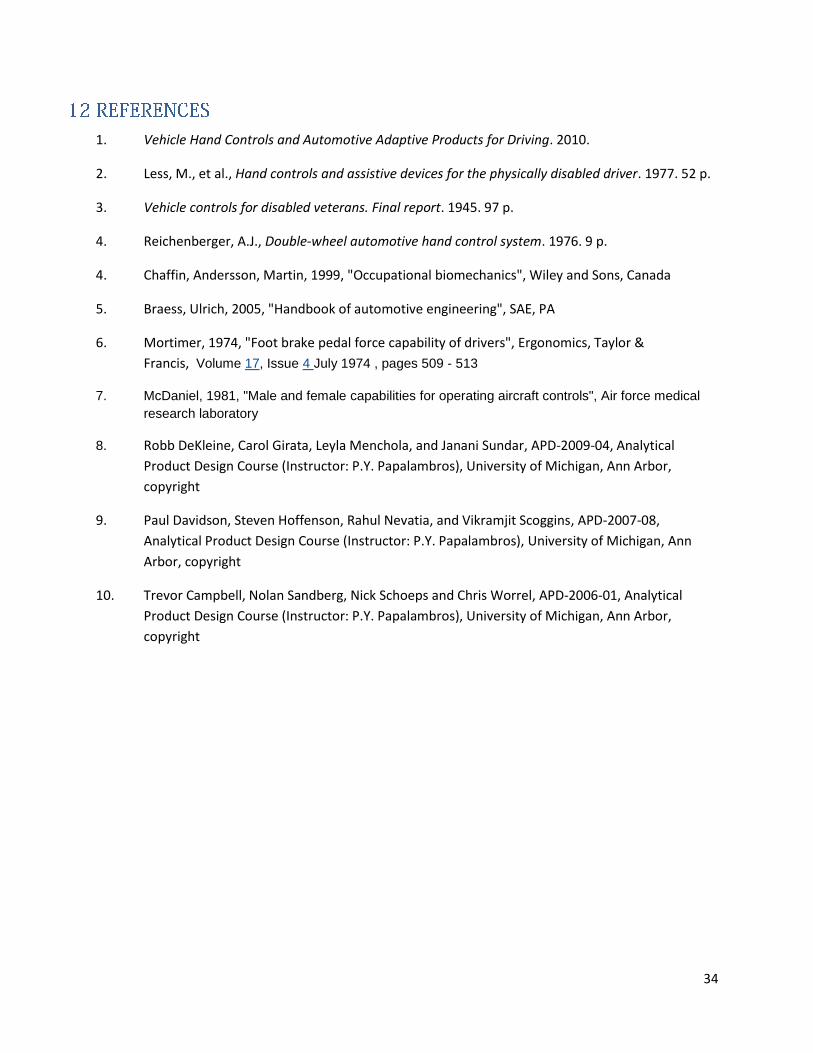
Weight (lbs) Levels 5 15 30
Beta Values 0.38 0.38 -0.76 Table 6: Part-Worth at Discrete Levels
Figure 20: Attribute Utility Curve – Price vs. Part-Worth
Figure 21: Attribute Utility Curve – Breaking Force Vs. Part-Worth
Figure 22: Attribute Utility Curve – Weight Vs. Part-Worth
There is a linear trend in price versus part-worth and force required to push the brake pedal versus part-worth. That is as price or weight decreases, the desire for the product increases. But Figure X does not
-2.00
-1.50
-1.00
-0.50
0.00
0.50
1.00
1.50
2.00
$0 $200 $400 $600 $800
Price Vs. Part-Worth
-1.50
-1.00
-0.50
0.00
0.50
1.00
0 10 20 30 40
Breaking Force Vs. Part-Worth
-1.00
-0.80
-0.60
-0.40
-0.20
0.00
0.20
0.40
0.60
0 10 20 30 40
Weight Vs. Part-Worth
32
show a linear trend. Customers have same desire level for the product when it weighs 5lbs or 10lbs and the desire decreases sharply at 30lbs.
Comparing our attributes with our competitors’, we computed the total utility of our product and competitors, with our product probability of 60% of the market size.
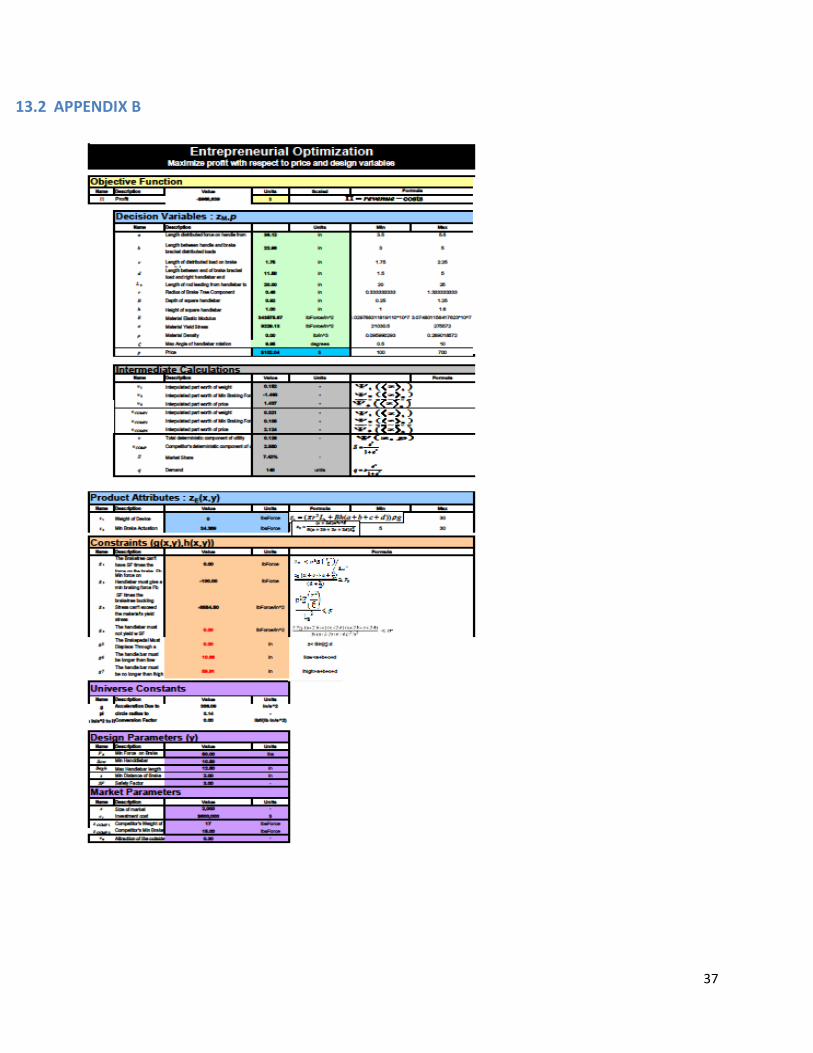
Microeconomic analysis results obtained from optimization of design variable using Solve in Microsoft Excel did not yield reasonable engineering design. To maximize profit, the analysis suggested a weight of 5lbs, breaking force of 5lbs, and selling price of $700; withb less than 1% market probability. Detailed calculation is shown in appendix B.
Therefore we decided to choose values similar to competitors of 18lbs for weight, 28.5lbs for breaking force, and selling price of $650.
10.1 THE CONJOINED OPTIMIZATION SOLUTION
Up until this point the only concise solution given to the optimization problem has consisted of a
reasoned choice of product attributes largely based off of competitors’ products (utilized in the previous
Microeconomics section). However, those product attributes imply physical dimensions and material
properties that components of the prototype device must be composed of in order to meet functionality
goals.
With the derivation of one more equation for the second product attribute, weight of the device,
Equation: 26
where, is the material’s density, is the acceleration due to gravity, and the quantity tof previously
defined variables in the parenthesis are the combined volume of the brake tree and handlebar; in
addition to price all of the product attributes are defined in terms of choice variables to be optimized.
The entire conjoint based non linear microeconomic mechanical/ergonomic optimization model is given
in appendix J with the costs detailed in appendix I.
10.1.1 Method
All of the lengths, thicknesses, and radii of the handlebar and brake tree assembly were used as decision
variables, as well as the material properties (density, elastic modulus, and yield stress). In this way the
solver could act to not only maximize the object function of profit, but also to balance the proper
dimensions of the device with a fictitious material by returning the material properties. The real material
would be chosen based on the closest match to the properties returned by the solver. Max and min
values for the materials were input based on a selection of purchasable materials ranging from
aluminum, to steel, to stainless steel in shapes and sizes readily machineable into the components
needed for the brake tree and handlebar of our prototype.
The previous inequalities given in the mechanical analysis section as well as the equations for the weight
of the device and minimum force to depress the handlebar to actuate the brake all together with price
form the product attribute and constraint equations.
33
The parameters were the high and low values in the inequality for max and min values of the sum of the
lengths a, b, c, and d along with the minimum allowable force to depress the brake, the brake pedal
travel length, and a safety factor of 3 on the yield stress (constraint) inequalities.
Product attributes for the competitors’ product were an average of the min and max values chosen for
our last conjoint based survey. A description of the costs involved can be found in the market analysis
section of this paper.
10.1.2 Results
Essentially the model was not adequately constrained to return a reasonable closed from solution. Every
time the solver was run it would return values for the decision variables leading to a handlebar of a
length outside of what could fit in any ordinary vehicle (outside of the explicitly set constraint values).
Specifically the length of the brake tree and the value of the length c were bound to their minimum
constraint values. The length of the brake tree should have probably been input as a parameter, and it
isn’t surprising that the solver would choose for the force from the brake tree to be a point force on the
handlebar (i.e. c to be as small as possible). However, it choose for a, b, and d to all far exceed their
bounds and made the yield strength and elastic modulus choices both strangely lower that the low
bounds set. Interestingly it also made the material’s density zero causing it to be weightless, but still
giving an unacceptable profit value from an investor’s standpoint. Overall the model was not able to
tradeoff the material constraints, and still give a profit within the first few years.
The main objective of this project is to have a simple, flexible and adjustable hand control for the
disabled people in order to be easily assembled to as many vehicles as possible. There are different
existing models in the market but they are complex, costly and require expertise for assembly.
The mechanism used in the system is a push-twist mechanism in which the brake is applied by pushing
the handle away from the driver and the gas pedal is applied by twisting the handle; the whole system is
fixated to the steering column. The system is adjustable in all its components, allowing maximum
flexibility to fit as many vehicles as possible. For assembly, a single adjustable wrench is required. Based
on the engineering analysis the system can operate fully without braking with the forces applied by the
driver, and also according to the ergonomic analysis the forces required for operating the vehicle by
hand are well under the limits of the 5 percentile female population.
Final product’s specifications are:
Weighs 18lbs
Required breaking force will be 28.5lbs
Unit cost will be $199
Unit price will be $650
34
1. Vehicle Hand Controls and Automotive Adaptive Products for Driving. 2010.
2. Less, M., et al., Hand controls and assistive devices for the physically disabled driver. 1977. 52 p.
3. Vehicle controls for disabled veterans. Final report. 1945. 97 p.
4. Reichenberger, A.J., Double-wheel automotive hand control system. 1976. 9 p.
4. Chaffin, Andersson, Martin, 1999, "Occupational biomechanics", Wiley and Sons, Canada
5. Braess, Ulrich, 2005, "Handbook of automotive engineering", SAE, PA
6. Mortimer, 1974, "Foot brake pedal force capability of drivers", Ergonomics, Taylor &
Francis, Volume 17, Issue 4 July 1974 , pages 509 - 513
7. McDaniel, 1981, "Male and female capabilities for operating aircraft controls", Air force medical
research laboratory
8. Robb DeKleine, Carol Girata, Leyla Menchola, and Janani Sundar, APD-2009-04, Analytical
Product Design Course (Instructor: P.Y. Papalambros), University of Michigan, Ann Arbor,
copyright
9. Paul Davidson, Steven Hoffenson, Rahul Nevatia, and Vikramjit Scoggins, APD-2007-08,
Analytical Product Design Course (Instructor: P.Y. Papalambros), University of Michigan, Ann
Arbor, copyright
10. Trevor Campbell, Nolan Sandberg, Nick Schoeps and Chris Worrel, APD-2006-01, Analytical
Product Design Course (Instructor: P.Y. Papalambros), University of Michigan, Ann Arbor,
copyright
35
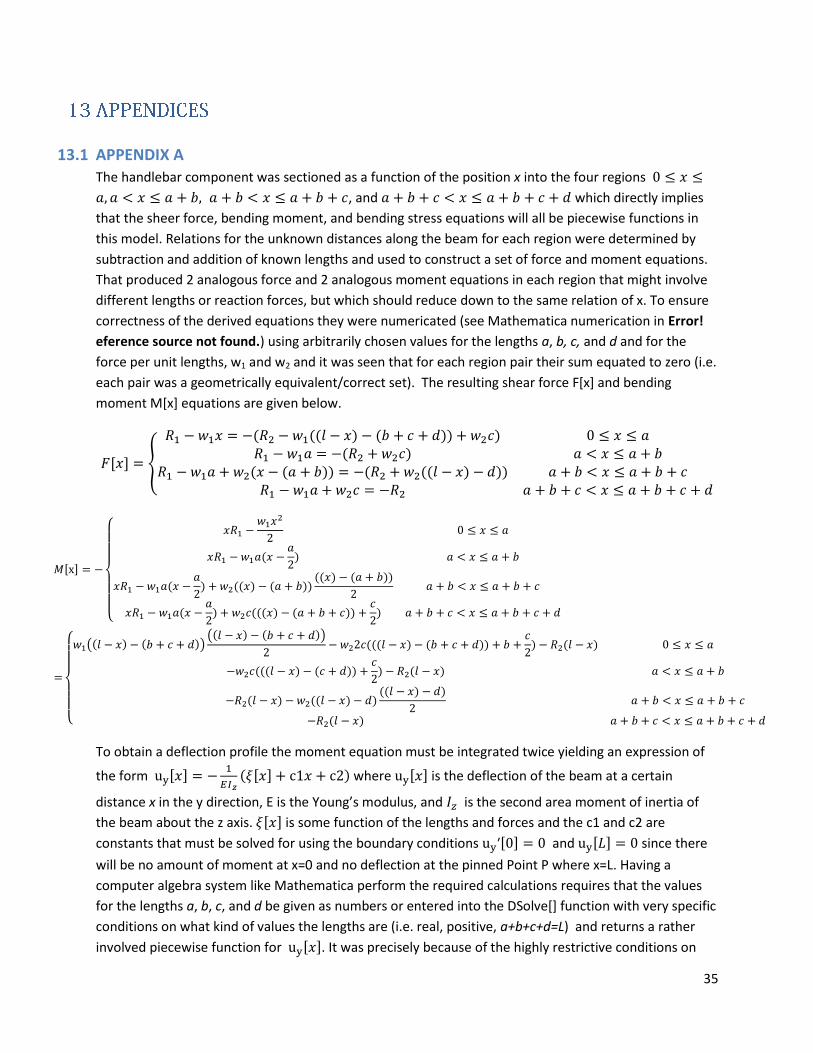
13.1 APPENDIX A
The handlebar component was sectioned as a function of the position x into the four regions
, and which directly implies
that the sheer force, bending moment, and bending stress equations will all be piecewise functions in
this model. Relations for the unknown distances along the beam for each region were determined by
subtraction and addition of known lengths and used to construct a set of force and moment equations.
That produced 2 analogous force and 2 analogous moment equations in each region that might involve
different lengths or reaction forces, but which should reduce down to the same relation of x. To ensure
correctness of the derived equations they were numericated (see Mathematica numerication in Error!
eference source not found.) using arbitrarily chosen values for the lengths a, b, c, and d and for the
force per unit lengths, w1 and w2 and it was seen that for each region pair their sum equated to zero (i.e.
each pair was a geometrically equivalent/correct set). The resulting shear force F[x] and bending
moment M[x] equations are given below.
To obtain a deflection profile the moment equation must be integrated twice yielding an expression of
the form
where is the deflection of the beam at a certain
distance x in the y direction, E is the Young’s modulus, and is the second area moment of inertia of
the beam about the z axis. is some function of the lengths and forces and the c1 and c2 are
constants that must be solved for using the boundary conditions and since there
will be no amount of moment at x=0 and no deflection at the pinned Point P where x=L. Having a
computer algebra system like Mathematica perform the required calculations requires that the values
for the lengths a, b, c, and d be given as numbers or entered into the DSolve[] function with very specific
conditions on what kind of values the lengths are (i.e. real, positive, a+b+c+d=L) and returns a rather
involved piecewise function for . It was precisely because of the highly restrictive conditions on

36
the lengths a, b, c, and d that they were not varied in the model, as well as for geometric reasons
previously described in the ergonomics section.
37
13.2 APPENDIX B
38
39
13.3 APPENDIX C
40
13.4 APPENDIX D
41
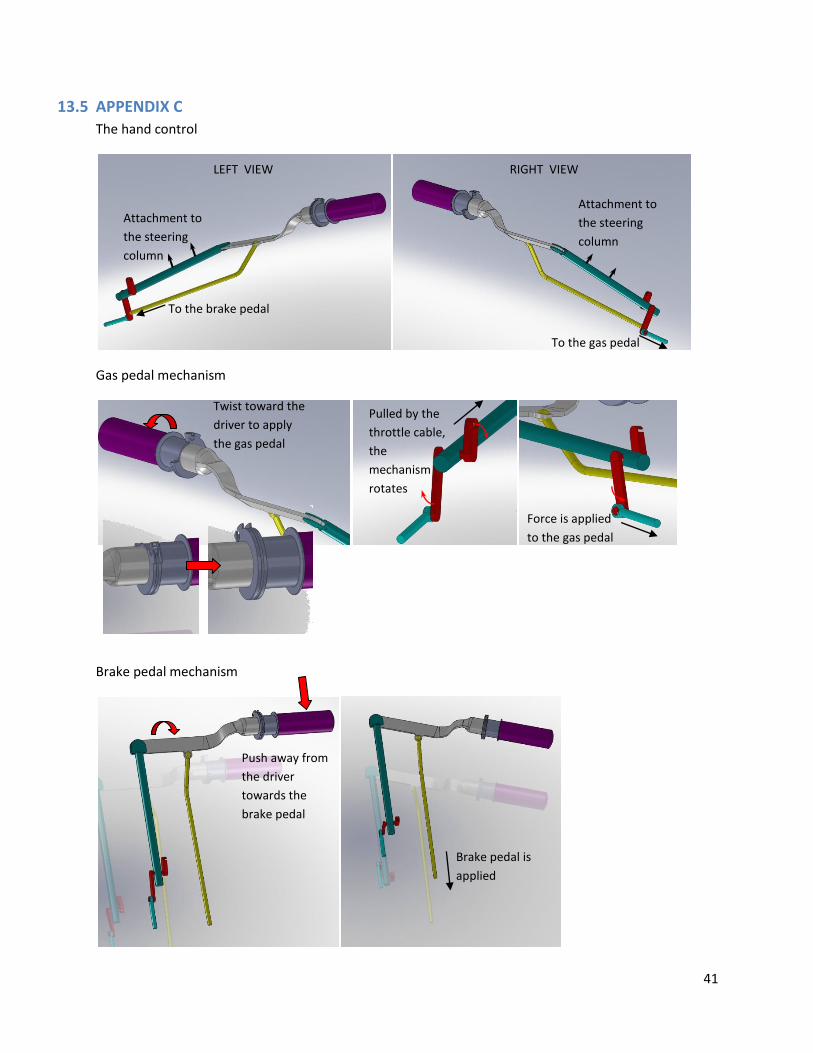
13.5 APPENDIX C
The hand control
Gas pedal mechanism
Brake pedal mechanism
To the brake pedal
To the gas pedal
Attachment to
the steering
column
Attachment to
the steering
column
Twist toward the
driver to apply
the gas pedal
Pulled by the
throttle cable,
the
mechanism
rotates
Force is applied
to the gas pedal
Push away from
the driver
towards the
brake pedal
Brake pedal is
applied
LEFT VIEW RIGHT VIEW
42
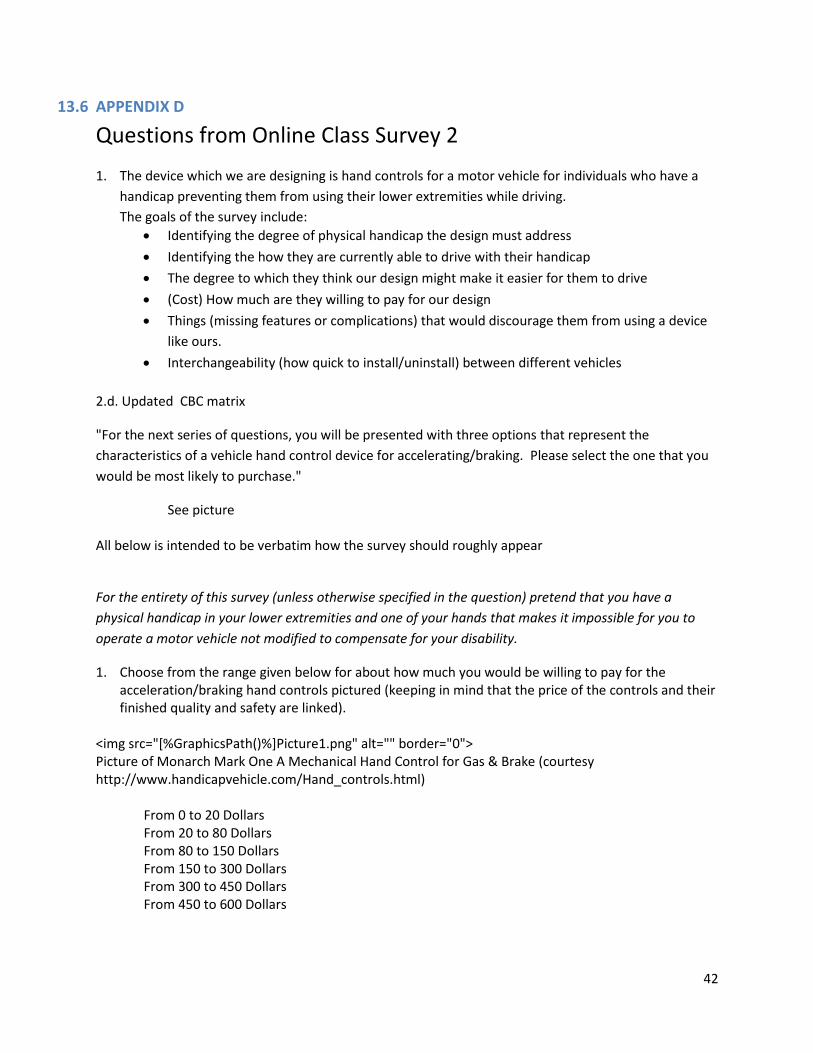
13.6 APPENDIX D
Questions from Online Class Survey 2
1. The device which we are designing is hand controls for a motor vehicle for individuals who have a
handicap preventing them from using their lower extremities while driving.
The goals of the survey include:
Identifying the degree of physical handicap the design must address
Identifying the how they are currently able to drive with their handicap
The degree to which they think our design might make it easier for them to drive
(Cost) How much are they willing to pay for our design
Things (missing features or complications) that would discourage them from using a device
like ours.
Interchangeability (how quick to install/uninstall) between different vehicles
2.d. Updated CBC matrix
"For the next series of questions, you will be presented with three options that represent the
characteristics of a vehicle hand control device for accelerating/braking. Please select the one that you
would be most likely to purchase."
See picture
All below is intended to be verbatim how the survey should roughly appear
For the entirety of this survey (unless otherwise specified in the question) pretend that you have a
physical handicap in your lower extremities and one of your hands that makes it impossible for you to
operate a motor vehicle not modified to compensate for your disability.
1. Choose from the range given below for about how much you would be willing to pay for the acceleration/braking hand controls pictured (keeping in mind that the price of the controls and their finished quality and safety are linked).
<img src="[%GraphicsPath()%]Picture1.png" alt="" border="0"> Picture of Monarch Mark One A Mechanical Hand Control for Gas & Brake (courtesy http://www.handicapvehicle.com/Hand_controls.html)
From 0 to 20 Dollars From 20 to 80 Dollars From 80 to 150 Dollars From 150 to 300 Dollars From 300 to 450 Dollars From 450 to 600 Dollars
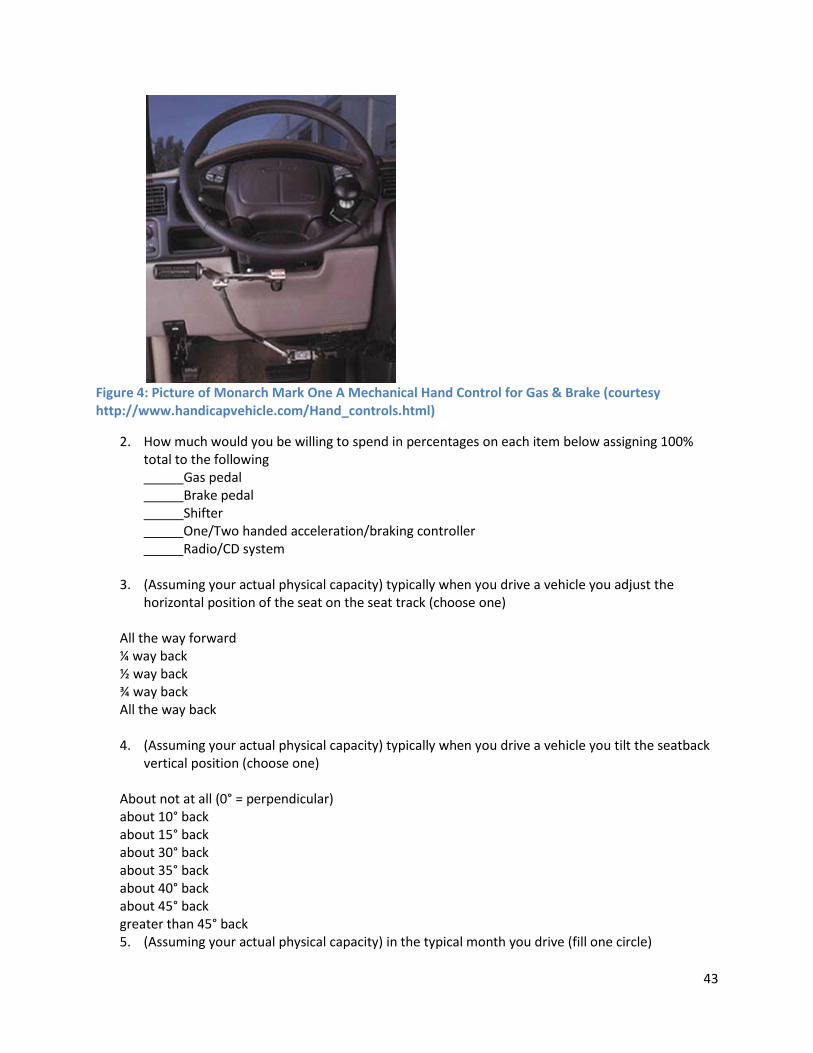
43
Figure 4: Picture of Monarch Mark One A Mechanical Hand Control for Gas & Brake (courtesy http://www.handicapvehicle.com/Hand_controls.html)
2. How much would you be willing to spend in percentages on each item below assigning 100% total to the following Gas pedal Brake pedal Shifter One/Two handed acceleration/braking controller Radio/CD system
3. (Assuming your actual physical capacity) typically when you drive a vehicle you adjust the
horizontal position of the seat on the seat track (choose one)
All the way forward ¼ way back ½ way back ¾ way back All the way back 4. (Assuming your actual physical capacity) typically when you drive a vehicle you tilt the seatback
vertical position (choose one)
About not at all (0° = perpendicular) about 10° back about 15° back about 30° back about 35° back about 40° back about 45° back greater than 45° back 5. (Assuming your actual physical capacity) in the typical month you drive (fill one circle)
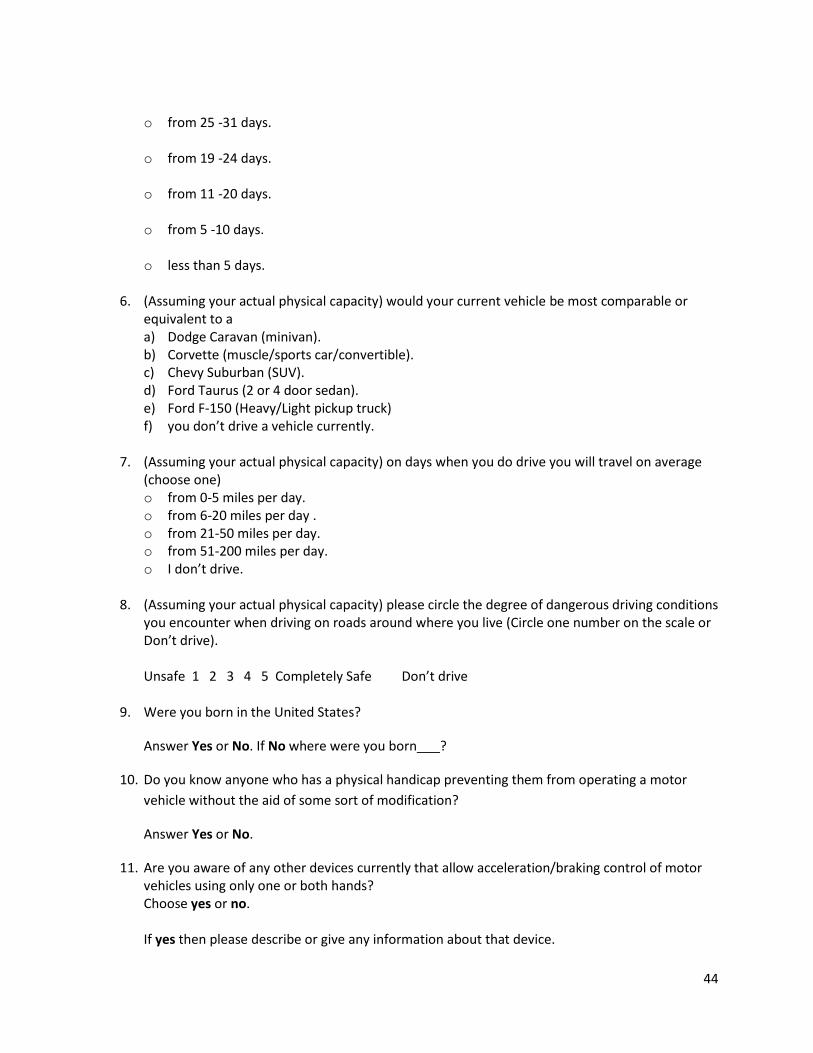
44
o from 25 -31 days.
o from 19 -24 days.
o from 11 -20 days. o from 5 -10 days.
o less than 5 days.
6. (Assuming your actual physical capacity) would your current vehicle be most comparable or
equivalent to a a) Dodge Caravan (minivan). b) Corvette (muscle/sports car/convertible). c) Chevy Suburban (SUV). d) Ford Taurus (2 or 4 door sedan). e) Ford F-150 (Heavy/Light pickup truck) f) you don’t drive a vehicle currently.
7. (Assuming your actual physical capacity) on days when you do drive you will travel on average
(choose one) o from 0-5 miles per day. o from 6-20 miles per day . o from 21-50 miles per day. o from 51-200 miles per day. o I don’t drive.
8. (Assuming your actual physical capacity) please circle the degree of dangerous driving conditions you encounter when driving on roads around where you live (Circle one number on the scale or Don’t drive). Unsafe 1 2 3 4 5 Completely Safe Don’t drive
9. Were you born in the United States?
Answer Yes or No. If No where were you born ?
10. Do you know anyone who has a physical handicap preventing them from operating a motor
vehicle without the aid of some sort of modification?
Answer Yes or No.
11. Are you aware of any other devices currently that allow acceleration/braking control of motor vehicles using only one or both hands? Choose yes or no. If yes then please describe or give any information about that device.
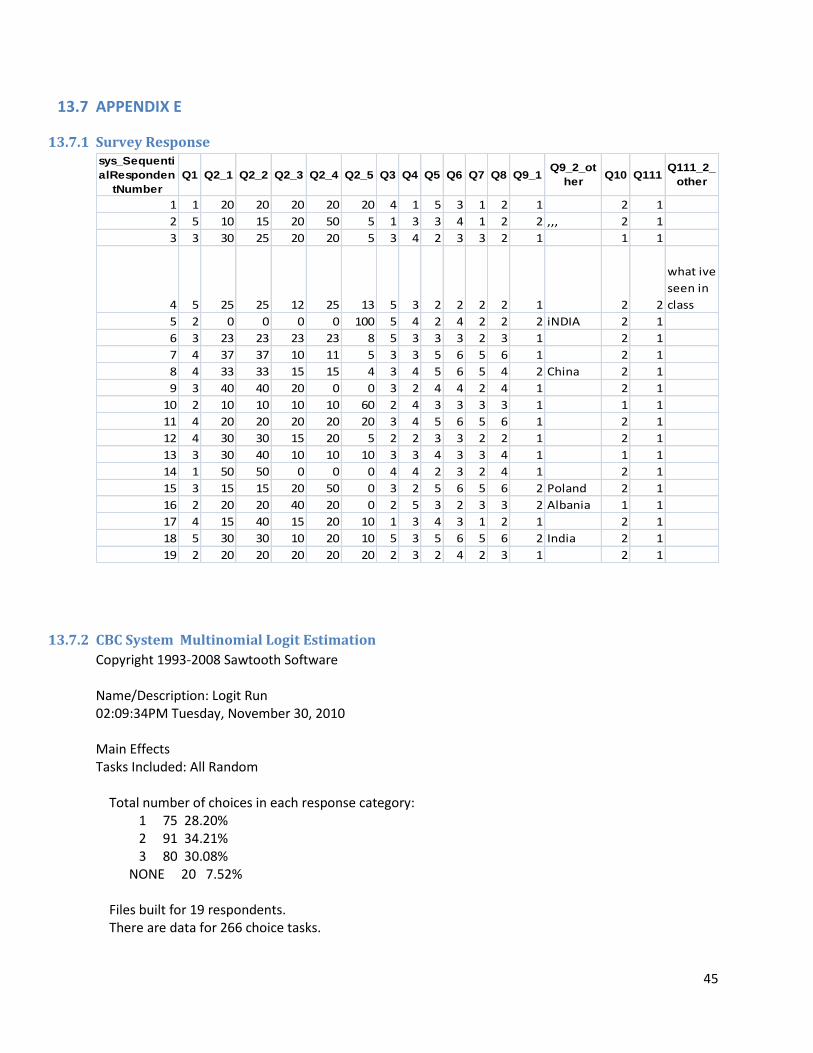
45
13.7 APPENDIX E
13.7.1 Survey Response sys_Sequenti
alResponden
tNumber
Q1 Q2_1 Q2_2 Q2_3 Q2_4 Q2_5 Q3 Q4 Q5 Q6 Q7 Q8 Q9_1Q9_2_ot
herQ10 Q111
Q111_2_
other
1 1 20 20 20 20 20 4 1 5 3 1 2 1 2 1
2 5 10 15 20 50 5 1 3 3 4 1 2 2 ,,, 2 1
3 3 30 25 20 20 5 3 4 2 3 3 2 1 1 1
4 5 25 25 12 25 13 5 3 2 2 2 2 1 2 2
what ive
seen in
class
5 2 0 0 0 0 100 5 4 2 4 2 2 2 iNDIA 2 1
6 3 23 23 23 23 8 5 3 3 3 2 3 1 2 1
7 4 37 37 10 11 5 3 3 5 6 5 6 1 2 1
8 4 33 33 15 15 4 3 4 5 6 5 4 2 China 2 1
9 3 40 40 20 0 0 3 2 4 4 2 4 1 2 1
10 2 10 10 10 10 60 2 4 3 3 3 3 1 1 1
11 4 20 20 20 20 20 3 4 5 6 5 6 1 2 1
12 4 30 30 15 20 5 2 2 3 3 2 2 1 2 1
13 3 30 40 10 10 10 3 3 4 3 3 4 1 1 1
14 1 50 50 0 0 0 4 4 2 3 2 4 1 2 1
15 3 15 15 20 50 0 3 2 5 6 5 6 2 Poland 2 1
16 2 20 20 40 20 0 2 5 3 2 3 3 2 Albania 1 1
17 4 15 40 15 20 10 1 3 4 3 1 2 1 2 1
18 5 30 30 10 20 10 5 3 5 6 5 6 2 India 2 1
19 2 20 20 20 20 20 2 3 2 4 2 3 1 2 1
13.7.2 CBC System Multinomial Logit Estimation
Copyright 1993-2008 Sawtooth Software Name/Description: Logit Run 02:09:34PM Tuesday, November 30, 2010 Main Effects Tasks Included: All Random Total number of choices in each response category: 1 75 28.20% 2 91 34.21% 3 80 30.08% NONE 20 7.52% Files built for 19 respondents. There are data for 266 choice tasks.
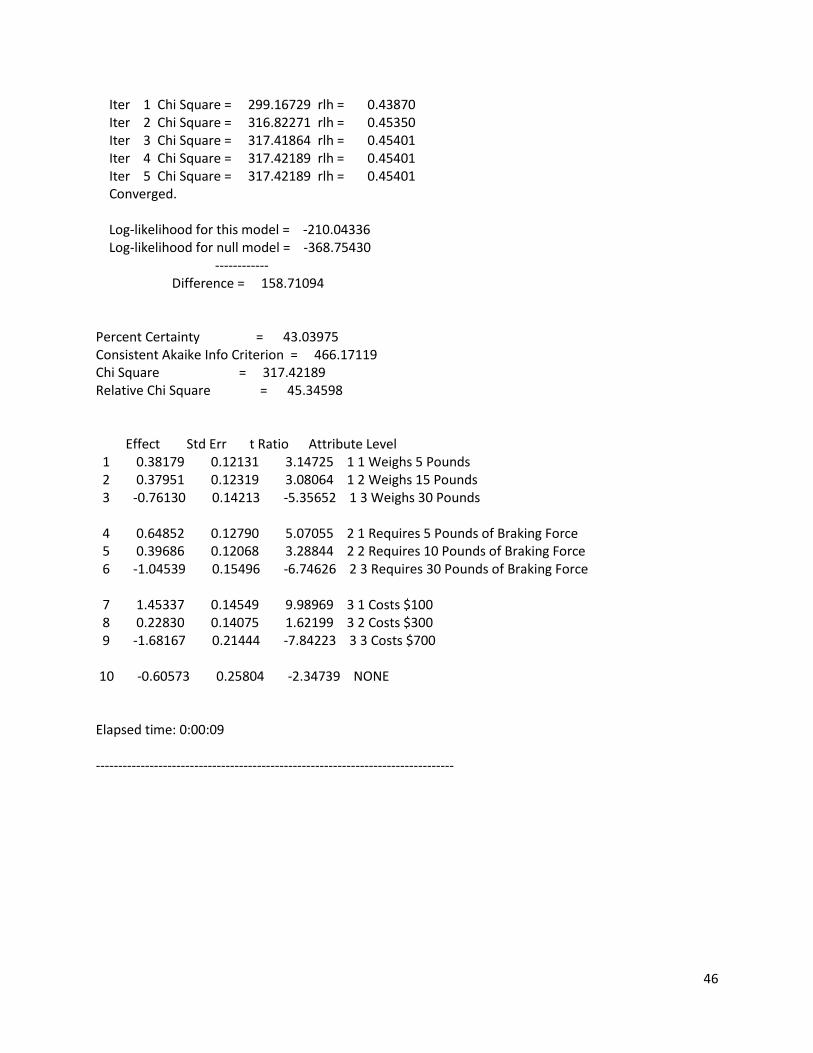
46
Iter 1 Chi Square = 299.16729 rlh = 0.43870 Iter 2 Chi Square = 316.82271 rlh = 0.45350 Iter 3 Chi Square = 317.41864 rlh = 0.45401 Iter 4 Chi Square = 317.42189 rlh = 0.45401 Iter 5 Chi Square = 317.42189 rlh = 0.45401 Converged. Log-likelihood for this model = -210.04336 Log-likelihood for null model = -368.75430 ------------ Difference = 158.71094 Percent Certainty = 43.03975 Consistent Akaike Info Criterion = 466.17119 Chi Square = 317.42189 Relative Chi Square = 45.34598 Effect Std Err t Ratio Attribute Level 1 0.38179 0.12131 3.14725 1 1 Weighs 5 Pounds 2 0.37951 0.12319 3.08064 1 2 Weighs 15 Pounds 3 -0.76130 0.14213 -5.35652 1 3 Weighs 30 Pounds 4 0.64852 0.12790 5.07055 2 1 Requires 5 Pounds of Braking Force 5 0.39686 0.12068 3.28844 2 2 Requires 10 Pounds of Braking Force 6 -1.04539 0.15496 -6.74626 2 3 Requires 30 Pounds of Braking Force 7 1.45337 0.14549 9.98969 3 1 Costs $100 8 0.22830 0.14075 1.62199 3 2 Costs $300 9 -1.68167 0.21444 -7.84223 3 3 Costs $700 10 -0.60573 0.25804 -2.34739 NONE Elapsed time: 0:00:09 --------------------------------------------------------------------------------
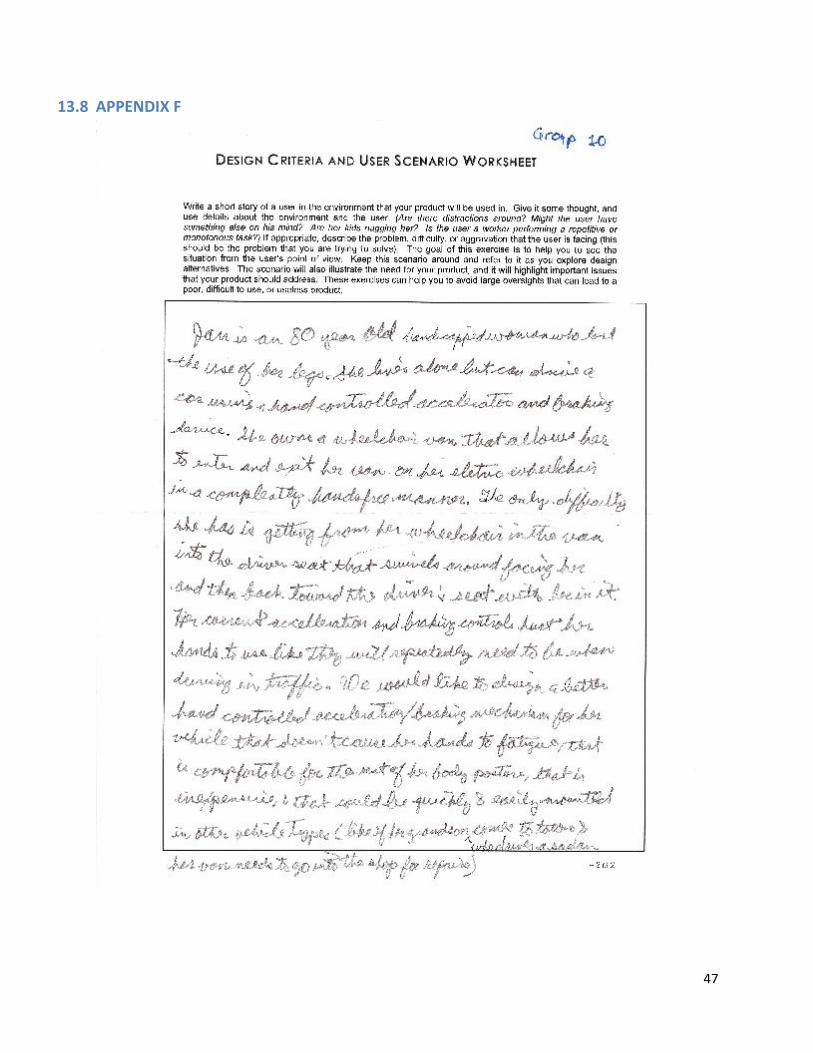
47
13.8 APPENDIX F
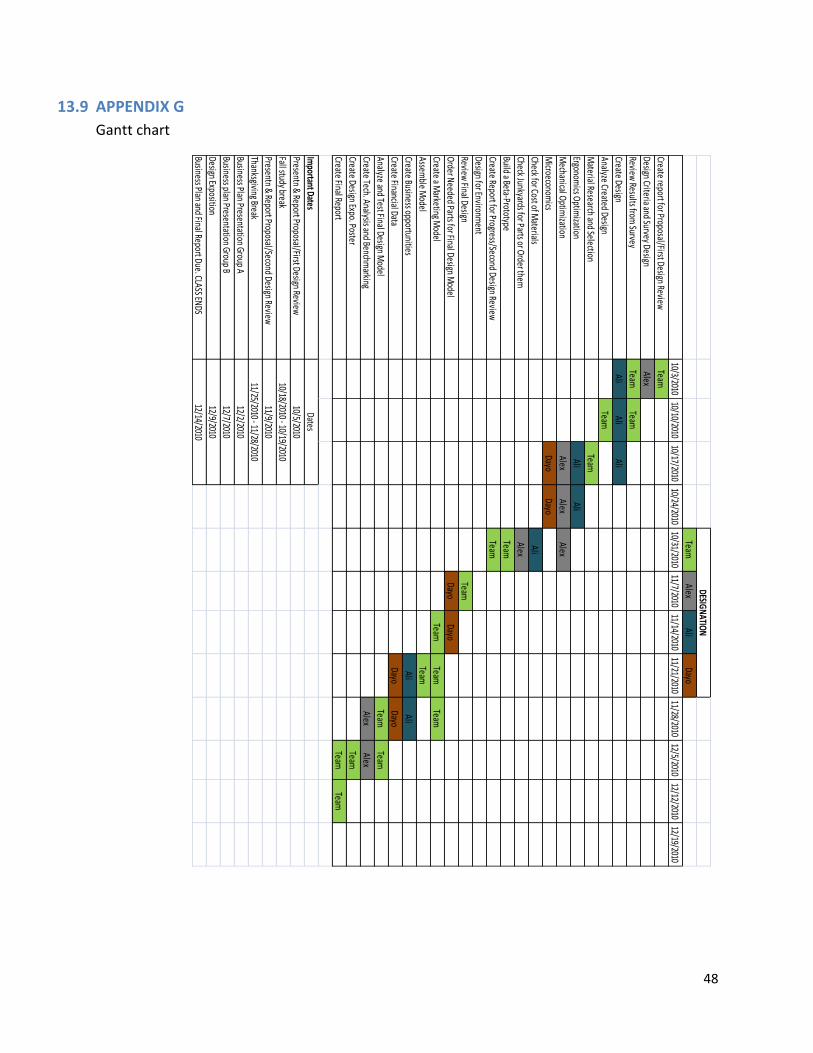
48
13.9 APPENDIX G
Gantt chart
TeamAlex
AliDayo
10/3/201010/10/2010
10/17/201010/24/2010
10/31/201011/7/2010
11/14/201011/21/2010
11/28/201012/5/2010
12/12/201012/19/2010
Create report for Proposal/First Design ReviewTeam
Design Criteria and Survey DesignAlex
Review Results from
SurveyTeam
Team
Create DesignAli
AliAli
Analyze Created DesignTeam
Material Research and Selection
Team
Ergonomics O
ptimization
AliAli
Mechanical O
ptimization
AlexAlex
Alex
Microeconom
icsDayo
Dayo
Check for Cost of Materials
Ali
Check Junkyards for Parts or Order them
Alex
Build a Beta-PrototypeTeam
Create Report for Progress/Second Design ReviewTeam
Design for Environment
Review Final Design
Team
Order N
eeded Parts for Final Design Model
DayoDayo
Create a Marketing M
odelTeam
TeamTeam
Assemble M
odelTeam
Create Business opportunitiesAli
Ali
Create Financial DataDayo
Dayo
Analyze and Test Final Design Model
TeamTeam
Create Tech. Analysis and Benchmarking
AlexAlex
Create Design Expo. PosterTeam
Create Final ReportTeam
Team
Important Dates
Presentn & Report Proposal/First Design Review
Fall study break
Presentn & Report Proposal/Second Design Review
Thanksgiving Break
Business Plan Presentation Group A
Business plan Presentation Group B
Design Exposition
Business Plan and Final Report Due. CLASS ENDS
12/2/2010
12/7/2010
12/9/2010
12/14/2010
11/25/2010 - 11/28/2010
DESIGN
ATION
Dates
10/5/2010
10/18/2010 - 10/19/2010
11/9/2010
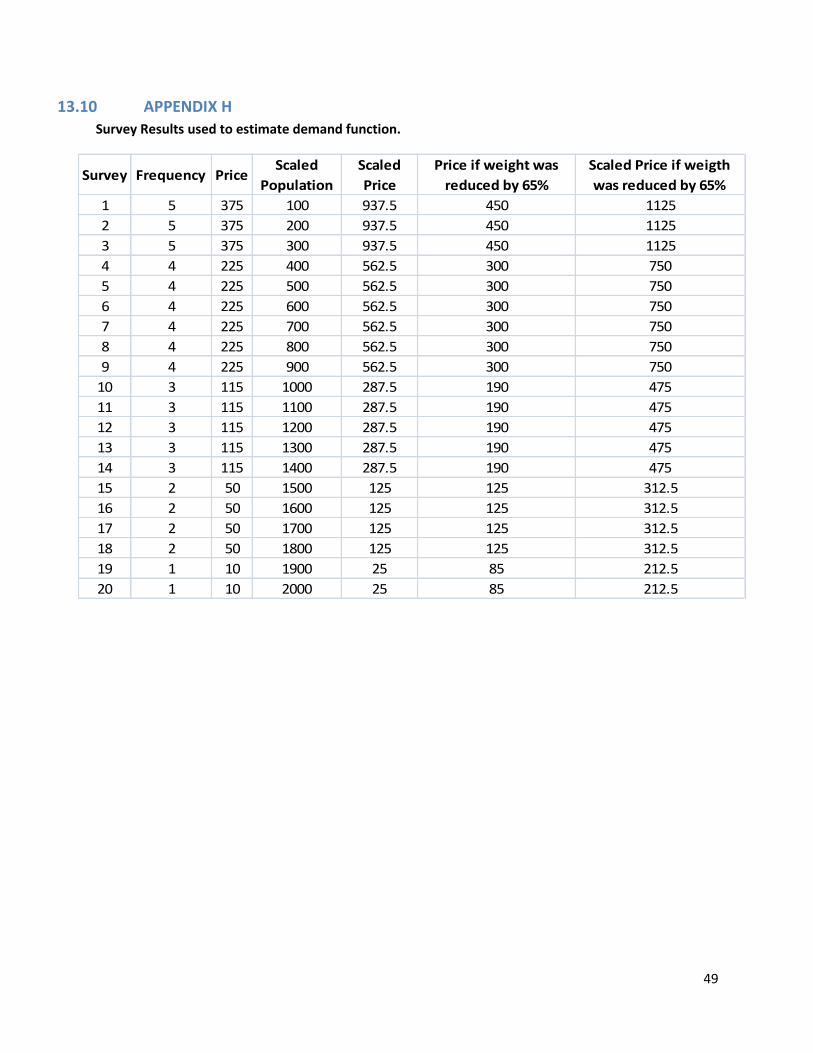
49
13.10 APPENDIX H
Survey Results used to estimate demand function.
Survey Frequency PriceScaled
Population
Scaled
Price
Price if weight was
reduced by 65%
Scaled Price if weigth
was reduced by 65%
1 5 375 100 937.5 450 1125
2 5 375 200 937.5 450 1125
3 5 375 300 937.5 450 1125
4 4 225 400 562.5 300 750
5 4 225 500 562.5 300 750
6 4 225 600 562.5 300 750
7 4 225 700 562.5 300 750
8 4 225 800 562.5 300 750
9 4 225 900 562.5 300 750
10 3 115 1000 287.5 190 475
11 3 115 1100 287.5 190 475
12 3 115 1200 287.5 190 475
13 3 115 1300 287.5 190 475
14 3 115 1400 287.5 190 475
15 2 50 1500 125 125 312.5
16 2 50 1600 125 125 312.5
17 2 50 1700 125 125 312.5
18 2 50 1800 125 125 312.5
19 1 10 1900 25 85 212.5
20 1 10 2000 25 85 212.5
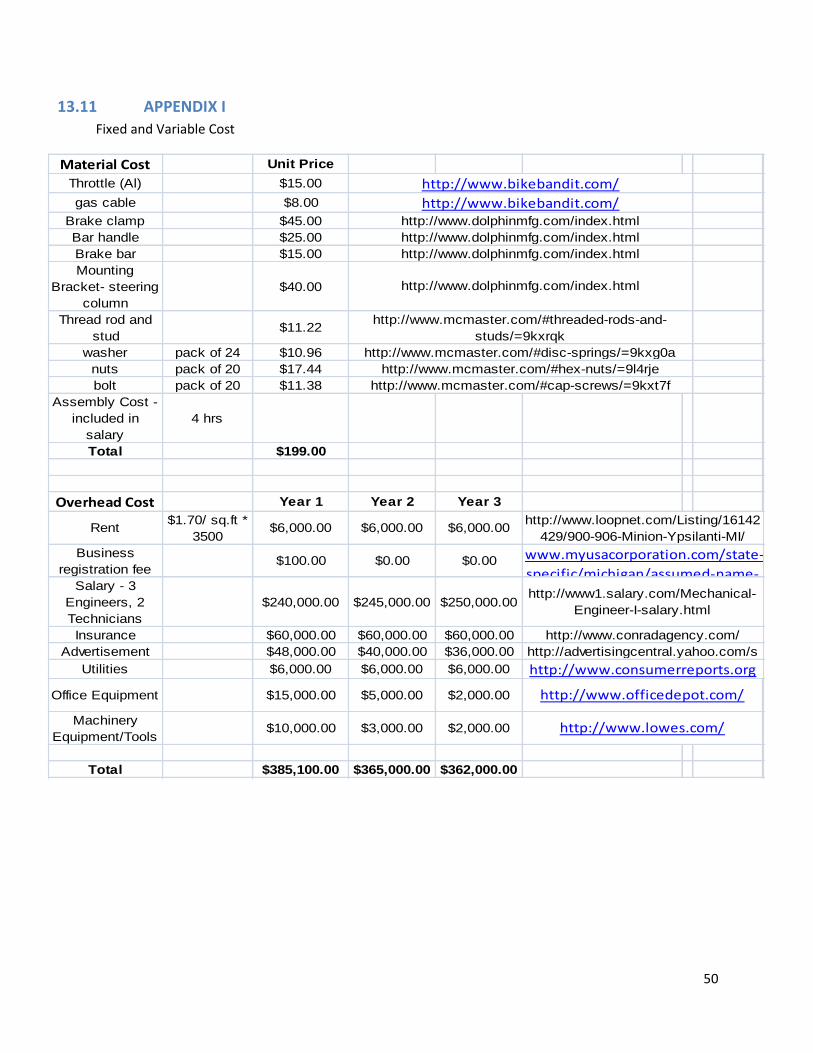
50
13.11 APPENDIX I
Fixed and Variable Cost
Material Cost Unit Price
Throttle (Al) $15.00
gas cable $8.00
Brake clamp $45.00
Bar handle $25.00
Brake bar $15.00
Mounting
Bracket- steering
column
$40.00
Thread rod and
stud$11.22
washer pack of 24 $10.96
nuts pack of 20 $17.44
bolt pack of 20 $11.38
Assembly Cost -
included in
salary
4 hrs
Total $199.00
Overhead Cost Year 1 Year 2 Year 3
Rent$1.70/ sq.ft *
3500$6,000.00 $6,000.00 $6,000.00
Business
registration fee$100.00 $0.00 $0.00
Salary - 3
Engineers, 2
Technicians
$240,000.00 $245,000.00 $250,000.00
Insurance $60,000.00 $60,000.00 $60,000.00
Advertisement $48,000.00 $40,000.00 $36,000.00
Utilities $6,000.00 $6,000.00 $6,000.00
Office Equipment $15,000.00 $5,000.00 $2,000.00
Machinery
Equipment/Tools$10,000.00 $3,000.00 $2,000.00
Total $385,100.00 $365,000.00 $362,000.00
http://www.officedepot.com/
http://www.lowes.com/
http://www.dolphinmfg.com/index.html
http://www.dolphinmfg.com/index.html
http://www.dolphinmfg.com/index.html
http://www.mcmaster.com/#threaded-rods-and-
studs/=9kxrqk
http://www.consumerreports.org
http://www.bikebandit.com/
http://www.bikebandit.com/http://www.dolphinmfg.com/index.html
http://www.conradagency.com/
http://advertisingcentral.yahoo.com/s
http://www.mcmaster.com/#disc-springs/=9kxg0a
http://www.mcmaster.com/#hex-nuts/=9l4rje
http://www.mcmaster.com/#cap-screws/=9kxt7f
http://www.loopnet.com/Listing/16142
429/900-906-Minion-Ypsilanti-MI/
www.myusacorporation.com/state-
specific/michigan/assumed-name-
http://www1.salary.com/Mechanical-
Engineer-I-salary.html
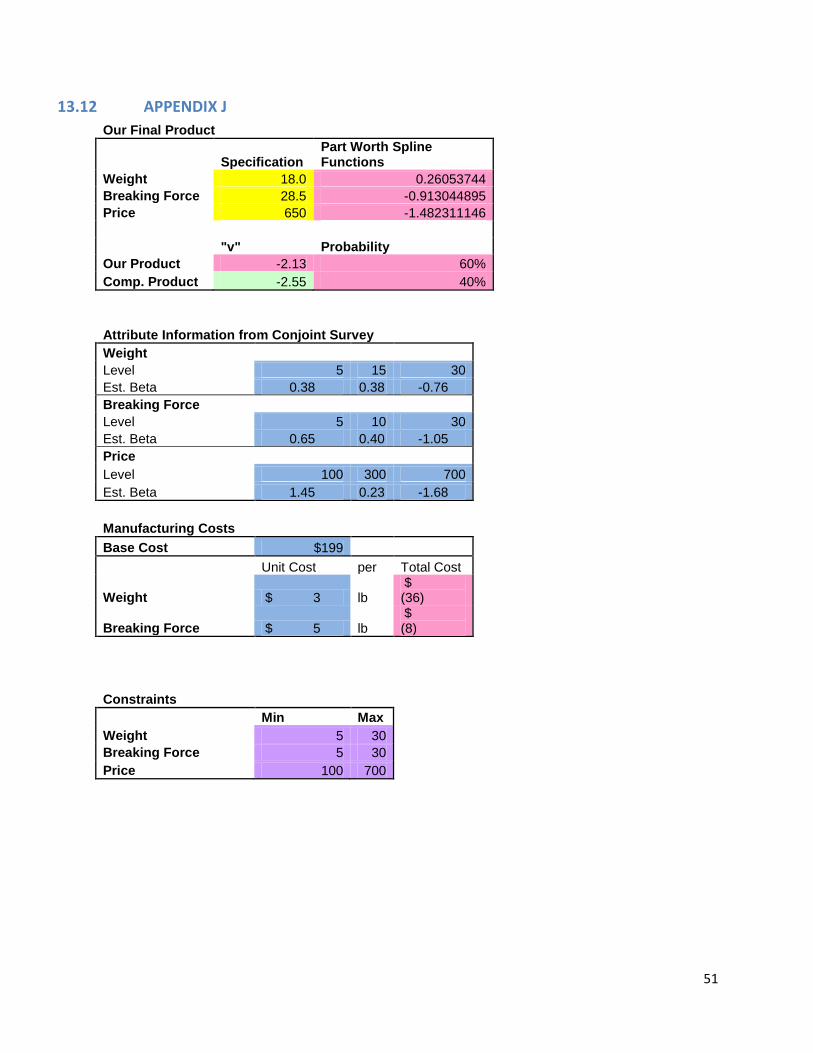
51
13.12 APPENDIX J
Our Final Product
Specification Part Worth Spline Functions
Weight 18.0 0.26053744
Breaking Force 28.5 -0.913044895
Price 650 -1.482311146
"v" Probability
Our Product -2.13 60%
Comp. Product -2.55 40%
Attribute Information from Conjoint Survey Weight
Level 5 15 30
Est. Beta 0.38 0.38 -0.76
Breaking Force
Level 5 10 30
Est. Beta 0.65 0.40 -1.05
Price
Level 100 300 700
Est. Beta 1.45 0.23 -1.68
Manufacturing Costs Base Cost $199
Unit Cost per Total Cost
Weight $ 3 lb $ (36)
Breaking Force $ 5 lb $ (8)
Constraints Min Max
Weight 5 30 Breaking Force 5 30 Price 100 700
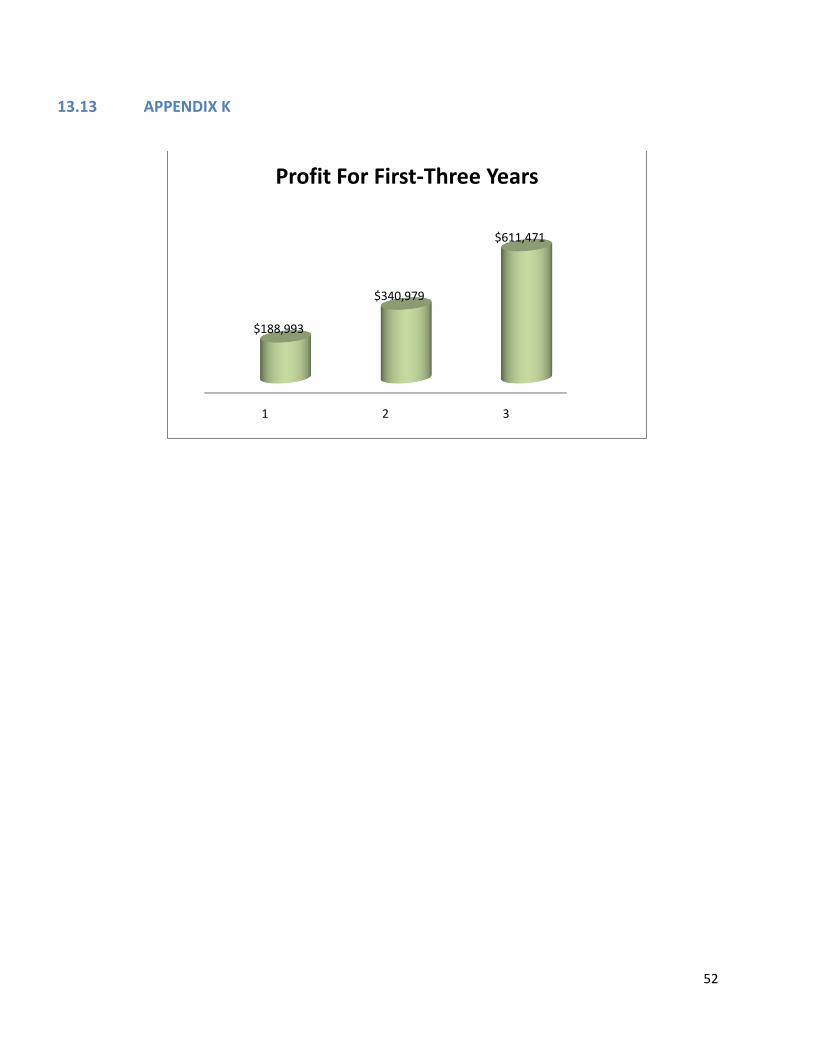
52
13.13 APPENDIX K
1 2 3
$188,993
$340,979
$611,471
Profit For First-Three Years