Embed Size (px)
Citation preview
APEC Energy Demand and Supply Outlook – 5th Edition Transport Sector Energy Demand
41
5 TRANSP ORT SEC TOR EN ERGY DEM AN D
The continued dependence on oil-derived fuels for transport poses two major concerns for all APEC economies, especially the oil importing economies. First, there is the oil security concerns discussed in Chapter 11. These oil security concerns mean continued oil price volatility will be a near certainty, and there will be significant risks of supply disruptions. Second, oil is a fossil fuel and its use in the transport sector is a major source of greenhouse gas emissions in all APEC economies. For these reasons, there is a strong need to reduce dependence on oil in the transport sector.
Motorization correlates closely with economic growth. However the relationship between the two varies greatly depending on the circumstances. For developing economies, growing income is usually accompanied by rapid growth in vehicle ownership per capita. As economies become wealthier, the growth in vehicle ownership slows down. Eventually economies approach vehicle saturation, or a maximum vehicle ownership level per capita. At this point, growth in per capita vehicle ownership slows to almost zero. However, the level of vehicle ownership per capita at which saturation is reached is strongly tied to the way cities are planned. This suggests better urban planning is a key policy for reducing oil dependence in transport.
More broadly, transport energy demand is a combination of three variables. These variables are: the demand for mobility, the transport mode used for mobility and the energy efficiency of the mode. Policies for reducing energy use in transport correspond to these variables: ‘Avoid’ (the demand for mobility), ‘Shift’ (to alternative modes) and ‘Improve’ (energy efficiency). Better urban planning is the main tool to accomplish ‘Avoid’ and ‘Shift’. On the other hand, better vehicle design is the main tool to accomplish ‘Improve’.
All three variables also respond to the price of energy. In the transport sector, this primarily means the price of oil. In recent years oil prices have increased rapidly. Under business-as-usual (BAU), real oil prices are assumed to remain high by historical standards, and to rise to above USD 120 per barrel by 2035. This is a key reason why the growth in oil demand in APEC economies is expected to be moderate over the outlook period.
This chapter first examines the BAU model results for the APEC region. It then discusses two
sets of alternative scenarios exploring options for better urban planning and better vehicle design.
BUSINESS-AS-USUAL TRANSPORT DEMAND RESULTS
Energy Demand
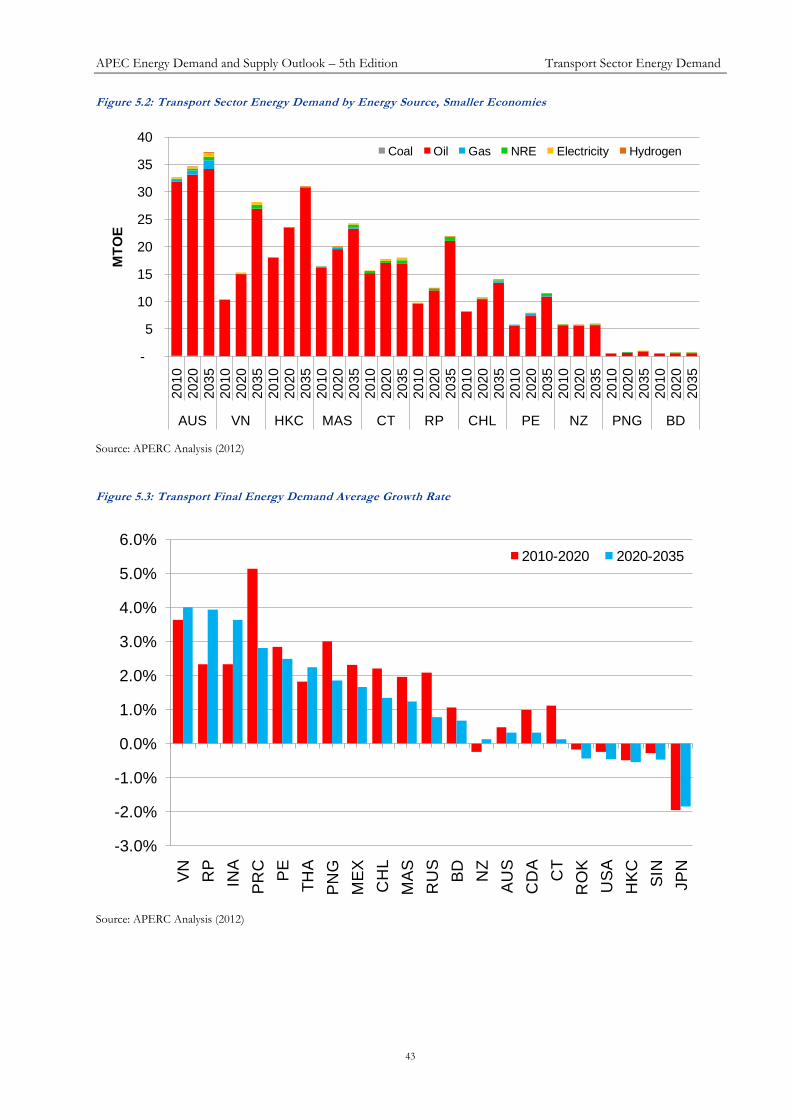
Figures 5.1 and 5.2 show the projected domestic transport energy demand by economy and by fuel under a business-as-usual (BAU) scenario. Note the differences between the scales of the vertical axes in the two figures. Over the outlook period domestic transport energy demand in the APEC region is projected to increase from 1203 million tonnes of oil equivalent (Mtoe) in 2010 to 1555 Mtoe in 2035, or a compound annual growth rate of 1.1%. The OECD APEC member economies, which tend to be economically more mature, are projected to show a net decline in domestic transport energy demand from 790 Mtoe in 2010 to 720 Mtoe in 2035 (-0.4% compound annual growth rate). In contrast, non-OECD APEC economies, which tend to be developing economies, show an increase from 415 Mtoe to 880 Mtoe (a 3.2% compound annual growth rate) over the same period.
Oil remains the primary fuel used in the transport sector, supplying 87% of domestic transport demand in 2035, a small reduction from 92% in 2010. Growth in alternative fuels is supported by the growing use of biofuels, natural gas and electricity.
The United States (US) and Japan are two notable exceptions to the trend of increasing energy demand in the domestic transport sector. In the economies of the US and Japan, transport energy demand is projected to decline 8% and 38% respectively between 2010 and 2035. The US transport energy demand is projected to decline due to more stringent Corporate Average Fuel Economy (CAFE) energy efficiency standards for vehicles, combined with an already nearly saturated vehicle ownership and a greater use of alternative vehicles. These factors will outweigh the growth in the vehicle fleet due to population growth. Japan’s transport energy demand decline is more pronounced, with the compounded effect of a declining population leading to a shrinking vehicle fleet in combination with the aforementioned factors (see the United States and Japan economy reviews detailed in Volume 2).
APEC Energy Demand and Supply Outlook – 5th Edition Transport Sector Energy Demand
42
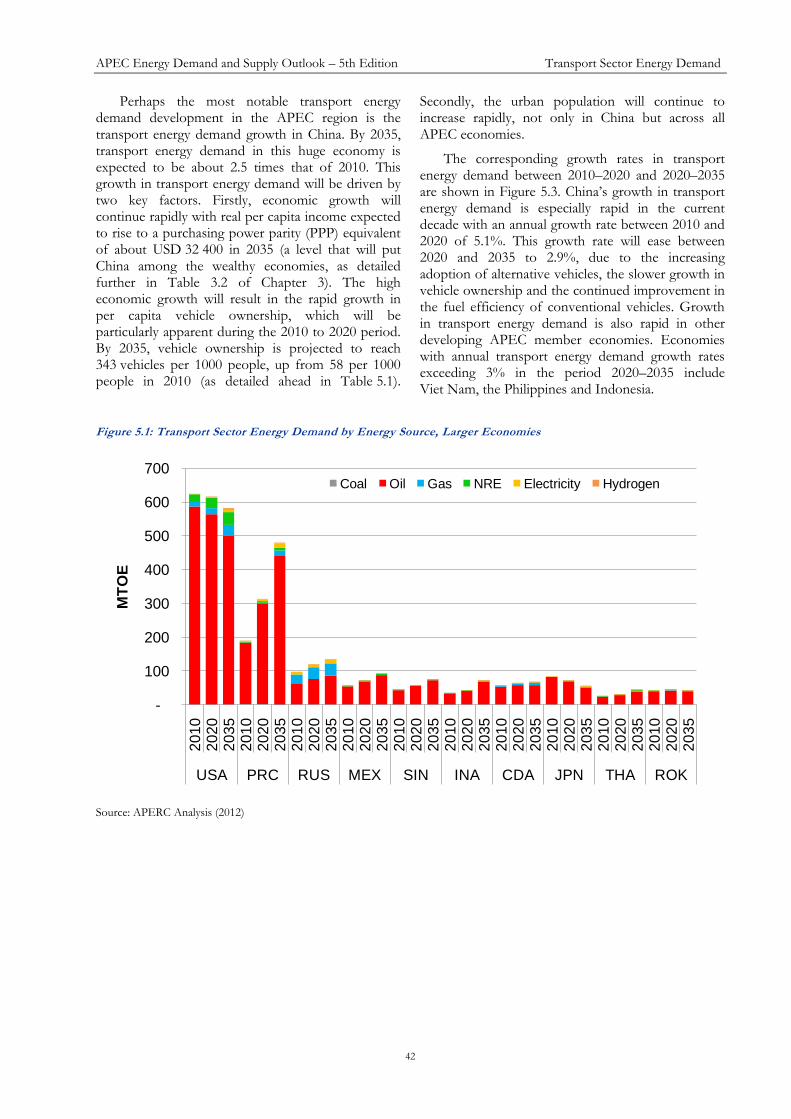
Perhaps the most notable transport energy demand development in the APEC region is the transport energy demand growth in China. By 2035, transport energy demand in this huge economy is expected to be about 2.5 times that of 2010. This growth in transport energy demand will be driven by two key factors. Firstly, economic growth will continue rapidly with real per capita income expected to rise to a purchasing power parity (PPP) equivalent of about USD 32 400 in 2035 (a level that will put China among the wealthy economies, as detailed further in Table 3.2 of Chapter 3). The high economic growth will result in the rapid growth in per capita vehicle ownership, which will be particularly apparent during the 2010 to 2020 period. By 2035, vehicle ownership is projected to reach 343 vehicles per 1000 people, up from 58 per 1000 people in 2010 (as detailed ahead in Table 5.1).
Secondly, the urban population will continue to increase rapidly, not only in China but across all APEC economies.
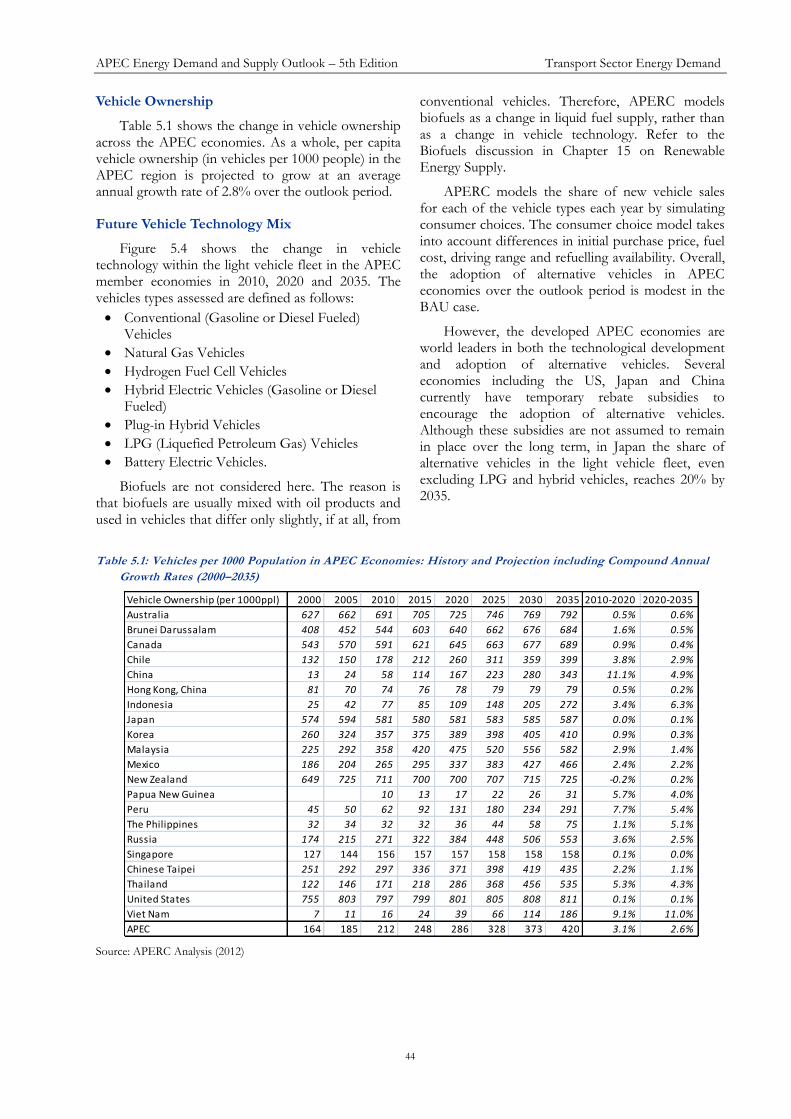
The corresponding growth rates in transport energy demand between 2010–2020 and 2020–2035 are shown in Figure 5.3. China’s growth in transport energy demand is especially rapid in the current decade with an annual growth rate between 2010 and 2020 of 5.1%. This growth rate will ease between 2020 and 2035 to 2.9%, due to the increasing adoption of alternative vehicles, the slower growth in vehicle ownership and the continued improvement in the fuel efficiency of conventional vehicles. Growth in transport energy demand is also rapid in other developing APEC member economies. Economies with annual transport energy demand growth rates exceeding 3% in the period 2020–2035 include Viet Nam, the Philippines and Indonesia.
Figure 5.1: Transport Sector Energy Demand by Energy Source, Larger Economies
Source: APERC Analysis (2012)
-
100
200
300
400
500
600
700
20
10
20
20
20
35
20
10
20
20
20
35
20
10
20
20
20
35
20
10
20
20
20
35
20
10
20
20
20
35
20
10
20
20
20
35
20
10
20
20
20
35
20
10
20
20
20
35
20
10
20
20
20
35
20
10
20
20
20
35
USA PRC RUS MEX SIN INA CDA JPN THA ROK
MT
OE
Coal Oil Gas NRE Electricity Hydrogen
APEC Energy Demand and Supply Outlook – 5th Edition Transport Sector Energy Demand
43
Figure 5.2: Transport Sector Energy Demand by Energy Source, Smaller Economies
Source: APERC Analysis (2012)
Figure 5.3: Transport Final Energy Demand Average Growth Rate
Source: APERC Analysis (2012)
-
5
10
15
20
25
30
35
40
20
10
20
20
20
35
20
10
20
20
20
35
20
10
20
20
20
35
20
10
20
20
20
35
20
10
20
20
20
35
20
10
20
20
20
35
20
10
20
20
20
35
20
10
20
20
20
35
20
10
20
20
20
35
20
10
20
20
20
35
20
10
20
20
20
35
AUS VN HKC MAS CT RP CHL PE NZ PNG BD
MT
OE
Coal Oil Gas NRE Electricity Hydrogen
-3.0%
-2.0%
-1.0%
0.0%
1.0%
2.0%
3.0%
4.0%
5.0%
6.0%
VN
RP
INA
PR
C
PE
TH
A
PN
G
ME
X
CH
L
MA
S
RU
S
BD
NZ
AU
S
CD
A
CT
RO
K
US
A
HK
C
SIN
JP
N
2010-2020 2020-2035
APEC Energy Demand and Supply Outlook – 5th Edition Transport Sector Energy Demand
44
Vehicle Ownership
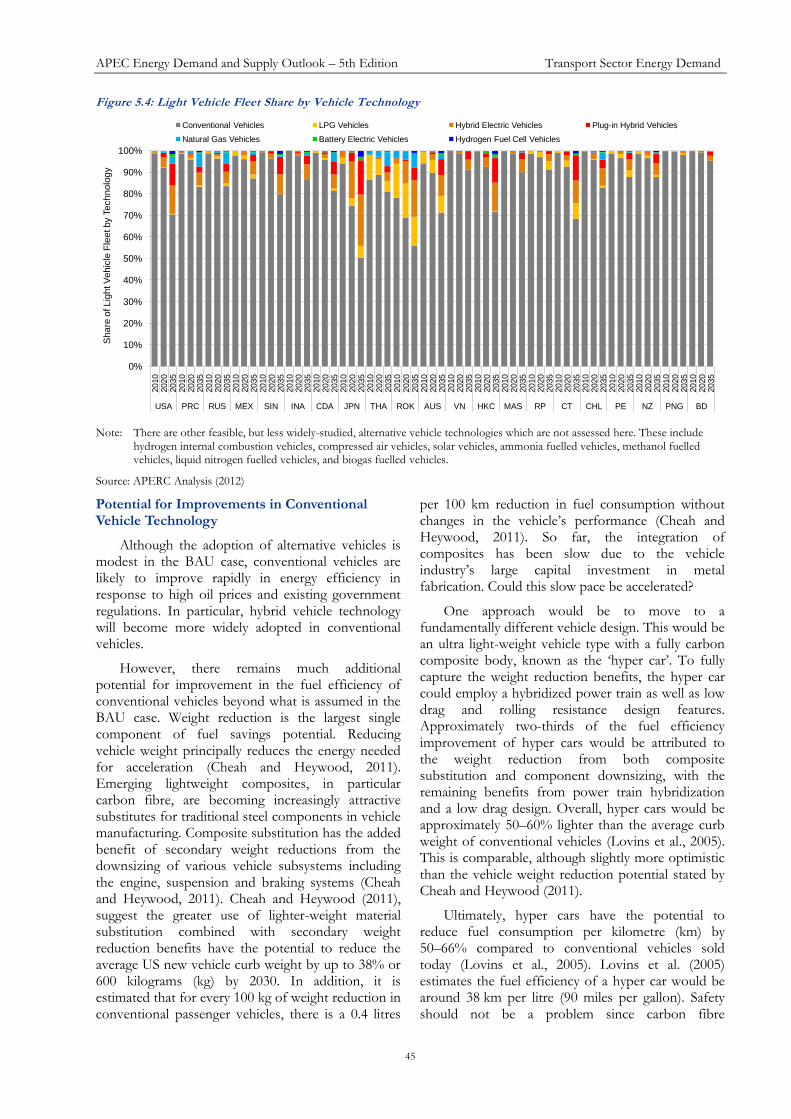
Table 5.1 shows the change in vehicle ownership across the APEC economies. As a whole, per capita vehicle ownership (in vehicles per 1000 people) in the APEC region is projected to grow at an average annual growth rate of 2.8% over the outlook period.
Future Vehicle Technology Mix
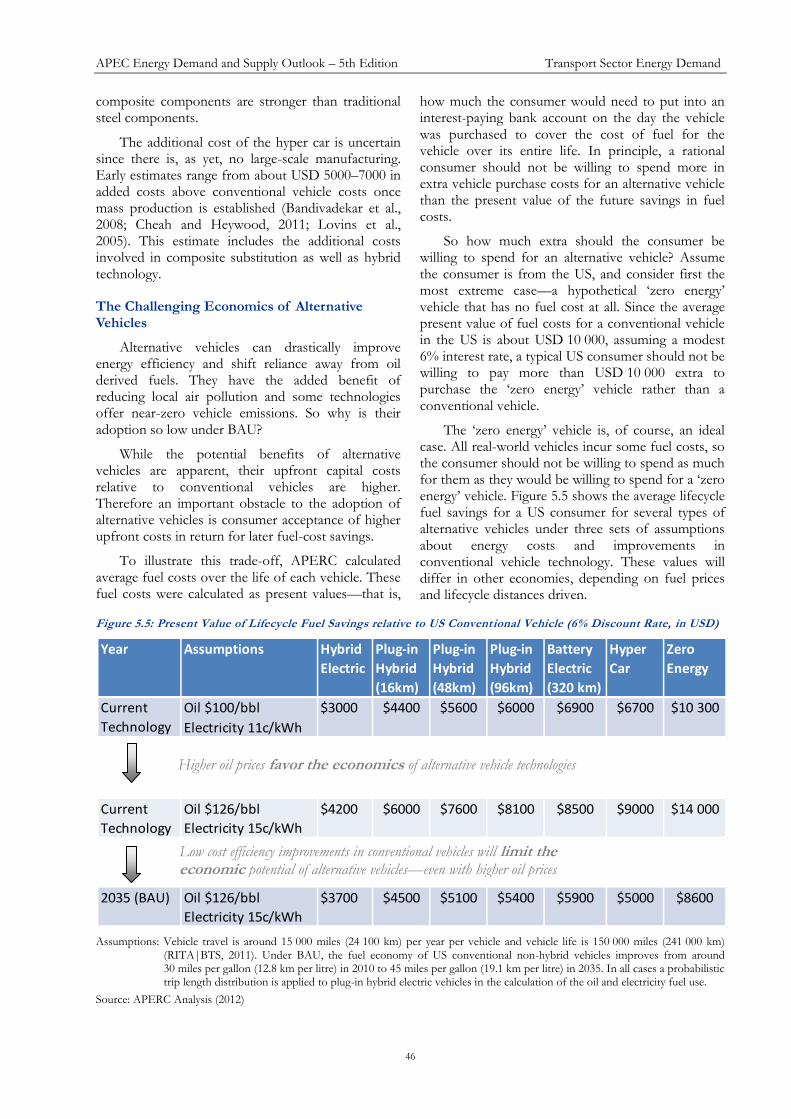
Figure 5.4 shows the change in vehicle technology within the light vehicle fleet in the APEC member economies in 2010, 2020 and 2035. The vehicles types assessed are defined as follows:
Conventional (Gasoline or Diesel Fueled) Vehicles
Natural Gas Vehicles
Hydrogen Fuel Cell Vehicles
Hybrid Electric Vehicles (Gasoline or Diesel Fueled)
Plug-in Hybrid Vehicles
LPG (Liquefied Petroleum Gas) Vehicles
Battery Electric Vehicles.
Biofuels are not considered here. The reason is that biofuels are usually mixed with oil products and used in vehicles that differ only slightly, if at all, from
conventional vehicles. Therefore, APERC models biofuels as a change in liquid fuel supply, rather than as a change in vehicle technology. Refer to the Biofuels discussion in Chapter 15 on Renewable Energy Supply.
APERC models the share of new vehicle sales for each of the vehicle types each year by simulating consumer choices. The consumer choice model takes into account differences in initial purchase price, fuel cost, driving range and refuelling availability. Overall, the adoption of alternative vehicles in APEC economies over the outlook period is modest in the BAU case.
However, the developed APEC economies are world leaders in both the technological development and adoption of alternative vehicles. Several economies including the US, Japan and China currently have temporary rebate subsidies to encourage the adoption of alternative vehicles. Although these subsidies are not assumed to remain in place over the long term, in Japan the share of alternative vehicles in the light vehicle fleet, even excluding LPG and hybrid vehicles, reaches 20% by 2035.
Table 5.1: Vehicles per 1000 Population in APEC Economies: History and Projection including Compound Annual
Growth Rates (2000–2035)
Source: APERC Analysis (2012)
Vehicle Ownership (per 1000ppl) 2000 2005 2010 2015 2020 2025 2030 2035 2010-2020 2020-2035
Australia 627 662 691 705 725 746 769 792 0.5% 0.6%
Brunei Darussalam 408 452 544 603 640 662 676 684 1.6% 0.5%
Canada 543 570 591 621 645 663 677 689 0.9% 0.4%
Chile 132 150 178 212 260 311 359 399 3.8% 2.9%
China 13 24 58 114 167 223 280 343 11.1% 4.9%
Hong Kong, China 81 70 74 76 78 79 79 79 0.5% 0.2%
Indonesia 25 42 77 85 109 148 205 272 3.4% 6.3%
Japan 574 594 581 580 581 583 585 587 0.0% 0.1%
Korea 260 324 357 375 389 398 405 410 0.9% 0.3%
Malaysia 225 292 358 420 475 520 556 582 2.9% 1.4%
Mexico 186 204 265 295 337 383 427 466 2.4% 2.2%
New Zealand 649 725 711 700 700 707 715 725 -0.2% 0.2%
Papua New Guinea 10 13 17 22 26 31 5.7% 4.0%
Peru 45 50 62 92 131 180 234 291 7.7% 5.4%
The Philippines 32 34 32 32 36 44 58 75 1.1% 5.1%
Russia 174 215 271 322 384 448 506 553 3.6% 2.5%
Singapore 127 144 156 157 157 158 158 158 0.1% 0.0%
Chinese Taipei 251 292 297 336 371 398 419 435 2.2% 1.1%
Thailand 122 146 171 218 286 368 456 535 5.3% 4.3%
United States 755 803 797 799 801 805 808 811 0.1% 0.1%
Viet Nam 7 11 16 24 39 66 114 186 9.1% 11.0%
APEC 164 185 212 248 286 328 373 420 3.1% 2.6%
APEC Energy Demand and Supply Outlook – 5th Edition Transport Sector Energy Demand
45
Figure 5.4: Light Vehicle Fleet Share by Vehicle Technology
Note: There are other feasible, but less widely-studied, alternative vehicle technologies which are not assessed here. These include
hydrogen internal combustion vehicles, compressed air vehicles, solar vehicles, ammonia fuelled vehicles, methanol fuelled vehicles, liquid nitrogen fuelled vehicles, and biogas fuelled vehicles.
Source: APERC Analysis (2012)
Potential for Improvements in Conventional Vehicle Technology
Although the adoption of alternative vehicles is modest in the BAU case, conventional vehicles are likely to improve rapidly in energy efficiency in response to high oil prices and existing government regulations. In particular, hybrid vehicle technology will become more widely adopted in conventional vehicles.
However, there remains much additional potential for improvement in the fuel efficiency of conventional vehicles beyond what is assumed in the BAU case. Weight reduction is the largest single component of fuel savings potential. Reducing vehicle weight principally reduces the energy needed for acceleration (Cheah and Heywood, 2011). Emerging lightweight composites, in particular carbon fibre, are becoming increasingly attractive substitutes for traditional steel components in vehicle manufacturing. Composite substitution has the added benefit of secondary weight reductions from the downsizing of various vehicle subsystems including the engine, suspension and braking systems (Cheah and Heywood, 2011). Cheah and Heywood (2011), suggest the greater use of lighter-weight material substitution combined with secondary weight reduction benefits have the potential to reduce the average US new vehicle curb weight by up to 38% or 600 kilograms (kg) by 2030. In addition, it is estimated that for every 100 kg of weight reduction in conventional passenger vehicles, there is a 0.4 litres
per 100 km reduction in fuel consumption without changes in the vehicle’s performance (Cheah and Heywood, 2011). So far, the integration of composites has been slow due to the vehicle industry’s large capital investment in metal fabrication. Could this slow pace be accelerated?
One approach would be to move to a fundamentally different vehicle design. This would be an ultra light-weight vehicle type with a fully carbon composite body, known as the ‘hyper car’. To fully capture the weight reduction benefits, the hyper car could employ a hybridized power train as well as low drag and rolling resistance design features. Approximately two-thirds of the fuel efficiency improvement of hyper cars would be attributed to the weight reduction from both composite substitution and component downsizing, with the remaining benefits from power train hybridization and a low drag design. Overall, hyper cars would be approximately 50–60% lighter than the average curb weight of conventional vehicles (Lovins et al., 2005). This is comparable, although slightly more optimistic than the vehicle weight reduction potential stated by Cheah and Heywood (2011).
Ultimately, hyper cars have the potential to reduce fuel consumption per kilometre (km) by 50–66% compared to conventional vehicles sold today (Lovins et al., 2005). Lovins et al. (2005) estimates the fuel efficiency of a hyper car would be around 38 km per litre (90 miles per gallon). Safety should not be a problem since carbon fibre
0%
10%
20%
30%
40%
50%
60%
70%
80%
90%
100%2010
2020
2035
2010
2020
2035
2010
2020
2035
2010
2020
2035
2010
2020
2035
2010
2020
2035
2010
2020
2035
2010
2020
2035
2010
2020
2035
2010
2020
2035
2010
2020
2035
2010
2020
2035
2010
2020
2035
2010
2020
2035
2010
2020
2035
2010
2020
2035
2010
2020
2035
2010
2020
2035
2010
2020
2035
2010
2020
2035
2010
2020
2035
USA PRC RUS MEX SIN INA CDA JPN THA ROK AUS VN HKC MAS RP CT CHL PE NZ PNG BD
Sh
are
of L
igh
t V
eh
icle
Fle
et b
y T
ech
no
log
y
Conventional Vehicles LPG Vehicles Hybrid Electric Vehicles Plug-in Hybrid Vehicles
Natural Gas Vehicles Battery Electric Vehicles Hydrogen Fuel Cell Vehicles
APEC Energy Demand and Supply Outlook – 5th Edition Transport Sector Energy Demand
46
composite components are stronger than traditional steel components.
The additional cost of the hyper car is uncertain since there is, as yet, no large-scale manufacturing. Early estimates range from about USD 5000–7000 in added costs above conventional vehicle costs once mass production is established (Bandivadekar et al., 2008; Cheah and Heywood, 2011; Lovins et al., 2005). This estimate includes the additional costs involved in composite substitution as well as hybrid technology.
The Challenging Economics of Alternative Vehicles
Alternative vehicles can drastically improve energy efficiency and shift reliance away from oil derived fuels. They have the added benefit of reducing local air pollution and some technologies offer near-zero vehicle emissions. So why is their adoption so low under BAU?
While the potential benefits of alternative vehicles are apparent, their upfront capital costs relative to conventional vehicles are higher. Therefore an important obstacle to the adoption of alternative vehicles is consumer acceptance of higher upfront costs in return for later fuel-cost savings.
To illustrate this trade-off, APERC calculated average fuel costs over the life of each vehicle. These fuel costs were calculated as present values—that is,
how much the consumer would need to put into an interest-paying bank account on the day the vehicle was purchased to cover the cost of fuel for the vehicle over its entire life. In principle, a rational consumer should not be willing to spend more in extra vehicle purchase costs for an alternative vehicle than the present value of the future savings in fuel costs.
So how much extra should the consumer be willing to spend for an alternative vehicle? Assume the consumer is from the US, and consider first the most extreme case—a hypothetical ‘zero energy’ vehicle that has no fuel cost at all. Since the average present value of fuel costs for a conventional vehicle in the US is about USD 10 000, assuming a modest 6% interest rate, a typical US consumer should not be willing to pay more than USD 10 000 extra to purchase the ‘zero energy’ vehicle rather than a conventional vehicle.
The ‘zero energy’ vehicle is, of course, an ideal case. All real-world vehicles incur some fuel costs, so the consumer should not be willing to spend as much for them as they would be willing to spend for a ‘zero energy’ vehicle. Figure 5.5 shows the average lifecycle fuel savings for a US consumer for several types of alternative vehicles under three sets of assumptions about energy costs and improvements in conventional vehicle technology. These values will differ in other economies, depending on fuel prices and lifecycle distances driven.
Figure 5.5: Present Value of Lifecycle Fuel Savings relative to US Conventional Vehicle (6% Discount Rate, in USD)
Assumptions: Vehicle travel is around 15 000 miles (24 100 km) per year per vehicle and vehicle life is 150 000 miles (241 000 km) (RITA|BTS, 2011). Under BAU, the fuel economy of US conventional non-hybrid vehicles improves from around 30 miles per gallon (12.8 km per litre) in 2010 to 45 miles per gallon (19.1 km per litre) in 2035. In all cases a probabilistic trip length distribution is applied to plug-in hybrid electric vehicles in the calculation of the oil and electricity fuel use.
Source: APERC Analysis (2012)
Year Assumptions Hybrid
Electric
Plug-in
Hybrid
(16km)
Plug-in
Hybrid
(48km)
Plug-in
Hybrid
(96km)
Battery
Electric
(320 km)
Hyper
Car
Zero
Energy
Oil $100/bbl
Electricity 11c/kWh
$10 300 Current
Technology
$3000 $4400 $5600 $6000 $6900 $6700
Oil $126/bbl
Electricity 15c/kWh
Current
Technology
$4200 $6000 $7600 $8100 $8500 $14 000 $9000
Oil $126/bbl
Electricity 15c/kWh
$8600 $5000 2035 (BAU) $3700 $4500 $5100 $5400 $5900
Higher oil prices favor the economics of alternative vehicle technologies
Low cost efficiency improvements in conventional vehicles will limit the economic potential of alternative vehicles—even with higher oil prices
APEC Energy Demand and Supply Outlook – 5th Edition Transport Sector Energy Demand
47
In the top part of Figure 5.5, the present value of lifecycle fuel savings assumes real energy prices over the vehicle’s life are constant—at an oil price of USD 100 per barrel and an electricity price of USD 0.11c per kilowatt-hour (kWh). Under this scenario the present value of fuel savings for a Battery Electric Vehicle with a 320 km (200 mile) range is approximately USD 6900. The fuel savings for Plug-in Hybrid Vehicles are variable depending on the electric propulsion range. For a 96 km (60 mile) range Plug-in Hybrid Vehicle, the present value of fuel savings is around USD 6000. As we reduce the electric propulsion range our potential present value of fuel savings decreases accordingly.
In the middle part of Figure 5.5, real oil prices are assumed to increase to USD 126 per barrel in 2035. This aligns with APERC’s BAU oil price assumption. Similarly, real electricity prices increase to USD 0.15c per kWh. Under higher energy prices the present value of fuel savings are more substantial, with potential savings reaching USD 8500 for a
Battery Electric Vehicle with a 320 km range. For the ‘zero energy’ vehicle, the present value of lifecycle fuel savings increases to USD 14 000.
In the bottom part of Figure 5.5, the benefit of rising energy costs is counteracted by the potential for low cost energy efficiency improvements in conventional vehicles, as assumed in the BAU case.
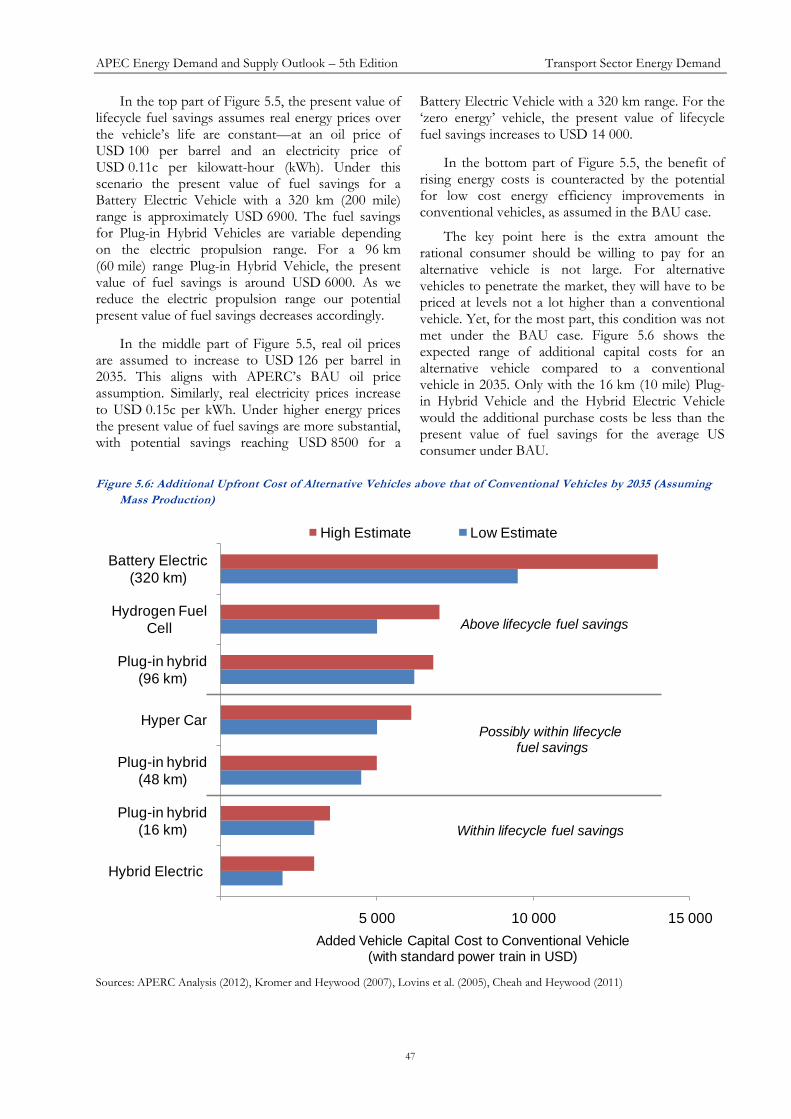
The key point here is the extra amount the rational consumer should be willing to pay for an alternative vehicle is not large. For alternative vehicles to penetrate the market, they will have to be priced at levels not a lot higher than a conventional vehicle. Yet, for the most part, this condition was not met under the BAU case. Figure 5.6 shows the expected range of additional capital costs for an alternative vehicle compared to a conventional vehicle in 2035. Only with the 16 km (10 mile) Plug-in Hybrid Vehicle and the Hybrid Electric Vehicle would the additional purchase costs be less than the present value of fuel savings for the average US consumer under BAU.
Figure 5.6: Additional Upfront Cost of Alternative Vehicles above that of Conventional Vehicles by 2035 (Assuming
Mass Production)
Sources: APERC Analysis (2012), Kromer and Heywood (2007), Lovins et al. (2005), Cheah and Heywood (2011)
5 000 10 000 15 000
Hybrid Electric
Plug-in hybrid
(16 km)
Plug-in hybrid
(48 km)
Hyper Car
Plug-in hybrid
(96 km)
Hydrogen Fuel
Cell
Battery Electric
(320 km)
Added Vehicle Capital Cost to Conventional Vehicle (with standard power train in USD)
High Estimate Low Estimate
Within lifecycle fuel savings
Above lifecycle fuel savings
Possibly within lifecycle fuel savings
APEC Energy Demand and Supply Outlook – 5th Edition Transport Sector Energy Demand
48
This analysis is probably conservative. Additional barriers for some alternative vehicles include battery degradation (requiring replacement), higher depreciation rates (caused by uncertainty over reliability), the disutility of shorter driving ranges (requiring more frequent refuelling or even limits on the distance the vehicle can be driven in a day), and inadequate refuelling infrastructure. Furthermore, research also shows consumers weigh the upfront vehicle capital cost more heavily than the potential lifecycle fuel savings in their decision-making (Hidrue et al., 2011). This finding implies higher discount rates in relation to consumer choice may be more appropriate, which raises further barriers to the adoption of alternative vehicles. This finding is supported by Train (1986) and other studies that show consumer discount rates for automobile ownership could be as high as 13%.
In short, the economics of alternative vehicles are challenging. The outlook for these vehicles would, of course, be improved by higher energy prices and/or carbon pricing. But, for alternative vehicles to penetrate the market in a big way, an intensive effort will be needed to lower the initial cost of these vehicles to a level competitive with the cost of conventional vehicles.
ALTERNATIVE SCENARIOS
Despite significant improvements in vehicle fuel efficiency, driven in part by high oil prices, the rapid growth of the APEC region’s vehicle fleet is expected to continue to push up total oil demand in the transport sector. Under our business-as-usual (BAU) assumptions, we do not project any shift away from conventionally fuelled vehicles during the outlook period, although the penetration of hybrid vehicles, including plug-in hybrids, is expected to rise modestly.
Two alternative scenarios were developed to investigate potential energy-saving opportunities. These scenarios are discussed below.
ALTERNATIVE URBAN DEVELOPMENT
SCENARIOS
Urban areas are major drivers of economic growth. For developing economies the emergence of wealth starts first in major cities, creating inequality in wealth between cities and rural communities. Once economies mature the distribution of wealth is dispersed more equally between urban and rural areas. Urban areas also tend to be the main drivers of motorization in developing economies. However, the way urban areas are planned and managed is a key driver of future demand for vehicle ownership. This section discusses scenarios modelling the impact better urban planning and management could have on light vehicle energy demand, with particular focus on the connection to vehicle saturation.
Better urban planning and management goes by several names. These include ‘smart development’, ‘compact development’, and ‘transit-oriented development’. Each of them emphasizes the use of public transit, walking and cycling while reducing motor vehicle dependence through infrastructure investment and policies promoting these alternative transport modes. The goal is not only to save energy, but also to promote cities that are healthy, safe, and pleasant places to live.
Smart cities have a lot of transport energy-saving design features and policies. Prominent examples of design features and policies of smart cities include:
Mixed-use development with reduced distances between housing, jobs, shopping, and community services.
Inter-connected streets to provide for easier access to destinations.
Better facilities and environment for walking and bicycling.
APEC Energy Demand and Supply Outlook – 5th Edition Transport Sector Energy Demand
49
Higher quality transit services and more accessibility of destinations to transit.
A de-emphasis of urban motorway and parking development, which tend to promote automobile use.
In some cases, policies or taxes designed to limit vehicle ownership and use such as road and fuel pricing policies.
The Relationship of Population Density to Transport Energy Use
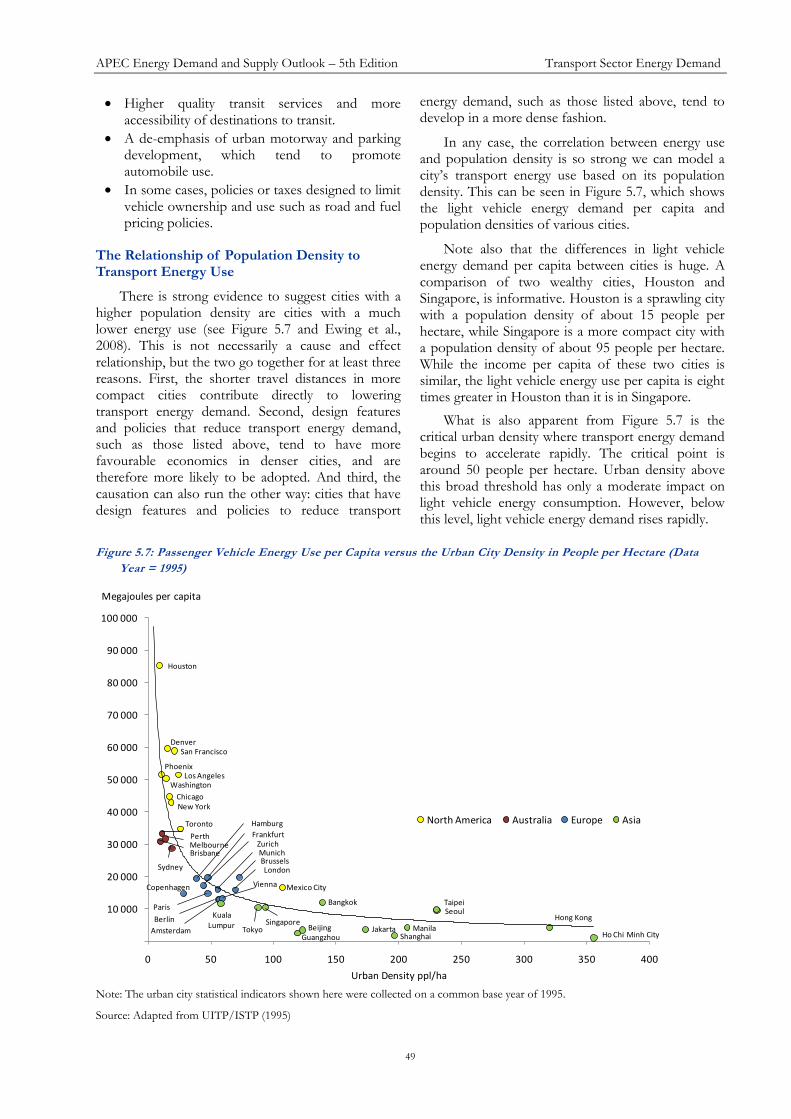
There is strong evidence to suggest cities with a higher population density are cities with a much lower energy use (see Figure 5.7 and Ewing et al., 2008). This is not necessarily a cause and effect relationship, but the two go together for at least three reasons. First, the shorter travel distances in more compact cities contribute directly to lowering transport energy demand. Second, design features and policies that reduce transport energy demand, such as those listed above, tend to have more favourable economics in denser cities, and are therefore more likely to be adopted. And third, the causation can also run the other way: cities that have design features and policies to reduce transport
energy demand, such as those listed above, tend to develop in a more dense fashion.
In any case, the correlation between energy use and population density is so strong we can model a city’s transport energy use based on its population density. This can be seen in Figure 5.7, which shows the light vehicle energy demand per capita and population densities of various cities.
Note also that the differences in light vehicle energy demand per capita between cities is huge. A comparison of two wealthy cities, Houston and Singapore, is informative. Houston is a sprawling city with a population density of about 15 people per hectare, while Singapore is a more compact city with a population density of about 95 people per hectare. While the income per capita of these two cities is similar, the light vehicle energy use per capita is eight times greater in Houston than it is in Singapore.
What is also apparent from Figure 5.7 is the critical urban density where transport energy demand begins to accelerate rapidly. The critical point is around 50 people per hectare. Urban density above this broad threshold has only a moderate impact on light vehicle energy consumption. However, below this level, light vehicle energy demand rises rapidly.
Figure 5.7: Passenger Vehicle Energy Use per Capita versus the Urban City Density in People per Hectare (Data
Year = 1995)
Note: The urban city statistical indicators shown here were collected on a common base year of 1995.
Source: Adapted from UITP/ISTP (1995)
Toronto
Chicago
Denver
Houston
Los Angeles
New York
Phoenix
San Francisco
Washington
Mexico City
BrisbaneMelbournePerth
Sydney
Vienna
Brussels
Copenhagen
Paris
Berlin
Frankfurt
Hamburg
Munich
Amsterdam
Zurich
London
Tokyo
Hong KongSingapore
Jakarta
KualaLumpur Beijing
ShanghaiGuangzhouManila
SeoulTaipeiBangkok
Ho Chi Minh City
10 000
20 000
30 000
40 000
50 000
60 000
70 000
80 000
90 000
100 000
0 50 100 150 200 250 300 350 400
Megajoules per capita
Urban Density ppl/ha
North America Australia Europe Asia
APEC Energy Demand and Supply Outlook – 5th Edition Transport Sector Energy Demand
50
The Declining Trend in Urban Density
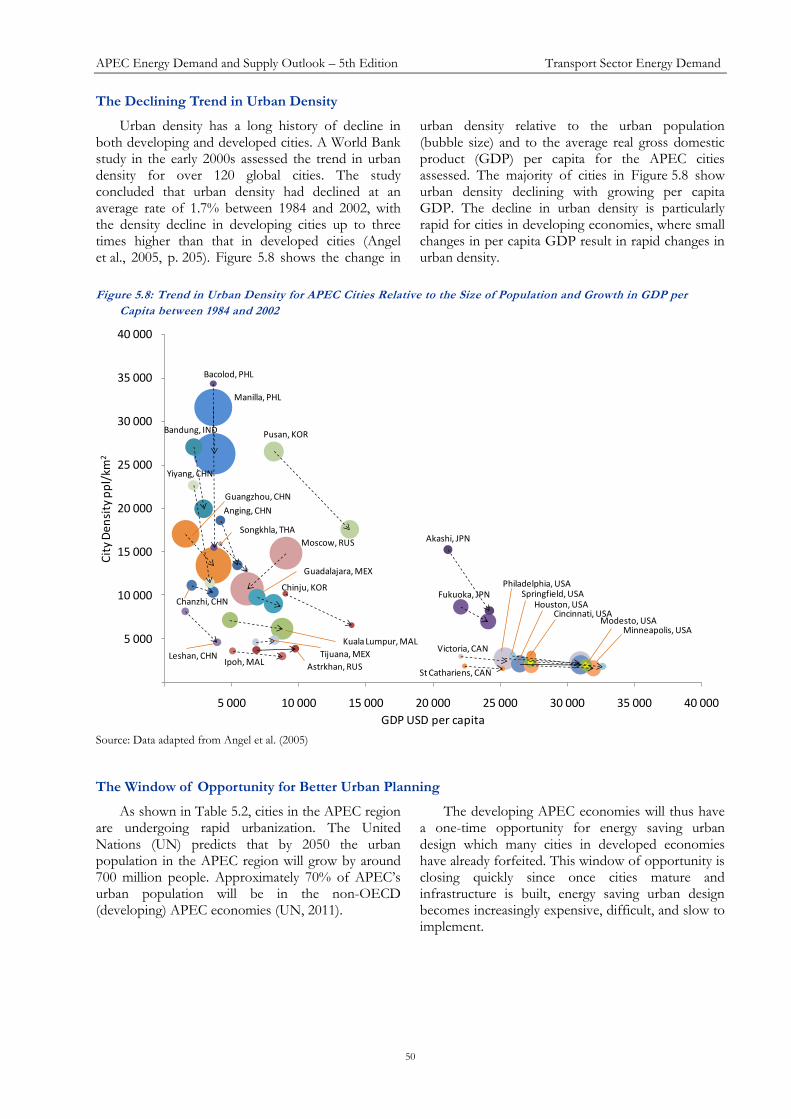
Urban density has a long history of decline in both developing and developed cities. A World Bank study in the early 2000s assessed the trend in urban density for over 120 global cities. The study concluded that urban density had declined at an average rate of 1.7% between 1984 and 2002, with the density decline in developing cities up to three times higher than that in developed cities (Angel et al., 2005, p. 205). Figure 5.8 shows the change in
urban density relative to the urban population (bubble size) and to the average real gross domestic product (GDP) per capita for the APEC cities assessed. The majority of cities in Figure 5.8 show urban density declining with growing per capita GDP. The decline in urban density is particularly rapid for cities in developing economies, where small changes in per capita GDP result in rapid changes in urban density.
Figure 5.8: Trend in Urban Density for APEC Cities Relative to the Size of Population and Growth in GDP per
Capita between 1984 and 2002
Source: Data adapted from Angel et al. (2005)
The Window of Opportunity for Better Urban Planning
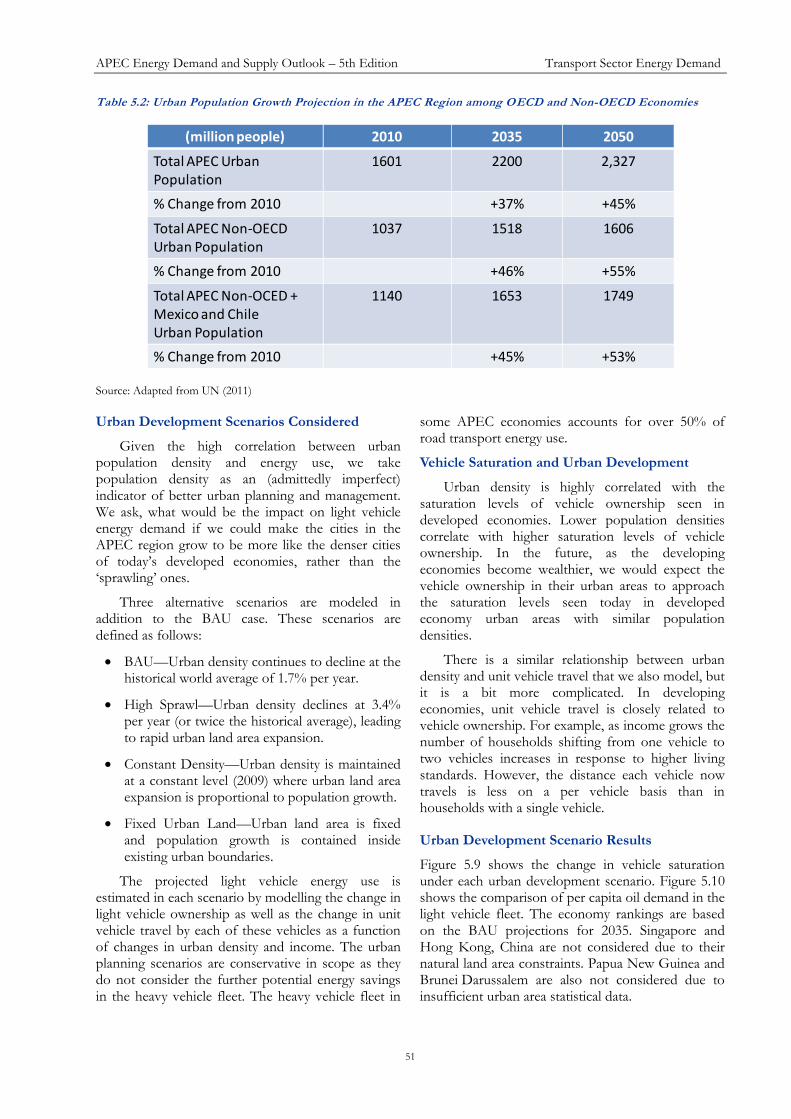
As shown in Table 5.2, cities in the APEC region are undergoing rapid urbanization. The United Nations (UN) predicts that by 2050 the urban population in the APEC region will grow by around 700 million people. Approximately 70% of APEC’s urban population will be in the non-OECD (developing) APEC economies (UN, 2011).
The developing APEC economies will thus have a one-time opportunity for energy saving urban design which many cities in developed economies have already forfeited. This window of opportunity is closing quickly since once cities mature and infrastructure is built, energy saving urban design becomes increasingly expensive, difficult, and slow to implement.
Akashi, JPN
Anging, CHN
Astrkhan, RUS
Bacolod, PHL
Bandung, IND
Chanzhi, CHN
Chinju, KOR
Cincinnati, USA
Fukuoka, JPN
Guadalajara, MEX
Guangzhou, CHN
Houston, USA
Ipoh, MAL
Kuala Lumpur, MAL
Leshan, CHN
Manilla, PHL
Minneapolis, USAModesto, USA
Moscow, RUS
Pusan, KOR
Songkhla, THA
Springfield, USA
St Cathariens, CAN
Tijuana, MEXVictoria, CAN
Yiyang, CHN
Philadelphia, USA
5 000
10 000
15 000
20 000
25 000
30 000
35 000
40 000
5 000 10 000 15 000 20 000 25 000 30 000 35 000 40 000
Cit
y D
ensi
ty p
pl/
km2
GDP USD per capita
APEC Energy Demand and Supply Outlook – 5th Edition Transport Sector Energy Demand
51
Table 5.2: Urban Population Growth Projection in the APEC Region among OECD and Non-OECD Economies
Source: Adapted from UN (2011)
Urban Development Scenarios Considered
Given the high correlation between urban population density and energy use, we take population density as an (admittedly imperfect) indicator of better urban planning and management. We ask, what would be the impact on light vehicle energy demand if we could make the cities in the APEC region grow to be more like the denser cities of today’s developed economies, rather than the ‘sprawling’ ones.
Three alternative scenarios are modeled in addition to the BAU case. These scenarios are defined as follows:
BAU—Urban density continues to decline at the historical world average of 1.7% per year.
High Sprawl—Urban density declines at 3.4% per year (or twice the historical average), leading to rapid urban land area expansion.
Constant Density—Urban density is maintained at a constant level (2009) where urban land area expansion is proportional to population growth.
Fixed Urban Land—Urban land area is fixed and population growth is contained inside existing urban boundaries.
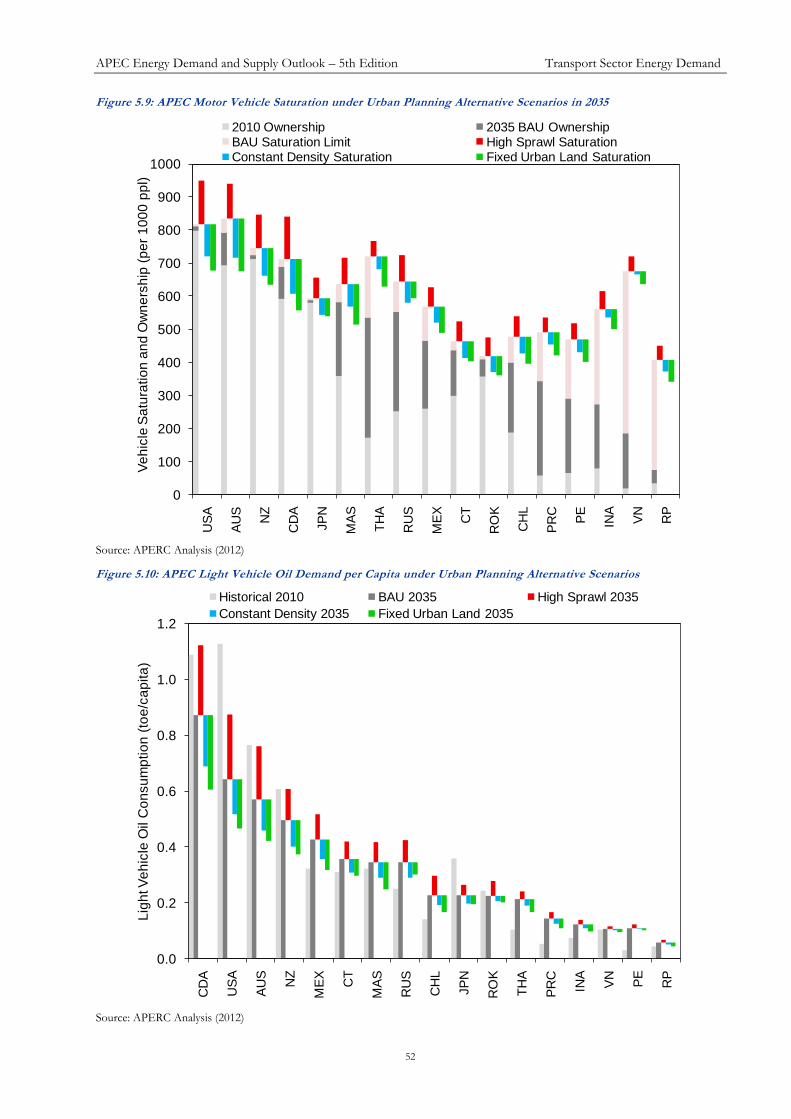
The projected light vehicle energy use is estimated in each scenario by modelling the change in light vehicle ownership as well as the change in unit vehicle travel by each of these vehicles as a function of changes in urban density and income. The urban planning scenarios are conservative in scope as they do not consider the further potential energy savings in the heavy vehicle fleet. The heavy vehicle fleet in
some APEC economies accounts for over 50% of road transport energy use.
Vehicle Saturation and Urban Development
Urban density is highly correlated with the saturation levels of vehicle ownership seen in developed economies. Lower population densities correlate with higher saturation levels of vehicle ownership. In the future, as the developing economies become wealthier, we would expect the vehicle ownership in their urban areas to approach the saturation levels seen today in developed economy urban areas with similar population densities.
There is a similar relationship between urban density and unit vehicle travel that we also model, but it is a bit more complicated. In developing economies, unit vehicle travel is closely related to vehicle ownership. For example, as income grows the number of households shifting from one vehicle to two vehicles increases in response to higher living standards. However, the distance each vehicle now travels is less on a per vehicle basis than in households with a single vehicle.
Urban Development Scenario Results
Figure 5.9 shows the change in vehicle saturation under each urban development scenario. Figure 5.10 shows the comparison of per capita oil demand in the light vehicle fleet. The economy rankings are based on the BAU projections for 2035. Singapore and Hong Kong, China are not considered due to their natural land area constraints. Papua New Guinea and Brunei Darussalem are also not considered due to insufficient urban area statistical data.
(million people) 2010 2035 2050
Total APEC Urban Population
1601 2200 2,327
% Change from 2010 +37% +45%
Total APEC Non-OECD Urban Population
1037 1518 1606
% Change from 2010 +46% +55%
Total APEC Non-OCED +Mexico and ChileUrban Population
1140 1653 1749
% Change from 2010 +45% +53%
APEC Energy Demand and Supply Outlook – 5th Edition Transport Sector Energy Demand
52
Figure 5.9: APEC Motor Vehicle Saturation under Urban Planning Alternative Scenarios in 2035
Source: APERC Analysis (2012)
Figure 5.10: APEC Light Vehicle Oil Demand per Capita under Urban Planning Alternative Scenarios
Source: APERC Analysis (2012)
ABCD AKALAMAN EFGH UVWX ACADAEAFBEBFBGBHAWAXAYAZAGAHAIAJBABBBCBD YZAAAB I JKL MNOP AOAPAQAR QRST BMBNBOBP
0
100
200
300
400
500
600
700
800
900
1000
US
A
AU
S
NZ
CD
A
JP
N
MA
S
TH
A
RU
S
ME
X
CT
RO
K
CH
L
PR
C
PE
INA
VN
RP
Ve
hic
le S
atu
ratio
n a
nd
Ow
ne
rsh
ip (
pe
r 1
00
0 p
pl)
2010 Ownership 2035 BAU OwnershipBAU Saturation Limit High Sprawl SaturationConstant Density Saturation Fixed Urban Land Saturation
ABCDAKALAMANEFGH UVWXACADAEAFBEBFBGBHAWAXAYAZAGAHAIAJBABBBCBDYZAAAB I JKL MNOPAOAPAQARQRSTBMBNBOBP
0.0
0.2
0.4
0.6
0.8
1.0
1.2
CD
A
US
A
AU
S
NZ
ME
X
CT
MA
S
RU
S
CH
L
JP
N
RO
K
TH
A
PR
C
INA
VN
PE
RP
Lig
ht V
eh
icle
Oil C
on
su
mp
tio
n (
toe
/ca
pita
)
Historical 2010 BAU 2035 High Sprawl 2035
Constant Density 2035 Fixed Urban Land 2035
APEC Energy Demand and Supply Outlook – 5th Edition Transport Sector Energy Demand
53
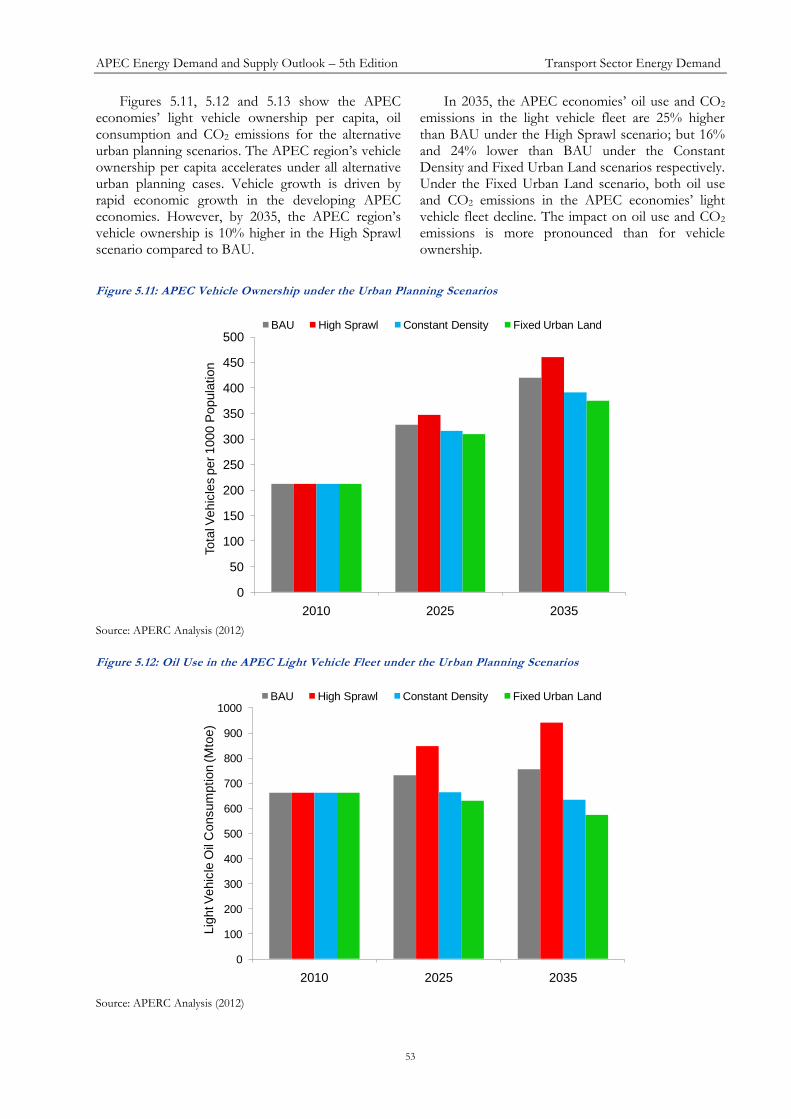
Figures 5.11, 5.12 and 5.13 show the APEC economies’ light vehicle ownership per capita, oil consumption and CO2 emissions for the alternative urban planning scenarios. The APEC region’s vehicle ownership per capita accelerates under all alternative urban planning cases. Vehicle growth is driven by rapid economic growth in the developing APEC economies. However, by 2035, the APEC region’s vehicle ownership is 10% higher in the High Sprawl scenario compared to BAU.
In 2035, the APEC economies’ oil use and CO2 emissions in the light vehicle fleet are 25% higher than BAU under the High Sprawl scenario; but 16% and 24% lower than BAU under the Constant Density and Fixed Urban Land scenarios respectively. Under the Fixed Urban Land scenario, both oil use and CO2 emissions in the APEC economies’ light vehicle fleet decline. The impact on oil use and CO2 emissions is more pronounced than for vehicle ownership.
Figure 5.11: APEC Vehicle Ownership under the Urban Planning Scenarios
Source: APERC Analysis (2012)
Figure 5.12: Oil Use in the APEC Light Vehicle Fleet under the Urban Planning Scenarios
Source: APERC Analysis (2012)
0
50
100
150
200
250
300
350
400
450
500
2010 2025 2035
Tota
l Vehic
les p
er 1000 P
opula
tion
BAU High Sprawl Constant Density Fixed Urban Land
0
100
200
300
400
500
600
700
800
900
1000
2010 2025 2035
Lig
ht V
ehic
le O
il C
onsum
ption (M
toe)
BAU High Sprawl Constant Density Fixed Urban Land
APEC Energy Demand and Supply Outlook – 5th Edition Transport Sector Energy Demand
54
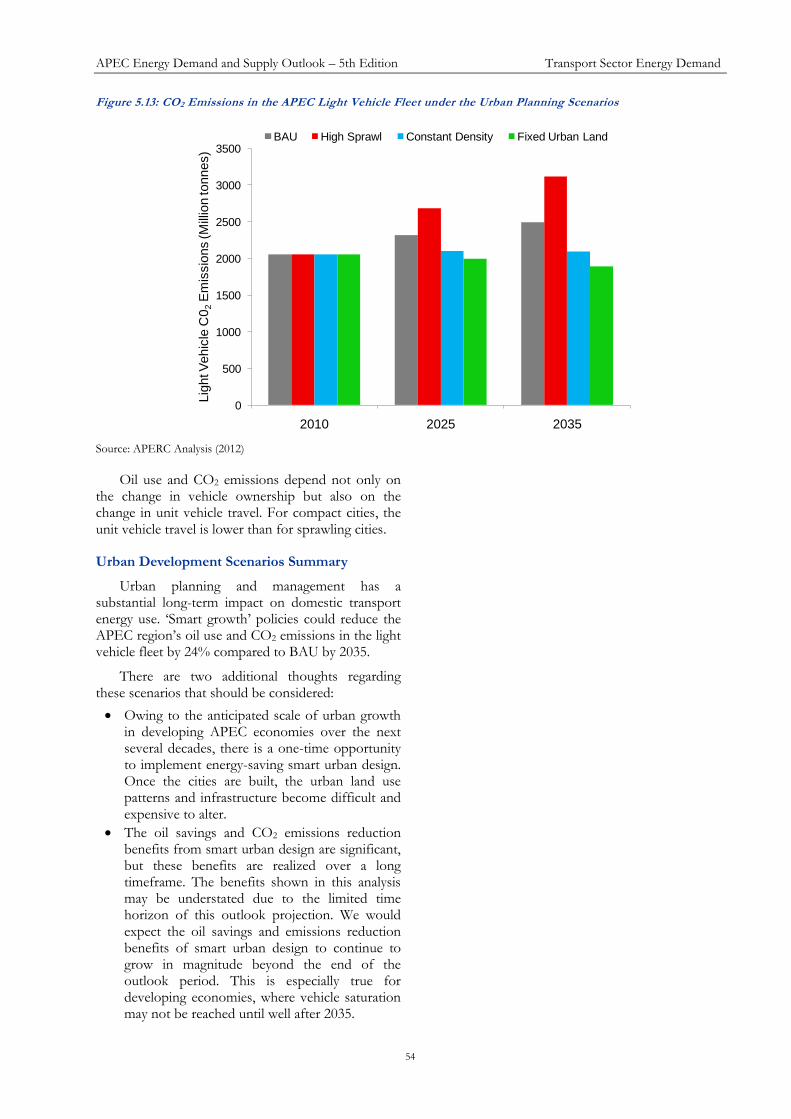
Figure 5.13: CO2 Emissions in the APEC Light Vehicle Fleet under the Urban Planning Scenarios
Source: APERC Analysis (2012)
Oil use and CO2 emissions depend not only on the change in vehicle ownership but also on the change in unit vehicle travel. For compact cities, the unit vehicle travel is lower than for sprawling cities.
Urban Development Scenarios Summary
Urban planning and management has a substantial long-term impact on domestic transport energy use. ‘Smart growth’ policies could reduce the APEC region’s oil use and CO2 emissions in the light vehicle fleet by 24% compared to BAU by 2035.
There are two additional thoughts regarding these scenarios that should be considered:
Owing to the anticipated scale of urban growth in developing APEC economies over the next several decades, there is a one-time opportunity to implement energy-saving smart urban design. Once the cities are built, the urban land use patterns and infrastructure become difficult and expensive to alter.
The oil savings and CO2 emissions reduction benefits from smart urban design are significant, but these benefits are realized over a long timeframe. The benefits shown in this analysis may be understated due to the limited time horizon of this outlook projection. We would expect the oil savings and emissions reduction benefits of smart urban design to continue to grow in magnitude beyond the end of the outlook period. This is especially true for developing economies, where vehicle saturation may not be reached until well after 2035.
0
500
1000
1500
2000
2500
3000
3500
2010 2025 2035
Lig
ht V
ehic
le C
02
Em
issio
ns (M
illio
n tonnes)
BAU High Sprawl Constant Density Fixed Urban Land
APEC Energy Demand and Supply Outlook – 5th Edition Transport Sector Energy Demand
55
THE VIRTUAL CLEAN CAR RACE SCENARIOS
APEC economies are promoting alternative vehicle technologies and alternative fuels as a means of reducing oil consumption, improving energy efficiency and promoting low-carbon transport (APEC, 2011). The potential for oil savings from the adoption of alternative vehicles is apparent. The impact on CO2 emissions is less obvious since the emissions from fuel production for specific alternative fuels, such as hydrogen and electricity, must be considered. Therefore, the difference in emissions intensity between vehicle technologies depends on both the efficiency of the vehicle itself (the energy use per km) and the carbon intensity of its fuel (carbon content per energy unit).
Four scenarios are modelled in this analysis to assess the relative merits of four types of alternative vehicles in reducing oil use and CO2 emissions in each APEC economy. Since these four scenarios simulate a competition between these four vehicle types, we denote these scenarios as the ‘Virtual Clean Car Race’.
In each of the four scenarios, we assume sales of new alternative vehicles increase incrementally from BAU, starting in 2013, and rise to a market share 50 percentage points above BAU by 2020 and thereafter. For example, if the market share of natural gas vehicles is 5% of new vehicle sales in 2020 in the BAU scenario, the share of natural gas vehicles would be 55% of new vehicle sales in 2020 in the Natural Gas Vehicle Transition scenario.
The market share of new conventional vehicles in each scenario would be correspondingly reduced. To continue the example, if the market share of conventional vehicles is 90% of new vehicle sales in 2020 in the BAU case, it would be 40% of new vehicle sales in 2020 in the Natural Gas Vehicle Transition scenario. At the same time, the share of alternative vehicles other than natural gas vehicles remains the same in the Natural Gas Vehicle Transition scenario as it was in the BAU scenario. Note that, while the market share of the alternative vehicles in new vehicle sales levels-off at its maximum value by 2020, the actual number of alternative vehicles in the fleet does not level-off until some years later, reflecting the time required for all vehicles in the fleet in 2020 to be replaced.
These assumptions are not intended to be realistic depictions of how alternative vehicle technology might enter the marketplace. Given that it will take many years to implement new vehicle designs and fuelling infrastructures, the assumptions are probably quite unrealistic. However, the assumptions do have two advantages in an exercise
designed to compare the merits of the vehicle technologies. First, the number of additional alternative vehicles in each year is always the same in all four cases, allowing an apples-to-apples comparison. Second, the planned transition to at least 50% alternative vehicles in the vehicle fleet can be almost entirely completed by 2035, the final year of this outlook period.
The scenarios to be examined are defined as follows:
Hyper Car Transition scenario
Electric Vehicle Transition scenario—this case assumes pure battery electric vehicles
Hydrogen Vehicle Transition scenario
Natural Gas Vehicle Transition scenario.
For each of the alternative vehicle types, we have modelled energy consumption and emissions based on published studies. As mentioned earlier, Lovins et al. (2005) report an energy savings potential for the hyper car of between 50–66%. Kromer and Heywood (2007) report that pure electric and hydrogen vehicles have a relative energy use compared to conventional vehicles of about 20% and 30% respectively, that is they consume 80% and 70% less energy. Finally, Semin (2008) reports that natural gas vehicles typically offer energy savings of 10% compared to conventional vehicles.
For the calculation of CO2 emissions we must also consider the assumptions regarding how the hydrogen and electricity are produced. These are discussed below.
Hydrogen Production Pathways
Hydrogen, like electricity, is an energy carrier not a primary energy source. Therefore hydrogen must be produced from a primary energy resource, either fossil fuel, renewable, or nuclear. There are many possible production paths for hydrogen. Three of these processes are generally regarded as being scalable. These technologies are steam methane reforming or SMR (using natural gas), gasification (using coal or biomass) and electrolysis of water (using electricity).
A major potential advantage of hydrogen (and electric) vehicles is the potential for using a low-carbon primary energy source (renewable, nuclear, or fossil fuel with carbon capture and storage) to produce the hydrogen or electricity. We could have assumed the use of a low-carbon primary energy source for our Hydrogen Vehicle Transition and Electric Vehicle Transition scenarios, in which case these vehicles would have looked very good in terms of CO2 emissions. However, this assumption would
APEC Energy Demand and Supply Outlook – 5th Edition Transport Sector Energy Demand
56
have required us to assume that enough new low-carbon hydrogen or electricity generation capacity is built to meet the energy needs of the hydrogen and electric vehicles. In this case, we would be counting the benefits of this additional low-carbon generation as a benefit of hydrogen or electric vehicles. This did not seem appropriate, especially since you could get the same emission reductions by simply building more low-carbon electricity generation capacity without using any hydrogen or electric vehicles at all.
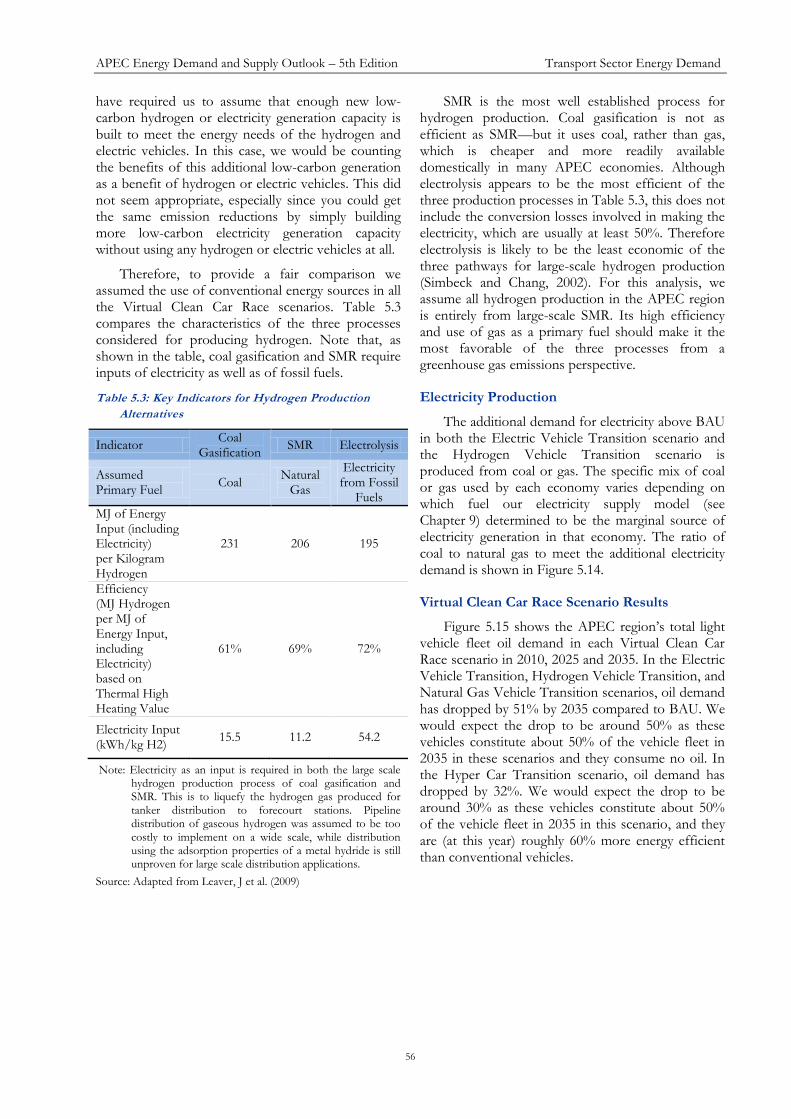
Therefore, to provide a fair comparison we assumed the use of conventional energy sources in all the Virtual Clean Car Race scenarios. Table 5.3 compares the characteristics of the three processes considered for producing hydrogen. Note that, as shown in the table, coal gasification and SMR require inputs of electricity as well as of fossil fuels.
Table 5.3: Key Indicators for Hydrogen Production
Alternatives
Indicator Coal
Gasification SMR Electrolysis
Assumed Primary Fuel
Coal Natural
Gas
Electricity from Fossil
Fuels
MJ of Energy Input (including Electricity) per Kilogram Hydrogen
231 206 195
Efficiency (MJ Hydrogen per MJ of Energy Input, including Electricity) based on Thermal High Heating Value
61% 69% 72%
Electricity Input (kWh/kg H2)
15.5 11.2 54.2
Note: Electricity as an input is required in both the large scale hydrogen production process of coal gasification and SMR. This is to liquefy the hydrogen gas produced for tanker distribution to forecourt stations. Pipeline distribution of gaseous hydrogen was assumed to be too costly to implement on a wide scale, while distribution using the adsorption properties of a metal hydride is still unproven for large scale distribution applications.
Source: Adapted from Leaver, J et al. (2009)
SMR is the most well established process for hydrogen production. Coal gasification is not as efficient as SMR—but it uses coal, rather than gas, which is cheaper and more readily available domestically in many APEC economies. Although electrolysis appears to be the most efficient of the three production processes in Table 5.3, this does not include the conversion losses involved in making the electricity, which are usually at least 50%. Therefore electrolysis is likely to be the least economic of the three pathways for large-scale hydrogen production (Simbeck and Chang, 2002). For this analysis, we assume all hydrogen production in the APEC region is entirely from large-scale SMR. Its high efficiency and use of gas as a primary fuel should make it the most favorable of the three processes from a greenhouse gas emissions perspective.
Electricity Production
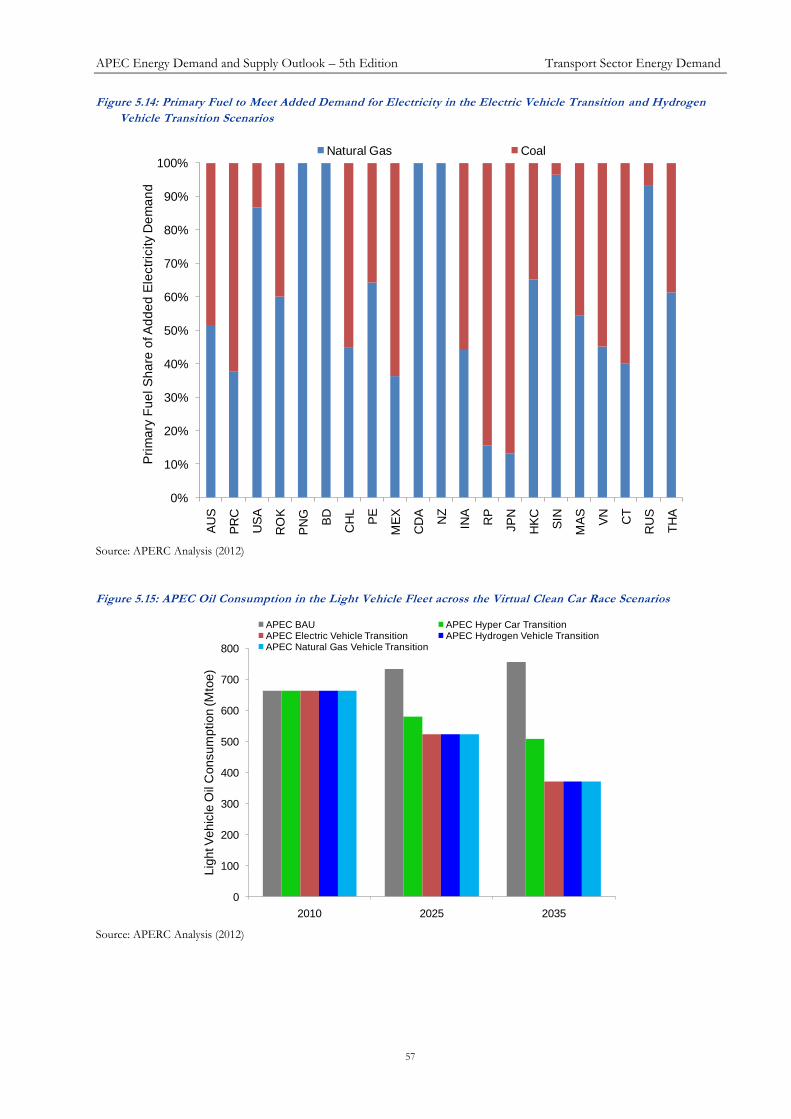
The additional demand for electricity above BAU in both the Electric Vehicle Transition scenario and the Hydrogen Vehicle Transition scenario is produced from coal or gas. The specific mix of coal or gas used by each economy varies depending on which fuel our electricity supply model (see Chapter 9) determined to be the marginal source of electricity generation in that economy. The ratio of coal to natural gas to meet the additional electricity demand is shown in Figure 5.14.
Virtual Clean Car Race Scenario Results
Figure 5.15 shows the APEC region’s total light vehicle fleet oil demand in each Virtual Clean Car Race scenario in 2010, 2025 and 2035. In the Electric Vehicle Transition, Hydrogen Vehicle Transition, and Natural Gas Vehicle Transition scenarios, oil demand has dropped by 51% by 2035 compared to BAU. We would expect the drop to be around 50% as these vehicles constitute about 50% of the vehicle fleet in 2035 in these scenarios and they consume no oil. In the Hyper Car Transition scenario, oil demand has dropped by 32%. We would expect the drop to be around 30% as these vehicles constitute about 50% of the vehicle fleet in 2035 in this scenario, and they are (at this year) roughly 60% more energy efficient than conventional vehicles.
APEC Energy Demand and Supply Outlook – 5th Edition Transport Sector Energy Demand
57
Figure 5.14: Primary Fuel to Meet Added Demand for Electricity in the Electric Vehicle Transition and Hydrogen
Vehicle Transition Scenarios
Source: APERC Analysis (2012)
Figure 5.15: APEC Oil Consumption in the Light Vehicle Fleet across the Virtual Clean Car Race Scenarios
Source: APERC Analysis (2012)
0%
10%
20%
30%
40%
50%
60%
70%
80%
90%
100%
AU
S
PR
C
US
A
RO
K
PN
G
BD
CH
L
PE
ME
X
CD
A
NZ
INA
RP
JP
N
HK
C
SIN
MA
S
VN
CT
RU
S
TH
A
Pri
ma
ry F
ue
l S
ha
re o
f A
dd
ed
Ele
ctr
icity D
em
an
dNatural Gas Coal
0
100
200
300
400
500
600
700
800
2010 2025 2035
Lig
ht V
eh
icle
Oil
Co
nsu
mp
tio
n (M
toe
)
APEC BAU APEC Hyper Car TransitionAPEC Electric Vehicle Transition APEC Hydrogen Vehicle TransitionAPEC Natural Gas Vehicle Transition
APEC Energy Demand and Supply Outlook – 5th Edition Transport Sector Energy Demand
58
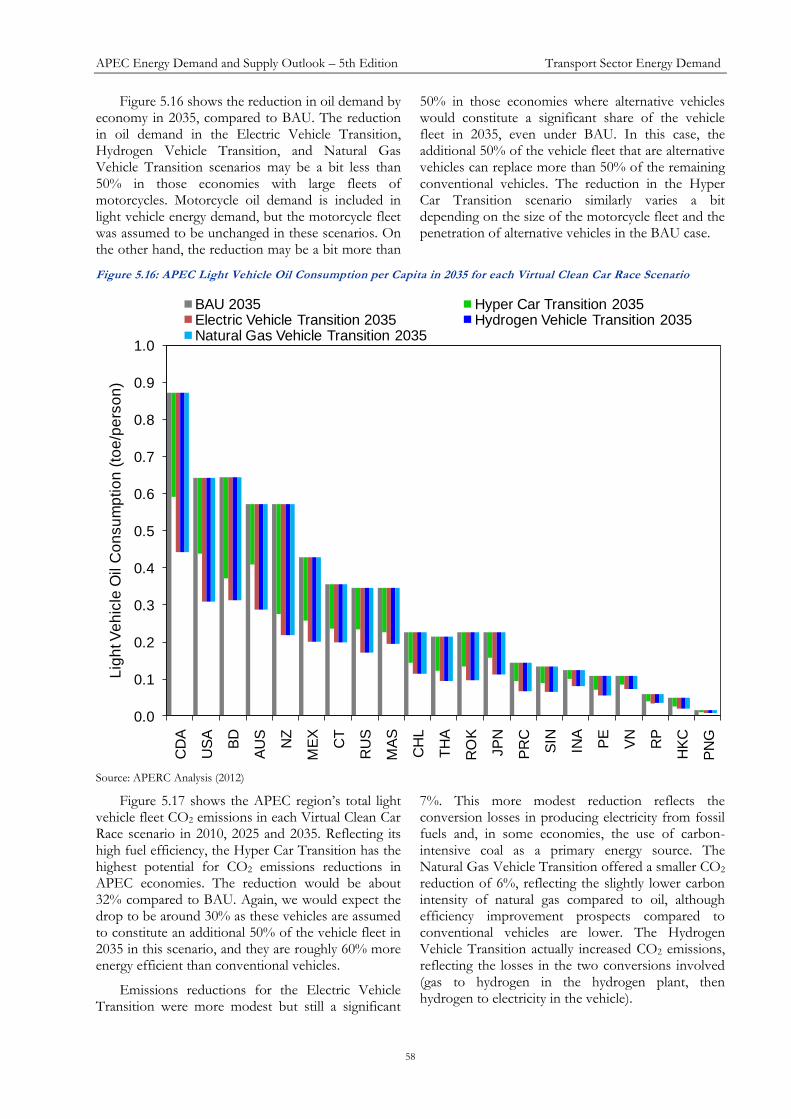
Figure 5.16 shows the reduction in oil demand by economy in 2035, compared to BAU. The reduction in oil demand in the Electric Vehicle Transition, Hydrogen Vehicle Transition, and Natural Gas Vehicle Transition scenarios may be a bit less than 50% in those economies with large fleets of motorcycles. Motorcycle oil demand is included in light vehicle energy demand, but the motorcycle fleet was assumed to be unchanged in these scenarios. On the other hand, the reduction may be a bit more than
50% in those economies where alternative vehicles would constitute a significant share of the vehicle fleet in 2035, even under BAU. In this case, the additional 50% of the vehicle fleet that are alternative vehicles can replace more than 50% of the remaining conventional vehicles. The reduction in the Hyper Car Transition scenario similarly varies a bit depending on the size of the motorcycle fleet and the penetration of alternative vehicles in the BAU case.
Figure 5.16: APEC Light Vehicle Oil Consumption per Capita in 2035 for each Virtual Clean Car Race Scenario
Source: APERC Analysis (2012)
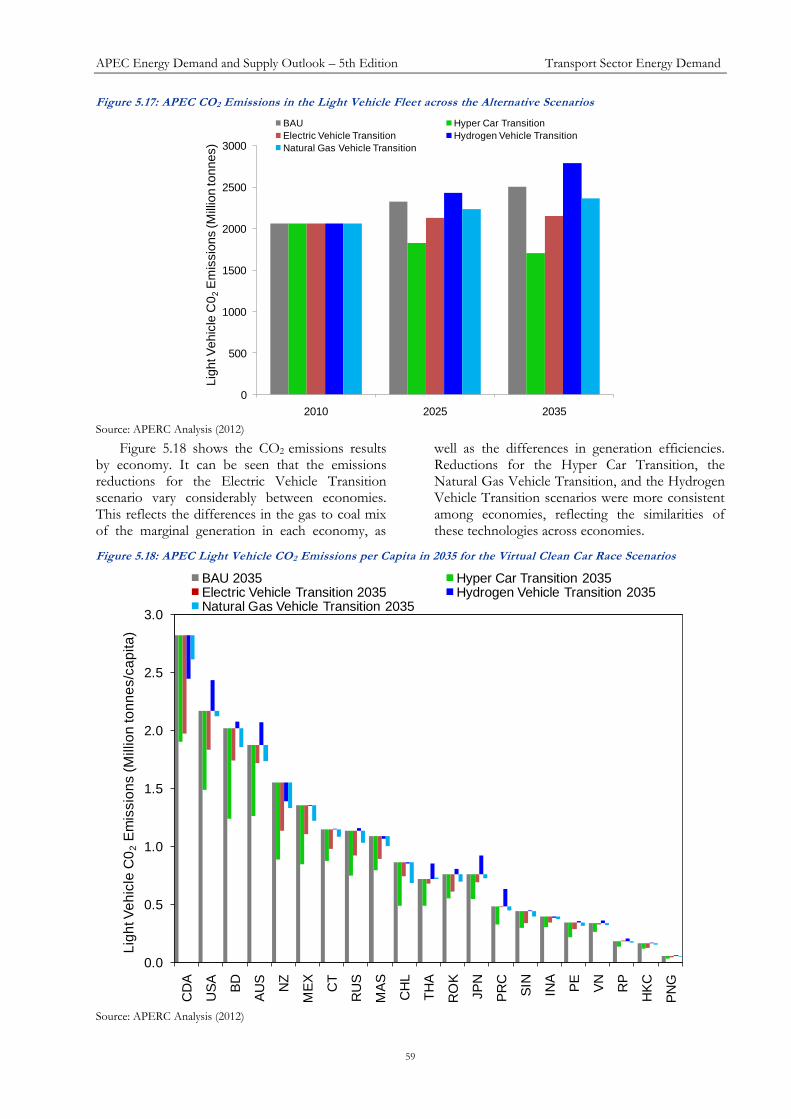
Figure 5.17 shows the APEC region’s total light vehicle fleet CO2 emissions in each Virtual Clean Car Race scenario in 2010, 2025 and 2035. Reflecting its high fuel efficiency, the Hyper Car Transition has the highest potential for CO2 emissions reductions in APEC economies. The reduction would be about 32% compared to BAU. Again, we would expect the drop to be around 30% as these vehicles are assumed to constitute an additional 50% of the vehicle fleet in 2035 in this scenario, and they are roughly 60% more energy efficient than conventional vehicles.
Emissions reductions for the Electric Vehicle Transition were more modest but still a significant
7%. This more modest reduction reflects the conversion losses in producing electricity from fossil fuels and, in some economies, the use of carbon-intensive coal as a primary energy source. The Natural Gas Vehicle Transition offered a smaller CO2 reduction of 6%, reflecting the slightly lower carbon intensity of natural gas compared to oil, although efficiency improvement prospects compared to conventional vehicles are lower. The Hydrogen Vehicle Transition actually increased CO2 emissions, reflecting the losses in the two conversions involved (gas to hydrogen in the hydrogen plant, then hydrogen to electricity in the vehicle).
BIBJBKBLABCDAKALAMANEFGH UVWXACADAEAFBEBFBGBHAWAXAYAZAGAHAIAJBABBBCBDYZAAABIJKL MNOPAOAPAQARQRSTBMBNBOBPASATAUAV
0.0
0.1
0.2
0.3
0.4
0.5
0.6
0.7
0.8
0.9
1.0
CD
A
US
A
BD
AU
S
NZ
ME
X
CT
RU
S
MA
S
CH
L
TH
A
RO
K
JP
N
PR
C
SIN
INA
PE
VN
RP
HK
C
PN
G
Lig
ht V
eh
icle
Oil C
on
su
mp
tio
n (
toe
/pe
rso
n)
BAU 2035 Hyper Car Transition 2035Electric Vehicle Transition 2035 Hydrogen Vehicle Transition 2035Natural Gas Vehicle Transition 2035
APEC Energy Demand and Supply Outlook – 5th Edition Transport Sector Energy Demand
59
Figure 5.17: APEC CO2 Emissions in the Light Vehicle Fleet across the Alternative Scenarios
Source: APERC Analysis (2012)
Figure 5.18 shows the CO2 emissions results by economy. It can be seen that the emissions reductions for the Electric Vehicle Transition scenario vary considerably between economies. This reflects the differences in the gas to coal mix of the marginal generation in each economy, as
well as the differences in generation efficiencies. Reductions for the Hyper Car Transition, the Natural Gas Vehicle Transition, and the Hydrogen Vehicle Transition scenarios were more consistent among economies, reflecting the similarities of these technologies across economies.
Figure 5.18: APEC Light Vehicle CO2 Emissions per Capita in 2035 for the Virtual Clean Car Race Scenarios
Source: APERC Analysis (2012)
0
500
1000
1500
2000
2500
3000
2010 2025 2035
Lig
ht V
ehic
le C
02
Em
issio
ns (M
illio
n tonnes)
BAU Hyper Car Transition
Electric Vehicle Transition Hydrogen Vehicle Transition
Natural Gas Vehicle Transition
BIBJBKBLABCDAKALAMANEFGH UVWXACADAEAFBEBFBGBHAWAXAYAZAGAHAIAJBABBBCBDYZAAABIJKL MNOPAOAPAQARQRSTBMBNBOBPASATAUAV
0.0
0.5
1.0
1.5
2.0
2.5
3.0
CD
A
US
A
BD
AU
S
NZ
ME
X
CT
RU
S
MA
S
CH
L
TH
A
RO
K
JP
N
PR
C
SIN
INA
PE
VN
RP
HK
C
PN
G
Lig
ht V
eh
icle
C0
2E
mis
sio
ns (
Millio
n to
nn
es/c
ap
ita
)
BAU 2035 Hyper Car Transition 2035Electric Vehicle Transition 2035 Hydrogen Vehicle Transition 2035Natural Gas Vehicle Transition 2035
APEC Energy Demand and Supply Outlook – 5th Edition Transport Sector Energy Demand
60
Virtual Clean Car Race Scenarios Summary
This analysis shows the way to energy security and low-carbon emissions is not easily achieved through the pursuit of alternative vehicles. All pathways require some compromises between the twin goals of reducing oil dependence and reducing greenhouse gas emissions.
Hydrogen vehicles offer the obvious benefit of energy diversification away from oil. However, the production of hydrogen from gas using SMR would result in a Hydrogen Vehicle Transition scenario that increases the CO2 emissions in the light vehicle fleet by an average of 15% in the APEC economies. The CO2 emissions would be significantly higher if coal gasification were used for the production of hydrogen.
Electric vehicles also offer energy diversification away from oil. They are, on average, less carbon intensive than conventional vehicles, but not by a large amount. An Electric Vehicle Transition scenario could reduce the carbon emissions of the light vehicle fleet by an average of 7% in the APEC economies. However, the CO2 intensity of electric vehicles varies widely by economy and may exceed that of conventional vehicles for economies strongly dependent on coal for electricity generation. Although battery technology is improving, electric vehicles are still at a disadvantage to conventional vehicles, and even hydrogen vehicles, in terms of their driving range, refuelling times, and initial cost (refer to Figure 5.6).
Another alternative to oil-fuelled conventional vehicles is natural gas. Natural gas vehicles traditionally offer greater energy efficiency than conventional vehicles as a result of the high octane content of the fuel enabling more efficient combustion (Semin, 2008). Owing to their higher combustion efficiency, natural gas vehicles offer about a 10% improvement in energy efficiency compared to a conventional gasoline vehicle (Semin, 2008). However, it is expected the energy efficiency of conventional vehicles in the future will match or exceed that of natural gas vehicles with the diffusion of hybrid electric drive, clean diesel, and lighter weight body technologies. Still, we find a Natural Gas Vehicle Transition scenario could offer a small reduction in the APEC region’s light vehicle fleet CO2 emissions of around 6% by 2035.
The best all-around option for reducing both oil dependence and CO2 emissions would appear to be hyper cars. On an APEC-wide basis, a Hyper Car Transition scenario could reduce light vehicle fleet oil use and corresponding CO2 emissions by 32% compared to BAU in 2035. A Hyper Car Transition
scenario would be relatively easy to achieve compared to the other alternative vehicles. It would require no change in fuelling infrastructure and the vehicles would have a driving range and performance characteristics similar to conventional vehicles.
The results of the Virtual Clean Car Race scenarios indicate that dealing with the twin challenges of energy security and climate change may require looking beyond the options examined here. Three suggestions worth considering are as follows:
1) The hyper car concept could be combined with alternative energy sources. For example, an electric hyper car would use no oil and require considerably less electricity than a conventional electric car. Because of the lower electricity requirements, it would have lower CO2 emissions than a conventional electric car. Since the electric hyper car would need smaller batteries for any given driving range than a conventional car, it could probably be produced more cheaply.
2) A major potential advantage of electric and hydrogen vehicles is that they could ultimately be powered by primary energy from low-carbon sources. This would allow both a move away from oil and significant reductions in CO2 emissions. But this conversion should probably be done in the context of a conversion of all electricity generation to low-carbon sources, since it would make no sense for the vehicle fleet to have its own dedicated source of low-carbon electricity while the rest of the economy continued to run on conventionally-generated electricity.
3) Meeting the twin challenges of energy security and climate change in the transport sector is a problem that will require multiple solutions. Vehicle technology changes alone will probably not be sufficient. As discussed at the beginning of this chapter, solutions include ‘Avoid’, ‘Shift’, and ‘Improve’. The APEC economies would be best served by pursuing all three of these options.
Suggestion #1 implies that electric or hydrogen propulsion, in combination with the hyper car concept, offers a further medium-term opportunity to dramatically reduce oil demand in transportation. Suggestion #2 implies that electric and hydrogen propulsion offers a long-term path to truly low-carbon vehicles. For these reasons, research on electric and hydrogen vehicle technologies continues to merit the support of policymakers.
APEC Energy Demand and Supply Outlook – 5th Edition Transport Sector Energy Demand
61
APERC’S TRANSPORT SECTOR ENERGY DEMAND MODEL AND HOW IT WORKS
The transport sector is modelled as five separate sub-sectors in each APEC economy:
1. Road vehicle fleet—further divided into the light and heavy vehicle fleets
2. Aviation—domestic and international
3. Shipping—domestic and international
4. Rail
5. Pipeline.
The road sub-sector has been the major focus of APERC’s transport modelling effort, as in most APEC economies it constitutes the largest source of transport energy demand by far.
Energy use in the road sub-sector is modelled as:
Number of Vehicles x Number of Kilometres per Vehicle
x Energy Consumption per Kilometre.
This calculation is performed separately for the light vehicle fleet and the heavy vehicle fleet. Within the light vehicle fleet, it is also performed separately for each of seven vehicle technologies (both conventional and alternative vehicles).
APERC’s road vehicle model represents the turnover of the vehicle fleet (purchases and retirements) each year for each vehicle type for each APEC economy. It thus allows the calculation of the number of vehicles of each technology on the road in each economy in each year. The market share for each vehicle technology among newly purchased vehicles each year depends on the merit of that vehicle technology to consumers. Using research detailed in Leaver and Leaver (2011), the calculation of use to the consumer takes into account:
Upfront capital expenditure
Annual fuel cost
Vehicle range limitation
Refuelling infrastructure availability.
The total number of light vehicles in each economy approaches a saturation level as the GDP per capita rises. But for economies whose GDP per capita is still relatively low, vehicle ownership will be well below the saturation level. APERC’s estimate of the saturation level in each economy is a function of the urban population density of major cities (higher population densities imply lower saturation vehicle ownership) as well as the urban population numbers.
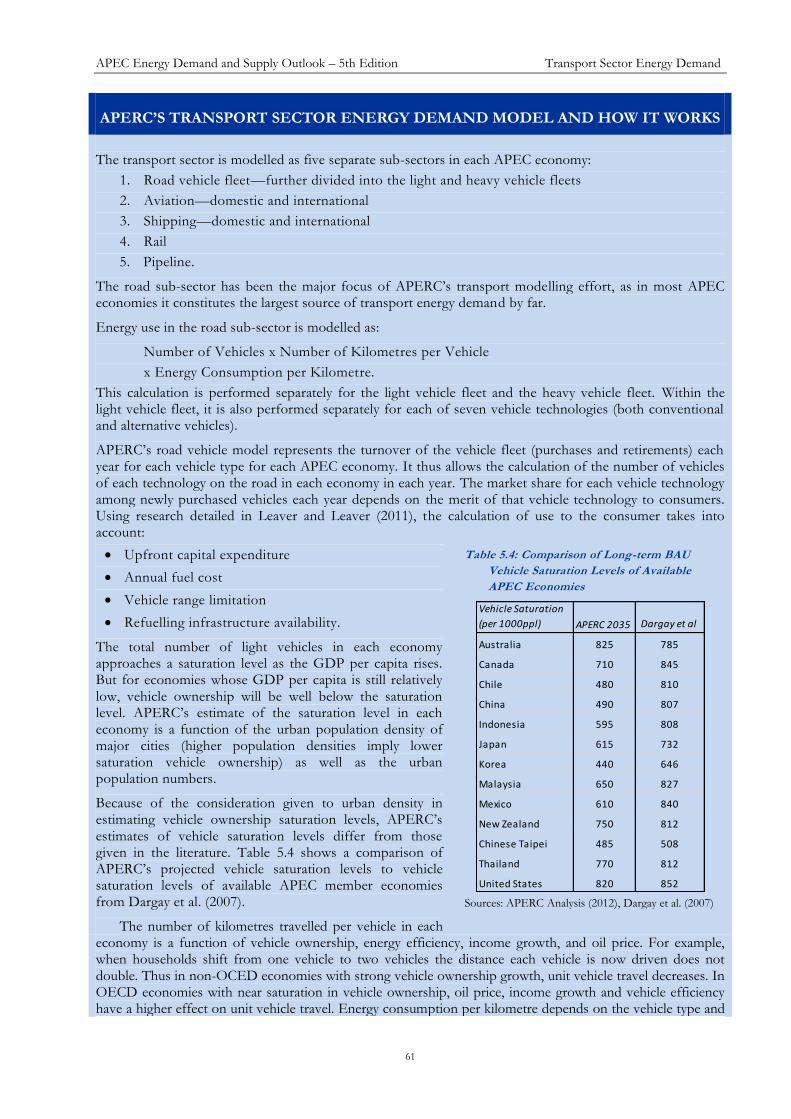
Because of the consideration given to urban density in estimating vehicle ownership saturation levels, APERC’s estimates of vehicle saturation levels differ from those given in the literature. Table 5.4 shows a comparison of APERC’s projected vehicle saturation levels to vehicle saturation levels of available APEC member economies from Dargay et al. (2007).
The number of kilometres travelled per vehicle in each economy is a function of vehicle ownership, energy efficiency, income growth, and oil price. For example, when households shift from one vehicle to two vehicles the distance each vehicle is now driven does not double. Thus in non-OCED economies with strong vehicle ownership growth, unit vehicle travel decreases. In OECD economies with near saturation in vehicle ownership, oil price, income growth and vehicle efficiency have a higher effect on unit vehicle travel. Energy consumption per kilometre depends on the vehicle type and
Table 5.4: Comparison of Long-term BAU
Vehicle Saturation Levels of Available
APEC Economies
Sources: APERC Analysis (2012), Dargay et al. (2007)
Vehicle Saturation
(per 1000ppl) APERC 2035 Dargay et al
Australia 825 785
Canada 710 845
Chile 480 810
China 490 807
Indonesia 595 808
Japan 615 732
Korea 440 646
Malaysia 650 827
Mexico 610 840
New Zealand 750 812
Chinese Taipei 485 508
Thailand 770 812
United States 820 852

APEC Energy Demand and Supply Outlook – 5th Edition Transport Sector Energy Demand
62
the year of manufacture. Estimates of energy consumption per kilometre by vehicle type, along with projected energy efficiency improvement trends, are drawn from the literature.
The non-road transport sectors employ a much simpler top-down approach, strongly tied to the changes in either GDP or GDP per capita. However, for the aviation and shipping models the demand response is also a function of the oil price. In addition, further consideration is given to possible modal shifts between road, rail, aviation and shipping based on expected infrastructure investment. APERC makes this assessment on a case by case basis for each APEC economy.
This section is a short summary of the APERC transport model. Further details of the mathematical derivation including case studies are given in Leaver, L et al. (2012).
APEC Energy Demand and Supply Outlook – 5th Edition Transport Sector Energy Demand
63
REFERENCES
Angel, S., Sheppard, S.C. and Civco, D. (2005), The Dynamics of Global Urban Expansion, The World Bank Transportation and Urban Development Department, Washington DC, USA.
APEC (Asia–Pacific Economic Cooperation) (2011), 7th APEC Transportation Ministerial Meeting – Joint Statement, www.apec.org/Meeting-Papers/Ministerial-Statements/Transportation/2011_transport.aspx
Bandivadekar, A., Bodek, K., Cheah, L., Evans, C., Groode, T., Heywood, J., Kasseris, E., Kromer, M. and Weiss, M. (2008), On the Road in 2035: Reducing Transportation’s Petroleum Consumption and GHG Emissions, Report No. LFEE 2008-05 RP, MIT Laboratory for Energy and the Environment, Cambridge, Massachusetts.
Cheah, L. and Heywood, J. (2011), “Meeting U.S. passenger vehicle fuel economy standards in 2016 and beyond”, Energy Policy, Volume 39 Issue 1, January 2011, pp. 454–466.
Dargay, J., Gately, D. and Sommer, M. (2007), “Vehicle Ownership and Income Growth, Worldwide: 1960–2030”, The Energy Journal, 28(4), pp 143–170.
Ewing, R., Bartholomew, K., Winkelman, S., Walters, J. and Chen, D. (2008), Growing Cooler: The Evidence on Urban Development and Climate Change, The Urban Land Institute, Washington DC, USA.
Hidrue, M., Parsons, G., Kempton, W. and Gardner, M. (2011), “Willingness to pay for electric vehicles and their attributes”, Resource and Energy Economics, Volume 33 Issue 3, September 2011, pp 686–705.
Kromer, M. and Heywood, J. (2007), Electric Powertrains: Opportunities and Challenges in the U.S. Light-Duty Vehicle Fleet, Publication No. LFEE 2007-03 RP, MIT Laboratory for Energy and the Environment, Cambridge, Massachusetts.
Leaver, J., Gillingham, K. and Leaver, L. (2009), “Assessment of primary impacts of a hydrogen economy in New Zealand using UniSyD”, International Journal of Hydrogen Energy, Volume 34 Issue 7, April 2009, pp 2855–2865.
Leaver, J. and Leaver, L. (2011), Potential impact of consumer behaviour and carbon price on national energy policy in New Zealand, Energy, Utility and Environment Conference Journal (Online), www.euec.com/euecjournal.aspx
Leaver, L., Samuelson, R. and Leaver, J. (2012), Potential for low transport energy use in developing Asian cities through compact urban development, paper presented at the 3rd Asian International Association for Energy Economics Conference, Kyoto, http://eneken.ieej.or.jp/3rd_IAEE_Asia/pdf/paper/036p.pdf
Lovins, A., Datta, E. K., Bustnes, O-E., Koomey, J. and Glasgow, N. (2005), Winning the oil endgame: innovation for profits, jobs and security, Rocky Mountain Institute.
RITA|BTS (Research and Innovative Technology Administration|Bureau of Transportation Statistics) (2011), National Transportation Statistics, Table 4-9: Motor Vehicle Fuel Consumption and Travel and Table 4-23: Average Fuel Efficiency of U.S. Light Duty Vehicles, www.bts.gov/publications/national_transportation_statistics/
Semin, R. (2008), “A Technical Review of Compressed Natural Gas as an Alternative Fuel for Internal Combustion Engines”, American Journal of Engineering and Applied Sciences, 1(4), pp 302–311.
Simbeck, R. and Chang, E. (2002), Hydrogen Supply: Cost Estimate for Hydrogen Pathways – Scoping Analysis, Mountain View, CA: SFA Pacific, Inc.
Train, K. (1986), Qualitative Choice Analysis: Theory, Econometrics, and an Application to Automobile Demand, The MIT Press, Cambridge, MA, USA.
UITP/ISTP (International Association of Public Transport, Brussels, and Institute for Sustainability and Technology Policy) (1995), Millennium Cities Database.
UN (United Nations) (2011), World Urbanization Prospects: The 2011 Revision, Department of Economic and Social Affairs, Population Division, http://esa.un.org/unpd/wup/CD-ROM/Urban-Rural-Population.htm