Embed Size (px)
Citation preview

Cloud Adoption Trends
� Spending on public cloud Infrastructure as a Service hardware and software is forecast to reach $173B in 2026
� SaaS and PaaS portion of cloud hardware and infrastructure software spending are projected to reach $55B in 2026
2

Agenda
� Understanding Cloud
� What is Cloud Computing
� Cloud Deployment Models� Public vs Private, Hybrid?
� Cloud Service Models� IaaS/PaaS/SaaS
� Problem Statement
� Obscurity of Cloud
� Solution
� Understanding APM
� Considerations for Cloud Applications
� Making the right APM choice
� APM for XaaS
� Synthetic Vs Real User Monitoring
� Magic Quadrant and Market Solutions
� Evaluating APM Solutions
� Examples
3

Understanding Cloud4

What is cloud computing?
Traditional IT
� Cost of Ownership and Maintenance
� Cost of Operation
� Total Control
Cloud Computing
� Flexible availability
� Cost effective, Pay per use
� Unlimited Scalability
� Fit for Purpose
5

Cloud Deployment Models
� Private Cloud
� Privately shared virtualized resources
� Systems and Services operated and delivered exclusively for an organization
� Public cloud
� Enterprise taps into a public set of resources delivering standardized, highly
automated offerings
� Compute resources, storage and networking capabilities, are owned by a
service provider and offered on demand with limited SLAs regarding tenancy,
isolation, and performance.
� Shifts CapEx to OpEx – Pay as you go
� Hybrid cloud
� Implementation of “Hybrid” includes a mix of internal (on-premises, often
virtualized) and external (cloud-hosted) solutions, with applications switching
between resources as needed
� Allows manipulation of CapEx and OpEx
6

Cloud Service Models
Applications
Data
Runtime
Middleware
OS
Virtualization
Servers
Networking
Storage
Traditional
IT
Applications
Data
Runtime
Middleware
OS
Virtualization
Servers
Networking
Storage
Virtualization
Servers
Networking
Storage
Runtime
Middleware
OS
Virtualization
Servers
Networking
Storage
Applications
Data
Runtime
Middleware
OS
Applications
Data
7

Obscurity of Cloud
Problem Statement8

Cloud Challenges
� Security and Privacy
�Compliance
� Obscurity
�Lack of Visibility
�Loss of Control
� Availability, Reliability, Service Quality
�Performance Unpredictability
� Lack of Skills, Expertise
� Integration with Existing Infrastructure
9

Traditional Management Paradigm
� Traditional data center management and monitoring protocols focus on technology elements in silos
� Lack of visibility and control puts organization at the mercy of cloud vendor
� Vendor’s commitment and capability to meet SLAs
10

Solution - CAPM11

Application Performance Measurement/Monitoring/Management?
Production Monitoring / Alerting
� CPU, Memory, Disk and Network
� Application availability/health
� Critical business function performance
� Garbage Collection Health
� Out of Memory, Deadlock Conditions
Application Monitoring� CPU, Memory, Disk and
Network monitoring� Process Health
� Heap Usage, Garbage Collection Health
� Threads Count, Contention/Race conditions
� DB Connection Health� # of connections,
use/wait time, deadlocks
UEM and Reporting� Real-time end user
experience monitoring� SLA Reporting
� Performance and Availability of Critical Business Functions
� Business Analytics� Business Transaction
Volumes� Trend Reports� Geographic Location
distribution
Code Optimization
�Method level code profiling - root cause identification and optimization
�Thread synchronization and deadlock analysis
�Heap Object analysis and optimization
�Response Time tier breakdown
12

Production Monitoring / Alerting
� CPU, Memory, Disk and Network
� Application availability/health
� Critical business function performance
� Garbage Collection Health
� Out of Memory, Deadlock Conditions
Application Monitoring� CPU, Memory, Disk and
Network monitoring� Process Health
� Heap Usage, Garbage Collection Health
� Threads Count, Contention/Race conditions
� DB Connection Health� # of connections,
use/wait time, deadlocks
UEM and Reporting� Real-time end user
experience monitoring� SLA Reporting
� Performance and Availability of Critical Business Functions
� Business Analytics� Business Transaction
Volumes� Trend Reports� Geographic Location
distribution
Code Optimization
�Method level code profiling - root cause identification and optimization
�Thread synchronization and deadlock analysis
�Heap Object analysis and optimization
�Response Time tier breakdown
Application Performance Measurement/Monitoring/Management?
Develop
Test
DeployMonitor
Feedback
13

APM & Cloud: Why is it Important?
� Ensuring excellent end-user experience
� ‘Right Sizing’, validation and forecasting future growth, smart scaling
� Mitigating Risk of Unpredictable Performance
� Regaining Visibility and Control
� SLA Verification
14

CAPM – Making the right choice15

APM for XaaS
• Network Monitoring
• TCP/IP and SPAN Port monitoring
• Not Cloud Compatible
• Synthetic Monitoring
• Robotic transactions simulating User Behavior
• Availability focused
• Compatible with all Cloud offerings: IaaS, PaaS and SaaS
• Deep Dive Monitoring
• To monitor container resources
• Java/J2EE and .Net
• Needs an Agent
• Compatible with IaaS and PaaS
• Real User Monitoring
• Script Injection
• Agent install at times
• Compatible with IaaS and PaaS
• Can also be implemented for SaaS if vendor permits
Agent Based
Active
(IaaS/PaaS)
Agent Based
Passive
(IaaS/PaaS)
Agentless
Passive
(Not Cloud Compatible)
Agentless
Active
(IaaS/PaaS/SaaS)
Application Performance Monitoring
16

Synthetic Vs RUM
� Synthetic� Active Monitoring, special focus on Availability� Based on ‘Scripted’ User Interactions� Gauges possible user experience� Executed from any location across the globe� Is Agentless
� RUM� Based on ‘Real’ User Interactions� A more definitive indicator of User Experience� Also provides a global perspective� Can be Agentless(JavaScript, Network tap) or
Agent based
17

Some things to consider..
� Focus on� Business Transactions
� Tiers
� Baselines
� End User Experience
� Unified View across Hybrid Environments
� APM Approach� Agent Vs Agentless
� Synthetic Vs Real User Monitoring (RUM)
� Development and Optimization considerations
18

Gartner’s Magic Quadrant for APM Suites
Dimensions of APM Suites
End-user experience monitoring (EUEM)
� The capture of data about how end-to end latency, execution
correctness and quality appear to the real user of the application
� A secondary focus on application availability may be accomplished by
synthetic transactions emulating the end user
Application topology discovery and visualization
� The discovery of the software and hardware infrastructure
components involved in application execution, and the array of
possible paths across which these components communicate to deliver
the application
User-defined transaction profiling
� The tracing of user-grouped events, which comprise a transaction as
they occur within the application as they interact with components
discovered in the second dimension; this is generated in response to a
user's request to the application.
Application component deep dive
� The fine-grained monitoring of resources consumed and events
occurring within the components discovered in the application
topology discovery and visualization dimension
� This includes the server-side components of software being executed.
IT operations analytics (ITOA)
� The combination or usage of the following techniques: complex
operations event processing, statistical pattern discovery and
recognition, unstructured text indexing, search and inference,
topological analysis, and multidimensional database search and
analysis.
19
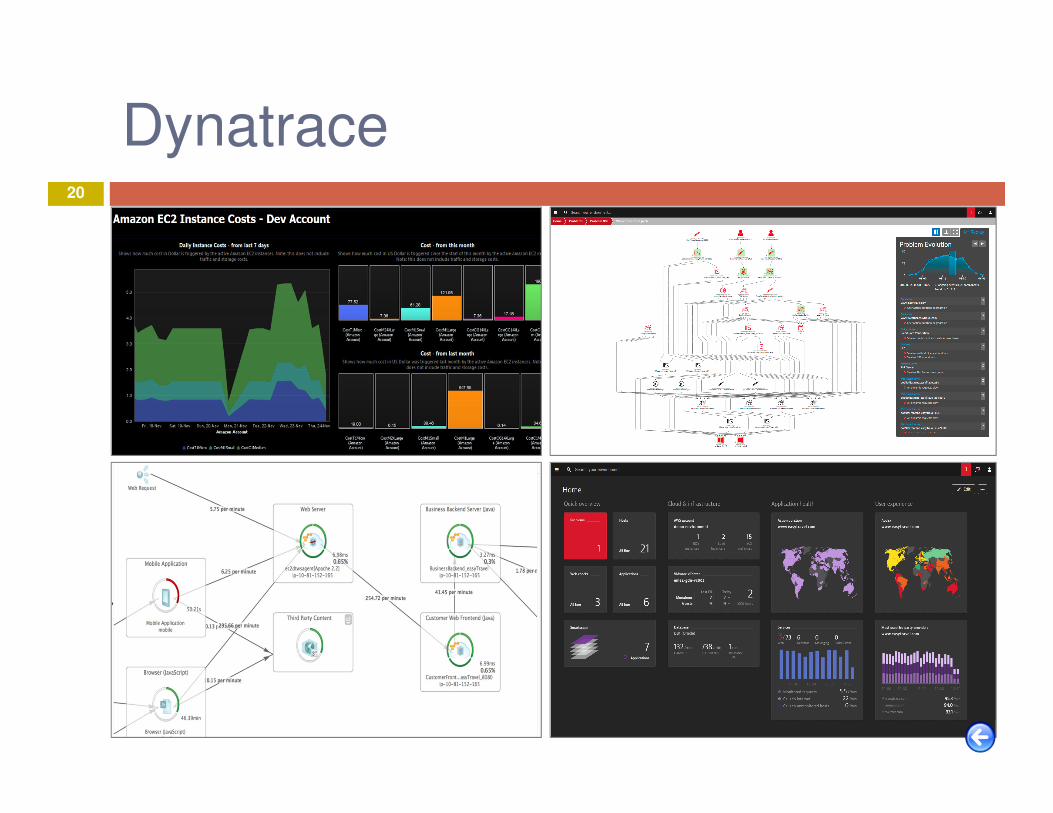
Dynatrace20

AppDynamics21

New Relic22

Monitoring Capabilities of Cloud Providers
� AWS- Amazon Cloud Watch and now X-Ray
� Chargeback/Cost Metrics, Status and Availability Monitoring
� Log Monitoring, Transaction Tracing, Service Mapping
� For AWS only
23
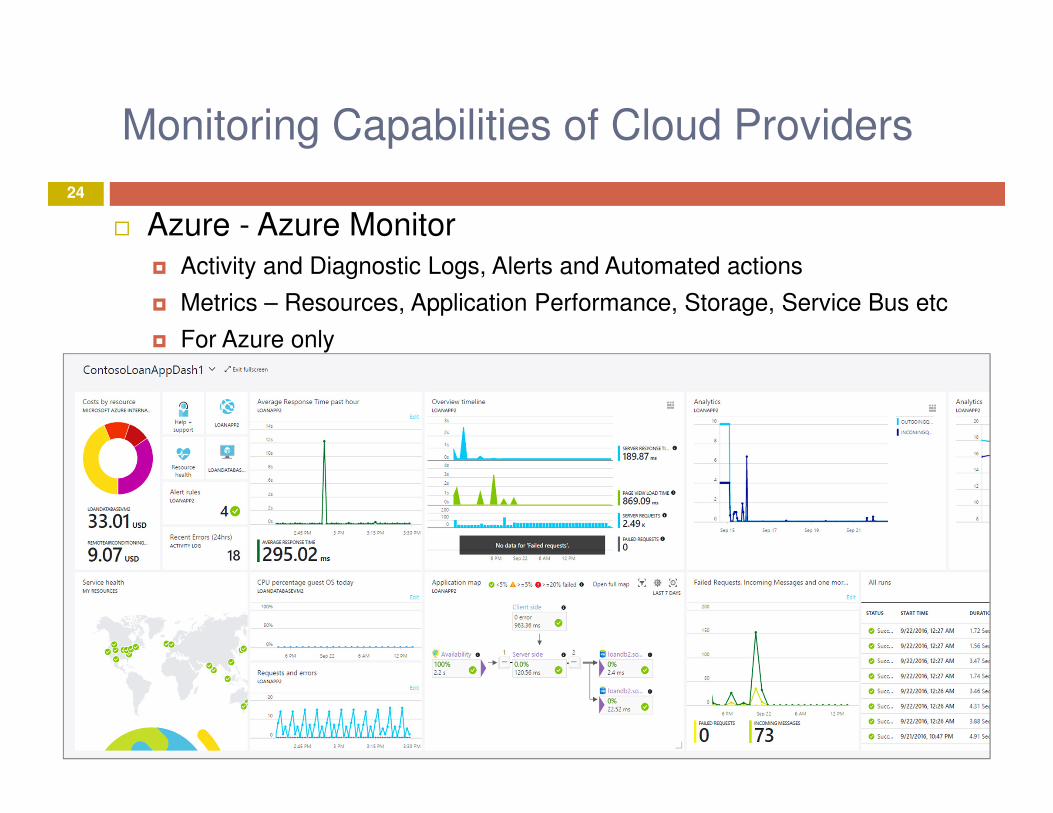
Monitoring Capabilities of Cloud Providers
� Azure - Azure Monitor
� Activity and Diagnostic Logs, Alerts and Automated actions
� Metrics – Resources, Application Performance, Storage, Service Bus etc
� For Azure only
24

Monitoring Capabilities of Cloud Providers
� Google - StackDriver
� Logging, event monitoring, diagnostics,
� Visibility into performance, uptime, and overall health of cloud applications
� For Google Cloud and AWS
25

Evaluating APM Solutions26

Defining APM Requirements
Real End User Monitoring Solution
� Must Have� Real-time capture and reporting on User Activity, Response Times
and Errors
� Page Rendering and object level details
� Business Transaction and SLA monitoring
� Business Analytics and User Session Insights
� Omni-channel visibility across Browsers and Mobile platforms
� Geographic perspective
� User defined transaction profiling for critical business applications� Integration with Runtime application performance
� ‘User-Complaint’ to ‘Code-Level’ root cause for faster triage of Production issues
� Good to Have� User defined transaction profiling for non critical applications
27

Defining APM Requirements
Synthetic Monitoring Solution for Active Availability coverage
� Must Have
� Page rendering and object level details for Root Cause analysis for critical business applications
� Last Mile response time from across the geography
� Multi Browser support for playback
� Good to Have
� Third part content analytics for critical business applications
� Competitive Benchmarking
� Integration with UEM, Runtime Application Performance
28

Defining APM Requirements
Runtime Application Performance Monitoring Solution
� Must Have
� Process health, Container resource, event monitoring (Heap, Thread, Connection pools, Servlets, EJBs)
� Auto discovery of transaction topology for service dependency mapping
� Transaction tracking/stitching for response time tier breakdown
� Code level ‘deep-dive’
� DB Performance (SQL Captures, Pool usage, Deadlocks, Hotspots)
� WebService, Messaging and Remote calls Performance
� Support for Java/J2EE, .Net, Microservices and other runtimes
� Monitoring of on premises and cloud hosted applications – seamless integration, presentation
� Real time high granularity collection and reporting
� No impact to application performance with minimal resource overhead
� Good to Have
� Transaction/Method level resource cost evaluation for code optimization
� Runtime Thread Dump and Heap Dump capabilities
� Application Events- Errors, Exceptions, logs and Stack Trace
� Integration with DevOps, support development/test lifecycle for agility � Integration with Load Generation tools (HP Performance Center) for monitoring of Performance tests
� Integration with IDEs and CI/CD solutions for code optimization
29
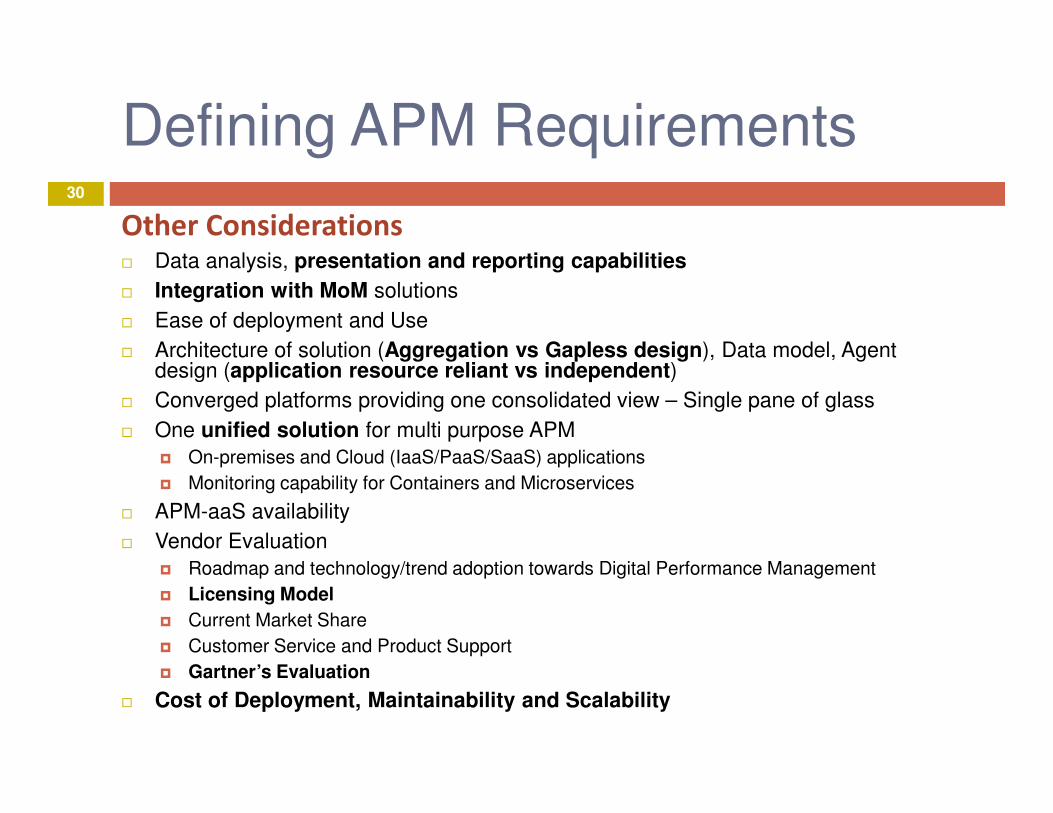
Defining APM Requirements
Other Considerations� Data analysis, presentation and reporting capabilities
� Integration with MoM solutions
� Ease of deployment and Use
� Architecture of solution (Aggregation vs Gapless design), Data model, Agent design (application resource reliant vs independent)
� Converged platforms providing one consolidated view – Single pane of glass
� One unified solution for multi purpose APM
� On-premises and Cloud (IaaS/PaaS/SaaS) applications
� Monitoring capability for Containers and Microservices
� APM-aaS availability
� Vendor Evaluation
� Roadmap and technology/trend adoption towards Digital Performance Management
� Licensing Model
� Current Market Share
� Customer Service and Product Support
� Gartner’s Evaluation
� Cost of Deployment, Maintainability and Scalability
30

Examples31

Synthetic Monitoring32

Synthetic Monitoring - Reports33

Real User Monitoring (JavaScript Injection)
1
2 3
4
4
SaaS
Application
34

RUM Reports
� Capability to track ‘critical’ transactions, visibility into top customer locations, branches and associated user
experiences
35

RUM Reports36

Agent Based Monitoring
IaaS/PaaS
Application
37

Agent Based Monitoring - Reports
38

Agent Based Monitoring - Reports
• Garbage Collection health, Suspension time, Process throughput, Thread Count
39

Agent Based Monitoring - Reports
40

Agent Based Monitoring - Reports
• Giving the Developers capability to drill in all the way to the source of the problem
� Deep dive into the code, identifying root cause at the method level
� Long running methods contributing to latency; Also identifying resource intensive methods
41

And that’s a wrap!
� We talked about� Cloud
� Cloud deployment models
� Service offerings
� Cloud Challenges
� APM Solutions
� Considerations for APM solutions
� Irrespective of � What cloud solution you adopt
� Which applications you migrate to it
� What monitoring methodologies you choose
� What APM solutions you deploy
….as an IT organization, you have to move from traditional monitoring/management paradigms to business service and end user focused, holistic solutions to survive this new age of Cloud
42

Questions?43

References
Gartner's Magic Quadrant for Application Performance Monitoring Suites
Things to Know About APM in the Cloud
Managing Performance of Cloud Based Applications
APM for Cloud Computing
Anatomy of APM
Cloud Predictions
Obscurity of Cloud
Duality of APM
Azure Monitor
AWS X-Ray
Google Stackdriver
Dynatrace
AppDynamics
New Relic
44

APPENDIX45

�Reporting on Average Application throughput during typical and peak times�Average response times for users with anomalies�Response Time Breakdown between Server, Network and Rendering time
EST Users come onlinePST Users come online
No improvement in Response Time since July 1st
RUM Reports (JavaScript Injection)
46

Agent Based Monitoring - Reports
47

RUM Reports (JavaScript Injection)
� Understanding User Experience across the globe
� Application Workload Trending for forecasting growth
48

RUM Reports (Agent Based)
49

SLA/SLM and Reporting
� Monitoring/Reporting Service levels for overall application as well as at ‘component level’
� Combining ‘Active’ and ‘Passive’ monitoring for complete visibility
� Proactive alerting
� Trending Transaction Volumes and End User Experience
� Understanding ‘cost per transaction’� Correlating business throughput to system
resource for ‘right-sizing’
50

Optimization for Cloud Applications
� Content Caching
� Compression algorithms – data is expensive in the cloud
� Optimized page rendering
� Parallel rendering of content
� WAN Quality of Service
� Chatty Applications
� Reducing acknowledgements to reduce WAN Latency
51

Dynatrace – Instance Cost52

Dynatrace – Problem Evolution53

Dynatrace – Topology Visualization54

Dynatrace – Overview Dashboards55

AppDynamics – Topology Visualization56

AppDynamics – User Experience57

New Relic – Infrastructure Overview58

New Relic – Instance Cost Monitoring59