Embed Size (px)
DESCRIPTION
ffg
Citation preview


©20
13 A
sian
Prod
uctiv
ity O
rgan
izat
ion

All rights reserved. No part of this work, including the �gures, tables, and charts, may be reproduced or used in any form or by any means, graphic,
©20
13 A
sian
Prod
uctiv
ity O
rgan
izat
ion

iii
1 Introduction1.1 Databook 2013 1.2 List of Contributors
2 Overview
3 Growth of Asian Economy3.1 Economic Scale and Growth 3.2 Catching Up in Per Capita GDP 3.3 Sources of Per Capita GDP Gap
4 Expenditure4.1 Composition of Final Demand 4.2 Demand-Side Growth Decomposition
5 Productivity5.1 Per-Worker Measure of Labor Productivity 5.2 Per-Hour Measure of Labor Productivity 5.3 Total Factor Productivity 5.4 Enhancement of Labor Productivity
6 Industry Perspective6.1 Output and Employment 6.2 Industry Growth 6.3 Labor Productivity by Industry
7 Real Income7.1 Real Income and Terms of Trade 7.2 Terms of Trade and Productivity Growth
AppendixA.1 GDP HarmonizationA.2 Capital StockA.3 Rate of Return and Capital ServicesA.4 Hours WorkedA.5 Other DataA.6 Industry Classification
References
1
1
2
5
13
14
23
29
37
37
49
57
57
63
68
80
87
87
94
106
111
111
120
123
123
127
129
131
133
134
135
Contents
©20
13 A
sian
Prod
uctiv
ity O
rgan
izat
ion

iv
Contents
National Accounts in Asian Countries
Population and Demographic Dividend
Quarterly Economic Growth
Turning Point in China
Sensitivity of TFP Estimates
Resource-Rich Countries and the Possible Dutch Disease
Cross-Country Comparison of GDP using Exchange Rate, 1970, 1980, 1990, 2000, 2010,
and 2011
Cross-Country Comparison of GDP using PPP, 1970, 1980, 1990, 2000, 2010, and 2011
GDP Growth, 1990–1995, 1995–2000, 2000–2005, and 2005–2011
Cross-Country Comparison of Per Capita GDP using Exchange Rate, 1970, 1980, 1990,
2000, 2010, and 2011
Per Capita GDP, 1970, 1980, 1990, 2000, 2010, and 2011
Country Groups Based on the Initial Economic Level and the Pace of Catching Up
Final Demand Shares in GDP, 1970, 1980, 1990, 2000, and 2011
Per-Worker Labor Productivity Levels, 1970, 1980, 1990, 2000, 2010, and 2011
Labor Productivity Growth, 1990–1995, 1995–2000, 2000–2005, and 2005–2011
Per-Hour Labor Productivity Levels, 1970, 1980, 1990, 2000, 2010, and 2011
Labor Productivity Growth, 1990–1995, 1995–2000, 2000–2005, and 2005–2011
Output Growth and Contributions of Labor, Capital, and TFP
Role of TFP and Capital Deepening in Labor Productivity Growth, 1970–2011
Country Groups Based on the Current Economic Level and the Pace of Catching Up
Output Growth by Industry, 2000–2010
Labor Productivity Growth by Industry, 2000–2010
Real Income and Terms of Trade, 1970–2011, 1995–2000, 2000–2005, and 2005–2011
Asset Classification and Parameters in Hyperbolic Function
Input–Output Tables and Supply and Use Tables
Average Ex Post Real Rate of Return in Asia
Sources of Labor Data
Industry Classification
Box 1 Box 2
Box 3
Box 4
Box 5
Box 6
Table 1
Table 2
Table 3
Table 4
Table 5
Table 6
Table 7
Table 8
Table 9
Table 10
Table 11
Table 12
Table 13
Table 14
Table 15
Table 16
Table 17
Table 18
Table 19
Table 20
Table 21
Table 22
Box
Table
22
33
48
60
86
121
14
16
18
24
27
28
37
59
61
64
66
76
84
88
100
106
112
127
127
130
132
134
©20
13 A
sian
Prod
uctiv
ity O
rgan
izat
ion

v
GDP Growth of Asia, the EU, Japan, and the US, 1970–2011
Share of Asia in World GDP in 2011 and Projection for 2018
Relative Prices of GDP, 2005
Regional GDP of Asia and the EU Relative to the US, 1970–2011
GDP of China, India, and Japan, 1970–2011
Regional GDP of South Asia, ASEAN, and GCC, 1970–2011
Country Contributions to Regional GDP Growth, 1970–1990 and 1990–2011
Correlation of GDP Growth, 1990–1999
Correlation of GDP Growth, 2000–2011
Share of Asian Population in the World in 2011
Cross-Country Comparison of Per Capita GDP using Exchange Rate of Japan and Aus-
tralia Relative to the US, 1970–2011
Cross-Country Comparison of Per Capita GDP using Exchange Rate of Asian Tigers
Relative to the US, 1970–2011
Per Capita GDP of Japan, the EU, and Australia Relative to the US, 1970–2011
Per Capita GDP of Asian Tigers Relative to the US, 1970–2011
Per Capita GDP of China, India, and ASEAN Relative to the US, 1970–2011
Per Capita Non-Mining GDP in Oil-Rich Countries, 2010
Initial Level and Growth of Per Capita GDP, 1970–2011
Labor Productivity and Employment Rate Gap Relative to the US, 1995 and 2011
Sources of Per Capita GDP Growth, 1995–2000 and 2000–2011
Share of Female Employment
Employment Rates, 1970, 1990, and 2011
Final Demand Shares in GDP of China, 1952–2011
Final Demand Shares in GDP of the US, 1929–2011
Final Demand Shares in GDP, 1995 and 2011
Ratio of Dependent Population and Consumption Share in GDP at Current Prices, 2011
Export and Import Shares in GDP, 1995 and 2011
Long-Term Trend of Household Consumption Share in GDP, 1970–2011
Share of Dependent Population, 2011
Household Consumption by Purpose, 2010
Engel Curve of Japan during 1949–2010 and Levels of Asian Countries in 2010
Long-Term Trend of Investment Share in GDP, 1970–2011
Investment Share by Type of Asset, 1970 and 2011
Long-Term Trend of Net Export Share in GDP, 1970–2011
Final Demand Contributions to Economic Growth, 1995–2000 and 2000–2011
Final Demand Contribution Shares to Economic Growth of the Asian Tigers, 2000–2011
Impacts of Global Financial Crisis and Recoveries, 2007–2011
Impacts of Asian Financial Crisis, 1997–1998
Final Demand Decomposition of Real GDP Growth, 1970–2011
Labor Productivity Level by Per-Worker GDP, 2011
Labor Productivity Trends of China and India, 1970–2011
Labor Productivity Level Relative to the US, 1970–2011
Labor Productivity Gap by Per-Worker and Per-Hour GDP Relative to the US, 2011
Figure 1
Figure 2
Figure 3
Figure 4
Figure 5
Figure 6
Figure 7
Figure 8 Figure 9
Figure 10
Figure 11
Figure 12
Figure 13
Figure 14
Figure 15
Figure 16
Figure 17
Figure 18
Figure 19
Figure 20
Figure 21
Figure 22
Figure 23
Figure 24
Figure 25
Figure 26
Figure 27
Figure 28
Figure 29
Figure 30
Figure 31
Figure 32
Figure 33
Figure 34
Figure 35
Figure 36
Figure 37
Figure 38
Figure 39
Figure 40
Figure 41
Figure 42
Figure
13
13
15
17
17
17
19
20
21
23
25
25
25
25
26
26
28
29
30
31
31
39
39
40
41
42
43
44
45
45
46
46
47
50
51
52
53
54
58
60
62
64
©20
13 A
sian
Prod
uctiv
ity O
rgan
izat
ion

vi
Contents
Labor Productivity Trends in Japan and the Four Asian Tigers, 1970–2011
Labor Productivity Growth, 1970–2010, 1970–1990, and 1990–2011
Labor Input Growth, 1970–2010, 1970–1990, and 1990–2011
Labor Productivity Trends of Japan during 1885–2011 and Levels of Asian Countries in 2011
Time Durations Taken to Improve Labor Productivity by Japan and the Asian Tigers
TFP Growth, 1970–2011, 1970–1990, and 1990–2011
Sources of Economic Growth, 1970–2011
Contribution Shares of Economic Growth, 1970–2011
Sources of Economic Growth, 1970–1985, 1985–2000, and 2000–2011
Contribution Shares of Economic Growth, 1970–1985, 1985–2000, and 2000–2011
Comparison of Sources of Economic Growth with OECD Countries, 2000–2010
Individual Countries’ Growth Accounting Decomposition, 1970–2011
IT Capital Contribution to Capital Input Growth of Japan and the US, 1970–2011
IT Capital Contribution to Capital Input Growth of Asian Tigers, China, and India, 1970–2011
Individual Countries’ Growth Accounting Decomposition (year-on-year), 1970–2011
Capital Deepening, 1970–2011, 1970–1990, and 1990–2011
Capital Productivity Growth, 1970–2011, 1970–1990, and 1990–2011
Capital Productivity Trends in Japan and the Four Asian Tigers, 1970–2011
Capital Productivity Trends in China and India, 1970–2011
Sources of Labor Productivity Growth, 1970–2011
Contribution Shares of Labor Productivity Growth, 1970–2011
Sources of Labor Productivity Growth, 1970–1985, 1985–2000, and 2000–2011
Contribution Shares of Labor Productivity Growth, 1970–1985, 1985–2000, and 2000–2011
Decomposition of Labor Productivity Growth, 1970–2011
Industry Shares of Value Added, 2010
Industry Shares of Value Added in Manufacturing, 2010
Industry Shares of Value Added and Employment by Country Group, 1980, 1990, 2000,
and 2010
Long-Term Trends of Value-added Share in the Agriculture Sector, 1970–2010
Industry Shares of Employment, 2010
Employment Share of Agriculture in Japan during 1885–2011 and Levels of Asian Coun-
tries in 2010
Long-Term Trends of Employment Share in the Agriculture Sector, 1970–2010
Job Creation in Manufacturing, 1970–2010
Industry Origins of Economic Growth, 1985–1990, 1990–1995, 1995–2000, and 2000–2010
Contribution of Manufacturing to Economic Growth, 1995–2000 and 2000–2010
Contribution of Service Sector to Economic Growth, 1995–2000 and 2000–2010
Contribution of Wholesale and Retail to Economic Growth, 1995–2000 and 2000–2010
Industry Origins of Output Growth in Manufacturing, 1995–2000 and 2000–2010
Industry Origins of Regional Economic Growth, 1995–2000 and 2000–2010
Industry Origins of Asian Economic Growth, 2000–2010
Industry Origins of Economic Growth, 1970–2010
Industry Origins of Labor Productivity Growth, 1985–1990, 1990–1995, 1995–2000,
and 2000–2010
Contribution of Manufacturing to Labor Productivity Growth, 1995–2000 and 2000–2010
Figure 43
Figure 44
Figure 45
Figure 46
Figure 47
Figure 48
Figure 49
Figure 50
Figure 51
Figure 52
Figure 53
Figure 54
Figure 55
Figure 56
Figure 57
Figure 58
Figure 59
Figure 60
Figure 61
Figure 62
Figure 63
Figure 64
Figure 65
Figure 66
Figure 67
Figure 68
Figure 69
Figure 70
Figure 71
Figure 72
Figure 73
Figure 74
Figure 75
Figure 76
Figure 77
Figure 78
Figure 79
Figure 80 Figure 81
Figure 82
Figure 83
Figure 84
65
65
65
67
68
70
71
71
72
72
73
75
78
78
79
80
80
81
81
81
81
82
82
83
89
89
90
92
93
93
94
95
96
97
98
99
101
102
103
104
107
108
©20
13 A
sian
Prod
uctiv
ity O
rgan
izat
ion

vii
Contribution of Service Sector to Labor Productivity Growth, 1995–2000 and 2000–2010
Contribution of Wholesale and Retail Sector to Labor Productivity Growth, 1995–2000
and 2000–2010
Effect of Net Income Transfer on GDP, 1970–2011
Real Income and Real GDP Growth, 1970–2011
Trading Gain Effect, 2005–2011
Price of Crude Oil, 1986–2013
Decomposition of Real Income Growth, 1970–2011 and 2000–2011
Decomposition of Real Income Growth, 1973–1979 and 1996–1998
Sources of Real Income Growth, 1970–2011
Terms-of-Trade Effect and Labor Productivity Growth, 1970–2011
Adjustment of FISIM
FISIM Share in GDP in the 2000–2011
Software Investment Ratio and GFCF Ratio to GDP, 2005
Capital-Output Ratio, 1980 and 2011
Ex Post Real Rate of Return in Asia, 1970–2011
Average Annual Hours Worked Per Worker Relative to the US, 2000–2011
Implementation of the 1968 and 1993 SNA and Plan for the 2008 SNA
Distribution of the World’s Population in Different Regions, 1950–2100
Asian Countries’ Population Size and Projection, 1970, 2011, and 2050
Proportion of the Dependent Population, 2011
Demographic Dividend, 1950–2100
Views of Quarterly Economic Growth in Asian Countries by the AQGM
Quarterly Economic Growth in Asian Countries, 2010Q4 – 2012Q4
Price of Labor Relative to Capital in China, Japan, and the Asian Tigers, 1970–2011
Labor Income Share for Employees, 2011
Sensitivity of TFP Estimates by the Change of Income Share, 1970–2011
Trading Gain Effects and Value-added Share in Mining Sector, 1970–2010
Figure 85
Figure 86
Figure 87
Figure 88
Figure 89
Figure 90
Figure 91
Figure 92
Figure 93
Figure 94
Figure 95
Figure 96
Figure 97
Figure 98
Figure 99
Figure 100
Figure B1
Figure B2.1
Figure B2.2
Figure B2.3
Figure B2.4
Figure B3.1
Figure B3.2
Figure B4.1
Figure B5.1
Figure B5.2
Figure B6.1
108
109
113
114
114
115
116
117
118
120
124
124
125
128
129
132
22
33
34
34
35
48
49
60
86
86
121
©20
13 A
sian
Prod
uctiv
ity O
rgan
izat
ion

viii
ADB
APO
APO20
AQGM
ASEAN
Asia23
Asia29
CLMV
CPI
EU
EU15
EU27
FISIM
GCC
GDP
GFCF
GNI
IMF
ISIC
IT
KEO
Lao PDR
NPISHs
OECD
PPP
QNA
ROC
SNA
TFP
UAE
UN
UNSD
US
Asian Development Bank
Asian Productivity Organization
20 member economies of the Asian Productivity Organization: Bangladesh,
Cambodia, the Republic of China, Fiji, Hong Kong, India, Indonesia, Islamic Re-
public of Iran, Japan, the Republic of Korea, the Lao PDR, Malaysia, Mongolia,
Nepal, Pakistan, the Philippines, Singapore, Sri Lanka, Thailand, and Vietnam
Asian quarterly growth map
Association of Southeast Asian Nations: Brunei, Cambodia, Indonesia, the Lao
PDR, Malaysia, Myanmar, the Philippines, Singapore, Thailand, and Vietnam
APO20 plus the People’s Republic of China, Brunei, and Myanmar
Asia23 plus GCC countries
Cambodia, the Lao PDR, Myanmar, and Vietnam
consumer price index
European Union
15 member economies of the European Union prior to enlargement: Austria,
Belgium, Denmark, Finland, France, Germany, Greece, Ireland, Italy, Luxem-
bourg, Netherlands, Portugal, Spain, Sweden, and the United Kingdom
European Union: EU15 plus Bulgaria, Cyprus, Czech Republic, Estonia, Hun-
gary, Latvia, Lithuania, Malta, Poland, Romania, Slovak Republic, and Slovenia
financial intermediation services indirectly measured
Gulf Cooperation Council: Bahrain, Kuwait, Oman, Qatar, Saudi Arabia, and
the UAE
gross domestic product
gross fixed capital formation
gross national income
International Monetary Fund
International Standard Industry Classification
information technology
Keio Economic Observatory, Keio University
Lao People’s Democratic Republic
non-profit institutions serving households
Organisation for Economic Co-operation and Development
purchasing power parity
quarterly national accounts
Republic of China
System of National Accounts
total factor productivity
United Arab Emirates
United Nations
United Nations Statistics Division
United States
Abbreviations
©20
13 A
sian
Prod
uctiv
ity O
rgan
izat
ion

ix
I am pleased to release this, the sixth edition of the APO Productivity Databook (Databook 2013) to the readers. The Databook 2013 is an analytical report based on comparative data on productivity and economic growth, which has been constructed from timely and reliable sources of data and information. In conjunction with the online data published on the APO website, the APO Pro-ductivity Database and the Asian Quarterly Growth Map, the Databook 2013 offers a comprehensive overview of Asia’s productivity data and expert analysis for development planners, public and private policy makers, industries and re-searchers, and the general public.
It is evident from the statistical data and analysis contained in this edition that Asian economies have generally been resilient and quickly recovered from the recent global financial crisis which has devastated so many other regions. Asia is steadily gaining a reputation as a vibrant center of the world economy, now contributing approximately two-fifths of global value added. In the context of such Asian dynamism, it is our ambitious expectation that all the APO members will eventually enjoy a high standard of living. Our challenge to this ambition is productivity; Asia must not be complacent in its efforts towards efficiency and competitive economic performance.
The APO continues working to propel all its member economies to be more productive and competitive through the mainstreaming of innovation-led pro-ductivity tools and techniques to further strengthen the region’s engines – its small and medium enterprises and the human capitals that power them. In this endeavor, the APO is mindful of equally distributing productivity gains across the populations. At the same time, it is our strong conviction that the productiv-ity journey be navigated in tandem with the concept of sustainable develop-ment. The APO has therefore been proactive in addressing the importance of environmental sustainability in pursuing production efficiency, together with promotion of Green Productivity.
This publication is the fruit of the research efforts of the APO Productivity Data-book Project, implemented by the Research and Planning Department of the APO Secretariat in collaboration with Keio Economic Observatory, Keio Universi-ty in Tokyo. My profound gratitude goes to Professor Koji Nomura, Professor Fu-kunari Kimura, Ms. Eunice Y. M. Lau, Ms. Kyoko Ishikawa, Ms. Shinyoung Oh, and Mr. Hiroshi Shirane. I also wish to thank all the national experts for providing their respective economic data. The APO continues, and will continue, to work with our members and their respective statistical offices to improve the data quality and coverage that underpins the data presented in the APO Productivity Databook series.
I am confident that readers will appreciate this publication as a reference and find practical uses for it.
Ryuichiro YamazakiSecretary-GeneralAsian Productivity OrganizationTokyo, August 2013
Foreword
©20
13 A
sian
Prod
uctiv
ity O
rgan
izat
ion

1
1
1.1 Databook 2012
1.1 Databook 2013
This is the sixth edition in the APO Productivity Databook series. The publication aims to provide a cross-country comparison of economic growth and productivity levels of Asian economies in relation to global and regional economies. Productivity analysis will allow valuable insights into the long- term growth potential of an economy. With a focus on long-term analysis, the APO Productivity Data-book not only looks at a country’s productivity performance, but also its economic composition and sources of growth in order to provide readers with a more comprehensive description and compari-son of a given country’s economic structure and characteristics.
Baseline indicators are calculated for 29 Asian economies, representing the 20 Asian Productivity Organization (APO) member economies (referred to as the APO20) – Bangladesh, Cambodia, the Re-public of China (ROC), Fiji, Hong Kong, India, Indonesia, the Islamic Republic of Iran (Iran), Japan, the Republic of Korea (Korea), the Lao People’s Democratic Republic (Lao PDR), Malaysia, Mongolia, Nepal, Pakistan, the Philippines, Singapore, Sri Lanka, Thailand, and Vietnam, and nine non-member economies in Asia – the People’s Republic of China (China), Brunei, Myanmar, and the Gulf Coopera-tion Council (GCC) that consists of Bahrain, Kuwait, Oman, Qatar, Saudi Arabia, and the United Arab Emirates (UAE). In addition, Australia, the European Union (EU), Turkey, and the United States (US) are included as reference economies. Turkey has been newly included in this edition as a reference country. This edition covers the period 1970–2011.
The productivity measures in this report are based on data and estimates collated for the APO Produc-tivity Database project since September 2007, as a joint research effort between the APO and the Keio Economic Observatory (KEO), at Keio University. Its estimates are based primarily on the System of National Accounts (SNA) in 1993. In this edition, some significant revisions on the national accounts were incorporated. New developments for the upgrading of statistics systems in APO member econo-mies have resulted in Malaysia and Hong Kong publishing their accounts based on the 2008 SNA in May and September 2012, respectively. In May 2011, the Philippines published its new accounts based on the 1993 SNA and elements of the 2008 SNA. While there are movements toward upgrading the SNA, some countries, such as Cambodia and Indonesia, have still not fully introduced the 1993 SNA. The different statuses of SNA adaptions among the member economies can result in discrepan-cies between data definitions and coverage, calling for data harmonization in order to perform com-parative productivity analyses. This Databook project tries to reconcile the national accounts variations that are based on the different concepts and definitions, and provide harmonized estimates for inter-national comparison.
To analyze the overall productivity improvement as well as partial productivity improvement (i.e., labor productivity and capital productivity), the Databook project constructs estimates of capital ser-vices appropriate to the concept of capital input introduced in the 2008 SNA. Based on these esti-mates, the sources of economic growth in each economy are further decomposed to factor inputs of labor and capital and total factor productivity (TFP) for 17 Asian economies – ROC, Fiji, Hong Kong, India, Indonesia, Iran, Japan, Korea, Malaysia, Mongolia, Pakistan, the Philippines, Singapore, Sri Lan-ka, Thailand, Vietnam, and China – along with the US as a reference economy. It is a notable achieve-ment that the TFP estimates for Pakistan and Sri Lanka are newly developed in the APO Productivity Database 2013 and are presented in this edition of the Databook. This edition reflects the revisions to the official national accounts and other statistical data published as of March 2013.
Most of the official national accounts and metadata information used for constructing the APO Pro-ductivity Database 2013 have been prepared by national experts in the APO member economies
1 Introduction
©20
13 A
sian
Prod
uctiv
ity O
rgan
izat
ion

2
1 Introduction
through questionnaires designed at KEO. The names of these experts are listed in Section 1.2. The submitted data was then examined and processed at KEO where further information was collected on labor, production, prices, and taxes as required. The project was managed by Koji Nomura (KEO, Keio University), under the consultancy of Professors Dale W. Jorgenson (Harvard University) and W. Erwin Diewert (University of British Columbia), and with coordination by Yasuko Asano (Research and Planning Department, APO). The text, tables, and figures in the report were authored by Koji Nomura, Fukunari Kimura (Department of Economics, Keio University), and Eunice Ya Ming Lau (KEO, Keio Uni-versity) with support from research assistants Kyoko Ishikawa, Shinyoung Oh, and Hiroshi Shirane.
1.2 List of Contributors
Authors of This Report
Dr. Koji NomuraAPO Productivity Database Project Manager,Associate Professor, KEO, Keio University, 2-15-45 Mita, Minato-ku, Tokyo 108-8345, Japan
Dr. Fukunari KimuraProfessor, Department of Economics, Keio University
Ms. Eunice Ya Ming LauResearcher, KEO, Keio University
Research Assistants at KEO, Keio University
Ms. Kyoko Ishikawa
Ms. Shinyoung Oh
Mr. Hiroshi Shirane
APO Officer
Ms. Yasuko AsanoProgram Officer, Research and Planning Department, Asian Productivity Organization, 1-24-1 Hongo, Bunkyo-ku, Tokyo 113-0033, Japan
National Experts
Bangladesh Mr. Ziauddin Ahmed
Deputy Director, Bangladesh Bureau of Statistics, Parishankhan Bhaban, E/27/A, Agargaon, Sher-e-Bangla Nagar, Dhaka
CambodiaMr. Chettra Keo
Director, National Accounts Department, National Institute of Statistics, Ministry of Planning, #84, St. 130, Don Penh, Phnom Penh
Republic of ChinaMs. Jia-yuan Mei
Chief, National Accounts Section, Bureau of Statistics, Directorate-General of Budget, Accounting, and Statistics, Executive Yuan,6F, No. 2, Guangjhou Street, Taipei 10065
FijiMs. Navilini Singh
Statistician, Economics Statistics Division, Fiji Islands Bureau of Statistics, P.O. Box 2048, Government Buildings, Suva
IndiaDr. Shailja Sharma
Deputy Director General, National Accounts Division, Central Statistics Office, Ministry of Statistics and Programme Implementation, Sardar Patel Bhawan, Parliament Street, New Delhi
Islamic Republic of IranMr. Hamid Azarmand
Consultant, National Iranian Productivity Organization, No. 15, Daneshsara St., Baharestan Sq., Tehran
©20
13 A
sian
Prod
uctiv
ity O
rgan
izat
ion

1
3
1.2 List of Contributors
JapanMr. Takashi Watanabe
Director, National Wealth Division, National Accounts Department, Economic and Social Research Institute, Cabinet Office, Government of Japan, 3-1-1 Kasumigaseki, Chiyoda-ku, Tokyo 100-8970
Republic of KoreaDr. Geonwoo Lee
Research Fellow, Korea Institute for Industrial Economics and Trade, 206-9 Cheongryangri-dong, Dongdaemun-ku, Seoul 130-742
Lao PDRMr. Phousavanh Chanthasombath
Economist, National Accounts Division, Department of Economic Statistics, Lao Statistics Bureau, Ministry of Planning and Investment, Ban Sithanneau, Souphanouvong Road, Vientiane
MalaysiaMs. Hezlin Suzliana Binti Abdul Halim
Assistant Director, National Accounts Statistics Division, Department of Statistics, Malaysia, Ting. 3, Unit 01-05, Wisma Minlon, Batu 12 Lebuhraya Sg. Besi, 43300 Seri Kembangan, Selangor
MongoliaMs. Bayarmaa Baatarsuren
Statistician, Macroeconomic Statistics Department, National Statistical Office of Mongolia, Government Building III, Bagatoiruu 44, Ulaanbaatar 11
NepalMr. Rajesh Dhital
Statistical Officer, Central Bureau of Statistics, Ramshapath, Thapathali, Kathmandu
PakistanMr. Shahid Mahmood Butt
Deputy Director General, National Accounts, Statistics Division, Pakistan Bureau of Statistics, Statistics House 21, Mauve Area G-9/1, Islamabad
PhilippinesMs. Estela T. de Guzman
Director, Industry and Trade Statistics Department, National Statistics Office, Solicarel Building, Ramon Magsaysay Blvd., Sta. Mesa, Manila 1016
Sri LankaMr. Weerasinghe Wasala Mudiyanselage Ananda Sarath Premakumara
Director Statistics, Sample Surveys Division, Department of Census and Statistics, Ministry of Finance and Planning, Unity Plaza Building, Bambalapitiya, Colombo 04
ThailandMs. Wannapa Khlaisuan
Senior Professional, National Accounts Office, National Economic and Social Development Board, 962 Krung Kasem Road, Pomprab, Bangkok 10100
VietnamMs. Thi Hai Ha Nguyen
Statistical Officer, Trade and Services Department, General Statistics Office of Vietnam, 6B Hoang Dieu Street, Ba Dinh District, Hanoi
©20
13 A
sian
Prod
uctiv
ity O
rgan
izat
ion

4
1 Introduction
APO
mem
ber e
cono
mie
sN
on-m
embe
r Asia
n ec
onom
ies i
nclu
ded
in D
atab
ook 2
013
©20
13 A
sian
Prod
uctiv
ity O
rgan
izat
ion

2
5
Overview
The year 2012 was a relatively strong one for economic growth in most Asian countries, despite the EU’s chronic slump and growing uncertainty in the US. The Euro crisis that started in 2008 gradually calmed down, although it appears it will take a few more years for the EU to resume its stable growth path. The US economy looked set to recover its vigor, but its relative importance as a trading partner of Asia remained lower than pre-global financial crisis levels. Asia, in contrast, grew almost by itself in these few years to become a notable growth center of the world despite some Asian countries show-ing signs of a slowdown in the short run.
China has been a champion of economic growth both in Asia and the world for decades, and other Asian countries also performed fairly well. Latecomers in ASEAN1, namely Cambodia, the Lao PDR, Myanmar, and Vietnam (CLMV), have shown higher gross domestic product (GDP) growth rates than their six ASEAN forerunners over the past decade and a half. India, Bangladesh, Sri Lanka and other developing Asian countries have also presented sustained economic growth. These indicate the nar-rowing of development gaps, and the increased upward mobility that has been steadily advancing across Asia. Aggressive introduction of foreign direct investment and participation in international production networks – made possible through enhancing physical and institutional connectivity and utilizing the abundant unskilled labor which is moving from the rural/informal sector to the urban/formal sector – can help Asia’s developing economies jump-start industrialization and approach the middle-income level.
After the global financial crisis, economic ties among East Asian countries tightened further still, due to extended and entrenched international production networks. East Asia, including both Northeast Asia and Southeast Asia, is a region where the international division of labor in terms of production processes or tasks, so-called the second unbundling (Baldwin, 2011), is the most advanced in the world, particularly in machinery industries. Although similar production networks are observed in Mexico, Costa Rica, and several countries in Latin America and Eastern Europe, those in East Asia are distinctive in their significance within these economies, extending across many countries in the re-gion and with a sophistication that combines intra-firm and inter-firm transactions (Ando and Kimura, 2005). The fragmentation theory proposed by Jones and Kierzkowski (1990) explains why East Asia can develop such a distinct new model – the differences in wage levels and development stages among East Asian economies yielding substantial savings in production costs and a physical and insti-tutional connectivity allowing low service-link costs to connect fragmented production blocks, there-by making the new type of international division of labor economically viable.
Since 2008, intra-regional trade in East Asia has grown at a fast pace, China and Korea have been more deeply involved with the East Asian economy, and CLMV as well as India have gradually come into international production networks. East Asia has developed greater self-sufficiency, depending more on their own market. It may not have achieved a complete de-coupling from the rest of the world, but it is certainly less reliant on external economies.
The past decade was a rare period when almost all developing countries in the world enjoyed high economic growth. The origins and industry sources of this growth, however, varied hugely across regions and, indeed, countries. In the 2000s there were drastic, observable hikes in the world prices of natural resources and fuels, pushing up the income levels of resource-exporting economies with aggressive resource-oriented investment and local currency appreciation. In response, the relative prices between manufactured goods and natural resources worsened substantially, leaving
2 Overview
1: ASEAN (Association of Southeast Asian Nations) consists of Brunei, Cambodia, Indonesia, the Lao PDR, Malaysia, Myanmar, the Phil-ippines, Singapore, Thailand, and Vietnam.
©20
13 A
sian
Prod
uctiv
ity O
rgan
izat
ion

6
2 Overview
resource-importing Asian economies vulnerable to an aggravation of the terms of trade. This undeni-ably lowered the welfare level of the economies involved, while at the same time strengthening their competitiveness in manufacturing activities. Wage increases (in US dollars terms) in East Asia have been more modest than in the rest of the world, while East Asia has started exporting massive amounts of machinery parts and components to Eastern Europe and other industrial agglomerations (Ando and Kimura, 2013). The dominance of East Asia as a manufacturing base will surely be uncon-tested in the coming five-to-ten years. On the other hand, resource-exporting economies may want to avoid the “Dutch disease”2 by avoiding drastic currency appreciation and promoting the growth of productive sectors.
There have recently been big debates about whether the Asian economies are prey to a “middle- income trap”, or not. Felipe (2013) reviews the long-run economic growth performance of 124 coun-tries during 1950–2010, classifying their income levels as one of four income groups, i.e., low-income, lower-middle-income, upper-middle-income, and high-income, and counting the number of years it took a country to cross the income thresholds in terms of its economic growth. According to this sim-plistic categorization of the Asian economies as of 2010, the Philippines and Sri Lanka may be in a lower-middle-income trap while Malaysia, Saudi Arabia, and Syria are caught in an upper-middle- income trap; other Asian economies covered by the study are mercifully not, as such, in traps. Al-though such simplistic numerical results are not gospel, one should be attentive for signs of slowed growth as in, for example, the six ASEAN forerunners after the Asian currency crisis, and perhaps in the China of the future. The East Asian developing economies in particular have been extremely success-ful in jump-starting industrialization by using the mechanics of production networks, and are now approaching the uncharted territory of graduating from middle-income to fully developed econo-mies. It is going to be a big challenge, one that certainly requires the substantial transformation of their industrial structure, together with industrial upgrading, productivity growth, and the enhance-ment of human capital.
2012 was also the year of domestic politics. In the US, President Obama was reelected while Japan, Korea, and China all elected new political leaders. Today, political moves toward regional economic integration appear accelerated; the extended negotiations over the Trans-Pacific Strategic Economic Partnership agreement started in March 2010 and included some Asian countries. The advancement of Trans-Pacific Strategic Economic Partnership negotiations will stimulate regional integration efforts in East Asia, including the Regional Comprehensive Economic Partnership in the ASEAN+6 frame-work3 and the China-Japan-Korea Free Trade Agreement. It is hoped that the competitive advance-ment of these regional initiatives will promote beneficial overall economic integration, will accelerate necessary domestic reforms, and will provide a model of new international economic order.
At the timing of writing (May 2013), there is wide journalistic coverage of a set of new economic poli-cies in Japan, so-called Abenomics. Abenomics is aimed at combining monetary policy, fiscal policy, and economic reform to escape Japan’s long-lasting recession. Although it is certainly too early to evaluate its outcome, people’s expectations for the future have dramatically altered, at least in the short run, and are tentatively returning to normal. Possible adverse effects of the yen deprecia-tion – returning only now to pre-global financial crisis levels – on neighboring countries seem so far to be minimal. Whether this can become a new prescription for stagnant developed economies is of global interest.
2: “Dutch disease” describes a phenomenon in which a country’s currency is pushed up by the commodity boom, making other parts of its economy less competitive and potentially increasing the country’s dependence on its natural resources. See 7.2 for the Asian countries’ experiences in the long-term changes of terms of trade and labor productivity improvement.
3: The ASEAN+6 are the ASEAN and its six major trading partners: China, India, Japan, Korea, Australia, and New Zealand.
©20
13 A
sian
Prod
uctiv
ity O
rgan
izat
ion
2
7
Overview
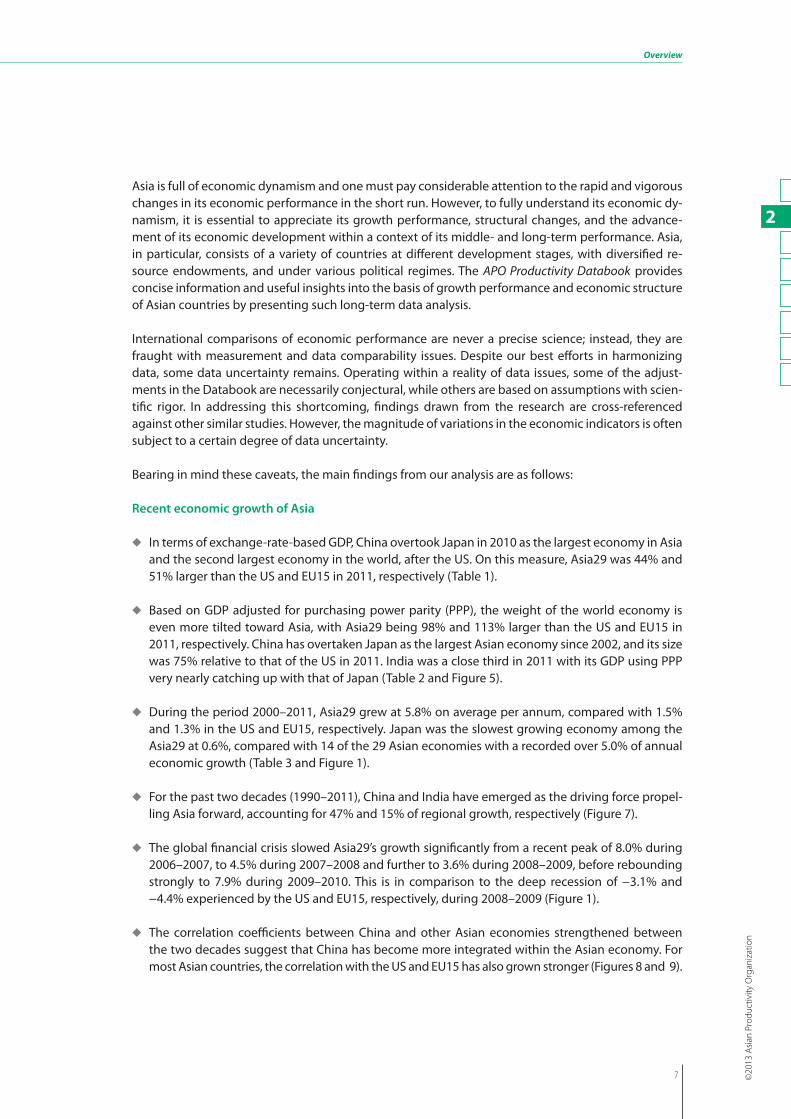
Asia is full of economic dynamism and one must pay considerable attention to the rapid and vigorous changes in its economic performance in the short run. However, to fully understand its economic dy-namism, it is essential to appreciate its growth performance, structural changes, and the advance-ment of its economic development within a context of its middle- and long-term performance. Asia, in particular, consists of a variety of countries at different development stages, with diversified re-source endowments, and under various political regimes. The APO Productivity Databook provides concise information and useful insights into the basis of growth performance and economic structure of Asian countries by presenting such long-term data analysis.
International comparisons of economic performance are never a precise science; instead, they are fraught with measurement and data comparability issues. Despite our best efforts in harmonizing data, some data uncertainty remains. Operating within a reality of data issues, some of the adjust-ments in the Databook are necessarily conjectural, while others are based on assumptions with scien-tific rigor. In addressing this shortcoming, findings drawn from the research are cross-referenced against other similar studies. However, the magnitude of variations in the economic indicators is often subject to a certain degree of data uncertainty.
Bearing in mind these caveats, the main findings from our analysis are as follows:
Recent economic growth of Asia
u In terms of exchange-rate-based GDP, China overtook Japan in 2010 as the largest economy in Asia and the second largest economy in the world, after the US. On this measure, Asia29 was 44% and 51% larger than the US and EU15 in 2011, respectively (Table 1).
u Based on GDP adjusted for purchasing power parity (PPP), the weight of the world economy is even more tilted toward Asia, with Asia29 being 98% and 113% larger than the US and EU15 in 2011, respectively. China has overtaken Japan as the largest Asian economy since 2002, and its size was 75% relative to that of the US in 2011. India was a close third in 2011 with its GDP using PPP very nearly catching up with that of Japan (Table 2 and Figure 5).
u During the period 2000–2011, Asia29 grew at 5.8% on average per annum, compared with 1.5% and 1.3% in the US and EU15, respectively. Japan was the slowest growing economy among the Asia29 at 0.6%, compared with 14 of the 29 Asian economies with a recorded over 5.0% of annual economic growth (Table 3 and Figure 1).
u For the past two decades (1990–2011), China and India have emerged as the driving force propel-ling Asia forward, accounting for 47% and 15% of regional growth, respectively (Figure 7).
u The global financial crisis slowed Asia29’s growth significantly from a recent peak of 8.0% during 2006–2007, to 4.5% during 2007–2008 and further to 3.6% during 2008–2009, before rebounding strongly to 7.9% during 2009–2010. This is in comparison to the deep recession of −3.1% and −4.4% experienced by the US and EU15, respectively, during 2008–2009 (Figure 1).
u The correlation coefficients between China and other Asian economies strengthened between the two decades suggest that China has become more integrated within the Asian economy. For most Asian countries, the correlation with the US and EU15 has also grown stronger (Figures 8 and 9).
©20
13 A
sian
Prod
uctiv
ity O
rgan
izat
ion

8
2 Overview
Catching up in per capita GDP
u Our results show the outcome of the dramatic development effort of the four Asian Tigers.4 Singa-pore and Hong Kong have managed to close a per capita GDP gap with the US of around 65% in just under four decades. Singapore has even surpassed the US since 2004, and in 2011 its per ca-pita GDP was 26% higher. In contrast, veteran Japan has fallen behind and its gap with the US has widened to 28%. In 2011, the ROC’s and Korea’s per capita GDP was 78% and 65% of the US level, respectively (Table 5 and Figure 14).
u Despite their rapid growth, per capita GDP of China and India was 17% and 7% that of the US in 2011, respectively, due to their population size. Even so, it represents a tenfold increase in China’s relative per capita GDP over the last four decades. The level achieved by Asia29 was 16% that of the US, indicating that there is ample room for catch-up (Table 5).
u Asia’s huge per capita GDP gap with the US is predominantly explained by its labor productivity gap. With the exception of the four Asian Tigers, Japan, and Iran, all Asian countries have a labor productivity gap of 50% or higher (Figure 18).
u For most countries in Asia, the majority of per capita GDP growth can be explained by improve-ment in labor productivity. However, the employment rate contribution relative to labor productiv-ity was also highly significant in Pakistan, Nepal, the Philippines, Bangladesh, Cambodia, and Iran (Figure 19).
u There is a large diversity in Asia’s employment rates from 30% to over 60% at present. The employ-ment rates have been rising in most countries in Asia and are 10–15 percentage points above that of the US in Cambodia, Singapore, Thailand, Vietnam, and China (Figure 21).
Changes in Demand composition
u With a few exceptions, household consumption is the biggest component of final demand. In re-cent years, Asia29’s consumption ratio has dropped to 50.1% of GDP, largely reflecting the trend in China. This compares with 71.2% in the US, 58.2% in EU15, and 54.1% in Australia (Table 7).
u The share of household consumption in GDP tends to be more volatile and falling in countries that are undergoing rapid development. As countries get richer, the household consumption share tends to rise. At the other end of the spectrum, countries with low income and a high dependent population (under-15s and over-65s) sustain a high consumption ratio to GDP (Figures 24 and 25).
u Overall, Asia invests more than the US/EU15 as a share of its GDP. Lately this wedge has been wid-ening. Historically, Australia’s investment share has been sandwiched between that of Asia and the US/EU15. In 2011, Asia29 invested 35% of its GDP, compared with 15.5% for the US, 18.8% for EU15, and 27.5% for Australia (Table 7 and Figure 31).
u China faces huge internal and external imbalances. The investment share of GDP (at 47.6%) as the biggest component in final demand and the household consumption share plummeted to 36.4% in 2011. In contrast, the weight of net exports has been rising in the past decade, although it is slackening in recent years due to weak foreign demand (Figure 22).
4: Refers to Hong Kong, Korea, Singapore, and the ROC.
©20
13 A
sian
Prod
uctiv
ity O
rgan
izat
ion

2
9
Overview
u GCC economies are unusually skewed toward net exports because of their oil. Net exports ac-counted for 26.9% of final demand in 2011, compared with Asia29’s 1.9% and China’s 2.6%. Only the US and South Asia run trade deficits of a more persistent nature, which accounted for −3.8% and −7.1% of final demand, respectively, in 2011 (Table 7).
u Basic necessities account for a high proportion of household consumption in lower-income coun-tries – the cross-country version of Engel’s Law, which says that basic necessities will account for a high proportion of household consumption for a lower per capita income group and vice versa. They spend 30–50% of total consumption for food, which corresponds to Japan’s experience in the 1950s and the 1960s (Figures 29 and 30).
u In the 2000s, investment recovered in the Asian economies and drove growth. For Singapore, Hong Kong, and the ROC, however, the strength of net exports was still the dominant force behind their economic growth. The growth slowed in the US and EU15, and the contributions of govern-ment consumption to growth nearly tripled as contributions from investment took a plunge (Figures 34 and 38).
Labor Productivity
u For most Asian countries, the per capita GDP gap with the US is largely explained by their labor productivity shortfalls of 80% or more against the US level. Only Singapore and Hong Kong have effectively closed that gap. The relative labor productivity of Asia23 was 15% that of the US in 2011 (Table 8 and Figure 39).
u Growth of per-worker GDP in Asia has outstripped that in the US, allowing catch-up. In particular, the low-income countries appeared to experience a labor productivity growth spurt in the 2000s. China achieved the fastest labor productivity growth of 10.2% on average per year in 2005–2011, followed by India’s 7.7% – this compares with the US’s 1.3%. Singapore’s 0.4% growth over the same period was the weakest performance among the Asian Tigers and Japan (Table 9 and Figure 41).
u The productivity gap based on GDP per hour is generally wider between Asian countries and the US. While the adjustments are negligible for most Asian countries, the productivity gap signifi-cantly widened by 16–27 percentage points for the Asian Tigers, suggesting that people work much longer hours than in the US (Figure 42).
u Most Asian countries experience faster growth in GDP per hour than the US. Among them, China’s performance is the most outstanding, with average annual productivity growth doubling from 4.3% to 9.1% between 1970–1990 and 1990–2011, compared to that of the US at 1.5% and 1.8% over the same periods (Figure 44).
u Mapped onto Japan’s historical trajectory of GDP per hour, most Asian countries cluster around the level that Japan achieved in the 1950s and 1960s, with the Asian Tigers being the clear front-runners, sprinting away from the pack. This indicates that most Asian countries are still half a century away from catching up with Japan (Figure 46).
©20
13 A
sian
Prod
uctiv
ity O
rgan
izat
ion

10
2 Overview
Total factor productivity
u Ten of the 17 Asian countries compared experienced faster TFP growth than the US over the period 1970–2011, with China in a league of its own. Its TFP growth was at 3.2% on average a year, com-pared with that of Sri Lanka at 1.9% in second place and Thailand at 1.8% in third place and that of the US at 0.9%. With TFP growing at 0.6% on average per year, Singapore’s productivity perfor-mance has been weak relative to its economic counterparts (Figure 48).
u Over the past four decades, economic growth in Asia has been predominantly explained by the contribution of capital input, but the role of TFP growth should not be underestimated. Its contri-bution accounted for over 20% of economic growth in ten of the 17 Asian countries compared, with it being most prominent in Sri Lanka (39%), China (36%), Thailand (33%), and Hong Kong (30%) (Figure 50).
u The composition of economic growth is shifting over time. In the past two decades, the contribu-tion of capital input (especially of non-IT capital) has been getting progressively smaller in Asia, falling to a share of below 50% on average, while the contribution of TFP is getting progressively more significant, rising to a share of above 40% on average in the 2000s (Figure 52).
u The evident rise in the contribution of information technology (IT) capital is noteworthy. By the 2000s, it had risen to above 5% in most Asian countries compared, while accounting for around one-third of economic growth in Japan and the US. The allocation shift towards IT capital started two decades earlier in the US than in any Asian country (Figures 52 and 55).
u Widening our perspective to include other Organisation for Economic Co-operation and Develop-ment (OECD) countries shows that Asia’s vibrant economic growth and TFP performance in the 2000s was unmatched by any other country, except Ireland (Figure 53).
u Over the past decades, it has been observable that economic growth has decelerated in the early starters (i.e., Japan and the Asian Tigers). Their experience lends support to the likelihood of an eventual slowdown in China; the question is more likely to be “when”, rather than “if”. TFP growth slowed from its former peaks achieved in the late 1970s or early 1980s until recent years when countries experienced TFP resurgence (Figure 54).
Capital Deepening and Capital Productivity
u Capital deepening appears to be an accompanying process of rapid economic development. The early starters (i.e., Japan and the Asian Tigers) underwent more rapid capital deepening in the ini-tial period whereas the reverse is true for the currently emerging Asian economies. For example, the rise in capital–labor ratio decelerated from 10.2% on average a year to 7.4% in Korea between 1970–1990 and 1990–2012, whereas it doubled in China from 5.2% to 10.5% (Figure 58).
u Capital deepening tends to go hand in hand with deterioration in capital productivity. China’s perfor-mance is particularly impressive as its acceleration in capital deepening over the past two decades did not compromise its capital productivity as much as the early starters in the early period (Figure 59).
u Over a long period stretching four decades, a downward trend in labor productivity growth can be seen among the early starters, but there is a step up in China and India. Singapore’s productivity performance, albeit robust compared with other mature economies like the US, has been very modest against its Asian counterparts (Figure 66).
©20
13 A
sian
Prod
uctiv
ity O
rgan
izat
ion

2
11
Overview
Industry structure
u Evidence supports the view that a country’s industry structure transforms with its economic devel-opment. There is a broad negative correlation between the share of agriculture in total GDP and per capita GDP. Finance, real estate, and business activities increase in weight as countries move up income levels, whereas mining is the sector that defines the oil-exporting countries (Figure 67).
u Manufacturing is a significant sector, accounting for over 20% of total value added in most Asian economies. It is particularly prominent in China, Thailand, Korea, Malaysia, and the ROC. Asian manufacturing is dominated by machinery and equipment in the richer Asian economies while their poorer counterparts concentrate on light manufacturing such as textiles and the food indus-try (Figure 68).
u While Asian countries are diversifying away from agriculture, the sector still dominates employ-ment, accounting for 41% of total employment in 2009 for Asia29, down from 62% in 1980. Its share in total value added rose from 6% to 10% over the same period, implying more labor effi-ciency. However, it is still the only sector that consistently has a disproportionately higher employ-ment share than justified by its value-added share. Shifting out of agriculture into more efficient sectors will boost economy-wide productivity (Figures 69 and 72).
u Manufacturing is a main absorption sector for workers who have been displaced from the agricul-ture sector, especially in the initial stages of economic development. In Korea and ROC, expansions to manufacturing output could account for the increases of employment in the 1970s and the 1980s. Since the 1990s, however, the manufacturing sector has no longer been an absorption sec-tor of employment, regardless of the sound expansion of production in this sector. (Figure 74).
Industry origins of economic growth
u Our results support the observation that China and India have taken different development paths, with the former relying more on the traditional growth engine of manufacturing and the latter on services. In the past two and a half decades China has been undergoing a slight transition, with its growth shifting away from being manufacturing-driven to being more services-driven. In the period 2000–2010, the contributions to economic growth by manufacturing and services were 35% and 44%, respectively, compared with 46% and 29% in the first half of the 1990s (Figures 75 and 76).
u In contrast, growth in India has always been more driven by services, the contribution of which rose from 51% in the late 1980s to 63% in the 2000s, while manufacturing usually contributes one-fifth or less (Figures 75 and 77).
u A total of 29% of Asia29’s regional growth originated from the expansion of manufacturing in the 2000s, two-thirds of which was accounted for by China. In other words, China’s manufacturing alone contributed 18% to regional growth (Figure 81).
u While the importance of manufacturing as a contributor to overall labor productivity growth has never waned in some countries (Korea, the ROC, China, and Thailand), services were contributing at least one-third or more in most Asian countries compared with the 2000s. Manufacturing has never been a major contributor in India in its recent development process, or in Hong Kong and Sri Lanka in the 2000s (Table 16 and Figure 85).
©20
13 A
sian
Prod
uctiv
ity O
rgan
izat
ion

12
2 Overview
Real income and terms of trade
u Real GDP could systematically underestimate (or overestimate) growth in real income if terms of trade improve (or deteriorate). It is generally observed that the trading gain effect is more signifi-cant in the short term than in the long term. Our findings confirm this observation, with the excep-tions being for some oil-exporting countries such as Kuwait and Brunei, where trading gain has always been positive and significant. Our results also reflect Australia’s recent fortune and trading gain as the prices of their commodity exports rise and their import prices continue to fall over the past decade or so (Table 17 and Figure 93).
u Positive net primary income from abroad also bolsters a country’s real income. In Japan and the Philippines, net primary income from abroad has been rising steadily, albeit at different magni-tudes. In Japan, it rose from 0.6% of GDP in 1990 to 3.1% in 2011, compared with 1.4% in 1990 and 32.3% in 2011 in the Philippines. Singapore’s historical margin fluctuates within a large range when compared with other rich economies – from +1.9% in 1997 to −7.1% in 2004, but on the whole, it has been more negative than positive (Figure 87).
u Our results show that for most countries studied, the difference between growth of real GDP and real income (reflecting the combined effect of trading gain and net primary income from abroad) was within the margin of ±20% over the long period 1970–2011; Kuwait and Brunei appear to be the outliers (Figure 88).
u The five countries that have been enjoying a trading gain over 1% per annum are all oil-exporting countries. Among them, only Iran managed to achieve a positive growth in labor productivity. In contrast, export-oriented, high productivity Asian countries have been facing a deteriorating trad-ing gain position as a price of their own success (Figure 94).
Asia is a diverse regional economy within which countries have embarked on their own journey of economic development at different times and different paces. As shown by our analysis, nearly all countries are making concerted efforts to move away from agriculture and accumulate capital in or-der to improve their growth potential and catch up with the West. Their efforts are yielding results beyond just impressive growth rates. The evidence gained from our research confirms that countries’ capital accumulation is accompanied by strong productivity improvements. Through the statistics and data presented in this report, one manages to catch a glimpse of the current unparalleled economic dynamics inherent in the region. China, in particular, has been rising in world economic rankings, having overtaken Germany in 2009 as the largest exporter and Japan in 2010 as the second-largest economy. Growth in India has also received a sudden spur in recent years. As the rich economies lumber on, heavily laden with debt (to the point of crisis in some) and associated difficulties, this may well prove to be an opportunity for Asia to consolidate its development achievements further.
©20
13 A
sian
Prod
uctiv
ity O
rgan
izat
ion

3
13
3.1 Economic Scale and Growth
In the past two decades, a consistent divergence has been observed in the growth performance be-tween Asia and the West. With the exception of the years adversely affected by the Asian financial crisis (i.e., 1997–1999), Asia29 has been growing faster than the US and EU15 by more than 3 to 4 per-centage points on average a year, respectively (Figure 1). Furthermore, this wedge has been widening in recent years; at the height of the global financial storm (i.e., 2009), the growth differentials were 6.9 and 8.0 percentage points against the US and EU15, respectively. In 2010, major economies rebound-ed strongly on the back of their simultaneous large-scale fiscal stimulus package before growth slowed again in 2011. Throughout this turbulent period, the differences in growth performance have been sustained. It is therefore no surprise that the center of gravity in the global economy is gradually shifting toward Asia. In 2011, the Asian economy contributed two-fifths of world output (38% for
3 Growth of Asian Economy
Asia29), compared with the US and EU27, each accounting for a one-fifth share (Figure 2). The Interna-tional Monetary Fund (IMF) (2013) projects that the Asian share in world output will continue to rise, reaching 46% (43% for Asia29) by 2018. In contrast, the US and EU27 will shrink by a similar extent to 18%, and 17%, respectively (14% for EU15). With the exception of the US, which has recently shown encouraging signs of moving away from the pack, most of the advanced econo-mies have been much weakened following the recent financial crisis; the fortune of the world economy is therefore increasingly tied to that of Asia’s. To better understand the dy-namics of the long-term economic growth within the region, the remain-der of this chapter looks into the details of countries’ diverse devel-opment efforts and achievements since the 1970s, through cross-country level comparisons of GDP and other related performance indi-cators.5 To facilitate international
5: The database used in the Databook series includes author adjustments made to better harmonize GDP coverage across coun-tries. GDP reported in this edition includes the final consumption of financial intermediation services indirectly measured (FISIM). Although our database mainly follows the 1993 SNA, the current decision to exclude investment of valuables and to include soft-ware investment and final consumption of FISIM is detailed in Appendix 1. The Databook 2013 reflects some large revisions pub-lished by national statistical offices in 2012 and in the first quarter of 2013. More specifically, at the end of 2011, Thailand officially switched to the 1993 SNA, and its national accounts became compatible with the 1993 framework for the first time. To construct the long time-series data in this report, back data based on the 1968 SNA has been adjusted to be consistent with the new series. (For example, government consumption in the new series includes consumption of fixed capital (CFC) owned by the government since 1990. Government capital stock and its CFC for the period 1970–1989 are estimated and the past government consumption and GDP are adjusted accordingly.) There are also some revisions to the data, largely results of national accounts revisions includ-ing backward amendment and/or benchmark revisions.
10%
8
6
4
2
Japan US
EU15Asia29
1975 1980 1985 1990 1995 2000 2005 20101970
−2
−4
−6
0
Figure 1 GDP Growth of Asia, the EU, Japan, and the US, 1970–2011___Annual growth rate of GDP at constant market prices
Sources: Official national accounts in each country, including author adjustments.
ASIA40 %
ASIA46 %
2011 2018
EU2720 %
EU2717 %
Others21 %
Others20 %
US19 %
US18 %
EU1518 %
Asia2938 %
APO2021 %
EU1514 %
Asia2943 %
APO2021 %
Other Asia 3%
Other Asia 3%
Figure 2 Share of Asia in World GDP in 2011 and Projec-tion for 2018___Share of GDP using constant PPP
Source: IMF, World Economic Outlook Database, April 2013.
©20
13 A
sian
Prod
uctiv
ity O
rgan
izat
ion

14
3 Growth of Asian Economy
level comparisons, harmonized GDP for each of the individual countries6 is expressed in its equivalent in a common currency unit (customarily in the US dollar), using a set of conversion rates between the individual national currencies. The choices for conversion rates are exchange rates and PPPs.
3.1 Economic Scale and Growth
Table 1 provides snapshot-level comparisons of Asian countries, based on GDP at current market prices using exchange rates,7 for the six separate years of 1970, 1980, 1990, 2000, 2010, and 2011. By
Table 1 Cross-Country Comparison of GDP using Exchange Rate, 1970, 1980, 1990, 2000, 2010, and 2011___GDP at current market prices, using annual average exchange rate
Unit: Billions of US dollars. Sources: Official national accounts in each country, including author adjustments.Note: See Appendix 1 for the adjustments made to harmonize GDP coverage across countries.
JapanChinaIndiaPakistanIranIndonesiaBangladeshKoreaPhilippinesThailandROCSaudiArabiaMalaysiaHongKongKuwaitMyanmarSriLankaSingaporeVietnamUAENepalCambodiaQatarBahrainOmanFijiBruneiMongolia
(regrouped)
APO20Asia23Asia29EastAsiaSouthAsiaASEANGCC(reference)
USEU15
AustraliaTurkey
209926112111010
977654433321111100000
357451462319
863510
1,0381,194
4525
100.043.929.0
5.85.44.84.74.33.53.52.82.41.91.81.41.31.20.90.60.50.50.40.30.20.10.10.10.1
171.2216.5221.4152.8
41.316.9
4.9
497.9572.6
21.611.8
ChinaJapanIndiaKoreaIndonesiaSaudiArabiaIranROCThailandUAEMalaysiaSingaporeHongKongPhilippinesPakistanQatarKuwaitVietnamBangladeshOmanSriLankaMyanmarBahrainNepalBruneiCambodiaMongoliaLaoPDRFiji(regrouped)
APO20Asia23Asia29EastAsiaSouthAsiaASEANGCC(reference)
USEU15EU27AustraliaTurkey
7,3185,9101,8511,114
858689657464365345278266244224211175164125108
73595629211713
984
12,79120,18221,65815,060
2,2512,2101,476
15,07614,34616,465
1,505778
100.080.825.315.211.7
9.49.06.35.04.73.83.63.33.12.92.42.21.71.51.00.80.80.40.30.20.20.10.10.1
174.8275.8295.9205.8
30.830.220.2
206.0196.0225.0
20.610.6
ChinaJapanIndiaKoreaIndonesiaSaudiArabiaIranROCThailandUAEMalaysiaSingaporeHongKongPhilippinesPakistanQatarKuwaitVietnamBangladeshOmanSriLankaMyanmarBahrainNepalBruneiCambodiaLaoPDRMongoliaFiji(regrouped)
APO20Asia23Asia29EastAsiaSouthAsiaASEANGCC(reference)
USEU15EU27AustraliaTurkey
5,9315,5081,6511,015
719542467428338290238232224199176129123108101
59504226191411
763
11,49917,48618,65513,112
1,9961,9081,169
14,49913,94215,941
1,274734
100.092.927.817.112.1
9.17.97.25.74.94.03.93.83.43.02.22.11.81.71.00.80.70.40.30.20.20.10.10.1
193.9294.8314.6221.1
33.732.219.7
244.5235.1268.8
21.512.4
JapanChinaKoreaIndiaROCSaudiArabiaHongKongIndonesiaThailandIranUAESingaporeMalaysiaPhilippinesPakistanBangladeshKuwaitVietnamOmanQatarSriLankaBahrainMyanmarNepalBruneiCambodiaFijiLaoPDRMongolia(regrouped)
APO20Asia23Asia29EastAsiaSouthAsiaASEANGCC(reference)
USEU15EU27AustraliaTurkey
4,7411,198
533468326194169168126110105
94948172463831201817
87664221
7,0918,3028,6866,969
609613384
9,9529,541
10,585407267
100.025.311.3
9.96.94.13.63.52.72.32.22.02.01.71.51.00.80.70.40.40.40.20.20.10.10.10.00.00.0
149.6175.1183.2147.0
12.812.9
8.1
209.9201.3223.3
8.65.6
JapanChinaIndiaKoreaROCIndonesiaSaudiArabiaIranThailandHongKongUAEPhilippinesPakistanMalaysiaSingaporeBangladeshKuwaitOmanSriLankaQatarVietnamMyanmarBahrainNepalBruneiCambodiaFijiMongoliaLaoPDR(regrouped)
APO20Asia23Asia29EastAsiaSouthAsiaASEANGCC(reference)
USEU15
AustraliaTurkey
3,103390322270165127120
9488775149484539291912
87755432111
4,4814,8805,0944,006
412366214
5,8016,160
323200
100.012.610.4
8.75.34.13.93.02.82.51.61.61.51.51.30.90.60.40.30.20.20.20.10.10.10.10.00.00.0
144.4157.3164.2129.1
13.311.8
6.9
186.9198.5
10.46.4
JapanChinaIndiaSaudiArabiaIranIndonesiaKoreaUAEROCPhilippinesThailandKuwaitHongKongPakistanMalaysiaBangladeshSingaporeQatarOmanMyanmarBruneiSriLankaBahrainNepalFijiVietnamCambodiaMongolia
(regrouped)
APO20Asia23Asia29EastAsiaSouthAsiaASEANGCC(reference)
USEU15
AustraliaTurkey
1,087303182148
97806444423633302929251912
86654331110
1,7452,0592,2991,526
237198239
2,7883,200
17391
100.027.916.813.6
8.97.35.94.03.93.33.12.72.72.72.31.71.10.70.60.50.50.40.30.20.10.10.10.0
160.6189.5211.6140.4
21.818.322.0
256.6294.5
15.98.3
1970 (%) 1980 (%) 1990 (%) 2000 (%) 2010 (%) 2011 (%)
©20
13 A
sian
Prod
uctiv
ity O
rgan
izat
ion

3
15
3.1 Economic Scale and Growth
6: Appendix 1 discusses the extent to which countries’ GDP data are comparable. 7: The exchange rates used in this Databook are the adjusted rates, which are called the Analysis of Main Aggregate (UNSD data-
base) rates in the UN Statistics Division’s National Accounts Main Aggregate Database. The AMA rates coincide with the IMF rates (which are mostly the annual average of market or official exchange rates) except for some periods in countries with official fixed exchange rates and high inflation, when there could be a serious disparity between real GDP growth and growth converted to US dollars based on IMF rates. In such cases, the AMA adjusts the IMF-based rates by multiplying the growth rate of the GDP deflator relative to that of the US.
8: It is therefore important to note that any international GDP comparisons are sensitive not only to revisions in national accounts but also to revisions in multilateral PPPs. Results presented in this edition are based on the PPP estimates of the 2005 International Comparisons Program benchmarking round.
this measure, Japan had been the largest economy in Asia until 2010 when China finally overtook Japan’s position to become the second-largest economy in the world after the US. Japan clearly surged ahead strongly between the 1970 and 1990 comparisons, dwarfing the relative size of all other Asian economies and reducing the US lead from five times to less than two times its economy. The turn of Japan’s fortune came in 1990, when the country’s bubble years of the late 1980s ended and its descent began. Thereafter, stagnation in Japan combined with vibrant growth in developing Asia has resulted in the rapid erosion of Japan’s prominence in the regional economy. On this measure, Asia29 was 44% and 51% larger than the US and EU15 in 2011, respectively.
Comparisons based on exchange rates could appear arbitrary as movements in exchange rates can be volatile and subject to short-term or substantial fluctuations of speculative capital flows and govern-ment intervention. Furthermore, comparisons based on exchange rates typically underestimate the size of a developing economy and in turn the perceived welfare of its residents. The rankings of scale of economy change dramatically when international price differences are properly accounted for. This is because exchange rates embody the trade sector bias (i.e., is more influenced by the prices of traded than non-traded goods and services) and thus do not necessarily succeed in correcting the price differentials among coun-tries. As developing economies tend to have relatively lower wages and, in turn, lower prices for non-traded goods and services, a unit of local currency has greater purchasing power in the local economy than reflected in its exchange rate.
Figure 3 shows the extent to which the exchange rates have failed to reflect countries’ price differentials properly relative to the US. With the exception of Japan and Austra-lia, exchange rates systematically under-represent the relative purchasing power for all the countries covered in this report. The underestimation is substantial for some, ranging from 15% for Fiji to 76% for Myanmar. Thus, the exchange-rate-based GDP considerably underestimates the economic scales in real terms for those countries. By taking into account the international price differentials, PPP rectifies the trade sector bias, and in turn the relative size of economies can be more adequately measured.8
Table 2 repeats the same snapshot level comparisons of Asian countries as in Table 1 but is based on GDP at con-stant market prices using constant PPPs for Asian countries. By correcting to allow for international price differentials,
Figure 3 Relative Prices of GDP, 2005___Ratio of PPP to exchange rate (reference country=US)
Sources: Analysis of Main Aggregate rates by United Nations Statistics Division (UNSD) and PPP by World Bank.
−72
−70−69−68−68−67−65−65−65
−61−60−59−58
−54−46
−40−40−38−35−34−34−34
−27−27−25−23
−15
−72−76−76
−70−70−70
−69−68−68−67−65−65−65
−61−60−59−58
−54−46
−40−40−38−35−34−34−34
−27−27−25−23
−156
18
20%−80 −60 −40 −20 0
JapanAustraliaFijiKoreaQatarKuwaitHong KongUAEBahrainSaudi ArabiaSingaporeTurkeyOmanROCBruneiMalaysiaChinaIndonesiaThailandPhilippinesBangladeshSri LankaMongoliaIndiaPakistanNepalCambodiaIranVietnamLao PDRMyanmar
©20
13 A
sian
Prod
uctiv
ity O
rgan
izat
ion

16
3 Growth of Asian Economy
Asia29 has been expanding rapidly, and was 98%, instead of 44%, larger than the US economy in 2011, having overtaken it in 1988 (Figure 4). East Asia (China, the ROC, Hong Kong, Japan, Korea, and Mon-golia) caught up with the US in 2008 from a low base of 42% in 1970. In contrast, EU15 has been expe-riencing a gradual relative decline in economic size, from 116% of the US economy in 1970 to a low of 93% in 2011. Based on the GDP using constant PPPs, the weight of the world economy is even more tilted toward Asia than portrayed by GDP using exchange rates. This reflects the fact that nearly all Asian countries increase in relative size after international price differentials have been properly ac-counted for. The relative size of China’s economy in 2011 doubled to 253% that of Japan, compared with 124% when exchange rates are used in Table 1. Similarly, its size in 2011 increased from 49% to
Table 2 Cross-Country Comparison of GDP using PPP, 1970, 1980, 1990, 2000, 2010, and 2011___GDP at constant market prices, using 2005 PPP, reference year 2010
Unit: Billions of US dollars (as of 2010). Sources: Official national accounts in each country, including author adjustments.Note: See Appendix 1 for the adjustments made to harmonize GDP coverage across countries.
1970JapanIndiaChinaIranSaudiArabiaIndonesiaKoreaPhilippinesKuwaitPakistanThailandROCBangladeshHongKongMalaysiaVietnamSingaporeSriLankaQatarMyanmarUAEBruneiOmanBahrainMongoliaFiji
(regrouped)
APO20Asia23Asia29EastAsiaSouthAsiaASEANGCC(reference)
USEU15
AustraliaTurkey
1,501485312215140100
87838170645857333330171512
9775521
2,8523,1803,4291,994
627343249
4,7355,501
260196
100.032.320.814.3
9.36.75.85.55.44.64.33.93.82.22.22.01.11.00.80.60.50.50.30.30.10.1
190.0211.8228.4132.8
41.822.816.6
315.4366.4
17.313.0
2011ChinaJapanIndiaKoreaIndonesiaIranROCSaudiArabiaThailandPakistanMalaysiaPhilippinesUAEHongKongSingaporeVietnamBangladeshQatarKuwaitSriLankaMyanmarOmanNepalBahrainCambodiaBruneiLaoPDRMongoliaFiji(regrouped)
APO20Asia23Asia29EastAsiaSouthAsiaASEANGCC(reference)
USEU15EU27AustraliaTurkey
11,0704,3734,2751,5221,1191,098
858679635481439382364344310297264172141115
9980423433201713
4
16,62327,81129,28018,180
5,1783,3511,469
14,76113,74515,586
9321,105
100.039.538.613.810.1
9.97.86.15.74.34.03.53.33.12.82.72.41.61.31.00.90.70.40.30.30.20.20.10.0
150.2251.2264.5164.2
46.830.313.3
133.3124.2140.8
8.410.0
2010ChinaJapanIndiaKoreaIndonesiaIranROCSaudiArabiaThailandPakistanMalaysiaPhilippinesUAEHongKongSingaporeVietnamBangladeshQatarKuwaitSriLankaMyanmarOmanNepalBahrainCambodiaBruneiLaoPDRMongoliaFiji(regrouped)
APO20Asia23Asia29EastAsiaSouthAsiaASEANGCC(reference)
USEU15EU27AustraliaTurkey
10,1284,3984,0451,4681,0501,047
825634632468417368348327295281248152132106
9380413331191611
4
16,07826,31927,69917,158
4,9073,2031,379
14,49913,56315,350
9011,018
100.043.439.914.510.410.3
8.16.36.24.64.13.63.43.22.92.82.41.51.31.00.90.80.40.30.30.20.20.10.0
158.7259.9273.5169.4
48.431.613.6
143.2133.9151.6
8.910.1
2000JapanChinaIndiaKoreaIndonesiaIranROCSaudiArabiaThailandPakistanMalaysiaUAEPhilippinesHongKongSingaporeBangladeshVietnamKuwaitSriLankaOmanQatarMyanmarNepalBahrainBruneiCambodiaLaoPDRMongoliaFiji(regrouped)
APO20Asia23Asia29EastAsiaSouthAsiaASEANGCC(reference)
USEU15EU27AustraliaTurkey
4,0763,7381,937
977631573565455405299266235231220170140139
876449443028191714
864
10,75314,53815,427
9,5822,4681,911
889
12,44911,96013,365
666695
100.091.747.524.015.514.113.911.2
9.97.36.55.85.75.44.23.43.42.11.61.21.10.70.70.50.40.40.20.10.1
263.8356.7378.5235.1
60.546.921.8
305.4293.4327.9
16.317.1
1990JapanChinaIndiaKoreaIndonesiaIranSaudiArabiaROCThailandPakistanPhilippinesHongKongUAEMalaysiaBangladeshSingaporeVietnamKuwaitSriLankaOmanQatarNepalMyanmarBruneiBahrainCambodiaMongoliaLaoPDRFiji(regrouped)
APO20Asia23Asia29EastAsiaSouthAsiaASEANGCC(reference)
USEU15
AustraliaTurkey
3,6441,3861,128
519415388347308260203173150143132
8885675038322317151312
7543
7,6369,0509,6566,0131,4741,172
606
8,9099,551
470484
100.038.031.014.211.410.6
9.58.57.15.64.84.13.93.62.42.31.81.41.00.90.60.50.40.40.30.20.10.10.1
209.5248.4265.0165.0
40.532.216.6
244.5262.1
12.913.3
1980JapanIndiaChinaSaudiArabiaIranIndonesiaKoreaROCPhilippinesUAEThailandPakistanHongKongMalaysiaKuwaitBangladeshSingaporeVietnamSriLankaQatarBruneiOmanMyanmarNepalBahrainMongoliaFiji
(regrouped)
APO20Asia23Asia29EastAsiaSouthAsiaASEANGCC(reference)
USEU15
AustraliaTurkey
2,316654571369299225205148147140122111
78726562403925201814131110
32
4,5625,1635,7813,322
864676618
6,4757,510
349291
100.028.224.615.912.9
9.78.96.46.46.05.34.83.43.12.82.71.71.71.10.90.80.60.60.50.40.10.1
196.9222.9249.6143.4
37.329.226.7
279.6324.2
15.112.6
(%) (%) (%) (%) (%) (%)
©20
13 A
sian
Prod
uctiv
ity O
rgan
izat
ion

3
17
3.1 Economic Scale and Growth
75% relative to the US economy. In this measure, China overtook Japan after 2002 to become the leading economy in Asia (Figure 5). This repre-sents remarkable growth, considering that the Chinese economy was only 21% that of Japan and 64% that of India in 1970. India has also nearly caught up with Japan, with its relative size having increased from 32% in 1970 to 98% in 2011. If India and Japan were to grow at the same pace as they have been on average be-tween 2000–2011, (i.e., at 7.2% and 0.6% a year, respectively), India might already overtake Ja-pan and become the second largest economy in Asia and the third largest economy in the world in 2012. Assuming that China and the US also grow at the same pace as they have displayed during the same period, the total GDP of the three largest Asian countries alone will be about 50% larger than the US economy by 2014.
9: GCC consists of Bahrain, Kuwait, Oman, Qatar, Saudi Arabia, and the UAE. These GCC countries display economic characteristics very different from those of other Asian economies due to their preponderant reliance on the oil and energy sector. Together, these countries account for about 45% of the world’s proven oil reserves and 25% of crude oil exports, and possess at least 17% of the proven global natural gas reserves.
40
60
80
100
120
140
160
180
1970 1975 1980 1985 1990 1995 2000 2005 2010
EU15
US
Asia29
APO20East Asia
200US=100
Figure 4 Regional GDP of Asia and the EU Relative to the US, 1970–2011___Indices of GDP at constant market prices, using 2005 PPP
Sources: Official national accounts in each country, including au-thor adjustments.
Figure 5 GDP of China, India, and Japan, 1970–2011___Indices of GDP at constant market prices, using 2005 PPP
Sources: Official national accounts in each country, including au-thor adjustments.
1970 1975 1980 1985 1990 1995 2000 2005 20100
10
20
30
40
50
60
70
China
Japan
India
80US=100
1970 1975 1980 1985 1990 1995 2000 2005 20100
5
10
15
20
25
30
GCC
ASEANSouth Asia
35US=100
Figure 6 Regional GDP of South Asia, ASEAN, and GCC, 1970–2011___Indices of GDP at constant market prices, using 2005 PPP
Sources: Official national accounts in each country, including au-thor adjustments.
Figure 6 shows the rapid expansion of the relative size of the South Asia economy (consisting of Ban-gladesh, India, Nepal, Pakistan, and Sri Lanka), 83% of which was accounted for by India in 2011. The catch-up effort of ASEAN has also been vigorous, but the setback caused by the Asian financial crisis of 1997–1998 is clearly visible. This partly explains why the ASEAN economy has fallen behind the re-gional economy of South Asia. In contrast, the progress of GCC9 countries flagged for two decades; only in the past decade has it picked up slightly and brought the relative size of the country group back to its previous peak of the early 1980s.10
©20
13 A
sian
Prod
uctiv
ity O
rgan
izat
ion

18
3 Growth of Asian Economy
Table 3 GDP Growth, 1990–1995, 1995–2000, 2000–2005, and 2005–2011___Average annual growth rate of GDP at constant market prices
Unit: Percentage. Sources: Official national accounts in each country, including author adjustments.Note: See Appendix 1 for the adjustments made to harmonize GDP coverage across countries.
1990–1995 1995–2000 2000–2005 2005–2011ChinaMalaysiaKuwaitSingaporeThailandVietnamKoreaIndonesiaROCCambodiaLaoPDROmanMyanmarBahrainSriLankaIndiaHongKongNepalPakistanBangladeshIranUAEBruneiSaudiArabiaFijiQatarPhilippinesJapanMongolia(regrouped)
APO20Asia23Asia29EastAsiaSouthAsiaASEANGCC(reference)
USEU15
AustraliaTurkey
QatarChinaMyanmarCambodiaVietnamUAELaoPDRIndiaSingaporeROCBangladeshKoreaSriLankaNepalMalaysiaBahrainIranMongoliaPhilippinesPakistanOmanHongKongSaudiArabiaKuwaitFijiBruneiJapanIndonesiaThailand(regrouped)
APO20Asia23Asia29EastAsiaSouthAsiaASEANGCC(reference)
USEU15EU27AustraliaTurkey
MyanmarChinaCambodiaQatarVietnamKuwaitIranIndiaMongoliaLaoPDRBahrainUAEThailandBangladeshPakistanSingaporeMalaysiaIndonesiaPhilippinesKoreaHongKongSriLankaSaudiArabiaROCNepalOmanBruneiFijiJapan(regrouped)
APO20Asia23Asia29EastAsiaSouthAsiaASEANGCC(reference)
USEU15EU27AustraliaTurkey
QatarChinaMyanmarMongoliaLaoPDRIndiaVietnamCambodiaSriLankaBangladeshSingaporeIndonesiaOmanIranBahrainPhilippinesMalaysiaNepalHongKongROCPakistanKoreaSaudiArabiaThailandUAEKuwaitBruneiFijiJapan(regrouped)
APO20Asia23Asia29EastAsiaSouthAsiaASEANGCC(reference)
USEU15EU27AustraliaTurkey
11.69.29.28.28.27.97.67.67.06.66.25.75.75.35.35.15.14.94.64.33.73.63.12.82.72.32.21.4
−1.8
4.05.35.25.15.07.23.8
2.51.6
3.23.2
10.68.38.07.06.76.36.05.75.65.15.15.14.94.84.84.24.13.63.53.23.22.62.62.12.01.40.80.80.7
2.94.14.14.25.32.63.9
4.22.82.83.84.1
12.19.39.08.17.37.26.86.66.36.25.95.45.35.34.94.74.64.64.54.44.14.03.83.53.13.12.12.01.2
3.95.45.45.26.25.14.8
2.41.81.93.44.5
15.910.3
9.87.97.87.76.66.66.56.16.15.75.65.24.84.74.54.54.04.03.93.73.53.02.82.01.00.50.2
4.06.36.26.37.25.14.4
0.90.81.02.84.0
1990–2011 2000–2011ChinaQatarMyanmarCambodiaVietnamLaoPDRIndiaSingaporeMalaysiaBangladeshSriLankaKoreaBahrainKuwaitIranROCIndonesiaOmanUAENepalThailandMongoliaPakistanHongKongPhilippinesSaudiArabiaBruneiFijiJapan(regrouped)
APO20Asia23Asia29EastAsiaSouthAsiaASEANGCC(reference)
USEU15EU27AustraliaTurkey
QatarMyanmarChinaCambodiaIndiaMongoliaLaoPDRVietnamIranBangladeshSingaporeSriLankaBahrainIndonesiaPhilippinesMalaysiaOmanKuwaitPakistanThailandHongKongKoreaUAENepalROCSaudiArabiaBruneiFijiJapan(regrouped)
APO20Asia23Asia29EastAsiaSouthAsiaASEANGCC(reference)
USEU15EU27AustraliaTurkey
9.99.68.97.37.16.66.36.15.75.25.25.15.15.05.04.94.74.54.44.34.24.24.13.93.83.21.81.70.9
3.75.35.35.36.05.04.2
2.41.71.83.33.9
12.410.9
9.97.77.27.27.16.95.95.85.55.35.35.24.64.64.54.34.34.14.04.04.03.93.83.61.51.20.6
4.05.95.85.86.75.14.6
1.51.31.43.14.2
Countries’ relative performance is also transformed when economic growth is used as the yardstick. Table 3 presents cross-country comparisons of real GDP growth in Asia, covering the 1990s and 2000s.11 The rankings vary from period to period and are no longer dominated by the economic
10: In interpreting the results in this report, one must bear in mind that conventional GDP tends to overstate the income of these oil-exporting countries since it does not account for the depletion of natural resource stock, and in turn a large part of their GDP may not be sustainable. Besides, GDP growth can underestimate the growth of real income available to the country brought about by a favorable change in terms of trade, and vice versa. For an oil-exporting country, the growth wedge of the two measures could be significant in the face of volatile oil prices. See Chapter 7.
©20
13 A
sian
Prod
uctiv
ity O
rgan
izat
ion

3
19
3.1 Economic Scale and Growth
gence of growth performance between the Asian countries on the one hand and the US and EU15 on the other was even more pronounced when looking at 2000–2011 (i.e., Asia29’s 5.8% compared with the US at 1.5% and EU15 at 1.3%). The change of guards in Asia is clearly illustrated in Figure 7. While Japan were the standard-bearers in yesteryears, China and India have emerged as the driving force propelling Asia forward over the past two decades (1990–2011) and accounting for 47% and 15% of regional growth, respectively. Despite being the slowest growing economy in Asia, Japan has remained the fourth larg-est contributor to regional growth in 1990–2011 due to its size.
Looking at the four sub-periods (in Table 3), growth in the reference countries, namely the US, EU15, and Australia, revived between 1990–2000, before it began to deteriorate in the subsequent two pe-riods in the 2000s. Both the US and EU15 went through deep recession in 2009, following the global financial storm. Consequently, for the second half of the 2000s (2005–2011), the US managed a growth of only 0.9% whereas EU15 achieved only 0.8%. In contrast, growth in Asia has gone from strength to strength, with a blip in the second half of the 1990s due to the Asian financial crisis. Fastest acceleration has been achieved by South Asia, from an annual average growth rate of 5.0% in 1990–1995 to 7.2% in 2005–2011, compared with 5.1% and 6.3% for East Asia, respectively. In contrast, ASEAN, which was most impacted by the Asian financial crisis among all country groups, has not yet fully recovered its pre-crisis growth vitality with the average growth rate in the second half of the 2000s (2005–2011), being 2.1 percentage points lower than that in the first half of the 1990s.
11: Annual data maximizes the use of available information and data, and are normally published two to three years in arrears. For more timely analysis, quarterly economic data is used as it is normally published within a month of the reference period and is subsequently revised as more data become available. There always exists, a trade-off between data timeliness and precision. See Box 3 (p. 48) for more details.
Figure 7 Country Contributions to Regional GDP Growth, 1970–1990 and 1990–2011___Contribution share to the growth of gross regional products (growth rate of Asia29=100)
Sources: Official national accounts in each country, including author adjustments.
−0.5 0.0 0.0 0.0 0.1 0.1 0.1 0.1 0.2 0.2 0.4 0.4 0.4 0.6 1.1 1.6 1.7 1.9 2.1 2.7 2.9 3.7 3.7 3.9 3.9 4.4 5.0
6.6
34.7
4.4 5.0
6.6 9.6
34.7
−10 0 10 20 30 40 % %
JapanChinaIndia
KoreaIndonesia
Saudi ArabiaROCIran
ThailandUAE
PakistanHong KongPhilippines
MalaysiaSingapore
VietnamOman
Sri LankaBangladesh
QatarBrunei
BahrainMyanmar
NepalMongolia
FijiLao PDR
CambodiaKuwait
1970–1990
0.0 0.0 0.0 0.1 0.1 0.1 0.1 0.3 0.4 0.4 0.5 0.6 0.9 1.0 1.1 1.2 1.2 1.3 1.5 1.7 1.82.23.1 3.63.85.1 5.1 5.1 4.85.9 5.7
15.5 15.447.147.1
0 10 20 30 40 50
ChinaIndia
KoreaJapan
IndonesiaIran
ROCThailand
Saudi ArabiaMalaysiaPakistan
UAEVietnam
SingaporeHong KongPhilippines
BangladeshQatar
KuwaitMyanmarSri Lanka
OmanNepal
CambodiaBahrain
Lao PDRBrunei
MongoliaFiji
1990–2011
16.1 16.1
giants. In fact, small developing Asian countries, like Qatar, Myan-mar, Cambodia, Vietnam, and Mongolia, are equally capable of exhibiting exuberant growth. In contrast, Japan has been consis-tently struggling at the bottom over the past two decades (1990–2011), with average growth of 0.9% per year, compared with Asia29’s 5.3% and the fastest growth of 9.9% achieved by Chi-na. During this period, only three Asian countries – Brunei, Fiji, and Japan – grew slower than the US (2.4%), and only Japan grew slow-er than EU15 (1.7%). The diver-
©20
13 A
sian
Prod
uctiv
ity O
rgan
izat
ion

20
3 Growth of Asian Economy
Based on Table 3, it is easy to assume that Asia has not been even slightly affected by the global finan-cial crisis, as Asia29’s growth rate accelerated from 5.4% to 6.2% between 2000–2005 and 2005–2011. But, in fact, Asia29’s growth slowed significantly from a recent peak of 8.0% in 2007, to 4.5% in 2008 and further to 3.6% in 2009, before rebounding strongly to 7.9% in 2010. Growth moderated again in 2011 to 5.6%, partly reflecting the retreating impact of the crisis response in the form of fiscal stimulation. Out of the 29 countries, eight Asian economies experienced negative growth in 2009, among which Japan went through the deepest contraction of 5.7%. Of the four Asian Tigers, only Korea managed a narrow escape from recession with 0.3% growth in 2009.
It has been a subject of much debate as to whether the Asian economy has decoupled from the US and EU15. If it has, the world economy will be substantially less volatile. Park and Shin (2009) show that East Asia has seen a marked increase in intra-regional trade, and, at the same time, diversified its export markets to other parts of the world resulting in an output movement that is more idiosyn-cratic than before, and in turn, less dependent on the US. Such increased self-subsistence is a neces-sary adaptation; in recent years the US has become less and less reliable as an outlet of China’s final goods export. In contrast, the impact of Asia’s extra-regional integration with the global financial mar-kets on business cycle synchronicity is less clear-cut. While deep financial markets allow more risk diversification and the smoothing out of consumption, closer integration also provides the conduit
Figure 8 Correlation of GDP Growth, 1990–1999___Correlation of GDP growth at constant prices
Sources: Official national accounts in each country, including author adjustments.
China (CHN)Hong Kong (HKG)Japan (JPN)Korea (KOR)Mongolia (MGL)ROC (ROC)Bangladesh (BAN)India (IND)Iran (IRN)Nepal (NEP)Pakistan (PAK)Sri Lanka (SRI)Brunei (BRN)Cambodia (CAM)Fiji (FIJ)Indonesia (IDN)Lao PDR (LAO)Malaysia (MAL)Myanmar (MYA)Philippines (PHL)Singapore (SIN)Thailand (THA)Vietnam (VIE)Bahrain (BHR)Kuwait (KWT)Oman (OMN)Qatar (QAT)Saudi Arabia (SAU)UAE (UAE)Australia (AUS)Turkey (TUR) EU15US
0.40.00.2
−0.60.6
−0.30.10.00.10.30.30.3
−0.30.30.50.40.50.00.00.60.60.70.30.60.6
−0.2−0.2−0.2
0.20.1
−0.7−0.2
0.70.8
−0.50.8
−0.1−0.4
0.20.10.30.30.40.2
−0.10.90.50.90.20.40.90.70.30.20.10.4
−0.10.20.3
−0.50.1
−0.2−0.2
0.7−0.3
0.5−0.3−0.4
0.2−0.2
0.40.00.40.1
−0.40.80.10.8
−0.20.30.50.50.3
−0.2−0.4
0.3−0.1
0.50.3
−0.70.20.0
−0.5
−0.20.7
−0.3−0.1−0.1
0.10.30.10.60.50.10.90.60.90.20.40.80.80.2
−0.1−0.2
0.0−0.3
0.0 0.3
−0.5−0.2
0.0−0.3
−0.70.40.6
−0.4−0.2−0.4−0.1−0.2
0.30.1
−0.40.3
−0.40.30.5
−0.3−0.6
0.0−0.6−0.1−0.7
0.4−0.5
0.60.5
−0.20.70.7
−0.6−0.3
0.0−0.1
0.50.10.60.30.10.80.30.8
−0.1−0.1
0.70.90.30.10.00.5
−0.50.2
−0.1−0.5−0.3−0.4−0.6
0.30.00.1
−0.20.2
−0.30.0
−0.1−0.3 0.1
−0.30.70.3
−0.1−0.5 0.00.10.50.00.6
−0.30.50.40.50.40.7
−0.10.20.1
−0.30.20.10.8
−0.2 0.6
−0.10.50.4
−0.10.0 0.3
−0.20.4
−0.50.0
−0.8 0.30.7
−0.10.10.6
0.40.4
−0.30.3
−0.20.0 0.1
−0.3 0.10.1
−0.10.0 0.20.00.40.10.0
−0.40.4
−0.1−0.4
0.3−0.2−0.2
−0.20.20.0
−0.1 0.20.0
−0.10.10.20.20.20.3
−0.10.70.1
−0.2−0.6 −0.4−0.3
0.00.2
−0.50.0
−0.60.90.30.30.40.20.30.1
−0.3 0.00.60.2
−0.10.20.2
−0.30.40.0
−0.3−0.1−0.1−0.3
−0.5−0.3−0.5 0.20.00.20.00.30.50.0 0.20.30.10.40.2
−0.2 0.20.00.3
−0.10.0
0.50.50.50.40.50.30.00.20.80.2
−0.10.10.0
−0.50.10.1
−0.4−0.2
0.0−0.3
0.40.10.40.20.40.10.10.2
−0.4−0.5−0.2 −0.5 −0.2−0.1 0.4
−0.3−0.7
0.50.2
0.00.60.10.40.10.00.30.10.00.5
−0.4−0.3−0.6−0.1
0.5−0.4−0.2
0.4
0.51.00.00.40.90.80.50.10.00.4
−0.30.10.2
−0.40.1
−0.3−0.4
0.60.50.70.60.40.5
−0.30.4
−0.10.1
−0.60.50.4
−0.20.00.4
0.10.50.90.80.50.10.00.3
−0.30.00.2
−0.40.1
−0.3−0.3
0.40.20.10.00.10.6
−0.20.2
−0.40.60.20.00.30.7
0.60.10.5
−0.20.1
−0.20.1
−0.50.70.20.20.20.4
0.70.50.20.20.3
−0.2−0.2
0.3−0.2
0.1−0.3−0.1
0.40.20.10.3
−0.70.0
−0.1−0.4−0.1−0.5−0.5
−0.10.40.50.0
−0.20.30.30.4
−0.30.0
0.40.4
−0.20.0
−0.60.00.6
−0.7−0.2
0.30.2
−0.40.00.60.3
−0.40.5
0.20.4
−0.1−0.2
0.5−0.4−0.4
0.00.40.40.30.40.5
−0.2−0.7
0.10.1
−0.6
0.00.00.70.5
−0.10.7−0.1 0.4
Group 1
1.01.0
1.01.0
1.01.0
1.01.0
1.01.0
1.01.0
1.01.0
1.01.0
1.01.0
1.01.0
1.01.0
1.01.0
1.01.0
1.01.0
1.01.00.1 1.0
−0.3 1.01.0
Group 2 Group 3 Group 4 Group 5H
KG
JPN
KOR
MG
L
ROC
BAN
IND
IRN
NEP
PAK
SRI
BRN
CAM
FIJ
IDN
LAO
MAL
MYA
PHL
SIN
THA
VIE
BHR
KWT
OM
N
QAT
SAU
UAE
AUS
TUR
EU15
US
CHN
If greater than 0.55 If less than −0.55
©20
13 A
sian
Prod
uctiv
ity O
rgan
izat
ion

3
21
3.1 Economic Scale and Growth
for financial contagion, and East Asia still suffers from the flight for quality when a crisis strikes. As the impact of the global financial crisis was filtering through, Asia seemed immune to the adverse impacts initially. However, once global investors began to retreat from the region and the financial menace began to inexorably spread through the real economy, Asia too started to slow.
Figures 8 and 9 compare the correlation coefficients of growth rates among countries in the 1990s and the 2000s, respectively. Countries are grouped by region. Overall, the correlation coefficients be-tween China and other Asian economies strengthened between the two decades, suggesting that China has become more integrated within the Asian economy. It is interesting to note that the correla-tion coefficient between China and Japan moved from 0.0 to 0.4, and China’s correlation with the US and EU15 has moved from being negative to moderately positive. Correlation among the East Asian countries has strengthened over time, and, with the exception of China, so has their correlation with the US and EU15. The correlation among countries in Group 3 and their correlation with the US and EU15, has also grown stronger. Within Group 3, the ties of Vietnam and the Philippines to East Asia have become much closer. Therefore, our comparisons of the correlation coefficients of growth be-tween the two periods lend support to an increase, not a decrease, in business cycle synchronicity.
Figure 9 Correlation of GDP Growth, 2000–2011___Correlation of GDP growth at constant prices
Sources: Official national accounts in each country, including author adjustments.
China (CHN)Hong Kong (HKG)Japan (JPN)Korea (KOR)Mongolia (MGL)ROC (ROC)Bangladesh (BAN)India (IND)Iran (IRN)Nepal (NEP)Pakistan (PAK)Sri Lanka (SRI)Brunei (BRN)Cambodia (CAM)Fiji (FIJ)Indonesia (IDN)Lao PDR (LAO)Malaysia (MAL)Myanmar (MYA)Philippines (PHL)Singapore (SIN)Thailand (THA)Vietnam (VIE)Bahrain (BHR)Kuwait (KWT)Oman (OMN)Qatar (QAT)Saudi Arabia (SAU)UAE (UAE)Australia (AUS)Turkey (TUR) EU15US
Group 1 Group 2 Group 3 Group 4 Group 5
HKG
JPN
KOR
MG
L
ROC
BAN
IND
IRN
NEP
PAK
SRI
BRN
CAM
FIJ
IDN
LAO
MAL
MYA
PHL
SIN
THA
VIE
BHR
KWT
OM
N
QAT
SAU
UAE
AUS
TUR
EU15
US
CHN
If greater than 0.55 If less than −0.55
1.00.6 1.00.4 0.8 1.00.3 0.6 0.8 1.00.6 0.8 0.7 0.4 1.00.4 0.8 0.9 0.8 0.5 1.00.7 0.5 0.2 −0.2 0.5 0.2 1.00.7 0.5 0.3 −0.1 0.3 0.4 0.6 1.00.3 0.4 0.5 0.6 0.2 0.5 −0.3 0.3 1.00.5 0.1 −0.1 −0.1 0.3 0.2 0.3 0.4 0.00.6 0.7 0.3 0.2 0.5 0.4 0.5 0.8 0.50.6 0.7 0.5 0.3 0.6 0.8 0.5 0.5 0.20.1 0.3 0.6 0.7 0.1 0.4 −0.3 0.0 0.70.5 0.7 0.6 0.4 0.8 0.3 0.3 0.3 0.3
−0.3 0.2 0.2 0.3 0.3 0.0 −0.2−0.4 0.20.7 0.6 0.5 0.3 0.6 0.6 0.6 0.4 −0.10.6 0.4 0.1 0.0 0.3 0.4 0.8 0.5 −0.30.5 0.9 0.9 0.7 0.8 0.9 0.2 0.2 0.40.3 0.4 0.2 0.1 0.4 0.1 0.0 0.4 0.60.5 0.9 0.9 0.7 0.7 0.9 0.4 0.4 0.40.5 0.9 0.8 0.7 0.5 1.0 0.4 0.5 0.40.3 0.7 0.9 0.8 0.6 0.8 −0.1 0.2 0.70.7 0.8 0.6 0.5 0.7 0.4 0.4 0.5 0.60.7 0.6 0.4 0.2 0.8 0.2 0.4 0.4 0.30.1 0.4 0.4 0.1 0.6 0.2 0.0 0.2 0.30.1 0.0 −0.1 −0.2 0.3 −0.2 0.5−0.3 −0.80.5 0.5 0.3 0.3 0.5 0.5 0.8 0.3 −0.10.2 0.6 0.5 0.0 0.6 0.4 0.3 0.4 0.10.4 0.5 0.4 0.1 0.7 0.2 0.3 0.3 0.40.3 0.3 0.5 0.4 0.2 0.2 −0.1 0.3 0.70.5 0.9 0.8 0.7 0.7 0.9 0.2 0.4 0.50.5 0.8 0.9 0.7 0.8 0.6 0.2 0.2 0.50.4 0.9 0.9 0.8 0.7 0.8 0.1 0.3 0.6
1.00.2 1.00.6 0.5 1.0
−0.4 0.1 0.0 1.0−0.1 0.6 0.2 0.3 1.0−0.3 0.1−0.2 0.3 0.2 1.0
0.6 0.3 0.9−0.2 0.2−0.4 1.00.4 0.2 0.7−0.2 −0.1−0.3 0.7 1.00.3 0.4 0.8 0.4 0.6 0.2 0.7 0.3 1.00.1 0.8 0.1 0.3 0.7 0.4−0.2−0.3 0.3 1.00.2 0.4 0.7 0.3 0.4 0.1 0.7 0.4 0.9 0.1 1.00.2 0.5 0.8 0.4 0.3 0.0 0.7 0.5 0.8 0.1 0.9 1.00.0 0.3 0.4 0.7 0.5 0.3 0.3−0.1 0.8 0.3 0.8 0.8 1.00.1 0.8 0.3 0.4 0.9 0.2 0.3 0.1 0.6 0.8 0.5 0.4 0.5 1.00.4 0.7 0.4 0.1 0.9 0.0 0.4 0.1 0.6 0.7 0.4 0.3 0.3 0.9 1.00.1 0.5 0.3 0.3 0.7 0.3 0.1−0.2 0.5 0.8 0.3 0.2 0.5 0.6 0.7 1.00.0−0.4 0.1−0.5 0.0−0.2 0.5 0.5 0.0−0.6 0.0 −0.1 −0.4−0.1 0.0 −0.3 1.00.3 0.2 0.7 0.0 0.0 0.1 0.7 0.9 0.4−0.2 0.5 0.6 0.1 0.2 0.1 −0.2 0.5 1.00.2 0.5 0.6 0.0 0.5 0.0 0.4 0.1 0.6 0.5 0.6 0.4 0.5 0.4 0.6 0.8 −0.1 0.1 1.00.1 0.6 0.3 0.3 0.7 0.5 0.0 0.0 0.5 0.8 0.3 0.2 0.4 0.7 0.7 0.8 −0.2 0.2 0.6 1.0
−0.2 0.3−0.1 0.7 0.5 0.2−0.2−0.3 0.2 0.6 0.3 0.2 0.6 0.6 0.4 0.4 −0.5 −0.2 0.2 0.5 1.00.3 0.6 0.8 0.4 0.5 0.2 0.6 0.2 0.9 0.4 0.8 0.9 0.8 0.6 0.5 0.5 −0.2 0.4 0.6 0.5 0.2 1.0
−0.2 0.4 0.2 0.6 0.8 0.3 0.3 0.0 0.7 0.4 0.7 0.6 0.8 0.8 0.6 0.5 0.0 0.2 0.3 0.5 0.6 0.6 1.0−0.1 0.5 0.4 0.6 0.8 0.3 0.3 0.0 0.8 0.5 0.8 0.7 0.9 0.8 0.5 0.6 −0.3 0.2 0.6 0.6 0.6 0.8 0.9 1.0
©20
13 A
sian
Prod
uctiv
ity O
rgan
izat
ion

22
3 Growth of Asian Economy
Understanding data comparability is essential for the construction of an international database, and requires significant effort and expert knowledge. Between September and December 2012, metadata sur-veys on the national accounts and other statistical data required for international comparisons of produc-tivity were conducted among the APO member economies. The aim of these surveys was to gather the metadata of the input data series required to populate the APO Productivity Database.
Broadly speaking, cross-country data inconsistency can arise from variations in one or more of the three aspects of a statistic: definitions, coverage, and methodology. The international definitions and guidelines work to standardize countries’ measurement efforts, but country data can deviate from the international best practice and vary in terms of omissions and coverage achieved. Countries can also vary in their esti-mation methodology and assumptions, which may account for part of the differences observable in the data and which can interfere with comparisons of countries’ underlying economic performance.
Most of the economic performance indicators in this report are GDP-related. The surveys therefore put a lot of emphasis on discerning countries’ GDP compilation practices. For GDP, the 1993 SNA is used as the stan-dard, noting how countries’ practices deviate from it. Since there are differences between the 1993 SNA and its predecessor (1968 SNA) in some concepts and coverage, it is important to know in which year in the data series definitions and classification started to switch over, so as to identify breaks in the time series. Figure B1 presents the current situation in compilations and data availability of the backward estimates based on the 1968 and 1993 SNAs and the future plan for introducing the 2008 SNA. For example, Japan
continued on next page >
Box 1 National Accounts in Asian Countries
Figure B1 Implementation of the 1968 and 1993 SNA and Plan for the 2008 SNA
Source: APO Metadata Survey 2012.
1991
1945 1950 1955 1960 1965 1970 1975 1980 1985 1990 1995 2000 2005 2010 2015
68 1972 197393 1979 200068 19939368 1951 198893 1951 200508 201268 1968 197493 1995 200308 2005 200868 1950 197893 1999 200708 2004 201068 1960 19709308 201368 1959 19819308 201368 1955 197893 1980 200008 201568 1970 198693 1970 200408 201468 199093 1997 200208 201568 1960
(mixture of 1953 SNA until 1968) 1975
93 2000 200708 20126893 1980 199508 201468 1974 197593 2000 200608 201568 1981 198893 2000 200408 201268 1946 198593 1998 201108 1998 201168 197593 1998 200168 1972 197593 1990 201268 198993 1986 199308 2015
Introduction year Backward estimates and implementation
Iran
Bangladesh
Cambodia
N.A.(Before 1993 SNA is introduced, Material Product System was used.)
N.A.(Some de�nitions of 1993 SNA are introduced. The main framework is still based on 1968 SNA.)
ROC
Fiji
India
Indonesia N.A.(Some de�nitions of 1993 SNA are introduced. It will be fully implemented in 2013.)
Philippines
Japan
Korea
Sri Lanka
Thailand
Vietnam
Lao PDR
Malaysia
Mongolia
Nepal
Pakistan
Plan making backward estimates
1993
©20
13 A
sian
Prod
uctiv
ity O
rgan
izat
ion

3
23
3.2 Catching Up in Per Capita GDP
of recent years. The ROC and Korea moved roughly to-gether but at a lower level than Singapore and Hong Kong. Korea’s income level similarly peaked in 1996 but its doldrums were shorter lived than Hong Kong or Sin-gapore’s. In Asia, Japan and Singapore are the two countries that have income levels almost equivalent to that of the US. However, this view is considerably re-vised if focusing on production or real income per cap-ita (i.e., using PPPs as the conversion rates) (Table 5).
In terms of per capita GDP at constant prices using PPPs, Japan was the first country in Asia to start catch-ing up with the US (Figure 13). By 1970, its per capita GDP was 62% that of the US, quite a distance ahead of other Asian countries. It had been steadily closing the gap with the US until 1991 (86%), but the gap widened
Figure 10 Share of Asian Population in the World in 2011
Source: IMF, World Economic Outlook Database, April 2013
Asia61 %
2011
EU277 %
Others28 %
EU156 %
US5 %
Asia2956 %
APO2035 %
Other Asia4 %
started to publish national accounts based on the 1993 SNA in 2000 (backward estimates based on the 1993 SNA are available from 1980 at present) and will introduce the 2008 SNA progressively and switch it in 2015–2016.
As Figure B1 suggests, countries differ in their year of introduction, the extent of implementation, and backward estimates available. According to the survey response, most APO countries are currently 1993 SNA compliant (partly or fully), although for some countries the switchover was a relatively recent affair; and for Indonesia, the 1993 SNA an ambition for the near future. The starting year of the official 1993 SNA-compliant time series therefore varies a great deal across countries, reflecting the differences in the avail-ability of backward estimates. Countries may have adopted the 1993 SNA as the framework for their national accounts, but the extent of compliance in terms of coverage may vary. The APO Productivity Database tries to reconcile the national accounts variations and provide harmonized estimates for inter-national comparison. See Appendix 1 for details of the adjustments.
> continued from previous page
3.2 Catching Up in Per Capita GDP
Performance comparisons based on whole-economy GDP do not take into account the population size and can in turn exaggerate the wellbeing of countries with large populations. Asia is the world’s most populous region. In 2011, it accounted for 61% of the world’s population (56% for Asia29), with China and India alone accounting for more than one-third (Figure 10). Based on per capita GDP, which adjusts for the differences in population size (but not income distribution), Asia’s rising economic gi-ants (i.e., China and India) are still substantially less well-off compared than the US standard, whereas the Asian Tigers fare exceptionally well.
Table 4 presents cross-country comparisons of per capita current-price GDP, using exchange rates as conversion rates. However, given the volatile nature of exchange rates, snapshot comparisons like those presented in Table 4 can appear arbitrary. Rather, long-term trends of nominal per capita GDP provide a better guide of relative movements. Based on this measure, Japan closed up on the US level in the late 1980s and peaked in 1995, reflecting the strong yen (Figure 11). Figure 12 shows compari-sons among the four Asian Tigers (Singapore, Hong Kong, the ROC, and Korea). Singapore and Hong Kong have been moving closely with one another for three and a half decades until the mid-2000s, when Singapore sprinted deftly ahead of Hong Kong. Hong Kong’s per capita GDP peaked in 1997, the year when Hong Kong was returned to China, and plummeted in 2004 before picking up again. Singa-pore’s followed a similar path: peaking in 1996, and falling to an all time low in 2002 before the surge
©20
13 A
sian
Prod
uctiv
ity O
rgan
izat
ion

24
3 Growth of Asian Economy
Table 4 Cross-Country Comparison of Per Capita GDP using Exchange Rate, 1970, 1980, 1990, 2000, 2010, and 2011___GDP at current market prices per person, using annual average exchange rate
Unit: Thousands of US dollars.Sources: Official national accounts in each country, including author adjustments.Note: See Appendix 1 for the adjustments made to harmonize GDP coverage across countries.
1970JapanHongKongSingaporeFijiIranROCMalaysiaKoreaThailandSriLankaPakistanPhilippinesBangladeshCambodiaIndiaChinaMyanmarMongoliaNepalIndonesiaVietnam
BahrainKuwaitOmanQatarSaudiArabiaUAEBrunei(regrouped)
APO20Asia23Asia29EastAsiaSouthAsiaASEANGCC(reference)
USEU15
AustraliaTurkey
1.990.960.930.430.390.390.360.280.210.210.200.200.130.120.110.110.100.090.090.090.03
1.883.950.404.990.884.271.49
0.310.230.230.320.120.131.33
5.063.49
3.560.69
100.048.346.421.419.819.517.913.910.610.510.110.0
6.75.85.65.55.04.74.44.31.4
94.4198.5
20.0250.7
44.3214.4
74.9
15.811.411.616.2
6.26.3
66.7
254.2175.3
178.734.7
2011SingaporeJapanHongKongKoreaROCMalaysiaIranThailandChinaFijiIndonesiaMongoliaSriLankaPhilippinesIndiaVietnamLaoPDRPakistanCambodiaMyanmarNepalBangladesh
BahrainKuwaitOmanQatarSaudiArabiaUAEBrunei(regrouped)
APO20Asia23Asia29EastAsiaSouthAsiaASEANGCC(reference)
USEU15EU27AustraliaTurkey
51.2446.2534.4622.3919.98
9.608.745.505.434.473.573.132.852.391.531.421.311.190.940.920.810.72
24.2653.5122.2796.9624.5439.8043.46
5.305.285.609.671.423.66
32.00
48.3835.8632.7767.4210.41
100.090.367.243.739.018.717.110.710.6
8.77.06.15.64.73.02.82.52.31.81.81.61.4
47.3104.4
43.5189.2
47.977.784.8
10.310.310.918.9
2.87.1
62.5
94.470.064.0
131.620.3
2010SingaporeJapanHongKongKoreaROCMalaysiaIranThailandChinaFijiIndonesiaSriLankaMongoliaPhilippinesIndiaVietnamLaoPDRPakistanCambodiaNepalMyanmarBangladesh
BahrainKuwaitOmanQatarSaudiArabiaUAEBrunei(regrouped)
APO20Asia23Asia29EastAsiaSouthAsiaASEANGCC(reference)
USEU15EU27AustraliaTurkey
45.6443.0131.9120.5418.49
8.346.285.134.423.743.032.412.252.161.401.241.101.010.830.730.710.68
20.8341.2221.4575.8419.7635.0935.60
4.864.644.898.451.293.20
26.34
46.8734.9931.8157.74
9.95
100.094.269.945.040.518.313.811.2
9.78.26.65.34.94.73.12.72.42.21.81.61.61.5
45.690.347.0
166.243.376.978.0
10.610.210.718.5
2.87.0
57.7
102.776.769.7
126.521.8
2000JapanHongKongSingaporeROCKoreaMalaysiaFijiThailandIranPhilippinesChinaSriLankaIndonesiaPakistanMongoliaIndiaVietnamBangladeshLaoPDRCambodiaNepalMyanmar
BahrainKuwaitOmanQatarSaudiArabiaUAEBrunei(regrouped)
APO20Asia23Asia29EastAsiaSouthAsiaASEANGCC(reference)
USEU15EU27AustraliaTurkey
37.3525.3823.4114.6411.35
4.002.102.081.711.060.950.890.810.520.470.460.410.370.320.310.280.15
13.1717.94
8.1829.20
9.6935.2017.75
3.452.462.554.730.461.19
13.32
35.2725.2421.9121.26
3.94
100.067.962.739.230.410.7
5.65.64.62.82.52.42.21.41.31.21.11.00.80.80.70.4
35.348.021.978.225.994.247.5
9.26.66.8
12.71.23.2
35.7
94.467.658.756.910.5
1990JapanHongKongSingaporeROCKoreaMalaysiaFijiIranThailandPhilippinesIndonesiaMongoliaSriLankaPakistanIndiaChinaBangladeshNepalLaoPDRCambodiaMyanmarVietnam
BahrainKuwaitOmanQatarSaudiArabiaUAEBrunei(regrouped)
APO20Asia23Asia29EastAsiaSouthAsiaASEANGCC(reference)
USEU15
AustraliaTurkey
25.1013.4812.75
8.086.312.491.851.721.620.800.710.580.490.430.390.340.270.240.210.190.130.10
9.278.967.16
17.667.44
28.8612.92
2.581.671.732.990.380.849.48
23.2416.83
18.923.54
100.053.750.832.225.1
9.97.46.86.43.22.82.31.91.71.51.41.11.00.80.80.50.4
36.935.728.570.329.7
115.051.5
10.36.76.9
11.91.53.3
37.8
92.667.1
75.414.1
1980JapanHongKongSingaporeIranROCFijiMalaysiaKoreaPhilippinesThailandIndonesiaPakistanChinaSriLankaMongoliaIndiaBangladeshMyanmarNepalCambodiaVietnam
BahrainKuwaitOmanQatarSaudiArabiaUAEBrunei(regrouped)
APO20Asia23Asia29EastAsiaSouthAsiaASEANGCC(reference)
USEU15
AustraliaTurkey
9.285.694.992.502.361.921.781.690.740.740.540.350.310.300.270.260.220.180.180.120.02
10.3721.60
5.7835.5715.1242.1328.25
1.220.840.931.310.270.56
17.27
12.278.96
11.782.03
100.061.353.826.925.520.719.118.2
8.08.05.83.83.33.22.92.92.41.91.91.30.2
111.7232.7
62.2383.2162.9453.9304.4
13.29.1
10.114.1
2.96.0
186.1
132.296.6
126.921.8
(%) (%) (%) (%) (%) (%)
again when the impact of the long recession of the 1990s started to manifest itself.12 In recent years, Japan’s level has stabilized to around 70–73% that of the US.
Japan’s per capita GDP was the highest among Asian countries until it was overtaken by Singapore13 in 1993. The result highlights the outcome of the dramatic development effort made by the four Asian Tigers, as shown in Figure 14. Not only were they inching up to the top, they were constantly closing the gap with the US. Starting from a level of 36% that of the US in 1970, Singapore surpassed the US
©20
13 A
sian
Prod
uctiv
ity O
rgan
izat
ion

3
25
3.2 Catching Up in Per Capita GDP
in 2004.14 In 2011, Singapore had a per capita GDP which was 26% above that of the US, and it became the richest economy in Asia. This represents a remarkable achievement. Hong Kong occupies the sec-ond place, with a per capita GDP similar to that of the US. Japan’s per capita GDP, at 72% of the US or around 60% of the group leader (Singapore), is similar to that of EU15. The ROC and Korea trail behind the other two Asian Tigers at 78% and 65% of the US, respectively.
12: Jorgenson and Nomura (2007) indicated that the manufacturing sector was the main contributor to the catching-up process of the Japanese economy in the 1960s, and that, by 1990, the US–Japan TFP gap for the manufacturing sector had almost disappeared.
13: Singapore’s population comprises not only Singaporean citizens but also non-citizens who have been granted permanent resi-dence in Singapore as well as non-permanent residents such as employment pass holders, work permit holders, and student pass holders. It is known that many workers and students commute to Singapore from outside the country every day. According to the most recent census, the share of Singaporean citizens with respect to total population was 74% in 2000, the share of permanent residents who are not Singaporean citizens was 7%, and the share of non-permanent residents was 19%.
Figure 11 Cross-Country Comparison of Per Capita GDP using Exchange Rate of Japan and Australia Relative to the US, 1970–2011___GDP at current market prices per person, using annual average exchange rates, relative to the US
Sources: Official national accounts in each country, including au-thor adjustments.
1970 1975 1980 1985 1990 1995 2000 2005 201020
40
60
80
100
120
140
USJapan
Austraria
160US=100 in each year
Figure 12 Cross-Country Comparison of Per Capita GDP using Exchange Rate of Asian Tigers Relative to the US, 1970–2011___GDP at current market prices per person, using annual average exchange rates, relative to the US
Sources: Official national accounts in each country, including au-thor adjustments.
1970 1975 1980 1985 1990 1995 2000 2005 20100
20
40
60
80
100
Singapore
ROC Korea
Hong Kong
120US=100 in each year
US
Figure 13 Per Capita GDP of Japan, the EU, and Australia Relative to the US, 1970–2011___Ratio of per capita GDP at constant market prices, using 2005 PPP, relative to the US
Sources: Official national accounts in each country, including au-thor adjustments.
1970 1975 1980 1985 1990 1995 2000 2005 201050
60
70
80
90
EU15
Japan
Austraria
100US=100 in each year
Figure 14 Per Capita GDP of Asian Tigers Relative to the US, 1970–2011___Ratio of per capita GDP at constant market prices, using 2005 PPP, relative to the US
Sources: Official national accounts in each country, including au-thor adjustments.
1970 1975 1980 1985 1990 1995 2000 2005 20100
20
40
60
80
100 US
ROC
Korea
Hong Kong
Singapore120
US=100 in each year
©20
13 A
sian
Prod
uctiv
ity O
rgan
izat
ion

26
3 Growth of Asian Economy
Figure 15 Per Capita GDP of China, India, and ASEAN Relative to the US, 1970–2011___Ratio of per capita GDP at constant market prices, using 2005 PPP, relative to the US
Sources: Official national accounts in each country, including au-thor adjustments.
1970 1975 1980 1985 1990 1995 2000 2005 20100
3
6
9
12
15
China
ASEAN
India
18US=100 in each year
Figure 16 Per Capita Non-Mining GDP in Oil-Rich Countries, 2010___GDP at constant market prices per person, using 2005 PPP, reference year 2010
Sources: Official national accounts in each country, including au-thor adjustments.
0 20 40 60 80 100
Qatar
Japan
UAE
Brunei
Kuwait
Bahrain
Oman
Saudi Arabia
Malaysia
Iran
42.0
2.4
3.0
2.4
9.7
12.4
6.2
20.6
24.9
14.4
47.2
32.0
11.1
12.2
13.4
16.4
20.6
25.3
27.7
23.8
Non-miningNon-mining
GDP
Thousands of US dollars (as of 2010)
The relative performance of China and India, the two most populous countries in the world, is dimin-ished in this measure due to their population size, with their per capita GDP at 17.3% and 7.5% that of the US in 2011, respectively (Figure 15). Even so, this should not taint the remarkable progress made over the past decades, especially that of China, whose per capita GDP was less than 2% that of the US in 1970; China’s relative per capita GDP has increased sevenfold in four decades. The income gap be-tween the US and the majority of Asian countries is still sizable,15 indicating that there is still a lot of room to catch up.
Table 5 presents separately the figures for seven oil-rich economies (Brunei and the six GCC countries). At first glance, figures in 1970 and to a lesser extent in 1990 suggest that these economies enjoyed an income many times that of Japan and the US. For example, Kuwait, Qatar, and Brunei had a per capita GDP 7.5 times, 7.4 times, and 3.9 times that of Japan, respectively, in 1970. However, the measurement of GDP as an indicator of income is misleading for these countries, as it erroneously includes proceeds from the liquidation of a natural resource stock as part of the income flow. In other words, GDP over-estimates income from the oil-exporting economies, as it does not account for depletion of their natural resource assets. To give a rough indication of the extent of distortion, Figure 16 provides com-parisons of per capita GDP excluding production of the mining sector (i.e., crude oil, natural gas, and so on). The non-mining GDP per person in Brunei and GCC economies like Qatar, the UAE, and Kuwait is almost similar to Japan’s level, although total GDP per capita is much larger.
Catching up with the per capita GDP level of advanced economies is a long-term process that could take several decades to accomplish. Empirical evidence has suggested that there may be a nega-tive correlation between per capita GDP level and the speed of catching up, although not without
14: Generally, Singapore’s GNI is lower than its GDP, and over the past four decades, the divergence was the largest in 2004 with GNI equivalent to 92.9% of GDP. As the US GNI never goes outside +1.7% of GDP, Singapore would not have overtaken the US in 2004 if GNI was used for comparisons instead of GDP. However, Singapore’s lead of 26% over the US in 2011 was large enough that their relative positions would be independent of whether GNI or GDP was used.
15: Per capita GDP may have underestimated the welfare of people in some countries. In the ROC, Hong Kong, and Japan, for ex-ample, GNI is consistently higher than GDP although the fluctuations are within +5%. The Philippines is the exception where the divergence between GNI and GDP has been increasing and has become significant for the past two decades, and GNI was higher than GDP by 33.3 (max in 2010, 32.3 in 2011)% in 2010. Fiji had a GNI 10–16% above GDP in the early 2000s, but since then, GNI has converged back to the GDP level.
©20
13 A
sian
Prod
uctiv
ity O
rgan
izat
ion

3
27
3.2 Catching Up in Per Capita GDP
exceptions. With the possibility of adopting successful practices and technologies from the more ad-vanced economies, less advanced economies are poised to experience faster growth in per capita GDP, enabling them to catch up to average income level. However, as income levels approach those of the more advanced countries, their economic growth rates are expected to gradually decline over time.16
Table 5 Per Capita GDP, 1970, 1980, 1990, 2000, 2010, and 2011___GDP at constant market prices per person, using 2005 PPP, reference year 2010
Unit: Thousands of US dollars (as of 2010).Sources: Official national accounts in each country, including author adjustments.Note: See Appendix 1 for the adjustments made to harmonize GDP coverage across countries.
1970JapanHongKongSingaporeIranROCMalaysiaFijiKoreaPhilippinesThailandMongoliaSriLankaPakistanIndiaIndonesiaBangladeshVietnamChinaMyanmar
BahrainKuwaitOmanQatarSaudiArabiaUAEBrunei(regrouped)
APO20Asia23Asia29EastAsiaSouthAsiaASEANGCC(reference)
USEU15
AustraliaTurkey
14.38.38.27.64.03.02.72.72.31.91.41.21.10.90.90.80.70.40.3
23.3107.9
7.5106.4
24.229.255.6
2.51.61.72.00.91.2
32.1
23.116.1
20.65.5
100.058.257.352.827.620.919.118.815.812.9
9.98.68.06.36.05.54.82.62.3
162.1752.1
52.5742.0168.7203.9387.9
17.511.112.014.1
6.38.5
223.8
161.0112.2
143.638.3
2011SingaporeHongKongROCJapanKoreaMalaysiaIranThailandChinaSriLankaFijiIndonesiaMongoliaPhilippinesIndiaVietnamPakistanLaoPDRCambodiaBangladeshMyanmarNepal
BahrainKuwaitOmanQatarSaudiArabiaUAEBrunei(regrouped)
APO20Asia23Asia29EastAsiaSouthAsiaASEANGCC(reference)
USEU15EU27AustraliaTurkey
59.848.637.034.230.615.114.6
9.68.25.54.84.74.64.13.53.42.72.72.41.81.61.6
28.245.824.495.224.241.950.6
6.97.37.6
11.73.35.6
31.9
47.434.431.041.714.8
100.081.361.857.251.125.324.416.013.7
9.28.07.87.86.85.95.74.54.54.03.02.72.7
47.176.740.8
159.340.470.084.6
11.512.212.719.5
5.59.3
53.3
79.257.551.969.824.7
2010SingaporeHongKongROCJapanKoreaMalaysiaIranThailandChinaSriLankaFijiIndonesiaMongoliaPhilippinesIndiaVietnamPakistanLaoPDRCambodiaBangladeshMyanmarNepal
BahrainKuwaitOmanQatarSaudiArabiaUAEBrunei(regrouped)
APO20Asia23Asia29EastAsiaSouthAsiaASEANGCC(reference)
USEU15EU27AustraliaTurkey
58.146.635.634.329.714.614.1
9.67.65.14.74.44.04.03.43.22.72.62.31.71.61.6
26.844.528.989.223.142.150.2
6.87.07.3
11.13.25.4
31.1
46.934.030.640.813.8
100.080.361.359.251.225.224.316.513.0
8.88.17.66.96.95.95.64.64.43.92.92.72.7
46.176.649.7
153.639.872.686.5
11.712.012.519.0
5.59.2
53.5
80.758.652.870.323.8
2000SingaporeHongKongJapanROCKoreaMalaysiaIranThailandFijiSriLankaIndonesiaPhilippinesChinaMongoliaPakistanIndiaVietnamLaoPDRNepalCambodiaBangladeshMyanmar
BahrainKuwaitOmanQatarSaudiArabiaUAEBrunei(regrouped)
APO20Asia23Asia29EastAsiaSouthAsiaASEANGCC(reference)
USEU15EU27AustraliaTurkey
42.233.132.125.320.811.3
8.96.74.53.33.13.02.92.52.21.91.81.51.21.21.10.6
29.440.820.572.022.778.351.8
5.24.34.56.51.93.7
30.8
44.131.627.734.810.3
100.078.376.060.049.226.821.115.810.6
7.97.27.17.05.95.14.54.23.62.92.82.71.4
69.596.648.5
170.453.7
185.5122.6
12.410.210.715.4
4.48.8
73.0
104.474.965.582.324.3
1990JapanSingaporeHongKongROCKoreaMalaysiaIranThailandFijiPhilippinesMongoliaIndonesiaSriLankaPakistanIndiaChinaLaoPDRVietnamNepalBangladeshCambodiaMyanmar
BahrainKuwaitOmanQatarSaudiArabiaUAEBrunei(regrouped)
APO20Asia23Asia29EastAsiaSouthAsiaASEANGCC(reference)
USEU15
AustraliaTurkey
29.528.026.315.112.1
7.37.14.83.82.92.62.32.21.81.41.21.01.00.90.80.80.4
23.723.319.455.021.580.753.3
4.43.13.34.51.42.7
26.9
35.726.1
27.58.6
100.095.089.251.341.124.723.916.213.1
9.78.87.87.66.14.64.13.53.43.22.72.61.3
80.479.065.8
186.773.0
273.7180.9
14.910.511.115.2
4.69.1
91.1
121.188.5
93.329.1
1980JapanSingaporeHongKongROCIranKoreaMalaysiaFijiPhilippinesThailandMongoliaSriLankaIndonesiaPakistanIndiaNepalBangladeshVietnamChinaMyanmar
BahrainKuwaitOmanQatarSaudiArabiaUAEBrunei(regrouped)
APO20Asia23Asia29EastAsiaSouthAsiaASEANGCC(reference)
USEU15
AustraliaTurkey
19.816.815.5
8.37.75.45.23.63.12.71.91.71.51.30.90.70.70.70.60.4
29.847.413.190.237.6
133.994.1
3.22.12.42.81.01.9
44.6
28.521.0
23.76.5
100.084.878.241.838.927.226.418.115.513.8
9.88.77.76.84.83.83.73.62.92.0
150.5239.6
66.0456.1190.3676.8475.8
16.210.711.914.4
4.99.7
225.3
144.0106.3
119.932.9
(%) (%) (%) (%) (%) (%)
16: The OECD (2012) observes that GDP per capita has broadly converged in the OECD countries since the 1970s. However, more advanced economies that started with high income levels in the 1970s have had lower rates of catch-up, stagnated or recently diverged vis-à-vis the US.
©20
13 A
sian
Prod
uctiv
ity O
rgan
izat
ion

28
3 Growth of Asian Economy
Figure 17 plots countries’ initial per capita GDP levels against their respective average growth rates per year between 1970 (or the ini-tial year data first became avail-able for the country in question) and 2011. If the two variables have a correlation coefficient of −0.5 (i.e., a negative relationship of medium strength), the higher the initial income level, the slower the average growth rate appears per year. However, this is not al-ways true. Low-income countries like Nepal, Bangladesh, the Philip-pines, and Fiji have failed to catch up, while Thailand and Malaysia could be expected to have grown even faster given their initial in-come levels. The Asian Tigers have enjoyed robust growth in the past
Sources: Official national accounts in each country, including author adjustments.Note: The annual catch-up rates are based on the difference in the growths of per capita GDP at constant prices between each country and the US during 1970–2011. The starting years for some countries are different due to data availability: Cambo-dia (1987–), the Lao PDR (1984–), and Nepal (1974–).
Table 6 Country Groups Based on the Initial Economic Level and the Pace of Catching Up___Level and average annual growth rate of GDP at constant market prices, using 2005 PPP
(C1)>3%
Annual rate of catch-up to the US
(C2)1%<–<3%
(C3)0%<–<1%
(C4)<0%
Initial GDPlevel
to the US
(L1)60%<
(L2)20%<–<60%
(L3)5%<–<20%
(L4)<5%
Japan, EU15
Brunei, Bahrain, Kuwait, Qatar,
Saudi Arabia, UAE, Australia
Singapore Hong Kong,Oman
Iran, Turkey
ROC, Korea Malaysia, MongoliaSri Lanka, Thailand
Fiji, Philippines
Cambodia, ChinaIndia, Indonesia,
Lao PDR, Myanmar,Vietnam
Bangladesh, Nepal,Pakistan
Figure 17 Initial Level and Growth of Per Capita GDP, 1970–2011___Level and average annual growth rate of GDP at constant market prices, using 2005 PPP, reference year 2010
Sources: Official national accounts in each country, including author adjustments.
India
Indonesia
Lao PDR Mongolia
Nepal
Sri Lanka
VietnamMyanmar
0 1 2 3 4 5 6Per capita GDP at constant prices
ROC
Hong Kong
Japan
Korea
Malaysia
Singapore
Thailand
China
USEU15
Australia
0 10 20 30 40 50 60 70Per capita GDP at constant prices
Fiji
Cambodia
BangladeshPakistan
Philippines
Thousands of US dollars (as of 2010) Thousands of US dollars (as of 2010)
Iran
Turkey
0
1
2
3
4
5% %
0
1
2
3
4
5
6
7
8Growth rate of per capita GDP during 1970–2011 Growth rate of per capita GDP during 1970–2011
=1970, =1990, =2011=1970, =1990, =2011
four decades, but Korea and the ROC, with their lower initial per capita GDP, have sustained higher growth rates than Singapore and Hong Kong. Relative to the Asian Tigers, China appears to be at the start of the catch-up process. Mature economies like the US, EU15, and Japan shared similar growth experiences (i.e., around 2% on average per year, in the past four decades).
Table 6 summarizes Figure 17 by country groups. Four levels of per capita income groups are defined: Group-L1, with per capita GDP at or above 60% of the US; Group-L2, from 20% to under 60%; Group-L3,
©20
13 A
sian
Prod
uctiv
ity O
rgan
izat
ion

3
29
3.3 Sources of Per Capita GDP Gap
17: Due to data constraints, labor utilization is measured as the number of workers relative to the population (termed the employ-ment rate in this report), to ensure consistency with the definition of labor productivity (i.e., GDP per worker) that is measured in all APO member economies, although it is frequently defined as hours worked per capita (OECD, 2012). In Section 5.2, labor pro-ductivity measures are provided based on hours worked for some selected countries. Also, in the computation of TFP in Section 5.3, hours worked data are used.
from 5% to under 20%; and Group-L4, below 5%. Likewise, countries are also grouped according to the speed of their catch-up with the US: Group-C1, at 3% per annum or above; Group-C2, from 1% to under 3%; Group-C3, from 0% to under 1%; and Group-C4, under 0%. The speed of catch-up with the US is defined as the difference in the average annual growth rate of per capita real GDP between each country and the US. Table 6 shows that many Asian countries (not belonging to Group-C4) have suc-ceeded in closing the gap in per capita real GDP against the US over the last four decades.
From Table 6 one can see that the initial economic level does not fully explain the catch-up process; if it does, the table would have been populated diagonally from bottom left corner to top right corner. Of the Asia29 countries, five achieved a very fast catch-up (i.e., over 3% a year on average) between the respective starting years of their data series and 2011. The per capita GDP level varies from Group-L2 (Singapore) to Group-L4 (Cambodia and China). Ten countries in Group-C4 experienced deteriora-tion in their relative income level against the US with low-income countries like Fiji and the Philippines failing to take off. The seven high-income countries in Group-C4 are all GCC countries except Australia. However, it is worth noting that GCC countries had an exceptionally high GDP (a distortion, as afore-mentioned) at the beginning of the period. Japan was the only Asian non-oil-exporting coun-try with a high-income level in 1970. But, like EU15, it has since failed to achieve further parity with the US.
3.3 Sources of Per Capita GDP Gap
To understand the diverse per-formance in the Asian group further, per capita GDP can be broken into two components, namely labor productivity (de-fined here as real GDP per work-er) and the corresponding labor utilization rate (i.e., number of workers to population ratio, or employment rate used in this report).17 Figure 18 shows the percentage point differences in per capita GDP decomposed into the contributions by the la-bor productivity gap and the employment rate gap relative to the US in 1995 and 2011.18 Most
Figure 18 Labor Productivity and Employment Rate Gap Relative to the US, 1995 and 2011___Decomposition of per capita GDP gap at constant market prices, using 2005 PPP
Sources: Official national accounts in each country, including author adjustments.
−100
−80
−60
−40
−20
0
−97−85
−13
−95
−2
−91
−6
−95
−1
−95
−1
−85
−11
−86
−10
−73
−22
−98
4
−82−74
−19−13
−82
−10
−84
−7
−85
−5
−86
−4
−85
−4
−76
−13
−75
−12
−90 −85
34
−41
−38
−55
−21
−56
−17
−48−33
−13
−7
−12
−14
−11−9
6
−24−11−6 −11
7
−2
−97−96−90
−104
9
−96
2
−80
−14
−86
−7−7−1
−100
7
−86
−7
−86
−5
−81−89
−1−9
−79
−11
−77
−11
−89
11
−80
−6
−84−84−92
9
−90−84
910
−43
−26
−47
−22
−62
−6
3
−38−34
6
−24−20
−3−2
−20
8
−4 −3
7 29
20%
%
Mya
nmar
Ba
ngla
desh
Cam
bodi
aN
epal
Lao
PDR
Viet
nam
Sout
h As
iaIn
dia
Paki
stan
Chin
a M
ongo
liaSr
i Lan
ka
Phili
ppin
esIn
done
siaAS
EAN
Asia
23As
ia29
Fiji
APO
20Ea
st A
siaTh
aila
ndIra
nTu
rkey
Mal
aysia
Kore
aRO
CEU
15Au
stra
liaJa
pan
Hon
g Ko
ngSi
ngap
ore
Nep
al
Mya
nmar
Ba
ngla
desh
Cam
bodi
a
La
o PD
R
Pa
kist
an
So
uth
Asia
Viet
nam
In
dia
Ph
ilipp
ines
M
ongo
lia
In
done
sia
Fi
ji
Sri L
anka
ASEA
N
APO
20
Asia
23
Asia
29
Chin
a
Thai
land
East
Asia
Iran
Turk
ey
M
alay
sia
Ko
rea
Ja
pan
EU15
ROC
Aust
ralia
Hon
g Ko
ng
Si
ngap
ore
1995
−100
−80
−60
−40
−20
0
20
2011
Employment rate Labor productivity Per capita GDP
©20
13 A
sian
Prod
uctiv
ity O
rgan
izat
ion

30
3 Growth of Asian Economy
of the Asian countries display a huge per capita GDP gap with the US, predominantly ex-plained by their relative labor productivity performance. Ex-cept for the four Asian Tigers, Japan, and Iran, all the other Asian countries had labor pro-ductivity gaps of more than 50% against the US in 2011. Hong Kong and Singapore had the smallest labor productivity gaps of 3–4% against the US. Al-lowing for a margin of error of ±10%, these gaps are not statis-tically significant. In contrast, the labor productivity gaps of the other two Asian Tigers are still sizable against the US, at 20% and 38% for the ROC and Korea, respectively.
Figure 19 focuses on explaining a country’s per capita GDP growth by its components: namely la-bor productivity growth and the change in the employment rate for the periods 1995–2000 and 2000–2011, respectively.19 For most countries in Asia, the majority of per capita GDP growth can be explained by improvement in labor productivity, but this should not lead us to underestimate the role played by changes in the employment rate. On average, Asia29’s per capita GDP grew by 2.9% a year between 1995 and 2000, and accelerated to 4.7% a year between 2000 and 2011. The earlier period captured the dampening effect of the Asian financial crisis of the late 1990s. Emerging from the crisis, both labor productivity growth and employment growth strengthened. For most countries, labor productivity explains a larg-er share of per capita GDP growth than employment, but the employment rate contribution relative to labor productivity was also highly significant in, for example, Pakistan and Nepal (over 50%), the Philippines and Bangladesh (around 40%), and Cambodia and Iran (around one-third).
Figure 19 Sources of Per Capita GDP Growth, 1995–2000 and 2000–2011___Decomposition of average annual growth rate of per capita GDP at constant market prices, using 2005 PPP
Sources: Official national accounts in each country, including author adjustments.
9.3 9.4
4.2 4.5 5.0 5.3 5.3 4.7 4.6 4.6 4.5 3.9 3.0 2.53.3 2.9 2.8 3.0 2.7 3.2
2.2 1.7 1.6 2.0 2.01.0 0.9 0.7
1.6 0.9 0.6
−1.1−0.2
2.1 1.3 0.80.2 0.5 0.5 0.2 0.2
0.7 1.41.6
0.50.7 0.7
0.50.7
0.11.0 1.4 1.1 0.7 0.5
1.2
1.2 1.00.8
0.0
−1.0−0.3−0.1
1.4
%
1995–2000
−2
0
2
4
6
8
%
−2
0
2
4
6
8
102000–2011
Employment rate Labor productivity Per capita GDP
IndonesiaThailandJapanH
ong KongASEANFijiPhilippinesAPO
20G
CCPakistanM
alaysiaM
ongoliaTurkeyIranN
epalEU
15AustraliaAsia29Asia23SingaporeU
SEast AsiaLao PD
RSouth AsiaIndiaSri LankaKoreaRO
CBangladeshCam
bodiaVietnamM
yanmar
China
GCC
FijiJapanU
SEU
15AustraliaPakistanN
epalAPO
20M
alaysiaPhilippinesSingaporeThailandTurkeyRO
CH
ong KongKoreaASEANIndonesiaBangladeshIranSri LankaAsia29Asia23South AsiaLao PD
REast AsiaIndiaM
ongoliaVietnamCam
bodiaM
yanmar
China
7.1 5.9
4.73.4 3.9 4.1 4.3
1.7
3.4 3.03.9
3.12.3
3.72.6 2.6
2.0 1.4 1.7
3.42.5
0.90.3
2.21.0 1.2 0.6 0.6
1.30.4
−1.4
0.2
0.1
1.50.6
0.5
0.1
−0.1
2.4 0.6 0.7
−0.4
0.2
0.8
−0.7
0.3 0.3 0.6
1.2 0.9
0.7
1.7
−1.1−0.3
1.31.4
−0.6
0.5
1.9
−0.6
0.1 0.4 0.4
−0.7−0.5
1.0
18: The gap of country x’s per capita GDP relative to the US is decomposed into the sum of the gap of labor productivity and employ-ment rate with respect to the US, as in:In (GDPx
t / POPxt−1) − In (GDPUS
t / POPUSt−1) = In (GDPx
t / EMPxt−1) − In (GDPUS
t / EMPUSt−1) + In (EMPx
t / POPxt−1) − In (EMPUS
t / POPUSt−1)
Gap of per capita GDP Gap of labor productivity Gap of employment rate
where POPxt is population of country x in period t and EMPx
t is the number of employment of country x in period t.19: Country x’s per capita GDP is decomposed into the product of its labor productivity and employment rate, as in:
In (GDPxt / POPx
t) = In (GDPxt / EMPx
t) + In (EMPxt / POPx
t)Per capita GDP Labor productivity Employment rate
where POPxt is population of country x in period t and EMPx
t is the number of
employment of country x in period t.
©20
13 A
sian
Prod
uctiv
ity O
rgan
izat
ion
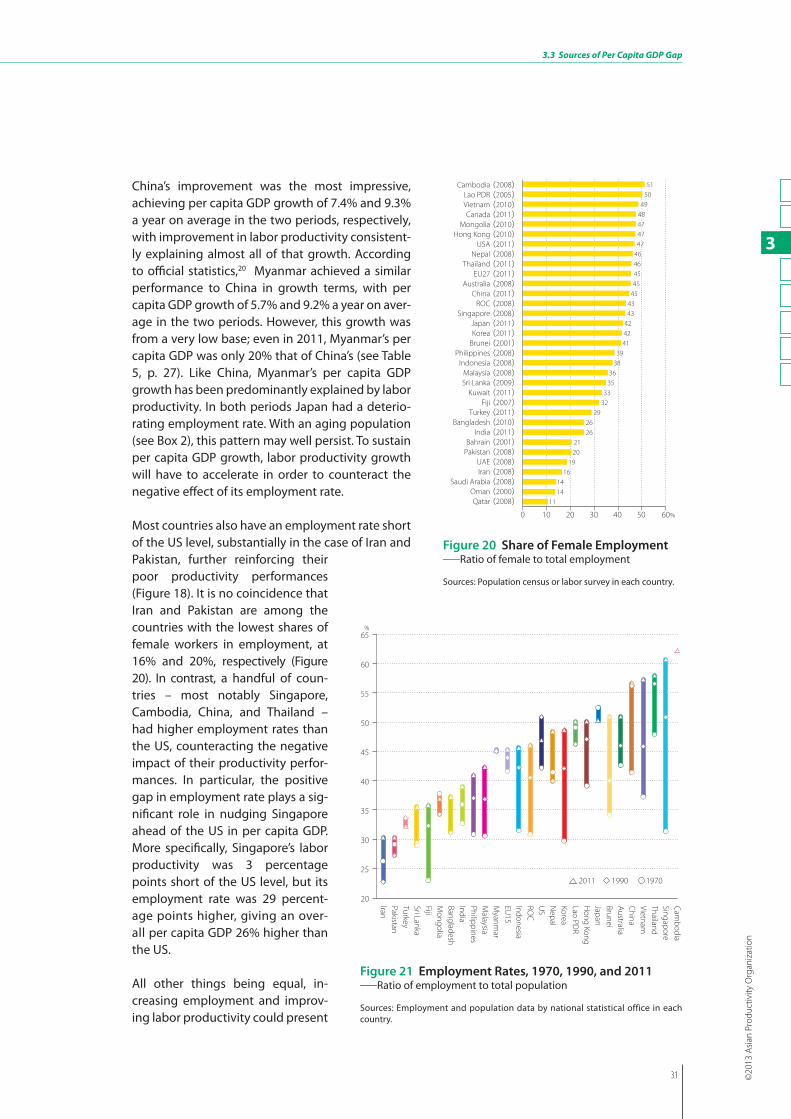
3
31
3.3 Sources of Per Capita GDP Gap
Figure 20 Share of Female Employment___Ratio of female to total employment
Sources: Population census or labor survey in each country.
0 10 20 30 40 50 60%
11
1416
14
19192021
2626
3233
2929
3635
38383939
424241
4343
4545454646
474747474747
48484949
5051Cambodia (2008)
Lao PDR (2005)Vietnam (2010)Canada (2011)
Mongolia (2010)Hong Kong (2010)
USA (2011)Nepal (2008)
Thailand (2011)EU27 (2011)
Australia (2008)China (2011)
ROC (2008)Singapore (2008)
Japan (2011)Korea (2011)
Brunei (2001)Philippines (2008)
Indonesia (2008)Malaysia (2008)Sri Lanka (2009)
Kuwait (2011)Fiji (2007)
Turkey (2011)Bangladesh (2010)
India (2011)Bahrain (2001)
Pakistan (2008)UAE (2008)Iran (2008)
Saudi Arabia (2008)Oman (2000)Qatar (2008)
Figure 21 Employment Rates, 1970, 1990, and 2011___Ratio of employment to total population
Sources: Employment and population data by national statistical office in each country.
20
25
30
35
40
45
50
55
60
Cambodia
SingaporeThailandVietnamChinaAustraliaBruneiJapanH
ong KongLao PD
RKoreaN
epalU
SRO
CIndonesiaEU
15M
yanmar
Malaysia
PhilippinesIndiaBangladeshM
ongoliaFijiSri LankaTurkeyPakistanIran
65%
2011 1990 1970
China’s improvement was the most impressive, achieving per capita GDP growth of 7.4% and 9.3% a year on average in the two periods, respectively, with improvement in labor productivity consistent-ly explaining almost all of that growth. According to official statistics,20 Myanmar achieved a similar performance to China in growth terms, with per capita GDP growth of 5.7% and 9.2% a year on aver-age in the two periods. However, this growth was from a very low base; even in 2011, Myanmar’s per capita GDP was only 20% that of China’s (see Table 5, p. 27). Like China, Myanmar’s per capita GDP growth has been predominantly explained by labor productivity. In both periods Japan had a deterio-rating employment rate. With an aging population (see Box 2), this pattern may well persist. To sustain per capita GDP growth, labor productivity growth will have to accelerate in order to counteract the negative effect of its employment rate.
Most countries also have an employment rate short of the US level, substantially in the case of Iran and Pakistan, further reinforcing their poor productivity performances (Figure 18). It is no coincidence that Iran and Pakistan are among the countries with the lowest shares of female workers in employment, at 16% and 20%, respectively (Figure 20). In contrast, a handful of coun-tries – most notably Singapore, Cambodia, China, and Thailand – had higher employment rates than the US, counteracting the negative impact of their productivity perfor-mances. In particular, the positive gap in employment rate plays a sig-nificant role in nudging Singapore ahead of the US in per capita GDP. More specifically, Singapore’s labor productivity was 3 percentage points short of the US level, but its employment rate was 29 percent-age points higher, giving an over-all per capita GDP 26% higher than the US.
All other things being equal, in-creasing employment and improv-ing labor productivity could present
©20
13 A
sian
Prod
uctiv
ity O
rgan
izat
ion

32
3 Growth of Asian Economy
a policy trade-off in the short term (i.e., they cannot be achieved simultaneously). If the policy target is to increase employment, productivity may suffer in the short term as marginal and less-productive workers are recruited, bringing down the average productivity performance. The huge labor produc-tivity gap between Asia and the US discussed in Chapter 5 should therefore be considered in the context of the generally high employment rate in Asia.
Figure 21 shows cross-country comparisons of employment rates in 2011, based on the labor statis-tics of each country. Employment consists of employees, own-account workers, and contributing family workers. Cambodia, and Singapore lead the Asian group with employment rates of over 60%, 13–15 percentage points higher than the US and 12–17 EU15, respectively, in 2011. It is clear that employment rates have been rising in Asia.21 The fastest catch-up countries (i.e., those in Group C1) are also countries with the largest surge in employment rates over the past four decades; Singapore, China, Korea, and the ROC. However, China seems to have exhausted its capacity for further im-provement as its employment rate was little changed between 1990 and 2011 at 57%. Some of the countries in Group C2 also experienced significant improvements in employment rates: for ex-ample, Indonesia and Vietnam. Countries that have failed to catch up also tend to make less vigor-ous improvements over the period, and in turn continue to have lower employment rates. Fiji is the only exception, where the employment rate has improved significantly, albeit from a very low, starting base.
20: The author would caution readers as to the reliability and quality of Myanmar’s official statistics, which have been questioned. Researchers have suggested that this is not consistent with other variables closely correlated with GDP, such as energy use. Non-official estimates put GDP growth at less than half of the official estimates. See Economist Intelligence Unit (2010). Nonetheless, official statistics from Myanmar are presented in this report, as there is no comprehensive and transparent alternative data source.
21: Japan is the only exception where the employment rate in 2011 was lower than that in 1970. This reflects, among other things, its aging population. US employment rates also shows weakening in the recent period, with levels in 2011 lower than that in 1990 (i.e., 47% compared with 51%).
©20
13 A
sian
Prod
uctiv
ity O
rgan
izat
ion

3
33
3.3 Sources of Per Capita GDP Gap
According to the United Nations (UN) (2011), the world’s population is estimated to reach 6.9 billion in 2010, of which Asian countries account for 60.4%. The region is by far the most populous in the world. China and India account for 19.5% and 17.8% of the world’s population, respectively. It has been observed that falling fertility rates and rising living standards go hand in hand, although the direction of causality is less certain. The evolution of the demographic structure implies dynamics in a society that are not cap-tured by the overall population size or growth. As people’s economic behavior, aspirations, and needs vary at different stages of life, changes in a country’s age structure can have a significant impact on its eco-nomic growth via a supply-side and demand-side impacts.
The world’s fertility rate is converging to the replacement level – the level at which a country’s population stabilizes. According to the UN, the number of children a woman is expected to have in her reproductive years has dropped by more than half, from about 6.0 to 2.5 in the last 60 years, compared to the replace-ment level of 2.1 children, one of them a girl. There is regional divergence in this trend: in the last 60 years, the total fertility rate dropped from about 6.7 children to 2.6 in Central America, and from about six chil-dren to 1.6 (i.e., below the replacement level) in East Asia. In comparison, some parts of Africa have only seen a modest drop in total fertility, which today remains at more than five children per woman. What is even more staggering is the pace of change. For example, it took Britain over 130 years (1800–1930) to halve its fertility rate, while it took Korea only 20 years to achieve it. This is echoed all around the world. This widespread social revolution has been heralded by a complex mix of economic and social development. Economic growth, greater access by women to education, income-earning opportunities, and sexual and reproductive health services have all been contributing factors to this trend. Coupled with changes in the mortality rate, such a trend can dramatically alter the age profile of a country’s population, and bring with it economic implications.
The growth rate of the world’s population has slowed from its peak of around 2.0% in the 1970s to today’s 1.1% a year. With falling fertility rates, the UN projects that the world’s population growth rate will deceler-ate to 0.40% a year by 2050 and further to 0.05% by 2100. Even so, the world population will still increase by one-third in the next 40 years, from 6.9 billion to 9.3 billion and a further 8% to 10.1 billion by 2100. These estimates are based on the medium-fertility variant, but with only a small variation in fertility, par-ticularly in the more populous countries, the total could be higher (10.6 billion by 2050 and 15 billion in 2100) or lower (8.1 billion in 2050 and 6.2 billion in 2100).
Much of this increase is expected to come from high-fertility countries, which comprise 39 out of the 55 countries in Africa, nine in Asia, six in Oceania, and four in Latin America. In contrast, low-fertility countries include all countries in Europe except Iceland and Ireland, 19 out of the 51 in Asia, 14 out of the 39 in the Americas, two in Africa (Mauritius and Tunisia), and one in Oceania (Australia). Figure B2.1 depicts this shift in the distribution of the world population with the more developed regions’ share gradually declining from 17.9% to 14.1% in 2050 and 13.2% in 2100, compared with 32.1% in 1950, whereas the share of the
Box 2 Population and Demographic Dividend
continued on next page >
Figure B2.1 Distribution of the World’s Population in Different Regions, 1950–2100
Source: UN (Department of Economic and Social Affairs), World Population Prospects: The 2010 Revision.
0
2
4
6
8
10
1950 1975 2000 2025 2050 2075 2100
Billion
0
2
4
6
8
10
1950 1975 2000 2025 2050 2075 2100
OceaniaNorthern AmericaLatin America and the CaribbeanEuropeAfricaOther AsiaASEANChinaIndia
BillionLeast developed countriesLess developed regions, excluding least developed countriesMore developed regions
0.2
0.3
0.7
1.1
1.72.3 2.7
0.5
0.6
0.3
0.3
0.4
0.40.50.7
0.7
0.50.7
0.7
3.0 3.6
1.4
0.7
0.9
1.6
1.5
0.7
1.1
1.7
0.8
0.7
2.2
1.4
1.3
1.7
0.7
0.7
0.7
1.4
1.2
1.4
1.5
0.7
0.50.7
0.8
0.90.5
1.3
1.1
0.70.40.50.30.9
0.6
2.7
4.3 5.6 6.3 6.3 6.1
1.2 1.3 1.3 1.3 1.31.0
1.5
0.8
©20
13 A
sian
Prod
uctiv
ity O
rgan
izat
ion

34
3 Growth of Asian Economy
least developed countries rising from today’s 12.1% to a projected 18.6% in 2050 and 26.6% in 2100, up from 7.9% in 1950.
According to the projection Asia’s share will decline from its 60.4% to-day to 55.3% in 2050 and 45.4% in 2100, while Africa’s share will rise from today’s 14.8% to 23.6% and 35.3%, respectively. Figure B2.2 shows the current population size of individual Asian countries com-pared with the 1970 level and its 2050 projection. As can be seen from the chart, China’s population is expected to more or less stabilize around the current level. China has socially engineered the change with its one-child policy, which has made its current population 300–400 million lower than it would have been otherwise. In less than a decade, India is projected to over-take China as the most populous country in the world, and China’s population will drop to under 1 bil-lion by 2088.
Figure B2.3 shows the demographic make-up of countries in 2010 (i.e., the population proportions of the under-15 and over-65 age groups, which together make up the de-pendent population). Ranking the countries by the share of old-age population filters the rich econo-mies to the top end; these econo-mies also have a relatively low share of the young age group compared to less developed countries. This suggests that demographic transi-tion tends to happen in parallel with economic progress, although the direction of causation is not cer-tain. As countries move from high to low mortality and fertility rates, the demographic transition pro-duces a “boom” generation that is larger than those immediately be-fore and after it. As this boom gen-eration gradually works through a nation’s age structure, it produces a demographic dividend of econom-ic growth as people reach their prime.
> continued from previous page
continued on next page >
Figure B2.2 Asian Countries’ Population Size and Pro-jection, 1970, 2011, and 2050
Source: World Bank, World Development Indicators.
600
800
1000
1200
1400
16002011Million 1970 2050
50
100
150
200
250
300
350
400
05
10
15
20
25
30
Brunei FijiBahrein Q
atarM
ongolia Kuw
ait O
man
Singapore Lao PD
R H
ong KongU
AE Cam
bodia Sri Lanka Australia RO
CN
epal Saudi Arabia M
alaysia Korea M
yanmar
Thailand Turkey Iran Vietnam
PhilippinesJapan Bangladesh Pakistan Indonesia U
S EU
27IndiaChina
scale by 200 millions
scale by 50 millions
scale by 5 millions
Figure B2.3 Proportion of the Dependent Population, 2011
Sources: Population census and official national accounts in each country.
20 25 %
Ages over 65Ages 0–14
40 % 0102030 0 5 10 15
JapanAustralia
USHong Kong
KoreaROC
SingaporeChina
ThailandTurkey
Sri LankaMyanmarVietnam
IranIndonesia
NepalFiji
IndiaMalaysia
BangladeshPhilippinesCambodiaPakistan
MongoliaLao PDRBrunei
Saudi ArabiaOmanKuwaitBahrainQatarUAE 0.4
0.8 2.2 2.5 2.7
5.0 5.0 5.3 5.6 5.7 6.0 6.0 6.3
7.3
10.9 11.4
3.0 3.7 3.7 4.0 4.3 4.4 4.4 4.6 4.8
9.1 9.1 9.4
13.3 13.3 13.8
23.3
3.0 3.7 3.7 4.0 4.3 4.4 4.4 4.6 4.8
9.1 9.1 9.4
13.3 13.3 13.8
23.3
13.6 20.9
30.0
34.8 31.7
33.6 30.7
30.2
34.9
23.4 23.2
20.2
15.1
11.6
16.8
26.8 27.0
25.9 37.3
27.4
26.7
28.9
26.7
30.8 26.3 25.3
16.5 16.8
15.6
19.8 18.9
16.8
26.8 27.0
25.9 37.3
27.4
26.7
28.9
26.7
30.8 26.3 25.3
16.5 16.8
15.6
19.8 18.9
13.1
©20
13 A
sian
Prod
uctiv
ity O
rgan
izat
ion

3
35
3.3 Sources of Per Capita GDP Gap
> continued from previous page
Using demographic data since 1950 and UN projections up to 2100, Figure B2.4 tracks changes in the ratio of the working population (aged 15–64) to dependent population (aged under 14 and over 65) over time. The higher the ratio, the more favorable its demography for economic growth. Japan could have capital-ized the demographic dividend in the 1960s, when its GDP growth was over 10% on average per year for ten years. Similarly, China, Hong Kong, Korea, Singapore, and Thailand are poised for the prospect of such demographic dividend in the 2000s and 2010s, whereas, based on projections, Indonesia will have to wait for such opportunity until the 2020s and 2030s, and India till the 2040s. The reaping of this dividend, how-
Figure B2.4 Demographic Dividend, 1950–2100
Source: UN (Department of Economic and Social Affairs), World Population Pros-pects: The 2010 Revision.
1.0
1.5
2.0
2.5
3.0
1950 1960 1970 1980 1990 2000 2010 2020 2030 2040 2050 2060 2070 2080 2090 2100
1.0
1.5
2.0
2.5
3.0
1950 1960 1970 1980 1990 2000 2010 2020 2030 2040 2050 2060 2070 2080 2090 2100
ChinaIndiaIndonesiaThailand Australia
Dependent population (aged under 14 and over 65)=1.0
Dependent population (aged under 14 and over 65)=1.0
Hong KongJapanKoreaSingaporeUS
ever, is far from automatic. A favor-able demography can work won-ders to produce a virtuous cycle of wealth creation only if it is com-bined with appropriate health, la-bor, financial, human capital, and growth-enhancing economic poli-cies. The presence of these comple-mentary factors cannot be taken for granted, but needs to be cultivated in order to earn the demographic dividend. As the analysis of the Databook show, the contribution of labor to economic growth has been smaller than those of capital and TFP for most countries (Figure 52, p. 72). This means that countries should not be afraid of ageing too much as long as fairly high growth rates of capital and TFP are main-tained. Nevertheless, understand-ing the demographic shift and its implications is highly relevant for economic projections and in turn provides valuable foresight for eco-nomic policy making.
©20
13 A
sian
Prod
uctiv
ity O
rgan
izat
ion

4
37
4.1 Composition of Final Demand
In national accounts, GDP is measured by three approaches: production (i.e., by industry or products); expenditure on final demand; and income to factor inputs. In theory, these three approaches are only accounting identities, but in reality, they differ by statistical discrepancies.22 Decompositions of GDP are valuable in understanding the structure, and in turn the behavior, of an economy. In this chapter, the economic composition of countries’ expenditure experience is critiqued. The decomposition of output growth into input growth and the TFP growth (the supply side) is analyzed in Chapter 5, while countries’ industry structure are presented and analyzed in Chapter 6.
4.1 Composition of Final Demand
From Table 7, one can see that country groups display distinctive features in their final demand com-position, reflecting their development stage and economic makeup. With the differences in emphasis and vulnerabilities, their behavior and reaction to economic shocks can be expected to be quite di-verse. Table 7 presents comparisons of final demand shares of nominal GDP, covering: (1) household consumption (including consumption of non-profit institutions serving households (NPISHs)); (2) government consumption; (3) investment (or, in national accounts terminology, gross fixed capital formation (GFCF) plus changes in inventories); and (4) net exports (i.e., exports minus imports).
For most countries, household consumption is by far the biggest component of GDP.23 The GCC coun-tries, Brunei, and China are the exceptions. Over the past four decades, the share of household con-sumption for mature economies tends to be rather stable and trending upward in recent years, while it is more volatile and largely trending downward in economies undergoing rapid transformation, such as the Asian Tigers in the 1970s and 1980s, and India and China in the present day.
4 Expenditure
22: Countries follow an international framework, called the SNA, in compiling their national accounts. As economies keep evolving, the SNA is revised periodically so it does not lose its relevance to economic realities and compromise on the accuracy of GDP measurement. The latest international effort resulted in the 2008 SNA, which improves upon the 1993 SNA. For further details, see Box 1 (p. 22).
Table 7 Final Demand Shares in GDP, 1970, 1980, 1990, 2000, and 2011___Share of final demands with respect to GDP at current market prices
Unit: Percentage.Sources: Official national accounts in each country, including author adjustments.Note: Final demand shares in country groups are computed by using the PPPs for GDP. Household consumption includes consumption of NPISHs. Investment includes GFCF plus changes in inventories.
Household consumption Government consumption Investment Net exports1970 1980 1990 2000 2011 1970 1980 1990 2000 2011 1970 1980 1990 2000 2011 1970 1980 1990 2000 2011
APO20 51.8 56.1 54.9 58.7 61.0 10.8 13.7 12.8 13.9 12.6 36.6 31.6 31.8 25.1 27.6 0.9 −1.4 0.6 2.4 −1.2
Asia23 52.1 55.8 54.1 55.7 51.2 10.8 13.7 12.9 14.3 12.9 36.2 31.8 32.2 27.5 35.5 0.8 −1.4 0.8 2.4 0.3
Asia29 51.7 52.5 53.8 55.1 50.1 10.9 13.7 13.6 14.6 13.0 35.8 30.6 31.3 27.1 35.0 1.6 3.2 1.3 3.2 1.9
East Asia 50.3 54.5 52.3 53.1 43.3 10.9 14.1 13.4 15.6 14.8 37.8 32.5 32.9 29.2 39.9 1.1 −1.1 1.4 2.0 2.0
South Asia 76.2 76.1 68.3 67.2 67.2 8.6 9.2 11.0 11.7 11.0 15.5 19.3 23.2 22.6 28.9 −0.3 −4.6 −2.5 −1.5 −7.1
ASEAN 65.3 58.5 56.2 56.7 57.7 13.4 12.5 10.5 10.1 10.4 26.3 31.6 34.7 24.0 28.3 −4.9 −2.6 −1.4 9.2 3.7
GCC 36.0 29.7 50.1 42.9 32.0 14.0 13.4 24.6 19.8 14.7 19.5 22.3 15.8 18.2 26.4 30.5 34.6 9.5 19.1 26.9
China 55.6 50.2 47.0 46.7 36.4 11.2 14.9 14.1 15.8 13.5 33.1 35.2 36.1 35.1 47.6 0.1 −0.3 2.7 2.4 2.6
India 74.8 74.2 65.2 64.9 63.5 9.4 10.1 11.7 12.7 11.7 15.9 18.9 24.5 23.3 31.7 −0.1 −3.2 −1.4 −0.9 −6.9
Japan 49.3 54.6 53.0 56.4 59.8 10.7 14.1 13.3 16.9 20.7 38.8 32.3 32.8 25.3 20.4 1.2 −0.9 0.9 1.4 −0.9
Australia 54.7 55.9 58.4 59.5 54.1 13.9 17.7 18.1 17.7 18.1 31.7 28.3 23.7 22.6 27.5 −0.3 −1.9 −0.2 0.2 0.3
US 62.4 63.0 66.1 68.6 71.2 18.3 16.7 16.7 14.3 17.1 18.9 20.8 18.6 20.9 15.5 0.4 −0.5 −1.3 −3.8 −3.8
EU15 58.1 58.2 58.1 58.7 58.2 16.3 20.1 20.0 19.8 21.9 26.1 24.1 22.6 21.2 18.8 −0.5 −2.4 −0.8 0.3 1.1
©20
13 A
sian
Prod
uctiv
ity O
rgan
izat
ion

38
4 Expenditure
China’s household consumption has been trending downward as a share of GDP. It fell from 55.6% in 1970 to 46.7% in 2000. This compares with the early Communist era, when household consumption was more volatile and at a higher level of over 60% of GDP (Figure 22); China was less well off then. Figure 22 shows how household consumption share and investment share mirror each other. As the decline in household consumption share accelerated in the 2000s, plummeting to 36.4% in 2011, the investment share rose rapidly to 47.6% of GDP from 35.1% in 2000. There is also a notably rapid rise in exports as a share of GDP since the 1980s when China began to open its economy, from around 5.0% or below in the 1950s and 1960s to its peak of 37.0% in 2006 before softening to 26.5% in 2011.
With a low consumption ratio, coupled with an unsustainable rise in investment and an over-dependence on exports, China faces huge internal and external imbalances, which if not addressed could jeopardize its medium-term growth prospects. A low consumption share of GDP is not merely a reflection of consumer behavior or preference, but a manifestation of an array of underlying distor-tions in the economy: an undervalued currency with a wide range of factor price distortions which favors the production of tradables over non-tradables, may result in an unusually low consumption ratio and a heavy reliance on exports; lax corporate governance of state-owned enterprises is not conducive to distribution of dividends and therefore, in effect, may act to subsidize investment; and in the absence of a social safety net, well-developed domestic financial markets may provide a strong incentive for precautionary saving on the part of households (Eichengreen, Park, and Shin, 2011). All of these factors suggest that there are policy levers available to the government to impede or re-balance the economy.
In recent years, even labor-abundant China faced a tightened supply of surplus labor at its coasts, put-ting an upward pressure on wages.24 This could be good news for the world, as a higher labor share of GDP will enable higher household consumption, helping the domestic market to fulfill its potential. This will make China less dependent on foreign demand on the one hand and generate demand for foreign products on the other. Signs that the Chinese economy may have started moving in the right direction were evident when the decline in the consumption ratio halted (even turning up slightly since its recent trough in 2009) and external imbalances narrowed to 2.6% in 2011 – the lowest since 2004. Since the peak of 8.8% in 2007, net exports have been shrinking. Only time will tell if this is the start of a more persistent trend that reflects fundamental adjustments to the underlying economy.
India, another fast-emerging economy, has seen its household consumption share declining rap-idly in the past four decades, from 74.8% in 1970 to 63.5% in 2011 (Table 7). In contrast, the share of household consumption was relatively stable in the US at around 62–63% for the 1970s and 1980s before edging up to 71.2% of GDP in 2011. From a historical perspective, the current level is below that experienced during the Great Depression in the US when the consumption share was over 75% and even as high as 83% in 1932, and above its all-time low of below 50% in 1944 during World War II (Figure 23).
The share of household consumption in EU15, which is at around 58%, has stayed fairly stable over the past four decades. The Asian average, meanwhile, has hovered in the lower 50% range until recently
23: Based on the metadata survey on national accounts in Asian countries, Japan is an exceptional country that estimates GDP from its expenditure side. In other countries, GDP is estimated from the production side (value added in industries), and some countries record statistical discrepancy as the difference in the estimates between production-based GDP and the sum of final expendi-tures. In this Databook, statistical discrepancy is mainly attributed to household consumption when data is recorded. Readers should keep in mind that it can have some impacts on the share of final demand: e.g., it accounts for 2.5% of GDP in 1990 in the Thailand SNA published as of the end of 2011.
24: See Box 4.
©20
13 A
sian
Prod
uctiv
ity O
rgan
izat
ion

4
39
4.1 Composition of Final Demand
when the gap with EU15 widened, largely reflecting the trend in China (Table 7). Australia’s consump-tion ratio has never exceeded 60% of GDP and has dipped significantly in the past decade to 54.1%, reflecting a pickup in the investment share and the strong positive contribution made by net exports. Within Asia, all regions display a decline in household consumption ratios. South Asia maintains the highest share, despite its fall from 76.2% in 1970 down to 67.2% in 2011. In contrast, GCC economies are unusually skewed towards net exports because of their oil production.
Overall, Asian countries invest significantly more than the US and EU15. Historically, the wedge in the investment share of GDP between Asia29 and EU15 never exceeded 10 percentage points, but since the beginning of the 1990s, it has started to widen (except for the period of the Asian Financial Crisis). In 2011, the portion represented over 16 percentage points. In the 1970s, EU15 was investing on aver-age 4% more of their GDP than the US. Thereafter, the EU15 investment share converged to the US level and they were out of synch with each other temporarily in the late 1980s and early 1990s. For the past five years, a divergence has opened up with the US investment share of GDP declining faster than that of EU15 (Figure 31.3). In 2011, investment accounted for 15.5% and 18.8% of final demand in the US and EU15, respectively, compared with 35.5% for Asia23. Australia’s investment level has been closer to the level of the APO20 than that of the US/EU15 and in 2011 it accounted for over a quarter of final demand. The share of investment in China is the biggest final demand component of GDP since 2004 and, at 47.6% in 2011, it is probably unsustainable in the long term. East Asia has the high-est investment ratio among the Asian regions; South Asia caught up with them in 2007, but since then, the paths of the two regions diverged in the opposite directions. Now South Asia is converging with ASEAN countries, the investment intensity of which has not recovered since the Asian financial crisis of the late 1990s.
Compared to other components of final demand, the contribution of net exports to the Asian econo-my has always been more volatile. Having increased in Asia23 between 1990 and 2000 from 0.8% to 2.4%, the contribution of net exports has been ebbing away once again to 0.3% in 2011. In contrast, the net export share in China has been steady at a rate of 2.4–2.7% over the past two decades. This compares with the oil-exporting GCC countries at 9.5% in 1990, rising to 19.1% in 2000 and further to 26.9% in 2011. Including the GCC countries, the contribution of net exports to the GDP of Asia29 was 1.9% in 2011, compared to 1.6% in 1970 when net exports accounted for nearly a third of final demand
0
10
20
30
40
50
60
70
1952 1962 1972 1982 1992 2002
Exports
Imports (−)
Investment
Household ConsumptionHousehold consumption
%
Figure 22 Final Demand Shares in GDP of China, 1952–2011_Share of final demands with respect to GDP at current market prices
Sources: National accounts by National Bureau Statistics of China, including author interpolation.
10
0
20
30
40
50
60
70
1939 1949 1959 1969 1979 1989 1999 2009
80
Exports
Imports (−)
Investment
Household ConsumptionHousehold consumption
1929
%
Figure 23 Final Demand Shares in GDP of the US, 1929–2011_Share of final demands with respect to GDP at current market prices
Sources: National accounts by Bureau of Economic Analysis, US.
©20
13 A
sian
Prod
uctiv
ity O
rgan
izat
ion

40
4 Expenditure
in GCC countries. In the US, there is an observable trend of persistent deficit between exports and imports, which has considerably expanded from 0.5% of GDP in 1980 to nearly 4.0% in the mid-2000s before narrowing to 3.8% in 2011. South Asia is the only Asian region that consistently runs a trade deficit with fluctuating sizes over the years. Lately, it has become historically sizable at 7.1% of GDP in 2011. In EU15, net exports have turned into a positive component in the past two decades, account-ing for 1.1% in 2011.
The regional averages disguise the great variation displayed by individual countries. Figure 24 shows the cross-country comparisons of final demand shares in current-price GDP during 1995 and 2011; countries are arranged in descending order of their household consumption shares. Although most countries fall to the right of the US, there are a handful of Asian countries that have a higher consump-tion ratio than the US; Bangladesh, Cambodia, Nepal, Pakistan, and the Philippines fell to the left of the US in both years of comparisons, and a deficit in net exports tends to be associated with high household consumption. Countries with a low income will struggle to defer consumption. It is no coincidence that countries clustered on the left of Figure 24 tend to be those in the bottom income groups25 among the countries studied in this report (see Table 14, p. 88). Countries with a high
−25
0
25
50
75
100
125%
−25
0
25
50
75
100
125%
Qatar
BruneiSingaporeChinaKuw
aitO
man
Saudi ArabiaM
alaysiaG
CCEast AsiaKoreaThailandAsia29Asia23BahrainASEANJapanIndonesiaAPO
20RO
CEU
15AustraliaFijiH
ong KongIranU
AEM
ongoliaIndiaSouth AsiaU
STurkeySri LankaPakistanPhilippinesVietnamM
yanmar
Nepal
BangladeshCam
bodia52
11
43
95
615
−15
83
5
19
−6
81
8
27
−15
78
8
14
−1
74
8
27
−9
74
11
24
−9
73
9
20
−2
71
14
24
−9
68
9
24
0
67
15
19
−1
66
10
25
−2
64
11
27
−1
63
11
27
−1
63
8
25
4
62
13
17
8
62
8
34
−4
61
16
23
0
59
18
24
0
58
20
20
1
57
15
27
2
57
13
29
0
57
7
36
0
55
15
28
1
55
10
37
−2
54
21
14
11
54
13
32
0
54
14
32
1
52
11
37
−1−7
52
14
33
1
50
21
21
8
49
12
43
−4
47
23
20
10
45
28
21
5
43
32
15
10
43
14
42
2
42
8
33
16
36
25
35
4
33
31
35
1
1995
84 82 80 78 74 73 71 71 70 70 67 65 65 63 61 60 60 58 58 57 56 56 54 53 52 51 50 50 48 43 40 38 36 33 32 27 22 20 18
8 6 106 10 15 17 14 15 10 11 8 6 12 13 12 21 22
10 9 916 18 15
7 13 13 12 14 1510 13 13 16 15 19
15 1710
13 1833
25 2223 15 24 30
20 2923 33 32 28 21
20 1928 33 33 27 27 30
2836 35
63
22 40
22 18
48
23 26 27
16 13 31
−5 −5
−22
−5−9
−12−4 −9
−14
0
−7
4
−4 −7−1
7
−1
1 4 1 2 2 0 2
120 2
−24
16
2
28 31
3
28 27 2648 50 41
Qatar
BruneiKuw
aitSaudi ArabiaG
CCO
man
ChinaBahrainSingaporeEast AsiaM
alaysiaM
ongoliaAsia29Asia23U
AEKoreaAustraliaThailandIranIndonesiaASEANEU
15JapanRO
CAPO
20IndiaVietnamH
ong KongSouth AsiaM
yanmar
Sri LankaTurkeyU
SFijiPhilippinesBangladeshN
epalCam
bodiaPakistan
2011
Household consumption Government consumption Investment Net exports
Figure 24 Final Demand Shares in GDP, 1995 and 2011___Share of final demands with respect to GDP at current market prices
Sources: Official national accounts in each country, including author adjustments.Note: Household consumption includes consumption of NPISHs. For Myanmar, however, household consumption includes government consumption due to data limitations. Investment includes GFCF plus changes in inventories.
©20
13 A
sian
Prod
uctiv
ity O
rgan
izat
ion

4
41
4.1 Composition of Final Demand
proportion of dependent population (under-15s and over-65s) also tend to have a high household consumption share in their GDP (see Figure 25).
At the other end of the spectrum, GCC and other oil-exporting countries tend to cluster at the low end of household consumption share of GDP in both years of comparison. The aver-age household consumption share for GCC countries has been squeezed by net exports (which in turn are dominated by erratic oil rev-enues), from 50.3% in 1995 to 32.0% in 2011.26 Given that a large part of GCC countries’ GDP is not sustainable income, it may in fact be pru-dent for oil-exporting countries not to over-consume beyond their sustainable levels and rather, purposefully invest much to generate a steady income stream in the eventuality of oil depletion – no matter how distant this may seem now. Among the non-oil-exporting Asian countries, it was Singapore that had the smallest household consumption share, but since 2002 China has replaced Singapore in pole position, with a share of 36.4% in 2011.
Net exports are particularly important in a handful of economies; in 2011 in Singapore export shares were at 27.6%, in Malaysia it was 16.5%, and in Hong Kong it was 3.9% reflect-ing their entrepôt function in Asia. This explains why the total values of exports and imports are ex-ceptionally high, relative to the size of GDP in these economies (Figure 26). Once the 2008 SNA is im-plemented, however, these values will be adjusted to reflect a change in the ownership of goods rather than accounting for goods moved for processing without incurring actual transactions.
Figure 27 shows the long-term trends of household consumption share of GDP for selected Asian countries. The Asian Tigers have been the consistent high performers, and come at the top for most of the level indicators presented in Chapter 3. As seen in Figure 27.1, Singapore and Korea showed the most rapid relative retrenchment in household consumption as a share of GDP in their initial stage of development. While the downward trend continues in Singapore, it has halted and been mildly re-versed in Korea since the late 1980s. Between 1970 and 2011, the household consumption share of GDP fell from 69.1% of GDP to 40.0% and from 74.1% to 53.1% in Singapore and Korea, respectively.
25: The Lao PDR is also in the bottom income bracket; it is, however, omitted from Figure 24 because of a lack of final demand data.26: It should also be noted that the shares are calculated in current market prices. Revenues from oil exports are notoriously erratic.
It is possible that a sudden surge in export revenues relative to imports can squeeze the shares of other components of final de-mand without any real change in the underlying behavior in the economies. For example, Qatar has the smallest share of house-hold consumption, which shrank from 32.9% in 1995 to 18.9% in 2010, while over the same period, net exports swung from 1.0% to 26.1%. Similarly, net exports for GCC countries as a whole swung from 7.8% to 18.2%, squeezing household consumption from 50.3% in 1995 to 32.0% in 2011.
10
20
30
40
50
60
70
80
90
10 15 20 25 30 35 40
%
Dependent population ratio
Household consumption share in GDP
45 %
Bangladesh
Cambodia
ROC
Hong Kong India
IndonesiaJapan
Korea
Iran
Bahrain
Malaysia
Mongolia
Nepal
Pakistan
Philippines
Singapore
Sri Lanka
Thailand
Vietnam
Brunei
China
Myanmar
Kuwait
Oman
Qatar
Saudi Arabia
UAEAustralia
TurkeyUS
Fiji
Figure 25 Ratio of Dependent Population and Consumption Share in GDP at Current Prices, 2011_Shares of dependent population (under-15s and over-65s) to total population and consumption share to GDP
Sources: Population data by national statistical office in each coun-try; World Bank, World Development Indicators; official national ac-counts in each country with author estimates.
©20
13 A
sian
Prod
uctiv
ity O
rgan
izat
ion

42
4 Expenditure
In contrast, household consump-tion as a share of GDP, at 64.9% in 2011, has held steady in Hong Kong over the past four decades with no established long-term downward trend. The household consumption share did fall from 64.8% in 1970 to nearly 55% in the late 1980s, but it was subse-quently reversed. Only time will tell if the recent pickup in con-sumption share is the start of a more persistent upward trend to-wards record levels. Similarly, rela-tive household consumption fell in the ROC, from 56.6% in 1970 to under 50% in the mid-1980s. Since then, it has been on an up-ward climb until the 2000s when it stabilized at around 60%.
Figure 27.2 plots the trends of household consumption in the three largest Asian economies by size. The downward long-term trend in India and China is unmis-takable.27 The falling share of household consumption may partially reflect the falling labor income share of GDP and/or an uneven distribution of economic gain between the rich and the poor in these countries. Further-more, the fact that India has a de-pendent population (under-15s and over-65s) of 35.2%, compared with 25.6% in China, may help to explain why India has had to sus-tain a relatively high share of household consumption despite its falling trend over time, whereas China’s share has fallen below the norm of country’s experience (Figure 25). In contrast, the household consumption share in Japan has been rising slowly since 1970, from just under 50% in 1970 to almost 60% in 2011. With a rapidly aging population, this rising trend can be expected to continue. Japan’s share of dependent population stood at 36.4% in 2011, nearly 60% of which was accounted for by the over-65 age group (Figure 28). To a lesser extent, all the Asian Tigers, China, Australia, and the US have a high proportion of over-65s relative to other countries.
27: The Chinese official statistics on household consumption could be misleading. Zhang and Tian (2013), for example, point out three potential sources of a significant downward bias in Chinese consumption data. Firstly, the method used to impute rents for owner-occupiers does not take into account land costs, and in turn greatly underestimates the market values of housing. Sec-ondly, private consumption on company accounts is misclassified as business costs (i.e., intermediate consumption) or investment expenditure. Thirdly, sample selection bias (under-representation of high income households) and reporting errors also contribute to the underestimation of household consumption. The authors suggest that taking into account these factors could add 10–15 percentage points to China’s consumption, which would bring it to a level more comparable with other East Asian countries.
0
−100
−80
−60
−40
−20
20
40
60
80
100%
−100
−80
−60
−40
−20
0
20
40
60
80
100%
Cambodia
Nepal
PhilippinesSri LankaVietnamThailandBangladeshH
ong KongM
alaysiaPakistanU
SIndiaM
ongoliaM
yanmar
KoreaAustraliaTurkeyIndonesiaFijiQ
atarJapanEU
15RO
CChinaBruneiU
AEO
man
IranSaudi ArabiaKuw
aitBahrainSingapore
2011
Exports Imports Net exports
−166
182
−27−22
−20
−48
−31
−180
−29
−78−73
−226
−69
−24−19
−54
−70
−25
−41
−21 −16−18
−90
−36
−19
−59
−32−31
−33
−66
−37−32
−87
7870
61
79207 230
59 56
9585
76
27 21
56
71
26
42
22
00
15 14
86
31
14
54
26 23 24
54
2310
62
−67
−42−28
−14
−29−41
−53
−18
−45
−27
−8
−43
−59
−25−18−19
−29
−2
−36
−12−12
−16
−95−148
−17
−48−42−43−41−38
−46
78
52
37
2235
4457
20
47
29
9
44
59
2518 19
28
1
35
11 11 14
91143
11
4233 34 31
2231
Mongolia
Nepal
Sri LankaFijiTurkeyBangladeshIndiaCam
bodiaPakistanPhilippinesVietnamU
SJapanM
yanmar
AustraliaEU
15IndonesiaThailandKoreaIranChinaH
ong KongRO
CU
AEM
alaysiaSaudi ArabiaSingaporeO
man
BahrainQ
atarKuw
aitBrunei
1995
Figure 26 Export and Import Shares in GDP, 1995 and 2011___Share of exports and imports with respect to GDP at current market prices
Sources: Official national accounts in each country, including author adjustments.
©20
13 A
sian
Prod
uctiv
ity O
rgan
izat
ion

4
43
4.1 Composition of Final Demand
Figure 27.3 illustrates the observations of Table 7, plotting Asian group averages against those of the reference countries. The US household consumption share has been climbing since the mid-1980s to nearly 71% of GDP in 2011, from a level of around 62%. Today the US level is more than 10% higher than that of EU15 and the APO20,28 both of which have been fluctuating between 57% and 60% since the mid-1990s. In 1970, household consumption accounted for around 50% of GDP in APO countries. It rose to a peak of 57.1% in 1983 before falling back and hovering around 55%. Since the early 1990s, however, it has been trending upwards and went over the 60% mark in 2011. The pattern in APO closely follows that of Japan. After the bubble burst and its economy floundered, the investment share of GDP shrank – with household consumption and government consumption both inflating their shares to sustain final demand (see Figure 24). In contrast, the consumption share for Asia29 declined rapidly from 55.7% to around 50% over the past decade. This largely reflects China’s recent household consumption behavior as it gained gravity in the regional economy. Australia’s levels have been fluctuating between that of EU15 and Asia29 in the 1970s and 1980s, and inclined towards EU15’s level in the 1990s, but its trend in the past decade has diverged again and become similar to that of Asia29, albeit at different levels. The trends of South Asia and East Asia are dominated by those of India and China, respectively (Figure 27.4).
30
40
50
60
70
1975 1980 1985 1990 1995 2000 2005 2010
APO20USAustralia
30
40
50
60
70
1970 1975 1980 1985 1990 1995 2000 2005 2010
East AsiaSouth AsiaASEAN
30
40
50
60
70
1975 1980 1985 1990 1995 2000 2005 2010
ROCHong KongKoreaSingapore
30
40
50
60
70
1970 1975 1980 1985 1990 1995 2000 2005 2010
ChinaIndiaJapan
Figure 27.4
Figure 27.2
1970
Figure 27.3
1970
Figure 27.1
Asia29EU15
80%
80%
80%
80%
Figure 27 Long-Term Trend of Household Consumption Share in GDP, 1970–2011___Share of household consumption with respect to GDP at current market prices
Sources: Official national accounts in each country, including author adjustments.
28: It is worth noting that the GDP share of government consumption in EU15 was 9.2 percentage points higher than the average of Asia23 in 2010 (Table 7). In fact, when it comes to welfare measurement, actual individual consumption, as opposed to household consumption, is preferred because the former takes into account expenditures by NPISHs and government expenditures on indi-vidual consumption goods and services (such as education and health) in addition to household consumption.
©20
13 A
sian
Prod
uctiv
ity O
rgan
izat
ion

44
4 Expenditure
US, accounting for one-fifth of consumption, are unreflected in other countries.
Figure 31 looks at the long-term trend of investment share in GDP across countries. Historically, an investment share in the region of 40% or above seems to be unsustainable in the long run. We see that Japan’s investment share of GDP steadily declined over the past decades from 38.8% in 1970 to 20.4% in 2011 (Figure 31.2). In the initial period, Singapore also sustained an investment share of 40% or above. Since the mid-1980s, however, it has seen a downward trend, in spite of its fluctuations. In 2011, the investment ratio was 22.2%. The investment share hit 40% in the ROC and Korea at different times but these were no more than temporary spikes (Figure 31.1). In contrast, the investment share in China and India has been rising. India in particular has been investing very aggressively since 2000, coming as close as 5.2 percentage points to China’s 41.7% share in 2007. Since then, the gap has wid-ened to 15.9% in 2011 as investment in India softened (Figure 31.2). If history is any guide, the contri-bution of investment to final demand in China will drop sooner or later. South Asia and East Asia’s investment shares are dominated by the effort in India and China, respectively. ASEAN’s investment share used to be around 35%, but it fell sharply to around 25% during the Asian financial crisis in the late 1990s and is slowly inching up, reaching 28.3% in 2011. In the past two and a half decades, the investment share in GCC countries has fluctuated between 20–30% of GDP (Figure 31.4).
Lao PDRNepal
PakistanPhilippines
MyanmarJapan
CambodiaSouth Asia
BangladeshIndia
APO20FijiUS
ASEANSaudi Arabia
AustraliaTurkey
Sri LankaIndonesia
MalaysiaMongolia
Asia23Asia29OmanBrunei
ThailandKuwait
VietnamIran
GCCKorea
East AsiaSingapore
ROCChina
Hong KongBahrain
UAEQatar
Age 0–14Age over 65
0 5 10 15 20 25 30 35 40 45%
37353534
3113
32313130
2829
2027
3019
2526272727
2424
2726
2027
232326
161617
1516
1221
1714
45
44
623
4555
65
136
314
76654
773
49
266
211109
119
132
01
Figure 28 Share of Dependent Popu-lation, 2011
Sources: Population data by national statistical office in each country; World Bank, World Development Indicators.
The decomposition of household consumption reveals a huge diversity of consumption patterns among individu-al countries, partly reflecting their income levels and partly the idiosyncratic characteristics of the society. Fig-ure 29 strongly illustrates the cross-country version of Engel’s Law, which says that basic necessities will account for a high proportion of household consumption for a lower per capita income group and vice versa. More spe-cifically, countries where food and non-alcoholic bever-ages account for a large proportion of consumption tend to have low income (i.e., in groups L3 or L4 in Table 14). Figure 30 traces the decreasing long-term path of Japan’s Engel’s Curve for the period 1949–2011 and the coun-tries’ levels in 2010 are mapped against Japan’s experi-ence (as circle). Among the selected countries, it is staggering to note that in 2010, 52.7% of Bangladesh’s household consumption was spent on food and non- alcoholic beverages at one end of the spectrum, com-pared with only 6.6% in the US at the other end. This trans-lates into the fact that low-income countries spend 30– 50% of their GDP on food and non-alcoholic beverages, which corresponds to Japan’s experience in the 1950s and the 1960s. Eating out, recreation and culture are luxuries that the least well-off countries cannot afford in contrast to their richer counterparts. Besides food and non-alcoholic beverages, housing/utilities and transport are the other two large spending categories. In rich eco-nomies, these two categories account for bigger shares in household consumption than food and non-alcoholic beverages. Idiosyncratic spending, such as education in Indonesia and Korea accounting for 7.5% and 7.2% of household consumption, respectively, and health in the
©20
13 A
sian
Prod
uctiv
ity O
rgan
izat
ion

4
45
4.1 Composition of Final Demand
Figure 32 shows the nominal invest-ment share of six types of assets for some selected countries.29 For most countries, investment is still very much construction-based (i.e., in dwellings, non-residential build-ings, and other structures). Howev-er, the expansion of IT capital in the past four decades is significant in the US, Japan, Asian Tigers, and Ma-laysia even at the current price com-parisons. The real-term comparisons are conducted at the flow and stock levels in Chapter 5.
Figure 33 plots the long-term trend of net export share in GDP from 1970 to 2011. Among the selected countries, India can be identified as prone to running a trade deficit, which deteriorated rapidly from the mid-2000s to 6.9% of GDP in 2011 (Figure 33.2). In contrast, net ex-ports, which used to be a huge drag on the Asian Tigers, Singapore, and Korea in the 1970s, have rapidly im-proved their position. In recent years, net exports are making a pos-itive contribution to GDP for all the Asian Tigers. The share of net ex-ports in Singapore is particularly large, at 27.6% in 2011, compared with 2.0%, 6.6%, and 3.9% for Korea, the ROC, and Hong Kong, respec-tively (Figure 33.1). China is another country that has turned around its net export position to transform it into a significant positive contribu-tion to final demand. The net ex-ports share of GDP peaked at 8.8% in 2007; since then, it has slackened at 2.6% in 2011, reflecting, among other factors, weaker foreign de-mand as a consequence of the glob-al financial crisis (Figure 33.2).
Figure 33.3 illustrates the external imbalance of the world’s major economies. Both the US and EU15 faced a trade deficit at the beginning
0
10
20
30
40
50
60
70
80
90
100%
US
SingaporeAustraliaRO
CKoreaJapanH
ong KongM
alaysiaIranThailandIndiaM
ongoliaIndonesiaCam
bodiaSri LankaBangladeshFiji
Miscellaneous goods andservices
Restaurants and hotels
Education
Recreation and culture
Communication
Transport
Health
Furnishings, householdequipment, and routinehousehold maintenance
Housing, water, electricity, gas and other fuels
Clothing and footwear
Alcoholic beverages, tobacco and narcotics
Food and non-alcoholicbeverages
5753
40 37 36 3630 27 25 22
15 14 13 13 10 7 7
22
311
4
44
2
3 2 24
2
36
104
310
7
5
53 14
3 5 53
3 4
12 17
1117
10
20
13
9
31
1618
2516 18 23
18 19
53
5 42
3
4
4
5
5
10
4
3 55
6 4
2 3
2 52
4
4
8
2
5
4
710 6
7
21
6 4
24
814
9
15
16
9
13
9
11
12
1110
14
10
3 53
2
2
3
8 3
44
22
2
12
44
2
5
3
5 7 10
8
911
13
9
45
7 3
31
2
22 2
74
43
3
22 5
22
2 12
3
10 6 8 77 9
6
84 5 4 3 7
1510
412
2014 13 12 15 16 15
Figure 29 Household Consumption by Purpose, 2010
Note: For data of Hong Kong, transportation includes communication; recreation and culture includes hotels; miscellaneous goods and services include restaurants. For data of Sri Lanka, transportation includes communication; food and non-alcoholic beverages includes alcoholic beverages, tobacco and narcotics. For Fiji and Indonesia, the observation period is 2009.Sources: Official national accounts in each country.
0.1
0.2
0.3
0.4
0.5
0.6
0.7
1940 1950 1960 1970 1980 1990 2000 2010 2020
Food consumption share in 2010 relative to Japan
Fiji
Indonesia
Sri Lanka
Mongolia Cambodia
India
Thailand
Iran
MalaysiaJapan
Korea
HongKongROC
SingaporeUS
Bangladesh
Japan (1949–2010)
Figure 30 Engel Curve of Japan during 1949–2010 and Levels of Asian Countries in 2010___Share of food in household consumption
Note: Food is defined as sum of food and non-alcoholic beverages and alcoholic beverages, tobacco and narcotics. For Fiji and Indonesia, the observation period is 2009. Sources: Official national accounts in each country. The historical data of Japan is based on JSNA by ESRI, Cabinet Office of Japan.
©20
13 A
sian
Prod
uctiv
ity O
rgan
izat
ion

46
4 Expenditure
29: The investment data by type of assets includes our own estimates for the countries where data is not available. Although our es-timates are constructed based on ten classifications of assets, they have been aggregated into six assets for the purposes of this table. The IT capital is defined as IT hardware, communications equipment, and computer software.
10
20
30
40
ROCHong KongKoreaSingapore
00
00
10
20
30
40
ChinaIndiaJapan
10
20
30
40
APO20Asia29USEU15Australia
10
20
30
40
East AsiaSouth AsiaASEANGCC
50%
50%
50%
50%
1975 1980 1985 1990 1995 2000 2005 2010 1970 1975 1980 1985 1990 1995 2000 2005 2010
1975 1980 1985 1990 1995 2000 2005 2010 1970 1975 1980 1985 1990 1995 2000 2005 2010
Figure 31.4
Figure 31.2
1970
Figure 31.3
1970
Figure 31.1
Figure 31 Long-Term Trend of Investment Share in GDP, 1970–2011___Share of investment with respect to GDP at current market prices
Sources: Official national accounts in each country, including author adjustments.
0
20
40
60
80
100%
0
20
40
60
80
100%
Dwellings Non-residential buildings Other structures
Transport equipment IT capital Other non-IT capital
IndiaIranVietnamKoreaH
ong KongFijiU
SJapanSingaporeIndonesiaPakistanM
alaysiaM
ongoliaThailandRO
CSri LankaPhilippinesChina
1970
SingaporePakistanSri LankaVietnamIranChinaJapanU
SH
ong KongKoreaRO
CFijiThailandIndonesiaIndiaM
alaysiaM
ongoliaPhilippines
2011
3927 23 23 23 22 22 20 19 18 16 16 15 11 9 8 5
8
8 15 21 2134
17 18 13 13 13 1829
17 15 2519 27
1624 22
238
12
17 20
9
32
55
18
30
1814
2126
22
1011 12
13
13
12
10 13
11
8
4
12
8
21
15
11 16 5
4
4
7 4
5 4
5
26 30 24 1832
1627 26
4328
11
3517
3042 35 30
42
28 25 24 24 20 18 15 15 13 11 11 11 10 9 9 8 5 5
21
4 11 1510
2512 12 13 22 19 20
7
32 3318 20 18
9
1927 24
2820
23 18 13
2315 14
14
43
16
2314
28
1011
9 1512
9
98
7
7
617
26
813
14
16
13
74
75
15 22
14
9
127 12
5
13
9
8
1932 25
1628 23 26 25
3927
37 32 32
8
31 2538
26
Figure 32 Investment Share by Type of Asset, 1970 and 2011
Sources: Official national accounts in each country, including author estimates based on input–output tables and trade data.
©20
13 A
sian
Prod
uctiv
ity O
rgan
izat
ion

4
47
4.1 Composition of Final Demand
−24
−16
−8
8
0
16
24
32% %
% %
1970 1975 1980 1985 1990 1995 2000 2005 2010
ROCHong KongKoreaSingapore
Figure 33.1
−6
−4
−2
0
2
4
6
8
10
1970 1975 1980 1985 1990 1995 2000 2005 2010
ChinaIndiaJapan
Figure 33.2
−8
−4
4
0
8
12
1970 1975 1980 1985 1990 1995 2000 2005 2010
East AsiaSouth AsiaASEAN
Figure 33.4
1970 1975 1980 1985 1990 1995 2000 2005 2010
USAustralia
EU15Asia29APO20
Figure 33.3
−6
−4
−2
0
2
4
6
Figure 33 Long-Term Trend of Net Export Share in GDP, 1970–2011___Share of net exports with respect to GDP at current market prices
Sources: Official national accounts in each country, including author adjustments.
of this period. While EU15 managed to revert and has been in surplus since the early 1990s (within a range of 0–2% of GDP), the US position has significantly deteriorated since the middle of the 1990s, despite a tremendous effort in restoring its trade balance in the late 1980s. In 2011, the size of the US trade deficit stood at 3.8% of its GDP, compared to its recent dip to 5.8% of GDP in 2006. Australia has been running a trade deficit for most of this period; only in the past few years has its trade balance been in surplus. In contrast, Asia29’s trade has been in surplus continuously and a near mirror-image of the US. Asia29’s net exports share of GDP was 1.9%, compared to the recent peak of 5.3% in 2011. Addressing this external imbalance has been highlighted as a necessary step to healthy and sustained growth in the world economy.
©20
13 A
sian
Prod
uctiv
ity O
rgan
izat
ion

48
4 Expenditure
Timely analysis of the current economic situation is beyond the scope of this Databook, which presents results based on annual data, with the latest year covered as 2011. In the meantime, for an insight into, for example, the current economic growth, one has to rely on countries’ quarterly national accounts (QNA). Although they are timelier, the QNA are often less precise, and subject to frequent revisions as more reli-able data become available in their normal estimation cycle. With this trade-off between timeliness and data quality in mind, the APO sees the complementary benefits of collating and presenting countries’ QNA alongside its database of annual data. As a result, the APO and KEO have developed an Asian Quarterly Growth Map (AQGM) that provides an instinctive understanding of recent economic growth covering Asian countries. Readers can find it at the APO website (www.apo-tokyo.org/AQGM.html).
The AQGM visualizes the seasonally adjusted rates of quarterly economic growth at constant prices. It is worth noting that there are three constant-price measures of quarterly growth. The first is the quarterly output compared with the same quarter in the previous year, which is also called the year-on-year quar-terly growth. The second is quarterly output of the previous quarter, or the quarter-on-quarter growth rate. The third is the annualized quarter-on-quarter growth rate, which is also often used in economic analyses of the current economic situation. The first two measures are presented in the AQGM (with year-on-year growth displayed as a default).
The current version includes 21 Asian countries that publish QNA: China, Hong Kong, India, Indonesia, Iran, Japan, Korea, Malaysia, Mongolia, the Philippines, the ROC, Singapore, Sri Lanka, Thailand, Vietnam, Arme-nia, Cyprus, Georgia, Israel, Jordan, and Turkey. For the purpose of international comparisons, the current version includes 50 non-Asian countries, based on data available from the OECD.Stat and independent publications by the respective statistical offices in those countries. The AQGM is updated at least once a month, to reflect revisions and capture newly available data. Based on the AQGM, Figure B3.2 presents year-on-year quarterly GDP growth and available quarter-on-quarter GDP growth for Asian countries, the US, and EU15 from 2011Q4 to 2012Q4.
continued on next page >
Box 3 Quarterly Economic Growth
Figure B3.1 Views of Quarterly Economic Growth in Asian Countries by the AQGM
Source: Asian Quarterly Growth Map, January 2013.
©20
13 A
sian
Prod
uctiv
ity O
rgan
izat
ion

4
49
4.2 Demand-Side Growth Decomposition
4.2 Demand-Side Growth Decomposition
Figure 34 shows the decomposition of the average annual economic growth by final demand for the periods 1995–2000 and 2000–2011, respectively with Asia29 growing faster in the latter period than the former (at 5.8% on average per annum compared with 4.1% as presented in Table 3, p. 18).30 The earlier period was atypical in that it embodied the impact of the Asian financial crisis, and there were some erratic contributions by the final demand components observed. On one hand, investment has
> continued from previous page
Figure B3.2 Quarterly Economic Growth in Asian Countries, 2010Q4 – 2012Q4
Source: Asian Quarterly Growth Map, January 2013.
Compared to the same quarter in previous year Compared to previous quarter
−2
0
2
4
6
8
10China
−2
0
2
4
6
8
10ROC
−2
0
2
4
6
8
10Hong Kong
−2
0
2
4
6
8
10India
−2
0
2
4
6
8
10
2010Q4
2011Q1
2011Q2
2011Q3
2011Q4
2012Q1
2012Q2
2012Q3
2012Q4
2010Q4
2011Q1
2011Q2
2011Q3
2011Q4
2012Q1
2012Q2
2012Q3
2012Q4
2010Q4
2011Q1
2011Q2
2011Q3
2011Q4
2012Q1
2012Q2
2012Q3
2012Q4
2010Q4
2011Q1
2011Q2
2011Q3
2011Q4
2012Q1
2012Q2
2012Q3
2012Q4
2010Q4
2011Q1
2011Q2
2011Q3
2011Q4
2012Q1
2012Q2
2012Q3
2012Q4
2010Q4
2011Q1
2011Q2
2011Q3
2011Q4
2012Q1
2012Q2
2012Q3
2012Q4
2010Q4
2011Q1
2011Q2
2011Q3
2011Q4
2012Q1
2012Q2
2012Q3
2012Q4
2010Q4
2011Q1
2011Q2
2011Q3
2011Q4
2012Q1
2012Q2
2012Q3
2012Q4
2010Q4
2011Q1
2011Q2
2011Q3
2011Q4
2012Q1
2012Q2
2012Q3
2012Q4
2010Q4
2011Q1
2011Q2
2011Q3
2011Q4
2012Q1
2012Q2
2012Q3
2012Q4
2010Q4
2011Q1
2011Q2
2011Q3
2011Q4
2012Q1
2012Q2
2012Q3
2012Q4
2010Q4
2011Q1
2011Q2
2011Q3
2011Q4
2012Q1
2012Q2
2012Q3
2012Q4
2010Q4
2011Q1
2011Q2
2011Q3
2011Q4
2012Q1
2012Q2
2012Q3
2012Q4
2010Q4
2011Q1
2011Q2
2011Q3
2011Q4
2012Q1
2012Q2
2012Q3
2012Q4
2010Q4
2011Q1
2011Q2
2011Q3
2011Q4
2012Q1
2012Q2
2012Q3
2012Q4
2010Q4
2011Q1
2011Q2
2011Q3
2011Q4
2012Q1
2012Q2
2012Q3
2012Q4
2010Q4
2011Q1
2011Q2
2011Q3
2011Q4
2012Q1
2012Q2
2012Q3
2012Q4
2010Q4
2011Q1
2011Q2
2011Q3
2011Q4
2012Q1
2012Q2
2012Q3
2012Q4
2010Q4
2011Q1
2011Q2
2011Q3
2011Q4
2012Q1
2012Q2
2012Q3
2012Q4
2010Q4
2011Q1
2011Q2
2011Q3
2011Q4
2012Q1
2012Q2
2012Q3
2012Q4
2010Q4
2011Q1
2011Q2
2011Q3
2011Q4
2012Q1
2012Q2
2012Q3
2012Q4
2010Q4
2011Q1
2011Q2
2011Q3
2011Q4
2012Q1
2012Q2
2012Q3
2012Q4
2010Q4
2011Q1
2011Q2
2011Q3
2011Q4
2012Q1
2012Q2
2012Q3
2012Q4
2010Q4
2011Q1
2011Q2
2011Q3
2011Q4
2012Q1
2012Q2
2012Q3
2012Q4
2010Q4
2011Q1
2011Q2
2011Q3
2011Q4
2012Q1
2012Q2
2012Q3
2012Q4
Indonesia
−2
0
2
4
6
8Japan
−2
0
2
4
6
8Korea
−2
0
2
4
6
8Malaysia
0
5
10
15
20
25Mongolia
−2
0
2
4
6
8Philippines
−202468
101214
Singapore
0
3
6
9Sri Lanka
−12
−8
−4
0
4
8
12Thailand
0
3
6
9Vietnam
−2
−1
0
1
2
3
4
5Australia
−1
0
1
2
3
4
5US
−1
0
1
2
3
4
5France
−4
−3
−2
−1
0
1
2
3Spain
−1
0
1
2
3
4
5Canada
−4
−3
−2
−1
0
1
2
3Italy
−4
−3
−2
−1
0
1
2
3Portugal
−2
0
2
4
6
8
10
12Turkey
−4
−3
−2
−1
0
1
2
3United Kingdom
−1
0
1
2
3
4
5Germany
−4
−3
−2
−1
0
1
2
3Ireland
% % % % %
% % % % %
% % % % %
% % % % %
% % % % %
©20
13 A
sian
Prod
uctiv
ity O
rgan
izat
ion

50
4 Expenditure
hold consumption, 17.7% by gov-ernment consumption, 26.2% by investment, and 15.7% by net exports. This compares with av-erage annual growths of 4.2% in the US and 2.9% in EU15. The con-tribution from household con-sumption was 72.2% and 59.9% in the US and EU15, respectively, whereas investment growth ac-counted for 38.2% and 32.7% of overall growth in the US and EU15, respectively.
On the back of the Asian financial crisis, investment growth surged strongly: its impact on real GDP growth became more significant in Asia in the 2000s, especially in the fast-growing economies. For example, investment contributed 5.9 percentage points in China, 2.5 percentage points in Myan-mar, 3.1 percentage points in In-dia, and 3.3 percentage points in Vietnam. The role played by investment in China has strength-ened, with its contribution to eco-nomic growth doubling between 1995–2000 and 2000–2011 from 26.2% to 54.9%, whereas the con-tribution of net exports dwin-dled from 15.7% to 4.2%. However, for Singapore and the ROC, the
shaved 4.8 and 3.4 percentage points off the overall economic growth in Thailand and Indonesia, respec-tively, canceling out growth in other components of final demand and leaving its GDP at a standstill. On the other hand, some countries received a huge boost in net exports, which contributed, for ex-ample, 6.7 and 4.8 percentage points to economic growth in Qatar and Malaysia, respectively. During this period, for most countries in Asia the engine of growth was household consumption while invest-ment growth was more subdued. Qatar experienced the fastest economic growth among the coun-tries studied, averaging 8.9% per year, three-quarters of which was driven by net exports. Unlike the nature of growth in Qatar, China’s growth was more even, with all components making their fair shares of positive contribution. Out of its average annual growth of 7.7%, 40.4% was contributed by house-
30: The Törnqvist quantity index is adopted for calculating the growth of real GDP. Using this index, the growth of real GDP into the products of contributions by final demands can be decomposed:In (GDPt / GDPt−1) = ∑ i (1/2) (si
t + sit−1) In (Qi
t / Qit−1)
Real GDP growth Contribution of final demand i where Qi
t is quantity of final demand i in period t and sit is expenditure share of
final demand i in period t. Thus, the real GDP growth may diverge from the official estimates or those presented in Table 3 (p. 18).
−6
−4
−2
0
2
4
6
8
10
Qatar
ChinaVietnamU
AESingaporeRO
CIndiaCam
bodiaM
alaysiaSri LankaKoreaM
yanmar
TurkeyU
SBangladeshAustraliaBahrainPakistanO
man
EU15
IranPhilippinesSaudi ArabiaH
ong KongBruneiKuw
aitJapanThailandIndonesia
%
−4
−2
0
2
4
6
8
10
12
Qatar
Myanm
arChinaCam
bodiaIndiaVietnamBahrainSri LankaBangladeshSingaporeIranIndonesiaM
alaysiaPhilippinesPakistanKuw
aitTurkeyKoreaO
man
ThailandH
ong KongRO
CN
epalU
AESaudi ArabiaAustraliaU
SEU
15BruneiJapan
1995–2000
2000–2011
Household consumption Government consumption
Investment Real GDPNet exports
−0.7
3.1 3.54.6
2.53.4 3.5 3.7
1.5 2.9 1.92.5 3.1 3.0
1.72.3 2.3 3.0
1.3 1.72.9 3.2
−0.21.1
0.2
2.40.4
0.4
2.01.0
1.40.2
0.6
1.10.4 0.9 0.6
0.3
0.8
0.40.5
0.60.2
0.1
0.50.4
0.1
0.0 0.3
0.4 0.0
1.6 0.20.5
−0.60.4 0.5
−0.1
1.8
2.02.6
1.12.4 1.3 0.9 1.2
−1.3
1.8
0.1
1.6 1.0 1.62.0
0.9 0.2
0.0
0.40.9
1.5
−0.6
0.8
−0.4−2.4
0.3
−0.2
−4.8−3.4
6.71.2
0.6 0.2 0.50.4 0.2
−0.1
4.8
−0.5
2.7
0.1
−0.3 −0.7
0.2
0.0
0.6
0.1 1.4
−0.1−2.0
0.00.4
1.5 3.4
−0.4
0.2
4.0 1.5
2.7
7.5
3.1
6.84.6 4.6
2.94.0 3.6
1.53.3 2.6 2.9 3.3 2.9
1.5
3.01.8 2.7 2.2 2.3 1.4
3.22.3 1.8 1.9
1.4 0.7 1.1 0.5
1.1
0.9
1.3
0.5
0.6 0.5
1.0
0.90.4
0.4
0.3 0.61.0 0.3 0.7
0.9
0.5
0.6
1.30.8
0.2 0.1
0.50.4 1.2 0.6
0.3 0.40.7
0.3
6.1
2.5
5.91.8
3.1 3.3
2.7
2.0
1.8
0.3
3.4
1.8 0.8 1.1 0.5 2.21.2
0.8
3.0
1.30.5
−0.3
2.02.1 2.0 1.8
−0.1
0.8
−0.4
1.40.0 0.5
−0.5−0.7
−1.2−0.4−1.1−0.1
3.2
−1.8
0.2
−0.1−0.1
0.3
−0.3−0.4
1.0
−2.8−0.2
1.1 2.6
−1.9−1.1−1.4−1.2
0.0 0.2
−1.7
0.3
%
Figure 34 Final Demand Contributions to Economic Growth, 1995–2000 and 2000–2011_Decomposition: Average annual growth rate of GDP at constant market prices
Sources: Official national accounts in each country, including author adjustments.
©20
13 A
sian
Prod
uctiv
ity O
rgan
izat
ion

4
51
4.2 Demand-Side Growth Decomposition
strength of net exports was the real economic story, accounting for 58.7% and 69.2% of their eco-nomic growth on average per year between 2000 and 2011, respectively (Figure 35). The reverse was true in India, where net exports swung away from making a positive contribution of 2.8% in the ear-lier period to being a drag on economic growth with a negative contribution of –9.9% in the period 2000–2011. In some of these economies, the contribution of household consumption to economic growth was really squeezed; for example, from 40.4% in 1995–2000 to 28.9% in 2000–2011 in China, from 39.2% to 27.2% in Singapore, and from 61.8% to 36.0% in the ROC. Also, in the latter period net exports made negative contributions in countries such as Vietnam, Nepal, Cambodia, India, and most of the oil-exporting countries.
In the 2000s, economic growth slowed in both the US and EU15 – from 4.2% on average per year in 1995–2000 to 1.5% in 2000–2011, and from 2.8% to 1.3%, respectively. In terms of contributions, household consumption increased from 72.2% to 88.6% and government spending from 5.9% to 17.8% in the US over the two periods. Investment in the US took a plunge, however, from a contribu-tion of 38.2% to –8.0% over the two periods although its net exports improved from –16.2% to 1.7%. EU15 had a similar pattern, where the contribution of government spending nearly tripled over the two periods from 12.0% to 28.6%, squeezing out the contribution of investment by nine-tenths, while household consumption remained more or less stable. Its net exports also improved from –4.6% to 12.6%.
Figure 38 shows how the contribution of economic growth by final demand varies across countries and over time for the period 1970–2011. The immediate impact of the global financial crisis of 2007–2008 is represented in the data, although its far-reaching effects would have stretched well beyond 2011. Most countries felt an adverse impact in 2008 and 2009, with the exception of India where growth rebounded strongly in 2009 from a slowdown in the previous year. The impact on the Asian countries varied both in magnitude and in nature. Japan’s recession was particularly deep with the economy contracting by 1.1% and 5.6% in 2008 and 2009, respectively, compared with 2.0% growth in 2007, as shown in Figure 36. Besides Japan, other Asian countries either experienced a mild reces-sion or a growth slowdown. Even so, relative to their rapid growth, the magnitude of the impact could still be substantial. For example, growth in Singapore dropped from 10.9% in 2007 to 0.7% and –0.5% in 2008 and 2009, respectively. Similarly, growth in Hong Kong slowed from 6.2% in 2007 to 2.3% 2008 before moving into the negative zone of –2.8% in 2009. The corre-sponding real GDP growth figures for the ROC were 5.8% in 2007, 0.9% in 2008, and –1.5% in 2009. India’s growth slowed from 10.2% in 2007 to 3.9% in 2008 before bounc-ing back to 7.3% in 2009. In contrast, the slowdown in China was more gradual but lasted longer – from 13.1% in 2007, growth decelerated to 10.5% in 2010, and further dipped to 9.4% in 2011. Most countries expe-rienced a rebound (strongly in some cases) in 2010, but it was largely due to some tempo-rary effects, which wore off and resulted in a more subdued growth trajectory in 2011. For example, growth in Japan swung from 4.5% in 2010 to –0.6% in 2011, and similarly from 10.3% to 5.9% in India, from 13.3% to 5.2% in
20
0
40
60
80
100
120
Korea
Hong Kong
Singapore
ROC
Investment
Government consumption
Household consumption
Net exports
%
Figure 35 Final Demand Contribution Shares to Economic Growth of the Asian Tigers, 2000–2011___Shares of final demand contributions to growth rate of GDP at constant market prices
Sources: Official national accounts in each country, including author adjustments.
©20
13 A
sian
Prod
uctiv
ity O
rgan
izat
ion
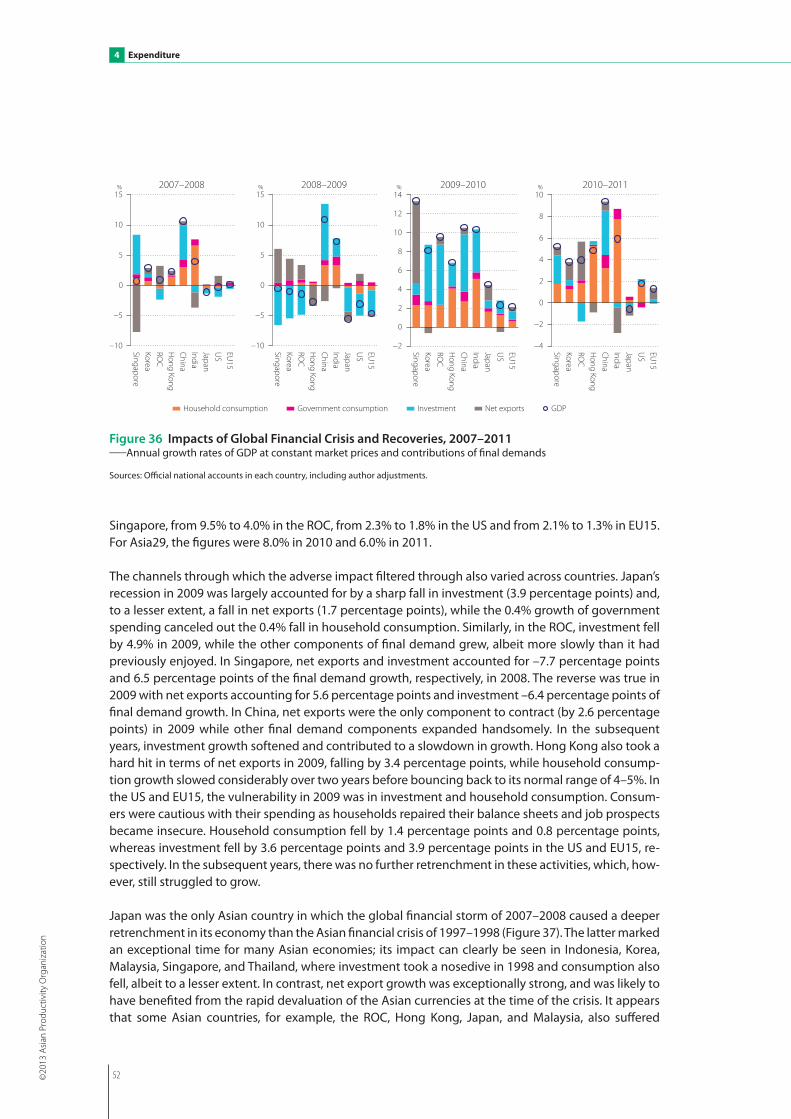
52
4 Expenditure
Singapore, from 9.5% to 4.0% in the ROC, from 2.3% to 1.8% in the US and from 2.1% to 1.3% in EU15. For Asia29, the figures were 8.0% in 2010 and 6.0% in 2011.
The channels through which the adverse impact filtered through also varied across countries. Japan’s recession in 2009 was largely accounted for by a sharp fall in investment (3.9 percentage points) and, to a lesser extent, a fall in net exports (1.7 percentage points), while the 0.4% growth of government spending canceled out the 0.4% fall in household consumption. Similarly, in the ROC, investment fell by 4.9% in 2009, while the other components of final demand grew, albeit more slowly than it had previously enjoyed. In Singapore, net exports and investment accounted for –7.7 percentage points and 6.5 percentage points of the final demand growth, respectively, in 2008. The reverse was true in 2009 with net exports accounting for 5.6 percentage points and investment –6.4 percentage points of final demand growth. In China, net exports were the only component to contract (by 2.6 percentage points) in 2009 while other final demand components expanded handsomely. In the subsequent years, investment growth softened and contributed to a slowdown in growth. Hong Kong also took a hard hit in terms of net exports in 2009, falling by 3.4 percentage points, while household consump-tion growth slowed considerably over two years before bouncing back to its normal range of 4–5%. In the US and EU15, the vulnerability in 2009 was in investment and household consumption. Consum-ers were cautious with their spending as households repaired their balance sheets and job prospects became insecure. Household consumption fell by 1.4 percentage points and 0.8 percentage points, whereas investment fell by 3.6 percentage points and 3.9 percentage points in the US and EU15, re-spectively. In the subsequent years, there was no further retrenchment in these activities, which, how-ever, still struggled to grow.
Japan was the only Asian country in which the global financial storm of 2007–2008 caused a deeper retrenchment in its economy than the Asian financial crisis of 1997–1998 (Figure 37). The latter marked an exceptional time for many Asian economies; its impact can clearly be seen in Indonesia, Korea, Malaysia, Singapore, and Thailand, where investment took a nosedive in 1998 and consumption also fell, albeit to a lesser extent. In contrast, net export growth was exceptionally strong, and was likely to have benefited from the rapid devaluation of the Asian currencies at the time of the crisis. It appears that some Asian countries, for example, the ROC, Hong Kong, Japan, and Malaysia, also suffered
2007–2008
Household consumption Government consumption Investment Net exports GDP
2008–2009 2009–2010 2010–2011
−10
−5
0
5
10
15
SingaporeKoreaRO
CH
ong KongChinaIndiaJapanU
SEU
15
%
−10
−5
0
5
10
15
SingaporeKoreaRO
CH
ong KongChinaIndiaJapanU
SEU
15
%
−2
0
2
4
6
8
10
12
14
SingaporeKoreaRO
CH
ong KongChinaIndiaJapanU
SEU
15
%
−4
−2
0
2
4
6
8
10
SingaporeKoreaRO
CH
ong KongChinaIndiaJapanU
SEU
15
%
Figure 36 Impacts of Global Financial Crisis and Recoveries, 2007–2011___Annual growth rates of GDP at constant market prices and contributions of final demands
Sources: Official national accounts in each country, including author adjustments.
©20
13 A
sian
Prod
uctiv
ity O
rgan
izat
ion

4
53
4.2 Demand-Side Growth Decomposition
adversely in 2001 following the burst of the dot.com bubble.
Economic restructuring is a grad-ual process and can take a long time to establish. Some shifting in the relative weight of the key driv-ers of growth may be emerging in some countries, and is discernible in data covering almost four dec-ades. For example, in the ROC and Hong Kong, the significant role played by investment in the early development stage has re-treated and besides household consumption, net exports have emerged as an important driver of economic growth in the 2000s. In contrast, investment has be-come increasingly prominent in determining economic growth in China and India in the past two decades as they undergo rapid development. In Japan, investment has faded as a key driver of eco-nomic growth since the beginning of the 1900s. In the US and EU15, economic growth is largely driven by household consumption, followed by investment, over the economic cycle, while the contribution from net exports tends to fluctuate. Government consumption, also, has been expanding proportion-ately more in some countries (such as EU15, Australia, China, and India) than others (Hong Kong, Vietnam, and the ROC in recent years). Growth of government consumption in the US appears to be more cyclical than in other countries.
It is difficult to understand the oil-exporting economies fully without analyzing the oil market in paral-lel. Its volatility can be clearly observed from Figure 38, with huge peaks and troughs, particularly in the 1970s. The oil booms of the 1970s brought benefits, but the downturn hurt. Net exports remain erratic, but overall volatility seems to have reduced in the past two decades. Qatar experienced the fastest GDP growth among the oil-exporting countries in recent years with very strong investment growth, but its economy is still very dependent on oil and gas and related industries, which accounted for 51% of its GDP in 2010 (Figure 67, p. 89) – roughly 80% of its export earnings, and 70% of govern-ment revenues in the 2000s.31 In contrast, Bahrain has diversified into a regional banking and financial center and benefited from the regional boom in recent years. Even so, petroleum production and processing still accounted for 21.9% of its GDP in 2010 (Figure 67) – about 60% of export earnings, and 75% of government revenues in the 2000s.32 The economic fortunes of these countries are there-fore intimately tied with the rest of the world via their dependence on the oil and gas industry. For example, demand for oil has been driven by the rapid growth in emerging economies. If, for in-stance, China’s growth slows, the demand for oil will also relent. Their future depends on how well they can diversify away from oil and gas while the stock of natural resources remains.
%
Household consumption Government consumption
Investment Net exports GDP
−25
−20
−15
−10
−5
0
5
10
15
20
IndonesiaThailandBruneiH
ong KongKoreaPhilippinesM
alaysiaJapanSingaporeFijiIranPakistanU
AEKuw
aitTurkeySaudi ArabiaRO
CQ
atarM
yanmar
BangladeshSri LankaIndiaCam
bodiaO
man
VietnamBahrainChinaM
ongoliaU
SEU
15Australia
Figure 37 Impacts of Asian Financial Crisis, 1997–1998___Annual growth rates of GDP at constant market prices and contribu-tions of final demands
Sources: Official national accounts in each country, including author adjustments.
31: Data from the series of Annual Statistical Abstract, State of Qatar. 32: Data from the Ministry of Finance, Kingdom of Bahrain.
©20
13 A
sian
Prod
uctiv
ity O
rgan
izat
ion

54
4 Expenditure
−30
−20
−10
0
10
20
30
40
50
Bahrain
−20
−15
−10
−5
0
5
10
15
20
Bangladesh
−20
−10
0
10
20
30
Brunei
−6
−3
0
3
6
9
12
15
Cambodia
−8
−4
0
4
8
12
16
20
China
−12
−8
−4
0
4
8
12
16
ROC
−6
−3
0
3
6
9
12India
−24
−18
−12
−6
0
6
12
18Indonesia
−30
−24
−18
−12
−6
0
6
12
18
24Iran
−6
−4
−2
0
2
4
6
8
10Japan
−24
−18
−12
−6
0
6
12
18Korea
−200
−150
−100
−50
0
50
100
150
200
Kuwait
−24
−18
−12
−6
0
6
12
18
Malaysia
−75
−50
−25
0
25
50
75
100
Mongolia
−16
−12
−8
−4
0
4
8
12
16Myanmar
1971 1976 1981 1986 1991 1996 2001 2006 2011 1971 1976 1981 1986 1991 1996 2001 2006 2011 1971 1976 1981 1986 1991 1996 2001 2006 2011
−4
−2
0
2
4
6
8
10
12Nepal
−30
−20
−10
0
10
20
30
40Oman
1971 1976 1981 1986 1991 1996 2001 2006 20111971 1976 1981 1986 1991 1996 2001 2006 20111971 1976 1981 1986 1991 1996 2001 2006 2011
1971 1976 1981 1986 1991 1996 2001 2006 2011 1971 1976 1981 1986 1991 1996 2001 2006 2011 1971 1976 1981 1986 1991 1996 2001 2006 2011
1971 1976 1981 1986 1991 1996 2001 2006 2011 1971 1976 1981 1986 1991 1996 2001 2006 2011 1971 1976 1981 1986 1991 1996 2001 2006 2011
1971 1976 1981 1986 1991 1996 2001 2006 20111971 1976 1981 1986 1991 1996 2001 2006 2011
1971 1976 1981 1986 1991 1996 2001 2006 2011 1971 1976 1981 1986 1991 1996 2001 2006 2011 1971 1976 1981 1986 1991 1996 2001 2006 2011
60% % %
%%
% % %
% % %
% % %
% % %
Household consumption Government consumption Investment Net exports Real GDP
−10
−5
0
5
10
15Hong Kong
1971 1976 1981 1986 1991 1996 2001 2006 2011
%
©20
13 A
sian
Prod
uctiv
ity O
rgan
izat
ion

4
55
4.2 Demand-Side Growth Decomposition
Figure 38 Final Demand Decomposition of Real GDP Growth, 1970–2011
Sources: Official national accounts in each country, including author adjustments.Note: Myanmar’s household consumption includes government consumption due to data limitations.
−30
−20
−10
0
10
20
Thailand
−8
−4
0
4
8
12
Pakistan
−12
−9
−6
−3
0
3
6
9
12
Philippines
−30
−20
−10
0
10
20
30
Qatar
−150
−100
−50
0
50
100
150
200
250
Saudi Arabia
−10
−5
0
5
10
15
20
Singapore
−12
−6
0
6
12
18
Sri Lanka
−30
0
30
60
90
UAE
−20
−10
0
10
20
30
Vietnam
−4
−2
0
2
4
6
8
10
US
−4
−2
0
2
4
6EU15
−6
−4
−2
0
2
4
6
8Australia
−15
−10
−5
0
5
10
15
Turkey
1971 1976 1981 1986 1991 1996 2001 2006 2011
1971 1976 1981 1986 1991 1996 2001 2006 2011 1971 1976 1981 1986 1991 1996 2001 2006 2011 1971 1976 1981 1986 1991 1996 2001 2006 2011
1971 1976 1981 1986 1991 1996 2001 2006 2011 1971 1976 1981 1986 1991 1996 2001 2006 2011 1971 1976 1981 1986 1991 1996 2001 2006 2011
1971 1976 1981 1986 1991 1996 2001 2006 2011 1971 1976 1981 1986 1991 1996 2001 2006 2011 1971 1976 1981 1986 1991 1996 2001 2006 2011
% % %
% % %
% % %
%
% % %
Household consumption Government consumption Investment Net exports Real GDP
1971 1976 1981 1986 1991 1996 2001 2006 2011 1971 1976 1981 1986 1991 1996 2001 2006 2011 1971 1976 1981 1986 1991 1996 2001 2006 2011
©20
13 A
sian
Prod
uctiv
ity O
rgan
izat
ion

5
57
5.1 Per-Worker Measure of Labor Productivity
Productivity performance is crucial to a country’s future economic prospects, especially when a lot of countries are facing aging populations. As the factors of inputs (labor and capital devoted to produc-tion) cannot increase indefinitely, productivity gains, which enable an economy to produce more for the same amount of inputs, are the only route to sustainable economic growth in the long run. It fol-lows that monitoring and improving national productivity capability (the supply side of the economy) are important aspects of public policy in many countries.
Used as a ratio of an output volume measure to an input volume measure, productivity is simple as a notion. When it comes to applying it, however, one quickly realizes the complexity in operationalizing this notion to suit different purposes, especially in a world with data limitations. Consequently, there are different measures of productivity for different purposes, and different estimation approaches and definitions subject to the data used. In the Databook, national accounts are the basis for productivity estimates, and, in turn, growth accounting with the appropriate choice of index numbers is adopted as estimation approach.33 Two productivity measures are presented in this chapter, namely labor pro-ductivity and TFP.
Labor productivity can be measured in a number of ways, depending on the definitions of output and labor input measures. The preferred measure is the basic-price GDP per actual hour worked, which adjusts to allow for different work patterns across countries and across time.34 However, total actual hours worked cannot be collated for all countries. In order to include all countries and define the Asian country groups, the labor productivity measure in terms of GDP per worker is used in Section 5.1. As workers in high-performing Asian countries tend to work longer hours on average than those in the US, the worker-based labor productivity gaps, in this instance, probably cast the Asian countries in a particularly favorable light. Although being a one-factor or partial-factor productivity measure, inter-est in labor productivity has never waned due to its simplicity as a concept, its broad availability, and its direct link to per capita GDP performance. Section 3.2 looks at how the per capita GDP gap, be-tween the US and most Asian economies, is largely explained by their labor productivity shortfalls. The cross-country comparisons of labor productivity performance conducted in Section 5.1 are based on a companionable definition, namely GDP per worker. Section 5.2 sees the focus shift to alternative estimates of labor productivity measure, namely GDP per hour worked for some selected Asian coun-tries. In Section 5.3, capital input is included as another key factor of production and the TFP estimates are presented for 17 Asian countries and the US, based on the estimates of capital services (see Appendix 3).
5.1 Per-Worker Measure of Labor Productivity
Figure 39 presents the cross-country comparisons of labor productivity levels in 2011, measured as GDP per worker in US dollars. 35 The countries naturally bundle into groups. On this measure, the US is the leading economy with Asia, Singapore and Hong Kong as close forerunners. The other two Asian
5 Productivity
33: The growth accounting approach is based on the microeconomic production theory and the nominal accounting balance of in-put and output of production. The standard model was presented by Solow (1957) and has been developed by researchers such as Zvi Griliches, Dale Jorgenson, Charles Hulten, and Erwin Diewert. See OECD (2001) for a presentation of definitions, theoretical foundations, and a number of practical issues in measuring productivity.
34: GDP is valued at basic prices in this chapter, as opposed to GDP at market prices used in the previous chapters. GDP at basic prices is defined as GDP at market prices, minus net indirect taxes on products. Since it reflects prices actually paid and received by the producer, it is more relevant to productivity comparisons. As most Asian countries do not provide official estimates for GDP at basic prices in their national accounts, they are calculated based on available tax data. See Appendix 1 for the methods employed for our calculations.
35: Cross-country level productivity comparisons are notoriously difficult to make and hence subject to a lot of data uncertainty. Esti-mates should therefore be taken as indicative for broad groupings rather than precise ranking.
©20
13 A
sian
Prod
uctiv
ity O
rgan
izat
ion

58
5 Productivity
Tigers together with Japan follow at some distance. While Iran is close to the top, it is worth noting that it has the lowest employment rate in Asia (Figure 21, p. 31). Singapore and Hong Kong both achieved a labor productivity level within −5% of the US in 2011. Given data uncertainty, this difference is not deemed statisti-cally significant. The ROC and Japan took the third and fourth places among the Asian group, with productiv-ity levels at 19% and 31% below that of the US, respec-tively. Korea followed, with a gap of 35%. Iran, Turkey, and Malaysia achieved productivity levels that were 48%, 46%, and 36% of the US level, respectively. There-after, a number of countries from among the Asia group followed with labor productivity levels at less than 20% of the US, pulling down the average perfor-mance of the group to 17% for the APO20, 16% for Asia29, and 11% for ASEAN. Bringing up the rear were China and India, with productivity levels that were 14% and 9% of the US level, respectively. In the past decade, the APO20 as a group has achieved little change in its labor productivity relative to that of the US, stagnating at around 16%, while Asia23’s has risen from 11% to 15% (Table 8). Having been the leader in Asia, Japan started to fall behind the Asian Tigers, when Hong Kong and Singapore caught up and overtook it in labor productivity in 1991 and 1992, respectively. In 2000, Hong Kong sustained a produc-tivity gap of 18% with the US, but by 2011 the gap had narrowed to around 4%. In contrast, the relative productivity level of Singapore against the US has been slightly improved over the last ten years.
In the past decade, the top eight countries have maintained their relative positions, although coun-tries have been closing in on the region’s leader up to 2011 when Singapore’s labor productivity grew faster than the rest. China and India are the two giant and fast-emerging economies in Asia. China began with one-third of India’s productivity levels in 1970; but four decades later it showed signs of pulling ahead of India (Figure 40). China’s relative performance against the US moved up from 2% in 1970 to 6% in 2000 and 14% in 2011, compared with the corresponding figures of 5%, 6%, and 9% for India.36 The figures for GCC countries and Brunei are uncharacteristically high, especially in 1970, but there are also noticeable variations within the country group. The atypically high figures in the early period re-flect the natural resource rents – the value of the resource over and above the cost of extraction – which are erroneously included in these countries’ GDP. The extent of exaggeration appears to be proportional to their oil production: Saudi Arabia has the largest proven oil reserves in the world and is the largest world oil exporter; Kuwait has the fourth-largest oil reserves in the world; in addition,
Thousands of US dollars (as of 2010)Thousands of US dollars (as of 2010)3.0 3.4 3.6 4.4 5.0 5.5
8.1 8.3 8.5 9.2 9.5 10.7 11.7
19.5
42.7 44.8
63.3 70.5
90.2 92.0
12.3 13.5 14.4 14.5 15.1 15.4 15.6
33.3
58.7
74.6 76.6
93.8
12.3 13.5 14.4 14.5 15.1 15.4 15.6
33.3
58.7
74.6 76.6
93.8
0 20 40 60 80 100
NepalMyanmar
CambodiaBangladesh
Lao PDRVietnam
South AsiaPakistan
IndiaPhilippines
IndonesiaASEAN
MongoliaFiji
ChinaSri Lanka
Asia23Asia29
ThailandAPO20
East AsiaMalaysia
TurkeyIran
KoreaJapanEU15ROC
AustraliaHong Kong
SingaporeUS
Figure 39 Labor Productivity Level by Per-Worker GDP, 2011___GDP at constant basic prices per worker, using 2005 PPP, reference year 2010
Source: APO Productivity Database 2013.01.
36: If the comparisons were with the region’s leader at different times, India’s relative labor productivity has actually fallen, while China has managed to make a substantial leap to close in on the leader, albeit from a very low level.
©20
13 A
sian
Prod
uctiv
ity O
rgan
izat
ion

5
59
5.1 Per-Worker Measure of Labor Productivity
Qatar has become the fourth-largest exporter of liquefied natural gas. In contrast, Bahrain has the smallest oil reserve compared to its peers. Its dependence on oil is therefore considerably lower and it has worked to diversify its economy over the past decade (see Figure 82, p. 104). The GCC countries have also been experiencing high population growth, especially in the late 1970s and the early 1980s. In the last two decades, this has somewhat stabilized at around 3.0% a year, except in the UAE and Qatar where the population grew at 7.6% and 6.9%, respectively. The working-age population has been expanding accordingly. Employment is erratic from one year to another, and this will be reflect-ed in the labor productivity figures.
Unit: Thousands of US dollars (as of 2010).Source: APO Productivity Database 2013.01.
Table 8 Per-Worker Labor Productivity Levels, 1970, 1980, 1990, 2000, 2010, and 2011___GDP at constant basic prices per worker, using 2005 PPP, reference year 2010
IranJapanSingaporeHongKongROCFijiMalaysiaKoreaPhilippinesSriLankaMongoliaPakistanThailandIndonesiaIndiaChina
BahrainKuwaitOman
SaudiArabiaUAE
(regrouped)
APO20Asia23Asia29EastAsiaSouthAsiaASEANGCC(reference)
USEU15
Australia
26.725.424.319.811.911.0
9.18.96.84.03.83.63.62.52.50.8
78.8320.4
53.7
113.063.8
7.24.14.44.52.93.4
130.5
50.836.0
44.0
100.095.190.974.244.541.234.033.525.414.914.413.613.5
9.59.53.2
294.81198.6
201.0
422.7238.5
26.815.416.616.810.712.7
488.0
189.9134.5
164.8
SingaporeHongKongROCJapanKoreaIranMalaysiaThailandSriLankaChinaFijiMongoliaIndonesiaPhilippinesIndiaPakistanVietnamLaoPDRBangladeshCambodiaMyanmarNepal
BahrainKuwaitOmanQatarSaudiArabiaUAEBrunei(regrouped)
APO20Asia23Asia29EastAsiaSouthAsiaASEANGCC(reference)
USEU15EU27AustraliaTurkey
92.090.274.663.358.744.833.315.414.413.512.311.7
9.59.28.58.35.55.04.43.63.43.0
42.175.455.3
126.263.696.892.3
15.614.515.119.5
8.110.773.8
93.870.565.376.642.7
100.098.181.168.863.848.736.216.715.614.713.412.710.310.0
9.39.16.05.54.83.93.63.3
45.882.060.1
137.269.2
105.2100.4
17.015.816.521.2
8.811.680.3
102.076.771.083.346.4
SingaporeHongKongROCJapanKoreaIranMalaysiaThailandSriLankaChinaFijiMongoliaPhilippinesIndonesiaPakistanIndiaVietnamLaoPDRBangladeshCambodiaMyanmarNepal
BahrainKuwaitOmanQatarSaudiArabiaUAEBrunei(regrouped)
APO20Asia23Asia29EastAsiaSouthAsiaASEANGCC(reference)
USEU15EU27AustraliaTurkey
90.288.573.263.557.744.032.715.513.612.412.110.0
9.49.08.48.25.34.84.33.43.23.0
43.874.465.4
111.166.897.693.6
15.413.914.518.5
7.810.475.9
93.069.864.475.542.0
100.098.181.170.464.048.836.217.215.113.713.511.110.410.0
9.39.15.95.34.73.83.63.3
48.582.572.5
123.274.1
108.2103.8
17.115.416.120.5
8.711.684.1
103.077.471.483.746.5
SingaporeHongKongJapanROCKoreaIranMalaysiaThailandFijiSriLankaPhilippinesPakistanMongoliaIndonesiaChinaIndiaVietnamBangladeshLaoPDRNepalCambodiaMyanmar
BahrainKuwaitOmanQatarSaudiArabiaUAEBrunei(regrouped)
APO20Asia23Asia29EastAsiaSouthAsiaASEANGCC(reference)
USEU15EU27AustraliaTurkey
75.664.557.655.442.932.026.712.011.5
9.47.77.56.86.64.84.73.43.43.02.72.31.2
63.199.065.7
133.570.0
126.1111.2
12.58.89.2
10.94.87.7
83.7
78.665.258.968.830.0
100.085.376.173.256.742.335.315.915.212.410.2
9.99.08.76.46.24.54.44.03.63.01.6
83.5130.9
86.9176.5
92.6166.7147.0
16.611.612.214.4
6.410.2
110.7
103.986.377.991.039.7
JapanHongKongSingaporeROCIranKoreaMalaysiaFijiThailandPhilippinesSriLankaMongoliaPakistanIndonesiaIndiaBangladeshNepalLaoPDRVietnamChinaMyanmar
BahrainKuwaitOmanQatarSaudiArabiaUAEBrunei(regrouped)
APO20Asia23Asia29EastAsiaSouthAsiaASEANGCC(reference)
USEU15
AustraliaTurkey
52.351.951.234.728.827.118.411.0
7.87.27.06.46.25.13.52.42.22.12.02.00.8
53.450.978.299.962.7
146.2123.5
10.96.46.87.63.65.8
72.6
65.355.2
55.923.7
100.099.498.066.355.151.835.121.115.013.713.512.311.8
9.76.74.64.24.03.93.81.5
102.197.3
149.6191.1119.9279.8236.3
20.812.212.914.4
6.911.0
139.0
124.9105.7
106.945.3
JapanSingaporeHongKongIranROCKoreaMalaysiaFijiPhilippinesMongoliaSriLankaThailandPakistanIndonesiaIndiaBangladeshNepalChinaMyanmar
BahrainKuwaitOmanQatarSaudiArabiaUAEBrunei(regrouped)
APO20Asia23Asia29EastAsiaSouthAsiaASEANGCC(reference)
USEU15
Australia
36.434.332.928.821.014.413.910.5
8.05.85.85.04.34.12.92.31.51.30.8
72.0125.2
73.1156.7113.5234.8255.8
8.75.25.86.13.04.4
128.1
56.346.4
50.5
100.094.390.379.057.839.538.328.722.015.915.913.911.811.1
7.96.34.23.42.1
197.9344.1200.9430.5311.9645.2702.8
24.014.215.916.8
8.112.1
351.8
154.8127.6
138.8
1970 (%) 1980 (%) 1990 (%) 2000 (%) 2010 (%) 2011 (%)
©20
13 A
sian
Prod
uctiv
ity O
rgan
izat
ion

60
5 Productivity
The Lewis model (Lewis, 1954) or the Fei-Ranis model (Fei and Ranis, 1964), which established develop-ment economics as a respectable academic discipline in the late 1950s and 1960s, proposed the concept of a turning point where a developing economy transforms itself from an unskilled-labor-abundant econ-omy with seemingly unlimited supply of labor to a labor-scarce industrial economy. The Chinese economy seems to pass by its turning point in the latter half of the 2000s.
Figure B4.1 presents the price of labor relative to capital in China, Japan, and the Asian Tigers. Price of labor is defined as the average wage (total labor compensation, including our estimates of wages for self- employed and family workers, over total hours worked) and price of capital is estimated by the ex-post approach for measuring user cost of capital in APO Productivity Database 2013 (see Appendix 3). The rela-tive price index of labor/capital is normalized as 1.0 in 1970 in each country.
Box 4 Turning Point in China
35
30
25
20
15
10
5
0
1970=1.0
China
Korea
JapanSingapore
Hong KongROC
1970 1975 1980 1985 1990 1995 2000 2005 2010
Figure B4.1 Price of Labor Relative to Capi-tal in China, Japan, and the Asian Tigers, 1970–2011
Sources: APO Productivity Database 2013.01.
In Japan the prices of labor increased at the begin-ning of the 1970s, and for Korea and ROC the late 1980s and the beginning of the 1990s, respective-ly. In these periods, China’s low price of labor could be a main source of superior price competitive-ness in labor-intensive manufacturing. The turning point is found at around 2008, in which the price of labor started to increase sharply relative to capital.
Such a turning point emerges when a country makes effective movements of labor from agri-cultural/rural/informal sectors to industrial/urban/formal sectors. Although it is claimed that the ag-gravation of income disparity is a serious concern, the alleviation of poverty in China are certainly great achievements. The Chinese economy has overcome its first-round of economic develop-ment issues and now faces new challenges to move beyond the upper middle-income plateau.
When labor productivity growth is compared however, the ranking of countries is substantially reshuffled (Table 9). In the 2000s there was a spurt in labor productivity growth among low-income countries. While they were scattered around the table in the earlier periods, by 2000–2005 the seven countries with the fastest labor productivity growth were all from Group-L4 (as defined in Table 6, p. 28); and in the latest period 2005–2011, five out of the top seven were from Group-L4 and two from Group-L3. Among them, China has been sustaining rapid productivity growth in the past two decades; its growth ac-celerated to an average of 10.2% a year in 2005–2011 from 7.1% a year in 1995–2000 and 8.6% a year in 2000–2005. This compares with India’s at 7.7%, 3.4%, and 3.5% over the same periods. La-bor productivity growth amongst the Asian Ti-gers was steady, ranging from 2.6% to 3.3% on
0
2
4
6
8
10
12
China
India
Thousands of US dollars (as of 2010)
1970 1975 1980 1985 1990 1995 2000 2005 2010
Figure 40 Labor Productivity Trends of China and India, 1970–2011___GDP at constant basic prices per worker, using 2005 PPP, reference year 2010
Source: APO Productivity Database 2013.01.
©20
13 A
sian
Prod
uctiv
ity O
rgan
izat
ion

5
61
5.1 Per-Worker Measure of Labor Productivity
average a year in 2000–2005. This performance was sustained in 2005–2011, except for in Singapore. While Singapore’s average annual productivity growth slowed significantly to 0.4%, the others en-joyed growth of about 3.0% in 2005–2011. The 2000s were an era when labor productivity deterio-rated in GCC countries. The decline accelerated from −0.1% to −1.9% between the two halves of the 2000s.
As a group, Asia23 achieved the highest labor productivity growth in recent years, reaching 5.5% on average a year in 2005–2011, up from 3.8% in 2000–2005. Within Asia, labor productivity growth has been accelerating in both South Asia and East Asia, to 6.5% and 6.1% in 2005–2011, respectively. South Asia displayed a newfound vigor in recent years considering that, to date, labor productivity
Table 9 Labor Productivity Growth, 1990–1995, 1995–2000, 2000–2005, and 2005–2011___Average annual growth rate of GDP at constant basic prices per worker, using 2005 PPP
Unit: Percentage.Source: APO Productivity Database 2013.01.
1990–1995 1995–2000 2000–2005 2005–2011KuwaitChinaThailandMalaysiaIndonesiaVietnamROCKoreaCambodiaSingaporeSriLankaHongKongPakistanMyanmarLaoPDRBahrainBangladeshIndiaNepalIranSaudiArabiaJapanQatarBruneiFijiPhilippinesMongoliaUAEOman(regrouped)
APO20Asia23Asia29EastAsiaSouthAsiaASEANGCC(reference)
USEU15
AustraliaTurkey
ChinaOmanMyanmarQatarVietnamKoreaROCLaoPDRBangladeshSingaporeCambodiaIndiaMongoliaPhilippinesNepalSriLankaSaudiArabiaJapanFijiMalaysiaIranUAEHongKongThailandBahrainPakistanKuwaitIndonesiaBrunei(regrouped)
APO20Asia23Asia29EastAsiaSouthAsiaASEANGCC(reference)
USEU15EU27AustraliaTurkey
MyanmarChinaVietnamLaoPDRCambodiaIndonesiaIranIndiaHongKongOmanSingaporeMalaysiaThailandKoreaMongoliaROCSriLankaPakistanBangladeshFijiJapanPhilippinesKuwaitNepalSaudiArabiaQatarBruneiUAEBahrain(regrouped)
APO20Asia23Asia29EastAsiaSouthAsiaASEANGCC(reference)
USEU15EU27AustraliaTurkey
ChinaMyanmarIndiaLaoPDRMongoliaSriLankaCambodiaVietnamHongKongKoreaROCBangladeshIranIndonesiaPhilippinesThailandNepalMalaysiaJapanSingaporePakistanFijiSaudiArabiaBruneiBahrainQatarUAEOmanKuwait(regrouped)
APO20Asia23Asia29EastAsiaSouthAsiaASEANGCC(reference)
USEU15EU27AustraliaTurkey
13.110.6
8.26.66.55.25.25.04.34.14.13.73.53.33.33.02.92.62.41.40.60.60.3
−0.2−0.4−0.4−1.3−3.7−9.3
1.93.83.74.12.75.20.7
1.52.0
2.11.3
7.15.85.65.54.74.24.13.93.93.73.43.42.51.91.71.71.61.31.20.90.70.70.60.40.40.30.2
−1.4−1.9
1.02.62.63.23.00.62.2
2.31.41.62.13.4
10.68.64.84.13.63.63.53.53.33.23.13.03.02.92.72.62.52.01.91.51.31.10.90.5
−0.2−0.7−1.2−1.8−4.8
1.43.83.74.63.13.2
−0.1
2.10.91.21.35.9
10.29.27.75.15.04.94.64.23.13.03.03.02.92.82.72.11.31.00.60.40.4
−0.4−0.7−2.2−2.6−3.0−3.3−3.3−6.6
2.85.55.36.16.52.8
−1.9
1.30.50.60.60.8
1990–2000 2000–2011ChinaKuwaitVietnamROCKoreaMyanmarThailandSingaporeMalaysiaCambodiaLaoPDRBangladeshIndiaQatarSriLankaIndonesiaHongKongNepalPakistanBahrainSaudiArabiaIranJapanPhilippinesMongoliaFijiBruneiUAEOman(regrouped)
APO20Asia23Asia29EastAsiaSouthAsiaASEANGCC(reference)
USEU15EU27AustraliaTurkey
MyanmarChinaIndiaLaoPDRVietnamCambodiaMongoliaSriLankaIranIndonesiaHongKongKoreaROCThailandBangladeshMalaysiaPhilippinesSingaporePakistanJapanNepalFijiOmanSaudiArabiaBruneiQatarUAEKuwaitBahrain(regrouped)
APO20Asia23Asia29EastAsiaSouthAsiaASEANGCC(reference)
USEU15EU27AustraliaTurkey
8.96.75.04.74.64.54.33.93.73.73.63.43.02.92.92.62.22.01.91.71.11.11.00.80.60.4
−1.0−1.5−1.7
1.43.23.13.62.92.91.4
1.91.71.62.12.4
9.99.45.64.64.54.13.83.73.23.23.23.02.82.52.42.01.91.81.21.00.90.6
−0.1−0.5−1.7−1.8−2.6−2.9−3.7
2.14.64.55.34.83.0
−1.0
1.70.70.90.93.4
©20
13 A
sian
Prod
uctiv
ity O
rgan
izat
ion

62
5 Productivity
growth had been traditionally faster in East Asia. In contrast, average annual productivity growth in the US slowed rapidly to 1.3% between 2005 and 2011, after a decade of over 2.0% growth a year. The EU15 shows signs of weakening as well, slowing in every successive period from 2.0% in the first half of the 1990s to 0.5% in the most recent period 2005–2011. Japan’s labor productivity growth behaved closer to that of other mature economies. Having managed to grow at 1.3% on average a year for a decade in 1995–2005, labor productivity growth in Japan has slowed to 0.6% per year on average since 2005.
Figure 41 shows labor productivity levels relative to the US (= 100) for Asian countries. The same grouping as in Section 3.2, based on the speed of catch-up with the US in per capita GDP, is used here. Broadly speaking, countries that are catching up faster with the US in per capita GDP (Group-C1) are also faster catching up in labor productivity (Figure 41.1). Similarly, countries with deteriorating rela-tive per capita GDP (Group-C4) also present signs of deterioration or of little change against the US in terms of labor productivity (Figure 41.4).
Among the countries that are catching up with the US in per capita GDP (i.e., Group-C1 and Group-C2), the Asian Tigers have made a tremendous effort in improving their relative labor productivity over the past four decades. Singapore and Hong Kong have closed the gap from 50–60% in 1970 to
CambodiaChinaROCKoreaSingapore
0
10
20
30
40
50
60
70
80
90
100
1970 1975 1980 1985 1990 1995 2000 2005 2010
US=100 US=100
US=100 US=100
0
10
20
30
40
50
60
70
80
90
100
1970 1975 1980 1985 1990 1995 2000 2005 2010
Hong KongIndiaIndonesiaLao PDRMalaysiaMyanmar Sri Lanka
ThailandVietnam
BangladeshJapanMongoliaNepalPakistanEU15
0
10
20
30
40
50
60
70
80
90
100
1970 1975 1980 1985 1990 1995 2000 2005 2010
FijiIranPhilippines AustraliaTurkey
0
10
20
30
40
50
60
70
80
90
100
1970 1975 1980 1985 1990 1995 2000 2005 2010
Figure 41.1: Group-C1 Countries Figure 41.2: Group-C2 Countries
Figure 41.3: Group-C3 Countries Figure 41.4: Group-C4 Countries
Figure 41 Labor Productivity Level Relative to the US, 1970–2011___Indices of GDP at constant basic prices per worker, using 2005 PPP
Source: APO Productivity Database 2013.01.
©20
13 A
sian
Prod
uctiv
ity O
rgan
izat
ion

5
63
5.2 Per-Hour Measure of Labor Productivity
within 5% in 2011 (Figure 41.1 and Figure 41.2). Similarly, the ROC and Korea have reduced a gap of around 80% initially to 20% and 40% by 2011, respectively (Figure 41.1). Malaysia has been making steady progress, raising its relative productivity level from 18% that of the US in 1970 to 35% in 2011 (Figure 41.2). The rest of the countries in these two groups all display an initial relative labor productiv-ity level of below 10%, but have shown signs of a strong and promising start in their catch-up process in the past decade.37
Countries that have managed modest catch-up with the US (Group-C3) or have a declining per capita GDP against the US (Group-C4) are also those with stagnant or deteriorating relative labor productiv-ity. Japan is the only high-income Asian country in this group, while the rest (except Iran) are all low-income countries with per capita GDP less than 20% that of the US. Japan showed strong catch-up behaviors in the earlier period, with relative labor productivity peaking at 81% that of the US in 1991, and since then the gap has widened again to over 30% in 2011. Similarly EU15, a reference economy with high income, has seen its productivity gap double against the US since 1995, from 13% to 25% in 2011, whereas the low-income countries have managed little catch-up (Figure 41.3) or a declining relative productivity level (Figure 41.4). Iran (a Group-L2 country) experienced a drastic decline in its relative labor productivity from its former peak of 77% in 1976 to 38% in 1988, before recovering to 48% in 2011.
5.2 Per-Hour Measure of Labor Productivity
The per-worker-based labor productivity gaps presented in Section 5.1 are most likely conservative estimates, since workers in high-performing Asian countries tend to work longer hours than those in the US on average. To adjust for this discrepancy, total hours worked are constructed in our database for 17 Asian countries, although the quality of the estimates may vary considerably across countries.38 Figure 42 shows how the productivity gap against the US in 2011 varies depending on which measure of labor productivity is used.39 The productivity gap with the US widens for all Asian countries when the differences in working hours are taken into account. However, for eleven of these countries, the adjustments are within 2–5 percentage points, and hence are not deemed as statistically significant. In contrast, the choice of labor productivity measure makes a significant difference for the previously high-performing countries in their relative performance. On a per-hour GDP basis, the labor pro-ductivity gap against the US widens by 16–27 percentage points for the four Asian Tigers (Korea, the ROC, Singapore, and Hong Kong). Europeans generally work fewer hours. This is reflected in compari-sons on hourly labor productivity showing EU15 in a more favorable light against the US, albeit only marginally.
Based on GDP at constant basic prices per hour worked, US labor productivity has been able to sustain a big lead over even the Asian high performers (Table 10). In 1970, the US productivity level was
37: Among these countries, the impact of the Asian financial crisis of 1997–1998 in temporarily stalling the progress of Thailand and Indonesia can be clearly seen. They are slowly recovering lost ground.
38: Cross-country comparisons of hours worked are notoriously difficult, not least because harmonized data is rarely readily available. In the countries studied, three published their total hours worked as part of their official statistics, but not for the whole period studied in this report, and the publications may have been constructed based on different methodologies. Some countries only published estimates for average weekly hours worked, which need estimates of number of weeks worked to derive the total aver-age hours worked per worker. Others may have only estimated benchmark hours worked available, which are then extrapolated to form a series. Consequently, growth of employment and growth of total hours worked become identical, as in the case of China and Thailand. In reading the results, it is therefore important to bear in mind the data limitations. See Appendix 4 for an explana-tion of the estimation procedure of total hours worked.
39: The labor productivity gap for country x is country x’s labor productivity divided by the US’s labor productivity in Figure 42.
©20
13 A
sian
Prod
uctiv
ity O
rgan
izat
ion

64
5 Productivity
nearly 2.5 times that of the Asian leader, Japan. This gap was re-duced to around 33% in 1990. Since 1990, Japan’s pace in clos-ing the gap has slowed. By 2011, a sizable gap of 35% still remained. The gap between the US and the Asian leader of the past decade (i.e., Singapore) has been persis-tent at around 30%. This is in con-trast with the picture painted by the per-worker productivity mea-sure, based on which the Asian leaders (Singapore and Hong Kong) have almost closed the gap with the US (Figure 41, p. 62).40 EU15’s lead over the Asian leader
−96 −95 −94 −91 −91 −90 −90
−86 −83 −85
−65
−52 −55
−38
−21
−32
−4 −2
−25
−19
−98 −97 −96 −94 −93 −93 −92
−90 −88 −88
−74
−65 −60
−54
−38 −35
−31 −27
−21 −20
−100
−90
−80
−70
−60
−50
−40
−30
−20
−10
0
Cam
bodi
a
Bang
lade
sh
Viet
nam
Paki
stan
Indi
a
Indo
nesia
Phili
ppin
es
Chin
a
Thai
land
Sri L
anka
Mal
aysia
Iran
Turk
ey
Kore
a
ROC
Japa
n
Hon
g Ko
ng
Sing
apor
e
EU15
Aust
ralia
%
Per worker GDP
Per hour GDP
Figure 42 Labor Productivity Gap by Per-Worker and Per-Hour GDP Relative to the US, 2011___GDP at constant basic prices per worker and hour, using 2005 PPP
Source: APO Productivity Database 2013.01.
40: Note that the differentials in the labor quality per hour worked among countries have not been accounted for in this comparison: labor productivity will tend to be overestimated if labor quality has been rising, and vice versa. Jorgenson and Nomura (2007) provide a comprehensive picture of bilateral productivity comparisons between the US and Japan, based on detailed estimates for 164 commodities, 33 assets (including land and inventories), and 1,596 labor categories. Even when the differences in quality of labor have been adjusted for, they find that the US–Japan labor productivity gap was still sizable, at 34.3% for 2004. They also point out that the gap in the “level” of TFP has been the major source of the labor productivity gap since the mid-1990s; lower TFP explains 57.0% of the labor productivity gap in 2004, while non-IT-capital deepening (defined by capital input per unit of labor in-put) accounts for 37.3%. In the next section, the gap in labor productivity “growth” among countries is analyzed, without the level comparisons of capital deepening and TFP due to lack of data.
Table 10 Per-Hour Labor Productivity Levels, 1970, 1980, 1990, 2000, 2010, and 2011___GDP at constant basic prices per hour, using 2005 PPP, reference year 2010
Unit: US dollar (as of 2010).Source: APO Productivity Database 2013.01.
1970JapanSingaporeIranHongKongROCMalaysiaKoreaPhilippinesSriLankaThailandPakistanIndonesiaIndiaChina
(reference)
US
12.011.011.0
7.74.94.13.22.92.51.61.51.31.20.4
28.6
100.091.691.664.141.034.226.924.221.013.712.810.6
9.73.2
238.0
2011SingaporeHongKongJapanROCKoreaIranMalaysiaSriLankaThailandChinaPhilippinesIndonesiaIndiaPakistanVietnamBangladeshCambodia(reference)
USEU15AustraliaTurkey
42.040.436.635.526.520.114.5
7.26.76.14.44.23.93.62.31.91.4
56.344.645.122.7
100.096.287.384.663.048.034.517.116.014.610.410.0
9.48.75.64.43.2
134.2106.4107.6
54.2
2010SingaporeHongKongJapanROCKoreaIranMalaysiaSriLankaThailandChinaPhilippinesIndonesiaIndiaPakistanVietnamBangladeshCambodia(reference)
USEU15AustraliaTurkey
40.437.136.634.825.319.714.2
6.86.85.64.54.03.83.62.31.81.4
56.144.144.622.4
100.092.090.886.162.748.835.216.816.814.011.0
9.99.49.05.64.53.4
139.1109.2110.5
55.4
2000SingaporeJapanHongKongROCKoreaIranMalaysiaThailandSriLankaPhilippinesIndonesiaPakistanChinaIndiaBangladeshVietnamCambodia(reference)
USEU15AustraliaTurkey
33.231.628.224.816.713.211.4
5.34.83.63.33.22.22.11.71.40.9
46.539.838.615.5
100.095.285.074.650.339.734.315.914.411.010.1
9.56.66.55.04.12.8
139.9119.7116.3
46.6
1990JapanSingaporeHongKongROCIranKoreaMalaysiaSriLankaThailandPhilippinesPakistanIndonesiaIndiaBangladeshChinaVietnam
(reference)
US
AustraliaTurkey
25.922.922.215.111.8
9.98.23.63.63.32.62.51.61.20.90.8
38.6
31.312.7
100.088.485.858.245.738.331.613.913.812.710.2
9.86.14.63.53.2
149.1
120.949.1
1980JapanSingaporeHongKongIranROCMalaysiaKoreaPhilippinesSriLankaThailandIndonesiaPakistanIndiaBangladeshChina
(reference)
US
Australia
17.616.113.111.8
8.86.35.23.62.92.32.01.91.31.10.6
33.1
27.5
100.091.874.867.449.935.829.720.316.613.111.510.6
7.46.13.2
188.3
156.8
(%) (%) (%) (%) (%) (%)
©20
13 A
sian
Prod
uctiv
ity O
rgan
izat
ion

5
65
5.2 Per-Hour Measure of Labor Productivity
was around 20% in 2000, but rapidly eroded to around 10% by 2011.
The levels of labor productivity for the top five countries – Japan and the four Asian Tigers – maintained their relative positions for almost four decades. The progress of labor productivity in these countries during 1970–2011 is shown in Figure 43. Within four decades, GDP per hour has roughly tripled for the top three economies, namely Japan, Singapore, and Hong Kong, and the gap among them has literally disappeared. They were ahead of the ROC and Korea by 10.0% and 30.0%, respectively, in 2011, despite the duo’s effort in catching up with Japan by 2.1% and 2.4% a year on average, respectively, over
1970 1975 1980 1985 1990 1995 2000 2005 20100
10
20
30
40ROCHong KongJapanKoreaSingapore
Thousands of US dollars (as of 2010)
Figure 43 Labor Productivity Trends in Japan and the Four Asian Tigers, 1970–2011___GDP at constant basic prices per hour, using 2005 PPP, reference year 2010
Source: APO Productivity Database 2013.01.
−1
0
1
2
3
4%
1970−2011 1990−20111970−1990
3.8
3.23.0
2.7 2.6 2.5 2.4 2.3 2.3 2.3 2.2 2.21.9
1.7 1.7 1.7
1.1
SingaporeM
alaysiaIndonesiaPhilippinesPakistanIranIndiaSri LankaFijiVietnamThailandM
ongoliaChinaRO
CKoreaH
ong KongU
SJapan
3.3 2.9
2.6 2.4 2.4 2.3 2.2 2.1 2.0
1.3 1.2 1.2 1.1 0.8 0.8
0.6 0.4
SingaporeM
alaysiaPakistanIranPhilippinesIndonesiaVietnamIndiaSri LankaM
ongoliaThailandFijiH
ong KongRO
CChinaU
SKoreaJapan
4.4
3.6 3.5 3.4
3.2 3.1 3.1 3.1 3.0 2.7 2.7 2.7 2.6 2.6 2.5
2.3
1.7
0.6
SingaporeIndonesiaM
alaysiaFijiChinaThailandKoreaPhilippinesM
ongoliaSri LankaRO
CIndiaPakistanIranVietnamH
ong KongU
SJapan
−0.1
−0.8
Figure 45 Labor Input Growth, 1970–2010, 1970–1990, and 1990–2011___Average annual growth rate of total hours worked
Source: APO Productivity Database 2013.01.
China Korea RO
C Vietnam
H
ong Kong Thailand Singapore Cam
bodia M
alaysia India Indonesia Japan Turkey Sri Lanka Pakistan U
S Australia Iran BangladeshPhilippines
China Vietnam
Korea India RO
C Sri Lanka Cam
bodia Thailand Singapore H
ong Kong Turkey M
alaysia Iran Indonesia BangladeshU
S Australia Japan Pakistan Philippines
Korea RO
C H
ong Kong China Thailand Japan Singapore IndonesiaM
alaysiaPakistanVietnam
Sri LankaIndia U
S Australia BangladeshPhilippinesIran Turkey
0
2
4
6
8
10% 1970−2011 1990−20111970−1990
6.8
5.1 4.8
4.5 4.0
3.4 3.3 3.2 3.1 3.0 2.9 2.7 2.6 2.6 2.1
1.7 1.5 1.5 1.5 1.0
9.1
4.9 4.7 4.3 4.1
3.3 3.2 3.0 2.9 2.8 2.8 2.7 2.5 2.4 2.1 1.8 1.7 1.7 1.6 1.3
5.6 5.6 5.3
4.3 3.9 3.8 3.7 3.5 3.5
2.7 2.2
1.8 1.5 1.5 1.1
0.7 0.6 0.4 0.3
Figure 44 Labor Productivity Growth, 1970–2010, 1970–1990, and 1990–2011___Average annual growth rate of GDP at constant basic prices per hour
Source: APO Productivity Database 2013.01.
©20
13 A
sian
Prod
uctiv
ity O
rgan
izat
ion

66
5 Productivity
the past four decades. If they could maintain this effort at the same pace, it would take the ROC two years, and Korea 14 years to finally draw level with Japan.
Over the past four decades, hourly labor productivity growth ranged from 1.0% (the Philippines) to 6.8% (China) on average per year, compared with that of the US at 1.7% and Australia at 1.5% (Figure 44). Among the 16 Asian countries compared, only Bangladesh, Iran, and the Philippines grew slower than the US. Between the two sub-periods (i.e., 1970–1990 and 1990–2011), there is a notable decel-eration in the hourly productivity growth for nine out of 16 Asian countries: for example, 2.5 percent-age points and 2.1 percentage points were shaved off productivity growth in the earlier period in Hong Kong and Japan, respectively. Seven countries managed to accelerate their productivity im-provement after 1990. Among these, China’s performance is the most outstanding, with productivity growth more than doubling from 4.3% to 9.1% between the two sub-periods.
The deceleration of labor productivity growth in most countries between the two sub-periods, reflect weaknesses in output growth. Figure 45 shows that all countries except Pakistan experienced a slow-down in hours-worked growth between the sub-periods, which should have worked to boost labor productivity growth, all other things being equal.41 This implies that output growth must have been decelerating more than labor input in percentage points for labor productivity growth to slow. In China, output growth was reinforced by the slower pace of labor input growth to result in an extraor-dinary surge in labor productivity growth. Labor input growth slowed to 0.8% a year on average in the latter period, from 3.2% in the previous period. Japan was the only economy to experience an
41: By definition, positive labor productivity growth occurs when output grows faster than labor input. Figures 44 and 45 therefore tend to have an inverse relationship, namely that the higher the labor input growth, the lower the labor productivity growth, other things being equal.
Table 11 Labor Productivity Growth, 1990–1995, 1995–2000, 2000–2005, and 2005–2011___Average annual growth rate of GDP at constant basic prices per hour, using 2005 PPP
Unit: Percentage.Source: APO Productivity Database 2013.01.Note: The annual average growth rates for Cambodia and Vietnam during 1990–1995 replicate their annual average growth rates of 1993–1995 due to absent data.
1990–1995 1995–2000 2000–2005 2005–2011ChinaThailandIndonesiaMalaysiaKoreaCambodiaROCVietnamHongKongSriLankaSingaporeIndiaPakistanBangladeshJapanIranPhilippines(reference)
US
AustraliaTurkey
ChinaKoreaVietnamROCBangladeshSingaporeIndiaPhilippinesJapanCambodiaSriLankaIranMalaysiaPakistanThailandHongKongIndonesia(reference)
USEU15AustraliaTurkey
ChinaVietnamCambodiaKoreaIranIndiaIndonesiaHongKongROCMalaysiaThailandSingaporePakistanJapanSriLankaPhilippinesBangladesh(reference)
USEU15AustraliaTurkey
ChinaIndiaSriLankaKoreaIranROCHongKongCambodiaVietnamBangladeshPhilippinesSingaporeThailandMalaysiaIndonesiaJapanPakistan(reference)
USEU15AustraliaTurkey
10.67.46.56.05.55.55.45.24.64.23.83.63.22.52.01.40.0
1.4
2.01.2
7.14.94.84.54.13.72.52.02.01.61.40.70.70.60.40.2
-1.1
2.31.82.32.8
8.66.74.04.03.73.63.23.13.03.02.92.72.31.81.71.3
-0.5
2.41.31.95.9
9.97.15.34.44.03.53.43.23.22.21.91.61.61.51.10.90.4
1.20.91.01.5
1990–2000 2000–2011ChinaKoreaVietnamROCThailandSingaporeMalaysiaBangladeshIndiaSriLankaCambodiaIndonesiaHongKongJapanPakistanIranPhilippines(reference)
USEU15AustraliaTurkey
ChinaIndiaVietnamKoreaIranSriLankaCambodiaROCHongKongThailandMalaysiaSingaporeIndonesiaPhilippinesJapanPakistanBangladesh(reference)
USEU15AustraliaTurkey
8.95.25.05.03.93.73.33.33.02.82.72.72.42.01.91.11.0
1.91.82.12.0
9.35.54.84.23.93.73.63.33.32.22.22.12.11.61.31.31.0
1.71.11.43.5
©20
13 A
sian
Prod
uctiv
ity O
rgan
izat
ion

5
67
5.2 Per-Hour Measure of Labor Productivity
growth was consistently higher than its per-worker counterpart, but instead of narrowing, the diver-gence widened to 1.4 percentage points in the second half of the 2000s. Hours worked in the ROC have also been growing at a slower rate than number of workers, but the portion ranged from 0.4 to 0.5 percentage points.
One can identify where countries are today in terms of their hourly productivity performance against a backdrop of Japan’s historical experience.43 Figure 46 traces the long-term path of Japan’s per-hour labor productivity for the period 1885–2011 along the red line, expressed as relative to Japan’s 2011 level (set equal to 1.0). A structural break is observed during World War II when output collapsed. Countries’ relative hourly productivity levels against Japan in 2011 are then mapped against Japan’s growth experience (as circles). By so doing, a corresponding year can be located when Japan’s hourly productivity level was the closest to that of the country in question. The two countries (i.e., Cambodia and Bangladesh) with the lowest hourly productivity in 2011 see levels corresponding to Japan’s in the 1900s. This means that even if they manage Japan’s long-term productivity growth of 2.9% on average per year, it will still take them over a century to catch up with the Asian leader’s current
42: For China and Thailand, both measures give the same productivity growth. This is a result of a statistical construct in our current database rather than the underlying trend.
43: While mindful that level comparisons of productivity among countries and over periods, are subject to a great degree of data un-certainty, they should provide a rough sketch of the productivity divergence in Asia.
BangladeshCambodia
ROC
Hong Kong
India
Indonesia
Korea
Malaysia
ThailandChina
Vietnampakistan
Singapore
Philippines
Iran
Sri Lanka
0.1
0.2
0.3
0.4
0.5
0.6
0.7
0.8
0.9
1.0
1.1
1880 1890 1900 1910 1920 1930 1940 1950 1960 1970 1980 1990 2000 2010
Labor productivity gap in 2011 relative to Japan(Japan's level in 2011=1.0)
Japan (1885−2011)
Figure 46 Labor Productivity Trends of Japan during 1885–2011 and Levels of Asian Countries in 2011___GDP at constant basic prices per hour, using 2005 PPP
Sources: For historical data of Japan, the sources of GDP are Long-Term Economic Statistics by K. Ohkawa et al. (1974) during 1885–1954 and the JSNA by ESRI, Cabinet Office of Japan, during 1955–2011 (including author adjustments). Hours worked data is based on KEO Database (Kuroda et al., 1997), Keio University, during 1955–2011. During 1885–1954, the average hours worked per person are assumed to be constant. For the labor productivity level of Asian countries in 2011, it is based on the APO Pro-ductivity Database 2013.01. The estimates for Fiji, Iran, the Lao PDR, and Mongolia are defined by per-worker labor productivity due to data constraints.
actual fall in labor input in the period 1990–2011. This served to compensate for a sluggish out-put growth during said period, and to sustain a positive labor pro-ductivity growth of 1.7% a year on average.
Table 11 looks more closely at the latter sub-period and provides the growth rates of per hour-based labor productivity since 1990. The growth patterns of indi-vidual countries generally follow their counterparts closely in per-worker productivity growth as il-lustrated in Table 9, but in some countries the two measures di-verge greatly and are not at all consistent through the periods compared.42 This contrast was particularly stark in the first half of the 1990s, when Japan’s hourly productivity growth was 2.0% compared with 0.6% in per-worker productivity growth. However, the divergence has been narrow-ing to 0.3 percentage points in the 2000s. Korea is another coun-try in which hourly productivity
©20
13 A
sian
Prod
uctiv
ity O
rgan
izat
ion

68
5 Productivity
position (i.e., Singapore, Hong Kong, and Japan). Most Asian countries are clustered around Japan’s level as achieved in the 1950s and early 1960s. Among them, China has been leading the catch-up effort, with produc-tivity growing three times faster than Japan’s long-term average (Table 11), followed by India and Vietnam.
In pole position are the Asian Tigers, of whom Singapore and Hong Kong have already surpassed Ja-pan. Figure 47 compares the time periods taken by each country to raise its labor productivity from 30% to 70% of Japan’s level today (i.e., unit of measurement on the y-axis of Figure 46). What Japan and Singapore had achieved in the 21 years from 1969 to 1990, and the 23 years from 1970 to 1993, respectively, Hong Kong, the ROC, and Korea managed to achieve in less than two decades (Figure 47). Although the speed of catch-up for latecomers is somewhat increasing, most Asian countries will still take a long time to catch up with the leaders, currently clustered at around Japan’s 1960 levels.
5.3 Total Factor Productivity
Labor productivity in the previous sections is only a one-factor or partial-factor productivity measure and does not provide a full perspective of production efficiency. An observation of low labor produc-tivity could suggest production inefficiency, but it could also reflect different capital intensities in the chosen production method under the relative labor–capital price faced by the economy concerned. By observing movements in labor productivity alone, it is not easy to distinguish which is the case. In populous Asian economies, which are relatively abundant in low-skilled labor, production lines may be deliberately organized in a way to utilize this abundant, and hence relatively cheap, resource. It follows that the chosen production method is most likely to be (low-skilled) labor-intensive and with little capital, manifested in low labor productivity. This is why economists analyze TFP, which is GDP per unit of combined inputs, to arrive at a more complete picture of a country’s production efficiency.44
Capital input is a key factor for measuring TFP, and is defined by capital services – the flow of services from productive capital stock, as recommended in the new SNA.45 The required basis for estimating capital services is the appropriate measures of capital stock. The SNA recommends constructing the national balance sheet accounts for official national accounts, but this is still not common practice in the national accounts of many Asian countries.46 Even where estimates of net capital stocks are avail-able for the whole economy, assumptions and methodologies can differ considerably among coun-tries. In response to this challenge, harmonized estimates for productive capital stocks and capital services have been constructed and compiled within the APO Productivity Database built on the
44: Different types of inputs and outputs are aggregated by using index numbers, and TFP is calculated as the output quantity in-dex divided by the input quantity index. In this chapter, the Törnqvist index is used for aggregating labor and 10 types of capi-tal inputs.
45: See the chapter on capital services and the national accounts of the 2008 SNA (United Nations, 2009). The second edition of the OECD Capital Manual (2009) provides a comprehensive framework for constructing prices and quantities of capital services.
46: Based on our metadata survey, half of APO member economies do not estimate the balance sheet accounts within the official national accounts; these countries are Bangladesh, the ROC, Iran, Korea, the Lao PDR, Mongolia, Nepal, Pakistan, Sri Lanka, and Vietnam (but the National Wealth Survey is available in the ROC and Korea for some selected years).
Figure 47 Time Durations Taken to Improve Labor Produc-tivity by Japan and the Asian Tigers
Sources: See Figure 46.
1965 1975 1985 1995 2005
Japan (21)
Singapore (23)
Hong Kong (16)
ROC (16)
Korea (19)
19901969
19931970
19931977
20021986
20111992
©20
13 A
sian
Prod
uctiv
ity O
rgan
izat
ion

5
69
5.3 Total Factor Productivity
same methodology and assumptions.47 In our methodology, changes in the quality of capital are in-corporated into the measurement of capital services in two ways: changes in the composition are captured by explicitly differentiating assets into ten types, and an appropriate and harmonized defla-tor is used for IT capital to reflect the rapid quality change embodied in IT-related assets (see Appendix 2).
The current APO Productivity Database estimates capital services and TFP for 17 Asian countries48 for which long-time investment data by type of asset are available or estimated.49 Their economic growth is decomposed into sources from factor inputs and TFP based on the methodology developed by Jorgenson and Griliches (1967). This report defines output as GDP at constant basic prices, and factors inputs as labor, IT capital, and non-IT capital.50 Labor input is measured by total hours worked (except for Fiji and Mongolia), without adjustments for changes in labor quality.51
Cross-country comparisons of TFP growth for the 17 Asian countries and the US are shown in Figure 48 for the period 1970–2011, and the two sub-periods 1970–1990 and 1990–2011. The average an-nual growth rate of TFP during the entire observation period ranges from almost 0% to 2%, with the exception of China who has achieved considerably high growth of TFP over 3%. Taking the US as the reference economy, with TFP growth of 0.9% on average a year, ten Asian countries achieved higher TFP growth than the US.
Looking at the sub-periods (i.e., 1970–1990 and 1990–2011), one can discern that the two were not identical and in fact had quite significant differences in terms of the magnitude of growth and coun-tries’ relative performance. Ten of the 17 Asian countries experienced acceleration in TFP growth. China and Iran accelerated the most between the two sub-periods: from 1.7% to 4.5%, and from −1.4% to 2.2%, respectively. More modestly, Mongolia’s productivity growth, for example, improved from −0.03% on average a year in the earlier period to 1.9% since 1990.52 Four countries saw their productivity growth more than halved: Thailand,53 Hong Kong, Indonesia, and Japan, all of which had a TFP growth of under 1% on average a year in the period 1990–2011. TFP growth in the ROC, Malay-sia, and the US was little changed.
47: The Department of Statistics Malaysia developed a new set of comprehensive capital stock statistics in April 2011 following the OECD Capital Manual (2009). The correlations between these official estimates (Department of Statistics Malaysia, 2012) and our estimates for the period of 1970–2011 are high; they are 88.7% and 93.6% for the growth rates of net and productive capital stock, respectively. In this report, capital input is defined as capital services computed from our estimates of productive capital stock, so as to ensure that the same methodology and same asset classification are applied for the 17 Asian countries compared.
48: In APO Productivity Database 2013, the TFP estimates for Pakistan and Sri Lanka were newly developed. 49: In measuring TFP, income generated from domestic production should be separated into labor compensation and returns to
capital. The national accounts readily provide the estimates of labor compensation for employees as a component of value added; labor compensation for the self-employed is not separately estimated but is combined with returns to capital in mixed income, except China, where labor remuneration in the national accounts includes labor income for the self-employed (Holz, 2006). In the Databook, it is assumed that the per-worker wages for self-employed and family workers are 20%–80% of the per worker wage for employees in the countries where the appropriate wage data is not available, in order to measure total labor compensation. For sensitivity of our TFP results to our assumptions, see Box 5 (p. 86).
50: IT capital is defined as a composite asset of IT hardware (computers and copying machines), communications equipment, and computer software.
51: The failure to take into account improvements in labor quality leads to TFP overestimation. The current APO Productivity Database estimates the labor quality index for only a handful of countries, and covering more Asian countries is the next challenge. The esti-mate of quality adjusted labor input for Singapore was newly developed last year. See Nomura and Amano (2012).
52: In Mongolia, subsoil assets may have a significant role in economic growth, although they are omitted in our measures of capital inputs.
53: Warr (2006) shows that the average annual TFP growths of Thailand were 2.0% in the period of economic boom (1987–1996), −9.0% during the Asian financial crisis (1996–98), and 1.6% in the period of recovery (1998–2002). These compare with our esti-mates of 2.7%, −8.7%, and 2.5%, respectively.
©20
13 A
sian
Prod
uctiv
ity O
rgan
izat
ion

70
5 Productivity
In terms of its contribution to economic growth, TFP has played a significant role in Asian fast-growing economies over the past decades. During the period of 1970–2011, China achieved the fastest output growth of 8.7% on average a year. This is followed by Singapore and Korea, growing at 7.1% and 6.8% on average a year, respectively (Figure 49). From these GDP growths, the TFP contribution accounted for over 30% of economic growth in six of the 17 Asian countries compared (Figure 50). Among them, the TFP contribution was the largest in Sri Lanka (39%), China (36%), Thailand (33%), and was 30% in Hong Kong and Pakistan. This compares with 31% in the US.
China’s productivity performance has been outstanding in this period. The average TFP growth was 3.2% per year during 1970–2010 (Figure 49). This compares with the long-run estimates of 3.8% dur-ing 1978–2005 in Holz (2006) and also 3.8% during 1978–2004 in Bosworth and Collins (2008). The Chinese experience of long-term TFP growth of about 3.0% is not unprecedented in Asia. According to Jorgenson and Nomura (2005), Japan achieved an annual TFP growth of 3.1% during 1960–1973, even after improvements in labor quality had been taken into account in the estimation of labor growth (and, as such, eliminating overestimation in TFP).54 Both the ROC and Korea55 also achieved a TFP growth of 2.4% and 2.2%, respectively, during the period 1985–2000,56 as shown in the second chart of Figure 51, whereas in the last decade, TFP growth was 2.9% in India.
In the long run, TFP growth has no impact on economic growth for the Philippines and Fiji, while labor input growth explained 60% and 40% of their economic growth, respectively (Figure 50). Looking at the breakdown of the period in Figure 51, one can see that the Philippines and Fiji were running an overall negative TFP growth only in the period 1970–1985, at −1.5% and −1.2% on average per an-num, respectively.57 Negative TFP growth can be caused by many things, including a rapid, temporary
%
1970−2011 1990−20111970−1990
4.5
2.6 2.3 2.3 2.2
1.9 1.9 1.5
1.3 1.2 0.9 0.9 0.8
0.5 0.5 0.4 0.3 0.3 ChinaSri LankaIndiaVietnamIranM
ongoliaKoreaRO
CSingaporePakistanThailandU
SH
ong KongIndonesiaPhilippinesM
alaysiaFijiJapan
3.2
2.1 1.9 1.8 1.7 1.7 1.6 1.4 1.4
1.0 0.9 0.8 0.6 0.6 0.5 0.4
0.0 0.0
−1.5
0.0
1.5
3.0
4.5
ChinaVietnamSri LankaThailandKoreaH
ong KongRO
CPakistanIndiaM
ongoliaU
SIndonesiaSingaporeJapanM
alaysiaIranFijiPhilippines
ThailandH
ong KongChinaPakistanRO
CKoreaVietnamSri LankaIndonesiaJapanU
SM
alaysiaIndiaM
ongoliaSingaporeFijiPhilippinesIran
2.8 2.6
1.7 1.6 1.6 1.5 1.4 1.1 1.1
0.9 0.8 0.6
0.4 0.0
−0.1 −0.3 −0.5
−1.4
Figure 48 TFP Growth, 1970–2011, 1970–1990, and 1990–2011
Source: APO Productivity Database 2013.01.Note: The starting period for Vietnam is 1986. The labor inputs for Fiji and Mongolia are defined by numbers of employment.
54: In the same period 1960–1973, the average annual contribution rate of labor quality improvement to growth is measured as 0.54% in Jorgenson and Nomura (2005). As a measure of the TFP contribution that is comparable with the estimates in this Databook, their estimate can be recognized as 3.6% per year during the same period.
55: Note that economic growth at the aggregate level for Korea has been revised upward considerably in the KSNA published in 2010. The main revisions stem from the introduction of a chain index in Korea’s system of national accounts. As a result, Korea’s GDP growth at constant market prices has been revised up from 7.0% to 8.6% on average in the 1970s, from 8.4% to 9.3% in the 1980s, and from 5.9% to 6.3% in the 1990s.
56: The National Statistics, Republic of China, published the TFP estimates for the period 1982–1999. The correlation of TFP growth rates between their estimates and ours is 0.76 for the whole period. For 1985–2000, our estimate is around 1 percentage point smaller than their estimate of 3.6% (1985–1999).
©20
13 A
sian
Prod
uctiv
ity O
rgan
izat
ion

5
71
5.3 Total Factor Productivity
decline in demand or the inefficient use of resources by political interventions to the economy. This is unlikely to be sustainable in the long run. As shown in the year-on-year changes of growth decompo-sition in each country (Figure 57), the Philippine’s TFP fell severely in the beginning of the 1980s, in which the economy shrank by 15.2% for two years from 1983 to 1985 under the regime of Ferdinand Marcos. In Mongolia, negative TFP growths are observed before the transition to market economy in 1992.
It is clear from Figure 50 that economic growth was predominantly explained by the contribution of capital input in most of the Asian countries, which ranged from 39% in Fiji to 80% in Japan. Among the Asian Tigers, the contribution of capital services ranged from 55% in Hong Kong to 67% in Singapore, whereas in China and India, it accounted for 52% and 58% of economic growth, respectively. This compares with 43% in the US, of which 16 percentage points were contributed by IT capital, a share unmatched by Asian countries. Japan has been leading Asian countries in terms of contribution from IT capital (12% of economic growth) whereas in other Asian countries it has been 1–10%, with China and India trailing behind.
One prevalent characteristic of Asian countries is their investment intensity as a share of GDP (Figure 31, p. 46), and in turn its contribution to economic growth (Figures 50 and 52). There is policy signifi-cance in identifying the driver(s) behind the rapid economic growth in Asian countries. If growth has been driven more by capital accumulation than by capital assimilation, the Asian model may prove to be too expensive for many less well-off countries to emulate. According to our findings (Figures 51 and 52), it is true that, historically, capital accumulation has played a much more significant role in the Asian countries than in the US. However, the relative contribution shares are not constant across
9%
−1
0
1
2
3
4
5
6
7
8
China
Singapore
KoreaVietnam
ROC
Malaysia
India
Sri Lanka
Indonesia
Hong Kong
Thailand
Mongolia
PakistanIran
Philippines
US
Japan
Fiji
LaborNon-IT Capital IT CapitalTFPOutput
1.01.8
1.01.5
1.0 1.4 1.70.9
1.3 1.4 1.3 0.91.5
1.01.5
0.7
−0.1
1.5
0.2
0.6
0.40.3
0.40.3
0.1
0.40.3 0.1 0.1
0.20.1
0.1
0.2
0.4
0.3
0.1
4.3
4.1
3.8 2.9 3.6
4.13.3
2.7 2.2 2.5
1.62.8 1.7 2.5
2.0
0.7
1.8
0.9
3.20.6
1.72.1 1.6
0.5
0.8
1.7 1.8 1.4
1.91.0
1.40.4 0.0
0.9 0.60.0
Figure 49 Sources of Economic Growth, 1970–2011
Source: APO Productivity Database 2013.01.Note: The starting period for Vietnam is 1986. The labor input for Fiji is defined by numbers of employment.
0
20
40
60
80
100
120%
China
Singapore
KoreaVietnam
ROC
Malaysia
India
Sri Lanka
Indonesia
Hong Kong
Thailand
Mongolia
PakistanIran
Philippines
US
Japan
Fiji
LaborNon-IT Capital IT CapitalTFP
12
2515
2215
2129
1624 26 27
1932
25
4027
−2
60
3
9
64
65
3
7
52 2
4
12
6
16
12
3
49
57
55 43 54
65 55
48 3947
32
57 37
62
54
26
68
3636
8
2531
24
814
30 3326
39
2030
11 1
31
221
Figure 50 Contribution Shares of Economic Growth, 1970–2011
Source: APO Productivity Database 2013.01.Note: The starting period for Vietnam is 1986. The labor input for Fiji is defined by numbers of employment.
57: Negative TFP growth for both countries is also observed in other studies. Baier, Dwyer, and Tamura (2006) estimate the average annual growth rate of TFP of Fiji at −0.75% during 1960–2000. Cororaton (2002) shows that the average annual TFP growth of the Philippines was −1.09% during 1970–2000.
©20
13 A
sian
Prod
uctiv
ity O
rgan
izat
ion

72
5 Productivity
countries and over time; there have been periods when (and in some countries where) capital assimi-lation as reflected in TFP growth also contributed significantly toward driving growth.
Looking at Figure 52, capital accumulation was the dominant factor in the early period 1970–1985, typically explaining two-thirds to three-quarters of economic growth achieved. In Thailand, Pakistan, China, and Hong Kong, however, the contribution of TFP growth was still significant, accounting for 30–38% of their respective economic growth. In the subsequent periods, the contribution of capital input became progressively smaller, falling to a share of below 50% on average, while the contribu-tion of TFP became progressively more significant, rising to a share of above 40% on average in the 2000s. The evident rise in the contribution of IT capital is also noteworthy. In 1970–1985, IT capital
1.8 1.7 2.21.5 1.3 2.0
0.81.7
1.10.3
0.0
1.22.2
2.8
1.0
0.3 0.40.5
0.20.0
0.1
0.1
0.1
0.0
0.3
2.2
0.1
0.10.1
0.3
5.4 5.3
6.3
3.5 3.9
4.1
4.4 1.92.5
3.2
4.1
2.7 1.7
0.9
0.9 0.8
−1.0
2.3 2.2
1.7
0.1
5.2
0.8
2.31.6
1.8
0.1
2.2
0.8
1.4
−1.8−1.5−1.2
0.9
−2
0
2
4
6
8
10
1970−1985
1.3 1.61.0 1.4
0.8 1.2 1.6 1.40.6 1.0 0.9 1.1 1.1 1.2
−0.2
0.9
0.10.8
0.50.3
0.50.4
0.1 0.2
0.50.1 0.2 0.6 0.1 0.1
0.4
0.1
4.13.4
3.64.8
3.23.4
2.2 3.1 3.1
0.81.6 0.6
0.7 0.61.6
3.5
1.52.2
0.5
2.4
1.8
0.2
1.9
2.81.3
1.6 0.6 0.8
2.7 0.71.0
1.2 1.0
−0.9
1985−2000 2000−2011
Non-IT Capital IT Capital Labor Output
1.2
1.9
0.1
1.30.3
1.0 1.2 1.0 0.71.5 1.1 1.7 1.3 1.0
2.4
−0.1
1.00.4 0.3
−0.1 0.3−0.4
0.6
0.2 0.4 0.4 0.2
0.50.2
0.20.4 0.7
0.1
0.3
0.30.4 0.3 0.4 0.1 0.3
5.03.2 1.9
4.2
2.6
2.0
1.8
2.21.6 1.9 0.5
1.7
0.91.1 1.7
0.6 0.20.1
3.9
2.93.7
1.3
2.4 1.52.3
1.1
1.3 1.11.4
2.1 1.9 2.1 1.4
0.7 0.6
KoreaRO
CSingaporeH
ong KongChinaM
alaysiaIndonesiaM
ongoliaThailandPakistanSri LankaJapanIndiaIranPhilippinesFijiU
S
ChinaSingaporeKoreaM
alaysiaRO
CVietnamThailandIndiaIndonesiaH
ong KongSri LankaPakistanPhilippinesU
SIranFijiJapanM
ongolia
ChinaIndiaM
ongoliaVietnamIranSingaporeSri LankaIndonesiaPhilippinesM
alaysiaPakistanKoreaThailandH
ong KongRO
CU
SFijiJapan
TFP
0.5
%
0.80.1
0.00.5
0.71.8
Figure 51 Sources of Economic Growth, 1970–1985, 1985–2000, and 2000–2011
Source: APO Productivity Database 2013.01.
KoreaRO
CSingaporeH
ong KongChinaM
alaysiaIndonesiaM
ongoliaThailandPakistanSri LankaJapanIndiaIranPhilippinesFijiU
S
ChinaSingaporeKoreaM
alaysiaRO
CVietnamThailandIndiaIndonesiaH
ong KongSri LankaPakistanPhilippinesU
SIranFijiJapanM
ongolia
22 21 2720 17
24 2813
2821
37
8
3834
63
84
33
35
73
11
1
2
2
0
1
7
12
4
2
10
64 64
78
47 52
74 59
72 32 47
45
75
60
118 78 52
30
11 10
−12
30 30
1
11 13
3831
1711
0
−37 −48 −62−45−53
27
15 22 14 20 1227
1929 27
1222 29 28 33 35
42
−9
462
11
75
7
3
6
2 3
11
22 6
182
3
15
7
45
46
50
68
46 28
54 4059
61
17
4347
19
2421
66
95
39
2130
7
3542
21 29
11 16
59
2720
3039 34
28
3
14 17 15 1228
2032 28 21
55
−1
2311 7
−8
30
6
2 5 6 3
10
4
4 815
2
8
8
109 28
5
42
5144
26
60
44
36
34
43 35 4111
42
22
28 46
37 2021
99
40 3952
19
4127
42
22 28 2433
51 47 5238
4345
ChinaIndiaM
ongoliaVietnamIranSingaporeSri LankaIndonesiaPhilippinesM
alaysiaPakistanKoreaThailandH
ong KongRO
CU
SFijiJapan
%
−20
0
20
40
60
80
100
1201970−1985 1985−2000 2000−2011
Non-IT Capital IT Capital LaborTFP
Figure 52 Contribution Shares of Economic Growth, 1970–1985, 1985–2000, and 2000–2011
Source: APO Productivity Database 2013.01.
©20
13 A
sian
Prod
uctiv
ity O
rgan
izat
ion

5
73
5.3 Total Factor Productivity
accounted for below 5% of economic growth in all Asian countries, except Japan and Singapore. By the 2000s, the IT capital share rose to above 5% in most countries, with the exceptions being India, Iran, Pakistan, Sri Lanka, and Indonesia. Between 1985–2000 and 2000–2010, the contribution of IT capital more than doubled in Malaysia and Japan, from 5% to 14%, and from 15% to 36%, respec-tively. Hong Kong sustained an IT share of 10% in the same period. This yearly accumulation of IT in-vestment may have paved the way for countries to capitalize on the productivity gain from the IT revolution. Reflecting on these results, capital accumulation appears to be a necessary step to eco-nomic growth, and countries may go through cycles of capital accumulation and assimilation. Al-though a prerequisite, capital accumulation does not guarantee TFP growth. Some countries may be more capable than others in reaping the benefits through capital assimilation, but the reasons as to why this is so are beyond the scope of this report.
Figure 53 places our estimates among those of OECD for 16 other OECD countries to give readers a wider perspective.58 Countries are arranged according to their average economic growth per annum for the past decade in descending order. In so doing, the wedge in economic growth is clearly dis-played, with all Asian countries (barring Fiji and Japan) having been filtered out to occupy the top end. Ireland is the only fast-growing economy in Europe. Asian countries are also among those that expe-rienced the fastest TFP growth in the 2000s: 4.1% in China, 3.2% in India, 2.8% in Mongolia, and 2.0% in Korea, and 1.7% in Hong Kong. Their performance was only beaten by Ireland, with TFP growth at 4.4%. Though growing at a more subdued pace, the contribution made by TFP in the slower-growing,
58: The multi-factor productivity in the OECD Productivity Database (OECD, 2012), referred as TFP in this report, defines total input as the weighted average of the growth rates of total hours worked and capital services. Comparing OECD’s TFP estimates for the whole economy with ours, there are mainly two differences in assumptions. Firstly, capital services of residential buildings are included in our estimates of capital input in order to be consistent with output that includes the imputed cost of owner-occupied housing. Secondly, the compensation of capital is defined in our estimates as the residual of the value added and the compensa-tion of labor (compensations for employees, self-employed persons, and contributing family workers), whereas the OECD defines it as the imputed value of capital services based on the assumptions of an ex-ante rate of returns on capital. Thus, although both apply the same Törnqvist index, the weights to aggregate labor and capital can differ. Other than these, our methodology and as-sumptions in measuring capital services are designed to be largely consistent with the OECD methodology, and the impact of the differences in assumptions on the volume estimates of capital services is judged to be limited.
Italy
China
Ireland
India
Vietnam
Mongolia
Iran
Singapore
Indonesia
Sri Lanka
Philippines
Malaysia
Pakistan
Thailand
Korea
Canada
Hong Kong
ROC
Australia
New
Zealand
United Kingdom
Austria
Netherlands
Spain
Germ
any
Denm
ark
Finland
Sweden
US
Belgium
Switzerland
France
Fiji
Japan
TFP Capital Labor Output
0.3
5.6
4.1
3.2
1.1
4.4
1.0
3.3
3.2
1.0
4.5
1.5
1.3
2.1
2.8
0.7
2.8
2.5
1.6
2.5
1.4
1.8
2.3
1.0
1.0
2.0
2.1
1.2
2.0
1.5
0.9
2.6
1.0
2.4
0.6
1.5
1.0
1.2
2.2
0.0
2.1
2.0
1.6
1.1
1.3
0.7
1.6
1.7
0.2
2.2
1.4
1.5
1.3
0.4
1.2
1.0
0.4
0.5
0.9
1.1
0.3
0.5
1.4
0.3
0.6
1.1
0.8
1.1
0.1
0.0
0.8
1.0
0.5
1.0
0.1
0.2
0.5
0.9
0.1
0.7
0.8
−0.2
1.1
0.7
0.50.60.4
0.60.6
0.3
0.2
0.7
0.2
0.40.3
0.4
−0.4
0.5
0.7
0.30.7
−0.9
%
3
0
6
9
Figure 53 Comparison of Sources of Economic Growth with OECD Countries, 2000–2010
Sources: APO Productivity Database 2013.01 for APO member economies and China and the US; OECD Stat (Dataset: Multi-Factor Productiv-ity) for OECD countries (except Japan and Korea). The ending years are different: Denmark, the Netherlands, and the UK are until 2008 and Australia is until 2009.
©20
13 A
sian
Prod
uctiv
ity O
rgan
izat
ion

74
5 Productivity
mature economies should not be underestimated: TFP accounted for half or more of economic growth in, for example, Austria, the Netherlands, Finland, Germany, and the US.
Figure 54 and Table 12 show the growth accounting decomposition for individual countries in five-year intervals covering the period 1970–2011. The relative importance of drivers behind economic growth changes over time. It is a common experience in most countries that a large part of the vibrant growth in the initial period is driven by input growth while TFP growth becomes more prominent and makes a steady contribution in the later periods. Hong Kong’s TFP growth peaked at 5.2% in 1975–1980, and was robust at 3.5% in 1985–1990, when TFP growth also peaked in the ROC, Korea, Japan, and Singapore, at 4.0%, 3.3%, 2.0%, and 2.5%, respectively. Thereafter, TFP growth slowed until recent years when countries experienced a productivity growth resurgence. This resurgence is also shared by Malaysia and the Philippines. TFP growth in Mongolia has been particularly strong since 1995. It has also bounced back in Indonesia59 and Thailand60 from a negative standing following the Asian finan-cial crisis of the late 1990s, but has lapsed again since 2005. In contrast, the US experienced a surge in TFP growth in the second half of the 1990s, which was sustained into the early 2000s before the ad-verse cyclical effect hit in 2005–2010. Over the whole period of estimation, TFP accounted for a quar-ter or more of economic growth in Hong Kong (30%), the ROC (24%), and Korea (25%), while it was 22% in Japan. In contrast, TFP performance has been erratic in Singapore, resulting in its relatively small contribution of only 8% to economic growth over the same period. Among the less developed economies, TFP has been contributing 33% to economic growth in Thailand, 14% in Indonesia, and 8% in Malaysia.
Looking at the decomposition of economic growth in China and in India, the two key drivers have been non-IT capital input growth and TFP growth. While the contribution from non-IT capital has been relatively stable in terms of percentage points, it is their TFP performance that has more bearing in determining the overall economic growth over time. For example, the trough of economic growth that China experienced in 1985–1990 was explained largely by the lack of TFP growth. Similarly, when output growth slowed from its peak in the latter half of the 1990s, it was due to the slowdown in TFP growth from 7.1% on average per annum in the previous period to 3.1%. Thereafter, output growth has accelerated to reflect the pickup in TFP growth in the 2000s. In India, TFP growth was insignificant in the 1970s; since then, it has been accelerating and has increasingly accounting for a greater proportion of economic growth. In the second half of the 2000s, India achieved TFP growth of 3.9% – its highest in the past four decades. Through trials and error, China and India invested first and then learned how to combine inputs efficiently. Both have reaped the benefits of their efforts in robust TFP growth, while the contribution from labor input growth dwindles in the two countries over time.
Tracking the size and growth of IT capital has become a standard practice in productivity research, following attempts to establish the driving force behind productivity resurgence in developed econo-mies, starting with the US in the 1990s. Unlike technological advancements in the past, which were largely confined to manufacturing, IT is a technology that can permeate the economy and bring about significant production gains in, for example, wholesale and retail, banking and finance, and transpor-tation and telecommunications (i.e., service sectors that have traditionally struggled with slow pro-ductivity growth). Given the share of the service sector in the economy (Figure 69, p. 90), its potential and implications for economic development and productivity gains could therefore be immense. A
59: Van der Eng (2008) provides estimates of capital stock for Indonesia and Van der Eng (2009) shows that annual average TFP growth increased from −4.4% during 1995–2000 to 1.7% during 2000–2007 in Indonesia. Warr (2006) also finds that TFP growth increased from −8.4% during 1996–1998 to 1.5% during 1998–2002.
60: Bosworth (2005) shows that annual average TFP growth increased from −4.6% during 1996–1999 to 2.1% during 1999–2004 in Thailand. Warr (2006) also finds that TFP growth increased from −9.0% during 1996–1998 to 1.6% during 1998–2002.
©20
13 A
sian
Prod
uctiv
ity O
rgan
izat
ion

5
75
5.3 Total Factor Productivity
0.1 0.1 0.2 0.7 0.6
4.2 4.0 3.44.3 3.8 4.3
4.35.6
1.0 1.1 1.8
2.8
0.60.7 0.4
0.20.5 1.2
4.90.4
7.1
3.13.9
4.0
1970–1975
1975–1980
1980–1985
1985–1990
1990–1995
1995–2000
2000–2005
2005–2011
China
0.5 0.4 0.4 0.3 0.3 0.8 0.6 0.1
6.65.3
4.03.1 3.4 3.1
2.11.5
2.0
1.9
1.11.2 1.0 0.3
0.3
0.3
–0.7
2.5
0.84.0
2.3
0.9
0.6 2.2
1970–1975
1975–1980
1980–1985
1985–1990
1990–1995
1995–2000
2000–2005
2005–2011
ROC
0.21.9 2.0
1.3 1.00.7 0.4
4.1
2.81.5
1.0
1.9
0.70.3
0.4–0.5 –1.1
–2.1
2.6
–0.4
0.71.2
1970–1975
1975–1980
1980–1985
1985–1990
1990–1995
1995–2000
2000–2005
2005–2011
Fiji
0.2 0.2 0.3 0.4 0.4 0.7
0.5 0.3
2.8 3.7 4.2 3.1 3.4 2.81.3 1.0
1.81.9
0.9 0.4 0.2 1.2
0.5 0.4
1.4
5.2
0.23.5 1.0
–2.1
1.8 2.3
1970–1975
1975–1980
1980–1985
1985–1990
1990–1995
1995–2000
2000–2005
2005–2011
Hong Kong
3.8 4.5 4.02.7 3.5
3.2
1.9 2.5
2.1 1.62.3
2.5 0.7 1.1
0.82.4
2.31.6
–1.6
2.23.2
–3.6
1.8
0.6
1970–1975
1975–1980
1980–1985
1985–1990
1990–1995
1995–2000
2000–2005
2005–2011
Indonesia
0.4 0.2 0.2 0.4 0.3 0.3 0.4
5.0
2.72.0 2.0
1.80.9 0.3
–0.3
0.9
0.40.4
–0.4 –0.7 –0.4 –0.4–0.7
0.5
1.6 2.0
–0.3
0.2 0.9
0.5
1970–1975
1975–1980
1980–1985
1985–1990
1990–1995
1995–2000
2000–2005
2005–2011
Japan
0.2 0.4 0.30.6 0.4 0.5 0.5 0.2
5.76.5
3.9 4.0 4.12.8
1.9 1.6
2.31.8
1.41.9 1.2
0.3
–0.3
1.1
–1.4
3.03.3
1.7
1.61.7
2.4
1970–1975
1975–1980
1980–1985
1985–1990
1990–1995
1995–2000
2000–2005
2005–2011
Korea
0.2 0.3 0.5 0.7 0.6
4.7 4.85.9
3.0
6.0 5.3
2.1 1.7
1.8 1.71.5
1.6
1.1 1.4
0.6 1.3
1.2 1.6
–2.5
2.2
1.8
–2.5
1.3 0.91970–1975
1975–1980
1980–1985
1985–1990
1990–1995
1995–2000
2000–2005
2005–2011
Malaysia
0.2 0.20.2 0.3
0.42.9 3.3
7.0
3.9
1.00.5 0.6
3.00.6
0.9
1.0
2.3
0.52.0
0.5
3.0 1.1
–1.6 –2.5–2.6
2.4
3.4
4.0
1970–1975
1975–1980
1980–1985
1985–1990
1990–1995
1995–2000
2000–2005
2005–2011
Mongolia
0.1 0.1
2.2 2.6 2.6 2.7 2.2
0.9 0.4 0.5
1.4 0.9 1.1 1.20.7
1.91.9
2.7
–0.1
2.32.7
1.7
1.5
0.42.4 0.6
1970–1975
1975–1980
1980–1985
1985–1990
1990–1995
1995–2000
2000–2005
2005–2011
Pakistan
0.1 0.1 0.22.2 2.2 2.2 2.2 2.2 2.3 2.3
4.01.1 1.1
2.0 2.10.9
1.9 1.7
0.4
–0.4 –0.3
0.7
1.5
1.9
1.32.4
3.3
1970–1975
1975–1980
1980–1985
1985–1990
1990–1995
1995–2000
2000–2005
2005–2011
India
4.6 5.52.2 0.9 1.1 2.4 2.7
0.91.5
1.11.2
0.8 1.21.1 0.4
3.9
–9.9
0.41.9 1.8
3.1 1.9
1970–1975
1975–1980
1980–1985
1985–1990
1990–1995
1995–2000
2000–2005
2005–2011
Iran
0.2 0.1 0.3 0.30.6
1.6 1.22.8 3.3
4.91.7 2.3
1.4 0.3
1.7
1.4
4.3 2.3 3.4
–0.5
1970–1975
1975–1980
1980–1985
1985–1990
1990–1995
1995–2000
2000–2005
2005–2011
Vietnam
0.2 0.3 0.4 0.5 0.5 0.8 0.6 0.3
1.1 1.0 0.7 0.70.5
0.70.7
0.5
0.5
1.7
0.91.3
0.7
1.2
–0.1 –0.2
0.8
0.6
1.20.6
0.8
1.5
1.2
0.3
1970–1975
1975–1980
1980–1985
1985–1990
1990–1995
1995–2000
2000–2005
2005–2011
US
0.2 0.2 0.3 0.5 0.30.3 0.3
2.0 1.9 1.9 2.4
5.02.7
0.6 1.1
–0.2
4.4
1.0
3.0
0.3
0.2
1.3 0.7
3.6
1.0
2.3
4.12.3
–2.5
3.20.9
1970–1975
1975–1980
1980–1985
1985–1990
1990–1995
1995–2000
2000–2005
2005–2011
Thailand
0.6 0.4 0.60.8 0.9 0.7
0.6 0.5
7.8
5.2 5.73.0 3.3 3.9
2.1 1.9
2.6
2.4 1.5
2.0 2.0 0.9
0.9 2.0
–1.9
0.2
–1.2
2.5 1.90.1
1.11.8
1970–1975
1975–1980
1980–1985
1985–1990
1990–1995
1995–2000
2000–2005
2005–2011
Singapore
0.2 0.2 0.21.9 2.0
2.8
1.10.3
0.81.6 2.0
2.0 1.4
2.0
0.20.6
2.11.4 0.8
0.32.1
0.1
2.0
4.3
1.80.7
3.5
1970–1975
1975–1980
1980–1985
1985–1990
1990–1995
1995–2000
2000–2005
2005–2011
Sri Lanka
0.40.6 0.2
2.0 3.3 2.70.7
1.7 2.4 1.7 1.5
3.0 1.7 1.8
1.0
1.2 0.7 1.41.3
0.5 0.8
–5.9
2.8
–0.8
0.9 1.6
1970–1975
1975–1980
1980–1985
1985–1990
1990–1995
1995–2000
2000–2005
2005–2011
Philippines
IT capitalNon–IT capitalTFP Labor Output
% % % %
% % % %
% % % %
% % % %
% %
0
2
4
6
8
10
12
–3
0
3
6
9
12
–1
0
1
2
3
4
5
6
–2
0
2
4
6
8
10
–1
0
1
2
3
4
5
6
7
2
0
4
6
8
0
2
4
6
8
10
–4
–2
0
2
4
6
8
10
–1
0
1
2
3
4
–2
0
2
4
6
8
10
–6
–3
0
3
6
9
–4
–2
0
2
4
6
8
10
–3
0
3
6
9
12
–3
0
3
6
–3
0
3
6
9
–12
–9
–6
–3
0
3
6
9
12
0
1
2
3
4
5
6
7
–8
–6
–4
–2
0
2
4
6
Figure 54 Individual Countries’ Growth Accounting Decomposition, 1970–2011
Source: APO Productivity Database 2013.01.
©20
13 A
sian
Prod
uctiv
ity O
rgan
izat
ion

76
5 Productivity
frequent question asked by policymakers and researchers is how best to capitalize on the productiv-ity potential invited by this IT revolution. As with non-IT capital, it involves a process of accumulation and assimilation. IT capability becomes a factor which determines an economy’s long-term growth prospects. The 2008 SNA formally acknowledges the IT sector’s importance to the modern economy and has made it more easily identifiable and separable in industry classification and asset type.
Japan has been leading Asian countries in terms of IT capital contribution to economic growth (Fig-ures 50 and 52). Japan’s shift in capital allocation took off in earnest in the mid-1990s, with the contri-bution of IT capital to capital input growth rising from a low of 11% in 1995 to a peak of 65% in 2005 (Figure 55).61 It took place in a period when Japan’s overall investment growth slowed significantly after the economic collapse of the early 1990s (Figure 38, p. 54); after years of excesses, Japan shifted away from non-IT to IT capital as a profitable investment. In contrast, the US had started its shift to-ward IT capital much earlier than any Asian economy and over a longer period of time. For two decades
Output Labor Capital TFP Output Labor Capital TFPIT Non-IT IT Non-IT
Chin
a
1970–1975 5.7 1.0 (18) 0.0 (1) 4.2 (73) 0.5 (9)
ROC
1970–1975 8.5 2.0 (24) 0.5 (6) 6.6 (78) −0.7 (−8)1975–1980 6.3 1.1 (17) 0.0 (1) 4.0 (64) 1.2 (19) 1975–1980 10.1 1.9 (19) 0.4 (4) 5.3 (52) 2.5 (24)1980–1985 10.2 1.8 (18) 0.0 (0) 3.4 (33) 4.9 (48) 1980–1985 6.2 1.1 (18) 0.4 (6) 4.0 (64) 0.8 (12)1985–1990 7.6 2.8 (37) 0.1 (1) 4.3 (57) 0.4 (5) 1985–1990 8.5 1.2 (14) 0.3 (4) 3.1 (36) 4.0 (47)1990–1995 11.6 0.6 (5) 0.1 (1) 3.8 (33) 7.1 (61) 1990–1995 7.0 1.0 (14) 0.3 (5) 3.4 (49) 2.3 (33)1995–2000 8.3 0.7 (8) 0.2 (3) 4.3 (52) 3.1 (38) 1995–2000 5.1 0.3 (6) 0.8 (15) 3.1 (61) 0.9 (18)2000–2005 9.3 0.4 (4) 0.7 (7) 4.3 (46) 3.9 (42) 2000–2005 3.5 0.3 (7) 0.6 (18) 2.1 (59) 0.6 (16)2005–2010 10.6 0.2 (2) 0.6 (5) 5.7 (53) 4.2 (40) 2005–2010 4.0 0.2 (4) 0.1 (2) 1.5 (38) 2.3 (56)2010–2011 8.9 0.2 (3) 0.5 (5) 5.5 (62) 2.7 (30) 2010–2011 4.0 1.0 (24) 0.1 (3) 1.2 (29) 1.7 (43)1970–2011 8.7 1.0 (12) 0.2 (3) 4.3 (49) 3.2 (36) 1970–2011 6.6 1.0 (15) 0.4 (6) 3.6 (54) 1.6 (24)
Fiji
1970–1975 5.6 4.1 (73) 0.1 (2) 1.9 (35) −0.5 (−9)
Hong
Kon
g
1970–1975 6.2 1.8 (30) 0.2 (3) 2.8 (44) 1.4 (23)1975–1980 3.7 2.8 (76) 0.1 (2) 2.0 (53) −1.1 (−31) 1975–1980 11.0 1.9 (17) 0.2 (2) 3.7 (33) 5.2 (47)1980–1985 0.7 1.5 (204) 0.0 (6) 1.3 (181) −2.1 (−291) 1980–1985 5.6 0.9 (16) 0.3 (5) 4.2 (75) 0.2 (3)1985–1990 3.8 1.0 (27) 0.1 (3) 0.0 (1) 2.6 (69) 1985–1990 7.4 0.4 (5) 0.4 (6) 3.1 (41) 3.5 (48)1990–1995 2.7 1.9 (70) 0.2 (7) 1.0 (38) −0.4 (−15) 1990–1995 5.1 0.2 (5) 0.4 (9) 3.4 (67) 1.0 (19)1995–2000 2.1 0.7 (32) 0.0 (−1) 0.7 (35) 0.7 (34) 1995–2000 2.6 1.2 (48) 0.7 (27) 2.8 (107) −2.1 (−81)2000–2005 2.0 0.3 (15) 0.1 (3) 0.4 (21) 1.2 (60) 2000–2005 4.1 0.5 (12) 0.5 (13) 1.3 (31) 1.8 (44)2005–2010 0.2 0.4 (209) 0.1 (37) 0.1 (44) −0.4 (−190) 2005–2010 3.9 0.8 (21) 0.3 (8) 1.1 (28) 1.7 (43)2010–2011 1.9 0.2 (13) −0.1 (−4) 0.0 (1) 1.7 (90) 2010–2011 4.9 −1.9 (−40) 0.2 (4) 0.8 (17) 5.8 (119)1970–2011 2.6 1.5 (60) 0.1 (3) 0.9 (36) 0.0 (1) 1970–2011 5.7 0.9 (16) 0.4 (7) 2.7 (48) 1.7 (30)
Indi
a
1970–1975 2.9 1.1 (36) 0.0 (1) 2.2 (75) −0.4 (−12)
Indo
nesi
a
1970–1975 8.3 2.1 (25) 0.0 (1) 3.8 (46) 2.3 (28)1975–1980 3.1 1.1 (37) 0.0 (1) 2.2 (72) −0.3 (−10) 1975–1980 7.8 1.6 (20) 0.1 (2) 4.5 (58) 1.6 (20)1980–1985 5.0 2.0 (40) 0.0 (1) 2.2 (44) 0.7 (14) 1980–1985 4.8 2.3 (47) 0.1 (3) 4.0 (85) −1.6 (−34)1985–1990 5.9 2.1 (36) 0.1 (1) 2.2 (37) 1.5 (26) 1985–1990 7.5 2.5 (33) 0.1 (2) 2.7 (36) 2.2 (29)1990–1995 5.1 0.9 (18) 0.1 (2) 2.2 (43) 1.9 (38) 1990–1995 7.6 0.7 (9) 0.2 (3) 3.5 (46) 3.2 (42)1995–2000 5.7 1.9 (33) 0.1 (3) 2.3 (41) 1.3 (24) 1995–2000 0.8 1.1 (132) 0.2 (19) 3.2 (397) −3.6 (−447)2000–2005 6.6 1.7 (26) 0.1 (2) 2.3 (35) 2.4 (36) 2000–2005 4.6 0.8 (17) 0.2 (3) 1.9 (42) 1.8 (39)2005–2010 8.4 0.3 (4) 0.2 (3) 4.0 (47) 3.9 (46) 2005–2010 5.6 2.8 (50) 0.2 (4) 2.4 (43) 0.2 (3)2010–2011 5.5 1.0 (17) 0.2 (3) 4.2 (75) 0.2 (4) 2010–2011 6.3 0.5 (8) 0.2 (4) 2.7 (43) 2.8 (45)1970–2011 5.3 1.4 (26) 0.1 (2) 2.5 (47) 1.4 (26) 1970–2011 5.9 1.7 (29) 0.1 (3) 3.3 (55) 0.8 (14)
Iran
1970–1975 9.4 0.9 (9) 0.0 (0) 4.6 (48) 3.9 (42)
Japa
n
1970–1975 4.4 −0.3 (−6) 0.4 (8) 5.0 (114) −0.7 (−16)1975–1980 −2.9 1.5 (−52) 0.1 (−2) 5.5 (−191) −9.9 (345) 1975–1980 4.3 0.9 (22) 0.2 (5) 2.7 (62) 0.5 (11)1980–1985 3.8 1.1 (30) 0.0 (1) 2.2 (57) 0.4 (12) 1980–1985 4.2 0.4 (9) 0.2 (6) 2.0 (47) 1.6 (39)1985–1990 1.4 1.2 (88) 0.1 (4) 0.2 (17) −0.1 (−9) 1985–1990 4.9 0.4 (8) 0.4 (9) 2.0 (41) 2.0 (42)1990–1995 3.7 0.8 (22) 0.1 (2) 0.9 (24) 1.9 (52) 1990–1995 1.4 −0.4 (−26) 0.3 (23) 1.8 (125) −0.3 (−23)1995–2000 4.1 1.2 (28) 0.1 (2) 1.1 (26) 1.8 (43) 1995–2000 0.8 −0.7 (−80) 0.3 (39) 0.9 (111) 0.2 (29)2000–2005 6.8 1.1 (16) 0.2 (3) 2.4 (36) 3.1 (46) 2000–2005 1.2 −0.4 (−32) 0.4 (33) 0.3 (26) 0.9 (72)2005–2010 5.2 0.3 (5) 0.1 (3) 2.9 (55) 1.9 (37) 2005–2010 0.3 −0.4 (−134) 0.2 (56) 0.0 (11) 0.6 (167)2010–2011 4.7 0.9 (20) 0.1 (2) 2.1 (44) 1.6 (34) 2010–2011 −0.6 −0.3 (48) 0.0 (−9) −0.3 (48) −0.1 (13)1970–2011 4.0 1.0 (25) 0.1 (2) 2.5 (62) 0.4 (11) 1970–2011 2.6 −0.1 (−2) 0.3 (12) 1.8 (68) 0.6 (22)
Kore
a
1970–1975 9.3 2.3 (24) 0.2 (2) 5.7 (61) 1.1 (12)
Mal
aysi
a
1970–1975 7.7 1.8 (23) 0.1 (1) 4.7 (61) 1.2 (15)1975–1980 7.3 1.8 (25) 0.4 (5) 6.5 (90) −1.4 (−19) 1975–1980 8.2 1.7 (21) 0.1 (1) 4.8 (59) 1.6 (19)1980–1985 8.5 1.4 (16) 0.3 (4) 3.9 (45) 3.0 (35) 1980–1985 5.1 1.5 (29) 0.1 (2) 5.9 (117) −2.5 (−49)1985–1990 9.7 1.9 (20) 0.6 (6) 4.0 (41) 3.3 (34) 1985–1990 6.9 1.6 (23) 0.2 (2) 3.0 (44) 2.2 (31)1990–1995 7.4 1.2 (16) 0.4 (5) 4.1 (56) 1.7 (23) 1990–1995 9.2 1.1 (12) 0.3 (3) 6.0 (65) 1.8 (20)1995–2000 4.9 0.0 (0) 0.5 (11) 2.8 (58) 1.6 (32) 1995–2000 4.8 1.4 (30) 0.5 (11) 5.3 (111) −2.5 (−52)2000–2005 4.5 0.3 (6) 0.5 (12) 1.9 (43) 1.7 (38) 2000–2005 4.6 0.6 (12) 0.7 (16) 2.1 (45) 1.3 (27)2005–2010 3.9 −0.3 (−7) 0.2 (5) 1.6 (41) 2.4 (62) 2005–2010 4.4 1.3 (29) 0.7 (15) 1.7 (38) 0.8 (17)2010–2011 3.4 −0.6 (−18) 0.1 (3) 1.5 (44) 2.4 (70) 2010–2011 5.0 1.2 (25) 0.5 (9) 1.6 (32) 1.7 (34)1970–2011 6.8 1.0 (15) 0.4 (6) 3.8 (55) 1.7 (25) 1970–2011 6.3 1.4 (21) 0.3 (5) 4.1 (65) 0.5 (8)
Table 12 Output Growth and Contributions of Labor, Capital, and TFP
©20
13 A
sian
Prod
uctiv
ity O
rgan
izat
ion

5
77
5.3 Total Factor Productivity
Output Labor Capital TFP Output Labor Capital TFPIT Non-IT IT Non-IT
Mon
golia
1970–1975 6.5 0.6 (9) 0.0 (1) 2.9 (45) 3.0 (45)
Paki
stan
1970–1975 3.6 1.4 (39) 0.0 (1) 2.2 (62) −0.1 (−2)1975–1980 5.4 0.9 (17) 0.1 (1) 3.3 (61) 1.1 (20) 1975–1980 5.8 0.9 (15) 0.0 (0) 2.6 (45) 2.3 (40)1980–1985 6.6 1.0 (15) 0.2 (4) 7.0 (106) −1.6 (−24) 1980–1985 6.4 1.1 (17) 0.0 (0) 2.6 (41) 2.7 (42)1985–1990 3.8 2.3 (61) 0.2 (4) 3.9 (101) −2.5 (−66) 1985–1990 5.6 1.2 (22) 0.1 (1) 2.7 (47) 1.7 (30)1990–1995 −1.8 −0.2 (12) 0.1 (−5) 1.0 (−55) −2.6 (148) 1990–1995 4.6 0.7 (16) 0.1 (2) 2.2 (48) 1.5 (34)1995–2000 3.6 0.5 (14) 0.2 (5) 0.5 (14) 2.4 (68) 1995–2000 3.2 1.9 (59) 0.0 (1) 0.9 (28) 0.4 (12)2000–2005 6.3 2.0 (32) 0.3 (4) 0.6 (9) 3.4 (55) 2000–2005 4.9 1.9 (40) 0.1 (1) 0.4 (9) 2.4 (50)2005–2010 6.3 0.6 (10) 0.5 (7) 3.0 (48) 2.2 (35) 2005–2010 4.1 2.8 (69) 0.1 (2) 0.5 (13) 0.6 (16)2010–2011 16.1 0.2 (1) 0.3 (2) 2.9 (18) 12.8 (79) 2010–2011 2.9 2.2 (77) 0.1 (2) 0.3 (10) 0.3 (11)1970–2011 4.9 0.9 (19) 0.2 (4) 2.8 (57) 1.0 (20) 1970–2011 4.7 1.5 (32) 0.1 (1) 1.7 (37) 1.4 (30)
Phili
ppin
es
1970–1975 5.6 3.0 (53) 0.1 (2) 2.0 (36) 0.5 (9)
Sing
apor
e
1970–1975 9.1 2.6 (28) 0.6 (6) 7.8 (86) −1.9 (−21)1975–1980 5.9 1.7 (29) 0.1 (2) 3.3 (56) 0.8 (14) 1975–1980 8.2 2.4 (29) 0.4 (5) 5.2 (63) 0.2 (3)1980–1985 −1.3 1.8 (−141) 0.1 (−11) 2.7 (−211) −5.9 (463) 1980–1985 6.6 1.5 (22) 0.6 (9) 5.7 (86) −1.2 (−17)1985–1990 4.6 1.0 (21) 0.1 (3) 0.7 (15) 2.8 (61) 1985–1990 8.3 2.0 (24) 0.8 (10) 3.0 (36) 2.5 (30)1990–1995 2.2 1.2 (55) 0.1 (3) 1.7 (77) −0.8 (−35) 1990–1995 8.2 2.0 (25) 0.9 (11) 3.3 (41) 1.9 (24)1995–2000 3.5 0.7 (19) 0.4 (12) 2.4 (69) 0.0 (0) 1995–2000 5.6 0.9 (16) 0.7 (12) 3.9 (70) 0.1 (2)2000–2005 4.5 1.4 (30) 0.6 (13) 1.7 (38) 0.9 (19) 2000–2005 4.7 0.9 (20) 0.6 (13) 2.1 (44) 1.1 (23)2005–2010 4.8 1.0 (20) 0.2 (5) 1.5 (31) 2.1 (44) 2005–2010 6.4 2.3 (36) 0.5 (8) 1.9 (29) 1.7 (26)2010–2011 3.8 2.8 (73) 0.1 (4) 1.8 (48) −0.9 (−25) 2010–2011 5.2 0.6 (12) 0.3 (6) 1.9 (36) 2.4 (46)1970–2011 3.7 1.5 (40) 0.2 (6) 2.0 (54) 0.0 (1) 1970–2011 7.1 1.8 (25) 0.6 (9) 4.1 (57) 0.6 (8)
Sri L
anka
1970–1975 4.2 2.0 (48) 0.0 (1) 1.9 (45) 0.3 (7)
Thai
land
1970–1975 5.5 −0.2 (−4) 0.1 (1) 2.0 (37) 3.6 (66)1975–1980 5.6 1.4 (26) 0.0 (1) 2.0 (36) 2.1 (38) 1975–1980 7.4 4.4 (59) 0.2 (2) 1.9 (25) 1.0 (14)1980–1985 5.0 2.0 (41) 0.1 (2) 2.8 (56) 0.1 (2) 1980–1985 5.3 1.0 (19) 0.2 (3) 1.9 (35) 2.3 (43)1985–1990 3.3 0.2 (6) 0.0 (1) 1.1 (34) 2.0 (59) 1985–1990 9.8 3.0 (31) 0.3 (3) 2.4 (24) 4.1 (42)1990–1995 5.3 0.6 (12) 0.1 (1) 0.3 (6) 4.3 (81) 1990–1995 8.2 0.3 (4) 0.5 (7) 5.0 (61) 2.3 (28)1995–2000 4.9 2.1 (43) 0.2 (4) 0.8 (16) 1.8 (37) 1995–2000 0.7 0.2 (25) 0.3 (44) 2.7 (378) −2.5 (−347)2000–2005 4.0 1.4 (36) 0.2 (6) 1.6 (40) 0.7 (18) 2000–2005 5.3 1.3 (24) 0.3 (6) 0.6 (11) 3.2 (59)2005–2010 6.2 0.6 (10) 0.3 (4) 1.9 (31) 3.4 (55) 2005–2010 3.6 0.7 (21) 0.4 (10) 1.2 (32) 1.3 (37)2010–2011 8.0 1.5 (19) 0.1 (1) 2.3 (29) 4.0 (51) 2010–2011 0.3 0.6 (163) 0.3 (74) 1.0 (291) −1.5 (−429)1970–2011 4.9 1.3 (27) 0.1 (2) 1.6 (32) 1.9 (39) 1970–2011 5.6 1.3 (24) 0.3 (5) 2.2 (39) 1.8 (33)
Viet
nam
US
1970–1975 2.7 0.5 (19) 0.2 (8) 1.1 (42) 0.8 (30)1975–1980 3.6 1.7 (48) 0.3 (7) 1.0 (28) 0.6 (17)1980–1985 3.2 0.9 (27) 0.4 (14) 0.7 (22) 1.2 (37)
1985−1990 4.8 1.7 (35) 0.2 (4) 1.6 (33) 1.4 (29) 1985–1990 3.2 1.3 (41) 0.5 (16) 0.7 (22) 0.6 (20)1990−1995 7.9 2.3 (29) 0.1 (2) 1.2 (15) 4.3 (55) 1990–1995 2.5 0.7 (28) 0.5 (18) 0.5 (19) 0.8 (34)1995−2000 6.7 1.4 (21) 0.3 (4) 2.8 (41) 2.3 (34) 1995–2000 4.2 1.2 (29) 0.8 (18) 0.7 (17) 1.5 (35)2000−2005 7.3 0.3 (4) 0.3 (4) 3.3 (45) 3.4 (47) 2000–2005 2.4 −0.1 (−3) 0.6 (25) 0.7 (29) 1.2 (49)2005−2010 6.8 1.7 (25) 0.6 (9) 4.8 (71) −0.3 (−5) 2005–2010 0.7 −0.4 (−60) 0.3 (49) 0.6 (81) 0.2 (29)2010−2011 5.8 1.3 (23) 0.5 (8) 5.1 (88) −1.1 (−20) 2010–2011 1.8 0.9 (52) 0.2 (12) 0.1 (3) 0.6 (33)1970−2011 6.8 1.5 (22) 0.3 (4) 2.9 (43) 2.1 (31) 1970–2011 2.8 0.7 (27) 0.4 (16) 0.7 (26) 0.9 (31)
Unit: Average annual growth rate (percentage), contribution share in parentheses.Source: APO Productivity Database 2013.01.
(i.e., between 1983 and 2003), IT capital accounted for over 40% of the US’ capital input growth, reach-ing height of over 50% at the turn of the millennium. In recent years, the slowdown in total capital growth has concentrated more on non-IT capital, resulting in spikes in the contribution of IT capital in both Japan and the US. The findings here are in accordance with Jorgenson, Ho, and Stiroh (2005). Based on their measurement, IT capital in the 1980s contributed 31.9% of the growth of total capital inputs in the US, but only 13.5% in Japan.62 Since 1995, the Japanese economy had been rapidly shift-ing its capital allocation from non-IT to IT capital. In 2002, the contribution of IT capital in Japan rose to 53.7%, which is higher than the US’ 49.8%.
A similar allocation shift to IT capital is also found in the Asian Tigers (Figure 56).63 In Korea, the ROC, and Hong Kong, the contribution of IT capital to total capital input peaked in excess of 30% at the turn
61: Japan’s capital services recorded negative growth in 2009–2011, for the first time after World War II, although IT capital services increased. This period has been omitted from our calculations of the IT capital contribution share in total capital input in Figure 55
62: Based on our estimates, IT capital contributes 38.5% in the US and 18.5% in Japan to the growth of total capital input. Although the estimates in the 1980s in this report are somewhat higher than the industry-level estimates in Jorgenson, Ho, and Stiroh (2005) and Jorgenson and Nomura (2005), the trends of both the US and Japan shown in Figure 55 are very similar to Figure 3 in Jorgen-son and Nomura (ibid.).
©20
13 A
sian
Prod
uctiv
ity O
rgan
izat
ion

78
5 Productivity
−1.0
0.0
1.0
2.0
3.0
4.0
5.0
6.0
8.0
7.0
1971 1976 1981 1986 1991 1996 2001 2006 2011
Japan
0
10
–10
20
30
40
50
60
80
70
%
1971 1976 1981 1986 1991 1996 2001 2006 2011
US
Non-IT capital (right-axis) IT capital (right-axis) IT capital contribution to capital input growth
0
10
20
30
40
50
60
80
70
% %%
0.5
0.0
1.0
1.5
2.0
2.5
3.0
Figure 55 IT Capital Contribution to Capital Input Growth of Japan and the US, 1970–2011
Source: APO Productivity Database 2013.01.
ROCHong KongKoreaSingapore
ChinaIndia
0
10
20
30
40%
0
10
20
30
40%
1971 1976 1981 1986 1991 1996 2001 2006 2011 1971 1976 1981 1986 1991 1996 2001 2006 2011
Figure 56 IT Capital Contribution to Capital Input Growth of Asian Tigers, China, and India, 1970–2011
Source: APO Productivity Database 2013.01.
63: The quality of the data on investment for IT capital (IT hardware, communications equipment, and computer software) varies con-siderably among countries. If the official estimates are not available in their national accounts, the investment data by type of as-set in benchmark Input–Output Tables (IOT) and the time-series IOTs (if available) are used to separate IT capital investment from GFCF in the national accounts. In the years when the IOTs are not available, domestic production and import data (UN Comtrade Database) for IT hardware and communication equipment is used to interpolate the estimates of IT investments. Thus, data incon-sistency could pose a problem. Where software is excluded from the GFCF definition compliant to the 1968 SNA, software invest-ment is estimated as described in Appendix 1. In addition, the constant-quality prices for IT capital are hardly available for most Asian countries. If they are not available, the prices for IT capital are estimated by harmonizing Japan’s price indices, as described in Appendix 2. Thus, readers are cautioned about data uncertainty and should expect that the decompositions of contributions of capital services into IT and non-IT capital may be considerably revised for some countries, when more reliable data sources for estimation become available.
of the millennium, from a share of 10% or below before 1995. In contrast, Singapore had two local peaks. The first at the end of 1980s when the contribution of IT capital reached 29%, and the second in 2005–2006 when it peaked at 29% again. China was a latecomer in terms of investing in IT capital with a surge in its contributions only taking off around 2000 and peaking at 16% in the early 2000s. There has not been as big a drive in IT pickups in India as in other Asian countries. Rather, the process has been gradual with a clear step-up in effort from a minimal level in the early 1990s. The share of IT capital reached 7% in the early 2000s before lessening recently.
©20
13 A
sian
Prod
uctiv
ity O
rgan
izat
ion

5
79
5.3 Total Factor Productivity
1971 1976 1981 1986 1991 1996 2001 2006 2011
1971 1976 1981 1986 1991 1996 2001 2006 2011 1971 1976 1981 1986 1991 1996 2001 2006 2011 1971 1976 1981 1986 1991 1996 2001 2006 2011
1971 1976 1981 1986 1991 1996 2001 2006 2011 1971 1976 1981 1986 1991 1996 2001 2006 2011 1971 1976 1981 1986 1991 1996 2001 2006 2011
1971 1976 1981 1986 1991 1996 2001 2006 2011 1971 1976 1981 1986 1991 1996 2001 2006 2011 1971 1976 1981 1986 1991 1996 2001 2006 2011
1971 1976 1981 1986 1991 1996 2001 2006 2011 1971 1976 1981 1986 1991 1996 2001 2006 2011 1971 1976 1981 1986 1991 1996 2001 2006 2011
1971 1976 1981 1986 1991 1996 2001 2006 2011 1971 1976 1981 1986 1991 1996 2001 2006 2011 1971 1976 1981 1986 1991 1996 2001 2006 2011
China ROC Fiji
Hong Kong Indonesia
Japan Korea
Malaysia Mongolia Pakistan
India
Iran
Vietnam USThailand
–8–6–4–2
02468
101214
–8
–6
–4
–2
0
2
4
6
8
10
–9
–6
–3
0
3
6
9
12
15
18
–9
–6
–3
0
3
6
9
12
–6
–4
–2
0
2
4
6
8
10
12
–12
–9
–6
–3
0
3
6
9
12
15Singapore
–12
–9
–6
–3
0
3
6
9
12
15
–18
–15
–12
–9
–6
–3
0
3
6
9
12
–9
–6
–3
0
3
6
9
12
15
–4
–2
0
2
4
6
8
10
–4
–2
0
2
4
6
8
–6
–4
–2
0
2
4
6
8
10Sri Lanka
–9
–6
–3
0
3
6
9
12
15
–12
–9
–6
–3
0
3
6
9
12
15
18
–15
–12
–9
–6
–3
0
3
6
9
12
–18–15–12
–9–6–3
0369
121518
–12
–8
–4
0
4
8
12
16
–12
–9
–6
–3
0
3
6
9
12Philippines
IT capitalNon–IT capitalTFP Labor Output
1971 1976 1981 1986 1991 1996 2001 2006 20111971 1976 1981 1986 1991 1996 2001 2006 2011
% % %
% % %
% % %
% % %
% % %
% % %
Figure 57 Individual Countries’ Growth Accounting Decomposition (year-on-year), 1970–2011
Source: APO Productivity Database 2013.01.
©20
13 A
sian
Prod
uctiv
ity O
rgan
izat
ion

80
5 Productivity
1970−2011 1990−20111970−1990
0.9 0.8
–0.3 –0.3–0.5 –0.6 –0.7 –0.8 –0.9
–1.1 –1.2–1.5
–2.0 –2.0–2.3 –2.4
–2.9
–3.6
–5
–4
–3
–2
–1
0
1
2
PakistanSri LankaThailandM
ongoliaIranFijiU
SIndiaH
ong KongPhilippinesChinaM
alaysiaSingaporeIndonesiaVietnamJapanRO
CKorea
% 2.0
1.4 1.0 1.0
–0.1 –0.2 –0.3 –0.3 –0.7
–1.1 –1.3 –1.4 –1.4 –1.5 –1.9 –2.0
–2.7 –2.7
IranSri LankaM
ongoliaPakistanFijiSingaporeIndiaPhilippinesU
SM
alaysiaH
ong KongThailandChinaJapanRO
CIndonesiaKoreaVietnam
0.9 0.8
0.2
–0.2 –0.4 –0.6
–0.9 –1.0 –1.3
–1.6 –2.0 –2.0 –2.0
–3.0 –3.3
–3.9 –4.0
–4.6
ThailandPakistanSri LankaVietnamH
ong KongU
SChinaFijiIndiaM
ongoliaM
alaysiaPhilippinesIndonesiaIranJapanRO
CSingaporeKorea
Figure 59 Capital Productivity Growth, 1970–2011, 1970–1990, and 1990–2011
Source: APO Productivity Database 2013.01.Note: The starting period for Vietnam is 1986.
% 1970−2011 1990−20111970−1990
8.77.9 7.7
6.8
5.3 5.1 5.0 4.9 4.73.8 3.7
3.02.3 2.1 2.0 1.7
1.2 0.8
0
2
4
6
8
10
12
KoreaChinaRO
CVietnamSingaporeJapanIndonesiaH
ong KongM
alaysiaIndiaThailandM
ongoliaU
SPhilippinesIranSri LankaPakistanFiji
10.5
7.6 7.4
6.0
4.6 4.4 4.4 4.1 4.0 3.2 3.1
2.5 1.9 1.8 1.6
0.7 0.6 0.6
ChinaVietnamKoreaRO
CIndiaIndonesiaThailandH
ong KongM
alaysiaJapanSingaporeU
SSri LankaM
ongoliaPhilippinesFijiIranPakistan
9.5
7.6 7.1
5.7 5.5 5.5 5.2
4.2 3.4
3.0 2.8 2.6 2.4 2.1 1.9 1.6 1.0
KoreaRO
CSingaporeJapanH
ong KongIndonesiaM
alaysiaChinaM
ongoliaIranThailandIndiaPhilippinesVietnamU
SPakistanSri LankaFiji
10.2
Figure 58 Capital Deepening, 1970–2011, 1970–1990, and 1990–2011
Source: APO Productivity Database 2013.01.Note: The starting period for Vietnam is 1986. The labor input for Fiji is defined by numbers of employment.
5.4 Enhancement of Labor Productivity
Although TFP more accurately measures how efficiently an economy utilizes its factor inputs, labor productivity and its drivers are of interest not least because of the close link to GDP per capita. Within the same growth accounting framework, average labor productivity growth at the aggregate level can be broken down into effects of capital deepening (as measured by capital input per hour worked), which reflect the capital–labor substitution, and of TFP. In other words, these factors are key in foster-ing labor productivity.
Capital deepening has been taking place in all of the countries compared, albeit to various degrees (Figure 58). Experience of countries suggests that capital deepening is an accompanying process of rapid economic development. The relatively early starters (i.e., Japan and the Asian Tigers) underwent more rapid capital deepening than other countries compared, and in the earlier rather than the latter period. The reverse is true for the emerging Asian economies where concerted efforts were made to increase capital intensity in the latter period. In 1990–2011, China, Vietnam, India, Indonesia, and Thailand moved up to occupy the top spots among the Asian Tigers, while Singapore and Japan stepped down in the rankings. In 1970–1990, the capital–labor ratio was rising by 10.2% and 9.5% on
©20
13 A
sian
Prod
uctiv
ity O
rgan
izat
ion

5
81
5.4 Enhancement of Labor Productivity
average a year in Korea and the ROC, respectively; over the subsequent two decades it slowed to 7.4% and 6.0% respectively. Meanwhile, China’s pace doubled between the two periods, from 5.2% to 10.5% on average a year. In Vietnam, it more than tripled from 2.4% to 7.6%. In the US the pace of capital deepening also hastened from 2.1% to 2.5% between the two sub-periods.
While labor productivity steadily improved for all countries (Figure 44, p. 65), the growth rate of capital productivity as the other measure of partial productivity remains negative for almost all countries during 1970–2011 (Figure 59). Although rates of capital deepening in Korea and the ROC were out-standing, at 8.7% and 7.9% per year, their capital productivity experienced the sharpest decline of 3.6 and 2.9% per year, respectively, on average during this period (Figure 60). In contrast, the deteriora-tion of capital productivity (by 1.2%) was relatively mild in China as shown in Figure 59, despite its fast capital deepening of 7.9% (Figure 58). Looking at the two sub-periods, overall the rate of deterioration in capital productivity for all countries was slower in the latter period. China’s performance is particularly impressive. Its acceleration in capital deepening in the latter period did not compromise
China
Korea
ROC
Vietnam
Hong Kong
Thailand
Singapore
Malaysia
India
Indonesia
Japan
Mongolia
Sri Lanka
Pakistan
US
Iran
Philippines
Fiji
TFP Non-IT capital deepeningIT capital deepening Labor productivity
0.2 0.4 0.4 0.3 0.4 0.2 0.5 0.3 0.1 0.1 0.3 0.2 0.1 0.0 0.4 0.1 0.2
0.0
3.4 3.1 2.9
2.1 2.0
1.4
2.2 2.4
1.52.0 1.8
1.6
0.6 0.7 0.4 1.0 0.8
0.2
3.2
1.71.6
2.11.7
1.8
0.6 0.5
1.4 0.8 0.61.0
1.91.4 0.9 0.4 0.0
0.0
−1
0
1
2
3
4
5
6
7%
Figure 62 Sources of Labor Productivity Growth, 1970–2011
Source: APO Productivity Database 2013.01.
3 7 8 6 9 715 9
3 412 6 4 2
25
517 16
50
60 59
4750
40
67 75
51
6867
58
22 31
23 67
8170
4733 33
47 4253
18 16
46
2821
36
7467
52
28
214
China
Singapore
Korea
Vietnam
ROC
Malaysia
India
Sri Lanka
Indonesia
Hong Kong
Thailand
Mongolia
Pakistan
IranPhilippines
US
Japan
Fiji
TFP Non-IT capital deepening IT capital deepening
0
−20
20
40
60
80
100
120%
Figure 63 Contribution Shares of Labor Productivity Growth, 1970–2011
Source: APO Productivity Database 2013.01.
1970 1975 1980 1985 1990 1995 2000 2005 20100.0
0.2
0.4
0.6
0.8
1.0
1.21970=1.0
ROCHong KongKoreaSingaporeJapan
Figure 60 Capital Productivity Trends in Japan and the Four Asian Tigers, 1970–2011
Source: APO Productivity Database 2013.01.
1970 1975 1980 1985 1990 1995 2000 2005 20100.0
0.2
0.4
0.6
0.8
1.0
1.2
ChinaIndia
1970=1.0
Figure 61 Capital Productivity Trends in China and India, 1970–2011
Source: APO Productivity Database 2013.01.
©20
13 A
sian
Prod
uctiv
ity O
rgan
izat
ion

82
5 Productivity
KoreaRO
CChinaH
ong KongM
ongoliaJapanSingaporeThailand
Indonesia
US
IndiaIranPhilippinesFiji
ChinaKoreaRO
CThailand
Hong Kong
SingaporeM
alaysiaIndonesia
IndiaJapan
US
Philippines
FijiIranM
ongolia
ChinaIndia
VietnamKoreaIran
ROC
Hong Kong
Thailand
US
Japan
Fiji
−2
0
2
4
6
8
101970−1985 1985−2000 2000−2011
%
Malaysia
Sri Lanka
Pakistan
Vietnam
Sri Lanka
Mongolia
Sri Lanka
SingaporeIndonesiaM
alaysia
Philippines
Pakistan
0.2 0.4 0.0 0.2 0.1 0.3 0.4 0.1 0.1 0.10.0
0.30.0 0.0
0.0 0.10.0
4.1 4.1
2.7 2.33.1 3.0
4.2
1.1
3.32.6
0.9 0.5 0.51.2
2.8
1.30.5
0.9 0.8
2.2 2.3 0.8 0.5
−1.0
2.3
0.1
0.8
1.60.9 0.8
0.0
−1.8−1.5−1.2
0.1 0.5 0.4 0.3 0.2 0.5 0.6 0.3 0.10.1
0.1 0.4 0.1 0.2 0.5 0.1 0.0 0.1
3.03.0 2.7 2.6
1.3
2.61.6
2.92.3
0.11.1
1.71.0 0.8 0.1
0.0−1.0
0.6
3.52.2
2.4
1.3
2.80.8
1.50.5
0.6
2.71.6
0.7
1.20.7 1.0
1.0 1.2
−0.9
0.6 0.2 0.3 0.4 0.3 0.1 0.2 0.3 0.4 0.3 0.4 0.1 0.6 0.4 0.3 0.3 0.10.0
4.8
2.5
0.9
3.1
1.81.3 1.2 1.5
0.80.0 0.3 0.8 0.4 0.6
0.1 0.4
−0.20.1
3.9
2.9
3.7
1.3
2.12.4 2.3 1.4
2.1
1.9 1.5 1.1 1.1 0.71.3 0.6
1.4 0.5
Pakistan
TFP Non-IT capital deepening IT capital deepening Labor productivity
Figure 64 Sources of Labor Productivity Growth, 1970–1985, 1985–2000, and 2000–2011
Source: APO Productivity Database 2013.01.
its capital productivity as much as the early starters (Figure 61). In 1990–2011, China’s capital–labor ratio rose by 10.5% whereas its capital productivity fell by 1.4%. This compares with Korea’s perfor-mance in 1970–1990 when its capital–labor ratio rose by 10.2% while capital productivity fell by 4.6%.
Labor productivity growth can be decomposed into contributions from capital deepening and TFP growth. Capital deepening should raise labor productivity, all other things being equal, and it remains the prime motor of labor productivity growth, generally explaining 50% of it; Sri Lanka, Pakistan, Thailand, and the US are the exceptions to this observation (Figure 63). Within this long period, the composition of labor productivity growth has seen substantial shifts (Figures 64 and 65). In the earlier
1970−1985 1985−2000 2000−2011
−20
0
20
40
60
80
100
120%
KoreaRO
CChinaH
ong KongM
ongoliaJapanSingaporeThailand
Indonesia
US
IndiaIranPhilippinesFiji
ChinaKoreaRO
CThailand
Hong Kong
SingaporeM
alaysiaIndonesia
IndiaJapan
US
Philippines
FijiIranM
ongolia
ChinaIndia
VietnamM
ongolia
Iran
ROC
Hong Kong
Thailand
US
Japan
Fiji
IT capital deepeningNon-IT capital deepeningTFP
Vietnam
Sri Lanka
Pakistan
Malaysia
Sri Lanka
Pakistan
Korea
Sri Lanka
SingaporeIndonesiaM
alaysia
Philippines
Pakistan
5 7 1 4 3 7 123 2 2 0
173 2 5
−3
78 77
55 48
7780
114
32
95
75
36
29
37
97
17 16
45 47
2012
−26 −192 −49 −65
65
3
22
6354 60
1
1682871016
2 8 8 8 413 17
8 52
3 14 2 11
32
620
45
53 4961
31
66
43
7976
4
40
62
44
49 8
−1
5339 43
31
66
21
41
1319
94
57
24
480382
5341
61
94
6 3 6 8 8 4 6 10 11 12 176
28 2617
22
5 7
5145
18
65
42
33 33
46
25
1
14 39
1836
5
30
−16
11
4252
76
27
5063 61
44
64
87
6955
54
3978
48
112 81
−400 −46
Figure 65 Contribution Shares of Labor Productivity Growth, 1970–1985, 1985–2000, and 2000–2011
Source: APO Productivity Database 2013.01.
©20
13 A
sian
Prod
uctiv
ity O
rgan
izat
ion

5
83
5.4 Enhancement of Labor Productivity
0.4 0.4 0.3 0.3 0.3 0.7 0.6 0.1
5.13.9
3.22.3 2.8
2.91.9
1.2
–0.7
2.5
0.84.0 2.3 0.9
0.62.2
1970–1975
1975–1980
1980–1985
1985–1990
1990–1995
1995–2000
2000–2005
2005–2011
0.1 0.20.6 0.8
–0.4
–0.2
0.5 0.3
–0.5
–1.1
–2.1
2.6
–0.4
0.7 1.2
1970–1975
1975–1980
1980–1985
1985–1990
1990–1995
1995–2000
2000–2005
2005–2011
0.2 0.2 0.3 0.4 0.4 0.6 0.5 0.3
1.6 2.13.3 2.8 3.2
1.70.9 0.8
1.4
5.20.2
3.51.0
–2.1
1.8 2.3
1970–1975
1975–1980
1980–1985
1985–1990
1990–1995
1995–2000
2000–2005
2005–2011
0.2 0.12.1 3.1 2.5 1.4
3.1 2.41.3
0.4
2.31.6
–1.6
2.2
3.2
–3.6
1.8
0.6
1970–1975
1975–1980
1980–1985
1985–1990
1990–1995
1995–2000
2000–2005
2005–2011
0.4 0.2 0.2 0.4 0.3 0.4 0.40.2
5.2
2.1 1.7 1.7 2.01.3
0.60.3
–0.7
0.5 1.62.0
–0.3
0.20.9
0.5
1970–1975
1975–1980
1980–1985
1985–1990
1990–1995
1995–2000
2000–2005
2005–2011
0.1 0.3 0.3 0.5 0.4 0.5 0.5 0.2
4.15.2
3.0 2.7 3.5 2.81.8 1.8
1.1
–1.4
3.0 3.3 1.71.6
1.7 2.4
1970–1975
1975–1980
1980–1985
1985–1990
1990–1995
1995–2000
2000–2005
2005–20110.1 0.3
0.4 0.7 0.5
2.8 2.94.3
1.3
4.53.0
1.1
–0.2
1.2 1.6
–2.5
2.2
1.8
–2.5
1.3
0.9
1970–1975
1975–1980
1980–1985
1985–1990
1990–1995
1995–2000
2000–2005
2005–2011
0.2 0.1 0.2 0.4
2.1 2.0
5.3
0.61.2
–0.9
2.4
3.0
1.1
–1.6–2.5 –2.6
2.43.4
4.0
1970–1975
1975–1980
1980–1985
1985–1990
1990–1995
1995–2000
2000–2005
2005–2011
0.1 0.1
0.2 0.3 0.50.7 0.7
2.33.0 3.2
1.4
4.32.3
3.4
–0.5
1970–1975
1975–1980
1980–1985
1985–1990
1990–1995
1995–2000
2000–2005
2005–2011
0.2 0.2 0.4 0.5 0.4 0.7 0.6 0.3
0.90.2
0.3 0.1 0.10.1
0.70.6
0.8
0.6
1.2
0.6 0.8
1.51.2
0.3
1970–1975
1975–1980
1980–1985
1985–1990
1990–1995
1995–2000
2000–2005
2005–2011
0.21.4 1.4
0.8 0.81.6 1.0 1.1
3.6
–0.4 –0.3
0.7 1.5
1.91.3
2.4
3.3
1970–1975
1975–1980
1980–1985
1985–1990
1990–1995
1995–2000
2000–2005
2005–2011
0.2 0.70.5
3.2 3.01.9 1.9
3.4 3.84.0
5.50.5 1.24.9
0.4
7.1
3.13.9
4.0
1970–1975
1975–1980
1980–1985
1985–1990
1990–1995
1995–2000
2000–2005
2005–2011
3.5 3.8 0.9
–1.3–0.6 –1.1
0.42.0
3.9
–9.9
0.4
–0.1
1.9 1.83.1
1.9
1970–1975
1975–1980
1980–1985
1985–1990
1990–1995
1995–2000
2000–2005
2005–2011
0.2 0.20.5
0.30.2
0.3
2.2
–0.3
1.40.6
4.6
2.6
–0.5
0.5
3.6
1.0
2.3 4.1
2.3
–2.5
3.20.9
1970–1975
1975–1980
1980–1985
1985–1990
1990–1995
1995–2000
2000–2005
2005–2011
0.5 0.3 0.5 0.6 0.7 0.6 0.5 0.3
5.9
2.7
3.9
0.7 1.2
3.0
1.2
–0.4–1.9
0.2
–1.2
2.5 1.9
0.1
1.1
1.8
–1
0
1
2
3
4
5
6
7
–4
–2
0
2
4
6
8
–4
–2
0
2
4
6
8
–1
0
1
2
3
–2
0
2
4
6
1970–1975
1975–1980
1980–1985
1985–1990
1990–1995
1995–2000
2000–2005
2005–2011
0.40.50.5
2.1 1.3 0.81.6
0.20.5
0.8
–5.9
2.8
–0.8
0.9 1.6
–2
0
2
4
6
8
–1
0
1
2
3
4
5
6
7
–2
0
2
4
6
8
0
2
4
6
8
10
12
–8
–6
–4
–2
0
2
41970–1975
1975–1980
1980–1985
1985–1990
1990–1995
1995–2000
2000–2005
2005–20110.1 0.1 0.1 0.10.2
1.4 1.2 1.3 1.5
0.2–0.2 –0.2–0.1
2.3 2.71.7 1.5
0.4
2.4
0.6
–1
–3
0
3
6
9
–1
0
1
2
3
4
5
6
–4
–2
0
2
4
6
8
0
1
2
3
4
1970–1975
1975–1980
1980–1985
1985–1990
1990–1995
1995–2000
2000–2005
2005–2011
0.10.2 0.2
–0.4
0.7 1.2 1.0
–0.1 –0.6
0.81.6
0.3
2.10.1
2.0 4.3
1.80.7
3.5
–2
–1
0
1
2
3
–3
0
3
6
–10
–8
–6
–4
–2
0
2
4
6
8
–1
0
1
2
3
4
5
6
1970–1975
1975–1980
1980–1985
1985–1990
1990–1995
1995–2000
2000–2005
2005–2011
ROC Fiji Hong Kong
Indonesia Japan
Korea Malaysia Mongolia
Vietnam US
India
China
Iran
ThailandSingaporePhilippines
Pakistan
Sri Lanka
IT capital deepeningNon-IT capital deepeningTFP Labor productivity
% % % %
% % % %
% % % %
% % % %
% %
Figure 66 Decomposition of Labor Productivity Growth, 1970–2011
Source: APO Productivity Database 2013.01.
©20
13 A
sian
Prod
uctiv
ity O
rgan
izat
ion

84
5 Productivity
period of 1970–1985, TFP growth was enjoyed by eleven out of the 16 Asian countries compared, and it was a significant drag on labor productivity growth in four countries (i.e., Singapore, Iran, the Philip-pines, and Fiji). During the middle period of 1985–2000, all countries (except Mongolia) achieved positive TFP growth to bolster labor productivity growth. By 2000–2011, TFP growth had become the dominant driver of labor productivity growth in 13 out of the 17 countries compared. At the same time, the contribution from IT capital deepening was also strengthening, from a range of 1–12% in 1970–1985, to 2–20% in 1985–2000, and 3–28% in 2000–2011. This may have accounted for a boost of countries’ TFP performance. In the mid period of 1985–2000, the contribution of IT capital deepening in the US was ahead of Asian countries accounting for 32% of labor productivity growth. Coinciden-tally, this was also the period when the share of TFP growth was the largest, at 61%.
Figure 66 and Table 13 show the decomposition of labor productivity growth for individual countries in five-year intervals covering the period 1970–2011. Productivity is procyclical in nature, and, in turn,
Table 13 Role of TFP and Capital Deepening in Labor Productivity Growth, 1970–2011
Labor Productivity
Capital deepening TFP Labor Productivity
Capital deepening TFPIT Non-IT IT Non-IT
Chin
a
1970–1975 3.7 0.0 (1) 3.2 (86) 0.5 (13)
ROC
1970–1975 4.8 0.4 (9) 5.1 (105) −0.7 (−14)1975–1980 4.2 0.0 (1) 3.0 (71) 1.2 (28) 1975–1980 6.7 0.4 (5) 3.9 (58) 2.5 (37)1980–1985 6.9 0.0 (1) 1.9 (28) 4.9 (71) 1980–1985 4.3 0.3 (8) 3.2 (75) 0.8 (17)1985–1990 2.4 0.1 (3) 1.9 (82) 0.4 (15) 1985–1990 6.5 0.3 (4) 2.3 (35) 4.0 (61)1990–1995 10.6 0.1 (1) 3.4 (32) 7.1 (67) 1990–1995 5.4 0.3 (6) 2.8 (52) 2.3 (42)1995–2000 7.1 0.2 (3) 3.8 (54) 3.1 (44) 1995–2000 4.5 0.7 (16) 2.9 (64) 0.9 (20)2000–2005 8.6 0.7 (8) 4.0 (47) 3.9 (46) 2000–2005 3.0 0.6 (20) 1.9 (62) 0.6 (19)2005–2010 10.2 0.6 (5) 5.5 (53) 4.2 (41) 2005–2010 3.7 0.1 (2) 1.4 (37) 2.3 (61)2010–2011 8.5 0.4 (5) 5.4 (63) 2.7 (32) 2010–2011 2.1 0.1 (3) 0.3 (14) 1.7 (83)1970–2011 6.8 0.2 (3) 3.4 (50) 3.2 (47) 1970–2011 4.8 0.4 (8) 2.9 (59) 1.6 (33)
Fiji
1970–1975 −0.5 0.0 (−5) 0.0 (−5) −0.5 (110)
Hong
Kon
g
1970–1975 3.2 0.2 (5) 1.6 (51) 1.4 (45)1975–1980 −0.5 0.0 (−3) 0.6 (−112) −1.1 (216) 1975–1980 7.5 0.2 (3) 2.1 (28) 5.2 (70)1980–1985 −1.2 0.0 (−2) 0.8 (−67) −2.1 (170) 1980–1985 3.8 0.3 (7) 3.3 (88) 0.2 (5)1985–1990 2.3 0.1 (3) −0.4 (−16) 2.6 (113) 1985–1990 6.7 0.4 (6) 2.8 (41) 3.5 (53)1990–1995 −0.4 0.2 (−38) −0.2 (39) −0.4 (98) 1990–1995 4.6 0.4 (9) 3.2 (69) 1.0 (21)1995–2000 1.2 0.0 (−3) 0.5 (44) 0.7 (59) 1995–2000 0.2 0.6 (292) 1.7 (819) −2.1 (−1011)2000–2005 1.5 0.1 (4) 0.3 (18) 1.2 (79) 2000–2005 3.1 0.5 (15) 0.9 (28) 1.8 (57)2005–2010 −0.4 0.1 (−15) −0.1 (22) −0.4 (94) 2005–2010 2.3 0.2 (10) 0.4 (19) 1.7 (71)2010–2011 1.5 −0.1 (−5) −0.1 (−6) 1.7 (111) 2010–2011 8.4 0.3 (4) 2.3 (27) 5.8 (69)1970–2011 0.3 0.0 (16) 0.2 (70) 0.0 (14) 1970–2011 4.0 0.4 (9) 2.0 (50) 1.7 (42)
Indi
a
1970–1975 1.1 0.0 (2) 1.4 (131) −0.4 (−33)
Indo
nesi
a
1970–1975 4.4 0.0 (1) 2.1 (47) 2.3 (53)1975–1980 1.1 0.0 (2) 1.4 (125) −0.3 (−28) 1975–1980 4.8 0.1 (2) 3.1 (65) 1.6 (33)1980–1985 1.6 0.0 (2) 0.8 (52) 0.7 (46) 1980–1985 0.9 0.1 (10) 2.5 (264) −1.6 (−175)1985–1990 2.3 0.0 (2) 0.8 (33) 1.5 (65) 1985–1990 3.6 0.1 (3) 1.4 (37) 2.2 (60)1990–1995 3.6 0.1 (2) 1.6 (44) 1.9 (54) 1990–1995 6.5 0.2 (3) 3.1 (47) 3.2 (49)1995–2000 2.5 0.1 (5) 1.0 (42) 1.3 (53) 1995–2000 −1.1 0.1 (−12) 2.4 (−230) −3.6 (342)2000–2005 3.6 0.1 (3) 1.1 (31) 2.4 (66) 2000–2005 3.2 0.1 (4) 1.3 (41) 1.8 (55)2005–2010 7.8 0.2 (3) 3.7 (47) 3.9 (50) 2005–2010 0.3 0.1 (38) 0.0 (4) 0.2 (58)2010–2011 3.7 0.1 (4) 3.3 (90) 0.2 (6) 2010–2011 5.3 0.2 (4) 2.2 (42) 2.8 (54)1970–2011 3.0 0.1 (3) 1.5 (51) 1.4 (46) 1970–2011 2.9 0.1 (4) 2.0 (68) 0.8 (28)
Iran
1970–1975 7.5 0.1 (1) 3.5 (47) 3.9 (52)
Japa
n
1970–1975 4.8 0.4 (8) 5.2 (107) −0.7 (−15)1975–1980 −6.0 0.0 (−1) 3.8 (−63) −9.9 (164) 1975–1980 2.8 0.2 (7) 2.1 (76) 0.5 (17)1980–1985 1.4 0.0 (2) 0.9 (66) 0.4 (32) 1980–1985 3.6 0.2 (7) 1.7 (48) 1.6 (45)1985–1990 −1.4 0.0 (−3) −1.3 (94) −0.1 (9) 1985–1990 4.2 0.4 (10) 1.7 (41) 2.0 (49)1990–1995 1.4 0.0 (3) −0.6 (−39) 1.9 (136) 1990–1995 2.0 0.3 (17) 2.0 (98) −0.3 (−16)1995–2000 0.7 0.1 (9) −1.1 (−150) 1.8 (241) 1995–2000 2.0 0.4 (19) 1.3 (69) 0.2 (13)2000–2005 3.7 0.2 (4) 0.4 (12) 3.1 (84) 2000–2005 1.8 0.4 (23) 0.6 (30) 0.9 (47)2005–2010 4.3 0.1 (3) 2.2 (52) 1.9 (45) 2005–2010 1.1 0.2 (20) 0.3 (31) 0.6 (50)2010–2011 2.3 0.1 (4) 0.6 (26) 1.6 (70) 2010–2011 −0.1 0.1 (−80) −0.1 (93) −0.1 (87)1970–2011 1.5 0.1 (5) 1.0 (67) 0.4 (28) 1970–2011 2.7 0.3 (12) 1.8 (67) 0.6 (21)
Kore
a
1970–1975 5.4 0.1 (3) 4.1 (76) 1.1 (21)
Mal
aysi
a
1970–1975 4.0 0.1 (1) 2.8 (70) 1.2 (29)1975–1980 4.2 0.3 (8) 5.2 (126) −1.4 (−33) 1975–1980 4.5 0.1 (2) 2.9 (63) 1.6 (35)1980–1985 6.4 0.3 (4) 3.0 (48) 3.0 (48) 1980–1985 1.9 0.1 (4) 4.3 (224) −2.5 (−128)1985–1990 6.5 0.5 (8) 2.7 (42) 3.3 (50) 1985–1990 3.6 0.1 (4) 1.3 (36) 2.2 (60)1990–1995 5.5 0.4 (6) 3.5 (63) 1.7 (31) 1990–1995 6.6 0.3 (4) 4.5 (68) 1.8 (28)1995–2000 4.9 0.5 (11) 2.8 (57) 1.6 (32) 1995–2000 0.9 0.4 (49) 3.0 (324) −2.5 (−273)2000–2005 4.0 0.5 (13) 1.8 (44) 1.7 (43) 2000–2005 3.0 0.7 (22) 1.1 (36) 1.3 (42)2005–2010 4.3 0.2 (5) 1.7 (40) 2.4 (55) 2005–2010 1.0 0.5 (50) −0.3 (−25) 0.8 (75)2010–2011 4.4 0.2 (3) 1.9 (43) 2.4 (54) 2010–2011 1.8 0.3 (17) −0.2 (−12) 1.7 (95)1970–2011 5.1 0.4 (7) 3.1 (60) 1.7 (33) 1970–2011 3.2 0.3 (9) 2.4 (75) 0.5 (16)
©20
13 A
sian
Prod
uctiv
ity O
rgan
izat
ion

5
85
5.4 Enhancement of Labor Productivity
it is difficult to discern fundamental shifts from short-term fluctuations. However, over a period span-ning four decades, it can be observed that labor productivity growth in the two fast-growing emerg-ing Asian economies (i.e., China and India) is accelerating. China has clearly leapt from a growth rate of around 4% in the 1970s to a rate of 8–10% in the 2000s, with its transition period in the early 1990s. India’s passage to accelerating labor productivity growth is more gradual than China’s, from around 1.0% in the 1970s to 7.8% in the second half of the 2000s. Both TFP growth and capital deepening took a leap in 2005–2011 to reinforce the positive trend. In contrast, the early starters (i.e., Japan and the Asian Tigers) have been experiencing a slowdown in labor productivity growth since their heights of the late 1980s. In both Hong Kong and Korea labor productivity growth appeared to have stabilized in the 2000s, but at a lower rate than previously. Singapore’s productivity performance, albeit robust compared with other mature economies like the US, has been very modest against its Asian counter-parts. A recent peak of 3.7–3.8% in the 1990s, compared with over 6% in Hong Kong, the ROC, and Korea in the late 1980s. The US clearly enjoyed a labor productivity growth spurt in the late 1990s (2.3%) and early 2000s (2.4%), the origin of which attracted a lot of research attention at the time. In recent years, it has returned to its long-term average of under 2%.
Labor Productivity
Capital deepening TFP Labor Productivity
Capital deepening TFPIT Non-IT IT Non-IT
Mon
golia
1970–1975 5.1 0.0 (1) 2.1 (41) 3.0 (58)
Paki
stan
1970–1975 0.2 0.0 (10) 0.2 (129) −0.1 (−39)1975–1980 3.1 0.1 (2) 2.0 (63) 1.1 (35) 1975–1980 3.7 0.0 (0) 1.4 (37) 2.3 (62)1980–1985 3.9 0.2 (5) 5.3 (136) −1.6 (−41) 1980–1985 3.9 0.0 (0) 1.2 (32) 2.7 (68)1985–1990 −1.9 0.1 (−4) 0.6 (−30) −2.5 (135) 1985–1990 3.0 0.1 (2) 1.3 (43) 1.7 (55)1990–1995 −1.3 0.1 (−7) 1.2 (−86) −2.6 (194) 1990–1995 3.2 0.1 (2) 1.5 (49) 1.5 (49)1995–2000 2.5 0.1 (6) −0.1 (−2) 2.4 (96) 1995–2000 0.6 0.0 (5) 0.2 (28) 0.4 (68)2000–2005 2.7 0.2 (8) −0.9 (−35) 3.4 (128) 2000–2005 2.3 0.1 (2) −0.2 (−8) 2.4 (105)2005–2010 5.0 0.4 (9) 2.3 (47) 2.2 (45) 2005–2010 0.5 0.1 (13) −0.2 (−42) 0.6 (129)2010–2011 15.8 0.3 (2) 2.7 (17) 12.8 (81) 2010–2011 0.0 0.0 (137) −0.3 (−1259) 0.3 (1222)1970–2011 2.7 0.2 (6) 1.6 (58) 1.0 (36) 1970–2011 2.1 0.0 (2) 0.7 (31) 1.4 (67)
Phili
ppin
es
1970–1975 1.0 0.0 (5) 0.5 (46) 0.5 (49)
Sing
apor
e
1970–1975 4.5 0.5 (11) 5.9 (132) −1.9 (−43)1975–1980 3.0 0.1 (2) 2.1 (70) 0.8 (27) 1975–1980 3.2 0.3 (9) 2.7 (84) 0.2 (7)1980–1985 −4.5 0.1 (−2) 1.3 (−30) −5.9 (132) 1980–1985 3.2 0.5 (16) 3.9 (120) −1.2 (−36)1985–1990 2.9 0.1 (3) 0.0 (1) 2.8 (95) 1985–1990 3.8 0.6 (17) 0.7 (18) 2.5 (66)1990–1995 0.0 0.0 (173) 0.8 (3619) −0.8 (−3691) 1990–1995 3.8 0.7 (18) 1.2 (31) 1.9 (52)1995–2000 2.0 0.4 (20) 1.6 (80) 0.0 (0) 1995–2000 3.7 0.6 (15) 3.0 (81) 0.1 (4)2000–2005 1.3 0.5 (35) 0.0 (−2) 0.9 (67) 2000–2005 2.7 0.5 (18) 1.2 (42) 1.1 (40)2005–2010 2.7 0.2 (6) 0.4 (16) 2.1 (78) 2005–2010 1.2 0.2 (21) −0.7 (−62) 1.7 (141)2010–2011 −2.1 −0.1 (3) −1.1 (53) −0.9 (44) 2010–2011 3.9 0.3 (7) 1.2 (31) 2.4 (62)1970–2011 1.0 0.2 (17) 0.8 (81) 0.0 (2) 1970–2011 3.3 0.5 (15) 2.2 (67) 0.6 (18)
Sri L
anka
1970–1975 −0.1 0.0 (−35) −0.4 (612) 0.3 (−477)
Thai
land
1970–1975 5.9 0.1 (1) 2.2 (37) 3.6 (61)1975–1980 2.9 0.0 (2) 0.7 (25) 2.1 (74) 1975–1980 0.8 0.1 (11) −0.3 (−36) 1.0 (125)1980–1985 1.4 0.1 (5) 1.2 (87) 0.1 (8) 1980–1985 3.8 0.2 (4) 1.4 (37) 2.3 (59)1985–1990 3.0 0.0 (1) 1.0 (33) 2.0 (66) 1985–1990 5.0 0.2 (4) 0.6 (13) 4.1 (83)1990–1995 4.2 0.0 (1) −0.1 (−2) 4.3 (101) 1990–1995 7.4 0.5 (7) 4.6 (62) 2.3 (31)1995–2000 1.4 0.1 (9) −0.6 (−40) 1.8 (131) 1995–2000 0.4 0.3 (79) 2.6 (669) −2.5 (−649)2000–2005 1.7 0.2 (12) 0.8 (47) 0.7 (42) 2000–2005 2.9 0.2 (8) −0.5 (−17) 3.2 (109)2005–2010 5.3 0.3 (5) 1.6 (30) 3.4 (65) 2005–2010 2.1 0.3 (15) 0.5 (22) 1.3 (64)2010–2011 5.7 0.1 (1) 1.6 (28) 4.0 (71) 2010–2011 −0.8 0.2 (−28) 0.5 (−61) −1.5 (189)1970–2011 2.6 0.1 (4) 0.6 (22) 1.9 (74) 1970–2011 3.4 0.2 (7) 1.4 (40) 1.8 (53)
Viet
nam
US
1970–1975 1.9 0.2 (10) 0.9 (47) 0.8 (42)1975–1980 1.0 0.2 (21) 0.2 (19) 0.6 (60)1980–1985 1.9 0.4 (22) 0.3 (15) 1.2 (63)
1985−1990 2.2 0.1 (7) 0.7 (32) 1.4 (61) 1985–1990 1.2 0.5 (38) 0.1 (9) 0.6 (53)1990−1995 5.2 0.1 (2) 0.7 (14) 4.3 (84) 1990–1995 1.4 0.4 (29) 0.1 (11) 0.8 (60)1995−2000 4.8 0.2 (5) 2.3 (47) 2.3 (48) 1995–2000 2.3 0.7 (30) 0.1 (6) 1.5 (64)2000−2005 6.7 0.3 (4) 3.0 (45) 3.4 (50) 2000–2005 2.4 0.6 (24) 0.7 (29) 1.2 (47)2005−2010 3.3 0.5 (15) 3.1 (95) −0.3 (−10) 2005–2010 1.3 0.4 (28) 0.8 (57) 0.2 (15)2010−2011 2.7 0.4 (14) 3.4 (128) −1.1 (−42) 2010–2011 0.3 0.1 (47) −0.4 (−144) 0.6 (197)1970−2011 4.5 0.3 (6) 2.1 (47) 2.1 (47) 1970–2011 1.7 0.4 (25) 0.4 (23) 0.9 (52)
Unit: Average annual growth rate (percentage), contribution share in parentheses.Source: APO Productivity Database 2013.01
©20
13 A
sian
Prod
uctiv
ity O
rgan
izat
ion

86
5 Productivity
TFP computations based on the growth accounting framework depends on data that is sometimes difficult to observe. One such task is calculating the wages for the self-employed and unpaid family workers. As a crude approximation in this report, it is assumed that per-worker wages for the self-employed and contrib-uting family workers are 20–80% of the per-worker wage for employee in the countries where the appro-priate wage data is not available, in order to estimate the labor compensation for total employment. The future review on this assumption affects TFP estimates directly through the revision of factor income shares and indirectly through the estimates of the ex post rate of return and thus the aggregate measure of capital services.
The right-hand chart of Figure B5.1 presents the labor income share (the ratio of compensation for employ-ees to the basic-price GDP) based on the official national accounts (including author adjustments in basic-price GDP for some countries) in 17 Asian countries and the US in 2011 and the left chart provides the employee share to total employment. There is a large divergence in labor income share for employees
Box 5 Sensitivity of TFP Estimates
among the Asian countries. Roughly, this divides into two groups: countries with ap-proximately a 50% share and countries with an approxi-mately a 30% share of com-pensation for employees. This does not necessarily reflect differences in the number of employees in total employ-ment. Although Malaysia has a high employee share of 78%, the labor income share is only 32%.
Figure B5.2 illustrates the sen-sitivity of TFP estimates by changing the factor income share during the period 1970–2011. In general, the growth rate of capital input is higher than that of labor input, so the higher income share of la-bor results in higher estimates of TFP growth. In other words, labor productivity is improved much faster over a given peri-od than capital productivity, the growth of which tends to be frequently negative (see Figures 44 and 59). The TFP es-timate reflects the improve-ment of labor productivity more when the labor income share increases. In Malaysia, with TFP growth of 0.5% on average during the period 1970–2011, the true estimate could be 1.1% if the current labor income share is under-estimated by 10%.
−1
0
1
2
3
4%
TFP(vL−10)
TFP(vL+10)TFP3.2
3.9
2.42.1
2.8
1.41.92.1
1.71.82.2
1.5 1.7
2.6
0.8
1.72.2
1.21.6
2.3
0.8
1.41.5
1.31.41.7
1.0 1.01.3
0.7 0.91.1
0.60.81.3
0.30.61.1
0.10.61.1
0.10.51.0
0.00.40.60.2 0.0
0.1
0.00.00.2
−0.2
China
Vietnam
Sri Lanka
Thailand
Korea
Hong Kong
ROC
Pakistan
India
Mongolia
US
Indonesia
Singapore
Japan
Malaysia
Iran
Fiji
Philippines
Figure B5.2 Sensitivity of TFP Estimates by the Change of Income Share, 1970–2011
Source: APO Productivity Database 2013.01.Note: The starting period for Vietnam is 1986. The labor inputs for Fiji and Mongolia are defined by number of employment.
Figure B5.1 Labor Income Share for Employees, 2011
Sources: Official national accounts in each country, including author adjustments.
020406080100 % 0 20 40 60 %
94
54
86
94
72
43
78
94
36
55
44
78
20
48
59
38
51
Share of employees to total
59
57
56
55
53
50
49
48
44
40
34
33
32
32
31
28
28
22
Labor income share for employees
USSri Lanka
ChinaJapan
Hong KongKorea
FijiROC
SingaporePakistan
PhilippinesThailandMalaysia
IndiaIndonesiaMongoliaVietnam
Iran
©20
13 A
sian
Prod
uctiv
ity O
rgan
izat
ion

6
87
This chapter provides the industry origins of economic growth and labor productivity growth in Asian countries. Industry decomposition allows an insight into the source of a country’s economic dynam-ics, which, in turn, determines its overall performance and characteristics, its strengths, and its vulner-abilities. On one hand, a broad industry base reflects diversification and sophistication in the economy, and in turn is more resourceful in weathering economic shocks. On the other hand, reliance on a nar-row industry-base leaves economies more vulnerable to shocks and more susceptible to volatility. Industry structure is a key indicator of an economy’s stage of development. As a rough sketch, at one end of the spectrum are predominantly agricultural- and rural-based economies, while at the other end the agriculture sector is negligible and the service sector is the dominant economic base. The middle realm is occupied by manufacturing as the main driver of economic growth. As an economy matures, its depth and sophistication increases and its resilience to economic shocks should be accordingly strengthened. Furthermore, the different composition of economic activities among countries is also one of the main sources of the huge gap in average labor productivity at the aggre-gate level, as observed in Chapter 5. By analyzing the industry structure of Asian economies, one can clearly trace the path of economic development and identify countries’ respective stages based on their characteristics.64
6.1 Output and Employment
Table 6 (p. 28) in Section 3.2 introduces a country grouping according to stages of development (as measured by per capita GDP relative to the US). Table 14 regroups countries based on the same set of criteria as in Table 6, but applies it to countries’ 2011 income levels. The difference in countries’ relative per capita GDP between the two tables reflects the impact of their catch-up efforts since 1970 or the year of first recorded data.
Comparing Table 14 with Table 6, it is notable that 13 of the 29 Asian economies have moved up in income group, whereas 14 have stagnated. Among them, the most upwardly mobile countries are the ROC and Korea, both in the fast catch-up group, which have moved up two income levels during the past four decades to join Japan in the top income group. Singapore and Hong Kong have also moved up one income group to the L1 level. Malaysia and Thailand have moved up one level to L2. Both China and India have moved up to L3, although they are in different catch-up groups. Indonesia, the Lao PDR, and Vietnam (in Group-C2) have also improved their income level to L3. This means that the number of lowest-income countries has been reduced from ten at the start of the period to three (Myanmar, Bangladesh, and Nepal) as of 2011. As expected, there were few movements in country groups with little or no catch-up. Only Pakistan moved up one level (as it marginally crossed the boundary of income groups from 5.0% to 5.7% that of the US), whereas Saudi Arabia and Bahrain are the only two countries that have moved backward in their income level from L1 to L2.
Countries at the lower rungs of the development ladder tend to have a bigger agriculture sector as a share of value added.65 Figure 67 shows the industry composition66 of the Asian economies in 2010, and indicates a broad, negative correlation between the share of the agriculture sector and the relative
6 Industry Perspective
64: Constructing the industry origins of labor productivity growth requires confronting a large volume of data from different sources. Issues of data inconsistency arising from fragmentation of national statistical frameworks can present enormous hurdles to researchers in this field. The industry data in this chapter is mainly based on official national accounts. Where back data is not avail-able, series are spliced together using different benchmarks and growth rates. Data inconsistencies in terms of concepts, cover-age, and data sources have not been fully treated although levels of breakdown are deliberately chosen to minimize the potential impact of these data inconsistencies. In this sense, the industry data in APO Productivity Database should be treated as a work in progress and it is difficult to advise on data uncertainty. These data will be further developed and examined in the near future. Readers should bear these caveats in mind in interpreting the results.
©20
13 A
sian
Prod
uctiv
ity O
rgan
izat
ion

88
6 Industry Perspective
grow in importance as one moves up income levels. The finance sector is especially promi-nent in Hong Kong (38%), Singapore (29%), and the US (33%). Mining appears to be what defines oil-exporting countries, typically accounting for over 40% of total value added, except in Bahrain (22%), Iran (15%), and the UAE (28%) – countries which have managed to diversify away from the dominance of mining. Finance is the biggest sector in Bahrain, accounting for 27% of total value added, whereas it is the second largest sector (17%) in the UAE, following mining.
Manufacturing is a key sector in propelling countries to make a leap in economic development. It ac-counts for around 20% of total value added or more in eight of the 29 Asian countries compared. Among these, manufacturing is the largest sector in China, Korea, and Thailand, at equivalent to around 30% of total value added, while in the ROC, Malaysia, and Indonesia it accounts for a quarter or more. At the other end of the spectrum are five countries where manufacturing accounts for less than 10%. Among these, two are oil-exporting countries and the other three are Hong Kong (2%), Mongolia (7%), and Nepal (6%). These compare with the values for the US at 11% and Australia at 8%.
Figure 68 shows the breakdown of the manufacturing sector, comprising nine sub-industries, for 17 selected Asian countries and the US.67 The dominance of machinery and equipment in Asian manufacturing can be clearly seen, particularly in the ROC and Singapore (close to 60% of
65: In Chapter 5, GDP is adjusted to be valued at basic prices (including our estimates, if the official estimates at basic prices are not available). However, the definition of GDP by industry differs among countries in this chapter due to data availability. GDP is val-ued at factor cost for Fiji, India, and Pakistan; at basic prices for Cambodia, Hong Kong, Korea, Iran, the Lao PDR, Mongolia, Nepal, and Singapore; at producers’ prices for the ROC, and the Philippines; and at market prices for Bangladesh, Indonesia, Japan, Malay-sia, Sri Lanka, Thailand, and Vietnam.
66: The nine industries are 1–agriculture; 2–mining; 3–manufacturing; 4–electricity, gas, and water supply; 5–construction; 6–whole-sale and retail trade, hotels, and restaurants; 7–transport, storage, and communications; 8–finance, real estate, and business activi-ties; and 9–community, social, and personal services. See Appendix 6 for the concordance with the ISIC, Revision 3.
67: Manufacturing consists of nine sub-industries: 3.1–food products, beverages, and tobacco products; 3.2–textiles, wearing apparel, and leather products; 3.3–wood and wood products; 3.4–paper, paper products, printing, and publishing; 3.5–coke, refined petro-leum products, chemicals, rubber, and plastic products; 3.6–other non-metallic mineral products; 3.7–basic metals; 3.8–machinery and equipment; and 3.9–other manufacturing. See Appendix 3 for the concordance with ISIC, Revision 3.
per capita GDP against the US. Half of the Asian countries com-pared have an agriculture sector accounting for over 10% of total value added, and they all have a relative per capita GDP that is 20% below that of the US. Among them, the three countries with the biggest agricultural share are all in the lowest income group (i.e., with a per capita GDP less than 5% that of the US). In contrast, the agriculture sector is 10% or less of the total value added for Group-L2 countries, compared with 3% or less for Group-L1 economies. In particular, agriculture accounts for less than 1% in the US, while it is negligible in Hong Kong and Singapore. Note also how finance, real estate, and business activities
Sources: Official national accounts in each country, including author adjustments.Note: The annual catch-up rates are based on the data during 1970–2011. The starting years for some countries are different due to data availability: Cambodia (1987–), the Lao PDR (1984–), and Nepal (1974–).
Table 14 Country Groups Based on the Current Economic Level and the Pace of Catching Up___Level and average annual growth rate of GDP at constant market prices, using 2005 PPP
(C1) >3%
Annual rate to catch-up to the US
(C2)1% <–< 3%
(C3) 0% <–< 1%
(C4) <0%
Per capitaGDP level to
the US in 2011
(L1) 60% <
(L2) 20% <–< 60%
(L3) 5% <–< 20%
(L4) < 5%
ROC, Korea, Singapore
Hong Kong Japan, EU15Brunei, Kuwait,
Qatar, UAE,Australia
Malaysia, Thailand, Oman
Iran, TurkeyBahrain,
Saudi Arabia
Cambodia, ChinaIndia, Indonesia,
Lao PDR, Mongolia, Sri Lanka, Vietnam
Pakistan Fiji, Philippines
MyanmarBangladesh,
Nepal
©20
13 A
sian
Prod
uctiv
ity O
rgan
izat
ion

6
89
6.1 Output and Employment
manufacturing’s total value add-ed), and Korea (50%) and Japan (45%). These compare with 40% in the US. At the other end are countries dominated by light manufacturing (e.g., the food products, beverages, and tobacco products sector in the Philippines, Sri Lanka, Fiji, and Mongolia, and the textiles, wearing apparel, and leather products sector in Cambo-dia and Bangladesh). Coke, refined petroleum products, chemicals, rubber, and plastic products are also a prominent subsector, not least in Kuwait, where they ac-count for two-thirds of the coun-try’s manufacturing value added.
Figure 69 shows the industry shares of value added and em-ployment by the four country groups based on 2011 income levels, compared with the Asia29 average and the US for the years 1980, 1990, 2000, and 2010.68 The first thing to note is that in 2010, the service sector accounted for the largest share of total value added in all country groups, inde-pendent of their economic devel-opment.69 That said, Group-L1 has always had the biggest service sector among all Asian countries, and this has become much more distinctive as the bulk of the economy in this group continues to shift heavily toward services over time. By 2010, the service sector accounted for 69% of total value added in Group-L1, com-pared to 80% in the US and 51% in Group-L2.70 The weight of the service sector is similar in Group-L3 and Group-L4 at 46–48%. This reflects the relative importance of manufacturing to the former, and agriculture for the latter, at their particular stages of development.
0 10 20 30 40 50 60 70 80 90 100 %
1. Agriculture 2. Mining3. Manufacturing 4. Electricity, gas, and water supply5. Construction 6. Wholesale and retail trade, hotels, and restaurants7. Transport, storage, and communications 8. Finance, real estate, and business activities9. Community, social, and personal services
Group-L2(except for China)
Group-L1(except forBahrain, Oman, and Saudi Arabia)
Group-L4
Group-L3(except for
Bangladesh)
NepalMyanmarCambodiaLao PDRPakistanVietnamBangladeshIndiaMongoliaIndonesiaSri LankaPhilippinesFijiThailandMalaysiaChinaTurkeyIranAustraliaKoreaSaudi ArabiaROCOmanJapanUSUAEBruneiBahrainKuwaitQatarHong KongSingapore
8.7 9.5 10.1 10.4 10.5 11.7 12.3 12.8
15.3 16.2 18.0 18.6 20.6 21.2
29.7 36.1 36.4 36.9
51.0 51.5
21.9 50.8
29.8
45.5
41.5
9.5 16.7
5.2 12.3
3.2
11.2 25.8
2.7
10.9 3.1
9.6
10.5
5.4 14.6
12.1 8.5
11.2 19.7
10.5 27.2
11.0 30.3
8.3 13.2
17.6 32.5
25.6 31.4
15.3 21.4
18.0 24.8
7.3 14.9 17.9
19.6 17.7
10.1 15.6
19.6 6.2
2.1
2.9
2.4 2.3
2.6 2.4 2.5
2.8
3.6 2.3
3.0
4.2 2.3
4.0
4.2
3.3
5.1
7.5
3.1
11.1
3.6
5.5
5.7
2.9
4.6
6.3
7.7
6.4
4.7
6.6
3.2
2.8
2.9
6.1
7.6
10.3
8.2
8.3
7.0
2.3
5.3
6.4
4.6
6.9
20.8 27.0
6.9
4.3 7.4
3.7 14.6
11.6 13.8
8.3 20.9
8.8
10.9 11.4
14.0 14.9
10.9 14.2
17.6 18.8
17.4 20.2
13.7 10.0
17.2 15.7 10.7
18.4 17.6
20.2 14.5
19.7 15.9
12.3 11.1
3.9
6.7 6.8
3.4 8.3
7.1 10.3
5.0 5.0
5.1
8.2 8.8
7.5 14.7
7.0 6.5 6.9
15.4 6.5
12.7 6.6
12.0 7.3
4.4 13.1
4.8 8.1
13.8 8.0
28.8 37.8
13.2 12.9
24.0 6.1
17.5 33.0
16.8 8.5
19.1 9.2
19.3 21.3
16.3 22.1
10.9 12.9 11.8
18.1 17.8
13.7 7.2
10.7 16.0 8.6
5.6 6.8
6.4 7.4
12.5
10.6 17.0
8.9 15.5 16.1
19.3 7.3
28.6 29.7
14.0 21.3
16.1 20.1
27.9 14.8 12.4
14.4 12.3 13.1
14.8 13.4 11.2 10.2
13.5 14.0
17.9 9.3
16.0 10.0 10.7
4.0 11.9
21.6
Figure 67 Industry Shares of Value Added, 2010
Sources: Official national accounts in each country, including author adjustments.
0 20 40 60 80 100 %
3-1. Food products, beverages, and tobacco products3-2. Textiles, wearing apparel, and leather products3-3. Wood and wood products3-4. Paper, paper products, printing, and publishing3-5. Coke, rened petroluem products, chemicals, rubber, and plastic products3-6. Other non-metallic mineral products3-7. Basic metals3-8. Machinery and equipment3-9. Other manufacturing
SingaporeKoreaROCKuwaitIndiaMalaysiaIranUSJapanCambodiaBangladeshThailandHong KongIndonesiaFijiPhilippinesMongoliaSri Lanka
3.2 4.1 4.6 5.9
9.5 11.8 12.7 13.4 13.9
15.5 21.6
22.3 24.8
29.1 34.6
46.6 50.7 50.8
4.2 3.0
3.0 15.1
4.6 2.8
63.7 41.9
8.2 8.6
7.8 5.08.0 9.8
5.9 13.3
18.0
2.8 2.6
3.5 2.7 2.0
3.1 3.3
5.2 2.95.4
2.3 3.8 3.9
30.0 4.1
15.4
3.4 4.5 6.1
26.7 15.7 3.319.0
69.8 21.8
30.7 27.0 10.7
26.3 15.8
3.2 3.68.1 4.1
21.5 7.0
24.4 2.82.8
8.9 4.814.5 2.7
18.0
17.2 6.3
5.911.3 6.7
2.8 3.210.0
2.6 2.0 9.5 3.1
1.8 7.7
2.0 3.9
3.4 15.4
2.9
62.4 51.1
58.5 9.8
30.9 42.6
29.7 40.6
44.8
8.3 6.3
34.1 21.2
24.4 11.2
21.3 2.3
7.6
3.4
4.3
5.1 4.9
2.5
4.8 4.8
6.2 3.1 2.5
2.3
2.3
Figure 68 Industry Shares of Value Added in Manufactur-ing, 2010
Sources: Official national accounts in each country, including author adjustments.
©20
13 A
sian
Prod
uctiv
ity O
rgan
izat
ion

90
6 Industry Perspective
The second noteworthy point is that Asia29 is still a region dominated by agriculture as far as employ-ment is concerned, despite its downward trend. In the past three decades, the agricultural employ-ment share for Asia29 dropped from 62% in 1980 to 40% in 2010, while its share in total value added rose from 6% in 1980 to 10% in 2010, implying that agriculture is becoming more labor-efficient. In the past three decades, the value-added share of agriculture in Group-L3 has more than halved from 31% in 1980 to 13% in 2010, with the most rapid shift taking place in the 1990s; employment in the sector was also cut by one-third over the same period. The least well-off countries, in contrast, have not been as successful in diversifying away from agriculture, which accounted for 26% of total value added and 53% of employment in 2010, compared with 34% and 69%, respectively, in 1980. In the meantime, the richest economies continued to squeeze agriculture even though it had a share of only 3% in total value added and 17% in total employment in 1980. By 2010, the figures had fallen to 1% and 5%, respectively.
Comparisons of the value added and employment shares also reveal some interesting facts. Agricul-ture is the only industry sector that consistently has a disproportionately higher employment share than justified by its share in value added across all country groups. This suggests that agriculture is still highly labor-intensive and/or there may be a high level of underemployment in the sector in Asia, both of which imply that the labor productivity level is low compared to other industry sectors.71 Thus, countries with a big agriculture sector often have low per capita GDP, and shifting out of agriculture will help boost economy-wide labor productivity. The US is an exception, where its agricultural
Figure 69 Industry Shares of Value Added and Employment by Country Group, 1980, 1990, 2000, and 2010
Sources: Official national accounts in each country, including author adjustments.
Emp.
V.A.
Emp.
V.A.
Emp.
V.A.
Emp.
V.A.
Emp.
V.A.
Emp.
V.A.
GroupL-1
1980
GroupL-2
GroupL-3
GroupL-4 Asia29 US
Emp.
V.A.
Emp.
V.A.
Emp.
V.A.
Emp.
V.A.
Emp.
V.A.
Emp.
V.A.
GroupL-1
GroupL-2
GroupL-3
GroupL-4 Asia29 US
1990
Emp.
V.A.
Emp.
V.A.
Emp.
V.A.
Emp.
V.A.
Emp.
V.A.
Emp.
V.A.
GroupL-1
GroupL-2
GroupL-3
GroupL-4 Asia29 US
2000
9. Community, social, and personal services8. Finance, real estate, and business activities7. Transport, storage, and communications6. Wholesale and retail trade, hotels, and restaurants5. Construction4. Electricity, gas, and water supply3. Manufacturing2. Mining1. Agriculture
Emp.
V.A.
Emp.
V.A.
Emp.
V.A.
Emp.
V.A.
Emp.
V.A.
Emp.
V.A.
GroupL-1
GroupL-2
GroupL-3
GroupL-4 Asia29 US
2010
0
10
20
30
40
50
60
70
80
90
100%
68: The group averages as industry share of value added are based on a country’s industry GDP, using exchange rates for the whole economy without consideration of the differences in relative prices of industry GDP among countries.
69: The service sector is defined in this Databook as 6–wholesale and retail trade, hotels, and restaurants; 7–transport, storage, and communications; 8–finance, real estate, and business activities; and 9–community, social, and personal services.
70: If Figure 67 was to rank by the size of the service sector, Hong Kong would top the table at 92.9%, followed by the US (80.4%), and other Group-L1 countries, namely the ROC (66.4%), Japan (70.7%), and Singapore (72.5%). Fiji is an exception, with a large service sector share (67.1%) relative to its per capita GDP level.
©20
13 A
sian
Prod
uctiv
ity O
rgan
izat
ion

6
91
6.1 Output and Employment
value-added share and employment share are similar, suggesting that labor productivity in this sector is higher than that experienced in Asian countries. The reverse is true for the sector of finance, real estate, and business activities, which often generate a much bigger value-added share than suggest-ed by its employment share. In 2010, the sector accounted for 33% of total value added generated by 19% of employment in the US, and 13% and 3%, respectively, in Asia29. While the value-added share of the sector has grown by 11 percentage points in the US over the past three decades, it has only grown by 1 percentage point in Asia29.
The third point to note is that the industry structure in Asian countries differ from that in the US as regards the relative importance of manufacturing, even in Group-L1 countries, where manufacturing accounts for 22% of the economies’ value added, compared with 11% in the US in 2010. The US econ-omy is highly skewed toward the service sector, accounting for 80% of the total value added, com-pared with an average of 69% in Group-L1 countries. Certainly, its share of finance, real estate, and business activities at 33% was much larger than the share in Group-L1 countries, at 19%. This suggests that Asian economies could experience further deindustrialization, and a shift in prominence toward services as they continue to mature. The relative prominence of manufacturing in the Asian regional economy as a whole is reflected in the fact that income groups are not filtered out by the size of a country’s manufacturing sector.72 In Asia, the manufacturing employment share is typically smaller than the value-added share that it generates. Furthermore the value-added share of the sector has been shrinking in the high-income groups (i.e., Group-L1 and Group-L2) whereas in Group-L3 coun-tries it has been relatively stable, and slowly expanding in Group-L4, reflecting their different develop-mental stage.
Figure 70 shows how the share of the agriculture industry in total value added shrank over time in the Asian economies. This could reflect the actual decline in agricultural output and/or the relatively rapid expansion in other sectors. Despite the broad spread, the downward trend is unmistakable, even for Group-L4 countries. The share of the agriculture sector displays a long-term declining trend in all countries, albeit at different paces and at different starting times. Looking at the available data, the share of agriculture in most Asian countries (excluding the oil-exporting countries) clustered around the 30–50% band in the 1970s, trending down to the 10–20% band by 2010. Vietnam and Mongolia are two countries where the agriculture sector experienced similar declines but within a much shorter period (from the late 1980s and mid-1990s, respectively). The relative decline of agriculture was most rapid in Korea, from 29% of total value added in 1970 to 2.6% in 2010. In many countries, the share of the agriculture sector more than halved between 1970 and 2010: for example, from 44% to 15% in Indonesia, from 42% to 18% in India, and from 39% in 1972 to 19% in Bangladesh. In China, the share of this sector also significantly declined, from 36% in 1970 to 10% in 2010.
Despite the relative decline of agriculture’s share in total value added, employment in the sector for Asia as a whole still accounted for 40% of total employment in 2010. Figure 71 shows countries’ indus-try shares in total employment, and ranks them by size of employment in the agriculture sector.73 Group-L4 and Group-L3 countries and Thailand cluster at the top in Figure 71, with the share of agricultural employment ranging from 33% (Sri Lanka) to 76% (Nepal). Figure 72 traces the historical
71: Gollin, Parente, and Rogerson (2004) and Caselli (2005) demonstrate the negative correlation between employment share of ag-riculture and GDP per worker. They show that the agriculture sector was relatively large in less well-off countries and agricultural labor productivity was lower than that in other sectors.
72: If Figure 67 was to rank by the size of the manufacturing sector, China would lead with a share of 32.5%, followed by Thailand and Korea at 31.4% and 30.3%, respectively.
73: Data for the Lao PDR and Myanmar are unavailable for Figure 71.
©20
13 A
sian
Prod
uctiv
ity O
rgan
izat
ion

92
6 Industry Perspective
trajectory of Japan’s employment share of agriculture for the period 1885–2011 and the countries’ levels in 2010, mapped against Japan’s experience (as circle). Large shares of agriculture employment over 30% in twelve countries correspond to Japan’s level at the end of the 1950s and the onset of high economic growth. This may indicate there is much room for improving labor productivity and per capita income.
The trend of employment share over time (Figure 73) suggests that the relative decline in the share of agriculture in total value added has been accompanied by a downward trend in its share in total em-ployment.74 This trend is unmistakable in most of the countries plotted in Figure 73.75 Between 1970 and 2010, the employment share in agriculture shrank from 50% to 7% in Korea and from 20% to 5%
74: Nepal’s employment-by-industry figures are constructed by interpolating benchmark data taken from its labor force survey as well as its population census. Figure 73 indicates that its share of agriculture has increased since 1999. This reflects the employment share of agriculture at 66% in the population census of 2001 and its share of 74% in the labor force survey of 2008.
75: However, the decline in a share does not always reflect an actual fall in employment for the agriculture sector; rather, it could reflect total employment rising faster than employment in agriculture. Countries that have been experiencing a consistent fall in actual employment in the agriculture sector are, for example, the ROC, Hong Kong, Japan, and Korea, whereas in Cambodia, India, Iran, Nepal, and Pakistan, actual employment has been rising. Other countries such as Thailand, Indonesia, Singapore, Malaysia, and Vietnam have no established trend in employment growth. China, however, has seen actual employment in agriculture falling since the turn of the millennium.
0
5
10
15
20
25
30
Group-L1
0
5
10
15
20
25
30
1970 1975 1980 1985 1990 1995 2000 2005
Group-L22005 2010 20101970 1975 1980 1985 1990 1995 2000
1970 1975 1980 1985 1990 1995 2000 20052005 2010 20101970 1975 1980 1985 1990 1995 2000
% %
10
20
30
40
50
60
70
Group-L3
%
10
20
30
40
50
60
70
Group-L4
%
BangladeshMyanmarNepal
BruneiROCHong KongJapanKoreaKuwaitQatarSingaporeUAEAustralia
BahrainIranMalaysiaOmanSaudi ArabiaThailandTurkey
Cambodia China FijiIndia Indonesia Lao PDRMongoliaPakistanPhilippinesSri LankaVietnam
Figure 70 Long-Term Trends of Value-added Share in the Agriculture Sector, 1970–2010
Sources: Official national accounts in each country, including author adjustments.
©20
13 A
sian
Prod
uctiv
ity O
rgan
izat
ion

6
93
6.1 Output and Employment
in Japan. Employment in agricul-ture also fell rapidly in the ROC, from 25% in 1978 to 5% in 2010. In China, the share has declined from 71% in 1978 to 37% in 2010.
It is the manufacturing sector that largely absorbs workers who have been displaced from the agricul-ture sector, especially in the initial stages of economic development. Figure 74 traces the trajectory of growth rates of GDP and em-ployment in combination with manufacturing for several Asian countries and the US over the past four decades. Each dot repre-sents the average annual growth rate in the 1970s, 1980s, 1990s, and 2000s. The growth rate in the 2000s is described by a white dot. If manufacturing GDP and em-ployment grow at the same rate, a dot will be on a 45° line through the origin running from the lower left to upper right quadrants. De-spite positive gains in manufac-turing GDP, for the US and Japan, the overall ‘growth’ in manufac-turing employment was negative, except for during the US’s 1970s and Japan’s 1980s,. In Korea and the ROC, expansions of manufac-turing output could allow for in-creases of employment in the 1970s and the 1980s but since the 1990s manufacturing has no long-er been an absorption sector of employment, regardless of the sound expansion of production in this sector. The experiences of Singapore, Indonesia, and Thai-land are closer to the 45° line through the origin, which im-plies the well-balanced growth of output and employment in man-ufacturing sector. In China and Sri Lanka, the job creation role of manufacturing still seems ef-fective. In India, Pakistan, and
Figure 71 Industry Shares of Employment, 2010
Sources: Official national accounts in each country, including author adjustments.
0 10 20 30 40 50 60 70 80 90 100 %
Group-L2(except for Fiji)
Group-L1(except for Bahrain,Oman, andSaudi Arabia)
Group-L4
3
3
4 5
5
5 7 10
13
19
25
33
34 34
37
38 38
45
48 49
53
57 76
7
3
2
2
2
3
4
17 12
8 9
8
6 9
7
7 16
8
27 17
18
17
17
18
18
8 6
18
14 13
13
12 14
22
11 6
2
4
8
12 23
40 8
5
9 9
12
12 8
33
8 7
6
9
14
6
6
5 5
9
6 5
7
5 6
2
3 3
32
21
16
11
14
15
16 21
18
21
18
12
24
23
22
24
17
21
16
23
17
10
23
21
16
15
15
8
15 7
12
10
9
6
3
5
3 7
9
5
9
4
5
8
13
6
10
5
6
7
9
4
3
5
5
7
3
3
3 2
18
8
4
3
6
19
6 5
9
5
5
3
9
14
3
9
4
6
4
5
2
3
2
2
5
25
32 35
24 55
46
57 42
38
45 39
33
22 24
23
21
17
18
17
17 23
19
12 15
11
10 10
6
10 4
1. Agriculture 2. Minig3. Manufacturing 4. Electricity, gas, and water supply5. Construction 6. Wholesale and retail trade, hotels, and restaurants7. Transport, storage, and communications 8. Finance, real estate, and business activities9. Community, social, and personal services
Group-L3(except for Bangladesh, and Thailand)
Hong KongSingaporeBahrainQatarBruneiUSKuwaitAustraliaUAESaudi ArabiaJapanOmanROCKoreaFijiMalaysiaIranTurkeySri LankaPhilippinesMongoliaChinaThailandIndonesiaPakistanBangladeshVietnamIndiaCambodiaNepal
Figure 72 Employment Share of Agriculture in Japan dur-ing 1885–2011 and Levels of Asian Countries in 2010
Sources: Official national accounts in each country, including author adjustments. The sources of historical data of Japan are Long-Term Economic Statistics by K. Ohkawa et al. (1974) during 1885–1954 and Population Censuses since 1920.
Nepal
1881 1891 1901 1911 1921 1931 1941 1951 1961 1971 1981 1991 2001 2011
SingaporeBrunei
Vietnam
Cambodia
Pakistan
Thailand Mongolia
Philippines
MalaysiaKorea
Fiji
India
Bangladesh
IndonesiaChina
ROC
Iran
Japan (1885–2011)
Agriculture Share in Total Employment
Sri Lanka
0.1
0.2
0.3
0.4
0.5
0.6
0.7
0.8
Hong Kong
©20
13 A
sian
Prod
uctiv
ity O
rgan
izat
ion
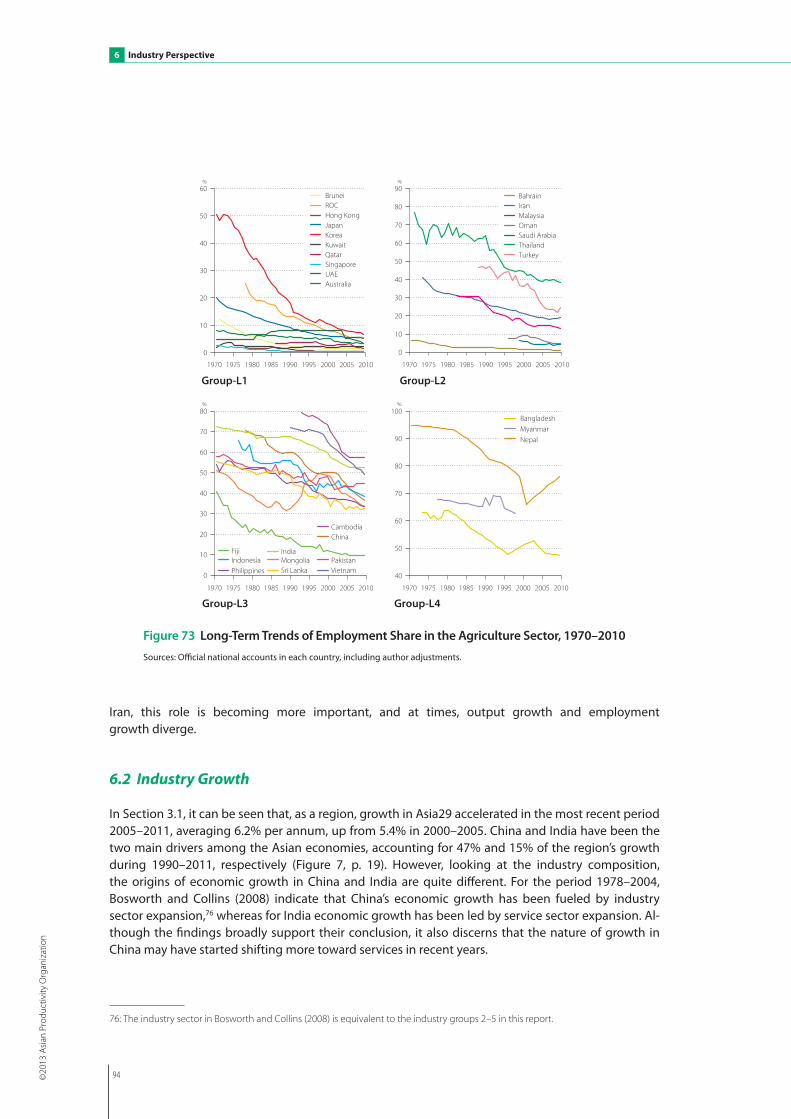
94
6 Industry Perspective
Iran, this role is becoming more important, and at times, output growth and employment growth diverge.
6.2 Industry Growth
In Section 3.1, it can be seen that, as a region, growth in Asia29 accelerated in the most recent period 2005–2011, averaging 6.2% per annum, up from 5.4% in 2000–2005. China and India have been the two main drivers among the Asian economies, accounting for 47% and 15% of the region’s growth during 1990–2011, respectively (Figure 7, p. 19). However, looking at the industry composition, the origins of economic growth in China and India are quite different. For the period 1978–2004, Bosworth and Collins (2008) indicate that China’s economic growth has been fueled by industry sector expansion,76 whereas for India economic growth has been led by service sector expansion. Al-though the findings broadly support their conclusion, it also discerns that the nature of growth in China may have started shifting more toward services in recent years.
76: The industry sector in Bosworth and Collins (2008) is equivalent to the industry groups 2–5 in this report.
Group-L1 Group-L2
Group-L3 Group-L4
% %
%%
0
10
20
30
40
50
60
70
80
90
1970 1975 1980 1985 1990 1995 2000 2005
0
10
20
30
40
50
60
70
80
1970 1975 1980 1985 1990 1995 2000 2005
40
50
60
70
80
90
100
1970 1975 1980 1985 1990 1995 2000 2005
0
10
20
30
40
50
60
1970 1975 1980 1985 1990 1995 2000 2005 2010 2010
2010 2010
BruneiROCHong KongJapanKoreaKuwaitQatarSingaporeUAEAustralia
BahrainIranMalaysiaOmanSaudi ArabiaThailandTurkey
CambodiaChina
Fiji IndiaIndonesia Mongolia PakistanPhilippines Sri Lanka Vietnam
BangladeshMyanmarNepal
Figure 73 Long-Term Trends of Employment Share in the Agriculture Sector, 1970–2010
Sources: Official national accounts in each country, including author adjustments.
©20
13 A
sian
Prod
uctiv
ity O
rgan
izat
ion

6
95
6.2 Industry Growth
The effect of extending the latest period to include 2010 has noticeably pulled down the averages for this period. The adverse impact of the global financial crisis has been significant for most countries and deep in some, rendering the period atypical for comparisons. Our results show that manufactur-ing had been the biggest contributor to economic growth in China until the 2000s when the service sector overtook manufacturing in this respect (Figure 75).77 The gap between contributions of manu-facturing and services was the widest in the early 1990s; narrowing in the late 1990s until a redress in the 2000s, with manufacturing and services accounting for 35% (Figure 76) and 44% (Figure 77) of economic growth, respectively. In contrast, economic growth in India has always been dominated by services and its growth has only become more pronounced over time. The contribution of
77: The Törnqvist quantity index is adopted for calculating the growth of real GDP. Using this index, the growth of real GDP into the products of contributions by industries can be decomposed:
= ∑ i (1/2) (sjt + sj
t−1) In (Qjt / Qj
t−1)Real GDP growth Contribution of an industry j
In (GDPt / GDPt−1) where Qj
t is real GDP of an industry j in period t and sjt is the nominal GDP share
of an industry j in period t.
Growth ofEmployment in Mnf
%10
%10
20 %
%8
−5
−4
−3
−2
−1
00
1
2
−2 2
−4
6
Growth of GDP in Mnf
2000−2010
1970−1980
1980−1990
1980−1990
1980−1990
1980−1990
1970 −1980
1970 −1980
1990 −2000
1990 −2000
2000−2010
2000−2010
%
%
0
2
4
6
8
0 5 10 15
Growth ofGDP in Mnf
0
1
2
3
4
5
6
7
0 2 4 6 8 10
Growth ofEmployment in Mnf
%
−12
−10
−8
−6
2
4
6
8
−8 −4 4 8 12 16 %
Growth ofEmployment in Mnf
Growth of GDP in Mnf
2000−2010
Growth of GDP in Mnf
Growth ofEmployment in Mnf
−2
4
JapanUSAustralia
ChinaIndonesiaSingaporeThailand
IndiaIranPakistanSri Lanka
ROCHong KongKorea
0
1990−2000
1990−2000
1970 −1980
Figure 74 Job Creation in Manufacturing, 1970–2010___Average annual growth rates of GDP at constant prices and number of employment
Sources: Official national accounts in each country, including author adjustments.Note: Each dot represents the average annual growth rate in manufacturing (mnf ) in the 1970s, 1980s, 1990s, and 2000s. The white dots indicate the rate in the latest decade.
©20
13 A
sian
Prod
uctiv
ity O
rgan
izat
ion

96
6 Industry Perspective
manufacturing and services to economic growth were 17% (Figure 76) versus 63% (Figure 77) in 2000–2010, compared with 18% and 51% in 1985–1990. The increased prominence of the service sec-tor has weakened, not so much manufacturing’s hold, but agriculture’s – the contribution of which shrank from 18% in the late 1980s to 8% in the latest period of comparisons.
Manufacturing has sustained its prominence in Thailand, Korea, and the ROC, contributing 36%, 41%, and 49% to economic growth in 2000–2010, respectively, while its importance is modest in Singapore as 26% in 2000–2010 (Figure 76). In Hong Kong, it has been a drag on economic growth in the past decade or so. During the Asian crisis, the most impaired economies were Thailand and Indonesia, and the sectors which bore the brunt were construction, wholesale and retail trade, hotels, and restau-rants, and finance, real estate, and business activities. In contrast, manufacturing played a significant role in bolstering the economy at the time (Figure 76).
The service sector plays an equal, if not more important, role in Asian economic growth. Services made the biggest contribution to economic growth in all Asian countries except Qatar (Figure 77). The story behind India’s recent growth has been one of services. Modern information and communi-cation technology have allowed India to take an unusual path in its economic development, bypass-ing a stage when manufacturing steers growth.78 Within the service sector, contribution is quite evenly spread among the sub-sectors, more recently the iron/steel and motor vehicle sectors have been intensively developed.79 For further improvement in per capita GDP and to capitalize on the
−4
−2
0
2
4
6
8
10
12%
%
ThailandKoreaM
alaysiaSingaporeRO
CChinaIndonesiaIndiaPakistan
VietnamN
epalPhilippinesJapanM
ongoliaFijiBangladeshAustralia
US
Sri LankaLao PD
RO
man
UAE
BruneiBahrainIranKuw
aitM
yanmar
1985–1990
ChinaM
alaysiaKuw
aitSingapore
ThailandU
AE
VietnamKoreaIndonesiaCam
bodiaRO
CLao PD
RIranSri LankaO
man
IndiaM
yanmar
BahrainN
epalPakistanBangladesh
Brunei
Qatar
FijiU
SPhilippinesJapanM
ongolia
1990–1995
−2
0
2
4
6
8
10
12
Qatar
ChinaM
yanmar
Cambodia
VietnamU
AESingaporeIndiaLao PD
RM
alaysiaRO
CBangladeshSri LankaKoreaN
epalU
SBahrainIranPakistanAustralia
PhilippinesO
man
Hong Kong
Saudi ArabiaKuw
aitFijiBruneiM
ongoliaJapanIndonesiaThailand
1995–2000M
yanmar
Qatar
China
Cambodia
Lao PDR
IndiaVietnam
Mongolia
Bangladesh
Iran
IndonesiaSri Lanka
Pakistan
Om
an
Hong Kong
ROC
Fiji
BruneiJapan
2000–2010
2. Mining
5. Construction
8. Finance, real estate, and business activities
3. Manufacturing
6. Wholesale and retail trade, hotels, and restaurants
9. Community, social, and personal services
1. Agriculture
4. Electricity, gas, and water supply
7. Transport, storage, and communications
Real GDP
Saudi Arabia
Philippines
Turkey
Qatar
Australia
TurkeySaudi Arabia
Turkey
Bahrain
Singapore
ThailandU
AE
Malaysia
KoreaKuw
aitTurkeySaudi Arabia
Nepal
AustraliaU
S
Figure 75 Industry Origins of Economic Growth, 1985–1990, 1990–1995, 1995–2000, and 2000–2010___Industry decomposition: Average annual growth rate of GDP at constant prices
Sources: Official national accounts in each country, including author adjustments.
©20
13 A
sian
Prod
uctiv
ity O
rgan
izat
ion

6
97
6.2 Industry Growth
demographic dividend (see Box 2, p. 33), expansion of labor-intensive manufacturing may be required in India for greater job creation.
Economic growth in the Asian Tigers was also dominated by the service sector, albeit more so in Sin-gapore and Hong Kong than in the ROC and Korea, where manufacturing remained a significant force. The service sector accounted for 50% of growth in the ROC for the period 2000–2010, 52% in Korea, 71% in Singapore, and 104% in Hong Kong (to counterbalance the negative contribution of 3% by manufacturing and 2% by construction) (Figure 77). These compare with 99% in the US (to counter-balance the negative contribution of 12% by construction). In the 2000s, growth in Hong Kong was highly skewed toward wholesale and retail trade, hotels, and restaurants, accounting for 44% of growth. This compares with 23% in Singapore and 18% in the ROC. In contrast, the sector contributed only 7% to Korea’s growth over the same period (Figure 78). Finance, real estate, and business activi-ties also played an important part, contributing 40% to growth in Hong Kong, 28% in Singapore, and 14% in the ROC.
The oil-exporting countries have different industry structures from other countries, with their reliance on mining for growth. The sector is volatile in nature and could in turn give rise to big swings in its
Figure 76 Contribution of Manufacturing to Economic Growth, 1995–2000 and 2000–2010
Sources: Official national accounts in each country, including author adjustments.
ChinaCambodia
KoreaMalaysiaVietnam
SingaporeUAEROC
Sri LankaTurkey
IranLao PDR
BangladeshUS
PhilippinesIndonesia
IndiaMyanmar
Saudi ArabiaThailand
QatarOman
FijiPakistan
NepalBruneiBahrainAustralia
JapanKuwait
Hong KongMongolia
40
36
47
40
26
27
25
26
25
29
27
17
17
18
20
116
110
12
9
22
6
17
31
13
10
24
6
6
25 −2
−14
−67 Contribution share
3.4
2.5
2.3
2.2
1.8
1.6
1.6
1.4
1.2
1.1
1.1
1.0
0.8
0.8
0.8
0.7
0.7
0.7
0.6
0.6
0.6
0.5
0.5
0.5
0.5
0.3
0.3
0.2
0.2
0.0
−0.4
−0.8 Contribution
35
22
30
25
49
41
36
26
17
21
24
26
21
24
17
23
8
18
19
19
10
15
11
10
49
8
10
6
3
1
0
−3
ChinaMyanmarVietnam
CambodiaROC
KoreaThailand
SingaporeIndia
BangladeshIndonesiaPakistan
IranOman
BahrainMalaysia
QatarPhilippines
TurkeySaudi Arabia
Lao PDRSri LankaMongolia
KuwaitJapanUAEUSFiji
AustraliaNepalBrunei
Hong Kong Contribution share
3.5
2.5
2.0
1.9
1.9
1.7
1.6
1.4
1.2
1.2
1.2
1.2
1.1
1.0
1.0
1.0
0.9
0.9
0.8
0.8
0.8
0.8
0.6
0.4
0.4
0.3
0.1
0.1
0.1
0.0
0.0
−0.1 Contribution
200 40 60 80−1.00.01.02.03.04.0 0 30 60−1.00.01.02.03.04.0% % % %
1995−2000 2000−2010
78: The computer software industry in India depends considerably on export demands. According to India’s Input–Output Table 2006–2007, 82% of the output in computer and related activities is exported. This export is equivalent to 14.8% of total exports in India and is the second-largest export product (among 130 products in this table).
79: In 2011, India was the 6th largest producer (3.9 million) of motor vehicles (80.1), following Korea (4.7), Germany (6.3), Japan (8.4), the US (8.7), and China (18.4), based on a survey by OICA (International Organization of Motor Vehicle Manufacturers). India moved up in the rankings from 15th (0.8) in 2000 to 12th (1.6) in 2005.
©20
13 A
sian
Prod
uctiv
ity O
rgan
izat
ion

98
6 Industry Perspective
economies from one period to another. In 2000–2010, mining accounted for almost half of economic growth in Qatar, 10% in Kuwait, 7% in Saudi Arabia, and only 1% in Iran, reflecting a drop in the demand toward the end of 2008 and 2009 (Figure 75). Still, it has been a drain on growth, in some cases a significant one; its contribution was −5% in Bahrain and Oman, and −124% in Brunei, reflect-ing a reduction in oil or gas production. These countries would do well to learn to diversify. Bahrain has been successful in branching into finance, real estate, and business activities, which accounted for 34% of the 6.1% overall growth over the same period. Oman also sustained growth of 4.4% on average a year, 60% of which originated from the service sector. Brunei has not managed as well, with dismal growth of 0.7% on average a year between 2000 and 2010. Oil and gas production activities are also reflected in Mongolia and the Lao PDR, where mining accounted for 18% and 20% of overall economic growth, respectively, in the 2000s.
For some Asian countries, agriculture is still the biggest sector. The four countries in which the agriculture sector has the largest share in total value added are Myanmar, Cambodia, Nepal, and the Lao PDR (Figure 67, p. 89). For the period 2000–2010, agriculture in Myanmar, Nepal, and Cambodia had the highest contribution to economic growth among all Asian countries, accounting for 33%, 30%, and 22% of growth, respectively.80 In the latest period, agricultural output is still expanding in the majority of Asian countries, suggesting that the shrinkage in its value-added share (Figure 70, p. 92)
80: In Myanmar, agriculture accounted for over 36.4% of GDP in 2010. Since 1988, the government has continued its modest steps to liberalize the sector and marketing controls have been made less onerous. As a result, farm production has increased. According to official statistics, the quality of which has been questionable, this sector accounted for 33.1% of GDP growth in 2000–2010.
Figure 77 Contribution of Service Sector to Economic Growth, 1995–2000 and 2000–2010
Sources: Official national accounts in each country, including author adjustments.
74
65
63
41
55
77
103
79
58
41
51
69
33
53
60
50
34
45
60
58
20
97
48
144
29
59
43
68
65
80
55
−30 0 30 60 90
ROCSingapore
IndiaChinaUAEUS
Hong KongAustraliaSri Lanka
CambodiaMalaysia
IranMyanmar
KoreaBahrainNepal
VietnamBangladeshPhilippines
TurkeyQatar
KuwaitPakistan
MongoliaLao PDR
Saudi ArabiaOman
FijiBruneiJapan
ThailandIndonesia
4.0
4.0
3.7
3.5
3.4
3.2
3.1
3.0
2.8
2.8
2.8
2.7
2.5
2.5
2.3
2.3
2.3
2.3
2.2
2.2
2.0
1.9
1.8
1.8
1.6
1.6
1.4
1.1
0.9
0.8
0.3
−0.3 −39
−1.00.01.02.03.04.05.0
63
38
73
44
38
104
51
71
65
45
63
63
73
54
63
70
70
65
53
40
60
56
61
74
51
58
52
50
99
193
91
72
0 30 60 90
IndiaQatar
BahrainChina
MyanmarHong Kong
Lao PDRSingaporeMongoliaCambodia
IranSri Lanka
UAEBangladeshPhilippines
TurkeyKuwait
MalaysiaIndonesiaVietnamOman
PakistanSaudi Arabia
AustraliaThailand
NepalKoreaROCUS
BruneiFiji
Japan
4.7
4.5
4.5
4.4
4.4
4.0
3.8
3.7
3.7
3.4
3.3
3.2
3.2
3.1
2.9
2.9
2.8
2.7
2.7
2.7
2.6
2.5
2.5
2.3
2.2
2.2
2.1
1.9
1.4
1.3
1.2
0.5
0.01.02.03.04.05.06.0 % %%%
Contribution shareContribution Contribution shareContribution
1995−2000 2000−2010
©20
13 A
sian
Prod
uctiv
ity O
rgan
izat
ion

6
99
6.2 Industry Growth
over the recent period is more a result of rapid growth in other sectors than any actual contraction of the sector.
Comparisons across the country groups in Table 15 reveal that Asia enjoyed more vibrant growth than the US in all sectors, it is notable that the US was more directly affected by the global financial crisis of 2008–2009 than Asia. Overall construction retrenched in the US in the 2000s, while growth has been strongest in South Asia and the GCC countries, at 8.7% and 9.2% a year on average respectively. Apart from construction, the other fast-growing sectors in GCC countries and South Asia were transport, storage, and communications (at over 10% a year on average), presumably reflecting their effort in building and upgrading infrastructure for their development needs. Finance, real estate, and business activities also enjoyed robust expansion at 9.0% and 7.4% a year on average in South Asia and GCC countries, respectively, compared with 2.0% in the US and 3.7% in Australia. For East Asia, manufactur-ing has been growing at 7.4% a year on average in Asia23 and 6.6% in GCC countries, compared with 1.0% in the US and 0.7% in Australia.
Figure 79 presents the sub-industry origins of average annual growth of manufacturing GDP for se-lected Asian countries for the periods 1995–2000 and 2000–2010.81 Manufacturing in Asia has been
Figure 78 Contribution of Wholesale and Retail to Economic Growth, 1995–2000 and 2000–2010
Sources: Official national accounts in each country, including author adjustments.
23
23
26
31
22
16
17
23
18
15
22
10
15
11
57
23
17
10
11
15
11
32
5
17
10
9
5
2
−2
−8
−14
−46
−20 0 20 40 60
MyanmarUAE
Sri LankaIranROC
VietnamIndiaUS
NepalLao PDR
PhilippinesChina
BangladeshCambodiaMongolia
Hong KongTurkey
SingaporeMalaysiaAustralia
KoreaFiji
QatarSaudi Arabia
PakistanOman
BahrainKuwait
IndonesiaBruneiJapan
Thailand
1.8
1.4
1.3
1.2
1.2
1.1
1.0
1.0
0.8
0.8
0.8
0.8
0.8
0.8
0.7
0.7
0.6
0.6
0.6
0.6
0.5
0.5
0.5
0.4
0.4
0.3
0.2
0.0
0.0
−0.1
−0.1
−0.2
−0.50.00.51.01.52.0
21
26
44
19
20
12
23
22
15
23
8
17
18
15
18
19
15
17
18
18
15
14
13
8
29
12
7
6
26
12
4
−9
−20 0 20 40 60
MyanmarLao PDR
Hong KongIndia
VietnamChina
SingaporeSri Lanka
CambodiaUAE
QatarBangladeshIndonesiaMongolia
PhilippinesMalaysia
IranPakistan
Saudi ArabiaROC
ThailandOmanTurkeyBahrain
FijiAustralia
KoreaKuwaitBrunei
USNepalJapan
2.4
2.0
1.7
1.4
1.3
1.2
1.2
1.1
1.1
1.0
1.0
1.0
0.9
0.9
0.8
0.8
0.8
0.8
0.7
0.7
0.6
0.6
0.5
0.5
0.4
0.4
0.3
0.3
0.2
0.2
0.1
−0.1
−0.50.00.51.01.52.02.53.0% % % %
Contribution shareContribution Contribution shareContribution
1995−2000 2000−2010
81: The Törnqvist quantity index is adopted for calculating the growth of real GDP of manufacturing. Using this index, the growth of real GDP of manufacturing into the products of contributions by sub-industries of manufacturing can be decomposed:
= ∑ i (1/2) (sjt + sj
t−1) In (Qjt / Qj
t−1)Real GDP growth of manufacturing Contribution of a sub-industry j
In (GDPt / GDPt−1) where Qj
t is real GDP of a sub-industry j in period t and sjt is the nom-
inal GDP share of a sub-industry j in period t.
©20
13 A
sian
Prod
uctiv
ity O
rgan
izat
ion

100
6 Industry Perspective
dominated by 3-8.machinery and equipment, accounting for 40% or more of overall manufacturing growth in half of the Asian coun-tries compared. In Korea and the ROC, it was over 80%. The sub-sector 3-1.food products, bever-ages, and tobacco products is the largest contributor in the Philip-pines for both periods, accounting for 55% of manufacturing output growth in both periods. In Bangla-desh and Cambodia, manufactur-ing growth has been dominated by the sub-sector of 3-2.textiles, wearing apparel, and leather products, whereas in Kuwait, and to a lesser extent in Singapore and Malaysia, it is 3-5.coke, petro-leum, chemicals, rubber, and plas-tic products.
Figure 80 contrasts industry con-tributions to economic growth for the periods of 1995–2000 and 2000–2010, as well as between the US and Asian averages.82 Even within such a short period, one can see that the industry struc-ture of growth is changing. The first striking feature is the domi-nance of manufacturing in Asian countries. Between 1995 and 2000, its contribution to economic growth in Asia23 was 32% com-pared with 18% in the US. Al-though its significance has fallen in recent years, it still accounted for 30% of economic growth in Asia23 between 2000 and 2010, compared with 10% in the US. This, however, masks a divergence
1. A
gricu
lture
2. M
inin
g
3. Ma
nufac
turin
g
4. Ele
ctrici
ty, ga
s, an
d wate
r sup
ply
5. Co
nstru
ctio
n
6. Wh
olesal
e and
ret
ail tr
ade,
hotel
s, an
d rest
auran
ts7.
Tran
spor
t, sto
rage
, and
co
mm
unica
tions
8. Fin
ance
, real
esta
te, an
d bu
sines
s acti
vities
9. Co
mm
unity
, so
cial, a
nd
perso
nal s
ervic
es
Bahrain −1.7 −1.5 8.2 13.9 9.5 6.3 9.8 8.0 8.3Bangladesh 3.4 7.9 7.2 6.8 7.2 6.5 7.3 4.4 5.5Brunei 2.2 −1.3 −0.2 3.1 4.7 5.0 4.1 4.5 3.9Cambodia 5.0 17.5 10.1 11.9 7.1 7.5 7.5 8.2 9.9China 4.1 10.7 10.7 10.7 11.9 12.1 8.7 11.4 10.5ROC 0.1 −4.2 6.9 2.8 −0.4 3.3 3.0 2.6 2.6Fiji −1.3 2.6 0.6 2.4 2.0 2.3 1.8 1.5 1.5Hong Kong −2.7 −6.9 −3.8 1.6 −2.2 6.2 4.1 4.5 1.6India 3.1 4.6 8.1 5.8 9.1 8.8 12.2 9.5 6.3Indonesia 3.4 1.1 4.4 7.7 6.7 5.8 12.1 6.5 5.2Iran 3.6 0.2 8.3 7.9 3.9 5.1 9.7 8.2 4.3Japan −1.1 −7.7 1.8 1.0 −2.7 −0.5 1.2 0.6 1.3Korea 1.3 −1.1 6.1 5.4 2.0 2.4 5.0 3.6 3.6Kuwait 7.8 1.4 5.3 14.0 4.7 3.3 12.9 5.1 6.3Lao PDR 2.8 42.9 8.5 4.2 6.8 10.2 8.7 8.4 10.3Malaysia 2.9 0.4 3.4 4.6 2.7 6.3 5.9 6.9 5.3Mongolia 0.7 5.3 7.8 3.6 5.2 8.6 13.6 6.4 3.7Myanmar 7.9 13.2 19.8 12.0 18.6 10.8 16.7 22.5 12.0Nepal 3.2 3.7 0.7 5.1 3.7 1.0 6.1 4.7 7.5Oman 2.6 −0.5 11.4 11.5 19.6 7.1 11.1 6.4 5.4Pakistan 2.6 5.5 7.0 0.4 4.1 4.4 3.5 5.7 6.2Philippines 2.8 10.7 3.7 4.4 4.7 5.2 6.7 6.2 4.4Qatar 6.0 9.8 10.6 6.6 21.5 16.5 22.9 16.2 10.2Saudi Arabia 1.2 0.8 7.7 11.2 6.0 10.2 12.0 7.2 3.3Singapore −0.2 0.0 5.5 4.0 2.5 6.4 3.9 5.4 5.0Sri Lanka 2.8 12.1 4.0 6.3 6.2 4.8 8.3 5.6 4.3Thailand 2.0 5.0 5.4 5.6 3.8 3.5 5.7 5.7 3.4UAE −2.4 −0.4 3.0 7.6 9.5 5.5 8.3 6.8 7.0Vietnam 3.5 1.7 9.9 12.2 9.3 7.5 8.8 5.4 6.3(regrouped)
APO20 2.8 1.6 4.8 3.7 3.1 4.1 5.5 4.4 3.0Asia23 3.4 5.5 7.4 6.7 6.0 6.2 6.5 5.8 4.9Asia29 3.4 4.0 7.3 6.8 6.1 6.3 6.7 5.9 4.9East Asia 3.6 10.3 7.7 7.0 5.3 5.8 5.1 4.8 4.7South Asia 3.1 4.9 7.8 5.0 8.7 8.0 10.3 9.0 6.2ASEAN 3.5 1.5 5.0 6.3 5.8 5.6 8.0 6.1 4.8GCC 0.7 1.4 6.6 10.2 9.2 8.0 11.1 7.4 4.7(regrouped)
US 3.1 0.1 1.1 0.1 −3.7 1.3 3.4 2.0 1.2Australia 1.9 2.4 0.7 1.5 6.6 2.8 3.7 3.7 3.0Turkey 1.2 1.6 4.1 4.7 3.7 3.1 5.5 6.3 2.3
Unit: Percentage.Sources: Official national accounts in each country, including author adjustments.
Table 15 Output Growth by Industry, 2000–2010___Average annual growth rate of industry GDP at constant prices
within Asia. In the earlier period, manufacturing accounted for 35% of growth in East Asia but only 13% in South Asia. The corresponding figures were 35% and 17% in the 2000s, so the differential is narrowing.
The country group most dominated by manufacturing in the late 1990s was ASEAN, with a contribu-tion of 40%. Yet, in recent years manufacturing’s contribution was reduced to 26%, while wholesale and retail trade, hotels, and restaurants increased from 10% to 18%. The latter also increased its weight in the APO20, from 12% to 16% between the two periods compared. In the US, the finance, real estate,
©20
13 A
sian
Prod
uctiv
ity O
rgan
izat
ion

6
101
6.2 Industry Growth
Asia23 were 1% and 6%. The reverse was true in the US, where the contribution of construction was 4% in the earlier period but fell to −12% in the later period in the 2000s. The contribution of wholesale and retail trade, hotels, and restaurants was also high in the US. In 1995–2000, it accounted for 23% of US economic growth compared with 11% in Asia23. Though in 2000–2010 its contribution was re-duced to 12% in the US, its significance to economic growth rose to 14% in Asia23.
Figure 81 presents industry contributions to regional economic growth in Asia29 during 2000–2010, decomposing Figure 7 (p. 19) in Section 3.1 into countries’ industry origins.83 In each industry contri-bution, the top eight countries are presented. The top four industries in terms of contributions to re-gional growth were manufacturing (29%), wholesale and retail trade (15%), finance, real estate, and business activities (13%), and community, social, and personal services (14%). A total of 29% of Asian economic growth originated from the expansion of its manufacturing sector, two-thirds of which was
and business activities sub-sector made the biggest contribution in both periods, accounting for 33% of economic growth in 1995–2000 and rising to 45% in 2000–2010. In contrast, its contribution in Asia was 14% in the period 2000–2010. Mining in GCC countries took a hit in 2008–2009 due to the down-turn in the world economy. Con-sequently, the contribution of mining fell from 14% to 11% be-tween the two periods while con-struction’s share increased from 5% to 11%. Finance, real estate, and business activities became the biggest contributors of eco-nomic growth in GCC countries, with its share rising from 16% to 20% between the two periods.
Construction was hit hard in the ASEAN countries during the Asian financial crisis, dragging down economic growth by 8% in the latter half of the 1990s. It bounced back subsequently and contrib-uted 6% to growth in the 2000s. The corresponding figures for
Figure 79 Industry Origins of Output Growth in Manufac-turing, 1995–2000 and 2000–2010___Sub-industry decomposition: Average annual growth rate of GDP at constant prices of manufacturing
Sources: Official national accounts in each country, including author adjustments.
Cambodia
Malaysia
KoreaIranRO
CBangladeshIndiaPhilippines
ThailandJapanIndonesia
Cambodia
IranIndiaBangladeshRO
CKoreaSingaporeThailandIndonesiaM
alaysiaPhilippinesKuw
aitJapan
% %
0
4
8
15.7
1.3
1.2
5.9
1.81.9
1.3
1.2
4.0
3.5 1.01.3 1.8
1.6 2.3 1.51.5
1.81.2
2.64.9
0.81.6
12
16
201995–2000 2000–2010
3-1. Food products, beverages, and tobacco products
3-3. Wood and wood products
3-5. Coke, petroluem, chemicals, rubber, and plastic products
3-7. Basic metals
3-9. Other manufacturing
3-2. Textiles, wearing apparel, and leather products
3-4. Paper, paper products, printing, and publishing
3-6. Other non-metallic mineral products
3-8. Machinery and equipment
3. Manufacturing
US
−2.20
2
4
6
8
10
8.5
0.5
0.8
2.0
0.7
0.8
3.53.0
0.70.5
1.8
0.9
0.6
1.4 1.00.70.4
2.7 0.8
0.80.9
0.5
1.41.9
1.6
0.5 1.81.2
0.3
1.3
0.5
2.23.03.2
4.85.6
3.3
0.7
0.40.40.4
−0.3
82: Asian averages are calculated using the Törnqvist index to aggregate the growth rates of industry GDP of each country based on the two-period average of each country’s shares of industry GDP to the gross regional products as weights.
83: The average growth rate of the Asian economy for 2000–2009 is set at 100%. Asian economic growth is calculated as the sum of the contributions over countries and industries:∑ x (1/2) (sx
t + sxt−1) ∑ i (1/2) (sx, j
t + sx, jt−1) In (Qx, j
t / Qx, jt−1)
Contribution of an industry j in a country x where Qx, j
t is real GDP of an industry j in a country x in period t, sx, jt is GDP share of
an industry j in a country x with respect to GDP of a country i in period t and sxt is GDP share of a country x with respect to the re-
gional GDP in period t. All the industries whose contribution is more than 0.25% are shown in Figure 81.
©20
13 A
sian
Prod
uctiv
ity O
rgan
izat
ion

102
6 Industry Perspective
accounted for by China. In other words, China’s manufacturing sector alone accounted for nearly 18% of the region’s economic growth. This was followed by China’s community, social, and personal services (7.4%) and wholesale and retail trade, hotels, and restaurants (6.9%).
Over a period of four decades there has been a noticeable shift in the industry origins of eco-nomic growth (Figure 82). For the ROC and Ko-rea, manufacturing has been a clear driving force behind economic growth on the whole. In the decade between the mid-1980s and the mid-1990s, however, the importance of manu-facturing retreated in the ROC temporarily while the economy developed its service sec-tor. Since the mid-1990s, the role of manufac-turing in the ROC has increased again, although compared to its heydays of the 1970s and 1980s its impact in terms of percentage points is much reduced. In Singapore, finance, real es-tate, and business activities, as well as whole-sale and retail trade, hotels, and restaurants are important drivers alongside the manufacturing sector. Working within the data constraints, Hong Kong appears a clear service-driven economy in recent years. While the lack of di-versification of the oil-exporting countries can-not be missed; historically, the dominance of the mining sector influenced the economic volatility of these countries, yet, in recent years the GCC countries have been making efforts in diversifying, especially into the service sector, with different degrees of success – Bahrain and
Figure 80 Industry Origins of Regional Eco-nomic Growth, 1995–2000 and 2000–2010___Contribution share
Sources: Official national accounts in each country, including au-thor adjustments.
1995―2000 2000―2010
−20
0
20
40
60
80
100
120%
Asia23
APO20
Asia29
East Asia
South Asia
ASEAN
GCC
US
APO20
Asia23
Asia29
East Asia
South Asia
ASEAN
GCC
US
9. Community, social, andpersonal services
8. Finance, real estate, andbusiness activities
7. Transport, storage, andcommunications
6. Wholesale and retail trade, hotels, and restaurants
5. Construction4. Electricity, gas, and
watersupply3. Manufacturing
2. Minig1. Agriculture
7 7 7 5
16 13
4 2 6 6 5 4 9 9
0 2
0 2 2 3
1 5
14
−1
1 4 4 5 2 2
11 1
25 32 31 35 13
40
20
18
25 30 29
35
17
26
13
10
4
4 4 4
3
5
2
0
2
3 3
4
1
3
3
0
−2
1 1 0
6
−8
5
4
5
6 6
5
9
6
11
−12
12
11 11 8
17
10
16
23
16
14 14 12
19
18
16
12
14
12 12 12 10
14
9
8
12
9 10 8
13
12
12
19
14 12 12 11 15
5
16
33 18
13 14 11 18 14
20
45
25 20 20 21 19
16
14 12 15 15 14 16
12 11 13
23
Oman are leading the way and have yielded results. The largely agricultural countries are Myanmar, the Lao PDR, Cambodia, Nepal, and Pakistan, and, to a lesser extent, Vietnam and Bangladesh. In the Philippines, construction was driving economic growth in the first half of the period, but it never re-covered its dominance after its crash in the mid-1980s. In the second half, economic growth was bet-ter balanced, with the development of finance, real estate, and business activities in particular.
©20
13 A
sian
Prod
uctiv
ity O
rgan
izat
ion

6
103
6.2 Industry Growth
0 5 10 15 20 25 30 35
China India Korea ROC Rest of the Asia
3. Manufacturing
%
Japan
18.0 2.8 1.5 1.2 1.0 4.6
0 2 4 6 8 10 12
China India Iran Rest of the Asia
9. Community, social, and personal services
Japan Korea
%14
7.4 1.9 1.4 0.6 0.4 2.6
0 2 4 6 8 10 12
China India Indonesia Iran Rest of the Asia
6. Wholesale and retail trade, hotels, and restaurants
Hong Kong
%14
6.9 3.2 0.6 0.5 0.4 2.9
0 2 4 6 8 10 12
China India Japan Rest of the Asia
8. Finance, real estate, and business activities
Iran Korea
%14
5.4 3.2 0.8 0.7 0.4 3.2
China India JapanIndonesia Iran Rest of the Asia
7. Transport, storage, and communications
0 2 4 6 8 10 12 %
3.7 2.2 0.6 0.5 0.4 2.2
%0 1 2 3 4 5 6
China India Indonesia UAE Korea Rest of the Asia
5. Construction
3.7 1.5 0.3 0.2 0.2 0.3
%0 1 2 3 4 5 6
China India Indonesia Iran Pakistan Rest of the Asia
1. Agriculture
2.5 1.3 0.3 0.2 0.2 0.7
%0 1 2 3 4 5
China Qatar India Saudi Arabia Kuwait Rest of the Asia
2. Mining
3.1 0.4 0.3 0.2 0.1 0.3
%0 0.5 1 1.5 2 2.5 3 3.5
China India Iran Korea Rest of the Asia
4. Electricity, gas, and water supply
2.0 0.3 0.1 0.1 0.1 0.5
Japan
Figure 81 Industry Origins of Asian Economic Growth, 2000–2010___Contribution to regional growth of GDP at constant prices, using 2005 PPP
Sources: Official national accounts in each country, including author adjustments.
©20
13 A
sian
Prod
uctiv
ity O
rgan
izat
ion

104
6 Industry Perspective
1971 1976 1981 1986 1991 1996 2001 2006 1971 1976 1981 1986 1991 1996 2001 2006 1971 1976 1981 1986 1991 1996 2001 2006
1971 1976 1981 1986 1991 1996 2001 2006 1971 1976 1981 1986 1991 1996 2001 2006 1971 1976 1981 1986 1991 1996 2001 2006
1971 1976 1981 1986 1991 1996 2001 2006 1971 1976 1981 1986 1991 1996 2001 2006 1971 1976 1981 1986 1991 1996 2001 2006
1971 1976 1981 1986 1991 1996 2001 2006 1971 1976 1981 1986 1991 1996 2001 2006 1971 1976 1981 1986 1991 1996 2001 2006
1971 1976 1981 1986 1991 1996 2001 2006 1971 1976 1981 1986 1991 1996 2001 2006 1971 1976 1981 1986 1991 1996 2001 2006
1971 1976 1981 1986 1991 1996 2001 2006 1971 1976 1981 1986 1991 1996 2001 2006 1971 1976 1981 1986 1991 1996 2001 2006
Bahrain Bangladesh Brunei
Cambodia China ROC
Hong Kong India Indonesia
Iran Japan Korea
Lao PDR Malaysia
Mongollia
Kuwait
Myanmar Nepal
−6
−3
0
3
6
9
12
−3
0
3
6
9
12
15
−6
−3
0
3
6
9
−8
−6
−4
−2
2
0
4
6
10
8
−5
0
5
10
15
−15
−10
−5
0
5
10
15
−30
−20
−10
0
10
20
−15
−10
−5
0
5
10
−6
−3
0
3
6
9
12
15
−8
−4
0
4
8
12
−4
−2
0
2
4
6
8
−20
−10
0
10
20
30
40
50
−3
0
3
6
9
12
−8
−4
0
4
8
12
16
−30
−20
−10
0
10
20
−12
−9
−6
−3
0
3
6
9
−60
−40
−20
0
20
40
60
1. Agriculture 2. Mining 3. Manufacturing5. Construction 6. Wholesale and retail trade, hotels, and restaurants 7. Transport, storage, and communications9. Community, social, and personal services Real GDP
4. Electricity, gas, and water supply8. Finance
% %%
%
−3
0
3
6
9
12
15%%
% %%
% %%
% %%
% %%
©20
13 A
sian
Prod
uctiv
ity O
rgan
izat
ion

6
105
6.2 Industry Growth
Figure 82 Industry Origins of Economic Growth, 1970–2010___Industry decomposition: Average annual growth rate of GDP at constant prices
Sources: Official national accounts in each country, including author adjustments.
1971 1976 1981 1986 1991 1996 2001 2006 1971 1976 1981 1986 1991 1996 2001 2006 1971 1976 1981 1986 1991 1996 2001 2006
1971 1976 1981 1986 1991 1996 2001 2006 1971 1976 1981 1986 1991 1996 2001 2006 1971 1976 1981 1986 1991 1996 2001 2006
1971 1976 1981 1986 1991 1996 2001 2006 1971 1976 1981 1986 1991 1996 2001 2006 1971 1976 1981 1986 1991 1996 2001 2006
1971 1976 1981 1986 1991 1996 2001 2006 1971 1976 1981 1986 1991 1996 2001 2006 1971 1976 1981 1986 1991 1996 2001 2006
1971 1976 1981 1986 1991 1996 2001 2006
1. Agriculture 2. Mining 3. Manufacturing5. Construction 6. Wholesale and retail trade, hotels, and restaurants 7. Transport, storage, and communications9. Community, social, and personal services Real GDP
4. Electricity, gas, and water supply8. Finance
Oman Pakistan Philippines
Qatar Saudi Arabia Singapore
Sri Lanka Thailand UAE
Vietnam
−4
−2
0
2
4
6
8
10
−25
−20
−15
−10
−5
0
5
10
15
20
−12
−8
−4
0
4
8
12
16
−3
−2
−1
0
1
2
3
4
5
6
7US
−9
−6
−3
0
3
6
9
−5
0
10
5
15
−20
0
20
40
60
80
100
−3
−2
−1
0
1
2
3
4
5
6
7Australia
−20
−10
0
10
20
30
−15
0
15
30
45
−3
0
3
6
9
−3
0
3
6
9
−8
−6
−4
−2
0
2
4
6
8
10Turkey
% %%
% %%
% %%
% %%
%
©20
13 A
sian
Prod
uctiv
ity O
rgan
izat
ion

106
6 Industry Perspective
6.3 Labor Productivity by Industry
Section 5.1 discusses per-worker measures of labor productivity performance in level terms, and identifies a large gap between Asia as a whole and the US. In 2011, Hong Kong and Singapore were the countries that had labor productivity levels comparable to that of the US. Besides these two, the best performers in Asia achieved productivity levels that were at least 40% that of the US; yet, Asia collectively was dragged down by a long tail of countries with labor productivity of less than 20% of the US level, pulling down the average performance to 17% that of the US for the APO20 and 15% for Asia23. In growth terms, however, Asia’s performance far exceeded that of the US, allowing the countries to close the gap with the US gradu-ally over time. Labor productivity growth in Asia23 was 5.5% per an-num on average between 2005 and 2011, compared to 1.3% in the US (Table 9, p. 61).
Table 16 presents cross-country comparisons in labor productivity growth by industry84 for the peri-od 2000–2010.85 Positive labor productivity growth was achieved across all sectors for Asia23. If one focuses on the regional economy,
84: Labor productivity in Table 16 is defined simply as per-worker GDP at constant prices by industry (vj). The industry decomposition of labor productivity growth for the whole economy (v) in Figure 83 is based on the equation v = ∑ jwjvj* where the weight is the two-period average of value-added shares. In this decomposition, the number of workers as a denominator of labor productivity (vj*) is adjusted, weighting the reciprocal of the ratio of real per-worker GDP by industry to its industry average. Thus, the industry contribution (wjvj*) is emphasized more in industries in which the per-worker GDP is higher than the industry average, in compari-son with the impact (wjvj) of using the non-adjusted measure of labor productivity.
85: The data presented in this chapter is subject to bigger uncertainty than those in previous chapters and the quality across coun-tries is also more varied. Employment data of the less developed countries often lacks frequency as well as industry details. Neither does the industry classification of employment data necessarily correspond to those of industry output data. Consequently, the quality of labor productivity estimates at the industry level is compromised. Furthermore, estimates of the manufacturing sector should be of better quality than those of the service sector as many countries have occasional manufacturing censuses, but do not have a similar census covering the service sector.
Unit: Percentage.Source: APO Productivity Database 2013.01.
Table 16 Labor Productivity Growth by Industry, 2000–2010___Average annual growth rate of industry labor productivity
1. A
gricu
lture
2. M
inin
g
3. Ma
nufac
turin
g
4. Ele
ctrici
ty, ga
s, an
d wate
r sup
ply
5. Co
nstru
ctio
n
6. Wh
olesal
e and
ret
ail tr
ade,
hotel
s, an
d rest
auran
ts7.
Tran
spor
t, sto
rage
, and
co
mm
unica
tions
8. Fin
ance
, real
esta
te, an
d bu
sines
s acti
vities
9. Co
mm
unity
, so
cial, a
nd
perso
nal s
ervic
es
Bahrain −7.0 3.3 2.2 21.5 −8.7 −2.6 −5.0 6.6 0.3Bangladesh 0.8 7.4 1.3 7.8 −1.2 3.3 2.1 −6.0 5.0Brunei −0.5 −3.7 −4.1 0.1 2.0 2.0 1.4 1.3 0.7Cambodia 3.8 12.1 2.5 −4.7 −6.1 −0.5 0.9 0.2 0.8China 6.7 9.0 8.0 8.1 7.6 8.3 7.1 8.9 8.0ROC 3.0 5.9 6.1 3.1 0.0 2.1 2.8 −0.2 0.2Fiji 0.3 6.4 1.7 2.0 −9.5 −0.3 2.5 −3.8 1.6Hong Kong −1.8 0.0 5.3 3.0 −1.1 5.0 2.3 1.0 0.1India 2.5 1.5 3.4 3.1 6.4 6.1 9.5 6.8 3.6Indonesia 3.1 −3.0 2.5 4.0 1.9 3.7 9.9 −0.4 0.0Iran 1.8 1.2 6.0 6.0 −1.1 0.9 3.9 1.0 4.3Japan 0.9 −1.1 3.7 1.0 −0.5 −0.6 0.8 0.7 0.3Korea 4.9 −3.3 6.8 3.4 1.0 2.9 0.7 −0.6 −0.5Kuwait 0.4 1.7 −0.4 7.4 −0.8 −2.8 6.6 −4.8 −1.3Lao PDR 0.0 0.0 0.0 0.0 0.0 0.0 0.0 0.0 0.0Malaysia 2.7 −7.2 4.2 −4.4 −0.9 1.8 0.6 −0.8 3.2Mongolia 1.9 −0.8 6.0 7.2 −2.2 2.7 3.7 5.2 −0.6Myanmar 0.0 0.0 0.0 0.0 0.0 0.0 0.0 0.0 0.0Nepal 0.0 −6.4 0.0 0.4 1.5 −0.9 2.5 −1.0 10.3Oman 1.6 −1.8 4.8 2.2 0.4 3.4 4.0 2.0 2.1Pakistan 0.1 −1.0 2.3 −4.1 −0.7 −0.8 −0.2 −3.5 5.3Philippines 1.2 4.5 2.8 1.0 1.6 −0.7 3.8 −2.7 3.4Qatar −2.3 −9.4 0.4 6.2 0.1 4.3 3.2 2.3 1.4Saudi Arabia 1.2 1.3 5.2 9.4 −1.0 5.5 7.3 −0.5 0.2Singapore −6.9 0.0 3.9 1.2 0.1 2.4 0.5 −0.4 −0.1Sri Lanka 2.8 11.2 2.4 13.6 4.7 1.7 4.5 −0.8 3.3Thailand 1.5 5.9 4.0 6.1 −0.7 0.0 4.3 1.6 −0.2UAE −0.1 −5.7 1.2 2.4 7.6 −1.6 −0.9 −8.4 −1.8Vietnam 3.7 1.1 3.7 1.4 −1.5 3.0 5.3 −8.3 −1.4(regrouped)
APO20 2.0 −1.4 1.4 1.1 −0.1 1.4 2.7 0.8 0.6Asia23 4.1 3.3 4.3 4.1 2.1 3.1 4.2 2.5 2.5Asia29 4.0 1.8 4.2 4.2 2.2 3.1 4.3 2.4 2.4East Asia 6.2 8.6 5.5 4.7 1.8 2.9 3.6 2.5 2.4South Asia 2.1 1.9 3.0 2.2 4.9 4.9 7.0 5.9 4.2ASEAN 3.1 −2.2 2.7 1.1 0.4 2.1 5.3 −1.2 0.5
GCC 0.6 −2.8 3.0 7.6 0.1 2.4 3.7 −2.2 −0.1(reference)
US 4.1 −2.2 5.1 0.9 −2.3 1.9 4.9 2.0 0.0Australia 3.9 −6.6 1.4 −4.4 2.3 1.1 2.4 1.4 −0.2Turkey 4.6 −0.8 2.9 2.0 3.5 1.0 4.2 −0.6 −0.3
©20
13 A
sian
Prod
uctiv
ity O
rgan
izat
ion

6
107
6.3 Labor Productivity by Industry
86: Not all Asian countries are included, as employment by industry sector is not available for some countries.
the findings highlight the fact that service industries no longer hamper an economy’s productivity performance but are as capable as manufacturing in achieving productivity growth. In fact, there are no significant differences between manufacturing and some services in Asia23; i.e., manufacturing (at 4.3% on average a year), transport, storage, and communications (4.2%), agriculture and electricity (4.1%). Construction was the sector with the slowest productivity growth at 2.1%. Within Asia, the di-vergence between South Asia and East Asia is stark. While South Asia had a much higher labor pro-ductivity in services and construction, and less so in utilities, East Asia led by quite a distance in the other three sectors of agriculture, mining, and manufacturing. When excluding China, the labor pro-ductivity growth in manufacturing remains much higher than that of the highest service sector in Japan, Korea, and the ROC.
Figure 83 shows the industry origins of average labor productivity growth per annum in four periods: 1985–1990, 1990–1995, 1995–2000, and 2000–2010.86 In the past two and a half decades, the role played by agriculture (both positive and negative) has been diminishing in Asian countries. While the importance of manufacturing has never waned in some countries (e.g., Korea, the ROC, China, and
2. Mining
5. Construction
8. Finance, real estate, and business activities
1. Agriculture
4. Electricity, gas, and water supply
7. Transport, storage, and communications
Real GDP
%
%
KoreaRO
CThailandM
alaysiaSingaporeN
epalJapanPakistan
Philippines
ChinaU
S
BangladeshAustraliaM
ongoliaIranM
yanmar
−6
−3
0
3
6
9
12
ChinaThailandM
alaysiaIndonesiaVietnamRO
CKoreaSingapore
IranPakistanCam
bodiaM
yanmar
IndiaBangladeshAustraliaN
epalU
S
JapanFijiPhilippinesM
ongolia
−4
−2
0
2
4
6
8
10
ChinaVietnamRO
CSingaporeKoreaBangladeshIndiaCam
bodia
Myanm
arU
SPhilippinesAustralia
Malaysia
Nepal
Japan
FijiPakistan
IranThailandM
ongoliaIndonesia
1985–1990 1990–1995
1995–2000 2000–2010
3. Manufacturing
9. Community, social, and personal services
6. Wholesale and retail trade, hotels, and restaurants
Sri Lanka
IndonesiaFijiIndia
Turkey
Sri Lanka
Turkey
Turkey
Sri Lanka
Hong Kong
ChinaIndiaVietnamCam
bodiaSri LankaTurkeyM
ongoliaIndonesiaH
ong KongKoreaRO
CThailandBangladeshIranPhilippinesM
alaysiaU
SSingaporePakistanN
epalJapanFijiAustralia
Figure 83 Industry Origins of Labor Productivity Growth, 1985–1990, 1990–1995, 1995–2000, and 2000–2010___Industry decomposition: Average annual growth rate of GDP at constant prices
Source: APO Productivity Database 2013.01.
©20
13 A
sian
Prod
uctiv
ity O
rgan
izat
ion

108
6 Industry Perspective
Figure 84 Contribution of Manufacturing to Labor Productivity Growth, 1995–2000 and 2000–2010
Source: APO Productivity Database 2013.01.
20 40 60 80%
47
68
41
47
28
78
87
283
22
21
32
45
28
17
−28
24
12
50
3
−4
−6
−11
−29
−276
−30 0 30 60
ChinaKorea
Vietnam
ROCHong Kong
USJapan
ThailandTurkey
IranFiji
IndiaNepal
3.4
2.8
1.7
1.5
1.3
1.3
1.0
0.9
0.8
0.7
0.6
0.6
0.5
0.5
0.4
0.4
0.2
0.2
0.0
0.0
−0.2
−0.4
−0.4
−0.5
−1.00.01.02.03.04.0
SingaporeCambodia
Malaysia
Bangladesh
Philippines
IndonesiaSri LankaAustralia
PakistanMyanmar
Mongolia
35
19
−2
ChinaKoreaROC
ThailandVietnamMalaysia
CambodiaSingaporeIndonesia
PhilippinesIran
JapanPakistan
BangladeshTurkey
USMongolia
Hong Kong
IndiaFiji
AustraliaNepal
1.8
3.0
1.7
1.4
1.3
1.2
1.2
1.0
1.0
0.8
0.7
0.7
0.6
0.6
0.5
0.5
0.5
0.5
0.5
0.3
0.3
0.2
0.0
0.01.02.03.0
Sri Lanka
% %%
Contribution share toaggrergate labor productivity
contributionContribution Contribution share toaggrergate labor productivity
contributionContribution
1995−2000 2000−2010
32
61
60
55
32
68
30
70
31
40
30
73
46
23
15
34
16
15
12
6
0
Figure 85 Contribution of Service Sector to Labor Productivity Growth, 1995–2000 and 2000–2010
Source: APO Productivity Database 2013.01.
90
59
36
57
59
67
67
90
70
91
647
104
130
22
36
20
24
27
16
18
23
1
64
0 30 60 90
SingaporeBangladeshCambodia
Sri LankaAustralia
MongoliaVietnamPakistan
Myanmar
PhilippinesMalaysia
Hong Kong
Indonesia
3.1
2.6
2.6
2.4
2.3
2.2
1.5
1.5
1.4
1.3
1.1
1.1
1.0
0.9
0.8
0.8
0.6
0.4
0.3
0.3
0.2
0.0
−0.9
−1.0
−471
−2.0−1.00.01.02.03.04.0
IndiaROC
China
US
Nepal
KoreaTurkey
IranJapan
Fiji
74
38
82
60
83
191
102
77
44
38
44
41
30
56
68
39
31
80
21
39
29
49
10
0 20 40 60 80 100
Hong KongSri Lanka
Bangladesh
CambodiaIndonesiaMongoliaPakistanVietnam
Philippines
Thailand
SingaporeMalaysiaAustralia
4.1
3.6
2.5
2.2
2.0
2.0
1.8
1.6
1.5
1.4
1.3
1.3
1.2
1.1
1.1
1.0
0.9
0.7
0.6
0.6
0.5
0.4
0.1
0.01.02.03.04.05.0
IndiaChina
Nepal
IranTurkey
US
ROCFiji
Korea
JapanThailand
% % %%
Contribution share toaggrergate labor productivity
contributionContribution Contribution share toaggrergate labor productivity
contributionContribution
1995−2000 2000−2010
©20
13 A
sian
Prod
uctiv
ity O
rgan
izat
ion

6
109
6.3 Labor Productivity by Industry
37
49
23
19
31
15
9
10
29
77
127
11
9
17
69
3
1
−2
−1
−7
−32
−11
−26
−570
−30 0 30 60
India
USROC
ChinaIran
FijiMongoliaAustralia
PakistanNepalKoreaJapan
Vietnam
TurkeyMalaysia
Thailand
1.0
0.8
0.8
0.7
0.7
0.6
0.6
0.4
0.3
0.2
0.2
0.2
0.2
0.2
0.0
0.0
0.0
0.0
−0.3
−0.3
−0.3
−0.4
−1.0
−1.1
−1.2−0.8−0.40.4 00.81.2
MyanmarSri Lanka
Bangladesh
Cambodia
Philippines
SingaporeHong Kong
Indonesia
43
22
10
17
18
15
19
13
14
25
17
5
2
2
0
−1
−1
−4
−10
−4
−15
−11
−17
−20 0 20 40
IndiaChina
KoreaROC
USIran
Turkey
NepalJapan
Fiji
1.3
1.2
0.9
0.7
0.7
0.5
0.5
0.4
0.4
0.4
0.3
0.1
0.1
0.1
0.0
0.0
0.0
0.0
−0.1
−0.1
−0.1
−0.2
−0.3
−0.50.00.51.01.52.0
Hong Kong
VietnamSri LankaIndonesia
Bangladesh
Singapore
CambodiaPakistanAustraliaMongolia
Thailand
MalaysiaPhilippines
% % %%
Contribution share toaggrergate labor productivity
contributionContribution Contribution share toaggrergate labor productivity
contributionContribution
1995−2000 2000−2010
Figure 86 Contribution of Wholesale and Retail Sector to Labor Productivity Growth, 1995–2000 and 2000–2010
Source: APO Productivity Database 2013.01.
Thailand), it has not been a major contributor in India in its recent development process, or in Hong Kong and Sri Lanka in the 2000s.
The manufacturing sector has been a major driving force behind productivity growth in most Asian countries, as shown in Figure 84. In the late 1990s, manufacturing accounted for a significant part of labor productivity growth in Korea (68%), Malaysia (78%), and China (47%). Nevertheless, its role has lessened in the 2000s to 61%, 68%, and 32%, respectively. In contrast, contributions from manufactur-ing strengthened from 22% to 60% in the ROC and from 45% to 73% in Japan between the two periods. In other economies, however, like India, Hong Kong, Sri Lanka, and Nepal in the 2000s, manu-facturing played a negligible role.
Traditionally, it has been difficult for the service sector to realize productivity growth, but modern ad-vancements in information and communication technology have changed all this. A lot of IT-intensive users are located in this sector, which is capable of capturing the productivity benefits arising from IT utilization. The growing importance of these services has been observed in explaining the productiv-ity growth in Western economies of recent decades. In Asia, the contribution from services matches that of manufacturing. Among the four industries in the service sector, three are potentially IT- employing industries: wholesale and retail trade, hotels, and restaurants; transport, storage, and com-munications; and finance, real estate, and business activities. Figure 85 presents the contribution of services in labor productivity growth by country. In the 2000s, services were contributing at least one-third or more to labor productivity growth in most Asian countries. The contribution was predominant in Hong Kong and India, accounting for 82% and 74% of labor productivity growth, respectively. It also accounted for around two-thirds or more of labor productivity growth in the US, Sri Lanka, and Singapore. Korea had the lowest share from the service sector, accounting for less than one-fifth of labor productivity growth. There is a slight expansion of the role played by services in China between these two periods, from 36% to 38%. The contribution of services was also highly significant in South
©20
13 A
sian
Prod
uctiv
ity O
rgan
izat
ion

110
6 Industry Perspective
Asian countries like Bangladesh, India, Nepal, and Pakistan over the same term. Finance, real estate, and business activities made the largest contribution of 1.3 percentage points in India and 1.0 per-centage point in Singapore, respectively, while transport, storage, and communications made the largest contribution of 1.1 percentage points in Mongolia. It was particularly prominent that in India all four industries significantly contributed to the improvement of economy-wide labor productivity for the period 2000–2010, while the contribution of manufacturing was negative for the period 1995–2000 and 6% in 2000–2010.
©20
13 A
sian
Prod
uctiv
ity O
rgan
izat
ion

7
111
The standard GDP concept does not adequately measure welfare, as discussed in Section 3. Among its shortcomings is the neglect of the terms-of-trade effect. An improvement in the terms of trade (i.e., the relative prices of a country’s exports to imports) unambiguously raises real income and in turn welfare.87 In many ways, a favorable change in the terms of trade is synonymous with technological progress as it makes it possible to get more for less; that is, for a given trade balance position, a coun-try can either import more for what it exports, or export less for what it imports.
7.1 Real Income and Terms of Trade
By focusing on production per se, the real GDP concept does not capture this beneficial effect of the improvement in the terms of trade.88 In contrast, real income focuses on an economy’s consumption possibilities, and in turn captures the impact of a change in the relative price of exports to imports. Real income growth attributed to changes in the terms of trade can be significant when there are large fluctuations in import and export prices and the economy under concern is highly exposed to international trade, as many Asian economies are (see Figure 26, p. 42). For example, real income growth for oil-exporting countries was more than double that of real GDP growth in recent years (as in Saudi Arabia and Brunei), while there has been no significant difference between real income growth and real GDP growth in Myanmar, which is a relatively closed economy (Figure 93, p. 118). In the recent decade, the trading gain has also driven a significant wedge between real income and real GDP in Australia. That is partly due to a fall in import prices, but owes more to the rising prices of its commodity exports.
The distinction between real income and real GDP lies in the differences between the corresponding deflators. Real GDP is calculated from a GDP deflator aggregating prices of household consumption, government consumption, investment, exports, and imports,89 while real income is calculated from the prices of domestic expenditure, consisting of household consumption, government consump-tion, and investment. Therefore, real income can be understood as how much domestic expenditure can be purchased with the current income flow.90 As such, real income captures the purchasing power of the income flow. Furthermore, the Databook adopts the concept of gross national income (GNI) instead of GDP in its estimation of real income, to take into account net income transfer from abroad. Applying the method proposed by Diewert and Morrison (1986), the annual growth rate of real in-come can be fully attributed to three components: annual growth rate of real GDP, real income growth attributed to changes in prices of exports and imports (referred to as the trading gain),91 and the effect of net income transfer.92
7 Real Income
87: See Diewert and Morrison (1986) and Kohli (2004).88: Kohli (2004) elaborates: “if real GDP is measured by a Laspeyres quantity index, as it is still the case in most countries, an improve-
ment in the terms of trade will actually lead to a fall in real GDP.”89: The weight for import price changes is negative. Thus, if import prices decrease, this tends to raise the GDP deflator.90: This definition of real income is the same as in Kohli (2004, 2006). An alternative definition is nominal GDP deflated by the price of
household consumption; this is adopted by Diewert, Mizobuchi, and Nomura (2005) and Diewert and Lawrence (2006).91: The term “trading gain” is used by some authors (Kohli, 2006). This term is adopted in this report.92: Real income growth can be decomposed into two components as follows:
In ( GNIt
GNIt−1) − In ( PDt
PDt−1) = In ( GNIt/GDPt
GNIt−1/GDPt−1) + In (GDPt / GDPt−1) − (1/2) ∑ i (sit + si
t−1) In (Pit / Pi
t−1) +
(1/2) (sXt + sX
t−1) ( In ( PXt / PX
t−1 ) − In ( PDt / PD
t−1 )) − (1/2) (sMt + sM
t−1) ( In ( PMt / PM
t−1 ) − In ( PDt / PD
t−1 )) Real income growth Income transfer effect Real GDP growth
Real income growth attributed to changes in the terms of trade (=trading gain)
where Pit is price of final demand i in period t and si
t is expenditure share of final demand i in period t . D is domestic expenditure, X is export, and M is import. Note that the real GDP growth based on this formulation may differ from that used in other chapters, since the implicit Törnqvist quantity index is adopted for calculating it.
©20
13 A
sian
Prod
uctiv
ity O
rgan
izat
ion

112
7 Real Income
93: Short-term trends in export and import prices cannot continue indefinitely. Negative and positive trading gain effects in shorter periods cancel each other out. In the end, the accumulated effect over a long period of time often becomes negligible.
A general observation is that over a long period of time the trading gain effect is, on average, small, but over a shorter period it could be very significant.93 The findings presented in Table 17 confirm this observation. Excluding the oil-exporting countries, the trading gain effect in 17 out of 22 the econo-mies compared, fell within the margin of ±10% of real GDP growth on average for the long period of 1970–2011. Movements in terms of trade have been consistently unfavorable to Japan and the ROC. In the short terms, the spread of the trading gain effect is wider across countries. Australia has been benefiting from the continual surge in commodity prices in the past decade or so and, as such, its
Table 17 Real Income and Terms of Trade, 1970–2011, 1995–2000, 2000–2005, and 2005–2011___Average annual growth rate of real income, real GDP, trading gain, and net primary income transfer from abroad
Unit: Percentage.Sources: Official national accounts in each country, including author adjustments.Note: See footnote 92 for the definition of real GDP growth, real income growth, and trading gain growth. The starting years for some coun-tries are different due to data availability during 1970–2011: Brunei (1989–), Cambodia (1993–), Mongolia (2000–), and Nepal (2000–).
1970–2011 1995–2000 2000–2005 2005–2011
Real
inco
me
Real
GDP
Trad
ing g
ain
Net p
rimar
y inc
ome
from
abro
ad
Real
inco
me
Real
GDP
Trad
ing g
ain
Net p
rimar
y inc
ome
from
abro
ad
Real
inco
me
Real
GDP
Trad
ing g
ain
Net p
rimar
y inc
ome
from
abro
ad
Real
inco
me
Real
GDP
Trad
ing g
ain
Net p
rimar
y inc
ome
from
abro
ad
China 8.58 8.61 −0.03 −0.01 China 6.96 7.74 −0.85 0.08 Myanmar 11.84 11.83 0.00 0.00 China 11.05 11.35 −0.38 0.09Vietnam 7.24 6.73 0.10 −0.14 Vietnam 6.84 6.90 0.21 −0.27 China 10.95 10.24 0.61 0.10 Myanmar 10.10 10.10 0.01 0.00Singapore 7.19 7.30 −0.06 −0.04 Singapore 6.43 6.46 0.23 −0.27 Cambodia 10.11 10.37 0.00 −0.26 Mongolia 8.80 9.13 1.01 −1.35Malaysia 6.86 6.40 0.49 −0.03 Philippines 5.52 2.69 1.15 1.69 Mongolia 9.90 7.13 3.08 −0.32 India 8.52 8.35 0.20 −0.03Korea 6.58 7.09 −0.49 −0.03 India 5.42 5.59 −0.18 0.01 Iran 8.80 7.14 1.97 −0.30 Cambodia 7.78 7.16 0.80 −0.18ROC 6.19 7.04 −0.92 0.07 ROC 5.34 5.47 −0.11 −0.03 Vietnam 7.51 7.57 0.05 −0.11 Vietnam 7.02 6.70 0.79 −0.46Indonesia 6.06 5.41 0.67 −0.03 Iran 5.19 2.72 2.32 0.15 India 6.79 7.04 −0.32 0.07 Sri Lanka 6.46 6.75 −0.31 0.02Hong Kong 5.76 5.76 −0.07 0.08 Cambodia 5.15 5.42 0.04 −0.31 Malaysia 6.75 4.76 1.24 0.75 Bangladesh 5.99 6.02 −0.64 0.62Iran 5.56 3.64 1.81 0.10 Malaysia 5.02 5.37 0.41 −0.77 Sri Lanka 5.50 4.67 0.72 0.11 Singapore 5.88 6.16 −1.29 1.02India 5.45 5.46 0.00 −0.01 Sri Lanka 4.82 5.04 −0.07 −0.15 Philippines 5.40 4.25 −0.28 1.44 Malaysia 5.50 4.49 0.66 0.34Thailand 5.20 5.71 −0.43 −0.08 Myanmar 4.10 4.67 0.04 −0.61 Bangladesh 5.23 5.41 −0.45 0.27 Indonesia 5.28 5.66 −0.72 0.34Myanmar 5.15 5.34 0.01 −0.20 Bangladesh 4.07 4.15 −0.20 0.12 Thailand 4.64 5.17 −0.01 −0.52 Philippines 5.21 4.75 −0.36 0.82Sri Lanka 5.00 5.34 −0.27 −0.07 Fiji 3.57 3.68 −1.13 1.00 Pakistan 4.63 4.77 −0.80 0.65 Nepal 4.86 4.24 0.59 0.03Pakistan 4.44 4.59 −0.26 0.11 Korea 3.07 4.98 −1.89 −0.02 Indonesia 3.96 4.55 −0.96 0.37 Iran 4.77 3.59 1.06 0.12Philippines 4.19 3.49 −0.02 0.72 Pakistan 2.74 3.14 −0.02 −0.37 Korea 3.71 4.47 −0.84 0.08 Hong Kong 3.74 4.03 −0.76 0.47Fiji 3.22 2.57 0.59 0.05 Hong Kong 2.71 2.40 0.35 −0.04 Singapore 3.52 4.68 0.09 −1.25 Pakistan 3.61 3.97 −0.76 0.40Bangladesh 3.01 3.12 −0.31 0.20 Japan 0.76 0.83 −0.16 0.09 Hong Kong 2.89 4.01 −1.01 −0.11 Thailand 2.93 3.10 −0.42 0.24Japan 2.46 2.70 −0.32 0.08 Indonesia −0.21 −0.08 0.68 −0.81 Nepal 2.64 3.11 −0.55 0.07 Korea 2.89 3.94 −1.10 0.06
Thailand −0.90 0.31 −1.20 −0.01 ROC 2.36 3.60 −1.47 0.22 ROC 1.39 4.00 −2.67 0.06Fiji 1.59 1.75 0.36 −0.52 Fiji 0.65 0.32 0.51 −0.18Japan 1.04 1.18 −0.34 0.21 Japan −0.05 0.40 −0.57 0.13
Bahrain 5.88 4.88 1.34 −0.38 Bahrain 6.04 3.51 2.87 −0.35 Bahrain 7.84 6.52 1.33 −0.02 Bahrain 8.10 5.72 4.23 −1.85Kuwait 5.70 0.72 4.56 0.43 Kuwait 6.04 1.68 4.42 −0.06 Kuwait 11.04 7.59 4.63 −1.18 Kuwait 6.06 1.53 5.13 −0.61Oman 7.93 6.31 1.48 0.14 Oman 6.82 3.12 4.09 −0.38 Oman 7.83 3.45 4.17 0.21 Oman 9.70 4.75 5.14 −0.19Qatar 6.55 5.92 0.78 −0.14 Qatar 13.78 8.91 5.83 −0.97 Qatar 12.12 8.75 5.69 −2.32 Qatar 14.44 13.34 0.59 0.50Saudi Arabia 6.50 4.21 1.27 0.84 Saudi Arabia 4.45 2.64 2.02 −0.21 Saudi Arabia 9.13 4.28 4.91 −0.07 Saudi Arabia 5.83 2.91 3.18 −0.27UAE 10.51 10.15 0.00 0.35 UAE 8.18 6.57 1.87 −0.27 UAE 6.48 4.69 1.74 0.05 UAE 4.47 2.85 1.78 −0.16
Brunei 5.39 1.81 3.59 0.00 Brunei 8.00 2.85 5.15 0.00 Brunei 6.37 −0.65 6.95 0.09(reference) (reference) (reference) (reference)
US 2.71 2.76 −0.07 0.03 US 4.27 4.19 0.08 0.00 US 2.39 2.36 −0.04 0.08 US 0.89 0.86 −0.12 0.15EU15 2.17 2.21 −0.04 −0.01 EU15 2.86 2.86 −0.07 0.06 EU15 2.04 1.80 0.08 0.16 EU15 0.60 0.82 −0.20 −0.02
EU27 2.75 2.80 −0.11 0.06 EU27 2.06 1.85 0.07 0.14 EU27 0.73 0.95 −0.19 −0.03Australia 3.57 3.33 0.30 −0.05 Australia 3.96 3.69 0.12 0.15 Australia 4.31 3.38 1.18 −0.24 Australia 4.21 2.85 1.20 0.16Turkey 4.19 4.35 −0.14 −0.03 Turkey 3.98 4.37 −0.31 −0.08 Turkey 4.67 4.59 0.27 −0.19 Turkey 3.27 3.89 −0.63 0.01
©20
13 A
sian
Prod
uctiv
ity O
rgan
izat
ion

7
113
7.1 Real Income and Terms of Trade
terms of trade have been turning strongly in its favor. The trading gain effect in Australia has therefore been rising from 3% on average a year in 1995–2000, to 35% in 2000–2005, and 42% in 2005–2011 of its real GDP growth. (In terms of percentage points, the trading gain added 0.12, 1.18, and 1.20 points to real GDP growth in the three consecutive periods.) For the oil-exporting countries, the trading gain effect is almost always positive and significant, making it possible to sustain a rise in purchasing pow-er with little real GDP growth in countries such as in Kuwait, Saudi Arabia and Brunei in the second half of the 2000s.
Over the past four decades, net primary income from abroad has not moved outside the margin of ±10% of real GDP growth on average for all 29 countries compared, except for the Philippines, Kuwait, and Saudi Arabia. Net primary income from abroad has been a long-term significant contribution to the purchasing power of the Philippines, with remittances from large number of overseas workers. When its real GDP growth slowed (such as during the late 1990s), net primary income from abroad played an even greater role in cushioning the real income of Filipinos. Over the past four decades, net primary income from abroad augmented real GDP growth by 2.9% and 0.9% on average a year in Ja-pan and the US, respectively and has grown to be more significant (i.e., 32% and 17%, respectively) in both countries as real GDP growth slowed (2005–2011).
Figure 87 plots the time series of net primary income from abroad as a percentage of GDP. The role of net primary income from abroad has been shifting from negative to positive in Hong Kong, with the transition taking place in the mid-1990s leading up to the handover of Hong Kong from British rule to China in 1997. Since then, net primary income from abroad has been positive. A shift in the role of net primary income from abroad has also taken place in Korea from negative to a more or less neutral position in the 2000s, whereas it has held positive in the ROC, oscillating around +2% of GDP, since 1980. Singapore’s net primary income from abroad displayed the largest fluctuations, ranging from +1.9% in 1997 to −7.1% in 2004, but on the whole, it has been more negative than positive. In Japan and the Philippines, net primary income from abroad has risen strongly, albeit at different magni-tudes. In Japan, it rose from 0.6% of GDP in 1990 to 3.1% in 2011, compared with 1.4% in 1990 and 32.3% in 2011 in the Philippines. In the US, it has always been a positive, fluctuating within +1.7% of GDP, whereas in the EU15 it was marginally negative for the three decades between 1975 and 2005 before turning mildly positive.
Combining both the trading gain effect and net primary income from abroad, real income growth for most of the countries compared fell within the margin of ±20% of real GDP growth (Figure 88); Kuwait
Figure 87 Effect of Net Income Transfer on GDP, 1970–2011
Sources: Official national accounts in each country, including author adjustments.
−8
−6
−4
−2
0
2
4
6
1970 1975 1980 1985 1990 1995 2000 2005 2010
ROCKorea
Hong KongSingapore
−2
−1
0
1
2
3
4
1970 1975 1980 1985 1990 1995 2000 2005 2010
IndiaEU15
ChinaJapanUS
−20
−10
0
10
20
30
40
1970 1975 1980 1985 1990 1995 2000 2005 2010
BangladeshFijiMalaysiaPakistan
CambodiaIndonesiaMongoliaPhilippines
% % %
©20
13 A
sian
Prod
uctiv
ity O
rgan
izat
ion

114
7 Real Income
and Brunei appear to be the outliers, with real income growth being 6.9 times and 3.0 times their re-spective long-term dismal real GDP growth of 0.7% and 1.6%.94
Unlike the oil-exporting countries, at any one time roughly half of the Asian countries compared sus-tained a negative trading gain effect, albeit to variable extents, whereas the impact from net primary income from abroad was relatively less pronounced. The period of 1995–2000 reflects the impact of the Asian financial crisis. For Thailand, the trading gain effect more than outweighed the small posi-tive average real GDP growth per year (of 0.3%), giving rise to a marginal fall in real income of −0.9%. In Korea, the negative trading gain also shaved 38% off real GDP growth of 5.0%, producing real in-come growth of 3.1%. At the start of the 2000s, the Asian economy recovered from the financial crisis, but the trading gain effect ran counter to welfare for some countries, with a negative impact that only intensified after 2005. For example, in the ROC, the trading gain effect caused real income growth to be 41% lower than real GDP growth in the period 2000–2005, but in the period 2005–2011 it wiped out 67% of the handsome 4.0% real GDP growth on average a year, leaving real income to grow at 1.4%. Similarly, in Korea the trading gain effect caused real GDP growth to overestimate real income growth by 19% in the first half of the 2000s, which increased to 28% in the years 2005–2011 (Table 17
94: According to Kohli (2004) study on real income of 26 OECD countries during 1980–1996, the trading gain on average over the entire period varies across countries, from the smallest effect of −0.8% (−30.9% of real income growth) per year in Norway to the largest of 0.63% (29.4% of real income growth) per year in Switzerland.
0
2
4
6
8
10
12
0 2 4 6 8 10 12 %
Real GDPgrowth
Real incomegrowth
(+20%)
(−20%)
%
Bangladesh
ROC
Fiji
Hong KongIndia
Indonesia
Iran
Japan
KoreaMalaysia
PakistanPhilippines
Singapore
Sri LankaThailand
Vietnam
Brunei
China
Myanmar
BahrainKuwait
Oman
QatarSaudi Arabia
UAE
AustraliaTurkey
USEU15
Figure 88 Real Income and Real GDP Growth, 1970–2011___Average annual growth rate of GDP at constant prices and real income
Sources: Official national accounts in each country, including author adjustments.Note: The starting years for some countries are different due to data availability during 1970–2011: Brunei (1989–), Cambodia (1993–), Mongolia (2000–), and Nepal (2000–).
Figure 89 Trading Gain Effect, 2005–2011___Average percentage points
Sources: Official national accounts in each country, including author adjustments.
%
−1.3
−1.1
−0.8
−0.8
−0.7
−0.6
−0.6
−0.6
0.0
0.2
0.5
0.6
0.6
0.7
0.8
0.8
1.0
1.1
1.2
3.2
−2.7
−0.4
−0.4
−0.4
−0.3
−0.2
−0.1
1.8
4.2
5.1
5.1
6.9
−3 0 3 6
ROCSingaporeKoreaHong KongPakistanIndonesiaBangladeshTurkeyJapanThailandChinaPhilippinesSri LankaEU15USMyanmarIndiaFijiNepalQatarMalaysiaVietnamCambodiaMongoliaIranAustraliaUAESaudi ArabiaBahrainKuwaitOmanBrunei
©20
13 A
sian
Prod
uctiv
ity O
rgan
izat
ion

7
115
7.1 Real Income and Terms of Trade
and Figure 89). In Japan, the negative trading gain effect more than wiped out the 0.6 percentage points of real GDP growth, leaving real income to actually fall by 0.1% a year on average in the period 2005–2011.
In contrast, the trading gain worked to counterbalance falling real GDP in Brunei, leaving it with a ro-bust, real income growth of 6.4%, despite its contracting real GDP of 0.7% in the latest period (Table 17). In Saudi Arabia, real income growth was more than 200% faster than its real GDP growth. This takes place against the backdrop of strong oil prices, which spiked in mid-July 2008 to USD 147 a bar-rel; after dropping sharply to USD 40 per barrel by the end of 2008 (reflecting the fall in demand after the collapse of Lehman Brothers), it has steadily risen to, and held at, over USD 100 a barrel since 2010 (Figure 90). In the US, the trading gain effect has been unfavorable more often than not, but its posi-tive net primary income from abroad has worked to counterbalance it and the difference between real GDP and real income growth is reduced. For example, in the latest period 2005–2011, the trading gain effect shaved 14.1% off real GDP growth but it was counterbalanced by the positive effect from net primary income from abroad, which added 17.2% to real GDP growth, leaving real income growth slightly higher than real GDP.
Figure 91 provides the results of further decomposition of the trading gain into the terms-of-trade effect and the real exchange rate effect in Asian countries for the period 1970–2011.95 The terms-of-trade effect is the part of real income growth attributed to the change in the relative price between exports and imports, while the real exchange rate effect refers to the part of real income growth at-tributed to changes in the relative prices of traded goods and domestically consumed goods. By ap-plying this result, real income growth can be decomposed into real GDP growth, terms-of-trade effect, real exchange rate effect, and net primary income from abroad. The first chart in Figure 91 applies this break-down to Asian countries for the period 1970–2011. It shows that the real exchange rate effect is
95: Following Kohli (2006), trading gain can be decomposed into two components as follows:
(1/2) (sXt + sX
t−1) ( In ( PXt / PX
t−1 ) − In ( PDt / PD
t−1 )) − (1/2) (sMt + sM
t−1) ( In ( PMt / PM
t−1 ) − In ( PDt / PD
t−1 )) = Real income growth attributed to changes in the terms of trade (=trading gain)
(1/4) (sXt + sX
t−1 + sMt + sM
t−1) ( In ( PXt / PX
t−1 ) − In ( PMt / PM
t−1 )) +
Terms-of-trade effect
(1/2) (sXt + sX
t−1 − sMt − sM
t−1) ((1/2) In ( PXt / PX
t−1 ) + (1/2) In ( PMt / PM
t−1 )− In ( PDt / PD
t−1 ))Real exchange rate effect
0
25
50
75
100
125
150
Jan 02,1986
Jan 02,1988
Jan 02,1990
Jan 02,1992
Jan 02,1994
Jan 02,1996
Jan 02,1998
Jan 02,2000
Jan 02,2002
Jan 02,2004
Jan 02,2006
Jan 02,2008
Jan 02,2010
Jan 02,2012
Dollars per barrel
41.07
10.82
77.05
145.31
30.28
75.40 77.91
113.39
109.39
Figure 90 Price of Crude Oil, 1986–2013
Source: US Energy Information Administration, WTI spot prices FOB (Cushing, Oklahoma).
©20
13 A
sian
Prod
uctiv
ity O
rgan
izat
ion

116
7 Real Income
generally much smaller than the terms-of-trade effect, implying that the relative prices of traded versus domestically consumed goods have been largely stable in most countries. The exceptions are Kuwait and Brunei where the real exchange rate effect account-ed for 31% and 18% of real in-come growth. This might have reflected the weight of oil in the composition of their traded goods. The second chart shows the decomposition for the most recent period 2000–2011. It shows that the trading gain, par-ticularly the terms-of-trade effect, is highly significant and favorable for the oil-exporting countries, but is significant and negative in a handful of Asian economies such as Hong Kong, the ROC, Korea, and Pakistan.
Figure 92 shows the decomposi-tion of average annual real in-come growth covering two periods of major economic shocks faced by the Asian economies: during 1973–1979, which includes the two oil price hikes in 1974 and 1979, and 1996–1998 to capture the impact of the Asian financial crisis. High oil prices improved the terms for oil-exporting countries, such as Iran and Indonesia, and worsened the terms of trade for oil-importing countries. During the Asian financial crisis, the terms-of-trade effect was still the predominant factor in determining the dif-ference between real income growth and real GDP growth. In Brunei, the terms-of-trade effect further reinforced the negative real GDP growth of −6.3%, reducing its real income growth a further 8.1 percentage points. In Iran, the negative terms-of-trade effect counteracted the 0.9% real GDP growth, giving real income growth of −1.5%. In Indonesia, the trading gain effect worked to counterbalance the contraction in real GDP, whereas in Thailand, it reinforced the negative real GDP growth. In the Philip-pines, although the strong favorable terms-of-trade effect was moderated by the negative real ex-change rate effect, the resulting real income growth more than quadrupled the real GDP growth.96
Figure 93 shows this decomposition of real income in each Asian country, along with the US, EU15, Australia, and Turkey97 from 1970, or the year of first data collection for the country in question. The trading gain can be positive or negative, depending on the direction of change in the terms of trade. Its impact is modest for most countries, adding less than ±1 percentage point to annual real GDP growth, except for some oil-rich countries. In the short term, one sees extreme spikes in trading gain. For instance, as a consequence of the first oil price shock, the improvement in the terms of trade was responsible for around 80% of the 40.6% increase in real income in Iran in 1974. The opposite was true
Figure 91 Decomposition of Real Income Growth, 1970–2011 and 2000–2011
Sources: Official national accounts in each country, including author adjustments.
UAE
ChinaO
man
VietnamSingaporeM
alaysiaKoreaQ
atarSaudi ArabiaRO
CIndonesiaBahrainH
ong KongKuw
aitIranIndiaThailandM
yanmar
Sri LankaBruneiPakistanPhilippinesTurkeyAustraliaFijiBangladeshU
SJapanEU
15
Qatar
ChinaM
yanmar
Mongolia
Om
anCam
bodiaKuw
aitBahrainIndiaSaudi ArabiaVietnamBruneiIranM
alaysiaSri LankaBangladeshU
AEPhilippinesSingaporeIndonesiaAustraliaPakistanTurkeyN
epalThailandH
ong KongKoreaRO
CU
SEU
15FijiJapan
1.2
10.2
8.66.3 6.7 7.3
6.4 7.1 5.94.2
7.05.4 4.9 5.8
0.7
3.65.5 5.7 5.3 5.3
1.6
4.6 3.5 4.4 3.32.6 3.1 2.8 2.7 2.2
0.8
1.1
0.81.1
1.8 1.5 0.9
2.4
0.7
2.8
1.8 1.0
3.7 3.8
1.1
3.2
0.8
4.4
1.7 1.61.1
1.71.2
2.6
11.310.8 10.9 8.2
4.2
8.6
4.36.1
7.8
3.5
7.1
0.9
5.2 4.6 5.8 5.73.7 4.5 5.5 5.2
3.1 4.3 4.2 3.7 4.0 4.0 4.23.8
1.5 1.3 1.0
2.3
0.6
−0.8 −0.9 −0.9−1.1
−3
−0.80
3
6
9
12%
%
1970–2011
−3
0
3
6
9
12
152000–2011
Real exchange rate e�ect Terms-of-trade e�ect Real GDPNet primary income from abroad Real income
−2.1−0.9−0.8 −1.0
©20
13 A
sian
Prod
uctiv
ity O
rgan
izat
ion

7
117
7.1 Real Income and Terms of Trade
in EU15, where the negative trading gain effect counterbalanced real GDP growth, leaving virtually no growth to real income in the period 1974–1975. The effect of the second oil spike can be seen in the early 1980s. Sri Lanka, Malaysia, and Indonesia also experienced volatile variations in trading gains in the 1970s. The trading gain has been working against Singapore and the ROC’s welfare for most of the period covered.
96: Kohli (2006) calculated the trading gain, the terms-of-trade effect, and the real exchange rate effect of Canada during 1982–2005. The average annual trading gain over the entire period is very low, at 0.1%. This is small by the standard of Asian economies. How-ever, the trading gain later became significant, especially for the three years 2002–2005. Over these years, the average trading gain is 1.6% per year. This effect is decomposed into a terms-of-trade effect of 1.4% and a real exchange rate effect of −0.1%.
97: There are several studies on the decomposition of real income growth for other countries: Kohli (2004) for 26 OECD countries dur-ing 1980–1996, Kohli (2006) for Canada during 1981–2005, and Diewert and Lawrence (2006) for Australia during 1960–2004.
Figure 92 Decomposition of Real Income Growth, 1973–1979 and 1996–1998___Decomposition: Average annual growth rate of real income
Sources: Official national accounts in each country, including author adjustments.
Sri LankaVietnamTurkeyChinaBanglad
eshRO
CInd
iaCam
bod
iaU
SSingap
oreA
ustraliaM
yanmar
Philipp
inesEU
15PakistanH
ong KongFijiM
alaysiaJap
anIranKoreaThailandInd
onesiaBrunei
−5
0
5
101973–1979
−15
−10
−5
0
5
10%% 1996–1998
Real exchange rate e�ect Terms-of-trade e�ect Real GDP Net primary income from abroad Real income
IndonesiaKoreaM
alaysiaIranRO
CH
ong KongSingaporeFijiPakistanThailandChinaM
yanmar
Sri LankaTurkeyPhilippinesIndiaAustraliaJapanU
SEU
15Bangladesh
3.2 1.11.2
2.3
5.26.9
9.8
7.5
1.5
8.9 8.07.1
4.3 4.6
7.35.8
4.45.4
4.7 4.1 3.6 3.8 3.9 2.9 2.9 2.3
−0.8 −1.1
3.31.4
1.2
1.41.3
1.0 1.21.91.42.9
0.85.04.63.54.34.34.66.37.45.36.95.1 6.0
0.91.22.93.0
−1.7 −1.1 −2.6−1.5
−0.9
−8.1
−1.0−1.6
−6.3−8.5
−5.0
0.9 0.9
−1.4
©20
13 A
sian
Prod
uctiv
ity O
rgan
izat
ion

118
7 Real Income
1971 1976 1981 1986 1991 1996 2001 2006 2011 1971 1976 1981 1986 1991 1996 2001 2006 20111971 1976 1981 1986 1991 1996 2001 2006 2011
1971 1976 1981 1986 1991 1996 2001 2006 2011 1971 1976 1981 1986 1991 1996 2001 2006 20111971 1976 1981 1986 1991 1996 2001 2006 2011
1971 1976 1981 1986 1991 1996 2001 2006 2011 1971 1976 1981 1986 1991 1996 2001 2006 20111971 1976 1981 1986 1991 1996 2001 2006 2011
1971 1976 1981 1986 1991 1996 2001 2006 2011 1971 1976 1981 1986 1991 1996 2001 2006 20111971 1976 1981 1986 1991 1996 2001 2006 2011
1971 1976 1981 1986 1991 1996 2001 2006 2011
1971 1976 1981 1986 1991 1996 2001 2006 2011 1971 1976 1981 1986 1991 1996 2001 2006 20111971 1976 1981 1986 1991 1996 2001 2006 2011
1971 1976 1981 1986 1991 1996 2001 2006 2011 1971 1976 1981 1986 1991 1996 2001 2006 2011
Bahrain Bangladesh Brunei
Cambodia China ROC
India Indonesia
Iran Japan Korea
Kuwait Malaysia Mongolia
Myanmar
Hong Kong
Nepal Oman
−20
−15
−10
−5
0
5
10
15
−6
−3
0
3
6
9
12
15
−6
−3
0
3
6
9
12
−4
−2
0
2
4
6
8
−10
−5
0
5
10
15
20
−2
0
2
4
6
8
−15
−10
−5
0
5
10
15
20
25
−6
−3
0
3
6
9
12
15
18
−15
−10
−5
0
5
10
15
20
−8
−4
0
4
8
12
16
−50
−25
0
25
50
75
−30
−15
0
15
30
45
−80
−60
−40
−20
0
20
40
60
−2
0
2
4
6
8
10
12
14
−27
−18
−9
0
9
18
27
36
45
−60
−30
0
30
60
90
−12
−9
−6
−3
0
3
6
9
12
15
−8
−4
0
4
8
12
16
Real GDP Trading gain Net primary income from abroad Real income
% % %
% % %
% % %
% % %
% % %
% % %
©20
13 A
sian
Prod
uctiv
ity O
rgan
izat
ion

7
119
7.1 Real Income and Terms of Trade
Figure 93 Sources of Real Income Growth, 1970–2011
Sources: Official national accounts in each country, including author adjustments.
1971 1976 1981 1986 1991 1996 2001 2006 2011 1971 1976 1981 1986 1991 1996 2001 2006 2011 1971 1976 1981 1986 1991 1996 2001 2006 2011
1971 1976 1981 1986 1991 1996 2001 2006 2011 1971 1976 1981 1986 1991 1996 2001 2006 2011 1971 1976 1981 1986 1991 1996 2001 2006 2011
1971 1976 1981 1986 1991 1996 2001 2006 2011 1971 1976 1981 1986 1991 1996 2001 2006 2011 1971 1976 1981 1986 1991 1996 2001 2006 2011
1971 1976 1981 1986 1991 1996 2001 2006 2011 1971 1976 1981 1986 1991 1996 2001 2006 2011 1971 1976 1981 1986 1991 1996 2001 2006 2011
1971 1976 1981 1986 1991 1996 2001 2006 2011
Pakistan Philippines Qatar
Saudi Arabia Singapore Sri Lanka
Thailand UAE Vietnam
US
−16
−12
−8
−4
0
4
8
12
16
−8
−4
0
4
8
12
16
20
−40
−20
0
20
40
60
80
100
−4
−2
0
2
4
8
6
EU15
−30
−20
−10
0
10
20
30
40
−15
−10
−5
0
5
10
15
20
−6
−4
−2
0
2
4
6
8
10
12
−4
−2
0
2
4
6
8Australia
−4
0
−2
6
4
2
8
10
−30
−20
−10
0
10
20
30
40
50
−10
−5
0
5
10
15
−4
−2
0
2
4
6
8
−6
−4
−2
0
2
4
6
8
10
12Turkey
Real GDP Trading gain Net primary income from abroad Real income
% % %
% % %
% % %
% % %
%
©20
13 A
sian
Prod
uctiv
ity O
rgan
izat
ion

120
7 Real Income
7.2 Terms of Trade and Productivity Growth
When the trading gain is highly favorable, it can breed a sense of complacency, and productivity performances can suffer as a re-sult. Resource-rich economies are susceptible to this pitfall because they are poised to reap some ex-tremely positive trading gains when commodity prices turn in their fa-vor over a sustained period of time. While commodity prices can rise, they can also fall. This is when countries’ real income growth could suffer if fundamentals for real GDP growth are weak. Over the past four decades, only five countries have enjoyed a favor-able trading gain effect of over 1% per annum. They are Kuwait, Brunei, Iran, Oman, and Bahrain (all oil-exporting countries), and only Iran among them could achieve a significant positive growth in labor productivity (Figure 94). Australia is a rising economy that has benefited from recent hikes in commodity prices, which are likely to stay for a period of time, as a response to the vibrant growth in the emerging economies especially China. The surge in its TFP in the 1990s stopped around the end of the century before turning negative about five years ago,98 just at the stage when they were enjoying an all-time-high positive trading gain effect, with real in-come growth faster than real GDP growth by 48% during 2005–2011 (Table 17, p. 112). A resource-rich country can suffer from “Dutch disease,” which describes a phenomenon in which a country’s currency is pushed up by the commodity boom, making other parts of its economy less competitive and poten-tially increasing the country’s dependence on natural resources. This is how resource abundance can easily lead to resource dependence. A way to counteract Dutch disease is broad-based robust produc-tivity growth and industry diversification, in which Bahrain and Oman have shown some success (see Section 6.2 and Figure 75, p. 96).
Figure 94 also shows that many Asian countries have succeeded in achieving high growth of labor productivity while having to accept a deteriorating trading gain over the long run. These countries are typically resource importers whose voracious demand for commodities pushes up their import prices, while export prices tend to fall as a result of their achievement in productivity improvement resulting in unfavorable movements in terms of trade. This is particularly the case in countries where economic growth is highly dependent on export promotion. In such instances, a negative trading gain is partly a side-effect of productivity success. Although the trading gain effect partly negates their real GDP growth, they are still much better off than before their development took off and without productiv-ity improvements.
98: The Economist, 28 May 2011, “Special Report on Australia: No worries?”
−4.5 −3.0 −1.5 0.0 1.5 3.0 4.5 6.0 7.5 %Labor productivity growth
−2
−1
0
1
2
3
4
5% Terms-of-trade e�ect
Bangladesh
Cambodia
ROC
Fiji
Hong Kong India
Indonesia
Iran
Japan
Korea
Malaysia
Nepal
Pakistan
Philippines
Singapore
Sri Lanka
Thailand
Vietnam
Brunei
China Myanmar
Bahrain
Kuwait
Oman
Qatar
Saudi Arabia
UAE
Australia
US
EU15
Turkey
Figure 94 Terms-of-Trade Effect and Labor Productivity Growth, 1970–2011
Sources: Official national accounts in each country, including author adjustments.Note: The starting years for some countries are different due to data availability dur-ing 1970–2011: Brunei (1989–), Cambodia (1993–), Mongolia (2000–), Nepal (2000–), and Vietnam (1986–).
©20
13 A
sian
Prod
uctiv
ity O
rgan
izat
ion

7
121
7.2 Terms of Trade and Productivity Growth
Resource price hikes are certainly blessings for resource-exporting economies when prices are increasing. Figure B6.1 illustrates trading gain effects (average annual growth rates due to trading gains in 1970–2010) and value-added shares of the mining sector in 1970 and 2010 in selected Asian economies. It indicates that large trade gainers typically have dominant mining sectors, petroleum and natural gas in particular. Providing resource prices continuously go up, these countries continue to gain from the positive terms-of-trade effects.
However, what would happen if resource prices came down, or their natural reserves were depleted? Then the story of the Dutch disease might come in. Richness in natural resources may become a curse if they do not have competitive industries other than mining. Figure B6.1 shows that some of the trading gainers actively reduced their share of the mining sector over time, which could reflect the intention of developing
Box 6 Resource-Rich Countries and the Possible Dutch Disease
industries other than mining. However, Figure 94 shows that labor productivity growth rates in these countries after 1990 remained low, or even negative. Even if they wanted to start industrialization, their high income and strong local currency would not easily allow them to develop a man-ufacturing sector or an inter-nationally competitive service industry. Another concern is their heavy dependence on foreign workers, both skilled and unskilled.
On the other side of coin are the resource/energy-importing economies. Most of these suf-fered from negative trading gain effects, losing a part of their economic growth due to resource price hikes, partic-ularly after 2000 (Table 17, p. 112). However, it has actually strengthened their competi-tiveness in manufacturing and other productive activities for the future.
Figure B6.1 Trading Gain Effects and Value-added Share in Mining Sector, 1970–2010
Note: The starting years for some countries are different due to data availability during 1970–2010: Brunei (1989–) and Vietnam (1986–) for trading gain effect, Brunei (1974–), UAE (1972–), Bahrain (1975–), Malaysia (1987–), and Vietnam (1986–) for value-added share of mining sector. Sources: Official national accounts in each country, including author adjustments.
Qatar
Brunei
Oman
Kuwait
Saudi Arabia
UAE
Malaysia
Iran
Bahrain
Vietnam
Indonesia
Australia
0 10 20 30 40 50 60 70 80 90
Trading gain e�ect, 1970−2010
Value-added shares in Mining, 1970 and 2010
−1
0
1
2
3
4
5%
%
©20
13 A
sian
Prod
uctiv
ity O
rgan
izat
ion

123
App.
GDP HarmonizationA.1
This edition incorporates some significant revisions to the national accounts. Observing new develop-ments for upgrading of statistics systems in Asian economies, Malaysia and Hong Kong newly pub-lished their national accounts based on the 2008 SNA in May and September 2012, respectively. In May 2011, the Philippines published its new national accounts based on the 1993 SNA, incorporating elements of the 2008 SNA. While there are movements towards upgrading the SNA, some countries, such as Cambodia and Indonesia, have still not fully introduced the 1993 SNA. The different statuses of SNA adaptions among member economies are responsible for the huge variations of data defini-tions and coverage in national accounts, calling for data harmonization to better perform compara-tive productivity analyses. This Databook project tries to reconcile the national accounts variations that are based on the different concepts and definitions to provide harmonized estimates for interna-tional comparison. The APO Productivity Database 2013 largely follows the concepts and definitions of the 1993 SNA, thus its GDP includes software investment and final consumption of financial inter-mediation services indirectly measured (FISIM) and excludes the expenditures for research and devel-opment. In addition to these adjustments, some extra adjustments are necessary to harmonize the estimates of GDP. Procedures for all these adjustments are explained below.
1) FISIMFISIM is an indirect measure of the value of financial intermediation services provided, but for which financial institutions do not charge explicitly (United Nations, 1993: para. 6.124). It represents a sig-nificant part of the income of the finance sector. The 1993 SNA recommends that FISIM should be al-located to users (to individual industries and final demands). This is in contrast to the 1968 SNA, where the imputed banking services were allocated exclusively to the business sector. The common practice was to create a notional industry that buys the entire service as an intermediate expense and gener-ates an equivalent negative value added. As such, the imputed banking services have no impact on GDP. Therefore, the 1993 SNA recommendation, if fully implemented, will impact on industry GDP and the overall GDP for the total economy (by the part of FISIM allocated to final demands).
Among the 20 APO member economies, eight countries – Bangladesh, Cambodia, Indonesia, the Lao PDR, Nepal, Pakistan, Sri Lanka, and Vietnam – do not allocate FISIM to final demands in their official national accounts, as a result of them still not following the 1993 SNA recommendation. Thus, the GDP values in these countries are smaller than others by definition. In addition, even in the countries whose national accounts follow the 1993 SNA’s recommendation on FISIM, the available data some-times does not cover the whole periods of our observations. To harmonize the GDP concept among countries and over periods, final demands of FISIM are estimated for those countries in the APO Pro-ductivity Database, using available estimates of value added in Imputed Bank Service Charge (IBSC) or financial intermediation (in instances where IBSC data is not available). The ratios of value added of IBSC or financial intermediation on FISIM allocated to final demand are assumed to be identical with the average ratios observed in the countries in which data is available. Figure 95 describes the coun-tries and methods to adjust FISIM. As described, in instances where both value added data are not available, the trend of the FISM share on GDP is applied to extrapolate past estimates (although the impacts on GDP are minor).
Figure 96 plots per capita GDP levels in 2011 and the FISIM share in GDP in the 2000–2011 (including both of the original estimates in the official national accounts and our estimates). In countries where GDPs are adjusted, the proportions by which author adjustments for FISIM increases GDP stand at 0.9–1.4% for Brunei, Indonesia, Nepal, and Pakistan and less than 0.5% GDP in others.
Appendix
©20
13 A
sian
Prod
uctiv
ity O
rgan
izat
ion

124
Appendix
2) SoftwareThe 1993 SNA also recommends the capitalization of intangible assets, which changes not only the size of GDP but also the size of capital input. One intangible asset is com-puter software, which includes pre-packaged software, custom software, and own-account software. Among the APO member economies, only nine have capitalized all three types of software. Another three countries ex-clude own-account software in their capitalization, in one country only pre-packaged software is capitalized, and in one country only custom software is capitalized. For the APO Productivity Database, tentative ad-justments have been made to har-monize data to include all software.
Among the countries studied, the data for software investment is available for the ROC, Japan, Korea, Mongolia, the Philippines, Singa-pore, Thailand, and China. To harmo-nize data, a country’s GDP is adjusted to include software investment (through its software industry) by using the ratio between software in-vestment and GDP (software ratio) and the tangible GFCF to GDP ratio (GFCF ratio). Data from the OECD Productivity Database (Schreyer, Bignon, and Dupont, 2003) and the APO Productivity Database suggest an inverse relationship between these two ratios (Figure 97). Coun-tries with a low GFCF ratio tend to be those with high per capita GDP, and the observed data suggest that IT tends to play a more important role in these countries than in less developed countries. Furthermore, it is observed from the OECD and APO software data that the software ratio has been gradually increasing over the past 25 years.
The Databook applies the inverse relationship between these two ratios observed from the OECD countries and national accounts in Asian non-OECD countries to estimate the software ratio in 2006
Figure 95 Adjustment of FISIM
1945
197019701970
19501951
19551953
19811955
1960
1960
1964
19461959
19511955
19701958
19701962
1970
1970
Adjustment of using value added of imputed bank service chargeAdjustment of using value added of �nancial intermediationUsing the average trend of FISIM share in GDP
BangladeshCambodia
FijiIndia
IndonesiaIran
JapanKorea
Lao PDRMalaysia
MongoliaNepal
PakistanPhilippines
Sri LankaThailandVietnam
BruneiMyanmar
BahrainKuwaitOmanQatar
Saudi ArabiaUAE
Turkey
1950 1955 1960 1965 1970 1975 1980 1985 1990 1995 2000 2005 2010
19801993
19771970
19601959
1970
19851970
19741960
19671972
19701986
19741990
19751982
19701975
19701975
Figure 96 FISIM Share in GDP in the 2000–2011
Sources: Official national accounts in each country and author estimates.
0.0
0.5
1.0
1.5
2.0
2.5
3.0
3.5
0 10 20 30 40 50 60
FISIM share in GDP (average in the 2000−2011)
Per capita GDP in 2011(using 2005 PPP, reference year 2010)
O�cal national accounts in each country, including author adjustments
%
Our estimates using value added in imputed bank service chargeOur estimates using value added in �nancial intermediation
BangladeshCambodia
ROC
Fiji
Hong Kong
India
Indonesia
Iran
Japan
Korea
Lao PDR
Malaysia
MongoliaNepal
Pakistan
PhilippinesSingapore
Sri Lanka
Thailand
Vietnam
Brunei
China
Myanmar
US
AustraliaTurkey
Thousands of US dollars (as of 2010)Thousands of US dollars (as of 2010)
©20
13 A
sian
Prod
uctiv
ity O
rgan
izat
ion

125
A.1 GDP Harmonization
App.
for those APO member economies that do not capitalize software in-vestment. The estimated ratios for individual countries in 2006 gradu-ally taper off as one move back in time. However, there is an excep-tion. Countries at the very early stage of economic growth are found to have a GFCF ratio as low as countries with high per capita GDP, but for a different reason. The low GFCF ratio is explained by the fact that these countries have not expe-rienced economic development yet, and in turn this does not imply an important role for software invest-ment. In this report, Cambodia, the Lao PDR, and Nepal are regarded as countries at the very early stage of economic development, and are as-signed Vietnam’s software ratio ac-cordingly, which is the lowest of all APO member economies.
Another problem arises from partial software capitalization. There are
Figure 97 Software Investment Ratio and GFCF Ratio to GDP, 2005
Source: OECD Productivity Database and author estimates.
Software investment/GDP
13 18 23 28 33 38 43 Tangible GFCF/GDP
Countries in which software is includedCountries in which software is excluded
Countries in which pre-package and own account software are excludedCountries in which custom and own account software are excludedCountries in which own account is excluded
%
Austria
Canada
Denmark
Finland
France
Germany
Ireland
Italy
Netherlands
New Zealand
Portugal
Spain
Sweden
United Kingdom
Switzerland
ROC
Hong Kong
Japan
Korea
Mongolia
PakistanPhilippines
Singapore
Thailand
Australia
China
US
Bangladesh Cambodia
Malaysia Sri LankaVietnamFiji
Indonesia
India
IranNepal
0.0
0.5
1.0
1.5
2.0
2.5
%
three types of software: pre-packaged software, custom software, and own-account software. Coun-tries may have capitalized one or two types of software, but software investment data is often not available separately. The Databook attempt’s to adjust for the varied level of capitalization across countries by adding the type of software not capitalized to countries’ GDP. In the case of Japan’s own-account software and ownership transfer cost, it used estimates by Nomura (2004) and added these to the GDP of Japan’s software industry and GFCF.
3) ValuablesValuables are defined as “goods of considerable value that are not used primarily for purposes of pro-duction or consumption but are held as stores of value over time” (United Nations, 1993: para. 10.7). They are held under the expectation that their prices will not deteriorate and will rise in the long run. Valuables consist of precious stones and metals such as diamonds; art-works such as paintings and sculptures; and other valuables such as jewelry made from stones and metals. In a small number of countries, such as, India, Iran, Mongolia, Pakistan, and Vietnam, net acquisitions of valuables are recorded as a part of gross capital formation. For example, the SNA in India has included it since 1999, accounting for 1.2% of GDP for India on average during 1999–2011. The current decision is to harmonize the data by excluding net acquisition of valuables from GDP in the APO Productivity Database 2013.
4) GDP at basic pricesGDP can be valued using different price concepts: factor cost, basic prices, and market prices. If the price concept is not standardized across countries, it will interfere with the international comparisons. All the countries covered in this Databook officially report GDP at market prices (or at purchasers’ prices), but this is not true for GDP at factor cost and GDP at basic prices. International comparisons in
©20
13 A
sian
Prod
uctiv
ity O
rgan
izat
ion

126
Appendix
Chapter 3 (on economic scale and growth) and Chapter 4 (on final demand) are based on GDP at mar-ket prices. However, by valuing output and input at the prices that producers actually pay and receive, GDP at basic prices is a more appropriate measure of countries’ output than GDP at market prices for international comparisons of TFP and industry performance as it is a measure from the producers’ perspective. Hence, Chapter 5 on whole-economy productivity performance is based on GDP at basic prices, including our estimates.
These concepts of GDP differ in the treatment of indirect tax and subsidies (and import duties). The difference between GDP at basic prices and GDP at market prices is “taxes on products” minus “subsi-dies on products.” “Taxes on products” are the indirect taxes payable on goods and services mainly when they are produced, sold, and imported, and “subsidies on products” are subsidies payable on goods and services mainly when they are produced, sold, and imported. Since GDP at basic prices is available for some economies, such as Hong Kong, India, Korea, Mongolia, Nepal, Singapore, and Sri Lanka, a GDP at basic prices, needs to be constructed for all other countries. In order to obtain GDP at basic prices, “taxes on products” and “duties on imports” are subtracted from GDP at market prices, which is available for all the countries studied, and “subsidies on products” is added. The main data sources for estimating “taxes on products” and “subsidies on products” are tax data in national ac-counts, the IMF’s Government Finance Statistics, and the input-output tables in each country.
Readers should bear these caveats in mind in interpreting the results in Chapter 6, since the definition of GDP by industry differs among countries due to data availability. GDP is valued at factor cost for Fiji, India, and Pakistan at basic prices for Cambodia, Hong Kong, Iran, Korea, the Lao PDR, Mongolia, Ne-pal, and Singapore, at producers’ prices for the ROC and the Philippines, and at market prices for Ban-gladesh, Indonesia, Japan, Malaysia, Sri Lanka, Thailand, and Vietnam. In this sense, APO industry data should be treated as a work in progress as it is difficult to advise on data uncertainty. These issues will be developed and examined in the future.
©20
13 A
sian
Prod
uctiv
ity O
rgan
izat
ion

127
A.2 Capital Stock
App.
Capital Stock A.2
At present, half the APO member economies publish estimates of capital stocks in their systems of national accounts. Even where estimates are available, users must be mindful of differences in methodologies and assumptions used to estimate capital stock, and a large diversity in the treatment of quality adjustment in price statistics among countries. In the APO Productivity Database 2013, a harmonized methodology has been applied in estimating capital stock and capital services, cover-ing 17 Asian economies: China, the ROC, Fiji, Hong Kong, India, Indonesia, Iran, Japan, Korea, Malaysia, Mongolia, Pakistan, the Philippines, Singapore, Sri Lanka, Thailand, and Vietnam, and the US as a reference country.
Quality changes in the aggregate measure of capital input can originate from two kinds of sources, namely the composition change by type of asset, and the quality change in each type of asset. To take the composition change of assets into account, the current database classifies ten types of assets (shown in Table 18). For countries in which detailed invest-ment data is not available from national accounts, the ten types of investment data are estimated based on the benchmark input–output tables and our estimates of the commodity flow data of domestic production and export/import of assets. The input–output tables and supply and use tables are listed in Table 19. The starting years for esti-mating capital stock based on the perpetual inventory method is 1901 for the US, 1951 for the ROC, 1952 for Chi-na, 1953 for Korea, 1955 for Japan, 1960 for Singapore, 1961 for Hong Kong, and 1970 for other countries.
It is well known that prices of constant-quality IT capital have been falling rapidly. For cross-country comparisons,
Table 18 Asset Classification and Parameters in Hyperbolic Function
Source: APO Productivity Database 2013.01.
T β1. IT hardware 7 0.50
2. communications equipment 15 0.50
3. transportation equipment 15 0.50
4. other machinery and equipment 15 0.50
5. residential buildings 30 0.75
6. non-residential buildings 30 0.75
7. other construction 40 0.75
8. cultivated assets 10 0.50
9. computer software 3 0.50
10. other intangible assets 7 0.50
Table 19 Input–Output Tables and Supply and Use Tables
Input–Output Tables / Supply and Use Tables
ROCBenchmark (1981, 1984, 1986, 1989, 1991, 1994, 1996, 1999,
2001, 2004, 2006) Annual (2006–2011)Fiji 1972, 1982, 2005
India 1993/1994, 1998/1999, 2003/2004, 2006/2007
Indonesia 1971, 1975, 1980, 1985, 1990, 1995, 2000, 2005
Iran 1999, 2001
Japan 1960, 1965, 1970, 1975, 1980, 1985, 1990, 1995, 2000, 2005
Korea
Benchmark (1960, 1963, 1966, 1970, 1975, 1980, 1985, 1990,
1995, 2000, 2005) Updated (1973, 1978, 1983, 1986–1988,
1993, 1998, 2003, 2006–2010)Malaysia 1978, 1983, 1987, 1991, 2000, 2005
Mongolia 1970, 1977, 1983, 1987, 2000, 2005
Pakistan 1975/1976, 1984/1985, 1989/1990, 1990/1991
Philippines 1969, 1975, 1985, 1988, 1990, 1995, 2000
Singapore 1973, 1978, 1983, 1988, 2000, 2005, 2007
Sri Lanka 2006
Thailand 1975, 1980, 1985, 1990, 1995, 1998, 2000, 2005
Vietnam 1996, 2000, 2007
China 1987, 1992, 1997, 2002, 2007
Brunei 2005
Turkey 1973, 1979, 1985, 1990, 1998, 2002
it has been noted that there is great diversity in the treatment of quality adjustment in price statistics among countries. Cross-country com-parisons will be significantly biased if some countries adjust their deflators for quality change while others do not. Price harmoniza-tion is sometimes used in an attempt to control for methodological differences in the compila-tion of price indexes, under the assumption that individual countries’ price data fails to capture quality improvements. Assuming that the rela-tive price of IT to non-IT capital in the countries compared is set equal to the IT to non-IT prices relative in the reference country, the harmo-nized price is formulated as: ∆ ln P̃IT
X = ∆ ln PnlTX +
(∆ ln PITref − ∆ ln PnlT
ref ), where the superscript X de-notes the country included in the comparisons, PIT is the price of IT capital, and PnIT is the price of non-IT capital. The price of IT capital in country X, P̃IT
X , is computed by the observed prices PITref
and PnlTref in the reference country and PnlT
X in X.
©20
13 A
sian
Prod
uctiv
ity O
rgan
izat
ion

128
Appendix
Schreyer (2002) and Schreyer, Bignon, and Dupont (2003) applied price harmonization to OECD capital services, with the US as a reference country, since the possible error due to using a harmonized price in-dex would be smaller than the bias arising from compar-ing capital services based on national deflators.
In this Databook, the same price harmonization method is applied to adjust the quality improvement for IT hardware and communications equip-ment in countries where the
Figure 98 Capital-Output Ratio, 1980 and 2011___Ratio of the beginning-of-period net capital stock to GDP at current prices
Source: APO Productivity Database 2013.01.Note: The starting period for Vietnam is 1986.
1980 2011
%
0.0
0.5
1.0
1.5
2.0
2.5
3.0
3.5
4.0
4.5
Japan
Korea
Indonesia
Thailand
ROC
China
Hong Kong
Fiji
Singapore
Vietnam
Mongolia
US
Philippines
Malaysia
India
Sri Lanka
Iran
Pakistan
1.7
1.1
2.0
3.4 3.1
2.9
1.5
2.3
1.8 1.8
2.9 2.7
2.6 2.5 2.3
3.2
2.4
2.0 1.8 1.8
2.7
2.4 2.5 2.4 2.4 2.3 2.2 2.2
2.0
1.4
2.5
1.9 2.2
2.9
3.9
appropriate quality-adjusted price data is not available, with Japan’s prices as a reference country. A similar procedure was applied in cases where the prices for some assets were not available, to estimate missing data based on the relative price of these assets to total GFCF. In measuring capi-tal services, this Databook largely follows the framework of the OECD Productivity Database (see Schreyer, Bignon, and Dupont, ibid.). The OECD assumes the truncated normal distribution as profiles for asset discarding (retirement) and the hyperbolic distribution as profiles for asset decaying. The age-efficiency profile is defined as a combined distribution of discard and decay of assets. The age- efficiency profile in each asset is based on the two parameters in the hyperbolic function: T (average service life) and β (−∞<β≤1). The hyperbolic function becomes one-hoss shay (no decay until T) when β=1 and linear when β=0. These two parameters are set, as shown in Table 18. The estimates of pro-ductive capital stock by type of asset are used in measuring capital services (see Appendix 3).
Figure 98 presents the estimated capital-output ratio (stock coefficient) that is defined by the ratio of the beginning-of-period net capital stock (all types of produced fixed assets owned by private and public institutions) to the basic-price GDP at current prices. Japan has the highest capital-output ratio among Asian countries, at 3.9. However, the ratio may not work well for cross-country comparisons since the price differential between that for GDP and fixed assets in each country is not accounted for. Compared to the 1980 level in each country, all Asian countries except Mongolia have an increasing trend of capital-output ratio, unlike the ratio in the US, which is stable.
©20
13 A
sian
Prod
uctiv
ity O
rgan
izat
ion

129
A.3 Rate of Return and Capital Services
App.
Rate of Return and Capital Services A.3
In the analysis of production and productivity, capital service provides an appropriate concept of capital as a factor of production. The fundamental assumption in measuring capital services is propor-tionality between the (productive) capital stock and capital services in each type of asset. Thus, the growth rates of capital services can differ from that of capital stock only at the aggregate level. For aggregating different types of capital, the user costs of capital by type of asset should be estimated.
Figure 99 Ex Post Real Rate of Return in Asia, 1970–2011
Source: APO Productivity Database 2013.01.Note: The starting period for Vietnam is 1986.
0
10
20
30
40
50%
%
China
0
10
20
30
40
50Korea
%
0
10
20
30
40
50Philippines
0
10
20
30
40
50
%
%
India
0
10
20
30
40
50
1970 1980 1990 2000 2010
1970 1980 1990 2000 2010
1970 1980 1990 2000 2010
1970 1980 1990 2000 2010
1970 1980 1990 2000 2010
%
0
10
20
30
40
50Thailand
1970 1980 1990 2000 2010
%
0
10
20
30
40
50Mongolia
1970 1980 1990 2000 2010
%
0
10
20
30
40
50Iran
1970 1980 1990 2000 2010
%
0
10
20
30
40
50Japan
1970 1980 1990 2000 2010
%
0
10
20
30
40
50US
1970 1980 1990 2000 2010
0
10
20
30
40
50Singapore
%
1970 1980 1990 2000 2010
%50
0
10
20
30
40
Malaysia
1970 1980 1990 2000 2010
%
0
10
20
30
40
50Indonesia
1970 1980 1990 2000 2010
%
0
10
20
30
40
50ROC
1970 1980 1990 2000 2010
%
0
10
20
30
40
50Fiji
1970 1980 1990 2000 2010
%
0
10
20
30
40
50Hong Kong
1970 1980 1990 2000 2010
%
0
10
20
30
40
50
1970 1980 1990 2000 2010
Pakistan
%
0
10
20
30
40
50
1970 1980 1990 2000 2010
Sri Lanka
Vietnam
©20
13 A
sian
Prod
uctiv
ity O
rgan
izat
ion

130
Appendix
This box outlines the methodology of the user cost of capital estimation and presents the estimated results of endogenous rate of return for Asian countries in the APO Productivity Database 2013.
The user cost of capital of a new asset (with type of asset denoted as k of the period t), ukt,0 , is defined
as qkt−1,0 {rt + (1 + k
t ) kP,t,0 − k
t }, where rt, kP,t,0, and qk
t,0 are the expected nominal rate of return, cross-section depreciation rate, and asset price, respectively. The asset-specific inflation rate k
t is defined as (qkt,0 /
qkt−1,0 −1). The OECD assumes the country-specific ex ante real rate of return r * that is constant for the
whole period, and defines the nominal rate of return as rt = (1 + r *)(1 + ρt) − 1, where ρt represents the expected overall inflation rate, defined by a five-year centered moving average of the rate of change of the CPI (see Schreyer, Bignon, and Dupont, 2003).
One of the main difficulties in applying the ex ante approach for measuring user cost of capital is ob-taining proper estimates for real rates of return, which can differ considerably among countries and over time. On the other hand, the ex post approach originated by Jorgenson and Griliches (1967) al-lows an estimation based on observed data. Assuming constant returns to scale and competitive mar-kets, capital compensation can be derived from the summation of the capital service cost Vk
t for each asset, which is defined as the product of the user cost of capital and the productive capital stock (i.e., Vt = Σk V
kt = Σk u
kt,0 S
kt ). Based on this identity and the n-equations of user cost of capital, the n+1 variables
of ukt,0 and rt are simultaneously determined, using the observed capital compensation Vt as the total
sum of Vkt that is not observable in each asset. Note that the depreciation rate k
P,t,0 is not independent of the estimated rt.
The estimated results of the ex post real rate of return based on rt* = (1 + rt) / (1 + ρt)−1 for 17 Asian countries and the US are shown in Figure 99. Although there are large fluctuations in countries like Thailand, Mongolia, and Vietnam, many Asian countries may exhibit decreasing trends in the (endog-enous) real rate of return, while the US holds a stable rate of around 10%. Table 20 presents the five-year-averages of the estimated rates for ex post real rate of return during 1970–2011. In 2005–2011, the real rate of return ranged from 5.3% for Japan to 21.8% in Indonesia and 27.1% for Iran. Using these ex post estimates, the aggregate capital services are measured in this report. The difference caused by the ex ante and ex post approaches may provide a modest difference in the growth measure of capital services, regardless of the substantial differences in the rates of return and capital compen-sations (Nomura, 2004).
Table 20 Average Ex Post Real Rate of Return in Asia
Unit: Percentage.Source: APO Productivity Database 2013.01.Note: The starting period for Vietnam is 1986.
1970–1974 1975–1979 1980–1984 1985–1989 1990–1994 1995–1999 2000–2004 2005–2011China 21.4 16.6 14.2 13.2 15.1 10.8 12.9 13.7 ROC 30.7 20.9 15.1 19.3 16.6 15.0 17.1 14.1 Fiji 11.3 12.5 5.0 2.6 15.3 7.0 7.2 4.7 Hong Kong 20.1 24.1 17.4 22.5 13.9 11.5 9.4 13.1 India 19.3 21.5 16.7 15.1 12.6 11.4 13.8 13.7 Indonesia 34.3 32.3 30.5 16.1 14.9 18.6 18.1 21.8 Iran 24.7 21.5 9.9 7.8 20.8 13.4 24.2 27.1 Japan 15.4 7.8 6.4 8.7 7.1 4.8 5.1 5.3 Korea 28.2 23.0 12.1 15.5 12.3 8.4 8.0 7.3 Malaysia 27.1 27.6 17.0 14.3 16.0 16.8 17.6 21.3 Mongolia 12.3 14.0 13.6 16.8 −5.5 22.0 −1.0 8.0 Pakistan 19.7 21.8 17.9 21.6 18.0 9.0 10.8 4.8 Philippines 11.2 15.1 11.7 12.5 9.1 13.4 18.6 16.3 Singapore 25.3 17.7 14.5 12.6 14.9 12.4 11.2 16.1 Sri Lanka 24.5 32.9 16.3 10.3 9.8 7.8 9.1 9.6 Thailand 13.9 10.4 4.9 10.6 11.6 10.2 9.2 10.0 Vietnam 10.2 18.9 12.2 14.0 13.2 US 9.7 8.1 5.3 6.8 6.9 9.6 10.1 8.7
©20
13 A
sian
Prod
uctiv
ity O
rgan
izat
ion

131
A.4 Hours Worked
App.
Hours WorkedA.4
Labor volume can be measured in three measurement units: number of persons in employment, number of filled jobs, and hours actually worked. Given the variations in working patterns and em-ployment legislation both over time and across countries, hours worked, if accurately measured, of-fers the most time-consistent and somewhat internationally comparable unit measuring the volume in each of different types of labor. This is the primary underlying reason for the importance of choos-ing hours actually worked in productivity analysis, but in reality, due to the difficulty in accurately es-timating average hours actually worked, it is not always available or comparable across countries. The large variety of data sources, definitions, and methodologies available in estimating these labor mar-ket variables often leads to a fragmentation of labor market statistics of an individual country con-cerned, dubious data quality, and incomparability across countries. Here follows an attempt to outline some of these intricate measuring issues.
Data on labor volume comes from two main statistical surveys on establishment and household, with respective strengths and weaknesses. Establishment surveys are surveys of firms with stratified sam-ple frames by the size of establishments. The concentration of total employment in a relatively small number of establishments means that this sampling strategy is cost effective in delivering high preci-sion labor market estimates with fairly small sampling error. Questionnaires are designed to be close to the concepts used in company administration. This has both strengths and weaknesses. On the one hand, data collected is of high quality and accuracy. On the other hand, changes in legislation and regulation could be a source of instability to the definitions, and in turn of the data collected. Further-more data that companies do not collect for administrative purpose, such as unpaid hours and work-er characteristics, are unavailable. This greatly limits the varieties of labor market data that can be collected through establishments. Employment as measured is necessarily based on jobs rather than on persons employed, as persons holding multiple jobs with different establishments cannot be iden-tified and will be counted more than once. Information on hours is on paid hours rather than hours actually worked. Certain categories of employment, most notably the self-employed, are not covered. Sometimes small firms, informal employment or the public sector are also excluded. As a result of these limitations, labor market data from establishment surveys often requires a raft of adjustments for omissions and definition modifications during the compilation process.
Household-based labor force surveys (LFS), in contrast, have full coverage of the economy, although they sometimes incorporate age or geographic exclusions and may have imperfect coverage of the armed forces and other institutional households. Nonetheless, they provide valuable data on certain employment groups such as the self-employed and unpaid family workers, and on the rate of multi-ple job holding. Employment status in LFS is independently determined and is not subject to the cri-teria used in company records. Most countries follow the International Labour Organization (ILO) definitions. As LFS’ are surveys from the socio-economic perspective, they also provide rich data on worker characteristics that are relevant to productivity analysis. The major weakness of the LFS, how-ever, is data precision. By relying on the recollection of the respondents, their response also depends on perception. Response errors could, therefore, arise from confusion of concepts and imprecise rec-ollection of the respondents concerning work patterns and pay during the reference week. Another source of errors originates from proxy response, which relies on the proxy’s perception and knowl-edge of another household’s member. A high level of proxy responses could, therefore, reduce the reliability of data collected.
The common practice of statistical offices has been to combine information from both establishment and household surveys, with a view to making use of the most reliable aspects of each of the surveys.
©20
13 A
sian
Prod
uctiv
ity O
rgan
izat
ion

132
Appendix
This seems to be the most promising avenue forward in improving the quality and consis-tency of data on labor input. However, statisti-cal offices could still differ a great deal in their methodologies, especially in estimating the annual average hours worked per job/per per-son, depending on their starting points, name-ly LFS data or enterprise data. All these have to be taken into account in international compar-isons of productivity.
In productivity analysis, ideally, labor volume should be quality adjusted in order to reflect workforce heterogeneity, as recommended in the SNA 2008. To adjust total hours worked for quality would require information on worker characteristics so as to distinguish the workforce into different types, which are then weighed by their marginal productivity and approximated by their respective shares of total compensation. Deriving a quality adjusted labor input (QALI) measure is a data-demanding exercise. Even if LFS provides the required information, researchers often run into the consistency issues discussed above, as well as sample size problems as they break down the workforce into fine categories. See Nomura and Amano (2012) as an exercise in this for Singapore.
The APO Productivity Database 2013 defines labor inputs as the simple sum of hours worked. Hours worked are defined in this Data-book as the economy-wide hours worked by employees, the self-employed, and contribut-ing family workers. Japanese and US national accounts publish estimates of the total hours worked. Other Asian countries do not publish hours worked in their national accounts. For these countries the procedure of constructing economy-wide annual hours worked consists of two steps; for many Asian countries first, an average weekly hours worked is obtained and the number of workers collated from official statistics, such as a labor force survey. The data we used is listed in Table 21. Multiplying the average hours worked by the number of workers gives economy-wide averages of weekly hours worked; second, the number of weeks worked is obtained, by counting the number of national holi-days in each country. Multiplying economy-wide average weekly hours worked by the number of
Figure 100 Average Annual Hours Worked Per Worker Relative to the US, 2000–2011
Sources: Official national accounts and labor force survey in each country, including author adjustments.
37
39
39
40
42
45
47
26
30 30
32
34
36 37
4
7
15
20
24
−4 EU15Australia
JapanTurkey
Sri LankaIndonesia
PhilippinesROCIndia
ChinaBangladesh
SingaporeHong Kong
ThailandPakistanVietnamMalaysia
IranKorea
Cambodia
50 %0 5 10 15 20 25 30 35 40 45−5 %
Sources of Labor DataBangladesh Labor Force Survey, Populations Census
Cambodia Socio-Economic Survey, Labor Force Survey
ROCYearbook of Manpower Survey Statistics in Taiwan Area, Taiwan Statistical Data Book
FijiAnnual Employment Survey, Population Census, Estimates by FIBOS (Fiji Islands Bureau of Statistics), Labor Force Survey
Hong KongData download from Census and Statistics Department of Hong Kong Statistics
India Census of India, Employment and Unemployment Survey
Indonesia Labor Force Situation in Indonesia
Iran Population Census, Labor Force Survey
Japan Labor Force Survey, National Accounts
KoreaCensus on Basic Characteristics of Establishment, Economically Active Population Survey, Monthly Labor Survey
Lao PDR Population Census, ADB Key Indicators for Asia and the Pacific
MalaysiaEconomic Report Various issues, Malaysia Economic Statistics-Time Series, Labor Force Survey Report
Mongolia Mongolian Statistical Yearbook
Nepal Population Census
PakistanLabor Force Survey, Pakistan Statistical Yearbook, Pakistan Economic Survey
Philippines Labor Force Survey, Philippines Statistical Yearbook
SingaporeLabor Force Survey, Singapore Yearbook of Manpower Statistics
Sri Lanka Central Bank of Sri Lanka Annual Report, Labor Force Survey
Thailand Labor Force Survey
VietnamEstimates by General Statistics Office, Labor Force and Employment Survey
Table 21 Sources of Labor Data
©20
13 A
sian
Prod
uctiv
ity O
rgan
izat
ion

133
A.5 Other Data
App.
weeks worked gives economy-wide annual hours worked. For Fiji, the Lao PDR, Mongolia, and Nepal, total hours worked are not estimated due to data constraint.
Figure 100 presents a cross-country comparison of average annual hours worked per worker for 2000–2011, relative to the level of the US. It indicates that workers in Asian countries tend to work much longer hours than those in the US and Europe. In many of the countries sampled, the difference in annual hours worked per person relative to the US is more than 20% of the US level. Prolonged working hours are observed in Asian countries regardless of their stage of development, spanning low-income countries such as Bangladesh and Cambodia to high-income countries such as the ROC and Singapore. Exceptions are Japan and Vietnam. Workers in both these countries are likely to work much shorter hours than those in other Asian countries. However, compared with the US and EU15, hours worked by workers in Japan is still about 10% longer.
Other DataA.5
For China, multiple data sources has been used; GDP for the whole economy, industry GDP, final de-mands, employment, and income data are taken from China Statistical Yearbook and China National Income 1952–1995; time-series data of GFCF during 1952–2011 at current and constant prices are con-structed at KEO; the main references for GFCF construction are drawn from Statistics on Investment in Fixed Assets of China 1950–2000, China Statistical Yearbook, and 1987, 1992, 1997, 2002, and 2007 Input–Output Tables of China; and multiple data sources for manufacturing, electrics, and trade data from China’s Customs Statistics are also utilized.99
The data source for EU15 and EU27 is the OECD.Stat (http://stats.oecd.org/). The data for the US, Aus-tralia, and Turkey are taken from the website of the US Bureau of Economic Analysis (http://www.bea.gov), the Australian Bureau of Statistics (http://www.abs.gov.au/), and the Turkish Statistical Institute (http://www.turkstat.gov.tr), respectively.
The exchange rates used in this edition are adjusted rates, called the Analysis of Main Aggregate (UNSD database) rates, in the UNSD National Accounts Main Aggregate Database. The AMA rates co-incide with IMF rates except for some periods in countries with official fixed exchange rates and high inflation, when there could be a serious disparity between real GDP growth and growth converted to US dollars based on IMF rates. In such cases, the AMA adjusts the IMF-based rates by multiplying the growth rate of the GDP deflator relative to the US.
Tax data of member economies are supplemented by the IMF’s Government Finance Statistics. From its tax revenue data, “taxes on goods and services” and “taxes on imports” are used for calculating taxes on products. From its expenditure data, “subsidies” are taken. Data taken from Government Fi-nance Statistics play a key role in adjusting GDP at market prices to GDP at basic prices.
99: Holz (2006) provides a useful reference on Chinese official statistics.
©20
13 A
sian
Prod
uctiv
ity O
rgan
izat
ion

134
Appendix
Industry ClassificationA.6
The concordance between the industry classification used in Chapter 6 and the International Stan-dard Industry Classification of All Economic Activities (ISIC), Rev. 3, is shown in the following table.
ISICRev.3
Databook1st 2nd
A - Agriculture, hunting and forestry 0102
11
Agriculture, hunting and related service activitiesForestry, logging and related service activities
B - Fishing 05 1 Fishing, operation of fish hatcheries and fish farms; service activities incidental to fishing
C - Mining and quarrying 1011
121314
22
222
Mining of coal and lignite; extraction of peatExtraction of crude petroleum and natural gas; service activitiesincidental to oil and gas extraction excluding surveyingMining of uranium and thorium oresMining of metal oresOther mining and quarrying
D - Manufacturing 151617181920
2122232425262728293031323334353637
333333
33333333333333333
3.13.13.23.23.23.3
3.43.43.53.53.53.63.73.83.83.83.83.83.83.83.83.93.9
Manufacture of food products and beveragesManufacture of tobacco productsManufacture of textilesManufacture of wearing apparel; dressing and dyeing of furTanning and dressing of leather; manufacture of luggage, handbags, saddlery, harness and footwearManufacture of wood and of products of wood and cork, except furniture; manufacture of articles of straw and plaiting materialsManufacture of paper and paper productsPublishing, printing and reproduction of recorded mediaManufacture of coke, refined petroleum products and nuclear fuelManufacture of chemicals and chemical productsManufacture of rubber and plastics productsManufacture of other non-metallic mineral productsManufacture of basic metalsManufacture of fabricated metal products, except machinery and equipmentManufacture of machinery and equipment n.e.c.Manufacture of office, accounting and computing machineryManufacture of electrical machinery and apparatus n.e.c.Manufacture of radio, television and communication equipment and apparatusManufacture of medical, precision and optical instruments, watches and clocksManufacture of motor vehicles, trailers and semi-trailersManufacture of other transport equipmentManufacture of furniture; manufacturing n.e.c.Recycling
E - Electricity, gas and water supply 4041
44
Electricity, gas, steam and hot water supplyCollection, purification and distribution of water
F - Construction 45 5 Construction
G - Wholesale and retail trade; repair of motor vehicles, motorcycles and personal and household goods
505152
666
Sale, maintenance and repair of motor vehicles and motorcycles; retail sale of automotive fuelWholesale trade and commission trade, except of motor vehicles and motorcyclesRetail trade, except of motor vehicles and motorcycles; repair of personal and household goods
H - Hotels and restaurants 55 6 Hotels and restaurants
I - Transport, storage and communications
6061626364
77777
Land transport; transport via pipelinesWater transportAir transportSupporting and auxiliary transport activities; activities of travel agenciesPost and telecommunications
J - Financial intermediation 656667
888
Financial intermediation, except insurance and pension fundingInsurance and pension funding, except compulsory social securityActivities auxiliary to financial intermediation
K - Real estate, renting and business activities
7071727374
88888
Real estate activitiesRenting of machinery and equipment without operator and of personal and household goodsComputer and related activitiesResearch and developmentOther business activities
L - Public administration and defence; compulsory social security
75 9 Public administration and defence; compulsory social security
M - Education 80 9 Education
N - Health and social work 85 9 Health and social work
O - Other community, social and personal service activities
90919293
9999
Sewage and refuse disposal, sanitation and similar activitiesActivities of membership organizations n.e.c.Recreational, cultural and sporting activitiesOther service activities
P - Private households with employed persons
95 9 Private households with employed persons
Q - Extra-territorial organizations and bodies
99 9 Extra-territorial organizations and bodies
Note: “n.e.c.” represents “not elsewhere classified.”
Table 22 Industry Classification
©20
13 A
sian
Prod
uctiv
ity O
rgan
izat
ion

135
Ando, Mitsuyo and Fukunari Kimura (2005) “The Formation of International Production and Distribution Networks in East Asia,” in Takatoshi Ito and Andrew K. Ros (eds.) International Trade in East Asia (NBER-East Asia Seminar on Economics, Volume 14), Chicago: The University of Chicago Press, pp. 177–213.
Ando, Mitsuyo and Fukunari Kimura (2013) “From Regional to Global Production Networks: Linkage be-tween Europe and East Asia via CEE,” Journal of Economic Integration, 2013.
Baier, Scott L., Gerald P. Dwyer, and Robert Tamura (2006) “How Important are Capital and Total Factor Productivity for Economic Growth?” Economic Inquiry 44(1), pp. 23–49.
Baldwin, Richard (2011) “21st Century Regionalism: Filling the Gap between 21st Century Trade and 20th Century Trade Rules,” Centre for Economic Policy Research Policy Insight, No. 56 (May).
Bosworth, Barry P. (2005) “Economic Growth in Thailand: The Macroeconomic Context,” paper presented to World Bank project on investment climate, firm competitiveness and growth in Thailand.
Bosworth, Barry P. and Susan M. Collins (2008) “Accounting for Growth: Comparing China and India,” Jour-nal of Economic Perspective 22(1), pp. 45–66.
Caselli, Francesco (2005) “Accounting for Cross-Country Income Differences,” in P. Aghion and S. N. Durlauf (eds.) Handbook of Economic Growth, Amsterdam: North Holland, pp. 679–741.
Cororaton, Caesar B. (2002) “Total Factor Productivity in the Philippines,” Discussion Paper Series 2002–01, Philippine Institute for Development Studies, Makati.
Department of Statistics Malaysia (2012) National Accounts Capital Stock Statistics 2005–2011, December.Diewert, W. Erwin and Denis Lawrence (2006) “Measuring the Contributions of Productivity and Terms of
Trade to Australia’s Economic Welfare,” report by Meyrick and Associates to Australian Government Pro-ductivity Commission, Canberra.
Diewert, W. Erwin and Catherine J. Morrison (1986) “Adjusting Outputs and Productivity Indexes for Changes in the Terms of Trade,” Economic Journal 96(3), pp. 659–679.
Diewert, W. Erwin, Hideyuki Mizobuchi, and Koji Nomura (2005) “On Measuring Japan’s Productivity, 1995–2003,” Department of Economics Discussion Paper Series No. 05–22, December, Vancouver: Univer-sity of British Columbia.
Economist Intelligence Unit (2010) “Country Report: Myanmar, January 2010,” available at http://www.eiu.com/.Eichengreen, B., Donghyun Park, and Kwanho Shin (2011) “When Fast Growing Economies Slow Down:
International Evidence and Implications for China,” NBER Working Paper Series 16919.Fei, J. C. H. and G. Ranis (1964) Development of the Labor Surplus Economy: Theory and Policy, Richard D. Ir-
win, Homewood Illinois.Felipe, Jesus (2013) “Tracking the Middle-Income Trap: What Is It, Who Is in It, and Why? Part 1,” ADB Eco-
nomics Working Paper Series No.306 (March).Gollin, Douglas, Stephen L. Parente, and Richard Rogerson (2004) “Farm Work, Home Work and Interna-
tional Productivity Differences,” Review of Economic Dynamics 7, pp. 827–850. Holz, Carsten A. (2006) “Measuring Chinese Productivity Growth, 1952–2005,” mimeo, Social Science Divi-
sion, Hong Kong University of Science and Technology.IMF (2013) World Economic Outlook, April, Washington D.C., International Monetary Fund.Jones, Ronald W. and Henryk Kierzkowski (1990) “The Role of Services in Production and International
Trade: A Theoretical Framework,” in Ronald W. Jones and Anne O. Krueger (eds.) The Political Economy of International Trade: Essays in Honor of Robert E. Baldwin, Oxford: Basil Blackwell, pp. 31–48.
Jorgenson, Dale W. and Zvi Griliches (1967) “The Explanation of Productivity Change,” Review of Economic Studies 34(3), pp. 249–283.
Jorgenson, Dale W. and Koji Nomura (2005) “The Industry Origins of Japanese Economic Growth,” Journal of Japanese and International Economies 19 (December), pp. 482–542.
Jorgenson, Dale W. and Koji Nomura (2007) “The Industry Origins of the U.S.-Japan Productivity Gap,” Eco-nomic Systems Research 19 (September), pp. 315–341.
Jorgenson, Dale W., Mun S. Ho, and Kevin J. Stiroh (2005) Information Technology and the American Growth Resurgence, Cambridge, MA: MIT Press.
Kohli, Ulrich (2004) “Real GDP, Real Domestic Income and Terms of Trade Changes,” Journal of International Economics 62(1), pp. 83–106.
Kohli, Ulrich (2006) “Real GDP, Real GDI, and Trading Gains: Canada, 1981–2005,” International Productivity Monitor 13, pp. 46–56.
Kuroda, Masahiro, Kazushige Shimpo, Koji Nomura, and Nobuyuki Kobayashi (1997), KEO Database – The Measurement of Output, Capital, and Labor, KEO Monograph Series No. 8, Tokyo: Keio University (in Japanese).
References
©20
13 A
sian
Prod
uctiv
ity O
rgan
izat
ion
References
136
Lewis, W. Arthur (1954) “Economic Development with Unlimited Supplies of Labour,” The Manchester School 22(2), pp. 139–191.
Maddison, Angus (1998) Chinese Economic Performance in the Long Run, Paris: OECD Development Centre.Nomura, Koji (2004) Measurement of Capital and Productivity in Japan, Tokyo: Keio University Press (in Japanese).Nomura, Koji and Tomomichi Amano (2012) “Labor Productivity and Quality Change in Singapore:
Achievements in 1974–2011 and Prospects for the Next Two Decades,” KEO Discussion Paper, No.129.OECD (2001) Measuring Productivity– OECD Manual, Paris: OECD.OECD (2009) Measuring Capital– OECD Manual, 2nd edition, Paris: OECD.OECD (2012) OECD Compendium of Productivity Indicators 2012, December.Ohkawa, Kazushi, Nobukiyo Takamatsu, and Yuzo Yamamoto (1974) Estimates of Long-Term Economic
Statistics of Japan since 1868 Vol. 1, National Income, Tokyo: Toyo Keizai Shinposha (in Japanese).Park, Yung Chul and Kwanho Shin (2009) “Economic Integration and Changes in the Business Cycle in East
Asia: Is the Region Decoupling from the Rest of the World?” Asian Economic Papers 8(1), pp. 107–140.Schreyer, Paul (2002) “Computer Price Indices and International Growth and Productivity Comparisons,” Re-
view of Income and Wealth 48(1), pp. 15–33. Schreyer, Paul, Pierre-Emmanuel Bignon, and Julien Dupont (2003) “OECD Capital Services Estimates:
Methodology and a First Set of Results,” OECD Statistics Working Paper 2003/6, Paris: OECD.Solow, Robert (1957) “Technical Change and the Aggregate Production Function,” Review of Economics and
Statistics 39(3), pp. 312–320. United Nations (1993) System of National Accounts 1993, New York: United Nations. United Nations (2008) International Standard Industrial Classification of all Economic Activities, Revision 4,
Department of Economic and Social Affairs Statistics Division, Statistical Paper series M No.4/Rev.United Nations (2009) System of National Accounts 2008, New York: United Nations. United Nations (2011) World Population Prospects: The 2010 Revision, New York: United Nations.Van der Eng, Pierre (2008) “Capital Formation and Capital Stock in Indonesia, 1950–2007,” Working Papers in
Trade and Development 2008/24, Australian National University, Canberra.Van der Eng, Pierre (2009) “Total Factor Productivity and Economic Growth in Indonesia,” Working Papers in
Trade and Development 2009/01, Australian National University, Canberra.Warr, Peter (2006) “Productivity Growth in Thailand and Indonesia: How Agriculture Contributes to Eco-
nomic Growth,” Working Paper in Economics and Development Studies 2006/06, Padjadjaran University, Bandung.
World Bank (2008) Global Purchasing Power Parities and Real Expenditures: 2005 International Comparison Pro-gram, Washington, DC: World Bank.
World Bank (2011) The Changing Wealth of Nations: Measuring Sustainable Development in the New Mil-lennium, Washington, DC: World Bank.
Young, Alwyn (1995) “The Tyranny of Numbers: Confronting the Statistical Realities of the East Asian Growth Experience,” Quarterly Journal of Economics 110(3), pp. 641–680.
Young, Alwyn (2003) “Gold into Base Metals: Productivity Growth in the People’s Republic of China during the Reform Period,” Journal of Political Economy 111(6), pp. 1220–1261.
Zhang, Jun and Zhu Tian (2013) “Poor Chinese Consumption Data Creates Savings Myth,” World Economics 14(2)(April).
©20
13 A
sian
Prod
uctiv
ity O
rgan
izat
ion