Embed Size (px)
Citation preview

Appendix 4 Draft Dredge
Management Plan – Port

Draft Dredge Management Plan – Port for South of Embley Project
A4-03Contents
Contents
1. INTRODUCTION A4-05
1.1 Commonwealth and State Approvals A4-05
2. DREDGING AND DISPOSAL DESCRIPTION A4-08
2.1 Location and Proposed Volumes of Dredging and Disposal A4-082.2 Dredging Methodology and Equipment A4-082.3 Disposal Management Measures A4-08
3. SEDIMENT CHARACTERISATION A4-10
4. EXISTING ENVIRONMENT A4-11
4.1 Past and Current Uses A4-114.2 Water Quality A4-114.3 Inshore and Offshore Marine Habitats A4-13
5. POTENTIAL IMPACTS A4-16
5.1 Turbidity Plume Generation Modelling A4-165.2 Marine Megafauna and Significant Species A4-195.3 Other Potential Marine Impacts A4-20
6. MANAGEMENT AND MONITORING A4-21
6.1 Water Quality A4-216.2 Coral Health Monitoring A4-236.3 Coral Health Response Procedure A4-236.4 Marine Mammals and Turtles A4-256.5 Marine Pests A4-296.6 Monitoring Programs A4-29
6.6.1 Water Quality A4-29
6.6.2 Coral Health Monitoring A4-33
7. REFERENCES A4-36
A4-04
FIGURES
Figure 1 Port, Spoil Ground and Mooring Locations A4-06Figure 2 Port Layout A4-07Figure 3 Longitudinal Sediment Profile Along Dredging Footprint A4-09Figure 4 Calculated Dredge Time Series Adopted for Mud Transport Model Runs A4-09Figure 5 Turbidity (Converted to TSS) Event Durations During Wet Season,
December 2007 to February 2008 – Boyd Point A4-11Figure 6 Turbidity Events, with Associated PAR, During Wet Season,
December 2007 to March 2008 – Pera Head A4-12Figure 7 Turbidity During the Dry Season, June to September 2010 – Pera Head A4-12Figure 8 Turbidity During the Dry Season, June to March 2010 – Port Area A4-13Figure 9 Reefal Habitat between Boyd Point and Pera Head A4-15Figure 10 TSS Percentage Exceedance Plots for 5 mg/L for Dredge Month 1 Assuming Wet Season
(Summer (Top)) and Dry Season (Winter (Bottom)) Conditions A4-17Figure 11 Average Daily Deposition Rate for the First Month of the Dredging Assuming Wet Season
(Summer (Top)) and Dry Season (Winter (Bottom)) Conditions. A4-18Figure 12 Water Quality (Turbidity) Management Process A4-22Figure 13 Coral Health Management Process A4-24Figure 14 Turtle and Marine Mammal Management Procedure – Dredging A4-27Figure 15 Turtle and Marine Mammal Management Procedure – Spoil Disposal A4-28Figure 16 Proposed Water Quality Monitoring Sites A4-31Figure 17 Median TSS through Dredge month 1 Assuming Summer (Top)
and Winter (Bottom) Conditions A4-32Figure 18 Above Background TSS Concentration Time Series Extract at Pera 1 and Boyd 1 A4-34
TABLES
Table 1 Amended Inshore Reef Areas and Extent of Dominant Benthic Assemblages A4-13Table 2 Schedule for Implementation of Targeted Coral Health Monitoring A4-23Table 3 Proposed Monitoring Programs A4-29
Draft Dredge Management Plan – Port for South of Embley Project
Appendix 4 – Draft Dredge Management Plan – Port A4-05
The South of Embley (SoE) Project involves the construction and operation of a bauxite mine and associated processing and Port facilities to be located near Boyd Point on the western side of Cape York Peninsula. The SoE Project would be developed and operated by RTA Weipa Pty Ltd, which is a wholly-owned subsidiary of Rio Tinto Aluminium Limited. A detailed description of the Project is provided in the SoE Project Environmental Impact Statement (EIS) (RTA 2011).
The SoE Project requires the construction and operation of a new Port facility located between Boyd Point and Pera Head (see Figure 1). The marine works include construction of a jetty, wharf and ship loaders, requiring dredging and disposal for berth pockets and approach/departure channel. The Port site is on RTA mining lease ML7024 and the departure channel extends outside the mining lease into State waters and further into Commonwealth waters. The capital dredge area and volumes required for the Port facility are shown on Figure 2.
The dredging and spoil disposal program will involve the removal and relocation of up to approximately 6,500,000m3 of marine sediments to a proposed offshore spoil ground at the location indicated in Figure 1 over a period of approximately 300 days.
The purpose of this DSDMP is to provide details on the environmental management aspects of the dredging and spoil disposal activities to be undertaken as part of the SoE port development. It details the environmental management and monitoring that will be implemented throughout the dredging and spoil disposal program to be undertaken by RTA as part of the SoE Project.
1.1 Commonwealth and State Approvals
The Project has been declared a “significant project” for which an EIS was required pursuant to section 26(1)(a) of the State Development and Public Works Organisation Act 1971 (Qld) (SDPWO) Act. The Project was declared a controlled action under the Environment Protection and Biodiversity Conservation Act 1999 (Cth) (EPBC Act) on 29th October 2010. As a consequence of this decision, the Project requires approval under the EPBC Act. The Commonwealth has determined an EIS under the EPBC Act is required.
The Commonwealth Environment Protection (Sea Dumping) Act 1981 (Sea Dumping Act) regulates the loading and dumping of spoil from dredging operations in Commonwealth waters. A permit will also be required for loading and disposal of dredged spoil from the Port facility at the proposed new spoil ground located in commonwealth waters.
Section 160 of the EPBC Act requires that Commonwealth agencies seek advice from the Commonwealth minister responsible for the EPBC Act before granting certain authorisations under other Acts. A permit under the Sea Dumping Act to dispose of dredged material at sea is such an authorisation. The EPBC Act has the effect of allowing the Minister to require assessment of the sea dumping application as though it was a controlled action under Part 8 of the Act. In order to avoid duplication of assessment processes and to ensure that all relevant information is considered at once, Department of Sustainability, Environment, Water, Population and Communities (DSEWPaC) has requested that sufficient information be provided in the SoE Project EIS to support the application for a Sea Dumping Permit for capital dredging for the Port facility. RTA submitted an application for a Sea Dumping Permit for the Stage 1 Port facility to DSEWPaC in October 2010 and the EIS was subsequently finalised and placed on exhibition in July 2011.
Detailed sediment characterisation reports have been provided separately to DSEWPaC. An amendment to the Sea Dumping Permit application was submitted to DSEWPaC on 31st October 2011 for the realignment of Stage 1 of the Port. Separate Sea Dumping Permit applications would be sought in the future, if required, for maintenance dredging and Stage 2 of the Port.
Development Approval is required for dredging under the Queensland Coastal Protection and Management Act 1995 and Sustainable Planning Act 2009 (Qld) for the section of the departure channel which is outside the mining lease and inside commonwealth waters.
This DMP supports applications for the Sea Dumping Permit and Development Approvals.
1. INTRODUCTION
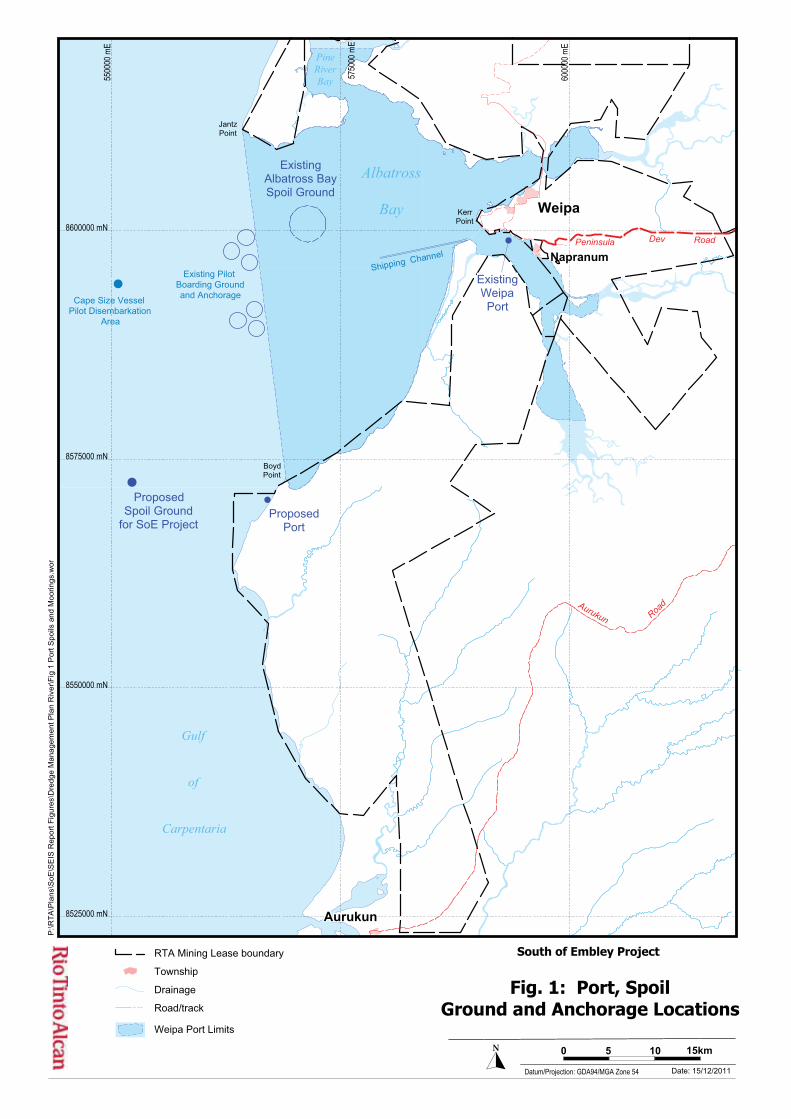
Figure 1 Port, Spoil Ground and Mooring Locations
����������
����������
��������
�������
��������
����������
������������������� ��
�����
������
�������
��
����������� ���
�
��� ����
���������������
�
����� � �
�� �� �� �� �� �� �� �� �� �� �� �� �� �� �� �� �� �� �� �� �� �� �� �� �� �� �� �� �� �� �� �� �� �� �� �� �� �� �� �� �� �� �� �� �� �� �� �� ��
� ��
��
�����������
�������������������������� �����
������ ���
�
���� ����
�
����� ����
�����������
�������� �!����������������������
��������� ������������������������ �������
�
��������"���� �����#��$!��%�����
��
����������� ������ ��
��������������������������������������� � �������!
&' �(������)���!�������
'�*�����
#������
&���+����%
,-&' - ����-���-��.��&�����/�����-#����(����$
��� ����&�0�-/���1� ���������������(�������2*��
� � �� �� �
� ����������������������������������
#��,�13+14+4511
���� ����)�$���
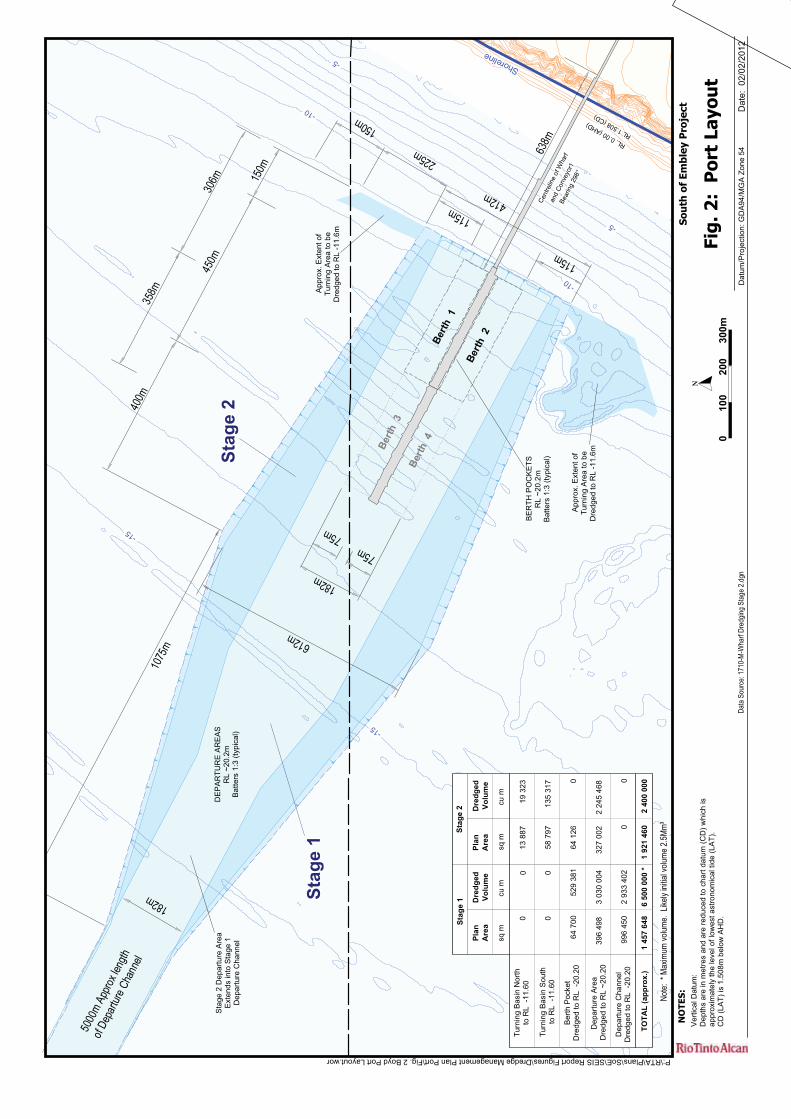
Figure 2 Port Layout
���
���� !
��
���
!��
��� ��
������
!���
����
���
���
���
��
����
���
�������""��
#�$��%�&
�'���
" ������(&
���$
&)2�5255�6 7
#8
&)2�5255�6 7
#8
&)2�5255�6 7
#8
&)2�5255�6 7
#8
&)2�5255�6 7
#8
&)2�5255�6 7
#8
&)2�5255�6 7
#8
&)2�5255�6 7
#8
&)2�5255�6 7
#8
&)2�5255�6 7
#8
&)2�5255�6 7
#8
&)2�5255�6 7
#8
&)2�5255�6 7
#8
&)2�5255�6 7
#8
&)2�5255�6 7
#8
&)2�5255�6 7
#8
&)2�5255�6 7
#8
&)2�5255�6 7
#8
&)2�5255�6 7
#8
&)2�5255�6 7
#8
&)2�5255�6 7
#8
&)2�5255�6 7
#8
&)2�5255�6 7
#8
&)2�5255�6 7
#8
&)2�5255�6 7
#8
&)2�5255�6 7
#8
&)2�5255�6 7
#8
&)2�5255�6 7
#8
&)2�5255�6 7
#8
&)2�5255�6 7
#8
&)2�5255�6 7
#8
&)2�5255�6 7
#8
&)2�5255�6 7
#8
&)2�5255�6 7
#8
&)2�5255�6 7
#8
&)2�5255�6 7
#8
&)2�5255�6 7
#8
&)2�5255�6 7
#8
&)2�5255�6 7
#8
&)2�5255�6 7
#8
&)2�5255�6 7
#8
&)2�5255�6 7
#8
&)2�5255�6 7
#8
&)2�5255�6 7
#8
&)2�5255�6 7
#8
&)2�5255�6 7
#8
&)2�5255�6 7
#8
&)2�5255�6 7
#8
&)2�5255�6 7
#8
�������
���
����
�������
���
����
�������
���
����
�������
���
����
�������
���
����
�������
���
����
�������
���
����
�������
���
����
�������
���
����
�������
���
����
�������
���
����
�������
���
����
�������
���
����
�������
���
����
�������
���
����
�������
���
����
�������
���
����
�������
���
����
�������
���
����
�������
���
����
�������
���
����
�������
���
����
�������
���
����
�������
���
����
�������
�915�
�93�
&)�123
5:�6�#
8
&)�123
5:�6�#
8
&)�123
5:�6�#
8
&)�123
5:�6�#
8
&)�123
5:�6�#
8
&)�123
5:�6�#
8
&)�123
5:�6�#
8
&)�123
5:�6�#
8
&)�123
5:�6�#
8
&)�123
5:�6�#
8
&)�123
5:�6�#
8
&)�123
5:�6�#
8
&)�123
5:�6�#
8
&)�123
5:�6�#
8
&)�123
5:�6�#
8
&)�123
5:�6�#
8
&)�123
5:�6�#
8
&)�123
5:�6�#
8
&)�123
5:�6�#
8
&)�123
5:�6�#
8
&)�123
5:�6�#
8
&)�123
5:�6�#
8
&)�123
5:�6�#
8
&)�123
5:�6�#
8
&)�123
5:�6�#
8
&)�123
5:�6�#
8
&)�123
5:�6�#
8
&)�123
5:�6�#
8
&)�123
5:�6�#
8
&)�123
5:�6�#
8
&)�123
5:�6�#
8
&)�123
5:�6�#
8
&)�123
5:�6�#
8
&)�123
5:�6�#
8
&)�123
5:�6�#
8
&)�123
5:�6�#
8
&)�123
5:�6�#
8
&)�123
5:�6�#
8
&)�123
5:�6�#
8
&)�123
5:�6�#
8
&)�123
5:�6�#
8
&)�123
5:�6�#
8
&)�123
5:�6�#
8
&)�123
5:�6�#
8
&)�123
5:�6�#
8
&)�123
5:�6�#
8
&)�123
5:�6�#
8
&)�123
5:�6�#
8
&)�123
5:�6�#
8
�����2���������
'������� ������!
#��������&)�9112;$
���������������
���������������
���������������
���������������
���������������
���������������
���������������
���������������
���������������
���������������
���������������
���������������
���������������
���������������
���������������
���������������
���������������
���������������
���������������
���������������
���������������
���������������
���������������
���������������
���������������
���������������
���������������
���������������
���������������
���������������
���������������
���������������
���������������
���������������
���������������
���������������
���������������
���������������
���������������
���������������
���������������
���������������
���������������
���������������
���������������
���������������
���������������
���������������
���������������
�������0���1
�������0���1
�������0���1
�������0���1
�������0���1
�������0���1
�������0���1
�������0���1
�������0���1
�������0���1
�������0���1
�������0���1
�������0���1
�������0���1
�������0���1
�������0���1
�������0���1
�������0���1
�������0���1
�������0���1
�������0���1
�������0���1
�������0���1
�������0���1
�������0���1
�������0���1
�������0���1
�������0���1
�������0���1
�������0���1
�������0���1
�������0���1
�������0���1
�������0���1
�������0���1
�������0���1
�������0���1
�������0���1
�������0���1
�������0���1
�������0���1
�������0���1
�������0���1
�������0���1
�������0���1
�������0���1
�������0���1
�������0���1
�������0���1
�������4<:=
�������4<:=
�������4<:=
�������4<:=
�������4<:=
�������4<:=
�������4<:=
�������4<:=
�������4<:=
�������4<:=
�������4<:=
�������4<:=
�������4<:=
�������4<:=
�������4<:=
�������4<:=
�������4<:=
�������4<:=
�������4<:=
�������4<:=
�������4<:=
�������4<:=
�������4<:=
�������4<:=
�������4<:=
�������4<:=
�������4<:=
�������4<:=
�������4<:=
�������4<:=
�������4<:=
�������4<:=
�������4<:=
�������4<:=
�������4<:=
�������4<:=
�������4<:=
�������4<:=
�������4<:=
�������4<:=
�������4<:=
�������4<:=
�������4<:=
�������4<:=
�������4<:=
�������4<:=
�������4<:=
�������4<:=
�������4<:=
�����
���
�915�
�93�
�����
���
����
���
����
���
����
���
����
���
����
���
����
���
����
���
����
���
����
���
����
���
����
���
����
���
����
���
����
���
����
���
����
���
����
���
����
���
����
���
����
���
����
���
����
���
����
���
����
���
����
���
����
���
����
���
����
���
����
���
����
���
����
���
����
���
����
���
����
���
����
���
����
���
����
���
����
���
����
���
����
���
����
���
����
���
����
���
����
���
����
���
����
���
����
���
����
���
����
���
�����
�����
������
��&'7� >���'�
&)�?4524$
�������1,@�6�������8
�����2���������
'������� ������!
#��������&)�9112;$
�913�
�913�
#� &'A&�� &� �
&)�?4524$
�������1,@�6�������8
����
���
����
���
����
���
����
���
����
���
����
���
����
���
����
���
����
���
����
���
����
���
����
���
����
���
����
���
����
���
����
���
����
���
����
���
����
���
����
���
����
���
����
���
����
���
����
���
����
���
����
���
����
���
����
���
����
���
����
���
����
���
����
���
����
���
����
���
����
���
����
���
����
���
����
���
����
���
����
���
����
���
����
���
����
���
����
���
����
���
����
���
����
���
����
���
����
���
�����4�#������� ��
�����������������1
#�������������
���������
�� �
����� ��
�����"�������� �
����
�
,-&' - ����-���-��.��&�����/�����-#����(����$��� ���� ���-/��2�4������ ����)�����2*��
� � �)�
������ � �*�*
+& �'����,%��
%�)� %
���-,%
�
#$%
��"�������#���$
,#�����������$������������������������������$�6�#8�*�������
�������$���������0�������*����������$���������6) '82
�#�6) '8����1235:$�!��*� 7#2
����
���
����
����
��� ��
�$
1@�::B
3:�B<B
1<�@4@
1@3�@1B
�����
����
���
����
����
�
@4B�554
;C�14; 5
5
4�4C3�C;: 5
�����
����
���
���$
���
����
�D�$
34<�@:1
@�5@5�55C
4�<@@�C545 5
�� �
���!
�"#
"�$�%���
��&'(
55
����
)�!�
*!���
����
��+
'�������������E����
���&)��9112;5
���
����
'������������������
���&)��9112;5
�D�$
����
���
<<;�C35
����� ��%�
#��������&)��945245
#������� ���
#��������&)�?45245
#�������������
#��������&)��945245
@<;�C<:
;C�B55
#��,��54+54+4514
#���$
+ ��������,��# <C+(� �F���3C
�����
��.�� #����
�/�$��
�-��0�1�$2������ $�/�$�
����-
���3
A4-08
2.1 Location and Proposed Volumes of
Dredging and Disposal
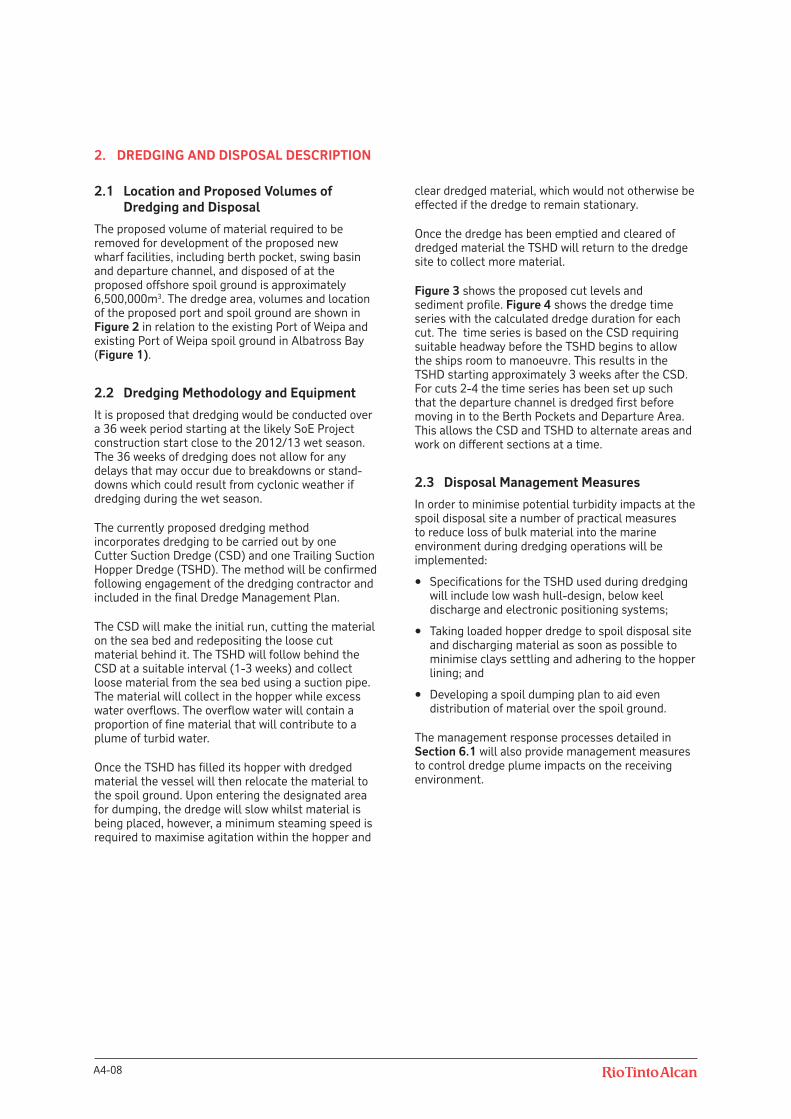
The proposed volume of material required to be removed for development of the proposed new wharf facilities, including berth pocket, swing basin and departure channel, and disposed of at the proposed offshore spoil ground is approximately 6,500,000m3. The dredge area, volumes and location of the proposed port and spoil ground are shown in Figure 2 in relation to the existing Port of Weipa and existing Port of Weipa spoil ground in Albatross Bay (Figure 1).
2.2 Dredging Methodology and Equipment
It is proposed that dredging would be conducted over a 36 week period starting at the likely SoE Project construction start close to the 2012/13 wet season. The 36 weeks of dredging does not allow for any delays that may occur due to breakdowns or stand-downs which could result from cyclonic weather if dredging during the wet season.
The currently proposed dredging method incorporates dredging to be carried out by one Cutter Suction Dredge (CSD) and one Trailing Suction Hopper Dredge (TSHD). The method will be confirmed following engagement of the dredging contractor and included in the final Dredge Management Plan.
The CSD will make the initial run, cutting the material on the sea bed and redepositing the loose cut material behind it. The TSHD will follow behind the CSD at a suitable interval (1-3 weeks) and collect loose material from the sea bed using a suction pipe. The material will collect in the hopper while excess water overflows. The overflow water will contain a proportion of fine material that will contribute to a plume of turbid water.
Once the TSHD has filled its hopper with dredged material the vessel will then relocate the material to the spoil ground. Upon entering the designated area for dumping, the dredge will slow whilst material is being placed, however, a minimum steaming speed is required to maximise agitation within the hopper and
clear dredged material, which would not otherwise be effected if the dredge to remain stationary.
Once the dredge has been emptied and cleared of dredged material the TSHD will return to the dredge site to collect more material.
Figure 3 shows the proposed cut levels and sediment profile. Figure 4 shows the dredge time series with the calculated dredge duration for each cut. The time series is based on the CSD requiring suitable headway before the TSHD begins to allow the ships room to manoeuvre. This results in the TSHD starting approximately 3 weeks after the CSD. For cuts 2-4 the time series has been set up such that the departure channel is dredged first before moving in to the Berth Pockets and Departure Area. This allows the CSD and TSHD to alternate areas and work on different sections at a time.
2.3 Disposal Management Measures
In order to minimise potential turbidity impacts at the spoil disposal site a number of practical measures to reduce loss of bulk material into the marine environment during dredging operations will be implemented:
Specifications for the TSHD used during dredging will include low wash hull-design, below keel discharge and electronic positioning systems;
Taking loaded hopper dredge to spoil disposal site and discharging material as soon as possible to minimise clays settling and adhering to the hopper lining; and
Developing a spoil dumping plan to aid even distribution of material over the spoil ground.
The management response processes detailed in Section 6.1 will also provide management measures to control dredge plume impacts on the receiving environment.
2. DREDGING AND DISPOSAL DESCRIPTION
A4-09
Draft Dredge Management Plan – Port for South of Embley Project
Appendix 4 – Draft Dredge Management Plan – Port
Figure 3 Longitudinal Sediment Profile Along Dredging Footprint
Original seabed depth
Silt-clay interface
Post-dredging depth
Sandy clay
Siltstone
De
pth
(m
LA
T)
7km 6km 5km 4km 3km 2km 1km 0
Distance from cliff
0
-5
-10
-15
-20
Sea level
Figure 4 Calculated Dredge Time Series Adopted for Mud Transport Model Runs
Period 1 Period 2 Period 3 Period 4 Period 5 Period 6 Period 7
CSD
TSHD
Time Intervals adopted for analysis
CSD (Cut 1 - Marine Sediment plus Sandy Clay) - Inshore
TSHD (Cut 1 - Marine Sediment plus Sandy Clay) - Inshore
CSD (Cut 2 - Sandy Clay) - Offshore
TSHD (Cut 2 - Sandy Clay) - Offshore
CSD (Cut 2 - Sandy Clay) - Inshore
TSHD (Cut 2 - Sandy Clay) - Inshore
CSD (Cut 3 - Siltstone) - Offshore
TSHD (Cut 3 - Siltstone) - Offshore
CSD (Cut 3 - Siltstone) - Inshore
TSHD (Cut 3 - Siltstone) - Inshore
CSD (Cut 4 - Siltstone) - Offshore
TSHD (Cut 4 - Siltstone) - Offshore
CSD (Cut 4 - Siltstone) - Inshore
TSHD (Cut 4 - Siltstone) - InshoreDre
dg
e S
tag
e
0 4 8 12 16 20 24 28 32 36
Assumed Time Series for Dredge Modelling
Week
A4-10
The sediment sampling and analyses completed at the Port facility location is described in Section 6.5.4 and summarised in Section 22 (EPBC Assessment Report) of the SoE Project EIS and summarised below. The assessment of dredged material is consistent with the assessment guidance described in National Assessment Guidelines for Dredging (NAGD) (Commonwealth of Australia 2009), Annex 2 of the London Protocol, and the Waste Specific Guidelines for Assessment of Dredged Material (IMO 2000).
The chemical and physical characteristics of material to be dredged from the proposed port area and the barge/ferry terminals was assessed, including elutriate and bioavailability. The assessment indicated that all dredge spoil is suitable for unconfined ocean disposal and did not identify any constituents present at levels of environmental concern that would persist in the water column during dredging or sea disposal.
The sediment profile in the proposed port area is shown in Figure 3. Cores from the site showed that it is predominantly a sandy clay layer overlying siltstone with a thin silty-clay surface layer.
3. SEDIMENT CHARACTERISATION
A4-11
Draft Dredge Management Plan – Port for South of Embley Project
Appendix 4 – Draft Dredge Management Plan – Port
Section 6 of the EIS describes the existing physical and biological marine environment, including sediment properties and water quality in the South of Embley project area. This section of the EIS includes all marine components of the project including the proposed port site, the proposed spoil ground offshore of Boyd Point, the existing Albatross Bay spoil ground, the location for the barge and ferry facilities at Hornibrook Point and Humbug Wharf in the Embley River and the location for the proposed barge/ferry terminal at Hey River.
4.1 Past and Current Uses
The port development site between Boyd Point and Pera Head is a remote and undeveloped area and as such there are few potential contaminant sources either from shipping activity or land use. As such it would be expected that there should be no anthropogenic contaminants in the sediments to be dredged and concentrations should represent natural background levels.
4.2 Water Quality
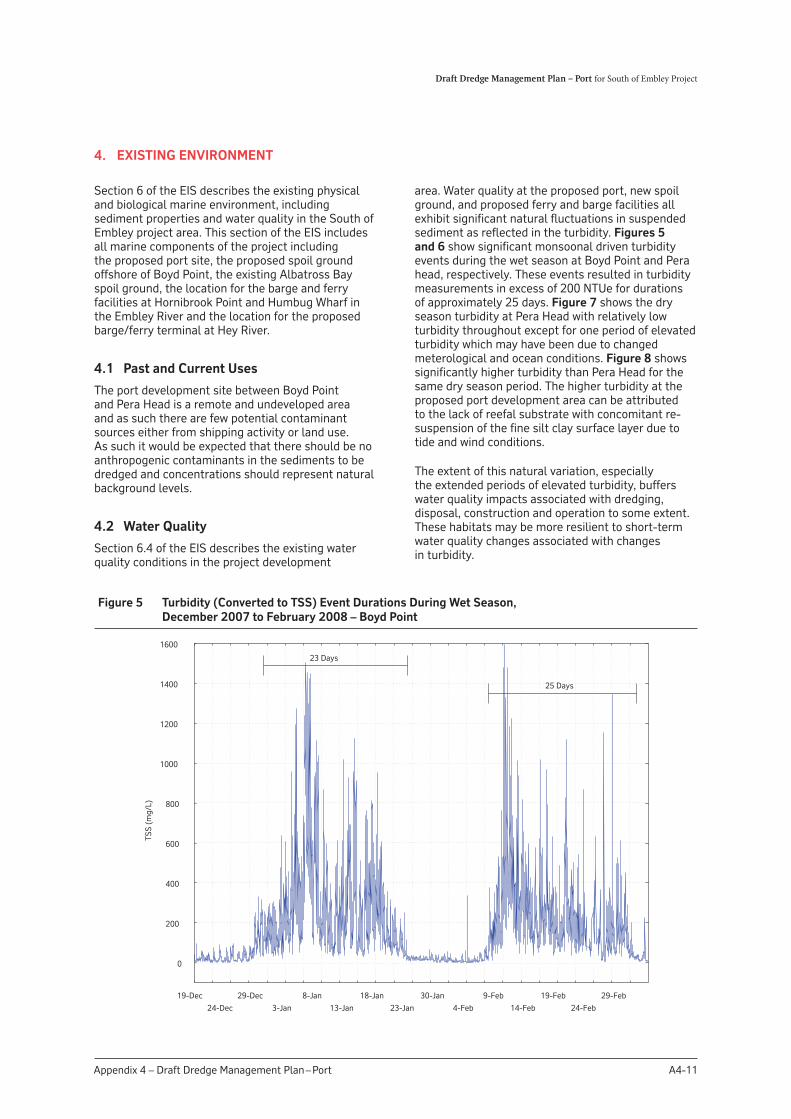
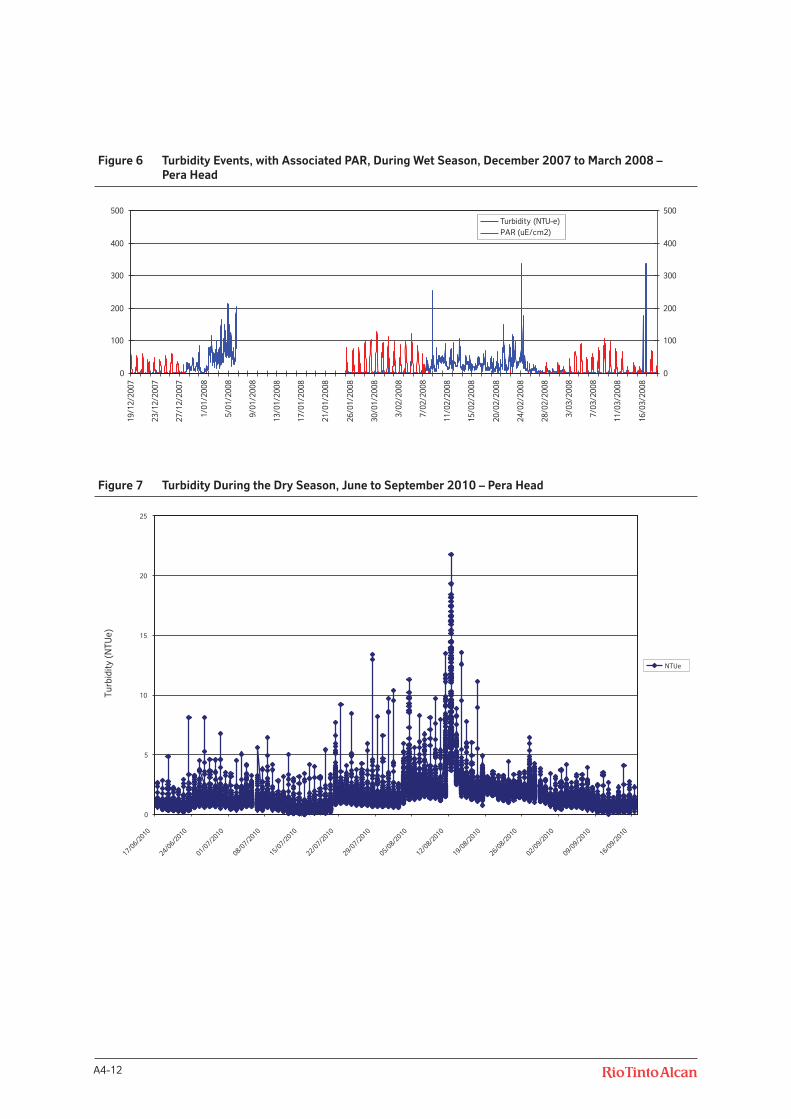
Section 6.4 of the EIS describes the existing water quality conditions in the project development
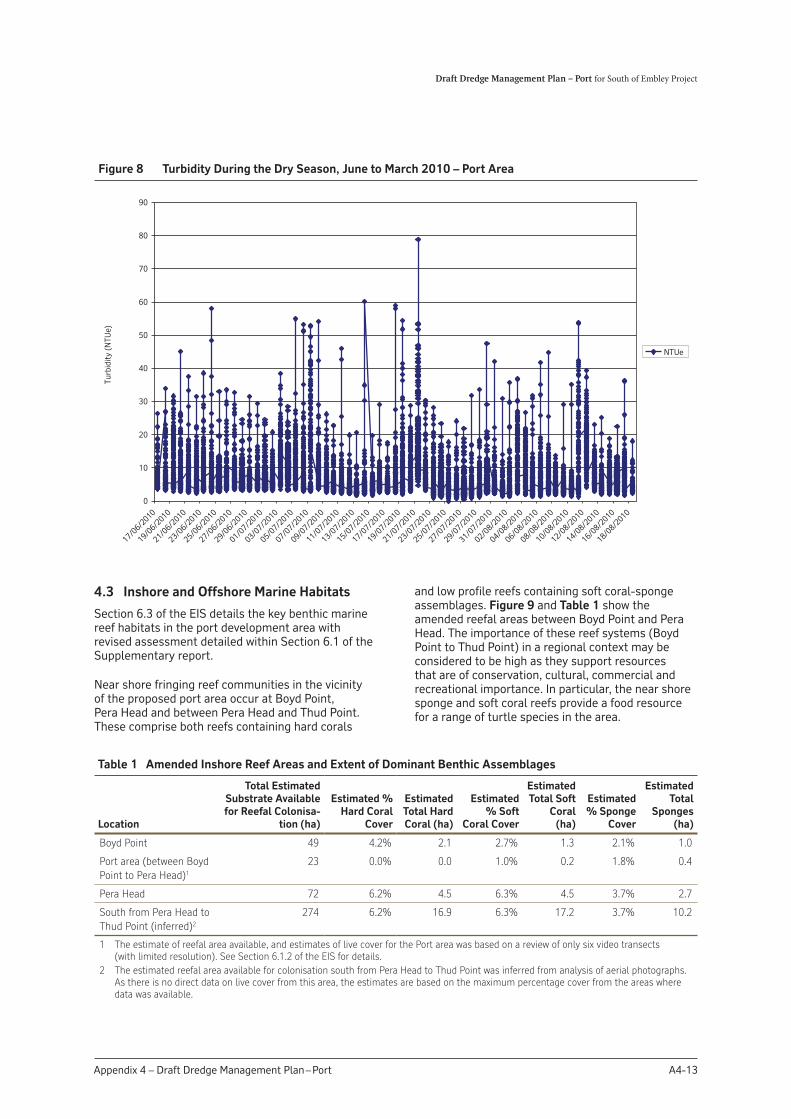
area. Water quality at the proposed port, new spoil ground, and proposed ferry and barge facilities all exhibit significant natural fluctuations in suspended sediment as reflected in the turbidity. Figures 5 and 6 show significant monsoonal driven turbidity events during the wet season at Boyd Point and Pera head, respectively. These events resulted in turbidity measurements in excess of 200 NTUe for durations of approximately 25 days. Figure 7 shows the dry season turbidity at Pera Head with relatively low turbidity throughout except for one period of elevated turbidity which may have been due to changed meterological and ocean conditions. Figure 8 shows significantly higher turbidity than Pera Head for the same dry season period. The higher turbidity at the proposed port development area can be attributed to the lack of reefal substrate with concomitant re-suspension of the fine silt clay surface layer due to tide and wind conditions.
The extent of this natural variation, especially the extended periods of elevated turbidity, buffers water quality impacts associated with dredging, disposal, construction and operation to some extent. These habitats may be more resilient to short-term water quality changes associated with changes in turbidity.
4. EXISTING ENVIRONMENT
Figure 5 Turbidity (Converted to TSS) Event Durations During Wet Season,
December 2007 to February 2008 – Boyd Point
19-Dec
24-Dec
29-Dec
3-Jan
8-Jan
13-Jan
18-Jan
23-Jan
30-Jan
4-Feb
9-Feb
14-Feb
19-Feb
24-Feb
29-Feb
0
200
400
600
800
1000
1200
1400
1600
TSS
(m
g/L)
23 Days
25 Days
A4-12
Figure 7 Turbidity During the Dry Season, June to September 2010 – Pera Head
0
5
10
15
20
25
17/06/2
010
24/06/2
010
01/07/2
010
08/07/2
010
15/07/2
010
22/07/2
010
29/07/2
010
05/08/2
010
12/08/2
010
19/08/2
010
26/08/2
010
02/09/2
010
09/09/2
010
16/09/2
010
Turb
idit
y (N
TUe)
NTUe
Figure 6 Turbidity Events, with Associated PAR, During Wet Season, December 2007 to March 2008 –
Pera Head
0
100
200
300
400
500
19/1
2/20
07
23/1
2/20
07
27/1
2/20
07
1/01
/200
8
5/01
/200
8
9/01
/200
8
13/0
1/20
08
17/0
1/20
08
21/0
1/20
08
26/0
1/20
08
30/0
1/20
08
3/02
/200
8
7/02
/200
8
11/0
2/20
08
15/0
2/20
08
20/0
2/20
08
24/0
2/20
08
28/0
2/20
08
3/03
/200
8
7/03
/200
8
11/0
3/20
08
16/0
3/20
08
0
100
200
300
400
500Turbidity (NTU-e)PAR (uE/cm2)
A4-13
Draft Dredge Management Plan – Port for South of Embley Project
Appendix 4 – Draft Dredge Management Plan – Port
4.3 Inshore and Offshore Marine Habitats
Section 6.3 of the EIS details the key benthic marine reef habitats in the port development area with revised assessment detailed within Section 6.1 of the Supplementary report.
Near shore fringing reef communities in the vicinity of the proposed port area occur at Boyd Point, Pera Head and between Pera Head and Thud Point. These comprise both reefs containing hard corals
and low profile reefs containing soft coral-sponge assemblages. Figure 9 and Table 1 show the amended reefal areas between Boyd Point and Pera Head. The importance of these reef systems (Boyd Point to Thud Point) in a regional context may be considered to be high as they support resources that are of conservation, cultural, commercial and recreational importance. In particular, the near shore sponge and soft coral reefs provide a food resource for a range of turtle species in the area.
Figure 8 Turbidity During the Dry Season, June to March 2010 – Port Area
0
10
20
30
40
50
60
70
80
90
17/06/2
010
19/06/2
010
21/06/2
010
23/06/2
010
25/06/2
010
27/06/2
010
29/06/2
010
01/07/2
010
03/07/2
010
05/07/2
010
07/07/2
010
09/07/2
010
11/07/2
010
13/07/2
010
15/07/2
010
17/07/2
010
19/07/2
010
21/07/2
010
23/07/2
010
25/07/2
010
27/07/2
010
29/07/2
010
31/07/2
010
02/08/2
010
04/08/2
010
06/08/2
010
08/08/2
010
10/08/2
010
12/08/2
010
14/08/2
010
16/08/2
010
18/08/2
010
Turb
idit
y (N
TUe)
NTUe
Table 1 Amended Inshore Reef Areas and Extent of Dominant Benthic Assemblages
Location
Total Estimated
Substrate Available
for Reefal Colonisa-
tion (ha)
Estimated %
Hard Coral
Cover
Estimated
Total Hard
Coral (ha)
Estimated
% Soft
Coral Cover
Estimated
Total Soft
Coral
(ha)
Estimated
% Sponge
Cover
Estimated
Total
Sponges
(ha)
Boyd Point 49 4.2% 2.1 2.7% 1.3 2.1% 1.0
Port area (between Boyd
Point to Pera Head)1
23 0.0% 0.0 1.0% 0.2 1.8% 0.4
Pera Head 72 6.2% 4.5 6.3% 4.5 3.7% 2.7
South from Pera Head to
Thud Point (inferred)2
274 6.2% 16.9 6.3% 17.2 3.7% 10.2
1 The estimate of reefal area available, and estimates of live cover for the Port area was based on a review of only six video transects
(with limited resolution). See Section 6.1.2 of the EIS for details.
2 The estimated reefal area available for colonisation south from Pera Head to Thud Point was inferred from analysis of aerial photographs.
As there is no direct data on live cover from this area, the estimates are based on the maximum percentage cover from the areas where
data was available.

A4-14
The development footprints for the Port facility has been confirmed by field inspection as consisting primarily of soft sediment habitats that contain sparse epifauna typical of soft sediments, such as seapens and tube-dwelling anemones, soft-corals or sponges. These areas can also contain diverse and abundant assemblages of macrobenthic infauna.
Within the vicinity of the Port and spoil disposal ground Nine Mile Reef and the “Three Mile” recreational and charter fishing area are accessed frequently by recreational fishers.
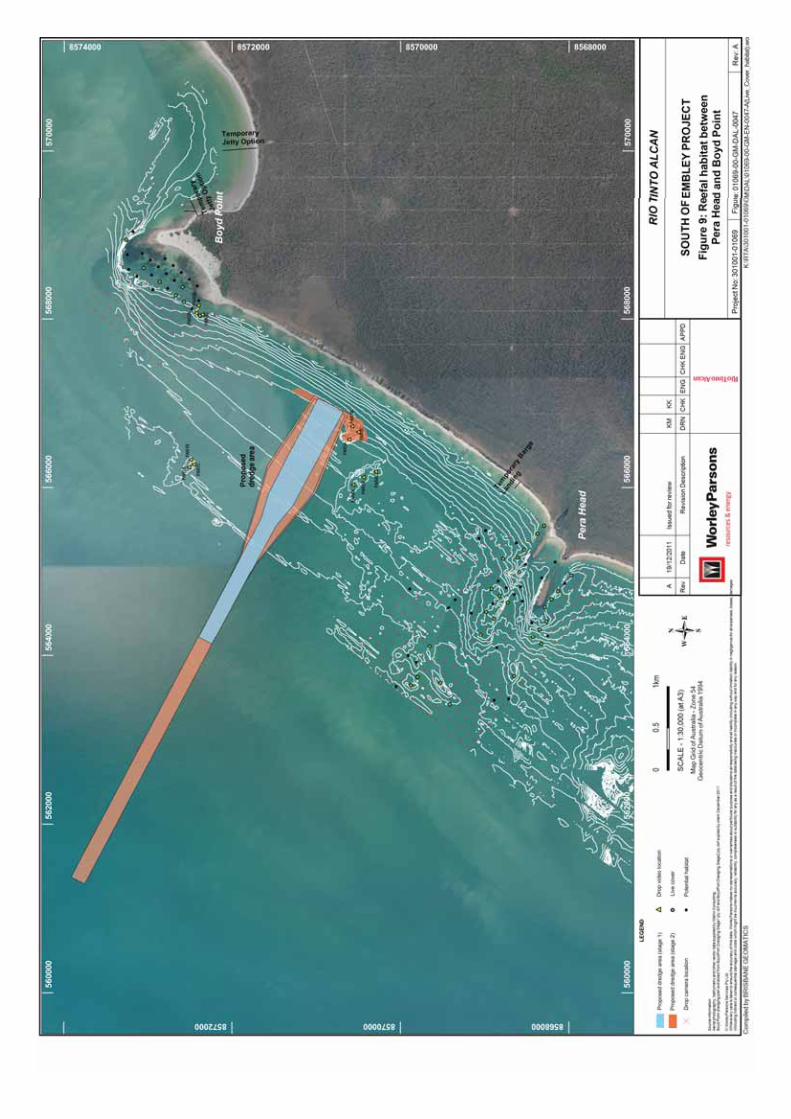
Figure 9 Reefal Habitat between Boyd Point and Pera Head
A4-16
5.1 Turbidity Plume Generation Modelling
At the proposed Port site, a turbid plume would eventuate as material is released to the water column during the dredge operation. The migration and dispersion of turbid plumes during capital dredging at the proposed port area and disposal at the proposed new spoil ground has been predicted through modelling. The details of the modelling and outputs are in Section 6.9 of the EIS.
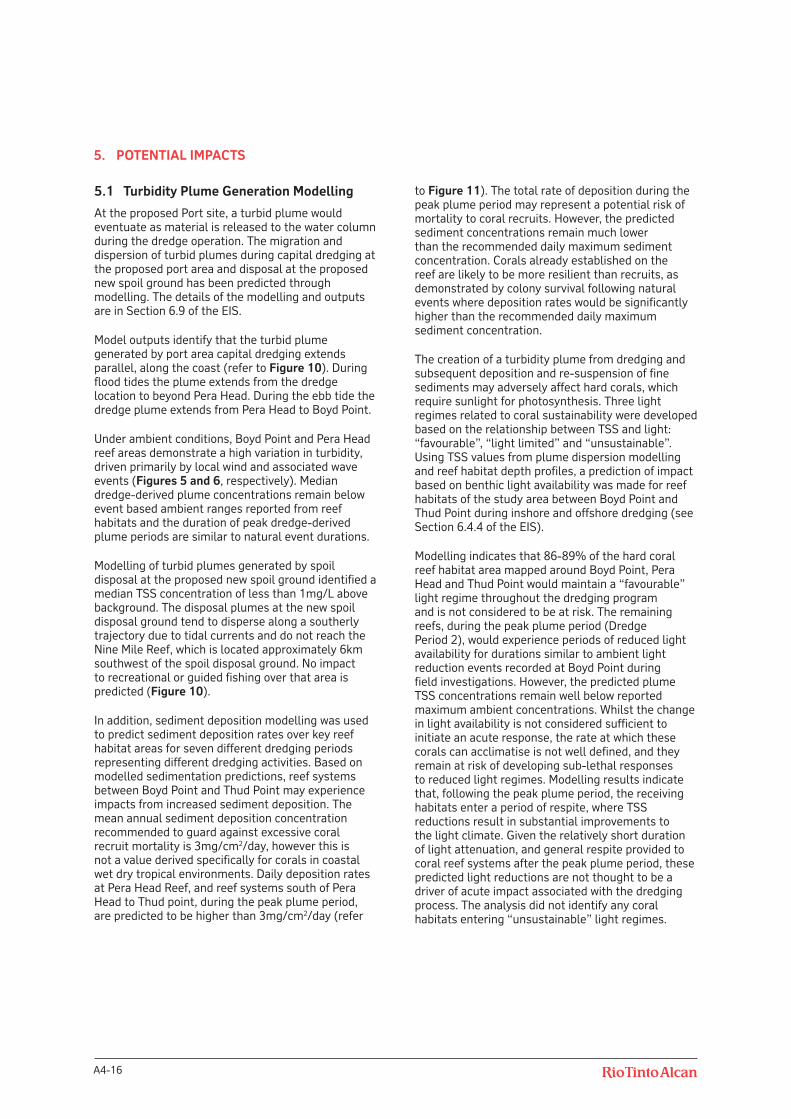
Model outputs identify that the turbid plume generated by port area capital dredging extends parallel, along the coast (refer to Figure 10). During flood tides the plume extends from the dredge location to beyond Pera Head. During the ebb tide the dredge plume extends from Pera Head to Boyd Point.
Under ambient conditions, Boyd Point and Pera Head reef areas demonstrate a high variation in turbidity, driven primarily by local wind and associated wave events (Figures 5 and 6, respectively). Median dredge-derived plume concentrations remain below event based ambient ranges reported from reef habitats and the duration of peak dredge-derived plume periods are similar to natural event durations.
Modelling of turbid plumes generated by spoil disposal at the proposed new spoil ground identified a median TSS concentration of less than 1mg/L above background. The disposal plumes at the new spoil disposal ground tend to disperse along a southerly trajectory due to tidal currents and do not reach the Nine Mile Reef, which is located approximately 6km southwest of the spoil disposal ground. No impact to recreational or guided fishing over that area is predicted (Figure 10).
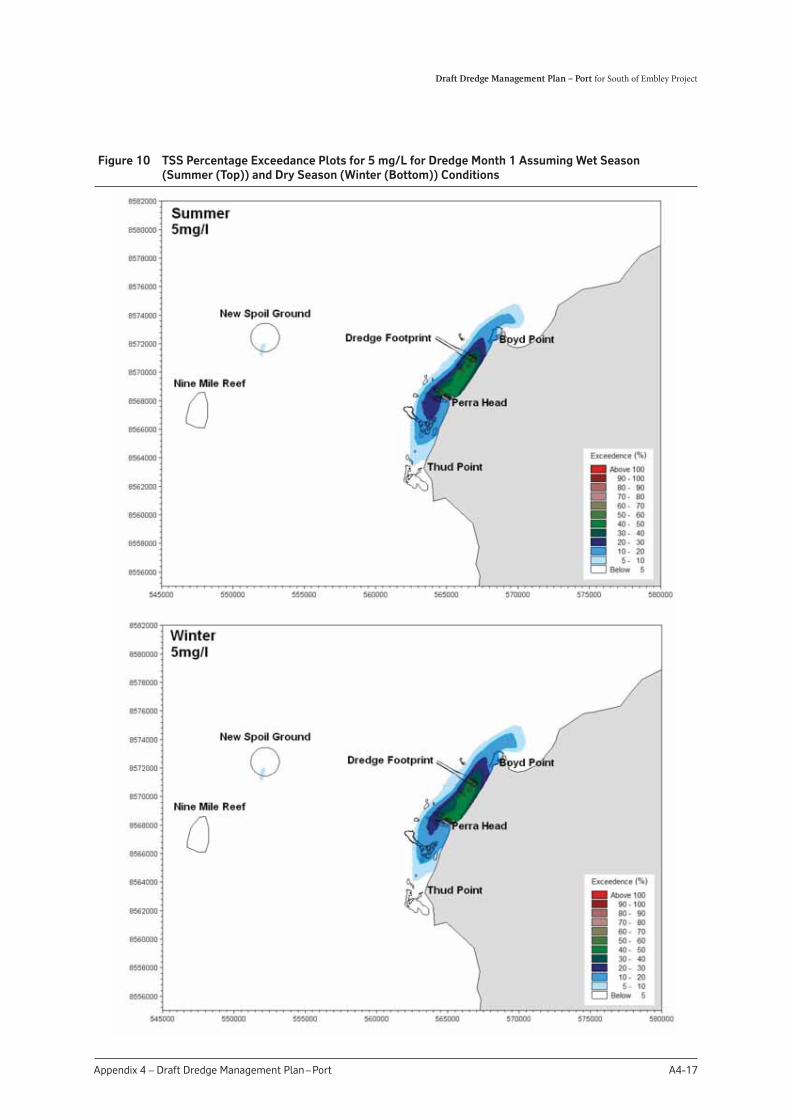
In addition, sediment deposition modelling was used to predict sediment deposition rates over key reef habitat areas for seven different dredging periods representing different dredging activities. Based on modelled sedimentation predictions, reef systems between Boyd Point and Thud Point may experience impacts from increased sediment deposition. The mean annual sediment deposition concentration recommended to guard against excessive coral recruit mortality is 3mg/cm2/day, however this is not a value derived specifically for corals in coastal wet dry tropical environments. Daily deposition rates at Pera Head Reef, and reef systems south of Pera Head to Thud point, during the peak plume period, are predicted to be higher than 3mg/cm2/day (refer
to Figure 11). The total rate of deposition during the peak plume period may represent a potential risk of mortality to coral recruits. However, the predicted sediment concentrations remain much lower than the recommended daily maximum sediment concentration. Corals already established on the reef are likely to be more resilient than recruits, as demonstrated by colony survival following natural events where deposition rates would be significantly higher than the recommended daily maximum sediment concentration.
The creation of a turbidity plume from dredging and subsequent deposition and re-suspension of fine sediments may adversely affect hard corals, which require sunlight for photosynthesis. Three light regimes related to coral sustainability were developed based on the relationship between TSS and light: “favourable”, “light limited” and “unsustainable”. Using TSS values from plume dispersion modelling and reef habitat depth profiles, a prediction of impact based on benthic light availability was made for reef habitats of the study area between Boyd Point and Thud Point during inshore and offshore dredging (see Section 6.4.4 of the EIS).
Modelling indicates that 86-89% of the hard coral reef habitat area mapped around Boyd Point, Pera Head and Thud Point would maintain a “favourable” light regime throughout the dredging program and is not considered to be at risk. The remaining reefs, during the peak plume period (Dredge Period 2), would experience periods of reduced light availability for durations similar to ambient light reduction events recorded at Boyd Point during field investigations. However, the predicted plume TSS concentrations remain well below reported maximum ambient concentrations. Whilst the change in light availability is not considered sufficient to initiate an acute response, the rate at which these corals can acclimatise is not well defined, and they remain at risk of developing sub-lethal responses to reduced light regimes. Modelling results indicate that, following the peak plume period, the receiving habitats enter a period of respite, where TSS reductions result in substantial improvements to the light climate. Given the relatively short duration of light attenuation, and general respite provided to coral reef systems after the peak plume period, these predicted light reductions are not thought to be a driver of acute impact associated with the dredging process. The analysis did not identify any coral habitats entering “unsustainable” light regimes.
5. POTENTIAL IMPACTS
A4-17
Draft Dredge Management Plan – Port for South of Embley Project
Appendix 4 – Draft Dredge Management Plan – Port
Figure 10 TSS Percentage Exceedance Plots for 5 mg/L for Dredge Month 1 Assuming Wet Season
(Summer (Top)) and Dry Season (Winter (Bottom)) Conditions
A4-18
Figure 11 Average Daily Deposition Rate for the First Month of the Dredging Assuming Wet Season
(Summer (Top)) and Dry Season (Winter (Bottom)) Conditions.
A4-19
Draft Dredge Management Plan – Port for South of Embley Project
Appendix 4 – Draft Dredge Management Plan – Port
Physical disturbance from dredging, spoil disposal and marine infrastructure construction, as well as the turbidity plume caused by dredging, may potentially have a local impact on the infauna assemblage at the site of the proposed port facility, the new spoil ground, the barge/ferry terminals and the Albatross Bay spoil ground. However, the soft sediment habitats of the Gulf of Carpentaria are not considered to be sensitive marine habitats. The areas proposed to be impacted by dredging, spoil disposal and construction of marine infrastructure would be extremely small relative to the area of soft sediment habitats in the region, therefore, these impacts pose a low risk on a regional scale. Macrobenthic infaunal assemblages can recover over time from the impacts of dredging and spoil disposal.
Further management and monitoring measures for the impacts from dredge and spoil disposal activities on coral assemblages are provided in Section 6.1.
5.2 Marine Megafauna and Significant
Species
Section 6.6 of the EIS provides a detailed assessment of the threatened and migratory marine species that occur or potentially occur in the project area. Further management and monitoring measures for the impacts to marine mammals and turtles are provided in Section 6.2.
Cetaceans (Whales and Dolphins)A number of dolphin species are known to occur in the Gulf of Carpentaria. These include the Indo-Pacific Humpback Dolphin (Sousa chinensis), inshore (Tursiops aduncus) and offshore (Tursiops truncatus) forms of the Bottlenose Dolphin, and the Australian Snubfin Dolphin (Orcaella heinsohni). The Indo-Pacific Humpback Dolphin and Australian Snubfin Dolphin are listed migratory species under the EPBC Act and Near Threatened under the Nature Conservation Act. These species are known to occur within the Port site and Bottlenose Dolphins are likely to occur at the proposed spoil ground. Bryde’s Whale (Balaenoptera edeni) inhabits inshore tropical waters, so it may occur sporadically in the vicinity of the port area.
The potential for boat strike on Dolphins would be less than for Dugongs and whales overall due to their greater mobility and ability to more quickly respond to disturbances.
DugongsDugongs (listed as “Vulnerable” under the Nature Conservation Act 1992 (Qld) and as a “migratory species” under the EPBC Act) occur in low densities in Albatross Bay and graze on the seagrass beds in the Embley estuary. The absence of seagrass within the footprints of the Port facility indicates the species would only migrate through these areas. Traditional Owners report that the species migrates through Boyd Bay which also indicates migration past the proposed port site. And it is concluded that the species is possible to occur at the spoil ground and may migrate through this area between feeding grounds, however it is more likely that the species would migrate through shallower waters than where the footprint of the proposed spoil ground occurs.
TSHDs are slow moving and as such are considered to not pose a boat strike risk. CSDs are essentially stationary during dredging, and so do not pose a risk to Dugong.
Marine TurtlesThree ‘threatened’ (EPBC Act) sea turtle species are known to nest on the beaches in the vicinity of the Project area and forage in the surrounding waters. Another three ‘threatened’ (EPBC Act) sea turtle species use the Project area waters for foraging. Sea turtle populations are currently adversely impacted by feral pigs (predation of nests) and becoming entrapped in ghost nets.
Areas of sponge/soft coral habitat occur between Boyd Point and Pera Head as detailed in Table 1. It is predicted that sediment deposition from port area capital dredging would be at its greatest between these two locations and may locally affect feeding preferences in marine turtles. It is estimated that a significantly larger area of similar habitat occurs between Pera Head and Thud Point, with more likely to occur at inshore reef areas south of Thud Point and north of Boyd Point, therefore regional impacts to feeding habitats are not predicted.
Changes to the above-water, night-time lighting regime can affect sea turtle hatchlings’ attempts to find water; therefore, lighting from construction and operation of the port may affect sea turtles. Overall, without mitigation, a changed light regime is predicted to pose a high risk to marine turtles. However, proposed programs designed to reduce the primary threats (feral pigs and ghost nets) would minimise overall impacts on local marine turtle nesting activity and increase hatchling emergence. The risk of turtle deaths due to boat strike is low.
A4-20
Fish Assemblages and FisheriesFour species of sawfish of conservation significance are likely to occur in Albatross Bay. Although fish species are able to move away from any local areas affected by a disturbance (e.g. dredging and dredge spoil deposition), physical disturbance to the dredge sites, deposition of spoil, and the re-suspension of disturbed and deposited sediment may have impacts of minor magnitude on sharks and rays, including sawfishes, and bony fishes at the proposed port facility and the proposed new spoil ground.
The Project area is included in the area where the Northern Prawn Fishery (NPF), the Gulf of Carpentaria Commercial Inshore Finfish Fishery and the Gulf of Carpentaria Commercial Line Fishery operate. Recreational fishers and guided fishing tour operators also utilise the Project area including the
“Three Mile” recreational fishing area. There would be a temporary impact on fish assemblages in the vicinity of the Port and spoil ground due to turbidity generated by dredging and disposal of sediment, however following dredging activities, the impacts are anticipated to be minor (Section 6.9.4.5 of the EIS).
5.3 Other Potential Marine Impacts
Marine PestsUnder the DSEWPaC-approved Port of Weipa Long Term Environment Management Plan for Dredging and Dumping Activities (SKM, 2009), the Port of Weipa is considered a low risk port for marine pests and hence there is currently no requirement to undertake a comprehensive marine pest survey of the port.
A4-21
Draft Dredge Management Plan – Port for South of Embley Project
Appendix 4 – Draft Dredge Management Plan – Port
The NQBP Technical Advisory and Consultative Committee (TACC) has been in place for the Port of Weipa for more than 10 years. The TACC would be advised on the capital dredging and spoil disposal activities associated with the Port facility.
6.1 Water Quality
BackgroundThe generation of dredge-induced turbidity plumes generally results from the suspension of fine sedimentary material during construction, dredging and spoil disposal activities. High levels of turbidity limit the light available to coral assemblages. If increased turbidity is of sufficient intensity, duration and/or frequency, the tolerance levels of coral assemblages may be exceeded, resulting in stress and/or mortality.
In order to manage any potential impacts a water quality and coral health monitoring program will be implemented.
Management MeasuresA range of measures can be implemented to manage water quality and impacts to coral assemblages.
General Management MeasuresWhere practicable the following management measures will be implemented throughout dredging and spoil disposal activities:
Use of mechanical devices, such as turbidity-reducing valves within overflow pipes on the TSHD;
Hopper doors will be kept in good condition to minimise loss of sediment during transport;
CSD and TSHD will be equipped with electronic bathymetric charts, loading diagrams and production statistics;
Overflow levels on the TSHD will be raised to the highest point during transit to the spoil disposal areas to minimise spillage of sediment;
Lower fill levels will be used during periods of rough sea-state conditions to minimise loss of sediments during transport to the Spoil Disposal Ground where there is a risk of spillage;
Regular track plots will be provided by the Contractor to demonstrate that no dredging occurs outside the designated areas;
Selection of direct sailing routes to and from the Spoil Disposal Ground to minimise the impact of propeller wash;
Ongoing monitoring of spoil disposal to demonstrate that spoil disposal occurs within the boundaries of the Spoil Disposal Ground;
Current and forecasted meteorological and oceanographic information will be considered in the daily work plan;
Available water quality and coral health data will be considered in the daily work plan;
Accurate positioning systems to be used on dredges to ensure direct impacts are restricted to the approved dredging areas; and
Accurate positioning of vessels to ensure disposal of spoil is within the footprint of the spoil disposal ground.
Responsive Management MeasuresThe following management measures will be considered for dredge and spoil disposal operation. The measures implemented will be contingent on the level of Management Trigger exceedance and will be selected based on the outcome into the investigation of the exceedance.
Dredge-specific Management MeasuresMove the dredge operations and vessels to other areas within the development footprint to reduce potential impacts on the affected corals;
Reduce or cease overflow during periods when the dredge plume is considered likely to lead to further impacts;
Reduce dredging activities from 24 hours a day to a period timed to reduce impacts (e.g. to 12 hours/day or night);
Spoil Ground-specific Management MeasuresOptimisation of the disposal location based on meteorological and ocean conditions and location of affected corals.
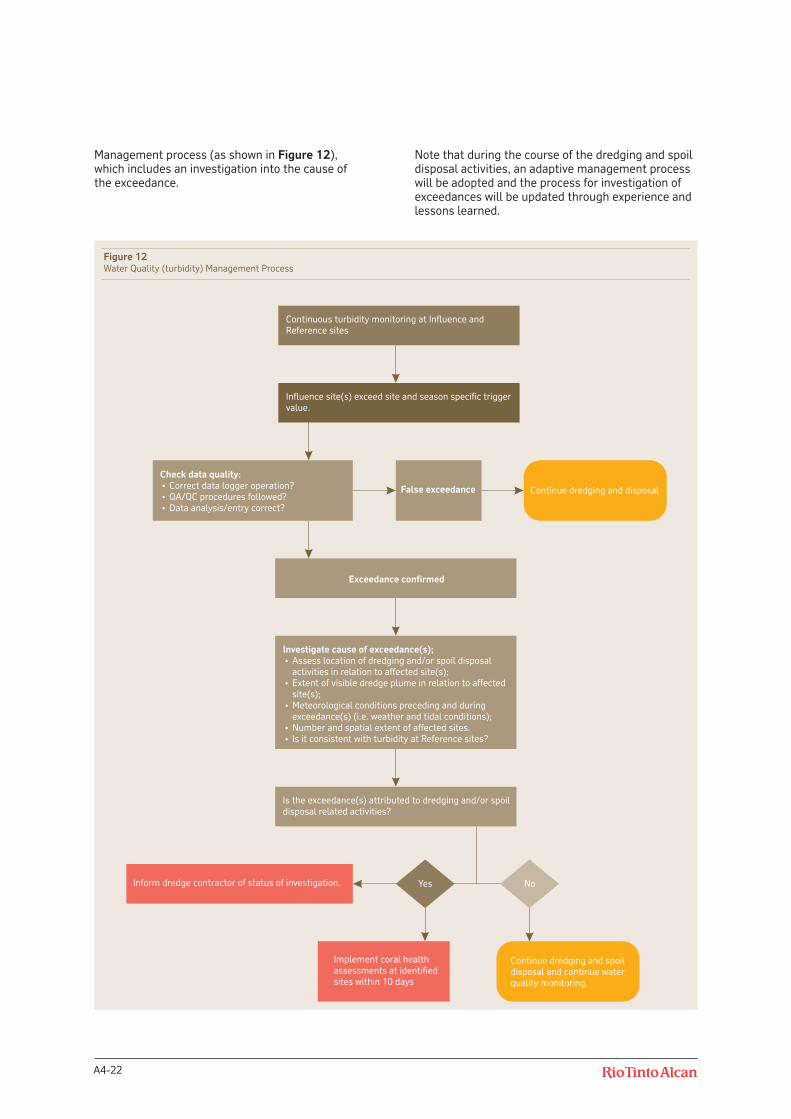
Water Quality MonitoringPrior to the commencement of dredging and spoil disposal activities site and season specific turbidity trigger values will be developed for the Zones of Influence based on wet and dry season baseline data. In ecosystems influenced by strong seasonal or event-scale effects (e.g. cyclones) it is necessary to monitor these seasonal influences and derive trigger values corresponding to the key seasonal periods. In wet- dry tropical areas such as Weipa two trigger values are derived, one for the wet season and another for the dry season (ANZECC/ARMCANZ, 2000).
Water quality monitoring will be undertaken using telemetered loggers measuring turbidity, and this data will be compared against turbidity trigger values for the Zones of Influence. An exceedance of the trigger values from the telemetered loggers will trigger the implementation of the Water Quality
6. MANAGEMENT AND MONITORING
A4-22
Figure 12 Water Quality (Turbidity) Management Process
Figure 12Water Quality (turbidity) Management Process
Continuous turbidity monitoring at Influence and
Reference sites
Influence site(s) exceed site and season specific trigger
value.
Check data quality:
�
�
�
Correct data logger operation?
QA/QC procedures followed?
Data analysis/entry correct?
False exceedance Continue dredging and disposal
Exceedance confirmed
Investigate cause of exceedance(s);
�
�
�
�
�
Assess location of dredging and/or spoil disposal
activities in relation to affected site(s);
Extent of visible dredge plume in relation to affected
site(s);
Meteorological conditions preceding and during
exceedance(s) (i.e. weather and tidal conditions);
Number and spatial extent of affected sites.
Is it consistent with turbidity at Reference sites?
Is the exceedance(s) attributed to dredging and/or spoil
disposal related activities?
Inform dredge contractor of status of investigation.
Implement coral health
assessments at identified
sites within 10 days
Continue dredging and spoil
disposal and continue water
quality monitoring.
Yes No
Management process (as shown in Figure 12), which includes an investigation into the cause of the exceedance.
Note that during the course of the dredging and spoil disposal activities, an adaptive management process will be adopted and the process for investigation of exceedances will be updated through experience and lessons learned.
A4-23
Draft Dredge Management Plan – Port for South of Embley Project
Appendix 4 – Draft Dredge Management Plan – Port
6.2 Coral Health Monitoring
The coral health program combines routine monitoring (Section 6.6.2) and reactive monitoring based on water quality triggers (Section 6.6.1).
Management Trigger LevelsCoral health data will be assessed against the following Management Triggers at the Influence sites:
Level 1: Detectable adverse change in health of coral assemblages.
Level 2: Detectable net mortality of coral.
Key indicators of changes in coral health will include, bleaching, mucus production, sediment deposition and mortality.
Coral Health MonitoringWhere the exceedance of the Turbidity trigger value is found likely to be attributable to dredging and/or spoil disposal activities, coral health monitoring will be carried out at identified sites and Reference sites. Where available, satellite imagery will be used to understand the extent of the dredge and disposal plumes, to support decisions on the location of potential impacts, and identify the Reference sites to be monitored.
The implementation of a targeted coral health monitoring effort in areas where exceedances are detected will allow for sufficient spatial resolution to characterise any changes in coral health.
Timing for the implementation of targeted coral health monitoring is shown in Table 2.
Table 2 Schedule for Implementation of Targeted
Coral Health Monitoring
Timing Activity
0 to 48 hours Determine whether exceedance was likely to be attributable to dredging and/or spoil disposal activities and whether targeted coral health monitoring should be implemented (as per Figure 13)
3 to 10 days Implement targeted coral health monitoring at identified sites if there are no likely alternative explanations for the exceedance other than dredging and/or spoil disposal activities. If the exceedance is significant and ongoing, targeted coral health monitoring will be implemented more rapidly, where practicable
>10 days Conduct a further coral health monitoring survey approximately two weeks after the targeted coral health monitoring.
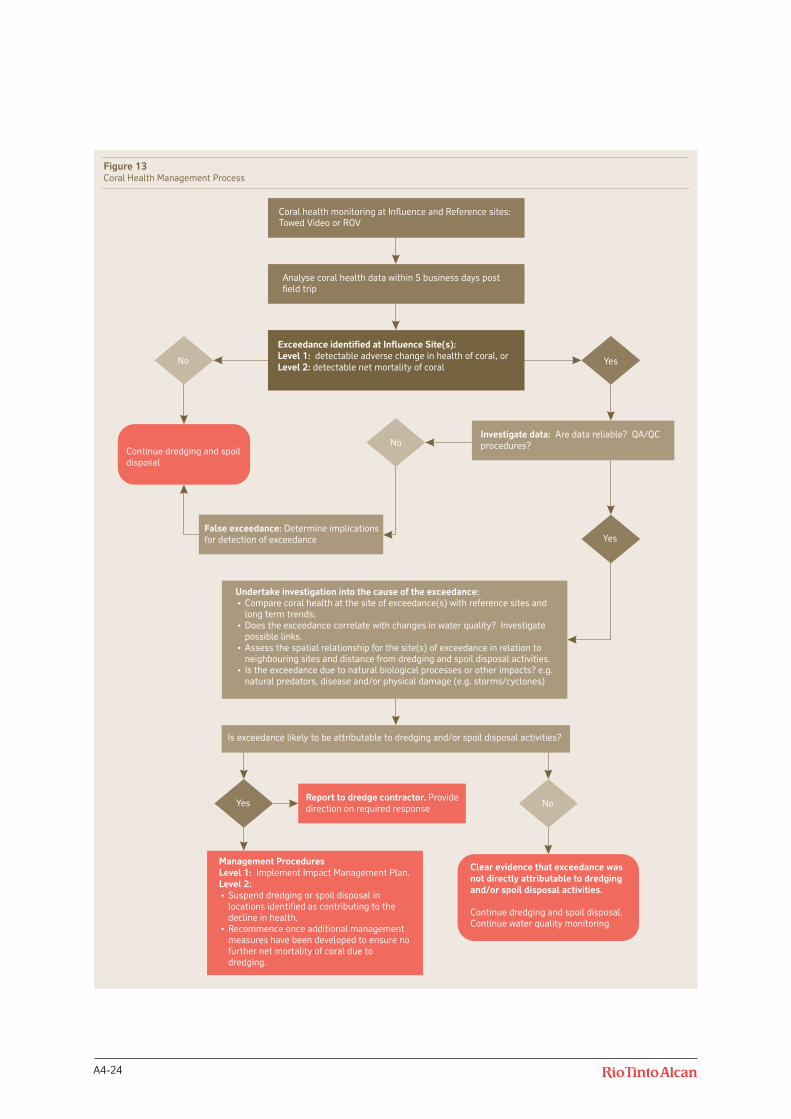
6.3 Coral Health Response Procedure
Reactive ManagementIn the event of an exceedance of a Coral Health Management Trigger, Level 1 or Level 2, the coral health management process as presented in Figure 13 will be implemented. This procedure includes the investigative approach to determine the likely cause of exceedance. As noted for the water quality management process an adaptive management approach will be adopted such that during the course of the dredging and spoil disposal activities, the process for investigation of exceedances may be updated through experience and lessons learned.
A4-24
Figure 13 Coral Health Management Process
Figure 13Coral Health Management Process
Coral health monitoring at Influence and Reference sites:
Towed Video or ROV
Analyse coral health data within 5 business days post
field trip
No
Exceedance identified at Influence Site(s):
Level 1:
Level 2:
detectable adverse change in health of coral, or
detectable net mortality of coralYes
Continue dredging and spoil
disposal
Investigate data: Are data reliable? QA/QC
procedures?No
False exceedance: Determine implications
for detection of exceedance Yes
Undertake investigation into the cause of the exceedance:
� Compare coral health at the site of exceedance(s) with reference sites and
long term trends;
Does the exceedance correlate with changes in water quality? Investigate
possible links.
Assess the spatial relationship for the site(s) of exceedance in relation to
neighbouring sites and distance from dredging and spoil disposal activities.
Is the exceedance due to natural biological processes or other impacts? e.g.
natural predators, disease and/or physical damage (e.g. storms/cyclones)
�
�
�
Is exceedance likely to be attributable to dredging and/or spoil disposal activities?
Yes NoReport to dredge contractor. Provide
direction on required response
Management Procedures
Level 1:
Level 2:
Implement Impact Management Plan.
Suspend dredging or spoil disposal in
locations identified as contributing to the
decline in health.
Recommence once additional management
measures have been developed to ensure no
further net mortality of coral due to
dredging.
�
�
Clear evidence that exceedance was
not directly attributable to dredging
and/or spoil disposal activities.
Continue dredging and spoil disposal.
Continue water quality monitoring
A4-25
Draft Dredge Management Plan – Port for South of Embley Project
Appendix 4 – Draft Dredge Management Plan – Port
Reactive management will be implemented based on the two coral health trigger levels. Where an identified exceedance is attributed to dredging and/or spoil disposal activities the following actions will be implemented for each trigger level:
Level 1
Inform the dredge contractor of the adverse change in coral health;
Undertake further investigations into the cause of the exceedance; and
Identify potential management measures to be implemented if further adverse coral health identified.
Level 2
In the event that net mortality of coral is identified at Influence sites as a result of dredging and/or spoil disposal activities the following management procedure will be implemented:
Notify dredge contractor and suspend dredging and/or spoil disposal activities in locations identified as contributing to the coral mortality within 48 hours;
Implement management measures to ensure no further net mortality of coral due to dredging and/or dredge spoil disposal activities;
Undertake further investigations into the cause of the exceedance, including:
– Identifying the dredging and/or spoil disposal activities and meteorological and ocean conditions that caused the exceedance.
– The results of the most recent coral health monitoring for all Influence and Reference sites.
– The results of the most recent water quality monitoring at Influence and Reference sites.
Dredging and/or spoil disposal activities will recommence once management measure have been implemented and Turbidity trigger values are met at the impacted sites.
Management MeasuresThe management measures that may be implemented should dredging and/or spoil disposal activities result in coral health triggers being exceeded will depend on the extent and nature of the impact and location of the impacted site(s).
Proposed measures that may be applied:
Reduction or cessation of overflow during times when the dredge plume is likely to further impact affected corals;
Optimisation of disposal location based on meteorological and ocean conditions as well as location of affected corals;
A reduction in dredging e.g. 12 hours/day;
Temporary cessation in dredging activities in areas contributing to decline in coral health; and
Move dredging to another location in the development area.
6.4 Marine Mammals and Turtles
BackgroundThe marine fauna of potential concern during dredging and spoil disposal activities are marine turtles and migratory species including Indo-pacific humpback dolphin (Sousa chinensis), Australian snub-fin dolphin (Orcaella heinsohni), Bryde’s whale (Balaenoptera edeni) and dugong (Dugong Dugon). An assessment of “significance of impact” for threatened and migratory fauna likely or known to occur in the Project area is detailed in Section 6.9.5 of EIS.
The objective of the marine mammal and turtle management program is to detect and minimise any avoidable impacts to marine mammals and turtles resulting from the dredging and spoil disposal activities.
Management MeasuresSection 6.9.4 of the EIS provides details of potential impacts on marine fauna and proposed management measures. The following are the range of management measures for identified potential impacts on marine mammals and turtles:
Disturbance from Vessel Activities (Boat Strikes)Prior to the commencement of dredging and spoil disposal activities, selected crew from the dredge vessel will be trained as Marine Fauna Observers (MFOs) in marine turtle and marine mammal behaviour and the actions to be taken in the event of marine fauna sightings, injury or mortality;
During daylight hours, operators of specified vessels will be required to maintain a MFO on watch during marine operations and vessel movements. If marine fauna are spotted, the vessel will adjust speed and direction to avoid impacting the animal, if this is possible;
A log will be maintained on all vessels detailing marine mammal and turtle sightings;
If marine mammals or turtles at risk from construction activities are sighted relevant vessels operating in the area will be notified and the location of marine mammals or turtles will be monitored and recorded where practicable;
A4-26
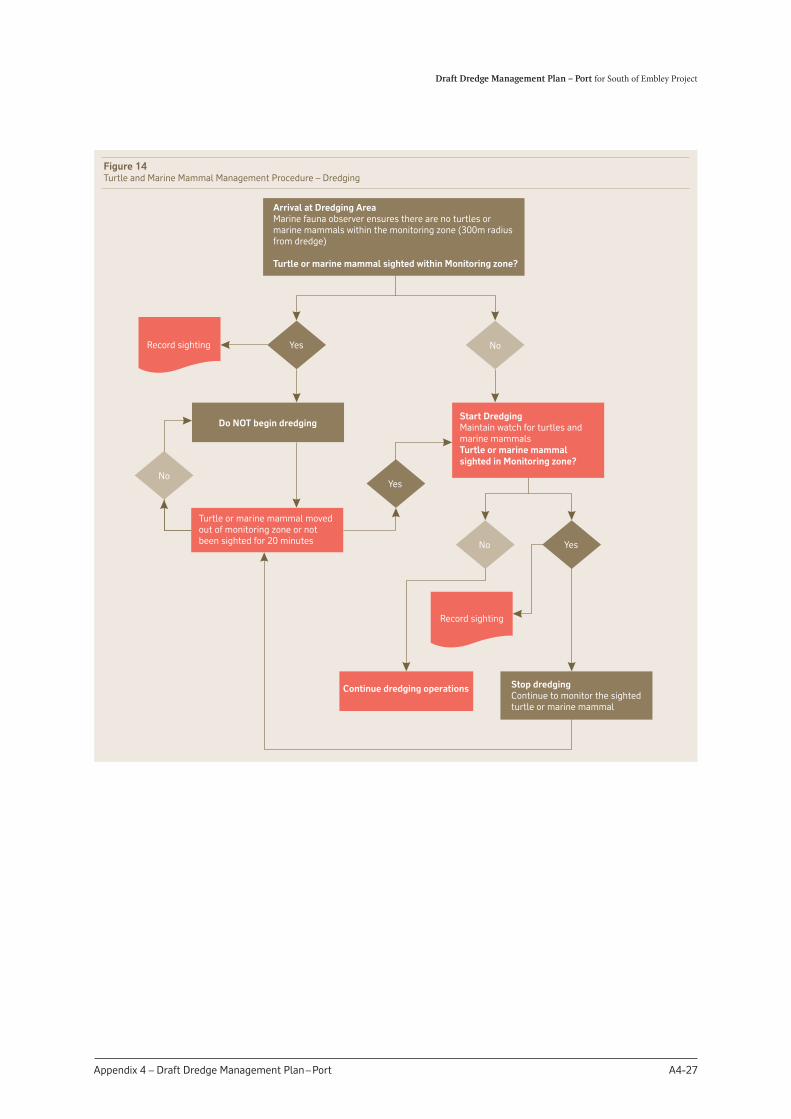
Observation and response procedures, including the application of a monitoring zone (300m radius from the dredge or spoil disposal barge) for specified marine mammals, will be implemented during dredging and spoil disposal activities. The dredging and spoil disposal turtle and marine mammal management procedures flowcharts are shown in Figures 14 and 15, respectively);
A lookout (MFO) will be maintained for marine mammals and turtles while the dredge sails between dredging areas and spoil ground. In the event of a sighting, vessels speed and direction will be adjusted to avoid impacting on the observed marine mammal or turtle, within the safety constraints of the vessel; and
Turtle exclusion devices will be used, where practicable, on the TSHD.
Water QualityWater quality (and therefore its potential impacts on marine turtles and mammals) will be managed through the water quality management process presented in Section 6.1.
Impacts from Artificial LightingRTA has developed and would implement a lighting plan at the port to mitigate the potential effects of lighting on sea turtle hatchlings; and
Light levels from the dredging works will be minimised to those lights that are necessary for the safe operation of the vessels.
Noise and VibrationsAll vessels shall operate in accordance with appropriate industry and equipment noise and vibration standards;
Regular maintenance shall be conducted to the manufacturers’ specifications; and
Where possible, avoid leaving engines, thrusters and auxiliary plants in stand-by or running mode unnecessarily.
A4-27
Draft Dredge Management Plan – Port for South of Embley Project
Appendix 4 – Draft Dredge Management Plan – Port
Figure 14 Turtle and Marine Mammal Management Procedure – Dredging
Figure 14Turtle and Marine Mammal Management Procedure – Dredging
Arrival at Dredging Area
Turtle or marine mammal sighted within Monitoring zone?
Marine fauna observer ensures there are no turtles or
marine mammals within the monitoring zone (300m radius
from dredge)
Do NOT begin dredging
Record sighting Yes No
Start Dredging
Turtle or marine mammal
sighted in Monitoring zone?
Maintain watch for turtles and
marine mammals
Turtle or marine mammal moved
out of monitoring zone or not
been sighted for 20 minutes
Yes
No Yes
Record sighting
Continue dredging operations Stop dredging
Continue to monitor the sighted
turtle or marine mammal
No
A4-28
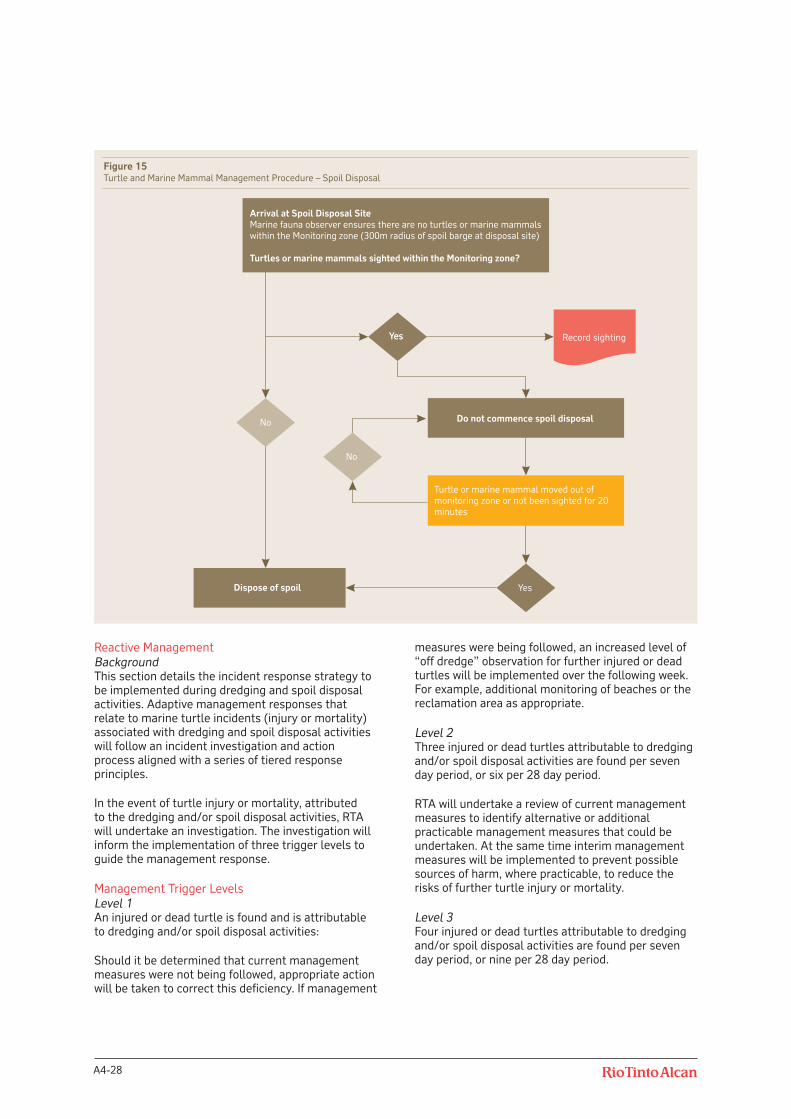
Figure 15 Turtle and Marine Mammal Management Procedure – Spoil Disposal
Figure 15Turtle and Marine Mammal Management Procedure – Spoil Disposal
Arrival at Spoil Disposal Site
Turtles or marine mammals sighted within the Monitoring zone?
Marine fauna observer ensures there are no turtles or marine mammals
within the Monitoring zone (300m radius of spoil barge at disposal site)
Dispose of spoil
Record sightingYesYes
Do not commence spoil disposal
No
Turtle or marine mammal moved out of
monitoring zone or not been sighted for 20
minutes
Yes
No
Reactive ManagementBackgroundThis section details the incident response strategy to be implemented during dredging and spoil disposal activities. Adaptive management responses that relate to marine turtle incidents (injury or mortality) associated with dredging and spoil disposal activities will follow an incident investigation and action process aligned with a series of tiered response principles.
In the event of turtle injury or mortality, attributed to the dredging and/or spoil disposal activities, RTA will undertake an investigation. The investigation will inform the implementation of three trigger levels to guide the management response.
Management Trigger LevelsLevel 1An injured or dead turtle is found and is attributable to dredging and/or spoil disposal activities:
Should it be determined that current management measures were not being followed, appropriate action will be taken to correct this deficiency. If management
measures were being followed, an increased level of “off dredge” observation for further injured or dead turtles will be implemented over the following week. For example, additional monitoring of beaches or the reclamation area as appropriate.
Level 2Three injured or dead turtles attributable to dredging and/or spoil disposal activities are found per seven day period, or six per 28 day period.
RTA will undertake a review of current management measures to identify alternative or additional practicable management measures that could be undertaken. At the same time interim management measures will be implemented to prevent possible sources of harm, where practicable, to reduce the risks of further turtle injury or mortality.
Level 3Four injured or dead turtles attributable to dredging and/or spoil disposal activities are found per seven day period, or nine per 28 day period.
A4-29
Draft Dredge Management Plan – Port for South of Embley Project
Appendix 4 – Draft Dredge Management Plan – Port
Immediate action will be taken to implement alternative and/or additional management measures to prevent likely sources of harm, including temporary relocation or suspension of activities. A review of management measures will be undertaken by RTA to identify longer-term alternative or additional management measures to reduce the risks of further turtle injury or mortality.
Following the implementation of management action or actions associated with an event, the effectiveness of the process and actions taken shall be reviewed periodically. The results of the review will guide adaptive management decisions and further actions as required.
6.5 Marine Pests
Consistent with the low risk rating, limited routine monitoring is undertaken at the Port of Weipa. Larval monitoring plates are deployed at three sites (Evans Landing, and Lorim Point Wharf east and west). These traps are retrieved and checked every three months and no pest species have been identified to date. RTA proposes to deploy similar larval plates at two locations along the Project jetty. They would be retrieved and checked for introduced marine pest larvae every three months.
In the event of a pest incursion during either dredging or operations, RTA would advise Biosecurity Queensland immediately and work with them in planning and implementing a response. The nature of the response would be determined largely by the type of organism and its lifecycle, substrate affected and extent of incursion.
6.6 Monitoring Programs
The receiving habitat monitoring programs incorporate both routine and reactive monitoring components to support the management measures in Section 6.1. The reactive monitoring provides a risk based approach to management of the dredging and spoil disposal activities.
The monitoring programs are designed to provide timely information to minimise potential impacts to receiving habitats. These habitats include near shore reefal habitats between Boyd Point and Thud Point and offshore habitats at Nine Mile Reef.
The monitoring program applies sub lethal indicators which allow management processes to be implemented in order to prevent more substantial impacts occurring. This approach minimises delays in dredging and construction schedules and minimises environmental impact.
The proposed monitoring program is summarised in Table 3.
6.6.1 Water Quality
The objective of the water quality monitoring program is to provide continuous water quality data to assist in the management of the dredging and spoil disposal activities. Information on water quality at Influence and Reference Sites will be collected to:
Monitor the intensity, temporal and spatial extent of increases in turbidity in relation to predicted plumes;
Reactively manage the risk of impacts to coral in the Zones of Influence from increases in turbidity;
Use water quality as an “early warning indicator” of potential impacts on coral health;
Demonstrate that Turbidity trigger Criteria have been met to allow for the recommencement of dredging and/or spoil disposal activities in the event of a Level 2 Coral Health Management Trigger; and
To provide context to the coral health monitoring program; the appropriateness of coral health Reference Sites will be validated with this information. A key assumption for coral health Reference Sites is that they will not be impacted by increased turbidity or sediment deposition from dredging and spoil disposal activities.
Table 3 Proposed Monitoring Programs
Monitoring Program Pre-Dredge
Dredge Period Post Dredge
P1 P2 P3 P4 P5 P6 P7 1 month 2 month
Water quality loggers Turbidity X X X X X X X X X
Coral Health X X X X X X X X
A4-30
Water Quality Criteria in the Zones of InfluenceWater quality within the Zones of Influence is predicted, by dredge plume modelling, to remain within acceptable limits; consequently, no net loss of coral is anticipated within these Zones. Initial site and season specific Turbidity trigger values will be developed for the Zones of Influence based on the background water quality data collected during the Wet (December 2007 to March 2008) and Dry (June 2010 to August 2010) seasons. Over 5,000 and 13,000 data points were captured for the wet and dry seasons, respectively. The trigger values will be developed following methods in the National Water Quality Guidelines (ANZECC/ARMCANZ, 2000) and Queensland Water Quality Guidelines (DERM, 2009).
Proposed water quality monitoring sitesIt is proposed to monitor turbidity at key habitats during dredging and spoil disposal activities. The monitoring sites have been chosen based on sediment plume modelling and baseline data collected during the EIS. The proposed sites are shown in Figure 16.
Influence sites will be established at four sites: Boyd Point (I1), Pera Head (I2), reefal area between Pera Head and Thud Point (I3) and Thud Point (I4). These sites are within the potential zone of influence as identified from the plume modelling (Figure 17). It should be noted that this modelling result is for dredge plume dispersion for dredging Periods 1 and 2 which includes inshore dredging with both the cutter suction dredge and trailing suction hopper dredge. Figure 17 shows little difference in suspended sediment concentration resulting from the dredge activity as a result of seasonal wind conditions, summer (wet season) and winter (dry season).
Reference sites will be located outside the zone of influence, north of Boyd Point (R1) and at false Pera Head (R2) approximately 11km south of Thud Point. A third Reference site will be located on the north-west corner of Nine Mile Reef (R3).
Water Quality Monitoring MethodTelemetered water quality loggers will be deployed at each of the Influence and Reference sites. The telemetered loggers will be equipped with turbidity sensors (NTU) and will have remote data transfer capabilities. Turbidity (NTU) readings will be recorded at 30 minute intervals and uploaded
at least twice daily. Data will be digitally logged in the unit and then transmitted using satellite telemetry to base station receivers for storage, display and analysis.
The purpose of the telemetered loggers is to provide real-time water quality data during dredging and spoil disposal activities. The monitoring aims to capture the spatial extent of the dredge and spoil disposal plumes, in particular in relation to sensitive coral communities located north and south of the dredging and spoil disposal activities.
In addition, two contingency telemetered water quality loggers will be available for deployment at sites where additional water quality information is required over the duration of dredging and spoil disposal activities. For example, telemetered loggers may be deployed within or at the edge of the zones of high Impact.
Turbidity data collected from the telemetered water quality loggers will provide an early indication of changes in water quality that may impact upon coral health. If the turbidity trigger values are exceeded at any of the telemetered water quality Influence sites and the exceedance is due to dredging and spoil disposal activities, a program of targeted coral health monitoring will be triggered. The sites that will be targeted for monitoring will depend on the spatial pattern of any exceedances of the turbidity trigger values, as well as consideration of the forecast meteorological and ocean conditions.
Satellite imagery of the extent of the dredging and spoil disposal plumes will be used, where available, in conjunction with information on meteorological/oceanographic conditions, to support decisions on the location of potential impacts.
In the event of a fault in a telemetered logger, an investigation into the reasons for the fault will be undertaken and if the fault lies with the instrument deployed in the field, then the equipment will be replaced on the next scheduled routine maintenance. Backup telemetered loggers will be available if an instrument is faulty and needs to be recalled for servicing or repair.
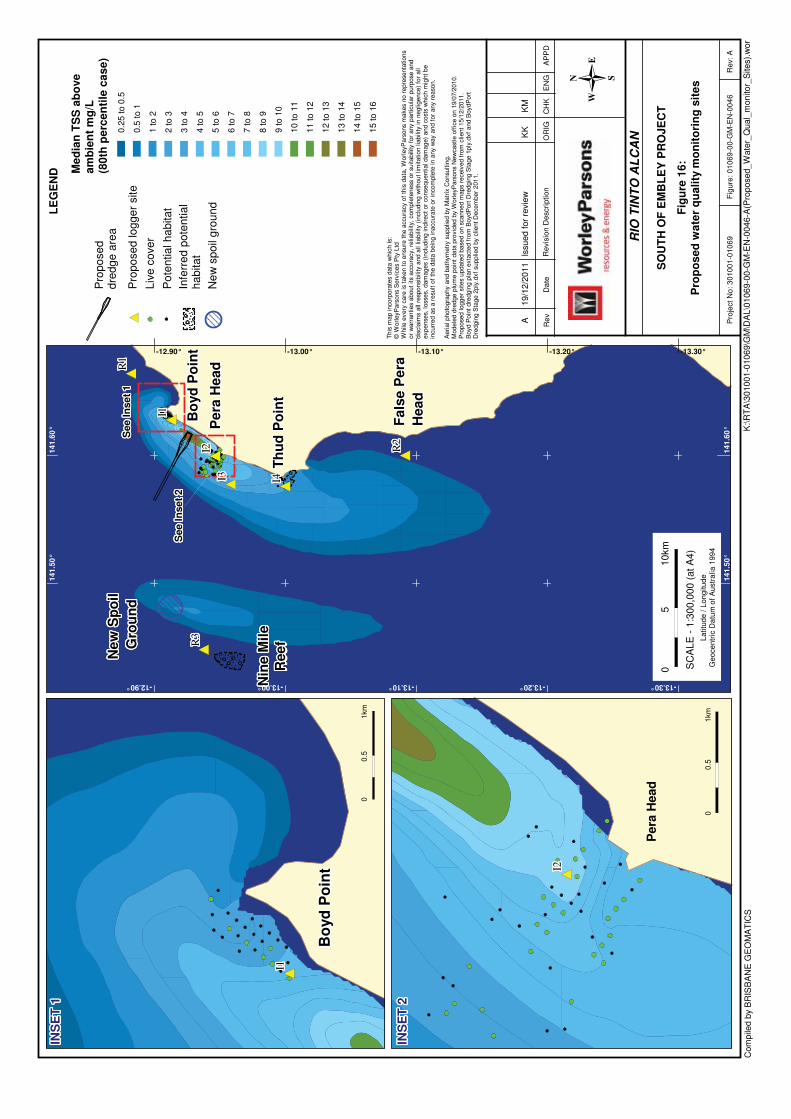
Figure 16 Proposed Water Quality Monitoring Sites
Com
pile
d by
BR
ISB
AN
E G
EO
MA
TIC
SK
:\RT
A\3
0100
1-01
069\
GM
\DA
L\01
069-
00-G
M-E
N-0
046-
A(P
ropo
sed_
Wat
er_Q
ual_
mon
itor_
Site
s).w
or
Rev
: AF
igur
e: 0
1069
-00-
GM
-EN
-004
6P
roje
ct N
o: 3
0100
1-01
069
LE
GE
ND
Rev
Rev
isio
n D
escr
iptio
nD
ate
OR
IGC
HK
EN
GA
PP
D
�R
IO T
INT
O A
LC
AN
Fig
ure
16:
Pro
po
sed
wat
er q
ual
ity
mo
nit
ori
ng
sit
es
Fal
se P
era
Fal
se P
era
Fal
se P
era
Fal
se P
era
Fal
se P
era
Fal
se P
era
Fal
se P
era
Fal
se P
era
Fal
se P
era
Fal
se P
era
Fal
se P
era
Fal
se P
era
Fal
se P
era
Fal
se P
era
Fal
se P
era
Fal
se P
era
Fal
se P
era
Fal
se P
era
Fal
se P
era
Fal
se P
era
Fal
se P
era
Fal
se P
era
Fal
se P
era
Fal
se P
era
Fal
se P
era
Fal
se P
era
Fal
se P
era
Fal
se P
era
Fal
se P
era
Fal
se P
era
Fal
se P
era
Fal
se P
era
Fal
se P
era
Fal
se P
era
Fal
se P
era
Fal
se P
era
Fal
se P
era
Fal
se P
era
Fal
se P
era
Fal
se P
era
Fal
se P
era
Fal
se P
era
Fal
se P
era
Fal
se P
era
Fal
se P
era
Fal
se P
era
Fal
se P
era
Fal
se P
era
Fal
se P
era
Hea
dH
ead
Hea
dH
ead
Hea
dH
ead
Hea
dH
ead
Hea
dH
ead
Hea
dH
ead
Hea
dH
ead
Hea
dH
ead
Hea
dH
ead
Hea
dH
ead
Hea
dH
ead
Hea
dH
ead
Hea
dH
ead
Hea
dH
ead
Hea
dH
ead
Hea
dH
ead
Hea
dH
ead
Hea
dH
ead
Hea
dH
ead
Hea
dH
ead
Hea
dH
ead
Hea
dH
ead
Hea
dH
ead
Hea
dH
ead
Hea
d
Per
a H
ead
Per
a H
ead
Per
a H
ead
Per
a H
ead
Per
a H
ead
Per
a H
ead
Per
a H
ead
Per
a H
ead
Per
a H
ead
Per
a H
ead
Per
a H
ead
Per
a H
ead
Per
a H
ead
Per
a H
ead
Per
a H
ead
Per
a H
ead
Per
a H
ead
Per
a H
ead
Per
a H
ead
Per
a H
ead
Per
a H
ead
Per
a H
ead
Per
a H
ead
Per
a H
ead
Per
a H
ead
Per
a H
ead
Per
a H
ead
Per
a H
ead
Per
a H
ead
Per
a H
ead
Per
a H
ead
Per
a H
ead
Per
a H
ead
Per
a H
ead
Per
a H
ead
Per
a H
ead
Per
a H
ead
Per
a H
ead
Per
a H
ead
Per
a H
ead
Per
a H
ead
Per
a H
ead
Per
a H
ead
Per
a H
ead
Per
a H
ead
Per
a H
ead
Per
a H
ead
Per
a H
ead
Per
a H
ead
Bo
yd P
oin
tB
oyd
Po
int
Bo
yd P
oin
tB
oyd
Po
int
Bo
yd P
oin
tB
oyd
Po
int
Bo
yd P
oin
tB
oyd
Po
int
Bo
yd P
oin
tB
oyd
Po
int
Bo
yd P
oin
tB
oyd
Po
int
Bo
yd P
oin
tB
oyd
Po
int
Bo
yd P
oin
tB
oyd
Po
int
Bo
yd P
oin
tB
oyd
Po
int
Bo
yd P
oin
tB
oyd
Po
int
Bo
yd P
oin
tB
oyd
Po
int
Bo
yd P
oin
tB
oyd
Po
int
Bo
yd P
oin
tB
oyd
Po
int
Bo
yd P
oin
tB
oyd
Po
int
Bo
yd P
oin
tB
oyd
Po
int
Bo
yd P
oin
tB
oyd
Po
int
Bo
yd P
oin
tB
oyd
Po
int
Bo
yd P
oin
tB
oyd
Po
int
Bo
yd P
oin
tB
oyd
Po
int
Bo
yd P
oin
tB
oyd
Po
int
Bo
yd P
oin
tB
oyd
Po
int
Bo
yd P
oin
tB
oyd
Po
int
Bo
yd P
oin
tB
oyd
Po
int
Bo
yd P
oin
tB
oyd
Po
int
Bo
yd P
oin
t
Th
ud
Po
int
Th
ud
Po
int
Th
ud
Po
int
Th
ud
Po
int
Th
ud
Po
int
Th
ud
Po
int
Th
ud
Po
int
Th
ud
Po
int
Th
ud
Po
int
Th
ud
Po
int
Th
ud
Po
int
Th
ud
Po
int
Th
ud
Po
int
Th
ud
Po
int
Th
ud
Po
int
Th
ud
Po
int
Th
ud
Po
int
Th
ud
Po
int
Th
ud
Po
int
Th
ud
Po
int
Th
ud
Po
int
Th
ud
Po
int
Th
ud
Po
int
Th
ud
Po
int
Th
ud
Po
int
Th
ud
Po
int
Th
ud
Po
int
Th
ud
Po
int
Th
ud
Po
int
Th
ud
Po
int
Th
ud
Po
int
Th
ud
Po
int
Th
ud
Po
int
Th
ud
Po
int
Th
ud
Po
int
Th
ud
Po
int
Th
ud
Po
int
Th
ud
Po
int
Th
ud
Po
int
Th
ud
Po
int
Th
ud
Po
int
Th
ud
Po
int
Th
ud
Po
int
Th
ud
Po
int
Th
ud
Po
int
Th
ud
Po
int
Th
ud
Po
int
Th
ud
Po
int
Th
ud
Po
int
New
Sp
oil
New
Sp
oil
New
Sp
oil
New
Sp
oil
New
Sp
oil
New
Sp
oil
New
Sp
oil
New
Sp
oil
New
Sp
oil
New
Sp
oil
New
Sp
oil
New
Sp
oil
New
Sp
oil
New
Sp
oil
New
Sp
oil
New
Sp
oil
New
Sp
oil
New
Sp
oil
New
Sp
oil
New
Sp
oil
New
Sp
oil
New
Sp
oil
New
Sp
oil
New
Sp
oil
New
Sp
oil
New
Sp
oil
New
Sp
oil
New
Sp
oil
New
Sp
oil
New
Sp
oil
New
Sp
oil
New
Sp
oil
New
Sp
oil
New
Sp
oil
New
Sp
oil
New
Sp
oil
New
Sp
oil
New
Sp
oil
New
Sp
oil
New
Sp
oil
New
Sp
oil
New
Sp
oil
New
Sp
oil
New
Sp
oil
New
Sp
oil
New
Sp
oil
New
Sp
oil
New
Sp
oil
New
Sp
oil
Gro
un
dG
rou
nd
Gro
un
dG
rou
nd
Gro
un
dG
rou
nd
Gro
un
dG
rou
nd
Gro
un
dG
rou
nd
Gro
un
dG
rou
nd
Gro
un
dG
rou
nd
Gro
un
dG
rou
nd
Gro
un
dG
rou
nd
Gro
un
dG
rou
nd
Gro
un
dG
rou
nd
Gro
un
dG
rou
nd
Gro
un
dG
rou
nd
Gro
un
dG
rou
nd
Gro
un
dG
rou
nd
Gro
un
dG
rou
nd
Gro
un
dG
rou
nd
Gro
un
dG
rou
nd
Gro
un
dG
rou
nd
Gro
un
dG
rou
nd
Gro
un
dG
rou
nd
Gro
un
dG
rou
nd
Gro
un
dG
rou
nd
Gro
un
dG
rou
nd
Gro
un
d
Nin
e M
ileN
ine
Mile
Nin
e M
ileN
ine
Mile
Nin
e M
ileN
ine
Mile
Nin
e M
ileN
ine
Mile
Nin
e M
ileN
ine
Mile
Nin
e M
ileN
ine
Mile
Nin
e M
ileN
ine
Mile
Nin
e M
ileN
ine
Mile
Nin
e M
ileN
ine
Mile
Nin
e M
ileN
ine
Mile
Nin
e M
ileN
ine
Mile
Nin
e M
ileN
ine
Mile
Nin
e M
ileN
ine
Mile
Nin
e M
ileN
ine
Mile
Nin
e M
ileN
ine
Mile
Nin
e M
ileN
ine
Mile
Nin
e M
ileN
ine
Mile
Nin
e M
ileN
ine
Mile
Nin
e M
ileN
ine
Mile
Nin
e M
ileN
ine
Mile
Nin
e M
ileN
ine
Mile
Nin
e M
ileN
ine
Mile
Nin
e M
ileN
ine
Mile
Nin
e M
ileN
ine
Mile
Nin
e M
ileR
eef
Ree
fR
eef
Ree
fR
eef
Ree
fR
eef
Ree
fR
eef
Ree
fR
eef
Ree
fR
eef
Ree
fR
eef
Ree
fR
eef
Ree
fR
eef
Ree
fR
eef
Ree
fR
eef
Ree
fR
eef
Ree
fR
eef
Ree
fR
eef
Ree
fR
eef
Ree
fR
eef
Ree
fR
eef
Ree
fR
eef
Ree
fR
eef
Ree
fR
eef
Ree
fR
eef
Ree
fR
eef
Ree
fR
eef
Ree
fR
eef
-13.10° -12.90° -13.00° -13.20° -13.30°
141
.50°
141
.50°
141
.60°
141
.60°
-13.30° -13.20° -13.00° -12.90° -13.10°
I1 I1 I1 I1 I1 I1 I1I1 I1 I1 I1 I1 I1 I1I1 I1 I1 I1 I1 I1 I1I1 I1 I1 I1 I1 I1I1 I1 I1 I1 I1 I1 I1I1 I1 I1 I1 I1 I1 I1I1 I1 I1 I1 I1 I1 I1I1
I2 I2 I2 I2 I2 I2 I2I2 I2 I2 I2 I2 I2 I2I2 I2 I2 I2 I2 I2 I2I2 I2 I2 I2 I2 I2I2 I2 I2 I2 I2 I2 I2I2 I2 I2 I2 I2 I2 I2I2 I2 I2 I2 I2 I2 I2I2I3 I3 I3 I3 I3 I3 I3I3 I3 I3 I3 I3 I3 I3I3 I3 I3 I3 I3 I3 I3I3 I3 I3 I3 I3 I3I3 I3 I3 I3 I3 I3 I3I3 I3 I3 I3 I3 I3 I3I3 I3 I3 I3 I3 I3 I3I3 I4 I4 I4 I4 I4 I4 I4I4 I4 I4 I4 I4 I4 I4I4 I4 I4 I4 I4 I4 I4I4 I4 I4 I4 I4 I4I4 I4 I4 I4 I4 I4 I4I4 I4 I4 I4 I4 I4 I4I4 I4 I4 I4 I4 I4 I4I4
R1
R1
R1
R1
R1
R1
R1
R1
R1
R1
R1
R1
R1
R1
R1
R1
R1
R1
R1
R1
R1
R1
R1
R1
R1
R1
R1
R1
R1
R1
R1
R1
R1
R1
R1
R1
R1
R1
R1
R1
R1
R1
R1
R1
R1
R1
R1
R1
R1
R2
R2
R2
R2
R2
R2
R2
R2
R2
R2
R2
R2
R2
R2
R2
R2
R2
R2
R2
R2
R2
R2
R2
R2
R2
R2
R2
R2
R2
R2
R2
R2
R2
R2
R2
R2
R2
R2
R2
R2
R2
R2
R2
R2
R2
R2
R2
R2
R2
R3
R3
R3
R3
R3
R3
R3
R3
R3
R3
R3
R3
R3
R3
R3
R3
R3
R3
R3
R3
R3
R3
R3
R3
R3
R3
R3
R3
R3
R3
R3
R3
R3
R3
R3
R3
R3
R3
R3
R3
R3
R3
R3
R3
R3
R3
R3
R3
R3
Thi
s m
ap in
corp
orat
es d
ata
whi
ch is
:©
Wor
leyP
arso
ns S
ervi
ces
Pty
Ltd
Whi
le e
very
car
e is
take
n to
ens
ure
the
accu
racy
of
this
dat
a, W
orle
yPar
sons
mak
es n
o re
pres
enta
tions
or w
arra
ntie
s ab
out i
ts a
ccur
acy,
rel
iabi
lity,
com
plet
enes
s or
sui
tabi
lity
for
any
part
icul
ar p
urpo
se a
nddi
scla
ims
all r
espo
nsib
ility
and
all
liabi
lity
(incl
udin
g w
ithou
t lim
itatio
n lia
bilit
y in
neg
ligen
ce)
for
all
expe
nses
, los
ses,
dam
ages
(in
clud
ing
indi
rect
or
cons
eque
ntia
l dam
age)
and
cos
ts w
hich
mig
ht b
e in
curr
ed a
s a
resu
lt of
the
data
bei
ng in
accu
rate
or
inco
mpl
ete
in a
ny w
ay a
nd f
or a
ny r
easo
n.
Aer
ial p
hoto
grap
hy a
nd b
athy
met
ry s
uppl
ied
by M
atrix
Con
sulti
ng.
Mod
eled
dre
dge
plum
e po
int d
ata
prov
ided
by
Wor
leyP
arso
ns N
ewca
stle
off
ice
on 1
9/07
/201
0.P
ropo
sed
logg
er s
ites
upda
ted
base
d on
sca
nned
map
s re
ceiv
ed f
rom
clie
nt 1
5/12
/201
1.B
oyd
Poi
nt d
redg
ing
plan
ext
acte
d fr
om B
oydP
ort D
redg
ing
Sta
ge 1
ply.
dxf
and
Boy
dPor
tD
redg
ing
Sta
ge 2
ply.
dxf
supp
lied
by c
lient
Dec
embe
r 20
11.
Pro
pose
d lo
gger
site
Infe
rred
pot
entia
lha
bita
t
0.5
to 1
0.25
to 0
.5
10 to
11
12 to
13
11 to
12
15 to
16
14 to
15
13 to
14
9 to
10
8 to
9
3 to
4
2 to
3
1 to
2
4 to
5
7 to
8
5 to
6
6 to
7
Med
ian
TS
S a
bo
ve
amb
ien
t m
g/L
(80t
h p
erce
nti
le c
ase)
AIs
sued
for
revi
ewK
KK
M19
/12/
2011
05
10km
SC
ALE
- 1
:300
,000
(at
A4)
Latit
ude
/ Lon
gitu
deG
eoce
ntric
Dat
um o
f Aus
tral
ia 1
994
Per
a H
ead
00.
51k
m
I2 I2 I2 I2 I2 I2 I2I2 I2 I2 I2 I2 I2 I2I2 I2 I2 I2 I2 I2 I2I2 I2 I2 I2 I2 I2I2 I2 I2 I2 I2 I2 I2I2 I2 I2 I2 I2 I2 I2I2 I2 I2 I2 I2 I2 I2I2
INS
ET
2IN
SE
T 2
INS
ET
2IN
SE
T 2
INS
ET
2IN
SE
T 2
INS
ET
2IN
SE
T 2
INS
ET
2IN
SE
T 2
INS
ET
2IN
SE
T 2
INS
ET
2IN
SE
T 2
INS
ET
2IN
SE
T 2
INS
ET
2IN
SE
T 2
INS
ET
2IN
SE
T 2
INS
ET
2IN
SE
T 2
INS
ET
2IN
SE
T 2
INS
ET
2IN
SE
T 2
INS
ET
2IN
SE
T 2
INS
ET
2IN
SE
T 2
INS
ET
2IN
SE
T 2
INS
ET
2IN
SE
T 2
INS
ET
2IN
SE
T 2
INS
ET
2IN
SE
T 2
INS
ET
2IN
SE
T 2
INS
ET
2IN
SE
T 2
INS
ET
2IN
SE
T 2
INS
ET
2IN
SE
T 2
INS
ET
2IN
SE
T 2
INS
ET
2
See
Inse
t 1
See
Inse
t 1
See
Inse
t 1
See
Inse
t 1
See
Inse
t 1
See
Inse
t 1
See
Inse
t 1
See
Inse
t 1
See
Inse
t 1
See
Inse
t 1
See
Inse
t 1
See
Inse
t 1
See
Inse
t 1
See
Inse
t 1
See
Inse
t 1
See
Inse
t 1
See
Inse
t 1
See
Inse
t 1
See
Inse
t 1
See
Inse
t 1
See
Inse
t 1
See
Inse
t 1
See
Inse
t 1
See
Inse
t 1
See
Inse
t 1
See
Inse
t 1
See
Inse
t 1
See
Inse
t 1
See
Inse
t 1
See
Inse
t 1
See
Inse
t 1
See
Inse
t 1
See
Inse
t 1
See
Inse
t 1
See
Inse
t 1
See
Inse
t 1
See
Inse
t 1
See
Inse
t 1
See
Inse
t 1
See
Inse
t 1
See
Inse
t 1
See
Inse
t 1
See
Inse
t 1
See
Inse
t 1
See
Inse
t 1
See
Inse
t 1
See
Inse
t 1
See
Inse
t 1
See
Inse
t 1
See
Inse
t 2
See
Inse
t 2
See
Inse
t 2
See
Inse
t 2
See
Inse
t 2
See
Inse
t 2
See
Inse
t 2
See
Inse
t 2
See
Inse
t 2
See
Inse
t 2
See
Inse
t 2
See
Inse
t 2
See
Inse
t 2
See
Inse
t 2
See
Inse
t 2
See
Inse
t 2
See
Inse
t 2
See
Inse
t 2
See
Inse
t 2
See
Inse
t 2
See
Inse
t 2
See
Inse
t 2
See
Inse
t 2
See
Inse
t 2
See
Inse
t 2
See
Inse
t 2
See
Inse
t 2
See
Inse
t 2
See
Inse
t 2
See
Inse
t 2
See
Inse
t 2
See
Inse
t 2
See
Inse
t 2
See
Inse
t 2
See
Inse
t 2
See
Inse
t 2
See
Inse
t 2
See
Inse
t 2
See
Inse
t 2
See
Inse
t 2
See
Inse
t 2
See
Inse
t 2
See
Inse
t 2
See
Inse
t 2
See
Inse
t 2
See
Inse
t 2
See
Inse
t 2
See
Inse
t 2
See
Inse
t 2
Bo
yd P
oin
tB
oyd
Po
int
Bo
yd P
oin
tB
oyd
Po
int
Bo
yd P
oin
tB
oyd
Po
int
Bo
yd P
oin
tB
oyd
Po
int
Bo
yd P
oin
tB
oyd
Po
int
Bo
yd P
oin
tB
oyd
Po
int
Bo
yd P
oin
tB
oyd
Po
int
Bo
yd P
oin
tB
oyd
Po
int
Bo
yd P
oin
tB
oyd
Po
int
Bo
yd P
oin
tB
oyd
Po
int
Bo
yd P
oin
tB
oyd
Po
int
Bo
yd P
oin
tB
oyd
Po
int
Bo
yd P
oin
tB
oyd
Po
int
Bo
yd P
oin
tB
oyd
Po
int
Bo
yd P
oin
tB
oyd
Po
int
Bo
yd P
oin
tB
oyd
Po
int
Bo
yd P
oin
tB
oyd
Po
int
Bo
yd P
oin
tB
oyd
Po
int
Bo
yd P
oin
tB
oyd
Po
int
Bo
yd P
oin
tB
oyd
Po
int
Bo
yd P
oin
tB
oyd
Po
int
Bo
yd P
oin
tB
oyd
Po
int
Bo
yd P
oin
tB
oyd
Po
int
Bo
yd P
oin
tB
oyd
Po
int
Bo
yd P
oin
t
00.
51k
m
I1 I1 I1 I1 I1 I1 I1I1 I1 I1 I1 I1 I1 I1I1 I1 I1 I1 I1 I1 I1I1 I1 I1 I1 I1 I1I1 I1 I1 I1 I1 I1 I1I1 I1 I1 I1 I1 I1 I1I1 I1 I1 I1 I1 I1 I1I1
INS
ET
1IN
SE
T 1
INS
ET
1IN
SE
T 1
INS
ET
1IN
SE
T 1
INS
ET
1IN
SE
T 1
INS
ET
1IN
SE
T 1
INS
ET
1IN
SE
T 1
INS
ET
1IN
SE
T 1
INS
ET
1IN
SE
T 1
INS
ET
1IN
SE
T 1
INS
ET
1IN
SE
T 1
INS
ET
1IN
SE
T 1
INS
ET
1IN
SE
T 1
INS
ET
1IN
SE
T 1
INS
ET
1IN
SE
T 1
INS
ET
1IN
SE
T 1
INS
ET
1IN
SE
T 1
INS
ET
1IN
SE
T 1
INS
ET
1IN
SE
T 1
INS
ET
1IN
SE
T 1
INS
ET
1IN
SE
T 1
INS
ET
1IN
SE
T 1
INS
ET
1IN
SE
T 1
INS
ET
1IN
SE
T 1
INS
ET
1IN
SE
T 1
INS
ET
1
Live
cov
er
Pot
entia
l hab
itat
Pro
pose
ddr
edge
are
a
SO
UT
H O
F E
MB
LE
Y P
RO
JEC
T
New
spo
il gr
ound
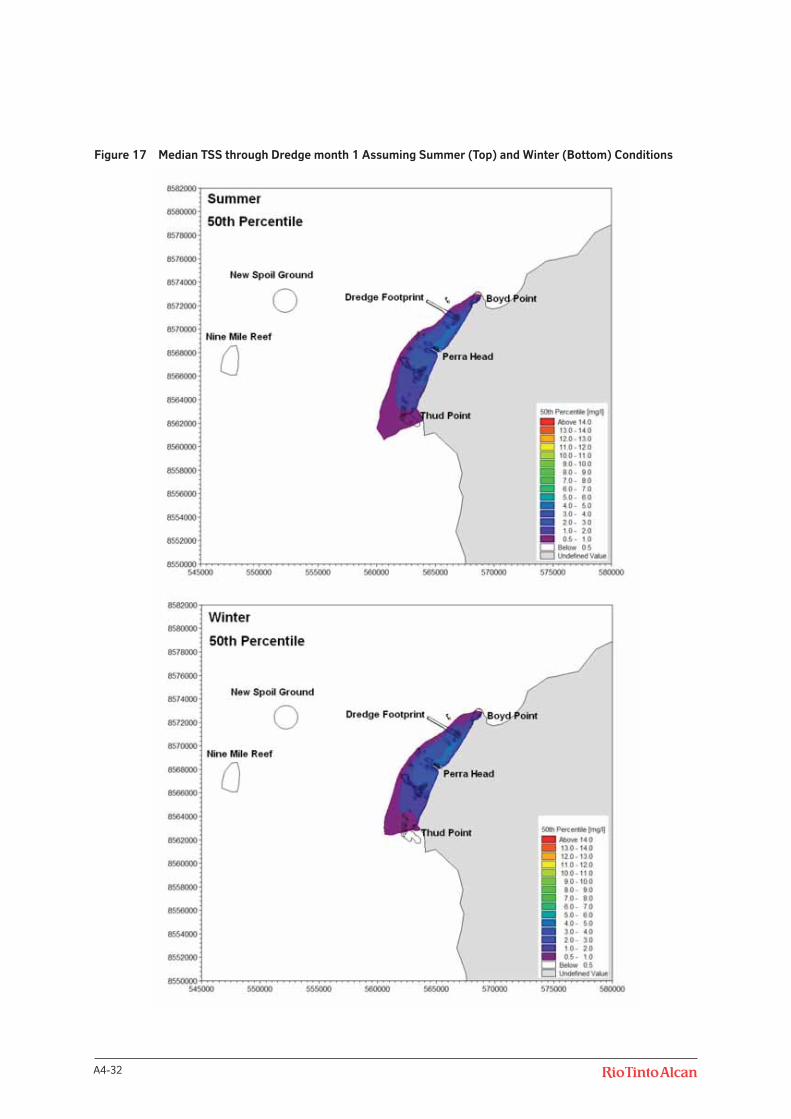
A4-32
Figure 17 Median TSS through Dredge month 1 Assuming Summer (Top) and Winter (Bottom) Conditions
A4-33
Draft Dredge Management Plan – Port for South of Embley Project
Appendix 4 – Draft Dredge Management Plan – Port
Quality Assurance/Quality Control (QA/QC)Standard Operating Procedures and Quality Assurance/Quality Control (QA/QC) Protocols (e.g. ISO 9000) for monitoring methods, site and field instrument maintenance and data capture, analysis and interpretation will be implemented throughout. As a minimum these will include:
Training for personnel;
Pre-deployment and deployment checks for logger function and capability to perform for the required deployment period;
Checks for loggers on retrieval;
Protocols for the download of data and preliminary field data checks;
Protocols for raw data filtering/cleaning and correction detailed protocols; and
Protocols for data management, data security and data audit.
Due to the potential for rapid biofouling in tropical coastal waters, all subsurface-deployed equipment will be serviced at a maximum interval of four weeks. This frequency may be reviewed if there is evidence that there is a significant loss of data. Depending on the period of deployment preventative maintenance and calibration will be scheduled for each instrument, including an on-site and off-site maintenance program.
Data Analysis and InterpretationWater quality (NTU) data collected from the telemetered loggers will be analysed daily against the turbidity trigger values set for the Zones of Influence to provide early warning of potential coral impacts associated with the dredging and spoil disposal plumes. Exceedance(s) of the turbidity trigger values will be reported on a site-by-site basis, but also such that the coincidence and extent of exceedance(s) can be visualised spatially (i.e. where possible, mapped).
In the event of any exceedance(s) of the turbidity trigger values, an analysis of the available information will be required to establish the likelihood that the decline in water quality is due to dredging and spoil disposal activities rather than other causes (see Figure 12 Water Quality Management Process).
This will include an assessment of the following factors:
Data and analysis QA/QC;
Location and status of dredging and spoil disposal activities in relation to the site at the time the exceedance was detected;
Location of the visible plume in relation to the site (via remote sensing information, if available);
Meteorological and ocean conditions (e.g. wind, tide, wave and swell state);
Effects of extreme weather events in the region (e.g. storms, cyclones); and
Spatial extent of water quality decline, particularly whether the exceedance was recorded only at a potential impact site or was observed more widely.
If turbidity trigger values are exceeded at one or more of the telemetered water quality loggers and there are no likely alternative explanations for the exceedance other than dredging and spoil disposal activities, targeted coral health monitoring will be triggered.
6.6.2 Coral Health Monitoring
The coral health monitoring program has been designed to provide a quantitative measure of coral health (percent bleaching or mortality) which can be assessed against management triggers as shown in the Coral Health Management Process (Figure 13).
The coral health monitoring program is designed to identify and measure changes in coral health that are attributable to dredging and spoil disposal activities and that are greater than changes occurring naturally in corals at the Reference Sites.
Proposed Monitoring SitesThe locations of the coral health Influence and Reference Sites will be coincident with the telemetered water quality sites (Figure 16), or as close as practically possible. The Reference sites will be used to assess natural changes in coral health during the dredging and spoil disposal program.
Monitoring FrequencyTable 3 shows the proposed monitoring frequency. Monitoring will be conducted pre-dredging to establish transects at each site. During dredging monitoring will be conducted towards the end of Dredge Periods 1, 2, 3, 5 and 7 as these are the periods that the model has predicted will result in suspended solids concentrations above background at the Influence sites, Boyd Point and Pera Head (Figure 18). The Dredge time periods are shown in Figure 4.
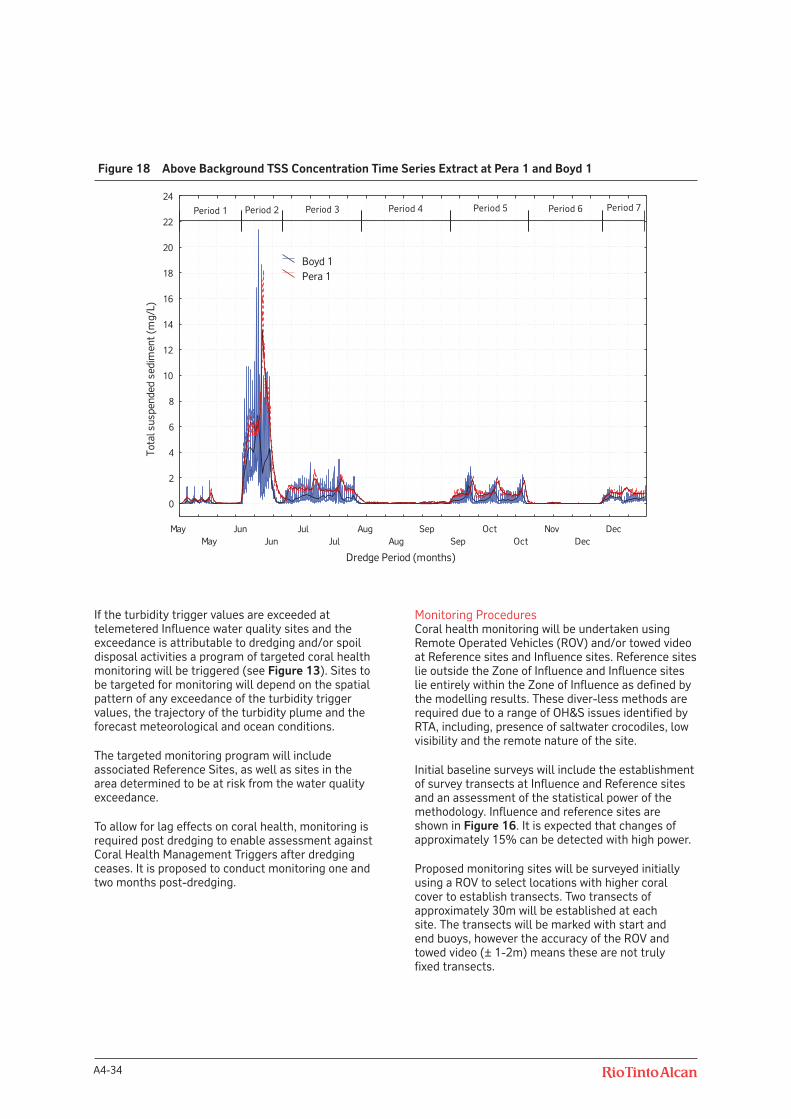
A4-34
If the turbidity trigger values are exceeded at telemetered Influence water quality sites and the exceedance is attributable to dredging and/or spoil disposal activities a program of targeted coral health monitoring will be triggered (see Figure 13). Sites to be targeted for monitoring will depend on the spatial pattern of any exceedance of the turbidity trigger values, the trajectory of the turbidity plume and the forecast meteorological and ocean conditions.
The targeted monitoring program will include associated Reference Sites, as well as sites in the area determined to be at risk from the water quality exceedance.
To allow for lag effects on coral health, monitoring is required post dredging to enable assessment against Coral Health Management Triggers after dredging ceases. It is proposed to conduct monitoring one and two months post-dredging.
Monitoring ProceduresCoral health monitoring will be undertaken using Remote Operated Vehicles (ROV) and/or towed video at Reference sites and Influence sites. Reference sites lie outside the Zone of Influence and Influence sites lie entirely within the Zone of Influence as defined by the modelling results. These diver-less methods are required due to a range of OH&S issues identified by RTA, including, presence of saltwater crocodiles, low visibility and the remote nature of the site.
Initial baseline surveys will include the establishment of survey transects at Influence and Reference sites and an assessment of the statistical power of the methodology. Influence and reference sites are shown in Figure 16. It is expected that changes of approximately 15% can be detected with high power.
Proposed monitoring sites will be surveyed initially using a ROV to select locations with higher coral cover to establish transects. Two transects of approximately 30m will be established at each site. The transects will be marked with start and end buoys, however the accuracy of the ROV and towed video (± 1-2m) means these are not truly fixed transects.
Figure 18 Above Background TSS Concentration Time Series Extract at Pera 1 and Boyd 1
MayMay
JunJun
JulJul
AugAug
SepSep
OctOct
NovDec
Dec
Dredge Period (months)
0
2
4
6
8
10
12
14
16
18
20
22
24
Tota
l sus
pend
ed s
edim
ent (
mg/
L)
Boyd 1 Pera 1
Period 1 Period 2 Period 3 Period 4 Period 5 Period 7Period 6
A4-35
Draft Dredge Management Plan – Port for South of Embley Project
Appendix 4 – Draft Dredge Management Plan – Port
Quality Assurance/Quality Control (QA/QC)Standard Operating Procedures and QA/QC Protocols (e.g. ISO 9000) for monitoring methods, site maintenance, and data capture, analysis and interpretation will be implemented throughout.
As a minimum these will include:
Training for personnel prior to mobilisation for field surveys to ensure that stringent methods are employed for towed video and/or ROV field work;
Trained scientist on board each survey vessel to oversee data collection and QA/QC collected images;
Regular maintenance of sites, re-establishing transect buoys as necessary;
Procedures to ensure consistency in collection of imagery and quality of imagery; and
Protocols for data management, data security and data audit.
Data Analysis and InterpretationCoral health will be assessed by analysis of imagery from the ROV and/or towed video. Quantitative processing of imagery will be conducted using coral point count (CPCe) or similar analysis methods, by image analysts with experience in scoring coral health, with frequent cross-referencing and testing to ensure consistent classification.
Interpretation of data will include testing for a change between the “before dredging and spoil disposal” and “during dredging and spoil disposal” periods at Influence sites, and References sites over the same period.
It is expected that the proposed methodology will allow detection of approximately 15% change with high power. This will be established during the pre-dredging monitoring.
A4-36
ANZECC/ARMCANZ (2000). Australian and New Zealand Guidelines for Fresh and Marine Water Quality. National Water Quality Strategy. Australian and New Zealand Environment Conservation Council and Agricultural Resource Management Council of Australia and New Zealand, Canberra.
Commonwealth of Australia (2009). National Assessment Guidelines for Dredging. Commonwealthof Australia, Canberra, 2009.
DERM (2009). Queensland Water Quality Guidelines 2009. Queensland Department of Environment and Resource Management.
IMO (2000). Specific Guidelines for Assessment of Dredged Material. Adopted by the 22nd Consultative Meeting of Contracting Parties to the London Convention 1972 by resolution LC.22/5 (2000) 18-22 September 2000. International Maritime Organisation.
RTA (2011). Environmental Impact Statement for South of Embley Project. Rio Tinto Alcan.
SKM (2009a). Port of Weipa Long Term Environment Management Plan for Dredging and Dumping Activities. Report prepared by Sinclair Knight Merz for North Queensland Bulk Ports. 31 August 2009.
7. REFERENCES


![References Port of Falmouth development initiative: Project Programme – Dredge Disposal and Maerl Mitigation, [online] (2009), Available at:](https://img.pdfslide.net/doc/110x75/56649ce15503460f949acabb/references-port-of-falmouth-development-initiative-project-programme-dredge.jpg)