Embed Size (px)
Citation preview
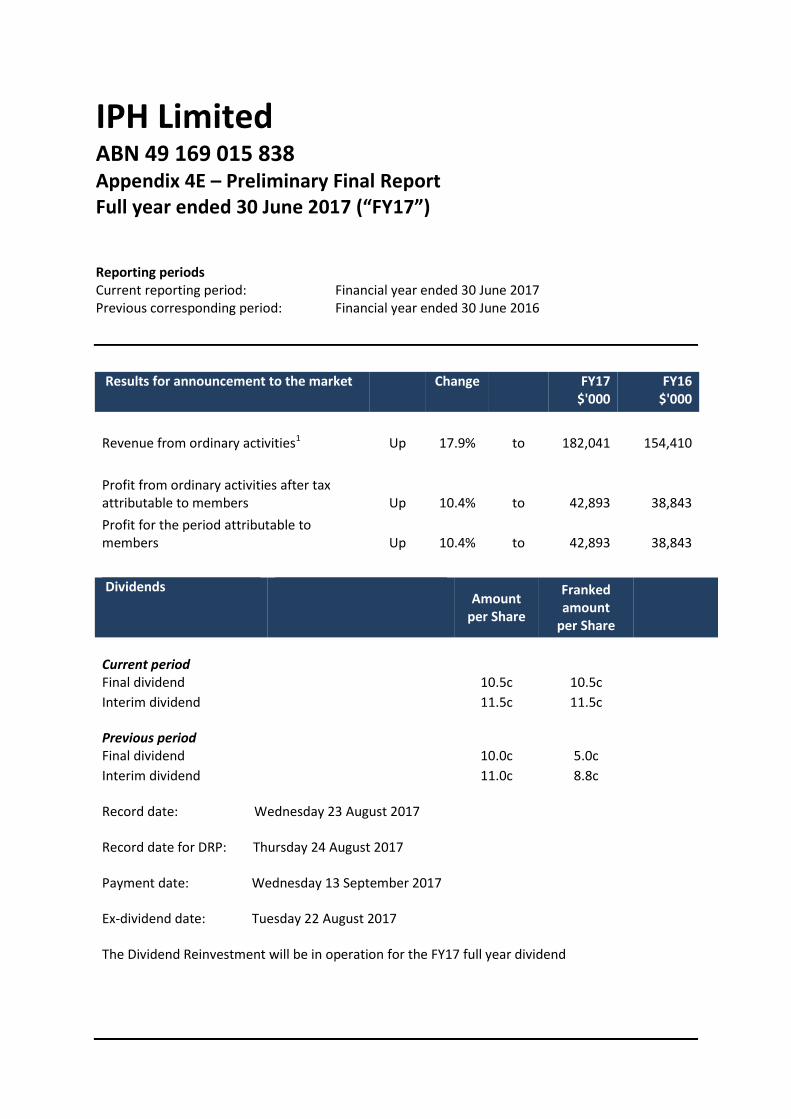
IPH Limited ABN 49 169 015 838 Appendix 4E – Preliminary Final Report Full year ended 30 June 2017 (“FY17”) Reporting periods Current reporting period: Financial year ended 30 June 2017 Previous corresponding period: Financial year ended 30 June 2016
Results for announcement to the market Change FY17
$'000 FY16
$'000
Revenue from ordinary activities1 Up 17.9% to 182,041 154,410
Profit from ordinary activities after tax attributable to members Up 10.4% to 42,893 38,843
Profit for the period attributable to members Up 10.4% to 42,893 38,843
Dividends
Amount per Share
Franked amount
per Share
Current period Final dividend 10.5c 10.5c
Interim dividend 11.5c 11.5c
Previous period Final dividend 10.0c 5.0c
Interim dividend 11.0c 8.8c
Record date: Wednesday 23 August 2017 Record date for DRP: Thursday 24 August 2017 Payment date: Wednesday 13 September 2017 Ex-dividend date: Tuesday 22 August 2017 The Dividend Reinvestment will be in operation for the FY17 full year dividend
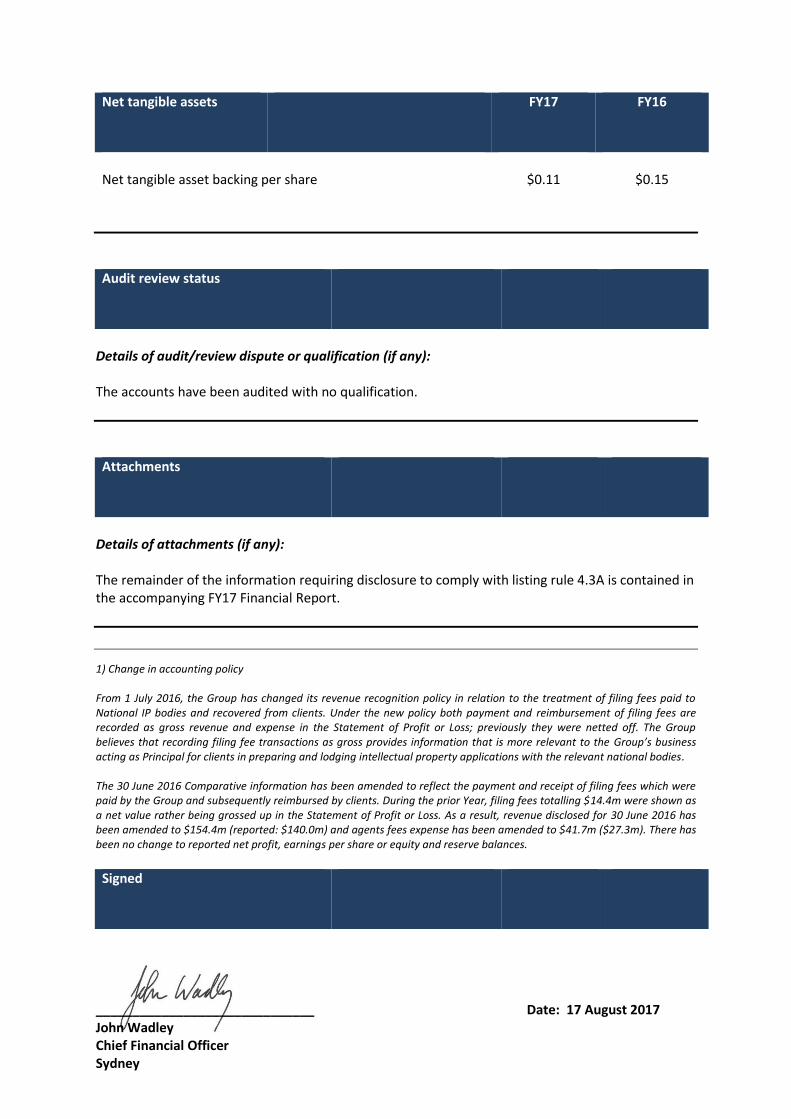
Net tangible assets FY17 FY16
Net tangible asset backing per share
$0.11
$0.15
Audit review status
Details of audit/review dispute or qualification (if any): The accounts have been audited with no qualification.
Attachments
Details of attachments (if any): The remainder of the information requiring disclosure to comply with listing rule 4.3A is contained in the accompanying FY17 Financial Report.
1) Change in accounting policy From 1 July 2016, the Group has changed its revenue recognition policy in relation to the treatment of filing fees paid to National IP bodies and recovered from clients. Under the new policy both payment and reimbursement of filing fees are recorded as gross revenue and expense in the Statement of Profit or Loss; previously they were netted off. The Group believes that recording filing fee transactions as gross provides information that is more relevant to the Group’s business acting as Principal for clients in preparing and lodging intellectual property applications with the relevant national bodies. The 30 June 2016 Comparative information has been amended to reflect the payment and receipt of filing fees which were paid by the Group and subsequently reimbursed by clients. During the prior Year, filing fees totalling $14.4m were shown as a net value rather being grossed up in the Statement of Profit or Loss. As a result, revenue disclosed for 30 June 2016 has been amended to $154.4m (reported: $140.0m) and agents fees expense has been amended to $41.7m ($27.3m). There has been no change to reported net profit, earnings per share or equity and reserve balances.
Signed
______________________________ Date: 17 August 2017 John Wadley Chief Financial Officer Sydney
1
Corporate Directory
Directors Mr Richard Grellman AM - Chairman
Mr David Griffith
Ms Robin Low
Dr Sally Pitkin
Mr John Atkin
Company secretary Mr Philip Heuzenroeder
Notice of annual general meeting
The details of the annual general meeting of IPH Limited are:
Monday 20 November at 10:30am at the offices of Ernst & Young
200 George Street
Sydney NSW 2000
Registered office Level 35
31 Market Street
Sydney NSW 2000
Tel: 02 9393 0301
Fax: 02 9261 5486
Principal place of business
Level 35
31 Market Street
Sydney NSW 2000
Share register Link Market Services Limited
Level 12
680 George Street
Sydney NSW 2000
Tel: 1300 554 474
Auditor Deloitte Touche Tohmatsu
Level 9, Grosvenor Place
225 George Street
Sydney NSW 2000
Solicitors Watson Mangioni Lawyers Pty Limited
Level 13
50 Carrington Street
Sydney NSW 2000
Stock exchange listing IPH Limited shares are listed on the Australian Securities Exchange (ASX code: IPH)
Website www.iphltd.com.au
Corporate Governance Statement The Corporate Governance Statement was approved by the Board of Directors on 30 September 2016 and can be found at www.iphltd.com.au
2
IPH Limited and its Controlled Entities Directors’ Report
30 June 2017
The Directors present their report, together with the financial statements, of the consolidated entity (referred to hereafter as the ‘Group’) consisting of IPH Limited (referred to hereafter as the ‘Company’ or ‘Parent Entity’) and the entities it controlled at the end of, or during, the year ended 30 June 2017.
IPH Limited (“IPH”, ASX:IPH), is the holding company of intellectual property services firms Spruson & Ferguson, Fisher Adams Kelly Callinans, Pizzeys and Cullens and data analytics software development company, Practice Insight. The group employs a multidisciplinary team of approximately 450 people in Australia, Singapore, Malaysia, Thailand, Indonesia, China, Hong Kong and Germany.
IPH is the leading intellectual property (“IP”) services group in the Asia-Pacific region offering a wide range of IP services and products to a diverse client base of Fortune Global 500 companies, multinationals, public sector research organisations, SMEs and professional services firms worldwide.
IPH was the first IP services group to list on the Australian Securities Exchange.
1. Directors The following persons were Directors of IPH Limited during the whole of the financial year and up to the date of this report, unless otherwise stated:
Name Office
Mr Richard Grellman, AM Non-executive Chairman
Mr David Griffith Managing Director and Chief Executive Officer
Ms Robin Low Non-executive Director
Dr Sally Pitkin Non-executive Director
Mr John Atkin Non-executive Director
On 2 May 2017, the company announced Dr Andrew Blattman will be appointed as the next Managing Director and CEO of IPH Limited. Dr Blattman will move into the role towards the end of 2017 taking over from David Griffith who will step down after 43 years in the intellectual property profession.
1.1 Information on Directors
The skills, experience, and expertise of each person who is a director of the Company at the end of the financial year is provided below, together with details of the company secretary as at year end.
Name: Richard Grellman, AM
Title: Non-executive Chairman (appointed 23 September 2014)
Qualifications: FCA
Experience and expertise:
Richard worked for KPMG for 32 years, mostly within the Corporate Recovery Division and was a Partner from 1982 to 2000. Richard is currently the Tribunal of The Statutory and other Officers Remuneration Tribunal (SOORT), appointed by the Governor of NSW.
Other current directorships:
Richard is also Chairman of AMP Foundation (2012) and Bible Society Australia (2011). Richard is also a Director of Bisalloy Steel Group Limited (2003) and the National Health and Medical Research Council Institute for Dementia Research (2015).
Former directorships (last 3 years)
Chairman of Crowe Horwath Australasia Limited (2011 - 2015), Chairman of Genworth Mortgage Insurance Limited (2012-2016).
3
IPH Limited and its Controlled Entities Directors’ Report (continued)
30 June 2017
Interests in shares: 67,586
Special responsibilities: Chairman
Name: David Griffith
Title: Managing Director and Chief Executive Officer
Qualifications: BE (Hons)
Experience and expertise:
David Griffith was appointed CEO of IPH in November 2014, after successfully managing intellectual property (IP) firm Spruson & Ferguson, now subsidiary of IPH, for over 20 years. Under David’s leadership Spruson & Ferguson became the first Australian IP firm to the enter Asian IP market with the opening of the firm’s Singapore office in 1997 and joining what was the partnership of CPA Global in 1998.
After amendments to the Australian Patents Act in 2013 allowing for incorporation of patent attorney practices, David led a successful $AU330m IPO of IPH Limited (ASX: IPH) in November 2014. IPH was the first IP professional services group to list on the ASX. Since David’s appointment IPH has completed five acquisitions and today is an S&P/ASX 200 company with market capitalisation of c.A$900m.
From 2005 David served on the Board of Computer Patent Annuities Limited Partnership (CPA) in Jersey, Channel Islands until the company was sold to Private Equity in 2010.
David began his career in the patent and trade mark attorney profession when he joined Spruson & Ferguson in 1974. He was a Principal of the firm from 1981 and Managing Principal from 1999-2015. David was a founding director of Spruson & Ferguson Asia and has been Chairman since 2011. He is also the Chairman of Spruson & Ferguson and a Director of Pizzeys, Fisher Adams Kelly Callinans, Cullens and Practice Insight.
Memberships of Professional Associations:
Emeritus member, IPTA; Member of Honor, FICPI; member of AIPPI, APAA and LESANZ.
Other current directorships:
No other current directorships
Interests in shares: 2,598,765
Special responsibilities: CEO
Name: Robin Low
Title: Non-executive Director (appointed 23 September 2014)
Qualifications: BCom, FCA, GAICD
Experience and expertise:
Robin worked at PricewaterhouseCoopers for 28 years and was a Partner from 1996 to 2013. She is also a member of the Auditing and Assurance Standards Board.
Other current directorships:
AUB Group Limited (2014), CSG Limited (2014), Appen Limited (2014), Sydney Medical School Foundation (2012), Primary Ethics (2011), Public Education Foundation (2010), Australian Reinsurance Pool Corporation (2017) and Gordian Runoff Limited/Enstar Australia Holdings Pty Limited (part of the NASDAQ listed Enstar Group) (2017).
Interests in shares: 65,804
Special responsibilities: Chairman - Audit Committee, Member – Risk Committee, Nomination and Remuneration Committee
4
IPH Limited and its Controlled Entities Directors’ Report (continued)
30 June 2017
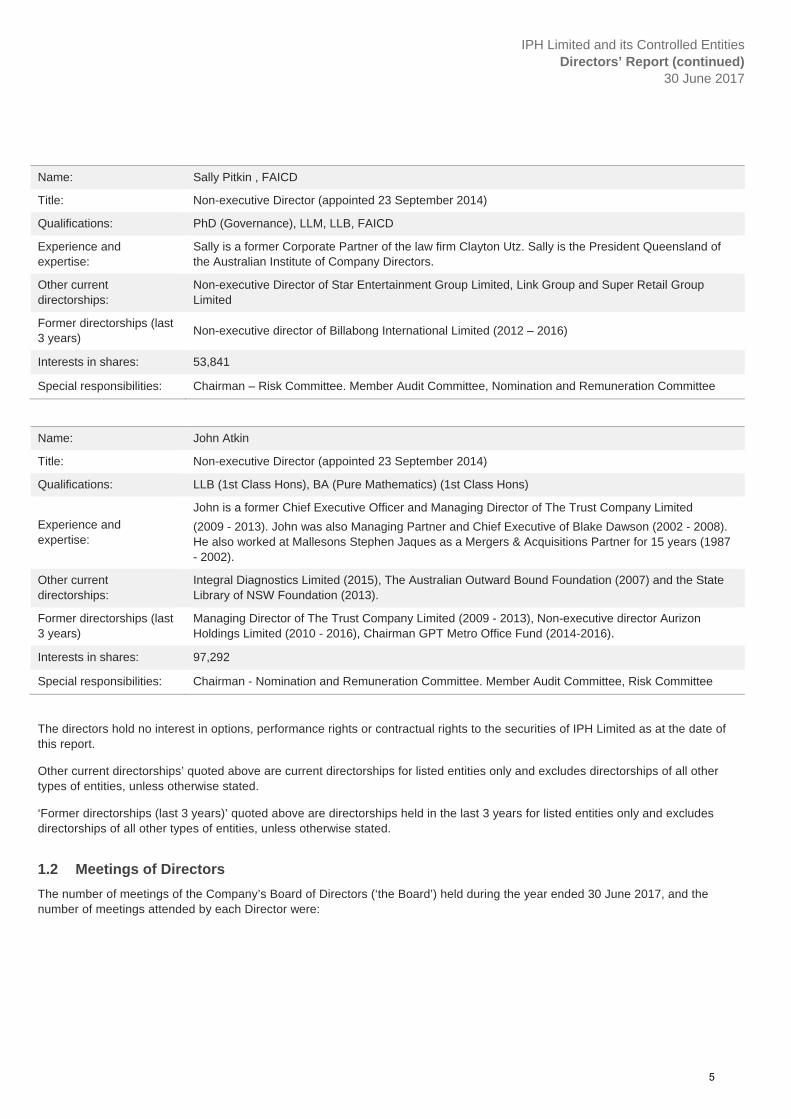
Name: Sally Pitkin , FAICD
Title: Non-executive Director (appointed 23 September 2014)
Qualifications: PhD (Governance), LLM, LLB, FAICD
Experience and expertise:
Sally is a former Corporate Partner of the law firm Clayton Utz. Sally is the President Queensland of the Australian Institute of Company Directors.
Other current directorships:
Non-executive Director of Star Entertainment Group Limited, Link Group and Super Retail Group Limited
Former directorships (last 3 years)
Non-executive director of Billabong International Limited (2012 – 2016)
Interests in shares: 53,841
Special responsibilities: Chairman – Risk Committee. Member Audit Committee, Nomination and Remuneration Committee
Name: John Atkin
Title: Non-executive Director (appointed 23 September 2014)
Qualifications: LLB (1st Class Hons), BA (Pure Mathematics) (1st Class Hons)
Experience and expertise:
John is a former Chief Executive Officer and Managing Director of The Trust Company Limited
(2009 - 2013). John was also Managing Partner and Chief Executive of Blake Dawson (2002 - 2008). He also worked at Mallesons Stephen Jaques as a Mergers & Acquisitions Partner for 15 years (1987 - 2002).
Other current directorships:
Integral Diagnostics Limited (2015), The Australian Outward Bound Foundation (2007) and the State Library of NSW Foundation (2013).
Former directorships (last 3 years)
Managing Director of The Trust Company Limited (2009 - 2013), Non-executive director Aurizon Holdings Limited (2010 - 2016), Chairman GPT Metro Office Fund (2014-2016).
Interests in shares: 97,292
Special responsibilities: Chairman - Nomination and Remuneration Committee. Member Audit Committee, Risk Committee
The directors hold no interest in options, performance rights or contractual rights to the securities of IPH Limited as at the date of this report.
Other current directorships’ quoted above are current directorships for listed entities only and excludes directorships of all other types of entities, unless otherwise stated.
‘Former directorships (last 3 years)’ quoted above are directorships held in the last 3 years for listed entities only and excludes directorships of all other types of entities, unless otherwise stated.
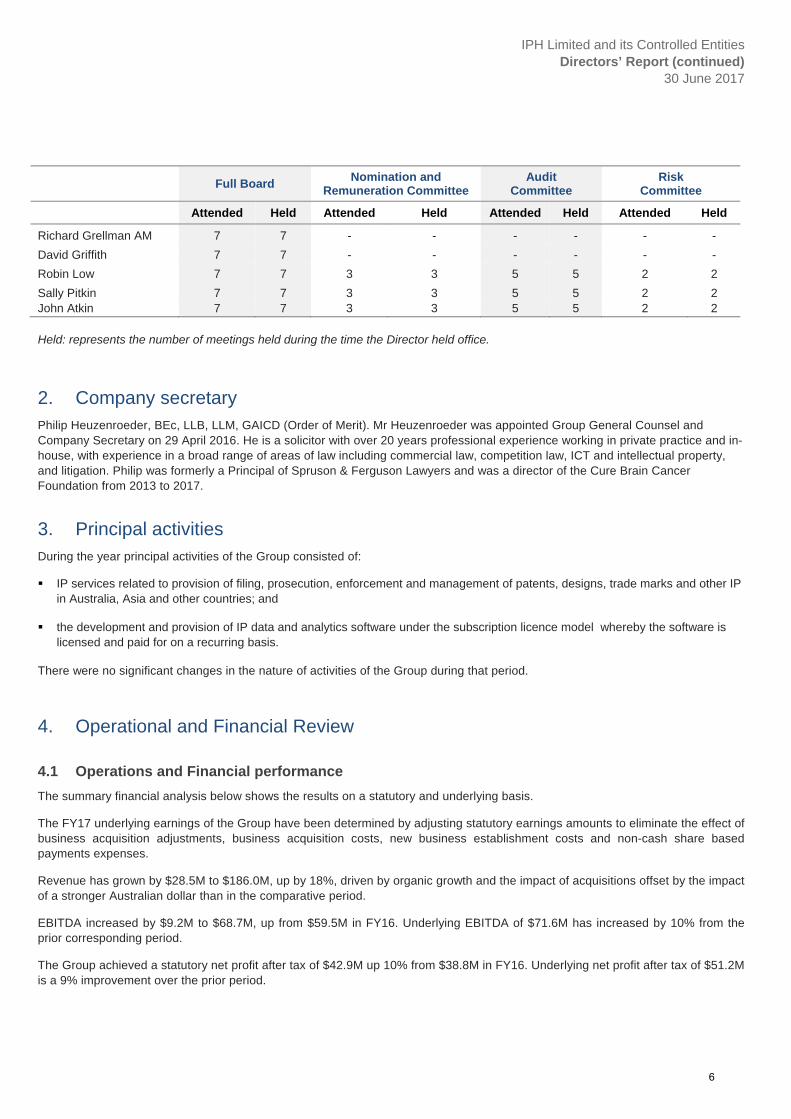
1.2 Meetings of Directors
The number of meetings of the Company’s Board of Directors (‘the Board’) held during the year ended 30 June 2017, and the number of meetings attended by each Director were:
5
IPH Limited and its Controlled Entities Directors’ Report (continued)
30 June 2017
Full Board Nomination and
Remuneration Committee Audit
Committee Risk
Committee
Attended Held Attended Held Attended Held Attended Held
Richard Grellman AM 7 7 - - - - - -
David Griffith 7 7 - - - - - -
Robin Low 7 7 3 3 5 5 2 2
Sally Pitkin 7 7 3 3 5 5 2 2 John Atkin 7 7 3 3 5 5 2 2 Held: represents the number of meetings held during the time the Director held office.
2. Company secretary Philip Heuzenroeder, BEc, LLB, LLM, GAICD (Order of Merit). Mr Heuzenroeder was appointed Group General Counsel and Company Secretary on 29 April 2016. He is a solicitor with over 20 years professional experience working in private practice and in-house, with experience in a broad range of areas of law including commercial law, competition law, ICT and intellectual property, and litigation. Philip was formerly a Principal of Spruson & Ferguson Lawyers and was a director of the Cure Brain Cancer Foundation from 2013 to 2017.
3. Principal activities During the year principal activities of the Group consisted of:
IP services related to provision of filing, prosecution, enforcement and management of patents, designs, trade marks and other IP in Australia, Asia and other countries; and
the development and provision of IP data and analytics software under the subscription licence model whereby the software is licensed and paid for on a recurring basis.
There were no significant changes in the nature of activities of the Group during that period.
4. Operational and Financial Review
4.1 Operations and Financial performance
The summary financial analysis below shows the results on a statutory and underlying basis.
The FY17 underlying earnings of the Group have been determined by adjusting statutory earnings amounts to eliminate the effect of business acquisition adjustments, business acquisition costs, new business establishment costs and non-cash share based payments expenses.
Revenue has grown by $28.5M to $186.0M, up by 18%, driven by organic growth and the impact of acquisitions offset by the impact of a stronger Australian dollar than in the comparative period.
EBITDA increased by $9.2M to $68.7M, up from $59.5M in FY16. Underlying EBITDA of $71.6M has increased by 10% from the prior corresponding period.
The Group achieved a statutory net profit after tax of $42.9M up 10% from $38.8M in FY16. Underlying net profit after tax of $51.2M is a 9% improvement over the prior period.
6
IPH Limited and its Controlled Entities Directors’ Report (continued)
30 June 2017
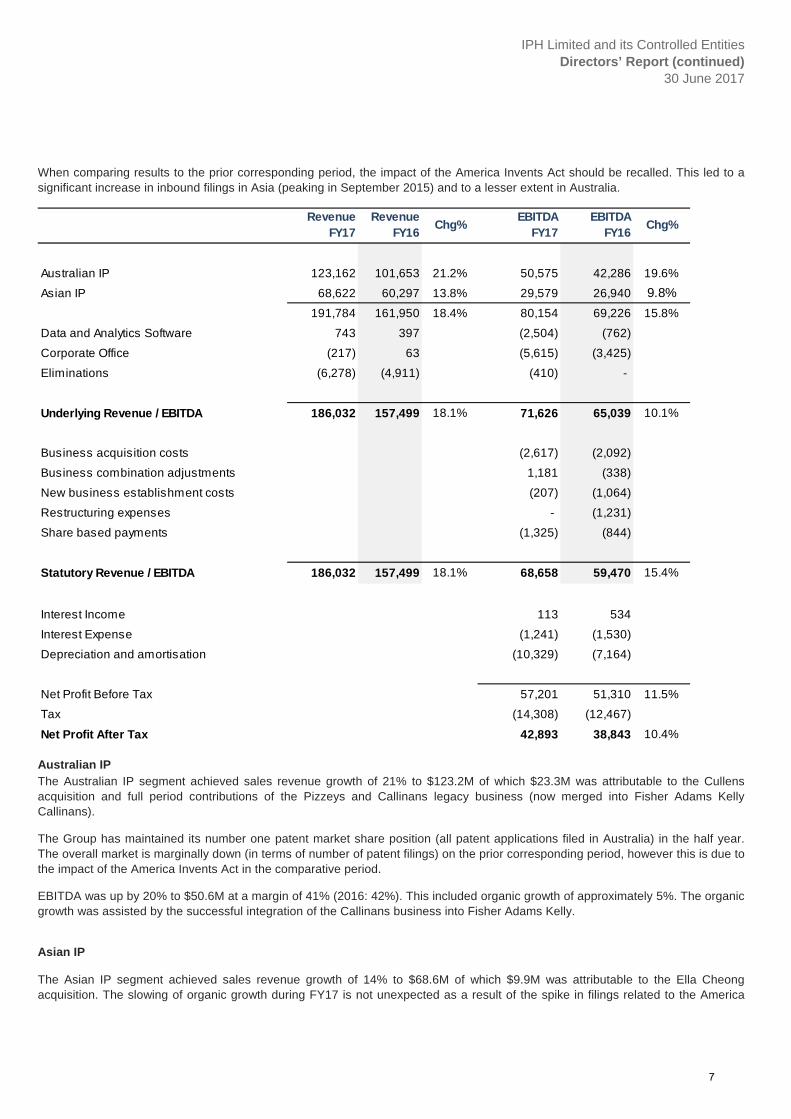
When comparing results to the prior corresponding period, the impact of the America Invents Act should be recalled. This led to a significant increase in inbound filings in Asia (peaking in September 2015) and to a lesser extent in Australia.
Australian IP The Australian IP segment achieved sales revenue growth of 21% to $123.2M of which $23.3M was attributable to the Cullens acquisition and full period contributions of the Pizzeys and Callinans legacy business (now merged into Fisher Adams Kelly Callinans).
The Group has maintained its number one patent market share position (all patent applications filed in Australia) in the half year. The overall market is marginally down (in terms of number of patent filings) on the prior corresponding period, however this is due to the impact of the America Invents Act in the comparative period.
EBITDA was up by 20% to $50.6M at a margin of 41% (2016: 42%). This included organic growth of approximately 5%. The organic growth was assisted by the successful integration of the Callinans business into Fisher Adams Kelly.
Asian IP The Asian IP segment achieved sales revenue growth of 14% to $68.6M of which $9.9M was attributable to the Ella Cheong acquisition. The slowing of organic growth during FY17 is not unexpected as a result of the spike in filings related to the America
RevenueFY17
RevenueFY16
Chg%EBITDA
FY17EBITDA
FY16Chg%
Australian IP 123,162 101,653 21.2% 50,575 42,286 19.6%
Asian IP 68,622 60,297 13.8% 29,579 26,940 9.8%
191,784 161,950 18.4% 80,154 69,226 15.8%
Data and Analytics Software 743 397 (2,504) (762)
Corporate Office (217) 63 (5,615) (3,425)
Eliminations (6,278) (4,911) (410) -
Underlying Revenue / EBITDA 186,032 157,499 18.1% 71,626 65,039 10.1%
Business acquisition costs (2,617) (2,092)
Business combination adjustments 1,181 (338)
New business establishment costs (207) (1,064)
Restructuring expenses - (1,231)
Share based payments (1,325) (844)
Statutory Revenue / EBITDA 186,032 157,499 18.1% 68,658 59,470 15.4%
Interest Income 113 534
Interest Expense (1,241) (1,530)
Depreciation and amortisation (10,329) (7,164)
Net Profit Before Tax 57,201 51,310 11.5%
Tax (14,308) (12,467)
Net Profit After Tax 42,893 38,843 10.4%
7
IPH Limited and its Controlled Entities Directors’ Report (continued)
30 June 2017
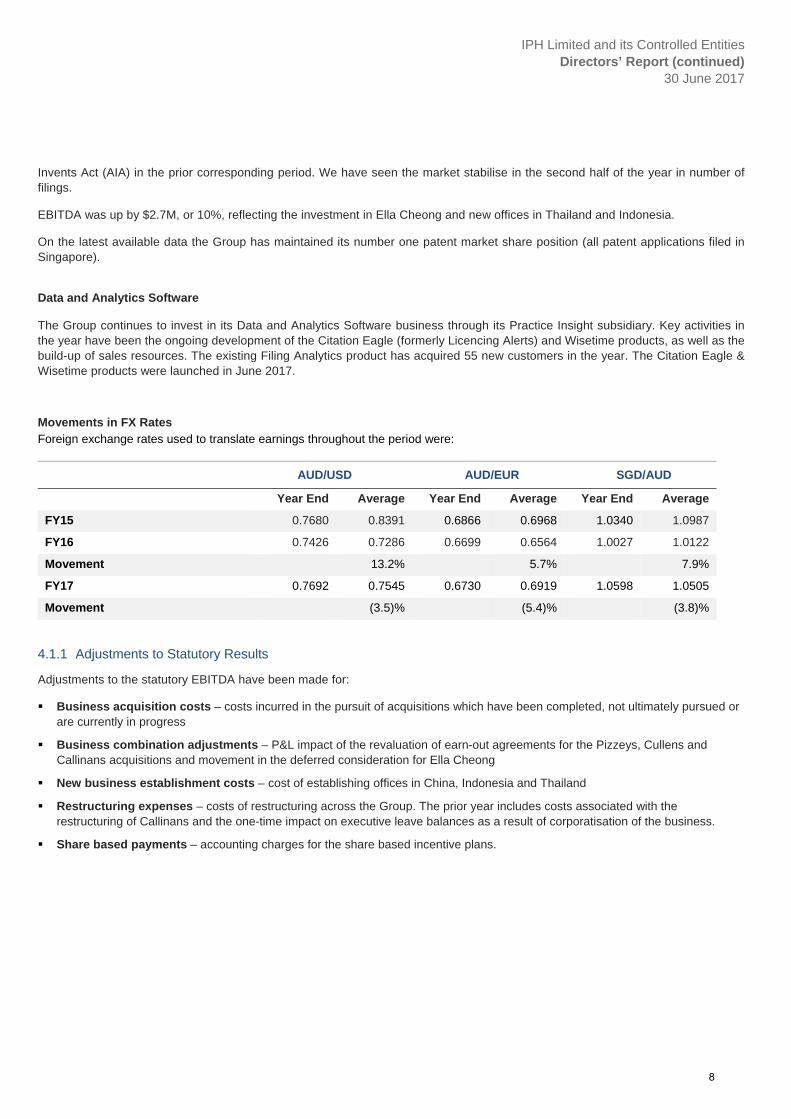
Invents Act (AIA) in the prior corresponding period. We have seen the market stabilise in the second half of the year in number of filings.
EBITDA was up by $2.7M, or 10%, reflecting the investment in Ella Cheong and new offices in Thailand and Indonesia.
On the latest available data the Group has maintained its number one patent market share position (all patent applications filed in Singapore).
Data and Analytics Software The Group continues to invest in its Data and Analytics Software business through its Practice Insight subsidiary. Key activities in the year have been the ongoing development of the Citation Eagle (formerly Licencing Alerts) and Wisetime products, as well as the build-up of sales resources. The existing Filing Analytics product has acquired 55 new customers in the year. The Citation Eagle & Wisetime products were launched in June 2017.
Movements in FX Rates Foreign exchange rates used to translate earnings throughout the period were:
AUD/USD AUD/EUR SGD/AUD
Year End Average Year End Average Year End Average
FY15 0.7680 0.8391 0.6866 0.6968 1.0340 1.0987
FY16 0.7426 0.7286 0.6699 0.6564 1.0027 1.0122
Movement 13.2% 5.7% 7.9%
FY17 0.7692 0.7545 0.6730 0.6919 1.0598 1.0505
Movement (3.5)% (5.4)% (3.8)%
4.1.1 Adjustments to Statutory Results
Adjustments to the statutory EBITDA have been made for:
Business acquisition costs – costs incurred in the pursuit of acquisitions which have been completed, not ultimately pursued or are currently in progress
Business combination adjustments – P&L impact of the revaluation of earn-out agreements for the Pizzeys, Cullens and Callinans acquisitions and movement in the deferred consideration for Ella Cheong
New business establishment costs – cost of establishing offices in China, Indonesia and Thailand
Restructuring expenses – costs of restructuring across the Group. The prior year includes costs associated with the restructuring of Callinans and the one-time impact on executive leave balances as a result of corporatisation of the business.
Share based payments – accounting charges for the share based incentive plans.
8
IPH Limited and its Controlled Entities Directors’ Report (continued)
30 June 2017
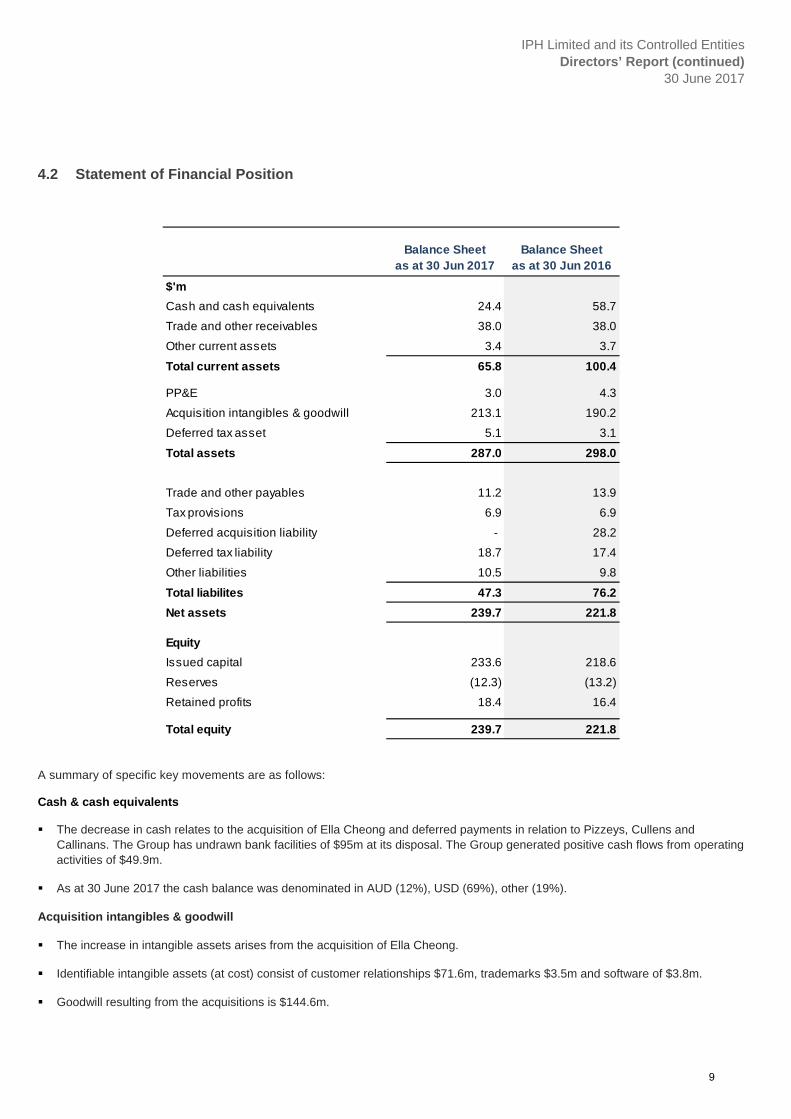
4.2 Statement of Financial Position
A summary of specific key movements are as follows:
Cash & cash equivalents The decrease in cash relates to the acquisition of Ella Cheong and deferred payments in relation to Pizzeys, Cullens and
Callinans. The Group has undrawn bank facilities of $95m at its disposal. The Group generated positive cash flows from operating activities of $49.9m.
As at 30 June 2017 the cash balance was denominated in AUD (12%), USD (69%), other (19%).
Acquisition intangibles & goodwill
The increase in intangible assets arises from the acquisition of Ella Cheong.
Identifiable intangible assets (at cost) consist of customer relationships $71.6m, trademarks $3.5m and software of $3.8m.
Goodwill resulting from the acquisitions is $144.6m.
Balance Sheet as at 30 Jun 2017
Balance Sheet as at 30 Jun 2016
$'m
Cash and cash equivalents 24.4 58.7
Trade and other receivables 38.0 38.0
Other current assets 3.4 3.7
Total current assets 65.8 100.4
PP&E 3.0 4.3
Acquisition intangibles & goodwill 213.1 190.2
Deferred tax asset 5.1 3.1
Total assets 287.0 298.0
Trade and other payables 11.2 13.9
Tax provisions 6.9 6.9
Deferred acquisition liability - 28.2
Deferred tax liability 18.7 17.4
Other liabilities 10.5 9.8
Total liabilites 47.3 76.2
Net assets 239.7 221.8
Equity
Issued capital 233.6 218.6
Reserves (12.3) (13.2)
Retained profits 18.4 16.4
Total equity 239.7 221.8
9
IPH Limited and its Controlled Entities Directors’ Report (continued)
30 June 2017
Liabilities
All deferred acquisition liabilities have been settled during FY17 – Pizzeys $13.4m, Cullens $6.1m and Callinans $2.7m.
The deferred tax liabilities related to the identifiable intangible assets on acquisitions and have increased with the acquisition of Ella Cheong.
Equity
The increase in issued capital arises on equity components of the settlement of deferred acquisition payments.
Acquisitions On 31 October 2016 IPH completed its first international acquisition upon reaching agreement to acquire Ella Cheong (Hong Kong) Limited and its subsidiary Ella Cheong Intellectual Property Agency (Beijing) Company Limited (“Ella Cheong Hong Kong & Beijing”). Upon completion of the transaction Ella Cheong Hong Kong & Beijing was rebranded as Spruson & Ferguson, and further extends the IPH group’s reach into Asia. The agreed purchase consideration for the acquisition is HK$169.4m (approximately A$28.9m).
The acquisitions represent a significant step in IPH’s strategy of building an intellectual property network in secondary markets internationally and provide an excellent platform for Spruson & Ferguson to expand the provision of its services for existing and new clients in Greater China.
4.3 Business Model, Strategy and Outlook
4.3.1 Business Model
IPH Limited is an intellectual property group operating a number of independent professional businesses providing intellectual property services (“IP Services”) and IP data and analytics software (“Data Services”) sectors.
In IPH’s IP services businesses in Australia and Asia, revenue is derived from fees charged for the provision of professional IP services by each firm as related to securing, enforcing and managing IP rights in the country (directly or through an agent ) in which registration is sought by the client. The business model allows IPH to generate recurring revenue streams throughout all stages of the IP lifecycle from its long-standing and diverse client base.
Practice Insight, IPH’s Data services business, generates revenue from the sale of its products directly or through a third party under an annual subscription licence model.
Factors that affect the performance of both business segments include, amongst others, the performance of the global and Australian economies, client activity levels, competitor activity, and the regulatory environment in which the services are provided.
4.3.2 Strategy
IPH Vision, Mission and Values From the Company’s foundation and listing on the ASX in November 2014, IPH has been pursuing the vision of becoming the leading IP group in IP secondary1 markets and adjacent areas of IP.
IPH mission is to provide the highest quality of service to our clients, meeting their needs and exceeding their expectations, whilst delivering sustainable growth and value to all of our stakeholders.
1 The primary IP markets of USA, Japan and Western Europe generate the majority of IP rights and clients by value. The secondary markets are all countries outside of USA, Japan and Western Europe.
10
IPH Limited and its Controlled Entities Directors’ Report (continued)
30 June 2017
From our origins in 1887 as Spruson & Ferguson, IPH’s success continues to be underpinned by key drivers and values at the core our businesses, which remain unchanged: Excellence in service delivery to our clients Innovation in value creation Integrity in business practices Efficiency and effectiveness in operations Empowerment and engagement of our people Value creating growth strategies IPH’s plan is to achieve its goals through implementation of strategic initiatives in five key areas:
Australian IP businesses
Asia IP business
Other secondary IP markets
Adjacent to IP markets
Business Improvements and Operations
Australian IP businesses
A key objective of all IPH’s Australian businesses is to continue to organically grow volume of filings, market share and revenue across all disciplines. IPH’s Australian businesses are also important part of Asian growth strategy and valuable source of filings and revenue into IPH’s Asian business in high growth Asian region.
Asian IP businesses
Over the past two years IPH has successfully executed on its Asian growth strategy with opening offices in Thailand and Indonesia and expanding into China and Hong Kong through acquisition of Ella Cheong Hong Kong and Beijing (re-branded Spruson & Ferguson). The expansion provided excellent platform for IPH’s Asian business to extend the provision of IP services to new geographical areas for existing clients and improved services offering for potential new clients. The key focus for IPH’s Asian business is to leverage existing infrastructure for further organic growth. IPH will continue to assess organic and M&A opportunities in Asia as they arise. Other secondary IP markets
IPH adopted strategic and disciplined approach to assessment of any of the potential M&A opportunities in Asia-Pacific and other secondary IP markets. Most and foremost, the growth opportunities are evaluated on the extent to which they help to achieve IPH’s strategic objectives. IPH continues to evaluate acquisition opportunities in international secondary markets.
Adjacent to IP markets
Over the past 40 years the IP industry observed the rise of non-traditional IP service providers offering alternative ways of servicing and delivering value to clients through technology and data-driven business models. With the acquisition and further investment in Practice Insight IPH is well positioned to capitalise on disruptive innovation. IPH continuously explores new opportunities in the adjacent to IP markets.
Business Improvements and Operations
In FY18, IPH will continue to focus on optimisation of IPH’s businesses with a view to extract operational efficiencies and improve quality of service for our clients.
11
IPH Limited and its Controlled Entities Directors’ Report (continued)
30 June 2017
4.3.3 Outlook
The Group’s Australian businesses are expected to revert to growth rates in line with the underlying market trends experienced in recent years. There will be a focus on continued margin improvement across all businesses through IT initiatives and business process improvements.
In Asia, it is expected that filing growth trends in the region will continue to normalise back to pre-AIA levels. We expect to maintain market share in Singapore and look to expand market share in higher growth jurisdictions. There will be a focus on leveraging and strengthening the Group’s existing network in Asia. Organic company growth in the region will be driven by filings directed from IPH’s Australian businesses and international clients acquired through traditional channels. The increasing trend of case transfers will support revenue growth into the future. Our China and Hong Kong businesses will seek to strengthen the patent capability of the offices and the capturing of market share in our addressable market.
The Data and Analytics Software business now has all products released, with the expectation that further enhancements will be made to the product suite on the basis of customer feedback. The immediate focus is on marketing and sales with a further investment in FY18 of approximately $3M, subject to meeting periodic performance milestones.
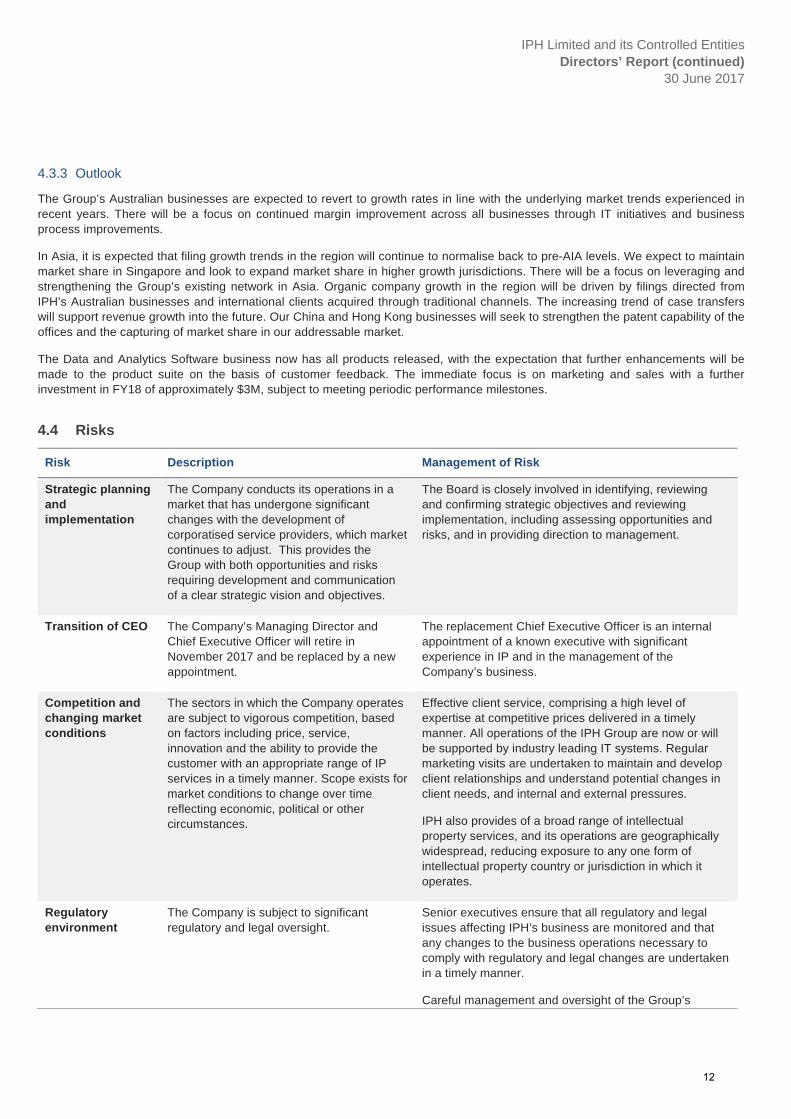
4.4 Risks
Risk Description Management of Risk
Strategic planning and implementation
The Company conducts its operations in a market that has undergone significant changes with the development of corporatised service providers, which market continues to adjust. This provides the Group with both opportunities and risks requiring development and communication of a clear strategic vision and objectives.
The Board is closely involved in identifying, reviewing and confirming strategic objectives and reviewing implementation, including assessing opportunities and risks, and in providing direction to management.
Transition of CEO The Company’s Managing Director and Chief Executive Officer will retire in November 2017 and be replaced by a new appointment.
The replacement Chief Executive Officer is an internal appointment of a known executive with significant experience in IP and in the management of the Company’s business.
Competition and changing market conditions
The sectors in which the Company operates are subject to vigorous competition, based on factors including price, service, innovation and the ability to provide the customer with an appropriate range of IP services in a timely manner. Scope exists for market conditions to change over time reflecting economic, political or other circumstances.
Effective client service, comprising a high level of expertise at competitive prices delivered in a timely manner. All operations of the IPH Group are now or will be supported by industry leading IT systems. Regular marketing visits are undertaken to maintain and develop client relationships and understand potential changes in client needs, and internal and external pressures.
IPH also provides of a broad range of intellectual property services, and its operations are geographically widespread, reducing exposure to any one form of intellectual property country or jurisdiction in which it operates.
Regulatory environment
The Company is subject to significant regulatory and legal oversight.
Senior executives ensure that all regulatory and legal issues affecting IPH’s business are monitored and that any changes to the business operations necessary to comply with regulatory and legal changes are undertaken in a timely manner.
Careful management and oversight of the Group’s
12
IPH Limited and its Controlled Entities Directors’ Report (continued)
30 June 2017
Risk Description Management of Risk
internal case management system.
Principal review of all professional work and compliance with a professional work approval matrix for outgoing work. The approval matrix is correlated to the complexity and level of potential risk associated with the work.
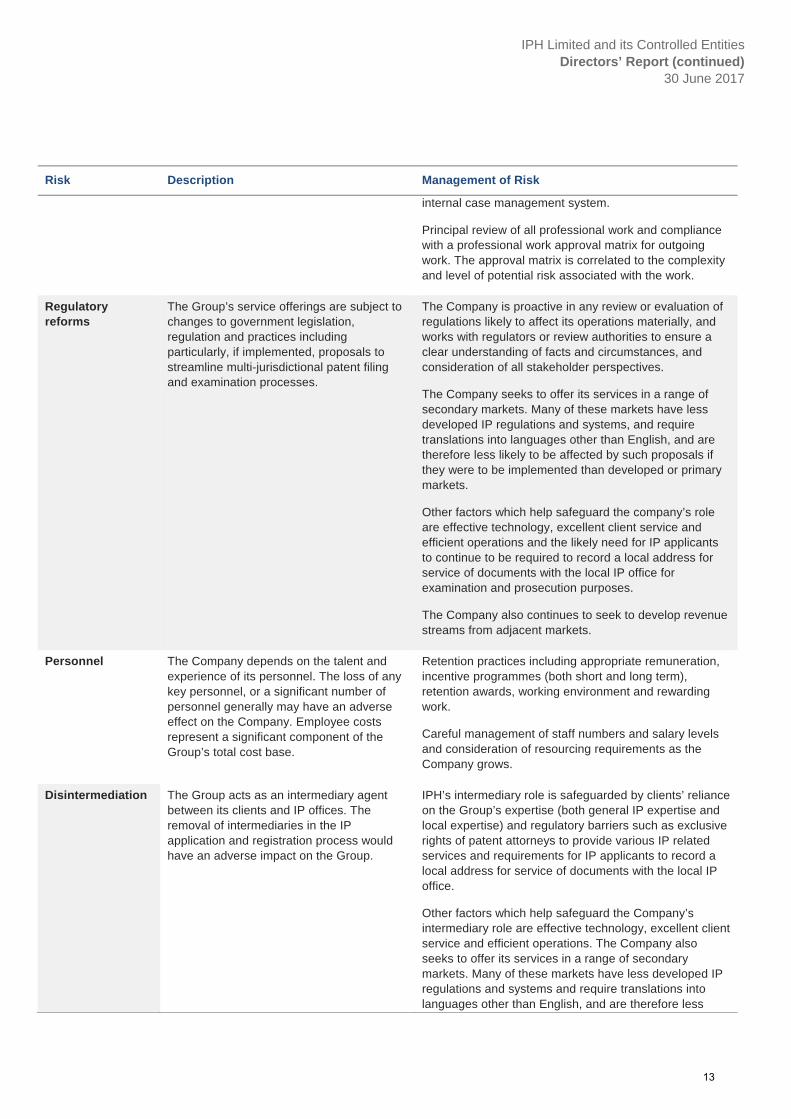
Regulatory reforms
The Group’s service offerings are subject to changes to government legislation, regulation and practices including particularly, if implemented, proposals to streamline multi-jurisdictional patent filing and examination processes.
The Company is proactive in any review or evaluation of regulations likely to affect its operations materially, and works with regulators or review authorities to ensure a clear understanding of facts and circumstances, and consideration of all stakeholder perspectives.
The Company seeks to offer its services in a range of secondary markets. Many of these markets have less developed IP regulations and systems, and require translations into languages other than English, and are therefore less likely to be affected by such proposals if they were to be implemented than developed or primary markets.
Other factors which help safeguard the company’s role are effective technology, excellent client service and efficient operations and the likely need for IP applicants to continue to be required to record a local address for service of documents with the local IP office for examination and prosecution purposes.
The Company also continues to seek to develop revenue streams from adjacent markets.
Personnel The Company depends on the talent and experience of its personnel. The loss of any key personnel, or a significant number of personnel generally may have an adverse effect on the Company. Employee costs represent a significant component of the Group’s total cost base.
Retention practices including appropriate remuneration, incentive programmes (both short and long term), retention awards, working environment and rewarding work.
Careful management of staff numbers and salary levels and consideration of resourcing requirements as the Company grows.
Disintermediation The Group acts as an intermediary agent between its clients and IP offices. The removal of intermediaries in the IP application and registration process would have an adverse impact on the Group.
IPH’s intermediary role is safeguarded by clients’ reliance on the Group’s expertise (both general IP expertise and local expertise) and regulatory barriers such as exclusive rights of patent attorneys to provide various IP related services and requirements for IP applicants to record a local address for service of documents with the local IP office.
Other factors which help safeguard the Company’s intermediary role are effective technology, excellent client service and efficient operations. The Company also seeks to offer its services in a range of secondary markets. Many of these markets have less developed IP regulations and systems and require translations into languages other than English, and are therefore less
13
IPH Limited and its Controlled Entities Directors’ Report (continued)
30 June 2017
Risk Description Management of Risk
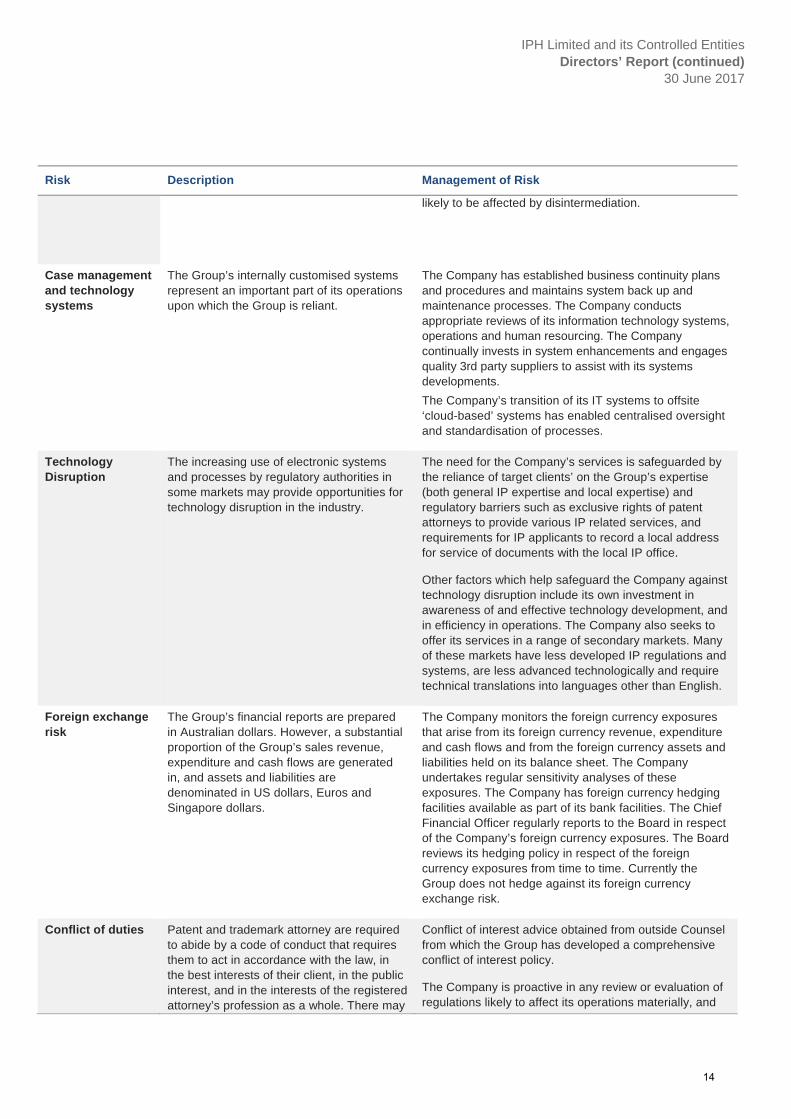
likely to be affected by disintermediation.
Case management and technology systems
The Group’s internally customised systems represent an important part of its operations upon which the Group is reliant.
The Company has established business continuity plans and procedures and maintains system back up and maintenance processes. The Company conducts appropriate reviews of its information technology systems, operations and human resourcing. The Company continually invests in system enhancements and engages quality 3rd party suppliers to assist with its systems developments.
The Company’s transition of its IT systems to offsite ‘cloud-based’ systems has enabled centralised oversight and standardisation of processes.
Technology Disruption
The increasing use of electronic systems and processes by regulatory authorities in some markets may provide opportunities for technology disruption in the industry.
The need for the Company’s services is safeguarded by the reliance of target clients’ on the Group’s expertise (both general IP expertise and local expertise) and regulatory barriers such as exclusive rights of patent attorneys to provide various IP related services, and requirements for IP applicants to record a local address for service of documents with the local IP office.
Other factors which help safeguard the Company against technology disruption include its own investment in awareness of and effective technology development, and in efficiency in operations. The Company also seeks to offer its services in a range of secondary markets. Many of these markets have less developed IP regulations and systems, are less advanced technologically and require technical translations into languages other than English.
Foreign exchange risk
The Group’s financial reports are prepared in Australian dollars. However, a substantial proportion of the Group’s sales revenue, expenditure and cash flows are generated in, and assets and liabilities are denominated in US dollars, Euros and Singapore dollars.
The Company monitors the foreign currency exposures that arise from its foreign currency revenue, expenditure and cash flows and from the foreign currency assets and liabilities held on its balance sheet. The Company undertakes regular sensitivity analyses of these exposures. The Company has foreign currency hedging facilities available as part of its bank facilities. The Chief Financial Officer regularly reports to the Board in respect of the Company’s foreign currency exposures. The Board reviews its hedging policy in respect of the foreign currency exposures from time to time. Currently the Group does not hedge against its foreign currency exchange risk.
Conflict of duties Patent and trademark attorney are required to abide by a code of conduct that requires them to act in accordance with the law, in the best interests of their client, in the public interest, and in the interests of the registered attorney’s profession as a whole. There may
Conflict of interest advice obtained from outside Counsel from which the Group has developed a comprehensive conflict of interest policy.
The Company is proactive in any review or evaluation of regulations likely to affect its operations materially, and
14
IPH Limited and its Controlled Entities Directors’ Report (continued)
30 June 2017
Risk Description Management of Risk
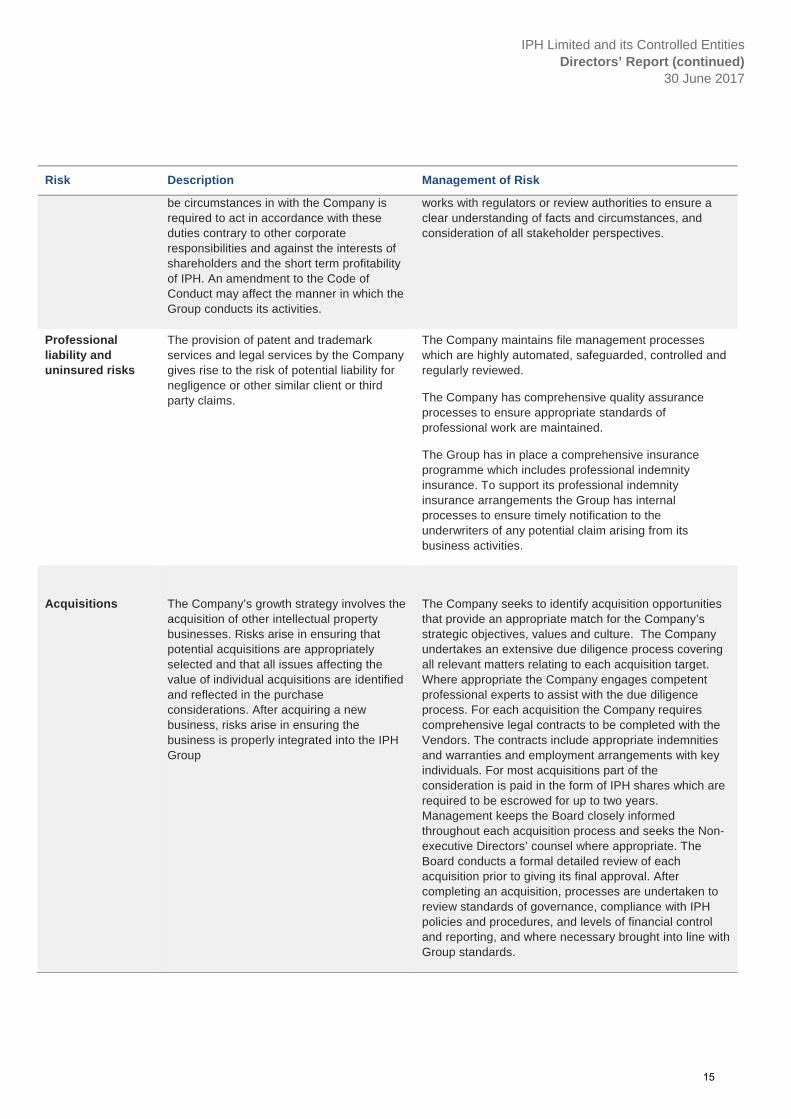
be circumstances in with the Company is required to act in accordance with these duties contrary to other corporate responsibilities and against the interests of shareholders and the short term profitability of IPH. An amendment to the Code of Conduct may affect the manner in which the Group conducts its activities.
works with regulators or review authorities to ensure a clear understanding of facts and circumstances, and consideration of all stakeholder perspectives.
Professional liability and uninsured risks
The provision of patent and trademark services and legal services by the Company gives rise to the risk of potential liability for negligence or other similar client or third party claims.
The Company maintains file management processes which are highly automated, safeguarded, controlled and regularly reviewed.
The Company has comprehensive quality assurance processes to ensure appropriate standards of professional work are maintained.
The Group has in place a comprehensive insurance programme which includes professional indemnity insurance. To support its professional indemnity insurance arrangements the Group has internal processes to ensure timely notification to the underwriters of any potential claim arising from its business activities.
Acquisitions
The Company’s growth strategy involves the acquisition of other intellectual property businesses. Risks arise in ensuring that potential acquisitions are appropriately selected and that all issues affecting the value of individual acquisitions are identified and reflected in the purchase considerations. After acquiring a new business, risks arise in ensuring the business is properly integrated into the IPH Group
The Company seeks to identify acquisition opportunities that provide an appropriate match for the Company’s strategic objectives, values and culture. The Company undertakes an extensive due diligence process covering all relevant matters relating to each acquisition target. Where appropriate the Company engages competent professional experts to assist with the due diligence process. For each acquisition the Company requires comprehensive legal contracts to be completed with the Vendors. The contracts include appropriate indemnities and warranties and employment arrangements with key individuals. For most acquisitions part of the consideration is paid in the form of IPH shares which are required to be escrowed for up to two years. Management keeps the Board closely informed throughout each acquisition process and seeks the Non-executive Directors’ counsel where appropriate. The Board conducts a formal detailed review of each acquisition prior to giving its final approval. After completing an acquisition, processes are undertaken to review standards of governance, compliance with IPH policies and procedures, and levels of financial control and reporting, and where necessary brought into line with Group standards.
15
IPH Limited and its Controlled Entities Directors’ Report (continued)
30 June 2017
5. Remuneration report (audited) Introduction from the Nomination and Remuneration Committee Chair
Dear Shareholder,
On behalf of the Board, I am pleased to present the Remuneration Report for the 2017 financial year.
The Company’s remuneration framework was initially developed in the context of the Company’s IPO in November 2014 and particularly the very significant continuing equity ownership held by the CEO and a number of other Principals. As foreshadowed in last year’s report, the Committee has reviewed the framework and implemented changes that reflect the transition from a private firm to a publicly listed company and the acquisition of a number of other businesses during that time.
Professional Staff Incentive Plan
The long term incentive scheme in place for professional staff has been replaced for future years by a new Equity Incentive Plan that provides a more direct link between individual performance and incentive achievement. In broad terms, half the balance of an incentive achieved (by reference to individual targets such as billings and client and expertise development) in any particular year will be paid in cash and half in IPH Limited shares. These shares will be issued to the employee immediately but held in trust for a period of three years. It is anticipated that this plan will be progressively rolled out to all business units in the group.
Corporate Executive Remuneration
Short and long term incentive measures for FY18 have been formalised for the IPH executive.
The Directors are of the view that fixed remuneration should be set at median market levels compared to peers with similar revenues and market capitalisation. At this stage of the company’s development, a simple annual bonus for superior performance awarded at the Board’s discretion having regard to the Group’s overall performance and the individual executive’s performance against agreed performance goals or key result areas is appropriate as a short term supplement to fixed remuneration. The long term Incentive is structured to align the long term interests of shareholders and executives and is pitched at the upper quartiles compared to the same peer group. Long term incentives will vest over a three year period with reference to EPS performance hurdles.
These changes have taken effect from 1 July 2017. Details of these arrangements affecting the KMP have been included in this report for the information of shareholders.
CEO Transition
As announced on 2 May 2017, Dr Andrew Blattman will succeed David Griffith as Managing Director and CEO in November 2017. In light of this transition Dr Blattman’s remuneration has been reviewed as of 1 July 2017.
Company Performance
The underlying performance of IPH Limited since the IPO has been extremely positive. Total shareholder returns during that time have ranked the company 16th against its peers in the ASX300 Accumulation Index. As a result of this and the achievement of the EPS hurdle, the performance criteria for the long term Incentives issued at IPO have been met and will therefore vest on the vesting date of 9 September 2017.
The Company continues to review its remuneration framework for all its executives and professional staff, including KMP, to ensure that on an ongoing basis the Company is able to attract, motivate and retain the talent necessary to run the business and drive behaviour that aligns with the creation of sustainable shareholder value.
We look forward to your continued support and welcome your feedback on our remuneration report.
Yours sincerely,
John Atkin Nomination and Remuneration Committee Chair
16
IPH Limited and its Controlled Entities Directors’ Report (continued)
30 June 2017
The remuneration report details the key management personnel (‘KMP’) remuneration arrangements for the Group, in accordance with the requirements of the Corporations Act 2001 and its Regulations.
KMP are those persons having authority and responsibility for planning, directing and controlling the activities of the Group, directly or indirectly, including all Directors.
The remuneration report is set out under the following main headings:
Principles used to determine the nature and amount of remuneration
Details of remuneration
Service agreements
Share-based compensation
Additional disclosures relating to key management personnel
5.1 Principles used to determine the nature and amount of remuneration
The objective of the Group’s executive reward framework is to ensure reward for performance is competitive and appropriate for the results delivered. The framework aligns executive reward with the achievement of strategic objectives and the creation of value for shareholders. The Board of Directors (‘the Board’) ensures that executive reward satisfies the following key criteria for good reward governance practices:
competitiveness and reasonableness;
acceptability to shareholders;
performance linkage / alignment of executive compensation; and
transparency.
The Nomination and Remuneration Committee (‘NRC’) is responsible for reviewing and making recommendations to the Board on remuneration packages and policies related to the Directors and other KMP and to ensure that the remuneration policies and practices are consistent with the Group’s strategic goals and human resources objectives. The performance of the Group depends on the quality of its Directors and other KMP. The remuneration philosophy is to attract, motivate and retain high performance and high quality personnel.
The NRC has structured an executive remuneration framework that is market competitive and complementary to the reward strategy of the Group.
Alignment to shareholders’ interests:
focuses on sustained growth in earnings per share as well as focusing the executive on key non-financial drivers of value; and
attracts and retains high calibre executives.
Alignment to program participants’ interests:
rewards capability and experience;
reflects competitive reward for contribution to growth in shareholder wealth; and
provides a clear structure for earning rewards.
17
IPH Limited and its Controlled Entities Directors’ Report (continued)
30 June 2017
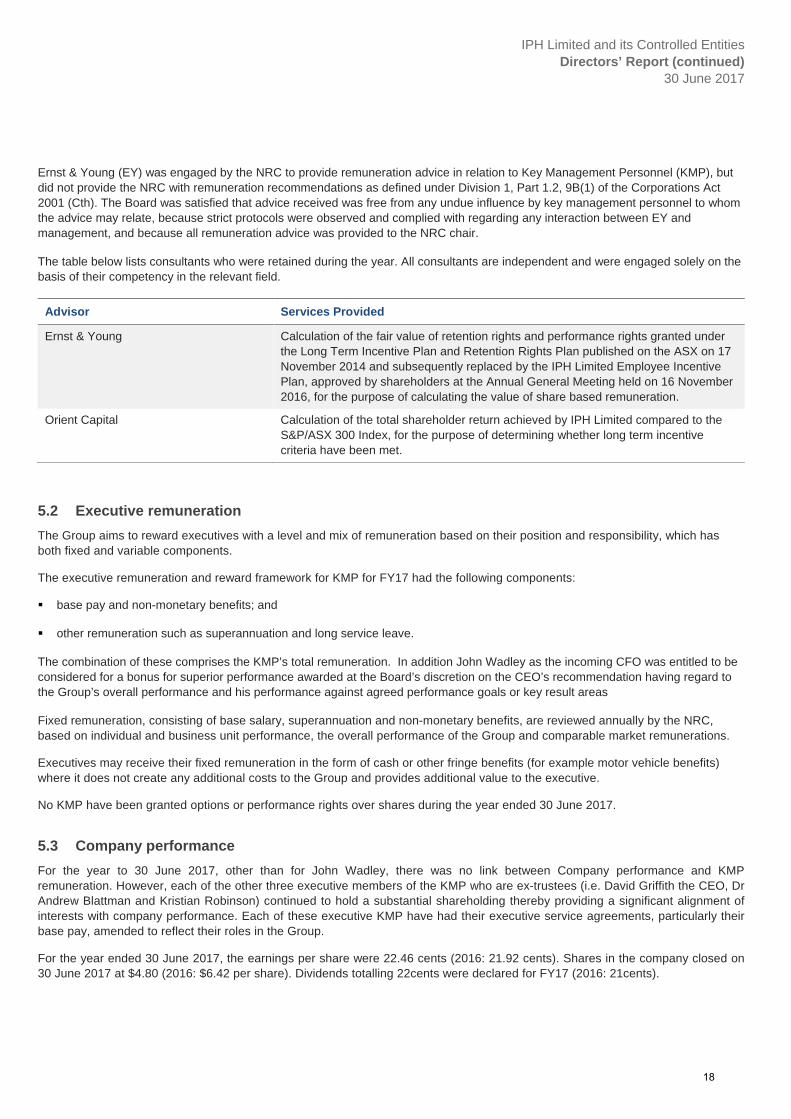
Ernst & Young (EY) was engaged by the NRC to provide remuneration advice in relation to Key Management Personnel (KMP), but did not provide the NRC with remuneration recommendations as defined under Division 1, Part 1.2, 9B(1) of the Corporations Act 2001 (Cth). The Board was satisfied that advice received was free from any undue influence by key management personnel to whom the advice may relate, because strict protocols were observed and complied with regarding any interaction between EY and management, and because all remuneration advice was provided to the NRC chair.
The table below lists consultants who were retained during the year. All consultants are independent and were engaged solely on the basis of their competency in the relevant field.
Advisor Services Provided
Ernst & Young Calculation of the fair value of retention rights and performance rights granted under the Long Term Incentive Plan and Retention Rights Plan published on the ASX on 17 November 2014 and subsequently replaced by the IPH Limited Employee Incentive Plan, approved by shareholders at the Annual General Meeting held on 16 November 2016, for the purpose of calculating the value of share based remuneration.
Orient Capital Calculation of the total shareholder return achieved by IPH Limited compared to the S&P/ASX 300 Index, for the purpose of determining whether long term incentive criteria have been met.
5.2 Executive remuneration
The Group aims to reward executives with a level and mix of remuneration based on their position and responsibility, which has both fixed and variable components.
The executive remuneration and reward framework for KMP for FY17 had the following components:
base pay and non-monetary benefits; and
other remuneration such as superannuation and long service leave.
The combination of these comprises the KMP’s total remuneration. In addition John Wadley as the incoming CFO was entitled to be considered for a bonus for superior performance awarded at the Board’s discretion on the CEO’s recommendation having regard to the Group’s overall performance and his performance against agreed performance goals or key result areas
Fixed remuneration, consisting of base salary, superannuation and non-monetary benefits, are reviewed annually by the NRC, based on individual and business unit performance, the overall performance of the Group and comparable market remunerations.
Executives may receive their fixed remuneration in the form of cash or other fringe benefits (for example motor vehicle benefits) where it does not create any additional costs to the Group and provides additional value to the executive.
No KMP have been granted options or performance rights over shares during the year ended 30 June 2017.
5.3 Company performance
For the year to 30 June 2017, other than for John Wadley, there was no link between Company performance and KMP remuneration. However, each of the other three executive members of the KMP who are ex-trustees (i.e. David Griffith the CEO, Dr Andrew Blattman and Kristian Robinson) continued to hold a substantial shareholding thereby providing a significant alignment of interests with company performance. Each of these executive KMP have had their executive service agreements, particularly their base pay, amended to reflect their roles in the Group.
For the year ended 30 June 2017, the earnings per share were 22.46 cents (2016: 21.92 cents). Shares in the company closed on 30 June 2017 at $4.80 (2016: $6.42 per share). Dividends totalling 22cents were declared for FY17 (2016: 21cents).
18
IPH Limited and its Controlled Entities Directors’ Report (continued)
30 June 2017
5.4 Non-executive Directors remuneration
Fees and payments to non-executive Directors reflect the demands and responsibilities of their role. Non-executive Directors’ fees and payments are reviewed periodically by the NRC. The NRC may, from time to time, receive advice from independent remuneration consultants to ensure Non-executive Directors’ fees and payments are appropriate and in line with the market.
The Chairman’s fees are determined independently from the fees of other non-executive Directors based on comparative roles in the external market. Non-executive Directors do not receive share options or other incentives and their remuneration must not include a commission on, or a percentage of, operating revenue.
ASX listing rules require the aggregate non-executive Directors remuneration be determined periodically by a general meeting. Under the Company’s Constitution and as set out in the IPO Prospectus, total aggregate remuneration available to non-executive Directors is set currently at $750,000 per annum.
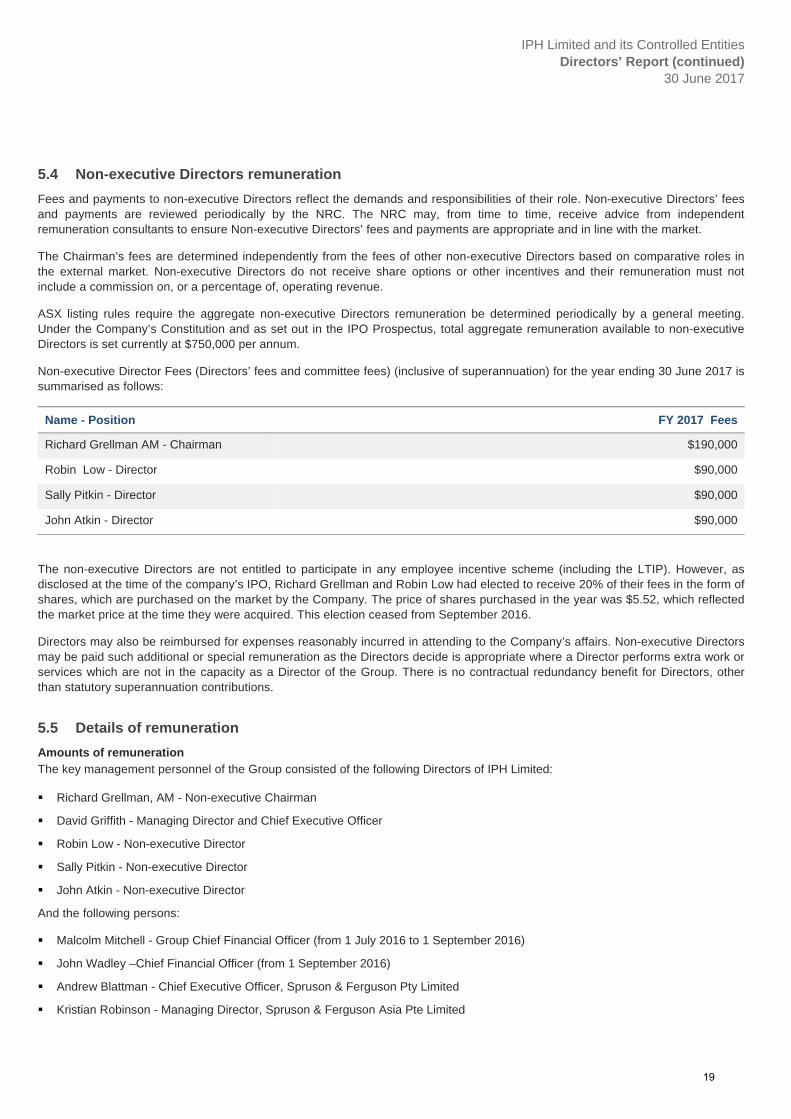
Non-executive Director Fees (Directors’ fees and committee fees) (inclusive of superannuation) for the year ending 30 June 2017 is summarised as follows:
Name - Position FY 2017 Fees
Richard Grellman AM - Chairman $190,000
Robin Low - Director $90,000
Sally Pitkin - Director $90,000
John Atkin - Director $90,000
The non-executive Directors are not entitled to participate in any employee incentive scheme (including the LTIP). However, as disclosed at the time of the company’s IPO, Richard Grellman and Robin Low had elected to receive 20% of their fees in the form of shares, which are purchased on the market by the Company. The price of shares purchased in the year was $5.52, which reflected the market price at the time they were acquired. This election ceased from September 2016.
Directors may also be reimbursed for expenses reasonably incurred in attending to the Company’s affairs. Non-executive Directors may be paid such additional or special remuneration as the Directors decide is appropriate where a Director performs extra work or services which are not in the capacity as a Director of the Group. There is no contractual redundancy benefit for Directors, other than statutory superannuation contributions.
5.5 Details of remuneration
Amounts of remuneration The key management personnel of the Group consisted of the following Directors of IPH Limited:
Richard Grellman, AM - Non-executive Chairman
David Griffith - Managing Director and Chief Executive Officer
Robin Low - Non-executive Director
Sally Pitkin - Non-executive Director
John Atkin - Non-executive Director
And the following persons:
Malcolm Mitchell - Group Chief Financial Officer (from 1 July 2016 to 1 September 2016)
John Wadley –Chief Financial Officer (from 1 September 2016)
Andrew Blattman - Chief Executive Officer, Spruson & Ferguson Pty Limited
Kristian Robinson - Managing Director, Spruson & Ferguson Asia Pte Limited
19
IPH Limited and its Controlled Entities Directors’ Report (continued)
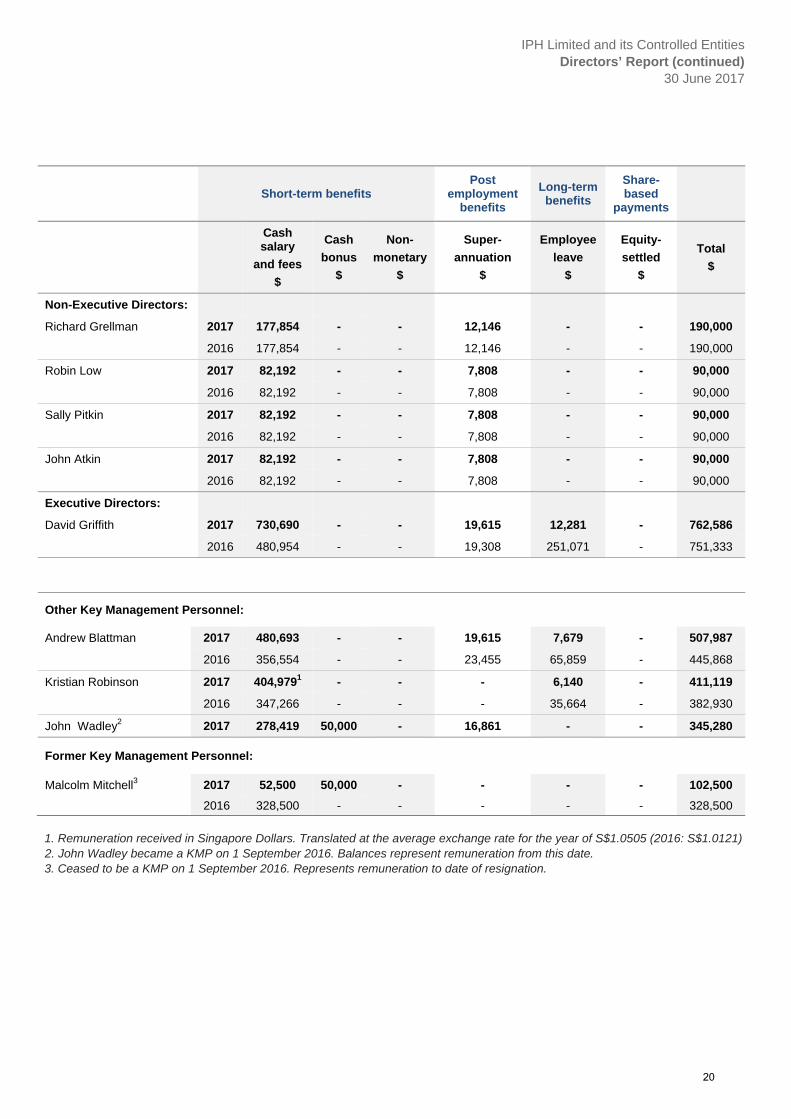
30 June 2017
Short-term benefits Post
employment benefits
Long-term benefits
Share-based
payments
Cash salary
and fees
$
Cash
bonus
$
Non-
monetary
$
Super-
annuation
$
Employee
leave
$
Equity-
settled
$
Total
$
Non-Executive Directors:
Richard Grellman 2017 177,854 - - 12,146 - - 190,000
2016 177,854 - - 12,146 - - 190,000
Robin Low 2017 82,192 - - 7,808 - - 90,000
2016 82,192 - - 7,808 - - 90,000
Sally Pitkin 2017 82,192 - - 7,808 - - 90,000
2016 82,192 - - 7,808 - - 90,000
John Atkin 2017 82,192 - - 7,808 - - 90,000
2016 82,192 - - 7,808 - - 90,000
Executive Directors:
David Griffith 2017 730,690 - - 19,615 12,281 - 762,586
2016 480,954 - - 19,308 251,071 - 751,333
Other Key Management Personnel:
Andrew Blattman 2017 480,693 - - 19,615 7,679 - 507,987
2016 356,554 - - 23,455 65,859 - 445,868
Kristian Robinson 2017 404,9791 - - - 6,140 - 411,119
2016 347,266 - - - 35,664 - 382,930
John Wadley2 2017 278,419 50,000 - 16,861 - - 345,280
Former Key Management Personnel:
Malcolm Mitchell3 2017 52,500 50,000 - - - - 102,500
2016 328,500 - - - - - 328,500
1. Remuneration received in Singapore Dollars. Translated at the average exchange rate for the year of S$1.0505 (2016: S$1.0121)
2. John Wadley became a KMP on 1 September 2016. Balances represent remuneration from this date. 3. Ceased to be a KMP on 1 September 2016. Represents remuneration to date of resignation.
20
IPH Limited and its Controlled Entities Directors’ Report (continued)
30 June 2017
5.6 Service agreements
Remuneration and other terms of employment for KMP are formalised in service or employment agreements. Details of these agreements are as follows:
David Griffith, Managing Director and Chief Executive Officer.
- Minimum three-year agreement commenced 17 November 2014.
- Base salary, inclusive of superannuation for the year ended 30 June 2017 of $750,000.
Dr Andrew Blattman, Chief Executive Officer, Spruson & Ferguson Pty Limited.
- Minimum three-year agreement commenced 1 January 2017.
- Base salary, inclusive of superannuation for the year ended 2017 of $500,308.
Kristian Robinson, Managing Director, Spruson & Ferguson Asia Pte Limited.
- Minimum three-year agreement commenced 1 January 2017.
- Base salary, inclusive of superannuation for the year ended 30 June 2017 of SGD 437,932.
John Wadley, Chief Financial Officer during the period 1 September 2016 to 30 June 2017.
- Base salary, inclusive of superannuation for the year ended 30 June 2017 of $350,000. Annual superior performance bonus of up to 20% of base salary.
- Base salary, inclusive of superannuation for the year ended 30 June 2018 of $450,000. Annual superior performance bonus of up to 10% of base salary and a proposed long term incentive opportunity of 50% of base salary (to be finalised).
As announced in April, David Griffith will retire as CEO later in 2017 and Andrew Blattman will assume that position. Dr Blat tman will be employed directly by IPH Limited under an employment contract with an indefinite term. His remuneration has been adjusted from 1 July 2017 to a base salary, inclusive of superannuation for the year ended 2018 of $750,000. He is entitled to be cons idered for an annual superior performance bonus of up to 20% of base salary and has a proposed long term incentive opportunity of 100% of base salary (subject to any necessary shareholder approval upon taking up his position). Material terms of the arrangements will be disclosed as required upon taking up the position.
Except where minimum employment term applies, KMP may terminate their employment contract by giving six months’ notice in writing. Contracts may be terminated by the Company with six months’ notice. In the event of serious misconduct or other specific circumstances warranting summary dismissal, the Company may terminate the employment contract immediately by notice in writing and without payment in lieu of notice. Upon the termination of the employment contract, the KMP will be subject to a restraint of trade period of 12 months throughout Australia, New Zealand and Asia. The enforceability of the restraint is subject to al l usual legal requirements.
KMP have no entitlement to termination payments in the event of removal for misconduct. Messers Griffith, Blattman and Robinson receive five weeks annual leave.
5.7 Additional disclosures relating to key management personnel
The following disclosures relate only to equity instruments in the Company or its subsidiaries.
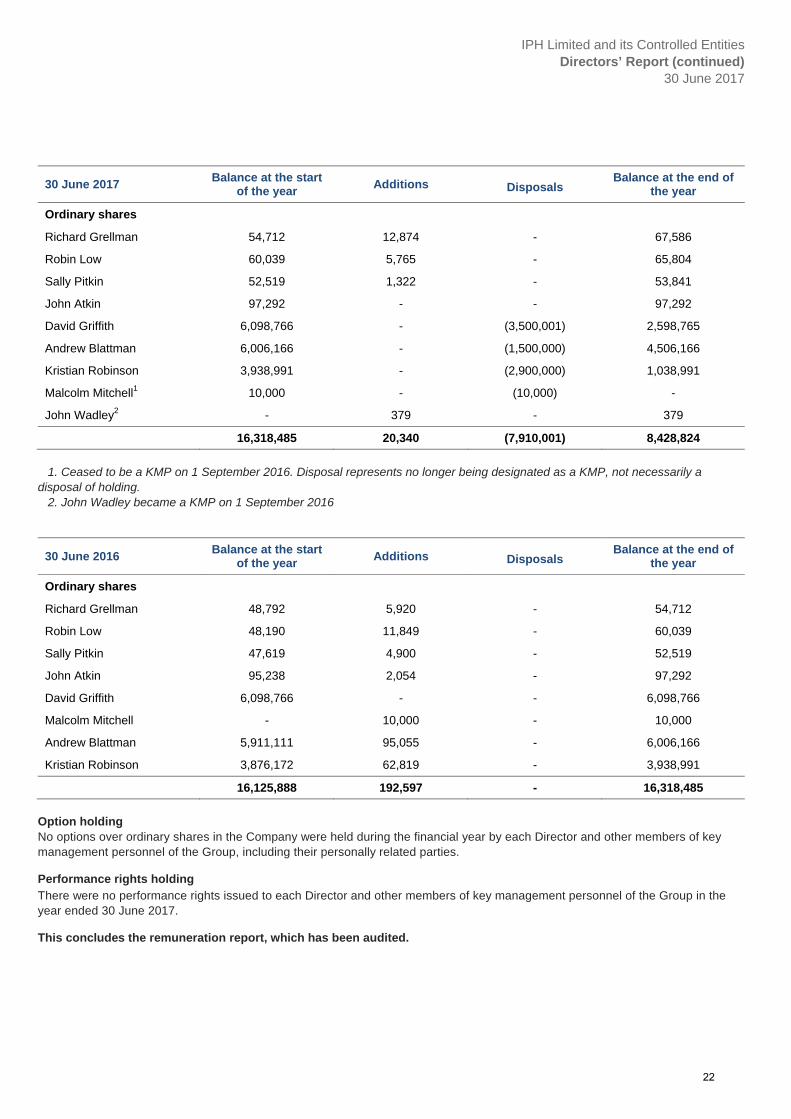
Shareholding
The number of shares in the Company held during the financial year by each Director and other members of key management personnel of the Group, including their personally related parties, is set out below:
IPH Limited and its Controlled Entities Directors’ Report (continued)
30 June 2017
30 June 2017 Balance at the start
of the year Additions Disposals
Balance at the end of the year
Ordinary shares
Richard Grellman 54,712 12,874 - 67,586
Robin Low 60,039 5,765 - 65,804
Sally Pitkin 52,519 1,322 - 53,841
John Atkin 97,292 - - 97,292
David Griffith 6,098,766 - (3,500,001) 2,598,765
Andrew Blattman 6,006,166 - (1,500,000) 4,506,166
Kristian Robinson 3,938,991 - (2,900,000) 1,038,991
Malcolm Mitchell1 10,000 - (10,000) -
John Wadley2 - 379 - 379
16,318,485 20,340 (7,910,001) 8,428,824
1. Ceased to be a KMP on 1 September 2016. Disposal represents no longer being designated as a KMP, not necessarily a disposal of holding. 2. John Wadley became a KMP on 1 September 2016
30 June 2016 Balance at the start
of the year Additions Disposals
Balance at the end of the year
Ordinary shares
Richard Grellman 48,792 5,920 - 54,712
Robin Low 48,190 11,849 - 60,039
Sally Pitkin 47,619 4,900 - 52,519
John Atkin 95,238 2,054 - 97,292
David Griffith 6,098,766 - - 6,098,766
Malcolm Mitchell - 10,000 - 10,000
Andrew Blattman 5,911,111 95,055 - 6,006,166
Kristian Robinson 3,876,172 62,819 - 3,938,991
16,125,888 192,597 - 16,318,485
Option holding No options over ordinary shares in the Company were held during the financial year by each Director and other members of key management personnel of the Group, including their personally related parties.
Performance rights holding There were no performance rights issued to each Director and other members of key management personnel of the Group in the year ended 30 June 2017.
This concludes the remuneration report, which has been audited.
22
IPH Limited and its Controlled Entities Directors’ Report (continued)
30 June 2017
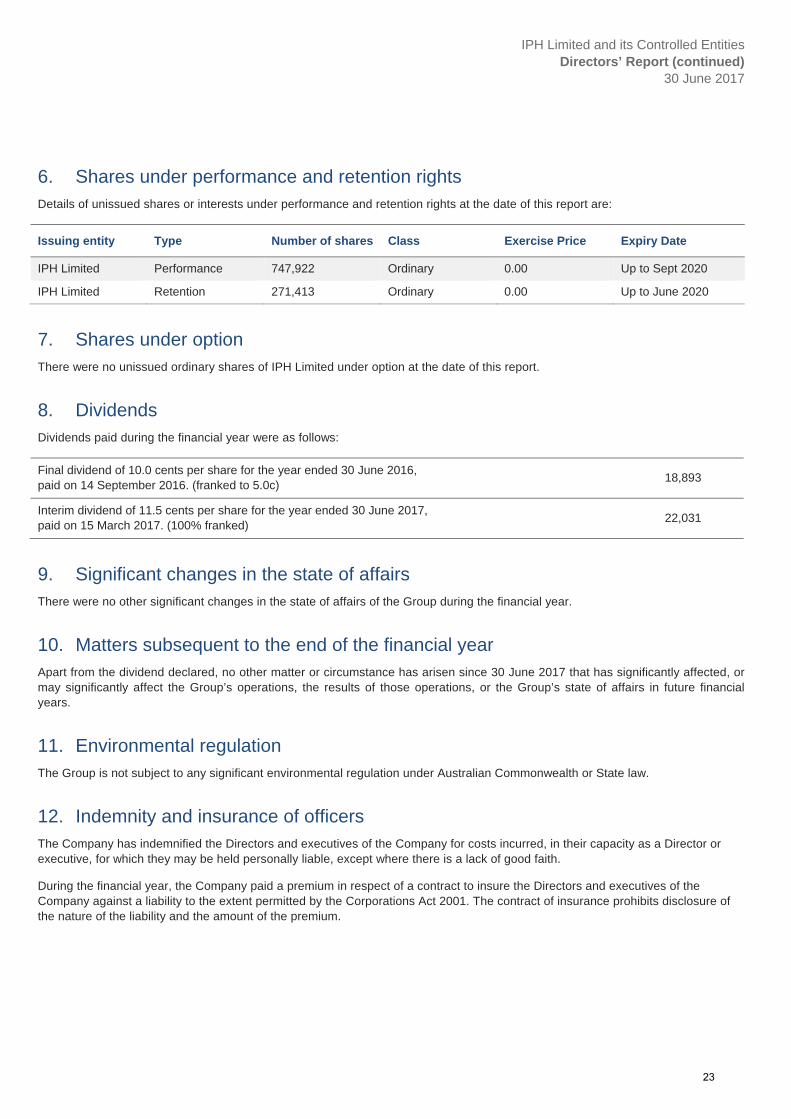
6. Shares under performance and retention rights Details of unissued shares or interests under performance and retention rights at the date of this report are:
Issuing entity Type Number of shares Class Exercise Price Expiry Date
IPH Limited Performance 747,922 Ordinary 0.00 Up to Sept 2020
IPH Limited Retention 271,413 Ordinary 0.00 Up to June 2020
7. Shares under option There were no unissued ordinary shares of IPH Limited under option at the date of this report.
8. Dividends Dividends paid during the financial year were as follows:
Final dividend of 10.0 cents per share for the year ended 30 June 2016, paid on 14 September 2016. (franked to 5.0c)
18,893
Interim dividend of 11.5 cents per share for the year ended 30 June 2017, paid on 15 March 2017. (100% franked)
22,031
9. Significant changes in the state of affairs There were no other significant changes in the state of affairs of the Group during the financial year.
10. Matters subsequent to the end of the financial year Apart from the dividend declared, no other matter or circumstance has arisen since 30 June 2017 that has significantly affected, or may significantly affect the Group’s operations, the results of those operations, or the Group’s state of affairs in future financial years.
11. Environmental regulation The Group is not subject to any significant environmental regulation under Australian Commonwealth or State law.
12. Indemnity and insurance of officers The Company has indemnified the Directors and executives of the Company for costs incurred, in their capacity as a Director or executive, for which they may be held personally liable, except where there is a lack of good faith.
During the financial year, the Company paid a premium in respect of a contract to insure the Directors and executives of the Company against a liability to the extent permitted by the Corporations Act 2001. The contract of insurance prohibits disclosure of the nature of the liability and the amount of the premium.
23
IPH Limited and its Controlled Entities Directors’ Report (continued)
30 June 2017
13. Indemnity and insurance of auditor The Company has not, during or since the end of the financial year, indemnified or agreed to indemnify the auditor of the Company or any related entity against a liability incurred by the auditor.
During the financial year, the Company has not paid a premium in respect of a contract to insure the auditor of the Company or any related entity.
14. Proceedings on behalf of the Company No person has applied to the Court under section 237 of the Corporations Act 2001 for leave to bring proceedings on behalf of the Company, or to intervene in any proceedings to which the Company is a party for the purpose of taking responsibility on behalf of the Company for all or part of those proceedings.
15. Non-audit services Details of the amounts paid or payable to the auditor for non-audit services provided during the financial year by the auditor are outlined in note 28 to the financial statements.
The Directors are satisfied that the provision of non-audit services during the financial year, by the auditor (or by another person or firm on the auditor’s behalf), is compatible with the general standard of independence for auditors imposed by the Corporations Act 2001.
The Directors are of the opinion that the services as disclosed in note 28 to the financial statements do not compromise the external auditor’s independence requirements of the Corporations Act 2001 for the following reasons:
all non-audit services have been reviewed and approved to ensure that they do not impact the integrity and objectivity of the auditor; and
none of the services undermine the general principles relating to auditor independence as set out in APES 110 Code of Ethics for Professional Accountants issued by the Accounting Professional and Ethical Standards Board, including reviewing or auditing the auditor’s own work, acting in a management or decision-making capacity for the Company, acting as advocate for the Company or jointly sharing economic risks and rewards.
16. Officers of the Company who are former partners of Deloitte Touche Tohmatsu There are no officers of the Company who are former partners of Deloitte Touche Tohmatsu.
17. Rounding of amounts The Company is of a kind referred to in ASIC Corporations (Rounding in Financial/Directors Reports) Instrument dated 24 March 2016 and in accordance with that Instrument amounts in the annual financial report are rounded off to the nearest thousand dollars, unless otherwise indicated.
24
IPH Limited and its Controlled Entities Directors’ Report (continued)
30 June 2017
18. Auditor’s independence declaration A copy of the auditor’s independence declaration as required under section 307C of the Corporations Act 2001 is set out on the following page.
19. Auditor Deloitte Touche Tohmatsu continues in office in accordance with section 327 of the Corporations Act 2001.
This report is made in accordance with a resolution of Directors, pursuant to section 298(2) (a) of the Corporations Act 2001.
David Griffith Managing Director
17 August 2017 Sydney
25
Liability limited by a scheme approved under Professional Standards Legislation.
Member of Deloitte Touche Tohmatsu Limited
Deloitte Touche Tohmatsu ABN 74 490 121 060
Grosvenor Place
225 George Street
Sydney NSW 2000
Tel: +61 2 9322 7000
www.deloitte.com.au
17 August 2017
Dear Board Members
IPH Limited
In accordance with section 307C of the Corporations Act 2001, I am pleased to provide the
following declaration of independence to the directors of IPH Limited.
As lead audit partner for the audit of the financial report of IPH Limited for the financial year
ended 30 June 2017, I declare that to the best of my knowledge and belief, there have been no
contraventions of:
(i) the auditor independence requirements of the Corporations Act 2001 in relation to
the audit; and
(ii) any applicable code of professional conduct in relation to the audit.
Yours sincerely
DELOITTE TOUCHE TOHMATSU
Tara Hill
Partner
Chartered Accountants
The Board of Directors
IPH Limited
Level 35, St Martins Tower
31 Market Street
Sydney NSW 2000
26
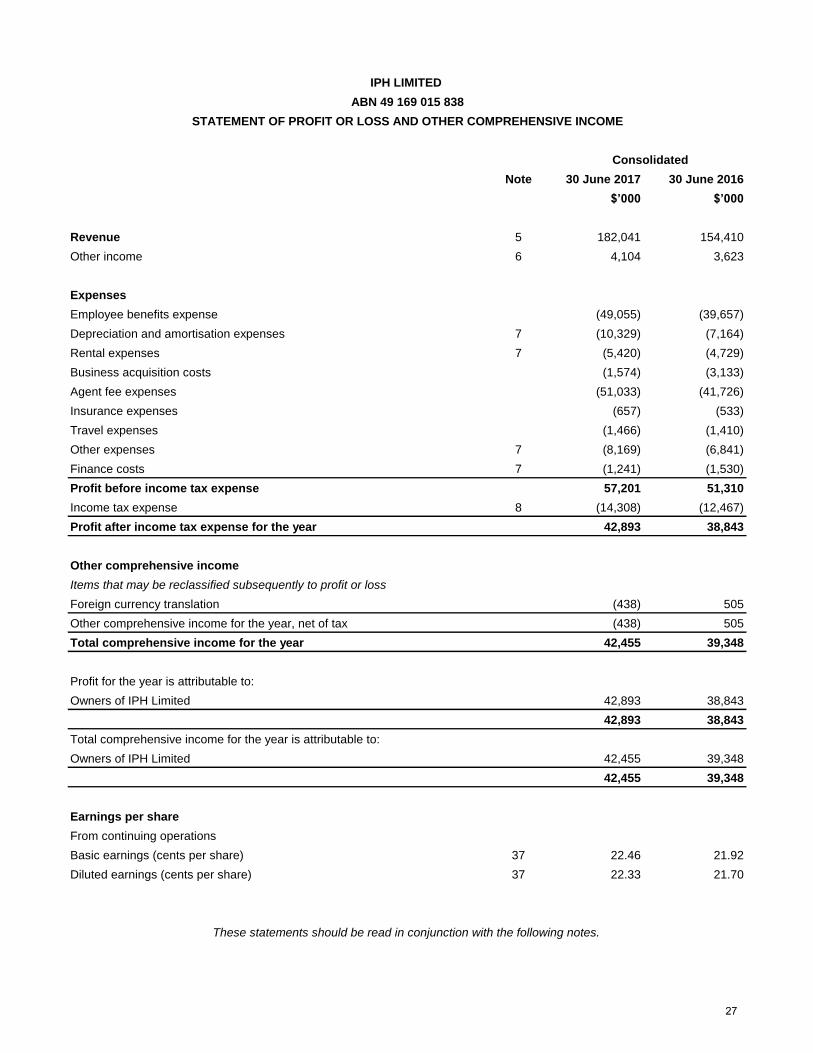
Note 30 June 2017 30 June 2016
$’000 $’000
Revenue 5 182,041 154,410
Other income 6 4,104 3,623
Expenses
Employee benefits expense (49,055) (39,657)
Depreciation and amortisation expenses 7 (10,329) (7,164)
Rental expenses 7 (5,420) (4,729)
Business acquisition costs (1,574) (3,133)
Agent fee expenses (51,033) (41,726)
Insurance expenses (657) (533)
Travel expenses (1,466) (1,410)
Other expenses 7 (8,169) (6,841)
Finance costs 7 (1,241) (1,530)
Profit before income tax expense 57,201 51,310
Income tax expense 8 (14,308) (12,467)
Profit after income tax expense for the year 42,893 38,843
Other comprehensive income
Items that may be reclassified subsequently to profit or loss
Foreign currency translation (438) 505
Other comprehensive income for the year, net of tax (438) 505
Total comprehensive income for the year 42,455 39,348
Profit for the year is attributable to:
Owners of IPH Limited 42,893 38,843
42,893 38,843
Total comprehensive income for the year is attributable to:
Owners of IPH Limited 42,455 39,348
42,455 39,348
Earnings per share
From continuing operations
Basic earnings (cents per share) 37 22.46 21.92
Diluted earnings (cents per share) 37 22.33 21.70
Consolidated
IPH LIMITED
STATEMENT OF PROFIT OR LOSS AND OTHER COMPREHENSIVE INCOME
ABN 49 169 015 838
These statements should be read in conjunction with the following notes.
27
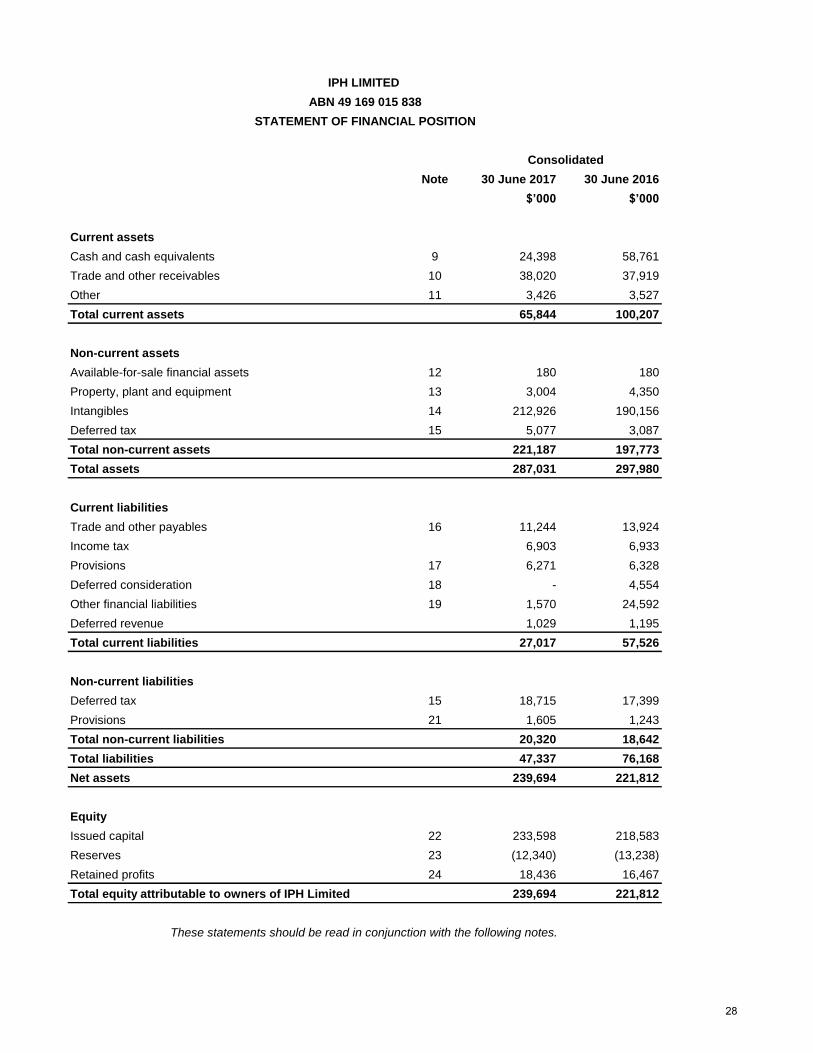
Note 30 June 2017 30 June 2016
$’000 $’000
Current assets
Cash and cash equivalents 9 24,398 58,761
Trade and other receivables 10 38,020 37,919
Other 11 3,426 3,527
Total current assets 65,844 100,207
Non-current assets
Available-for-sale financial assets 12 180 180
Property, plant and equipment 13 3,004 4,350
Intangibles 14 212,926 190,156
Deferred tax 15 5,077 3,087
Total non-current assets 221,187 197,773
Total assets 287,031 297,980
Current liabilities
Trade and other payables 16 11,244 13,924
Income tax 6,903 6,933
Provisions 17 6,271 6,328
Deferred consideration 18 - 4,554
Other financial liabilities 19 1,570 24,592
Deferred revenue 1,029 1,195
Total current liabilities 27,017 57,526
Non-current liabilities
Deferred tax 15 18,715 17,399
Provisions 21 1,605 1,243
Total non-current liabilities 20,320 18,642
Total liabilities 47,337 76,168
Net assets 239,694 221,812
Equity
Issued capital 22 233,598 218,583
Reserves 23 (12,340) (13,238)
Retained profits 24 18,436 16,467
Total equity attributable to owners of IPH Limited 239,694 221,812
Consolidated
IPH LIMITED
ABN 49 169 015 838
STATEMENT OF FINANCIAL POSITION
These statements should be read in conjunction with the following notes.
28
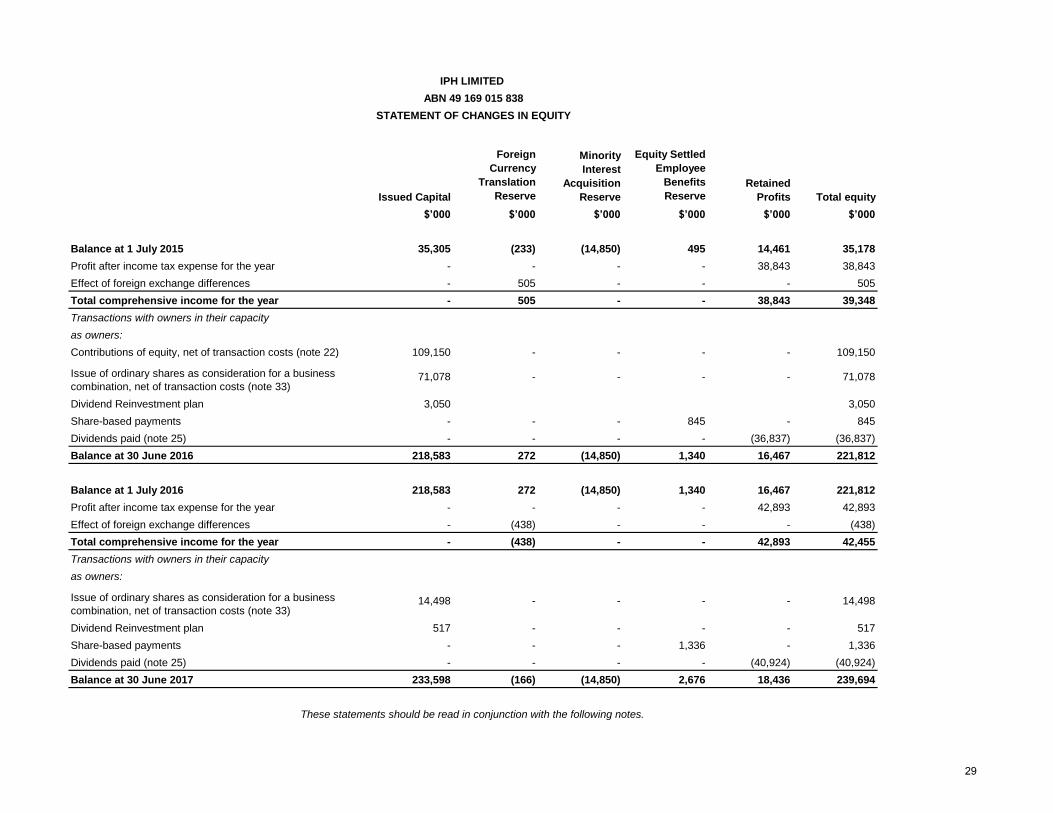
Foreign Currency
Translation Reserve
Equity Settled Employee
Benefits Reserve
$’000 $’000 $’000 $’000 $’000 $’000
Balance at 1 July 2015 35,305 (233) (14,850) 495 14,461 35,178
Profit after income tax expense for the year - - - - 38,843 38,843
Effect of foreign exchange differences - 505 - - - 505
Total comprehensive income for the year - 505 - - 38,843 39,348
Transactions with owners in their capacity
as owners:
Contributions of equity, net of transaction costs (note 22) 109,150 - - - - 109,150
Dividend Reinvestment plan 3,050 3,050
Share-based payments - - - 845 - 845
Dividends paid (note 25) - - - - (36,837) (36,837)
Balance at 30 June 2016 218,583 272 (14,850) 1,340 16,467 221,812
Balance at 1 July 2016 218,583 272 (14,850) 1,340 16,467 221,812
Profit after income tax expense for the year - - - - 42,893 42,893
Effect of foreign exchange differences - (438) - - - (438)
Total comprehensive income for the year - (438) - - 42,893 42,455
Transactions with owners in their capacity
as owners:
Dividend Reinvestment plan 517 - - - - 517
Share-based payments - - - 1,336 - 1,336
Dividends paid (note 25) - - - - (40,924) (40,924)
Balance at 30 June 2017 233,598 (166) (14,850) 2,676 18,436 239,694
IPH LIMITED
STATEMENT OF CHANGES IN EQUITY
ABN 49 169 015 838
Issued Capital Total equityRetained
Profits
Minority Interest
Acquisition Reserve
These statements should be read in conjunction with the following notes.
- - 71,078
- - 14,498Issue of ordinary shares as consideration for a business combination, net of transaction costs (note 33)
14,498 - -
Issue of ordinary shares as consideration for a business combination, net of transaction costs (note 33)
71,078 - -
29
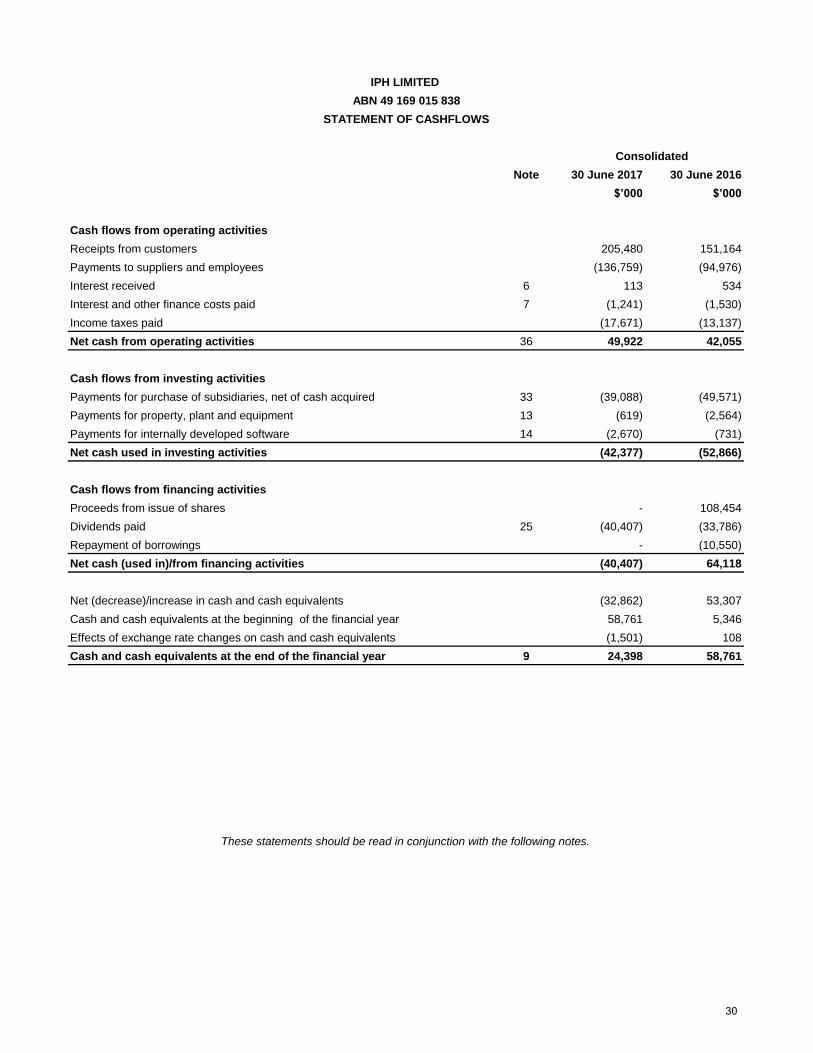
Note 30 June 2017 30 June 2016
$’000 $’000
Cash flows from operating activities
Receipts from customers 205,480 151,164
Payments to suppliers and employees (136,759) (94,976)
Interest received 6 113 534
Interest and other finance costs paid 7 (1,241) (1,530)
Income taxes paid (17,671) (13,137)
Net cash from operating activities 36 49,922 42,055
Cash flows from investing activities
Payments for purchase of subsidiaries, net of cash acquired 33 (39,088) (49,571)
Payments for property, plant and equipment 13 (619) (2,564)
Payments for internally developed software 14 (2,670) (731)
Net cash used in investing activities (42,377) (52,866)
Cash flows from financing activities
Proceeds from issue of shares - 108,454
Dividends paid 25 (40,407) (33,786)
Repayment of borrowings - (10,550)
Net cash (used in)/from financing activities (40,407) 64,118
Net (decrease)/increase in cash and cash equivalents (32,862) 53,307
Cash and cash equivalents at the beginning of the financial year 58,761 5,346
Effects of exchange rate changes on cash and cash equivalents (1,501) 108
Cash and cash equivalents at the end of the financial year 9 24,398 58,761
These statements should be read in conjunction with the following notes.
Consolidated
IPH LIMITED
ABN 49 169 015 838
STATEMENT OF CASHFLOWS
30
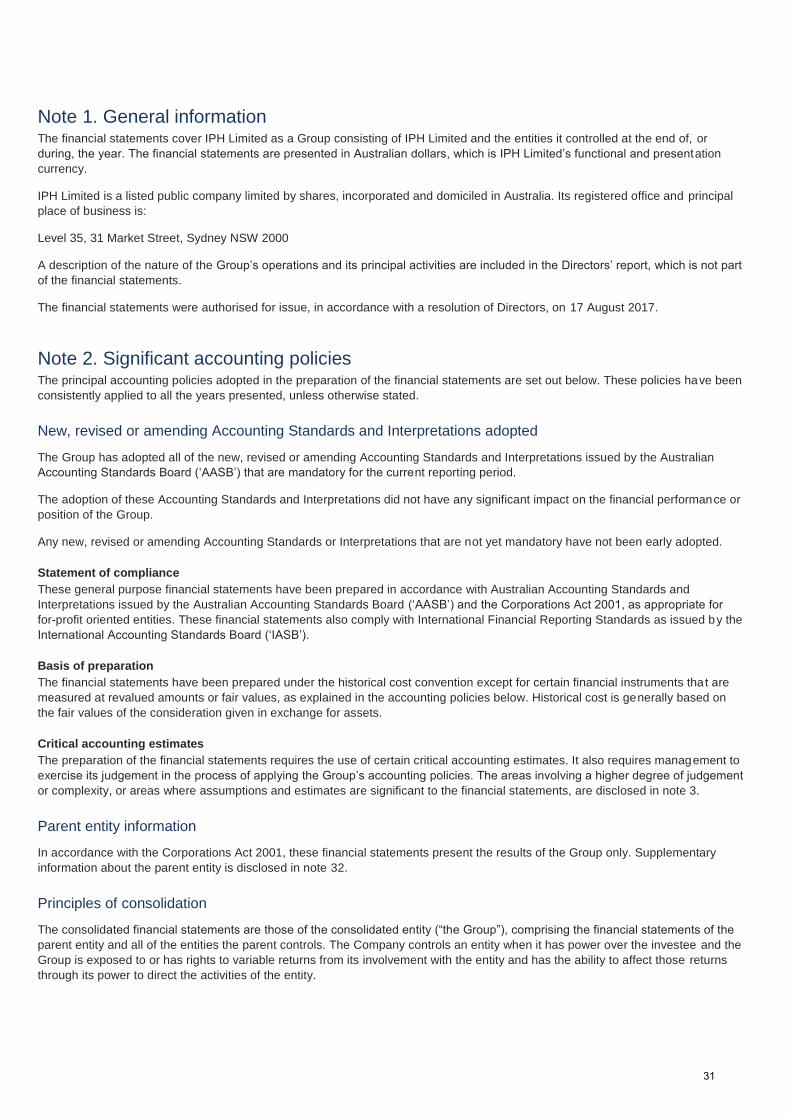
Note 1. General information The financial statements cover IPH Limited as a Group consisting of IPH Limited and the entities it controlled at the end of, or during, the year. The financial statements are presented in Australian dollars, which is IPH Limited’s functional and presentation currency.
IPH Limited is a listed public company limited by shares, incorporated and domiciled in Australia. Its registered office and principal place of business is:
Level 35, 31 Market Street, Sydney NSW 2000
A description of the nature of the Group’s operations and its principal activities are included in the Directors’ report, which is not part
of the financial statements.
The financial statements were authorised for issue, in accordance with a resolution of Directors, on 17 August 2017.
Note 2. Significant accounting policies The principal accounting policies adopted in the preparation of the financial statements are set out below. These policies have been consistently applied to all the years presented, unless otherwise stated.
New, revised or amending Accounting Standards and Interpretations adopted
The Group has adopted all of the new, revised or amending Accounting Standards and Interpretations issued by the Australian Accounting Standards Board (‘AASB’) that are mandatory for the current reporting period.
The adoption of these Accounting Standards and Interpretations did not have any significant impact on the financial performance or position of the Group.
Any new, revised or amending Accounting Standards or Interpretations that are not yet mandatory have not been early adopted.
Statement of compliance These general purpose financial statements have been prepared in accordance with Australian Accounting Standards and Interpretations issued by the Australian Accounting Standards Board (‘AASB’) and the Corporations Act 2001, as appropriate for
for-profit oriented entities. These financial statements also comply with International Financial Reporting Standards as issued by the International Accounting Standards Board (‘IASB’).
Basis of preparation The financial statements have been prepared under the historical cost convention except for certain financial instruments that are measured at revalued amounts or fair values, as explained in the accounting policies below. Historical cost is generally based on the fair values of the consideration given in exchange for assets.
Critical accounting estimates The preparation of the financial statements requires the use of certain critical accounting estimates. It also requires management to exercise its judgement in the process of applying the Group’s accounting policies. The areas involving a higher degree of judgement or complexity, or areas where assumptions and estimates are significant to the financial statements, are disclosed in note 3.
Parent entity information
In accordance with the Corporations Act 2001, these financial statements present the results of the Group only. Supplementary information about the parent entity is disclosed in note 32.
Principles of consolidation
The consolidated financial statements are those of the consolidated entity (“the Group”), comprising the financial statements of the
parent entity and all of the entities the parent controls. The Company controls an entity when it has power over the investee and the Group is exposed to or has rights to variable returns from its involvement with the entity and has the ability to affect those returns through its power to direct the activities of the entity.
31
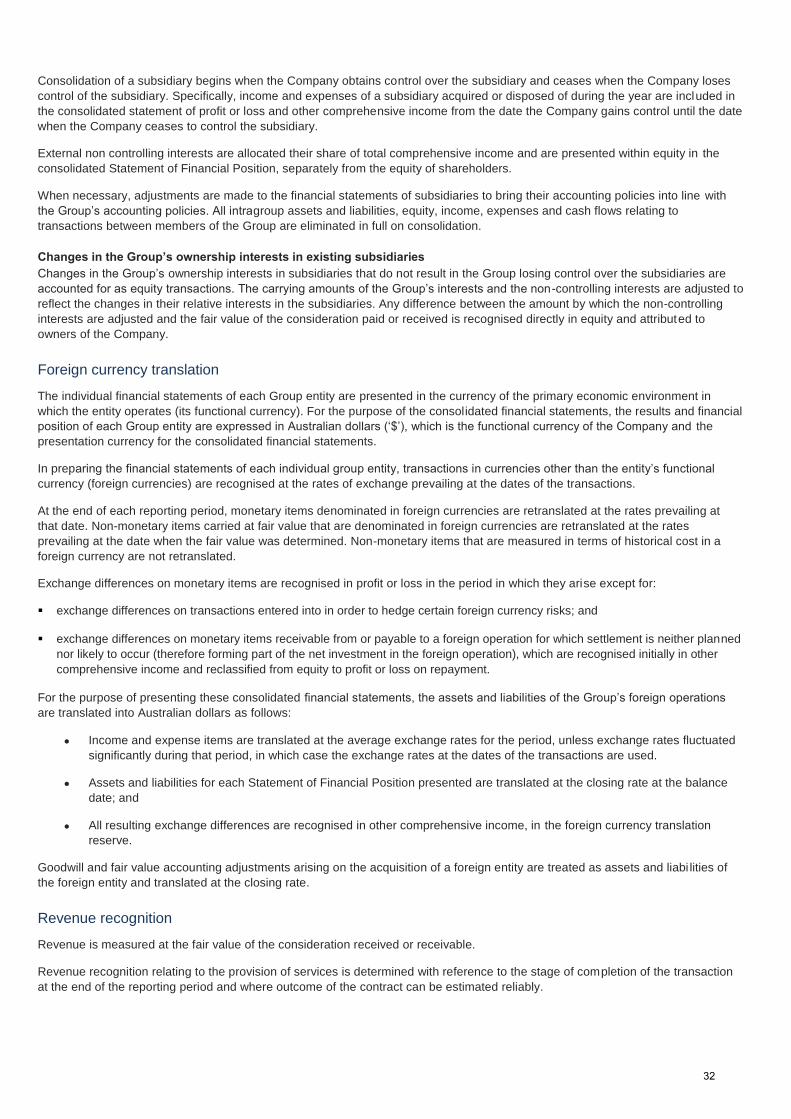
Consolidation of a subsidiary begins when the Company obtains control over the subsidiary and ceases when the Company loses control of the subsidiary. Specifically, income and expenses of a subsidiary acquired or disposed of during the year are included in the consolidated statement of profit or loss and other comprehensive income from the date the Company gains control until the date when the Company ceases to control the subsidiary.
External non controlling interests are allocated their share of total comprehensive income and are presented within equity in the consolidated Statement of Financial Position, separately from the equity of shareholders.
When necessary, adjustments are made to the financial statements of subsidiaries to bring their accounting policies into line with the Group’s accounting policies. All intragroup assets and liabilities, equity, income, expenses and cash flows relating to transactions between members of the Group are eliminated in full on consolidation.
Changes in the Group’s ownership interests in existing subsidiaries Changes in the Group’s ownership interests in subsidiaries that do not result in the Group losing control over the subsidiaries are accounted for as equity transactions. The carrying amounts of the Group’s interests and the non-controlling interests are adjusted to reflect the changes in their relative interests in the subsidiaries. Any difference between the amount by which the non-controlling interests are adjusted and the fair value of the consideration paid or received is recognised directly in equity and attributed to owners of the Company.
Foreign currency translation
The individual financial statements of each Group entity are presented in the currency of the primary economic environment in which the entity operates (its functional currency). For the purpose of the consolidated financial statements, the results and financial position of each Group entity are expressed in Australian dollars (‘$’), which is the functional currency of the Company and the presentation currency for the consolidated financial statements.
In preparing the financial statements of each individual group entity, transactions in currencies other than the entity’s functional currency (foreign currencies) are recognised at the rates of exchange prevailing at the dates of the transactions.
At the end of each reporting period, monetary items denominated in foreign currencies are retranslated at the rates prevailing at that date. Non-monetary items carried at fair value that are denominated in foreign currencies are retranslated at the rates prevailing at the date when the fair value was determined. Non-monetary items that are measured in terms of historical cost in a foreign currency are not retranslated.
Exchange differences on monetary items are recognised in profit or loss in the period in which they arise except for:
exchange differences on transactions entered into in order to hedge certain foreign currency risks; and
exchange differences on monetary items receivable from or payable to a foreign operation for which settlement is neither planned nor likely to occur (therefore forming part of the net investment in the foreign operation), which are recognised initially in other comprehensive income and reclassified from equity to profit or loss on repayment.
For the purpose of presenting these consolidated financial statements, the assets and liabilities of the Group’s foreign operations
are translated into Australian dollars as follows:
Income and expense items are translated at the average exchange rates for the period, unless exchange rates fluctuated significantly during that period, in which case the exchange rates at the dates of the transactions are used.
Assets and liabilities for each Statement of Financial Position presented are translated at the closing rate at the balance date; and
All resulting exchange differences are recognised in other comprehensive income, in the foreign currency translation reserve.
Goodwill and fair value accounting adjustments arising on the acquisition of a foreign entity are treated as assets and liabi lities of the foreign entity and translated at the closing rate.
Revenue recognition
Revenue is measured at the fair value of the consideration received or receivable.
Revenue recognition relating to the provision of services is determined with reference to the stage of completion of the transaction at the end of the reporting period and where outcome of the contract can be estimated reliably.
32
Stage of completion is determined with reference to the services performed to date as a percentage of total anticipated services to be performed. Where the outcome cannot be estimated reliably, revenue is recognised only to the extent that related expenditure is recoverable.
Dividend revenue is recognised when the right to receive a dividend has been established (provided that it is probable that the economic benefits will flow to the Group and the amount of income can be measured reliably).
Interest income from a financial asset is recognised when it is probable that the economic benefits will flow to the Group and the amount of revenue can be measured reliably. Interest income is recognised on an accruals basis
Other revenue, including commission revenue, is recognised when it is received or when the right to receive payment is established.
All revenue is stated net of the amount of goods and services tax (GST).
Work in progress
Work in progress (WIP) represents costs incurred and profit recognised on client assignments and services that are in progress at balance date. WIP is valued at net realisable value after providing for any foreseeable losses. WIP older than 90 days is reviewed and any WIP not thought to be recoverable is written off.
Disbursements recoverable
Recoverable client disbursements recorded in work in progress are recognised when services are provided. The amount recognised is net of any GST payable. Internally generated disbursements are credited directly to the profit & loss as they are charged to a client matter.
Disbursements older than 60 days are constantly being reviewed and any not thought to be recoverable are written off.
Income Tax
The income tax expense or benefit is the tax payable on the current periods taxable income based on the national income tax rate for each jurisdiction adjusted by changes in deferred tax assets and liabilities attributable to temporary differences between the tax bases of assets and liabilities and their carrying amounts in the financial statements.
Current tax Current tax is calculated by reference to the amount of income taxes payable or recoverable in respect of the taxable profit or tax loss for the period. It is calculated using tax rates and tax laws that have been enacted or substantively enacted by reporting date.
Deferred tax Deferred tax is recognised on temporary differences between the carrying amount of assets and liabilities in the financial statements and the corresponding tax base of those items.
Deferred tax liabilities are recognised for all taxable temporary differences. Deferred tax assets are recognised to the extent that it is probable that sufficient taxable amounts will be available to utilise those temporary differences and losses.
Deferred tax assets and liabilities are not recognised if the temporary differences giving rise to them arise from the initial recognition of assets and liabilities (other than as a result of a business combination) which affects neither taxable income nor account ing profit. Furthermore, a deferred tax liability is not recognised in relation to taxable temporary differences arising from goodwill.
Deferred tax liabilities are recognised for taxable temporary differences arising on investments except where the Group is able to control the reversal of the temporary differences and it is probable that the temporary differences will not reverse in the foreseeable future. Deferred tax assets arising from deductible temporary differences associated with these investments and interests are only recognised to the extent that it is probable that there will be sufficient taxable profits against which to utilise the benefits of the temporary differences and they are expected to reverse in the foreseeable future.
Deferred tax assets and liabilities are measured at the tax rates that are expected to apply to the period(s) when the asset and liability giving rise to them are realised or settled, based on tax rates (and tax laws) that have been enacted or substantively enacted by reporting date. The measurement of deferred tax liabilities and assets reflects the tax consequences that would follow from the manner in which the Company expects, at the reporting date, to recover or settle the carrying amount of its assets and liabilities.
33
Deferred tax assets and liabilities are offset when they relate to income taxes levied by the same taxation authority and the Company intends to settle its current tax assets and liabilities on a net basis.
Current and deferred tax for the period Current and deferred tax is recognised as an expense or income in the Statement of Comprehensive Income, except when it relates to items credited or debited directly to equity, in which case the deferred tax is also recognised directly in equity.
The Company and its wholly-owned Australian resident entities are part of a tax-consolidated group which was formed on 3 September 2014. As a consequence, all members of the tax-consolidated group are taxed as a single entity. The head entity within the tax consolidated group is IPH Limited.
Tax expense/income, deferred tax liabilities and deferred tax assets arising from temporary differences of the members of the tax-consolidated group are recognised in the separate financial statements of the members of the tax consolidated group using the “separate taxpayer within group” approach.
Current tax liabilities and assets and deferred tax assets arising from unused tax losses and tax credits of the members of the tax-consolidated group are recognised by the Company (as head entity in the tax-consolidated group).
Due to the existence of a tax funding arrangement between the entities in the tax-consolidated group, amounts are recognised as payable to or receivable by the Company and each member of the group in relation to the tax contribution amounts paid or payable between the parent entity and the other members of the tax consolidated group in accordance with the arrangement. Where the tax contribution amount recognised by each member of the tax consolidated group for a particular period is different to the aggregate of the current tax liability or asset and any deferred tax asset arising from unused tax losses and tax credits in respect of that period, the difference is recognised as a contribution from (or distribution to) equity participants.
Cash and cash equivalents
Cash and cash equivalents include cash on hand and at banks, short term deposits with an original maturity of three months or less held at call with financial institutions, and bank overdrafts. Bank overdrafts are shown within borrowings in current liabilities in the consolidated statement of financial position.
Trade and other receivables
Trade and other receivables include amounts due from customers for services performed in the ordinary course of business. Receivables expected to be collected within 12 months of the end of the reporting period are classified as current assets. All other receivables are classified as non-current assets.
Trade and other receivables are initially recognised at fair value and subsequently measured at amortised cost using the effective interest method, less any provision for impairment.
Unearned income is recognised as a liability when received and is recognised as revenue once a patent service has been provided or completed.
Trade and other payables
Trade and other payables represent the liabilities for goods and services received that remain unpaid at the end of the reporting period. The balance is recognised as a current liability with the amounts normally paid within 90 days of recognition of the liability.
Financial instruments
Loans and receivables Loans and receivables are non-derivative financial assets with fixed or determinable payments that are not quoted in an active market. They are carried at amortised cost using the effective interest rate method. Gains and losses are recognised in profit or loss when the asset is derecognised or impaired.
Available-for-sale financial assets Available for sale financial assets include any financial assets not included in the above categories and are measured at fair value. Unrealised gains and losses arising from changes in fair value are taken directly to equity. The cumulative gain or loss is held in equity until the financial asset is de-recognised, at which time the cumulative gain or loss held in equity is recognised in profit and loss.
34
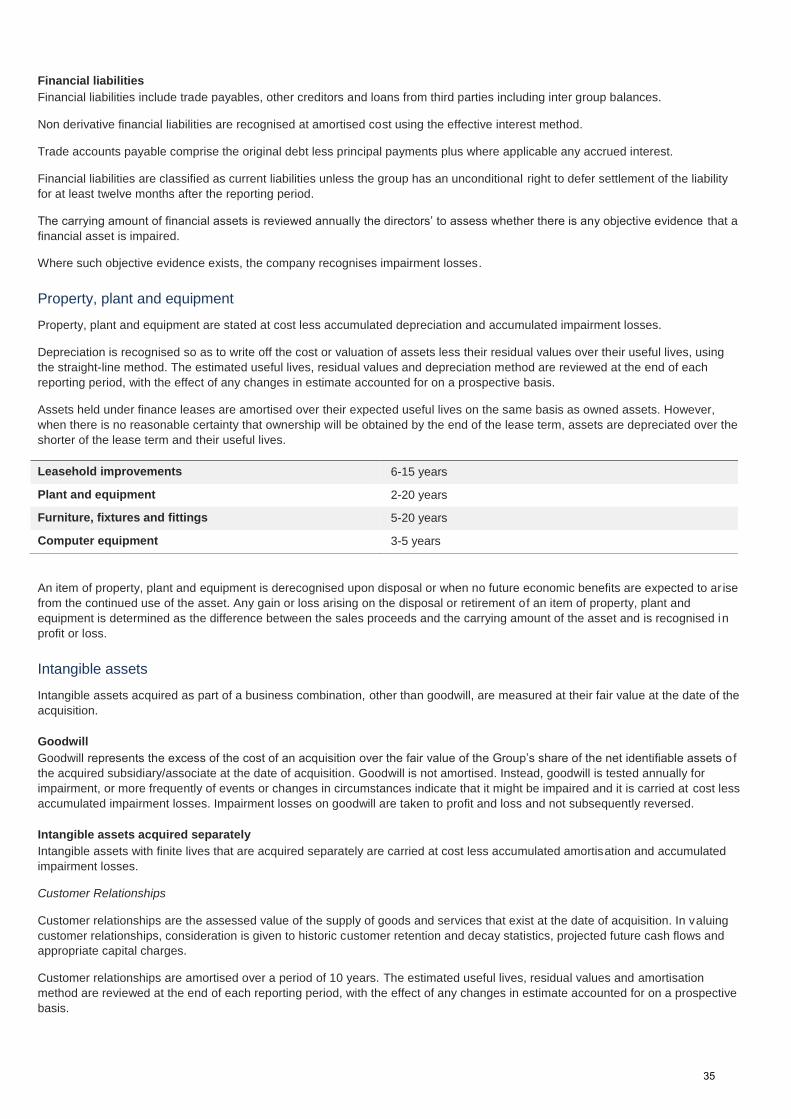
Financial liabilities Financial liabilities include trade payables, other creditors and loans from third parties including inter group balances.
Non derivative financial liabilities are recognised at amortised cost using the effective interest method.
Trade accounts payable comprise the original debt less principal payments plus where applicable any accrued interest.
Financial liabilities are classified as current liabilities unless the group has an unconditional right to defer settlement of the liability for at least twelve months after the reporting period.
The carrying amount of financial assets is reviewed annually the directors’ to assess whether there is any objective evidence that a financial asset is impaired.
Where such objective evidence exists, the company recognises impairment losses.
Property, plant and equipment
Property, plant and equipment are stated at cost less accumulated depreciation and accumulated impairment losses.
Depreciation is recognised so as to write off the cost or valuation of assets less their residual values over their useful lives, using the straight-line method. The estimated useful lives, residual values and depreciation method are reviewed at the end of each reporting period, with the effect of any changes in estimate accounted for on a prospective basis.
Assets held under finance leases are amortised over their expected useful lives on the same basis as owned assets. However, when there is no reasonable certainty that ownership will be obtained by the end of the lease term, assets are depreciated over the shorter of the lease term and their useful lives.
Leasehold improvements 6-15 years
Plant and equipment 2-20 years
Furniture, fixtures and fittings 5-20 years
Computer equipment 3-5 years
An item of property, plant and equipment is derecognised upon disposal or when no future economic benefits are expected to ar ise from the continued use of the asset. Any gain or loss arising on the disposal or retirement of an item of property, plant and equipment is determined as the difference between the sales proceeds and the carrying amount of the asset and is recognised in profit or loss.
Intangible assets
Intangible assets acquired as part of a business combination, other than goodwill, are measured at their fair value at the date of the acquisition.
Goodwill Goodwill represents the excess of the cost of an acquisition over the fair value of the Group’s share of the net identifiable assets o f the acquired subsidiary/associate at the date of acquisition. Goodwill is not amortised. Instead, goodwill is tested annually for impairment, or more frequently of events or changes in circumstances indicate that it might be impaired and it is carried at cost less accumulated impairment losses. Impairment losses on goodwill are taken to profit and loss and not subsequently reversed.
Intangible assets acquired separately Intangible assets with finite lives that are acquired separately are carried at cost less accumulated amortisation and accumulated impairment losses.
Customer Relationships
Customer relationships are the assessed value of the supply of goods and services that exist at the date of acquisition. In valuing customer relationships, consideration is given to historic customer retention and decay statistics, projected future cash flows and appropriate capital charges.
Customer relationships are amortised over a period of 10 years. The estimated useful lives, residual values and amortisation method are reviewed at the end of each reporting period, with the effect of any changes in estimate accounted for on a prospective basis.
35
Trademarks
Trademarks are intangible assets with indefinite useful lives that are acquired separately are carried at cost less accumulated impairment losses.
Software acquired
Software acquired through a business combination is assessed as the identifiable value of that software at the date of acquis ition. Acquired software is amortised over a period of 4 years.
Internally-generated intangible assets
Internally-generated intangible assets, including software, arising from development (or from the development phase of an internal project) is recognised if, and only if, all of the following have been demonstrated:
the technical feasibility of completing the intangible asset so that it will be available for use or sale;
the intention to complete the intangible asset and use or sell it;
the ability to use or sell the intangible asset;
how the intangible asset will generate probable future economic benefits;
the availability of adequate technical, financial and other resources to complete the development and to use or sell the intangible asset; and
the ability to measure reliably the expenditure attributable to the intangible asset during its development.
The amount initially recognised for internally-generated intangible assets is the sum of the expenditure incurred from the date when the intangible asset first meets the recognition criteria listed above. Where no internally generated intangible asset can be recognised, development expenditure is recognised in profit or loss in the period in which it is incurred.
Subsequent to initial recognition, internally-generated intangible assets are reported at cost less accumulated amortisation and accumulated impairment losses, on the same basis as intangible assets that are acquired separately.
The useful lives of internally generated intangible assets are as follows:
Software 3 years
Derecognition of intangible assets An intangible asset is derecognised on disposal, or when no future economic benefits are expected from use or disposal. Gains or losses arising from derecognition of an intangible asset, measured as the difference between the net disposal proceeds and the carrying amount of the asset are recognised in profit or loss when the asset is derecognised.
Impairment of assets
Goodwill and other assets that have an indefinite useful life are not amortised but are tested annually for impairment in accordance with AASB 136 ‘Impairment of Assets’. Assets subject to annual depreciation or amortisation are reviewed for impairment whenever events or circumstances arise that indicates that the carrying amount of the asset may be impaired.
An impairment loss is recognised where the carrying amount of the asset exceeds its recoverable amount. The recoverable amount of an asset is defined as the higher of its fair value less costs to sell and value in use.
For the purposes of impairment, assets are grouped at the lowest levels for which there are separately identifiable cash flows (cash generating units).
Provisions
Provisions are recognised when the Group has a present obligation (legal or constructive) as a result of a past event, it is probable that the Group will be required to settle the obligation, and a reliable estimate can be made of the amount of the obligation.
The amount recognised as a provision is the best estimate of the consideration required to settle the present obligation at the end of the reporting period, taking into account the risks and uncertainties surrounding the obligation. When a provision is measured using
36
the cash flows estimated to settle the present obligation, its carrying amount is the present value of those cash flows (where the effect of the time value of money is material).
When some or all of the economic benefits required to settle a provision are expected to be recovered from a third party, a receivable is recognised as an asset if it is virtually certain that reimbursement will be received and the amount of the receivable can be measured reliably.
Leases
Leases are classified as finance leases whenever the terms of the lease transfer substantially all the risks and rewards of ownership to the lessee. All other leases are classified as operating leases.
Assets held under finance leases are initially recognised as assets of the Group at their fair value at the inception of the lease or, if lower, at the present value of the minimum lease payments. The corresponding liability to the lessor is included in the statement of financial position as a finance lease obligation.
Lease payments are apportioned between finance expenses and reduction of the lease obligation so as to achieve a constant rate of interest on the remaining balance of the liability. Finance expenses are recognised immediately in profit or loss, unless they are directly attributable to qualifying assets, in which case they are capitalised in accordance with the Group’s general policy on borrowing costs. Contingent rentals are recognised as expenses in the periods in which they are incurred.
Operating lease payments are recognised as an expense on a straight-line basis over the lease term, except where another systematic basis is more representative of the time pattern in which economic benefits from the leased asset are consumed. Contingent rentals arising under operating leases are recognised as an expense in the period in which they are incurred.
In the event that lease incentives are received to enter into operating leases, such incentives are recognised as a liability . The aggregate benefit of incentives is recognised as a reduction of rental expense on a straight-line basis, except where another systematic basis is more representative of the time pattern in which economic benefits from the leased asset are consumed.
Employee benefits
Short and long-term employee benefit A liability is recognised for benefits accruing to employees in respect of wages and salaries, annual leave, and long service leave when it is probable that settlement will be required and they are capable of being measured reliably.
Liabilities recognised in respect of short-term employee benefits, are measured at their nominal values using the remuneration rate expected to apply at the time of settlement. Liabilities recognised in respect of long term employee benefits are measured at the present value of the estimated future cash outflows to be made by the Group in respect of services provided by the employees up to reporting date.
Retirement benefit costs
Payments to defined contribution plans are recognised as an expense when employees have rendered service entitling them to the contributions.
Borrowings costs
Borrowing costs can include interest, amortisation of discounts or premiums relating to borrowings, ancillary costs incurred in connection with arrangement of borrowings, foreign exchange losses net of hedged amounts on borrowings. Borrowings are initially recognised at fair value, net of transaction costs and subsequently measured at amortised cost. Any difference between the proceeds (net of transaction costs) and the redemption amount is recognised in profit or loss over the period of the borrowings using the effective interest method.
Goods and services tax (GST)
Revenues, expenses and assets are recognised net of the amount of GST, except where the amount of GST incurred is not recoverable from the Tax Office. In these circumstances the GST is recognised as part of the cost of acquisition of the asset or as part of an item of the expense. Receivables and payables in the consolidated statement of financial position are shown inclusive of GST.
Cash flows are presented in the statement of cash flows on a gross basis, except for the GST component of investing and financing activities, which are disclosed as operating cash flows.
37
Share based payments
Equity settled share based compensation benefits are provided to employees. Equity settled transactions are awards of shares, options or rights, which are provided in exchange for the rendering of services. Equity settled share based payments are measured at the fair value of the equity instruments at the grant date.
The fair value at the grant date of the equity settled share based payments is expensed on a straight line basis over the vesting period, based on the Group’s estimate of equity instruments that will eventually vest, with a corresponding increase in equity. At the end of each reporting period, the Group revises its estimate of the number of equity instruments expected to vest. The impact of the revision of the original estimates, if any, is recognised in profit or loss such that the cumulative expense reflects the revised estimate, with a corresponding adjustment to the equity settled employee benefits reserve.
Fair value measurement
When an asset or liability, financial or non-financial, is measured at fair value for recognition or disclosure purposes, the fair value is based on the price that would be received to sell an asset or paid to transfer a liability in an orderly transaction between market participants at the measurement date; and assumes that the transaction will take place either: in the principal market; or in the absence of a principal market, in the most advantageous market.
Fair value is measured using the assumptions that market participants would use when pricing the asset or liability, assuming they act in their economic best interests. For non-financial assets, the fair value measurement is based on its highest and best use. Valuation techniques that are appropriate in the circumstances and for which sufficient data are available to measure fair value, are used, maximising the use of relevant observable inputs and minimising the use of unobservable inputs.
Assets and liabilities measured at fair value are classified, into three levels, using a fair value hierarchy that reflects the significance of the inputs used in making the measurements (note 26). Classifications are reviewed at each reporting date and transfers between levels are determined based on a reassessment of the lowest level of input that is significant to the fair value measurement.
For recurring and non-recurring fair value measurements, external valuers may be used when internal expertise is either not available or when the valuation is deemed to be significant. External valuers are selected based on market knowledge and reputation. Where there is a significant change in fair value of an asset or liability from one period to another, an analysis is undertaken, which includes a verification of the major inputs applied in the latest valuation and a comparison, where applicable, with external sources of data.
Issued capital
Ordinary shares are classified as equity.
Incremental costs directly attributable to the issue of new shares or options are shown in equity as a deduction, net of tax, from the proceeds.
Dividends
Dividends are recognised when declared during the financial year and no longer at the discretion of the Company.
Business combinations
The acquisition method of accounting is used to account for business combinations regardless of whether equity instruments or other assets are acquired.
The consideration transferred is the sum of the acquisition-date fair values of the assets transferred, equity instruments issued or liabilities incurred. The consideration transferred also includes the fair value of any contingent consideration arrangement and the fair value of any pre-existing equity interest in the subsidiary. Identifiable assets acquired and liabilities and contingent liabilities assumed in a business combination are measured initially at their fair values at the acquisition date. For each business combination, the non-controlling interest in the acquiree is measured at either fair value or at the proportionate share of the acquiree’s identifiable net assets. All acquisition costs are expensed as incurred to profit or loss.
On the acquisition of a business, the Group assesses the financial assets acquired and liabilities assumed for appropriate classification and designation in accordance with the contractual terms, economic conditions, the Group’s operating or accounting
policies and other pertinent conditions in existence at the acquisition-date.
38
Where the business combination is achieved in stages, the Group remeasures its previously held equity interest in the acquiree at the acquisition-date fair value and the difference between the fair value and the previous carrying amount is recognised in profit or loss. Contingent consideration to be transferred by the acquirer is recognised at the acquisition-date fair value. Subsequent changes in the fair value of the contingent consideration classified as an asset or liability is recognised in profit or loss. Contingent consideration classified as equity is not remeasured and its subsequent settlement is accounted for within equity.
The difference between the acquisition-date fair value of assets acquired, liabilities assumed and any non-controlling interest in the acquiree and the fair value of the consideration transferred and the fair value of any pre-existing investment in the acquiree is recognised as goodwill. If the consideration transferred and the pre-existing fair value is less than the fair value of the identifiable net assets acquired, being a bargain purchase, the difference is recognised as a gain directly in profit or loss on the acquisition-date, but only after a reassessment of the identification and measurement of the net assets acquired, the non-controlling interest in the acquiree, if any, the consideration transferred and any previously held equity interest.
Where settlement of any part of cash consideration is deferred, the amounts payable in the future are discounted to their present value as at the date of exchange. Contingent consideration is classified either as equity or a financial liability. Amounts classified as financial liability are subsequently remeasured to fair value with changes to fair value recognised in profit or loss.
Business combinations are initially accounted for on a provisional basis. The acquirer retrospectively adjusts the provisional amounts recognised and also recognises additional assets or liabilities during the measurement period, based on new information obtained about the facts and circumstances that existed at the acquisition-date. The measurement period ends on either the earlier of (i) 12 months from the date of the acquisition or (ii) when the acquirer receives all the information possible to determine fair value.
Earnings per share
Basic earnings per share Basic earnings per share is calculated by dividing the profit attributable to the owners of IPH Limited, excluding any costs of servicing equity other than ordinary shares, by the weighted average number of ordinary shares outstanding during the financial year, adjusted for bonus elements in ordinary shares issued during the financial year.
Diluted earnings per share Diluted earnings per share adjusts the figures used in the determination of basic earnings per share to take into account the after income tax effect of interest and other financing costs associated with dilutive potential ordinary shares and the weighted average number of shares assumed to have been issued for no consideration in relation to dilutive potential ordinary shares.
Rounding of amounts
The Company is of a kind referred to in ASIC Corporations (Rounding in Financial/Directors Reports) Instrument dated 24 March 2016 and in accordance with that Instrument amounts in the annual financial report are rounded off to the nearest thousand do llars, unless otherwise indicated.
New Accounting Standards and Interpretations not yet mandatory or early adopted
Australian Accounting Standards and Interpretations that have recently been issued or amended but are not yet mandatory, have not been early adopted by the Group for the annual reporting period ended 30 June 2017. The Group’s assessment of the impact of
these new or amended Accounting Standards and Interpretations, most relevant to the Group, are set out below.
AASB 9 Financial Instruments This standard is applicable to annual reporting periods beginning on or after 1 January 2018. The standard replaces all previous versions of AASB 9 and completes the project to replace IAS 39 ‘Financial Instruments: Recognition and Measurement’. AASB 9
introduces new classification and measurement models for financial assets. New simpler hedge accounting requirements are intended to more closely align the accounting treatment with the risk management activities of the entity. New impairment requirements will use an ‘expected credit loss’ model to recognise an allowance. The Group will adopt this standard from 1 July
2018 and the financial impact of its adoption is currently being assessed. The primary exposure of the group is to trade debtors, creditors and any debt that may be drawn.
AASB 15 Revenue from Contracts with Customers
This standard is currently applicable to annual reporting periods beginning on or after 1 January 2018. AASB 15 replaces all current guidance on revenue recognition from contracts with customers. It requires identification of discrete performance obligations within a transaction and an associated transaction price allocation to these obligations. Revenue is recognised upon satisfaction of these performance obligations, which occur when control of the goods or services are transferred to the customer. Revenue received for a
39
contract that includes a variable amount is subject to revised conditions for recognition, whereby it must be highly probable that no significant reversal of the variable component may occur when the uncertainties around its measurement are removed. The Group expects to adopt the standard from 1 July 2018 and apply the standard retrospectively, recognising the cumulative effect of initially applying the standard as an adjustment to the opening balance of retained earnings. The new standard will be relevant to the recognition of service charges and recoverable expenses. Any financial impact of adoption is currently being assessed by the Group.
AASB 16 Leases
This standard is currently applicable to annual reporting periods beginning on or after 1 January 2019. AASB 16 replaces the current AASB 117 Leases standard and sets out a comprehensive model for identifying lease arrangements and the subsequent measurement. A contract contains a lease if it conveys the right to control the use of an identified asset for a period of time. The majority of leases from the lessee perspective within the scope of AASB 16 will require the recognition of a “right of use” asset and a related lease liability, being the present value of future lease payments. This will result in an increase in the recognised assets and liabilities in the statement of financial position as well as a change in expense recognition, with interest and deprecia tion replacing operating lease expense, with the exception of for leases of low value assets and leases with a term of 12 months or less. The Group expects to adopt the standard from 1 July 2019 and the primary impact from adoption will be the treatment of premises and leased office equipment across the Group. The adoption of the standard will increase net current assets and lease liabilities due to the recognition of the lease liability and right of use asset; expense relating to minimum lease payments will reduce and there will be an increase in interest expense. The quantum of these changes is currently being determined.
Other amending accounting standards issued are not considered to have a significant impact on the financial statements of the consolidated entity as their amendments provide either clarification of existing accounting treatment or editorial amendments. These standards (and their operative dates) include:
AASB 2016-2 Amendments to Australian Accounting Standards – Disclosure initiative: Amendments to AASB 107 (from 1 January 2017)
IFRS 2 Share-based payment – amendments clarifying how to account for certain types of share-based payment transactions (from 1 January 2018)
Changes in Accounting Policies
Recognition of filing fee revenue and expense
The accounting policy for the recognition of subcontracted services revenue has been reviewed as part of the Group’s assessment
and alignment of the accounting policies of newly acquired entities. The new Standard AASB 15 Revenue from Contracts with Customers includes additional guidance in relation to the determination of principal versus agency relationship in the context of a performance obligation, such guidance is not as extensively included within the current AASB 118 Revenue Standard.
From 1 July 2016, the Group has changed its revenue recognition policy in relation to the treatment of filing fees paid to National IP bodies and recovered from clients. Under the new policy both reimbursement and payment of filing fees are recorded as gross revenue and expense in the Statement of Profit or Loss; previously they were netted off. The Group believes that recording filing fee transactions as gross provides information that is more relevant to the Group’s business acting as Principal for clients in p reparing and lodging intellectual property applications with the relevant national bodies.
The 30 June 2016 Comparative information has been amended to reflect the payment and receipt of filing fees which were paid by the Group and subsequently reimbursed by clients. During the prior year, filing fees totalling $14.4m were shown as a net value rather being grossed up in the Statement of Profit or Loss and Other Comprehensive Income. As a result, revenue disclosed for 30 June 2016 has been amended to $154.4m (reported: $140.0m) and agents fees expense has been amended to $41.7m (reported: $27.3m). There has been no change to reported net profit, earnings per share or equity and reserve balances.
Deferred tax measurement relating to indefinite life intangible assets
The IFRS Interpretations Committee (IFRIC) has issued an agenda decision related to the expected manner of recovery of indefinite life intangible assets. The Committee was asked to clarify how an entity determines the expected manner of recovery of an intangible asset with an indefinite useful life for deferred tax measurement purposes. The Committee indicated that the fact that
40
an entity does not amortise an indefinite life intangible asset does not necessary mean that the carrying amount will be recovered only through sale and not use. Therefore the entity should determine the expected manner of recovery of the carrying amount of the intangible asset.
As a result of the IFRIC clarification, a deferred tax liability has been recognised in relation to the trade mark intangible assets resulting in an increase to goodwill. Deferred tax liabilities of $1.05m have been recognised as a result with a corresponding increase in goodwill. Refer note 33.
Note 3. Critical accounting judgements, estimates and assumptions The preparation of the financial statements requires management to make judgements, estimates and assumptions that affect the reported amounts in the financial statements. Management continually evaluates its judgements and estimates in relation to assets, liabilities, contingent liabilities, revenue and expenses. Management bases its judgements, estimates and assumptions on historical experience and on other various factors, including expectations of future events, management believes to be reasonable under the circumstances. The resulting accounting judgements and estimates will seldom equal the related actual results. The judgements , estimates and assumptions that have a significant risk of causing a material adjustment to the carrying amounts of assets and liabilities (refer to the respective notes) within the next financial year are discussed below.
Goodwill and other indefinite life intangible assets The Group tests annually, or more frequently if events of changes in circumstances indicate impairment, whether goodwill and other indefinite life intangible assets, total carrying value $148m, have suffered any impairment, in accordance with the accounting policy stated in note 2.
Customer relationships, total carry value $59.9m are finite intangible assets and are amortised over their expected life. Assets subject to amortisation are reviewed for impairment whenever events or circumstances arise that indicates that the carrying amount of the asset may be impaired.
Business combinations The fair value of assets acquired, liabilities and contingent liabilities assumed are initially estimated by the Group taking into consideration all available information at the reporting date. Fair value adjustments on the finalisation of the business combination accounting is retrospective, where applicable, to the period the combination occurred and may have an impact on the assets and liabilities, depreciation and amortisation reported. Acquisitions of $28.9m were made during the year.
41
Note 4. Operating segments
Identification of reportable operating segments The Group is organised into three segments: Intellectual Property Services Australia; Intellectual Property Services Asia; and Data and Analytics Software. These operating segments are based on the internal reports that are reviewed and used by the senior executive team and Board of Directors (who are identified as the Chief Operating Decision Makers (‘CODM’)) in assessing
performance and in determining the allocation of resources. There is no aggregation of operating segments.
Intellectual Property Services Australia
Related to the provision of filing, prosecution, enforcement and management of patents, designs, trade marks and other IP in Australia.
Intellectual Property Services Asia
Related to the provision of filing, prosecution, enforcement and management of patents, designs, trade marks and other IP in Asia.
Data and Analytics Software
Develops and provides IP data and analytics software under a subscription license model.
The CODM reviews profit before interest, income tax and adjustments to the statutory reported results. The accounting policies adopted for internal reporting to the CODM are consistent with those adopted in the financial statements. The information reported to the CODM is on at least a monthly basis.
Intersegment transactions There are varying levels of integration between the segments. The integration includes provision of professional services, shared technology and management services. Intersegment transactions were made at market rates. Intersegment transactions are eliminated on consolidation.
Reliance on major customers
Maximum revenue from any customer is less than 2% of overall revenue of the Group. Country of origin of revenue has not been disclosed as this is commercially sensitive information.
42
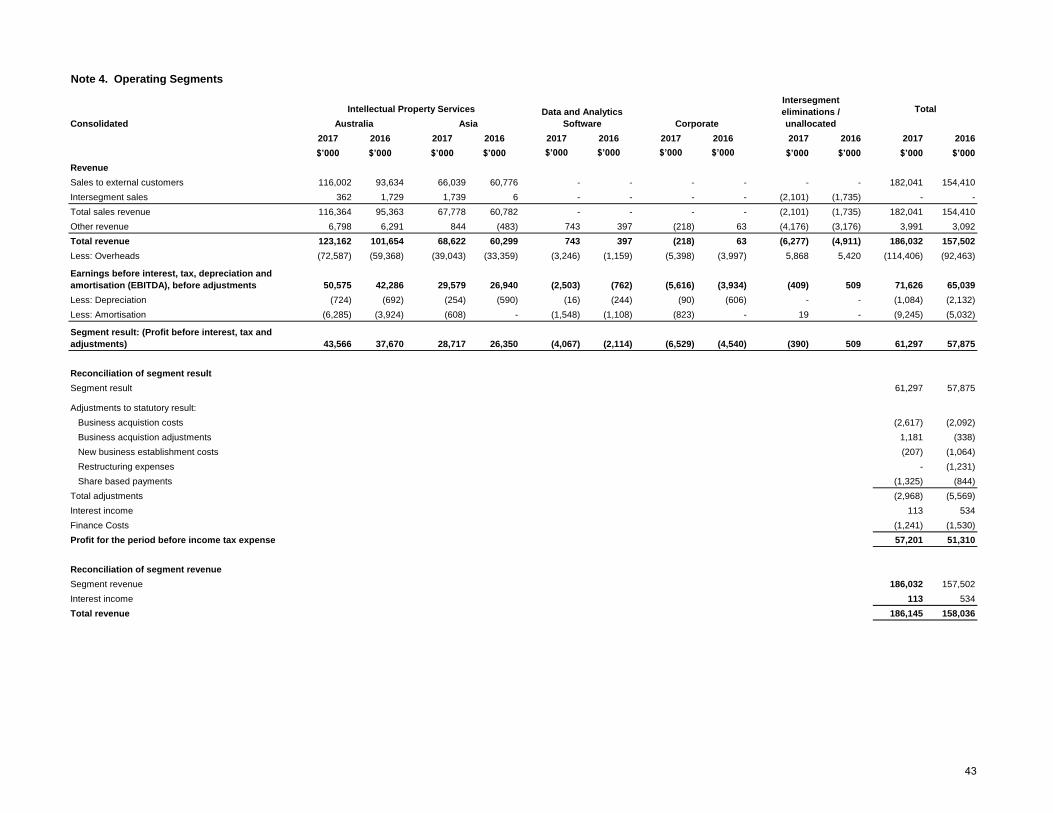
Note 4. Operating Segments
Consolidated
2017 2016 2017 2016 2017 2016 2017 2016 2017 2016 2017 2016
$’000 $’000 $’000 $’000 $’000 $’000 $’000 $’000 $’000 $’000 $’000 $’000
Revenue
Sales to external customers 116,002 93,634 66,039 60,776 - - - - - - 182,041 154,410
Intersegment sales 362 1,729 1,739 6 - - - - (2,101) (1,735) - -
Total sales revenue 116,364 95,363 67,778 60,782 - - - - (2,101) (1,735) 182,041 154,410
Other revenue 6,798 6,291 844 (483) 743 397 (218) 63 (4,176) (3,176) 3,991 3,092
Total revenue 123,162 101,654 68,622 60,299 743 397 (218) 63 (6,277) (4,911) 186,032 157,502
Less: Overheads (72,587) (59,368) (39,043) (33,359) (3,246) (1,159) (5,398) (3,997) 5,868 5,420 (114,406) (92,463)
50,575 42,286 29,579 26,940 (2,503) (762) (5,616) (3,934) (409) 509 71,626 65,039
Less: Depreciation (724) (692) (254) (590) (16) (244) (90) (606) - - (1,084) (2,132)
Less: Amortisation (6,285) (3,924) (608) - (1,548) (1,108) (823) - 19 - (9,245) (5,032)
43,566 37,670 28,717 26,350 (4,067) (2,114) (6,529) (4,540) (390) 509 61,297 57,875
Reconciliation of segment result
Segment result 61,297 57,875
Adjustments to statutory result:
Business acquistion costs (2,617) (2,092)
Business acquistion adjustments 1,181 (338)
New business establishment costs (207) (1,064)
Restructuring expenses - (1,231)
Share based payments (1,325) (844)
Total adjustments (2,968) (5,569)
Interest income 113 534
Finance Costs (1,241) (1,530)
Profit for the period before income tax expense 57,201 51,310
Reconciliation of segment revenue
Segment revenue 186,032 157,502
Interest income 113 534
Total revenue 186,145 158,036
Segment result: (Profit before interest, tax and adjustments)
Intersegment eliminations / unallocatedAustralia Asia
TotalIntellectual Property Services Data and Analytics Software Corporate
Earnings before interest, tax, depreciation and amortisation (EBITDA), before adjustments
43
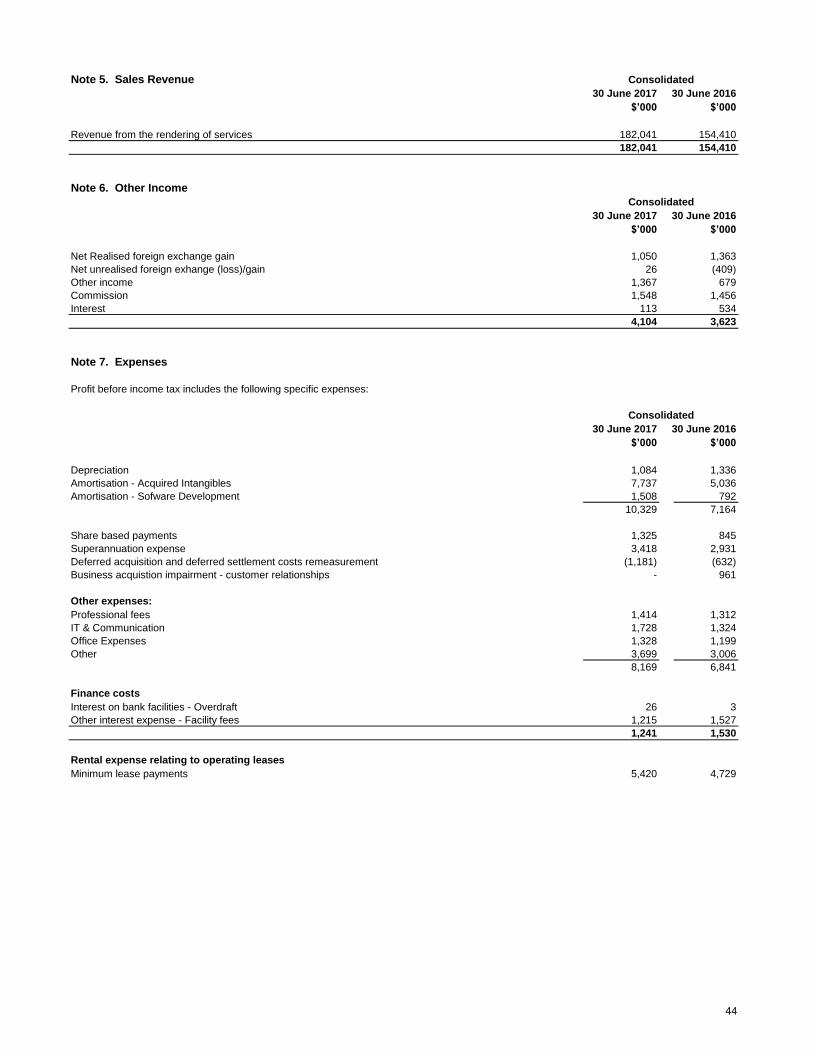
Note 5. Sales Revenue30 June 2017 30 June 2016
$’000 $’000
Revenue from the rendering of services 182,041 154,410182,041 154,410
Note 6. Other Income
30 June 2017 30 June 2016$’000 $’000
Net Realised foreign exchange gain 1,050 1,363Net unrealised foreign exhange (loss)/gain 26 (409)Other income 1,367 679Commission 1,548 1,456Interest 113 534
4,104 3,623
Note 7. Expenses
Profit before income tax includes the following specific expenses:
30 June 2017 30 June 2016$’000 $’000
Depreciation 1,084 1,336Amortisation - Acquired Intangibles 7,737 5,036Amortisation - Sofware Development 1,508 792
10,329 7,164
Share based payments 1,325 845Superannuation expense 3,418 2,931Deferred acquisition and deferred settlement costs remeasurement (1,181) (632)Business acquistion impairment - customer relationships - 961
Other expenses:Professional fees 1,414 1,312IT & Communication 1,728 1,324Office Expenses 1,328 1,199Other 3,699 3,006
8,169 6,841
Finance costs Interest on bank facilities - Overdraft 26 3Other interest expense - Facility fees 1,215 1,527
1,241 1,530
Rental expense relating to operating leases Minimum lease payments 5,420 4,729
Consolidated
Consolidated
Consolidated
44
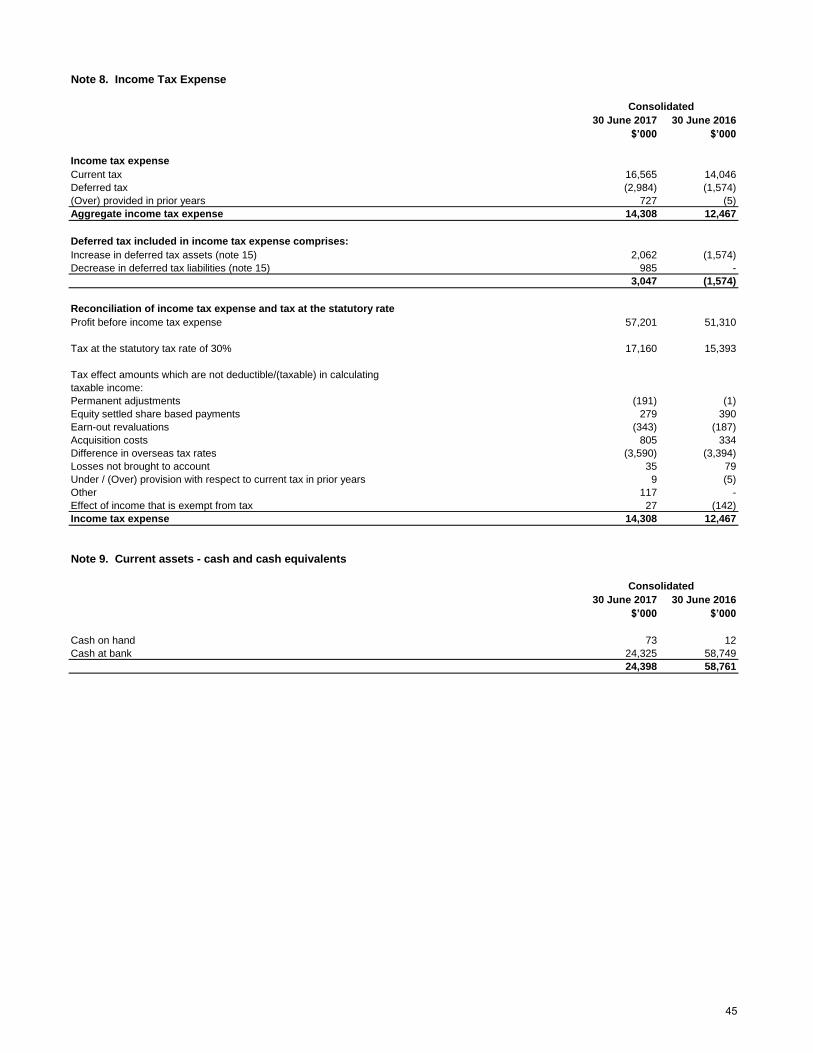
Note 8. Income Tax Expense
30 June 2017 30 June 2016$’000 $’000
Income tax expense Current tax 16,565 14,046Deferred tax (2,984) (1,574)(Over) provided in prior years 727 (5)Aggregate income tax expense 14,308 12,467
Deferred tax included in income tax expense comprises: Increase in deferred tax assets (note 15) 2,062 (1,574)Decrease in deferred tax liabilities (note 15) 985 -
3,047 (1,574)
Reconciliation of income tax expense and tax at the statutory rateProfit before income tax expense 57,201 51,310
Tax at the statutory tax rate of 30% 17,160 15,393
Tax effect amounts which are not deductible/(taxable) in calculating taxable income:Permanent adjustments (191) (1)Equity settled share based payments 279 390Earn-out revaluations (343) (187)Acquisition costs 805 334Difference in overseas tax rates (3,590) (3,394)Losses not brought to account 35 79Under / (Over) provision with respect to current tax in prior years 9 (5)Other 117 -Effect of income that is exempt from tax 27 (142)Income tax expense 14,308 12,467
Note 9. Current assets - cash and cash equivalents
30 June 2017 30 June 2016$’000 $’000
Cash on hand 73 12Cash at bank 24,325 58,749
24,398 58,761
Consolidated
Consolidated
45
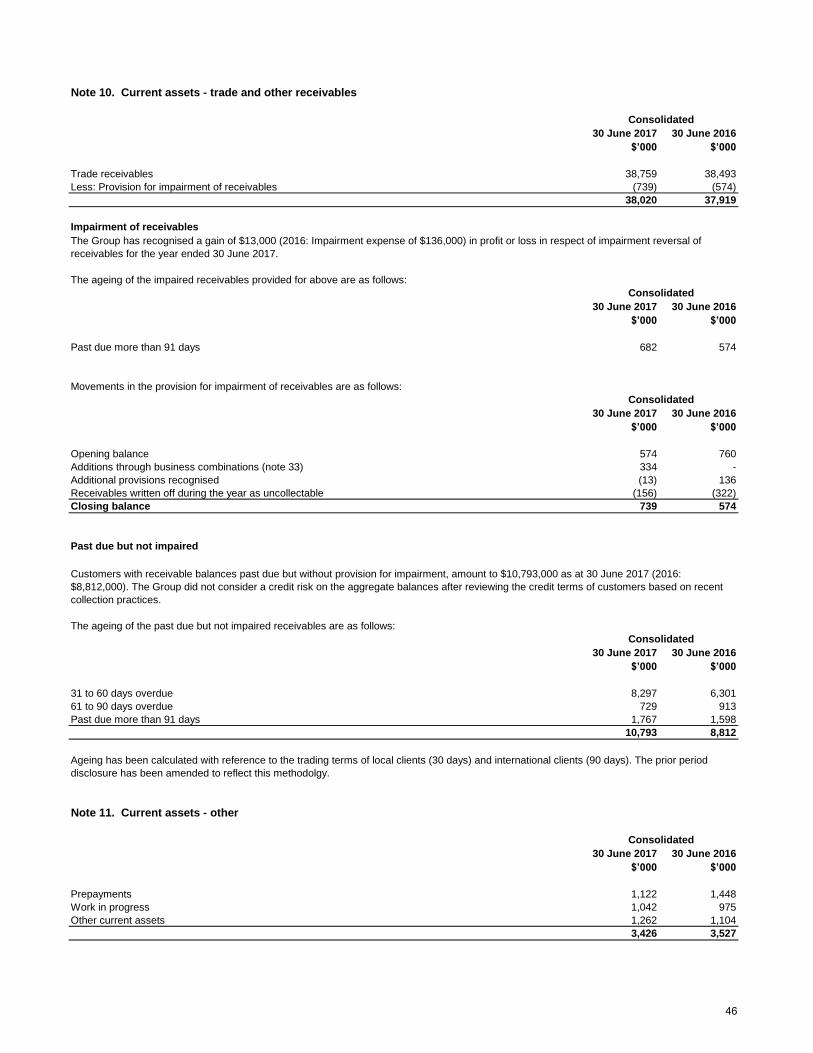
Note 10. Current assets - trade and other receivables
30 June 2017 30 June 2016$’000 $’000
Trade receivables 38,759 38,493Less: Provision for impairment of receivables (739) (574)
38,020 37,919
Impairment of receivables
The ageing of the impaired receivables provided for above are as follows:
30 June 2017 30 June 2016$’000 $’000
Past due more than 91 days 682 574
Movements in the provision for impairment of receivables are as follows:
30 June 2017 30 June 2016$’000 $’000
Opening balance 574 760Additions through business combinations (note 33) 334 -Additional provisions recognised (13) 136Receivables written off during the year as uncollectable (156) (322)Closing balance 739 574
Past due but not impaired
The ageing of the past due but not impaired receivables are as follows:
30 June 2017 30 June 2016$’000 $’000
31 to 60 days overdue 8,297 6,30161 to 90 days overdue 729 913Past due more than 91 days 1,767 1,598
10,793 8,812
Note 11. Current assets - other
30 June 2017 30 June 2016$’000 $’000
Prepayments 1,122 1,448Work in progress 1,042 975Other current assets 1,262 1,104
3,426 3,527
Consolidated
Consolidated
The Group has recognised a gain of $13,000 (2016: Impairment expense of $136,000) in profit or loss in respect of impairment reversal of receivables for the year ended 30 June 2017.
Consolidated
Consolidated
Customers with receivable balances past due but without provision for impairment, amount to $10,793,000 as at 30 June 2017 (2016: $8,812,000). The Group did not consider a credit risk on the aggregate balances after reviewing the credit terms of customers based on recent collection practices.
Consolidated
Ageing has been calculated with reference to the trading terms of local clients (30 days) and international clients (90 days). The prior period disclosure has been amended to reflect this methodolgy.
46
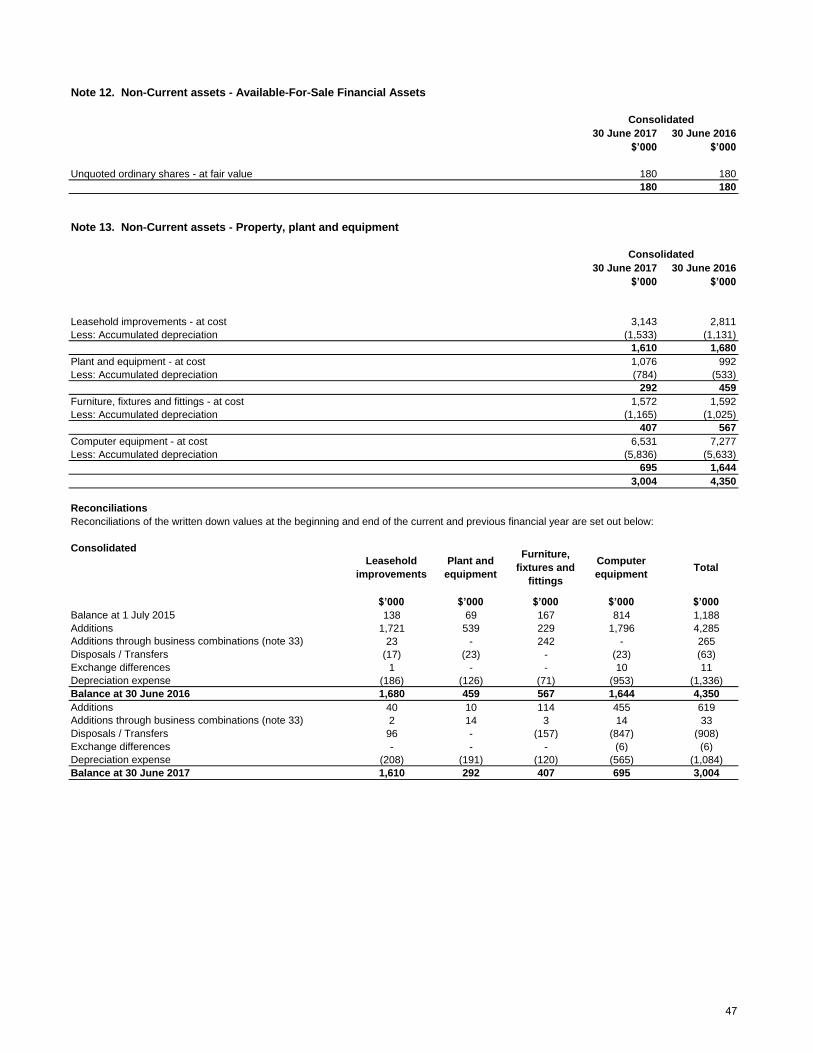
Note 12. Non-Current assets - Available-For-Sale Financial Assets
30 June 2017 30 June 2016$’000 $’000
Unquoted ordinary shares - at fair value 180 180180 180
Note 13. Non-Current assets - Property, plant and equipment
30 June 2017 30 June 2016$’000 $’000
Leasehold improvements - at cost 3,143 2,811Less: Accumulated depreciation (1,533) (1,131)
1,610 1,680Plant and equipment - at cost 1,076 992Less: Accumulated depreciation (784) (533)
292 459Furniture, fixtures and fittings - at cost 1,572 1,592Less: Accumulated depreciation (1,165) (1,025)
407 567Computer equipment - at cost 6,531 7,277Less: Accumulated depreciation (5,836) (5,633)
695 1,6443,004 4,350
ReconciliationsReconciliations of the written down values at the beginning and end of the current and previous financial year are set out below:
Consolidated
$’000 $’000 $’000 $’000 $’000
Balance at 1 July 2015 138 69 167 814 1,188Additions 1,721 539 229 1,796 4,285Additions through business combinations (note 33) 23 - 242 - 265Disposals / Transfers (17) (23) - (23) (63)Exchange differences 1 - - 10 11Depreciation expense (186) (126) (71) (953) (1,336)Balance at 30 June 2016 1,680 459 567 1,644 4,350Additions 40 10 114 455 619Additions through business combinations (note 33) 2 14 3 14 33Disposals / Transfers 96 - (157) (847) (908)Exchange differences - - - (6) (6)Depreciation expense (208) (191) (120) (565) (1,084)Balance at 30 June 2017 1,610 292 407 695 3,004
Consolidated
TotalLeasehold
improvements
Consolidated
Plant and equipment
Furniture, fixtures and
fittings
Computer equipment
47
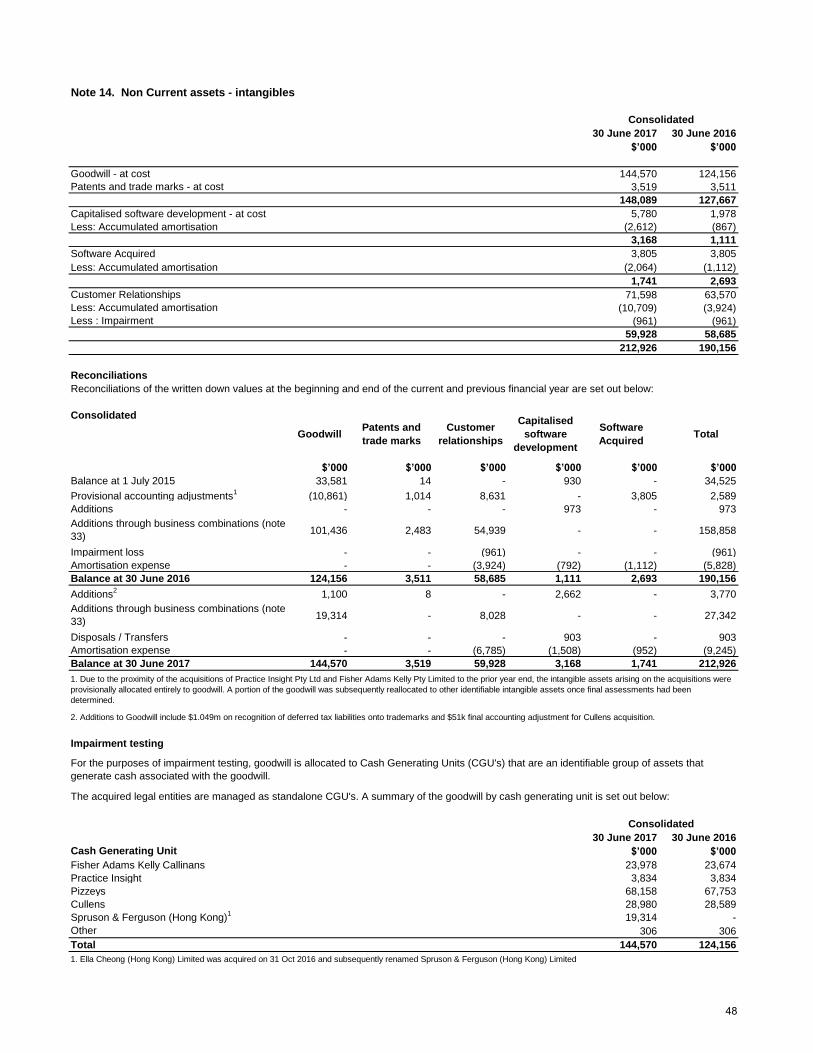
Note 14. Non Current assets - intangibles
30 June 2017 30 June 2016$’000 $’000
Goodwill - at cost 144,570 124,156Patents and trade marks - at cost 3,519 3,511
148,089 127,667Capitalised software development - at cost 5,780 1,978Less: Accumulated amortisation (2,612) (867)
3,168 1,111Software Acquired 3,805 3,805Less: Accumulated amortisation (2,064) (1,112)
1,741 2,693Customer Relationships 71,598 63,570Less: Accumulated amortisation (10,709) (3,924)Less : Impairment (961) (961)
59,928 58,685212,926 190,156
ReconciliationsReconciliations of the written down values at the beginning and end of the current and previous financial year are set out below:
Consolidated
$’000 $’000 $’000 $’000 $’000 $’000
Balance at 1 July 2015 33,581 14 - 930 - 34,525
Provisional accounting adjustments1 (10,861) 1,014 8,631 - 3,805 2,589Additions - - - 973 - 973
101,436 2,483 54,939 - - 158,858
Impairment loss - - (961) - - (961)Amortisation expense - - (3,924) (792) (1,112) (5,828)Balance at 30 June 2016 124,156 3,511 58,685 1,111 2,693 190,156
Additions2 1,100 8 - 2,662 - 3,770
19,314 - 8,028 - - 27,342
Disposals / Transfers - - - 903 - 903Amortisation expense - - (6,785) (1,508) (952) (9,245)Balance at 30 June 2017 144,570 3,519 59,928 3,168 1,741 212,926
2. Additions to Goodwill include $1.049m on recognition of deferred tax liabilities onto trademarks and $51k final accounting adjustment for Cullens acquisition.
Impairment testing
30 June 2017 30 June 2016Cash Generating Unit $’000 $’000
Fisher Adams Kelly Callinans 23,978 23,674Practice Insight 3,834 3,834Pizzeys 68,158 67,753Cullens 28,980 28,589
19,314 -Other 306 306Total 144,570 124,156
Spruson & Ferguson (Hong Kong)1
Consolidated
Patents and trade marks
Customer relationships
Capitalised software
developmentTotal
The acquired legal entities are managed as standalone CGU's. A summary of the goodwill by cash generating unit is set out below:
Consolidated
1. Ella Cheong (Hong Kong) Limited was acquired on 31 Oct 2016 and subsequently renamed Spruson & Ferguson (Hong Kong) Limited
GoodwillSoftware Acquired
Additions through business combinations (note 33)
Additions through business combinations (note 33)
For the purposes of impairment testing, goodwill is allocated to Cash Generating Units (CGU's) that are an identifiable group of assets that generate cash associated with the goodwill.
1. Due to the proximity of the acquisitions of Practice Insight Pty Ltd and Fisher Adams Kelly Pty Limited to the prior year end, the intangible assets arising on the acquisitions were provisionally allocated entirely to goodwill. A portion of the goodwill was subsequently reallocated to other identifiable intangible assets once final assessments had been determined.
48
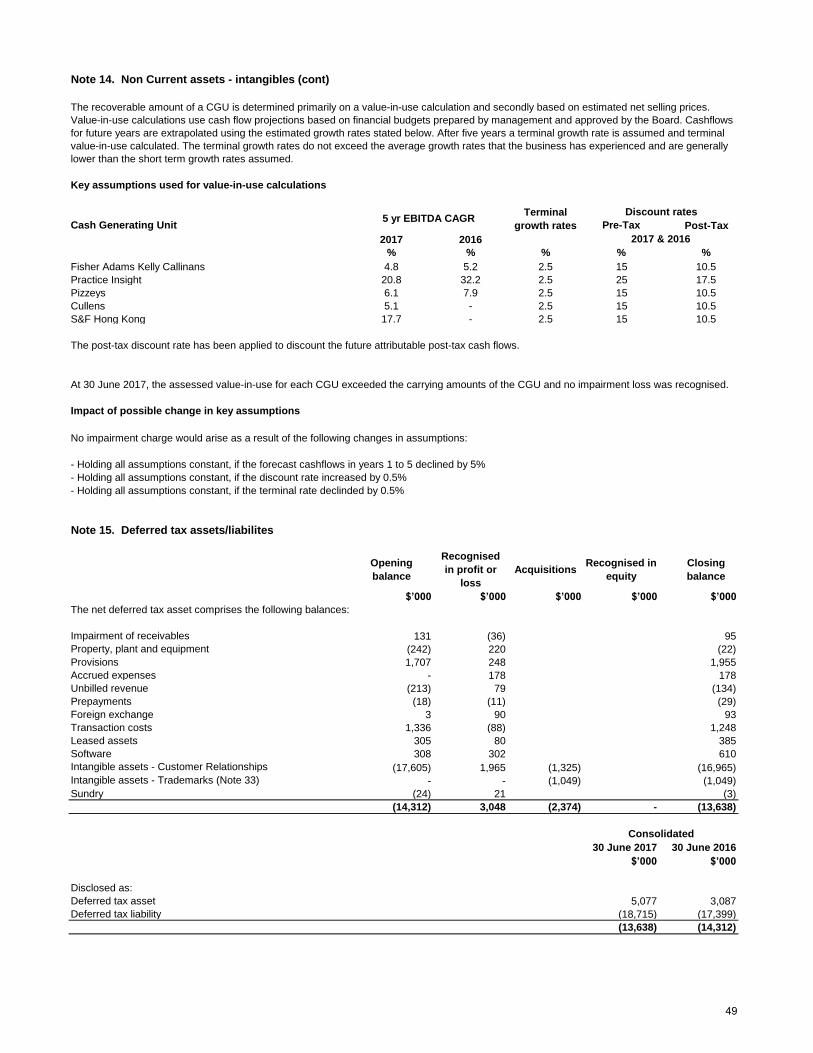
Note 14. Non Current assets - intangibles (cont)
Key assumptions used for value-in-use calculations
Cash Generating Unit Pre-Tax Post-Tax2017 2016
% % % % %Fisher Adams Kelly Callinans 4.8 5.2 2.5 15 10.5Practice Insight 20.8 32.2 2.5 25 17.5Pizzeys 6.1 7.9 2.5 15 10.5Cullens 5.1 - 2.5 15 10.5S&F Hong Kong 17.7 - 2.5 15 10.5
The post-tax discount rate has been applied to discount the future attributable post-tax cash flows.
Impact of possible change in key assumptions
No impairment charge would arise as a result of the following changes in assumptions:
- Holding all assumptions constant, if the forecast cashflows in years 1 to 5 declined by 5% - Holding all assumptions constant, if the discount rate increased by 0.5% - Holding all assumptions constant, if the terminal rate declinded by 0.5%
Note 15. Deferred tax assets/liabilites
$’000 $’000 $’000 $’000 $’000
The net deferred tax asset comprises the following balances:
Impairment of receivables 131 (36) 95Property, plant and equipment (242) 220 (22)Provisions 1,707 248 1,955Accrued expenses - 178 178Unbilled revenue (213) 79 (134)Prepayments (18) (11) (29)Foreign exchange 3 90 93Transaction costs 1,336 (88) 1,248Leased assets 305 80 385Software 308 302 610
(17,605) 1,965 (1,325) (16,965)- - (1,049) (1,049)
Sundry (24) 21 (3)(14,312) 3,048 (2,374) - (13,638)
30 June 2017 30 June 2016$’000 $’000
Disclosed as:Deferred tax asset 5,077 3,087Deferred tax liability (18,715) (17,399)
(13,638) (14,312)
Intangible assets - Customer RelationshipsIntangible assets - Trademarks (Note 33)
2017 & 2016
Consolidated
Opening balance
Recognised in profit or
lossAcquisitions
Recognised in equity
Closing balance
The recoverable amount of a CGU is determined primarily on a value-in-use calculation and secondly based on estimated net selling prices. Value-in-use calculations use cash flow projections based on financial budgets prepared by management and approved by the Board. Cashflows for future years are extrapolated using the estimated growth rates stated below. After five years a terminal growth rate is assumed and terminal value-in-use calculated. The terminal growth rates do not exceed the average growth rates that the business has experienced and are generally lower than the short term growth rates assumed.
Terminal growth rates
At 30 June 2017, the assessed value-in-use for each CGU exceeded the carrying amounts of the CGU and no impairment loss was recognised.
Discount rates5 yr EBITDA CAGR
49
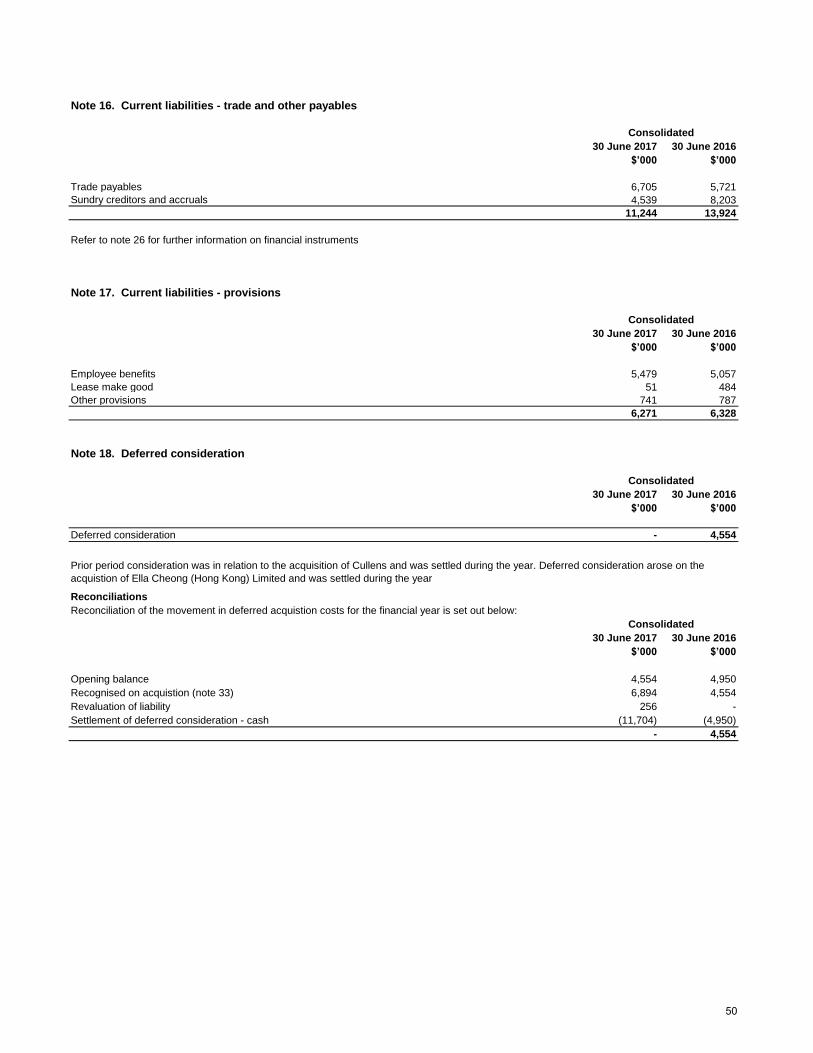
Note 16. Current liabilities - trade and other payables
30 June 2017 30 June 2016$’000 $’000
Trade payables 6,705 5,721Sundry creditors and accruals 4,539 8,203
11,244 13,924
Refer to note 26 for further information on financial instruments
Note 17. Current liabilities - provisions
30 June 2017 30 June 2016$’000 $’000
Employee benefits 5,479 5,057Lease make good 51 484Other provisions 741 787
6,271 6,328
Note 18. Deferred consideration
30 June 2017 30 June 2016$’000 $’000
Deferred consideration - 4,554
ReconciliationsReconciliation of the movement in deferred acquistion costs for the financial year is set out below:
30 June 2017 30 June 2016$’000 $’000
Opening balance 4,554 4,950Recognised on acquistion (note 33) 6,894 4,554Revaluation of liability 256 -Settlement of deferred consideration - cash (11,704) (4,950)
- 4,554
Consolidated
Prior period consideration was in relation to the acquisition of Cullens and was settled during the year. Deferred consideration arose on the acquistion of Ella Cheong (Hong Kong) Limited and was settled during the year
Consolidated
Consolidated
Consolidated
50
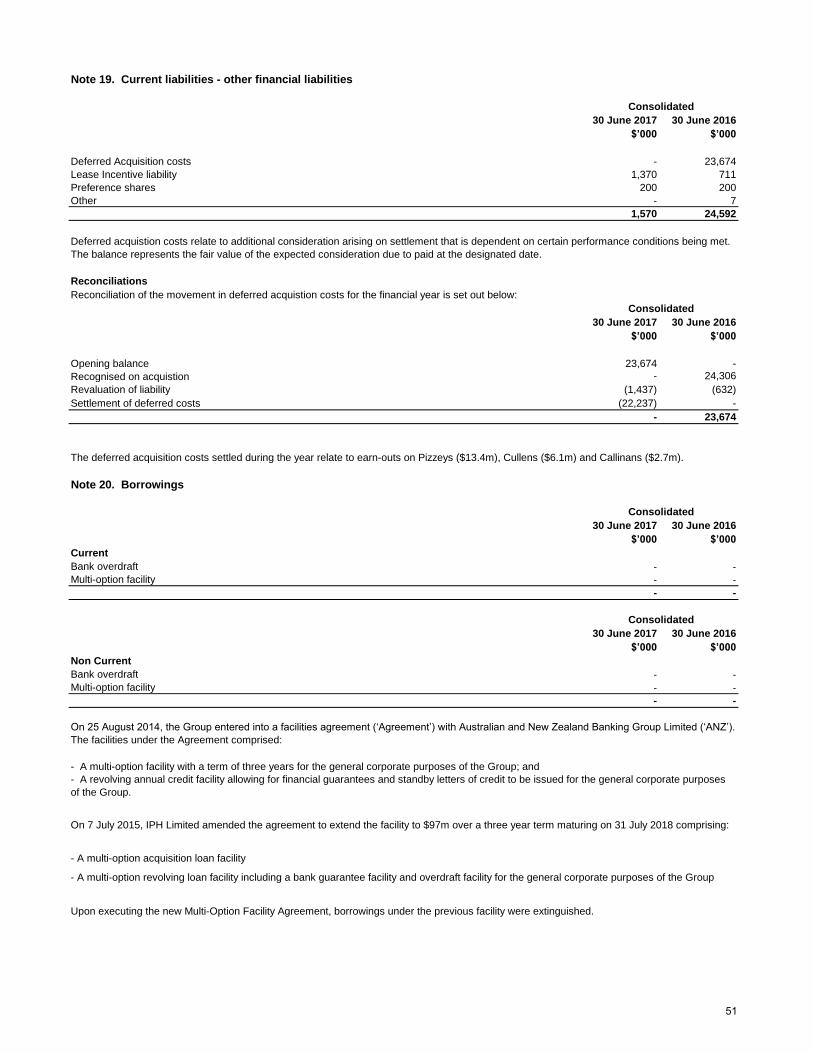
Note 19. Current liabilities - other financial liabilities
30 June 2017 30 June 2016$’000 $’000
Deferred Acquisition costs - 23,674Lease Incentive liability 1,370 711Preference shares 200 200Other - 7
1,570 24,592
ReconciliationsReconciliation of the movement in deferred acquistion costs for the financial year is set out below:
30 June 2017 30 June 2016$’000 $’000
Opening balance 23,674 -Recognised on acquistion - 24,306Revaluation of liability (1,437) (632)Settlement of deferred costs (22,237) -
- 23,674
Note 20. Borrowings
30 June 2017 30 June 2016$’000 $’000
CurrentBank overdraft - -Multi-option facility - -
- -
30 June 2017 30 June 2016$’000 $’000
Non CurrentBank overdraft - -Multi-option facility - -
- -
- A multi-option facility with a term of three years for the general corporate purposes of the Group; and
- A multi-option acquisition loan facility
Upon executing the new Multi-Option Facility Agreement, borrowings under the previous facility were extinguished.
On 25 August 2014, the Group entered into a facilities agreement (‘Agreement’) with Australian and New Zealand Banking Group Limited (‘ANZ’).
The facilities under the Agreement comprised:
- A revolving annual credit facility allowing for financial guarantees and standby letters of credit to be issued for the general corporate purposes of the Group.
On 7 July 2015, IPH Limited amended the agreement to extend the facility to $97m over a three year term maturing on 31 July 2018 comprising:
- A multi-option revolving loan facility including a bank guarantee facility and overdraft facility for the general corporate purposes of the Group
Consolidated
Consolidated
Consolidated
Deferred acquistion costs relate to additional consideration arising on settlement that is dependent on certain performance conditions being met. The balance represents the fair value of the expected consideration due to paid at the designated date.
Consolidated
The deferred acquisition costs settled during the year relate to earn-outs on Pizzeys ($13.4m), Cullens ($6.1m) and Callinans ($2.7m).
51
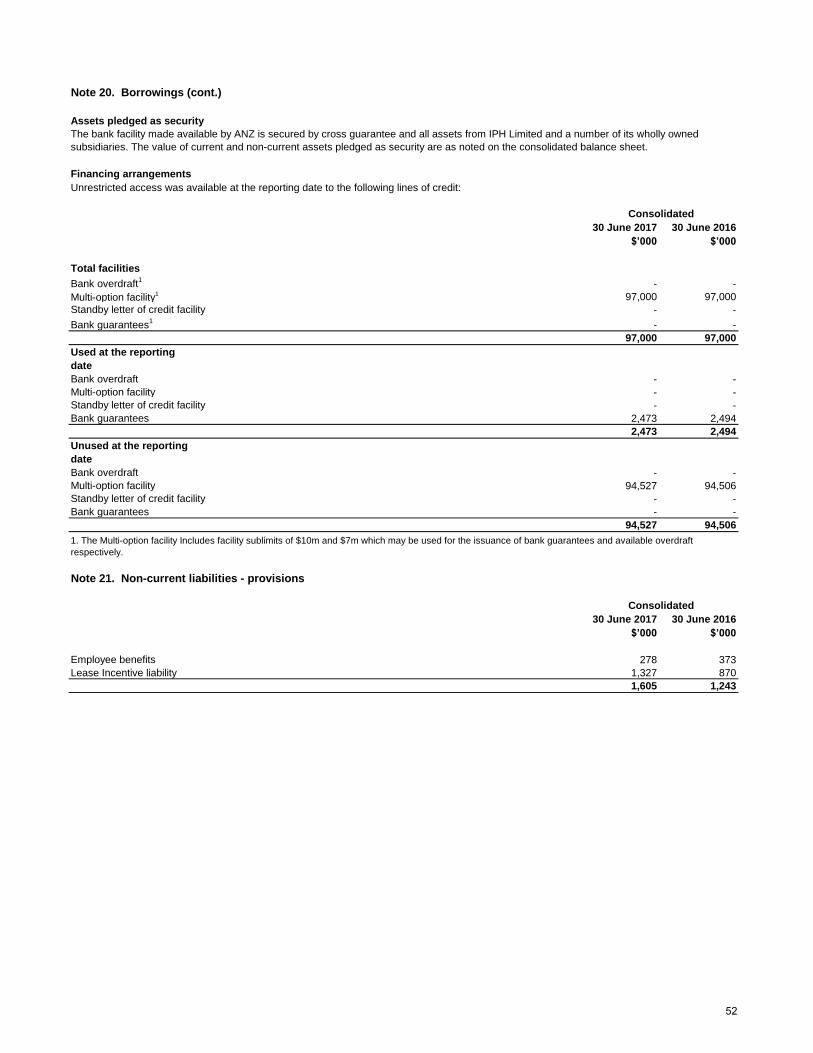
Note 20. Borrowings (cont.)
Assets pledged as security
Financing arrangementsUnrestricted access was available at the reporting date to the following lines of credit:
30 June 2017 30 June 2016$’000 $’000
Total facilities
Bank overdraft1 - -Multi-option facility1 97,000 97,000Standby letter of credit facility - -
Bank guarantees1 - -97,000 97,000
Used at the reporting dateBank overdraft - -Multi-option facility - -Standby letter of credit facility - -Bank guarantees 2,473 2,494
2,473 2,494Unused at the reporting dateBank overdraft - -Multi-option facility 94,527 94,506Standby letter of credit facility - -Bank guarantees - -
94,527 94,506
Note 21. Non-current liabilities - provisions
30 June 2017 30 June 2016$’000 $’000
Employee benefits 278 373Lease Incentive liability 1,327 870
1,605 1,243
Consolidated
Consolidated
The bank facility made available by ANZ is secured by cross guarantee and all assets from IPH Limited and a number of its wholly owned subsidiaries. The value of current and non-current assets pledged as security are as noted on the consolidated balance sheet.
1. The Multi-option facility Includes facility sublimits of $10m and $7m which may be used for the issuance of bank guarantees and available overdraft respectively.
52
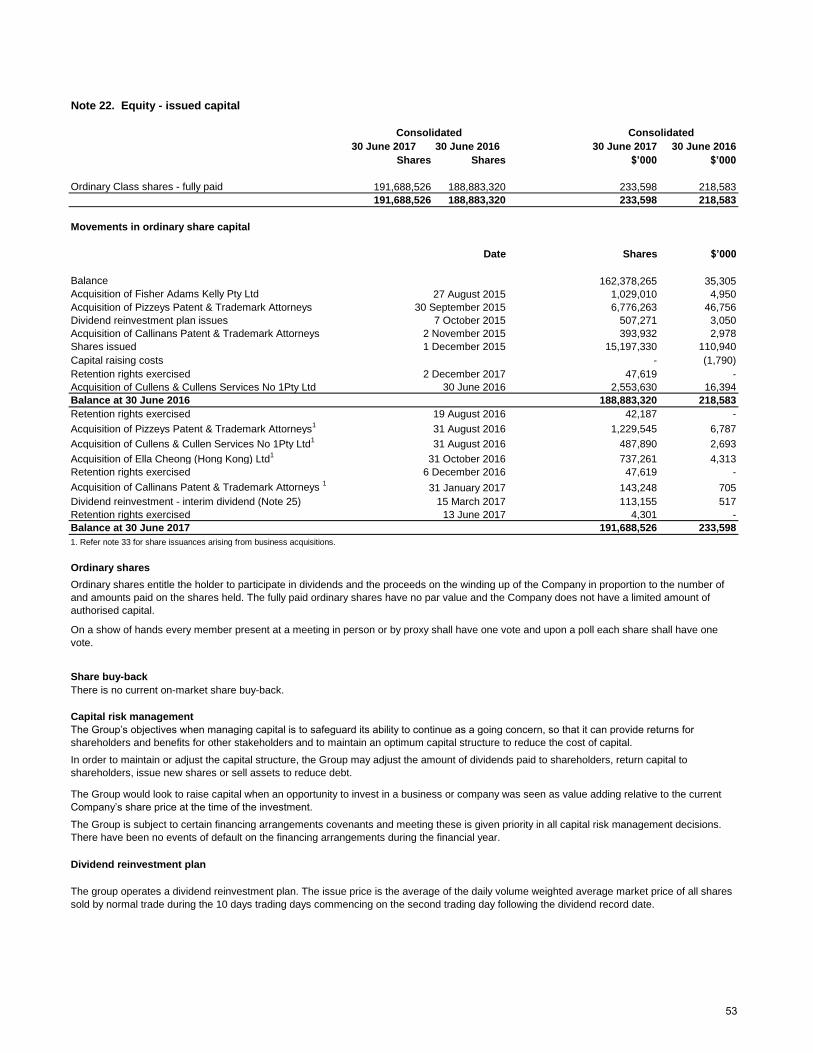
Note 22. Equity - issued capital
30 June 2017 30 June 2016 30 June 2017 30 June 2016Shares Shares $’000 $’000
Ordinary Class shares - fully paid 191,688,526 188,883,320 233,598 218,583191,688,526 188,883,320 233,598 218,583
Movements in ordinary share capital
Date Shares $’000
Balance 162,378,265 35,305Acquisition of Fisher Adams Kelly Pty Ltd 1,029,010 4,950Acquisition of Pizzeys Patent & Trademark Attorneys 6,776,263 46,756Dividend reinvestment plan issues 507,271 3,050Acquisition of Callinans Patent & Trademark Attorneys 393,932 2,978Shares issued 15,197,330 110,940Capital raising costs - (1,790)Retention rights exercised 47,619 -Acquisition of Cullens & Cullens Services No 1Pty Ltd 30 June 2016 2,553,630 16,394Balance at 30 June 2016 188,883,320 218,583Retention rights exercised 42,187 -
Acquisition of Pizzeys Patent & Trademark Attorneys1 1,229,545 6,787
Acquisition of Cullens & Cullen Services No 1Pty Ltd1 487,890 2,693
Acquisition of Ella Cheong (Hong Kong) Ltd1 737,261 4,313Retention rights exercised 47,619 -
Acquisition of Callinans Patent & Trademark Attorneys 1 143,248 705Dividend reinvestment - interim dividend (Note 25) 113,155 517Retention rights exercised 4,301 -Balance at 30 June 2017 191,688,526 233,5981. Refer note 33 for share issuances arising from business acquisitions.
Ordinary shares
Share buy-backThere is no current on-market share buy-back.
Capital risk management
Dividend reinvestment plan
6 December 2016
Ordinary shares entitle the holder to participate in dividends and the proceeds on the winding up of the Company in proportion to the number of and amounts paid on the shares held. The fully paid ordinary shares have no par value and the Company does not have a limited amount of authorised capital.
The Group’s objectives when managing capital is to safeguard its ability to continue as a going concern, so that it can provide returns for
shareholders and benefits for other stakeholders and to maintain an optimum capital structure to reduce the cost of capital.
2 November 20151 December 2015
19 August 2016
31 August 2016
31 August 2016
On a show of hands every member present at a meeting in person or by proxy shall have one vote and upon a poll each share shall have one vote.
31 October 2016
15 March 2017
2 December 2017
31 January 2017
13 June 2017
The group operates a dividend reinvestment plan. The issue price is the average of the daily volume weighted average market price of all shares sold by normal trade during the 10 days trading days commencing on the second trading day following the dividend record date.
Consolidated Consolidated
27 August 201530 September 2015
7 October 2015
In order to maintain or adjust the capital structure, the Group may adjust the amount of dividends paid to shareholders, return capital to shareholders, issue new shares or sell assets to reduce debt.
The Group would look to raise capital when an opportunity to invest in a business or company was seen as value adding relative to the current Company’s share price at the time of the investment.
The Group is subject to certain financing arrangements covenants and meeting these is given priority in all capital risk management decisions. There have been no events of default on the financing arrangements during the financial year.
53
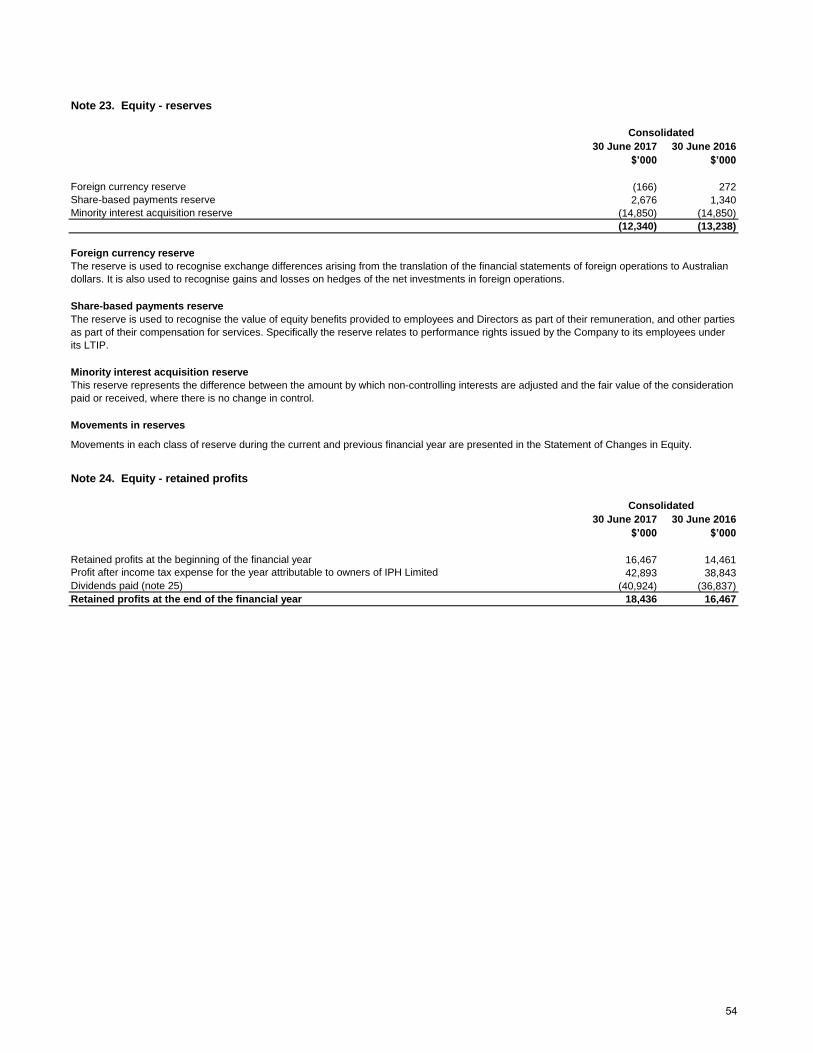
Note 23. Equity - reserves
30 June 2017 30 June 2016$’000 $’000
Foreign currency reserve (166) 272Share-based payments reserve 2,676 1,340Minority interest acquisition reserve (14,850) (14,850)
(12,340) (13,238)
Foreign currency reserve
Share-based payments reserve
Minority interest acquisition reserve
Movements in reserves
Note 24. Equity - retained profits
30 June 2017 30 June 2016$’000 $’000
Retained profits at the beginning of the financial year 16,467 14,46142,893 38,843
Dividends paid (note 25) (40,924) (36,837)Retained profits at the end of the financial year 18,436 16,467
Consolidated
Profit after income tax expense for the year attributable to owners of IPH Limited
Movements in each class of reserve during the current and previous financial year are presented in the Statement of Changes in Equity.
The reserve is used to recognise the value of equity benefits provided to employees and Directors as part of their remuneration, and other parties as part of their compensation for services. Specifically the reserve relates to performance rights issued by the Company to its employees under its LTIP.
This reserve represents the difference between the amount by which non-controlling interests are adjusted and the fair value of the consideration paid or received, where there is no change in control.
Consolidated
The reserve is used to recognise exchange differences arising from the translation of the financial statements of foreign operations to Australian dollars. It is also used to recognise gains and losses on hedges of the net investments in foreign operations.
54
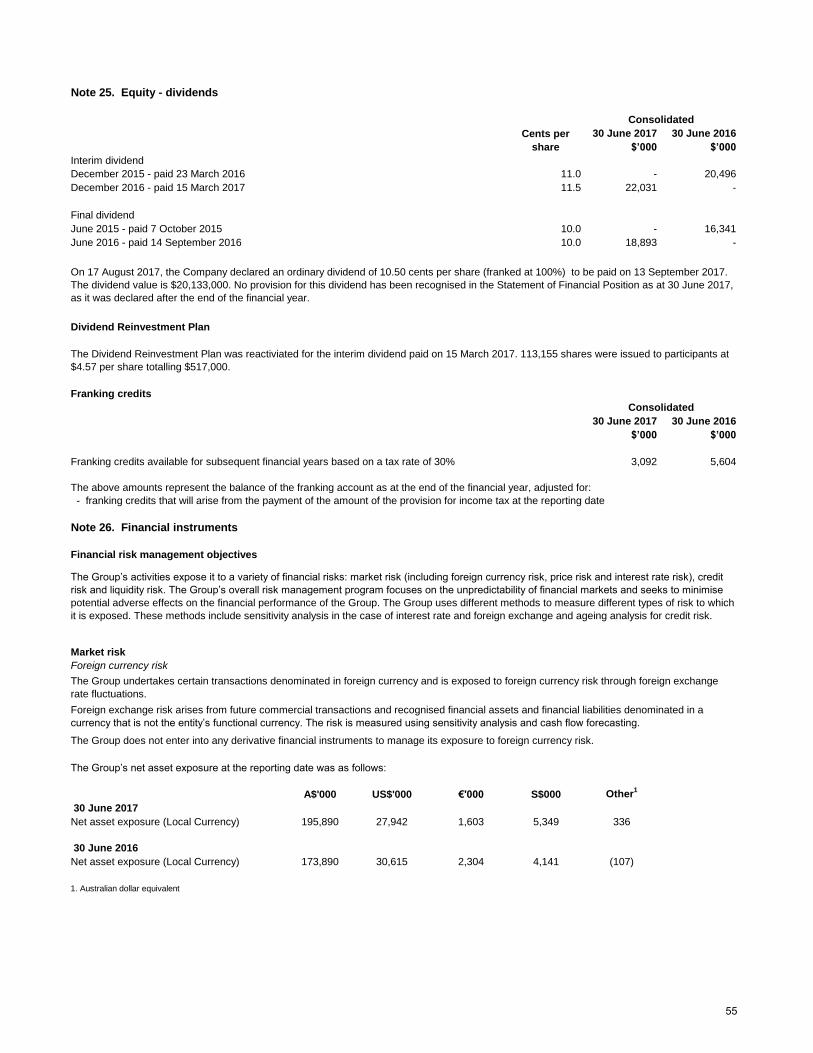
Note 25. Equity - dividends
30 June 2017 30 June 2016$’000 $’000
Interim dividend December 2015 - paid 23 March 2016 11.0 - 20,496December 2016 - paid 15 March 2017 11.5 22,031 -
Final dividendJune 2015 - paid 7 October 2015 10.0 - 16,341June 2016 - paid 14 September 2016 10.0 18,893 -
Franking credits
30 June 2017 30 June 2016$’000 $’000
Franking credits available for subsequent financial years based on a tax rate of 30% 3,092 5,604
The above amounts represent the balance of the franking account as at the end of the financial year, adjusted for: - franking credits that will arise from the payment of the amount of the provision for income tax at the reporting date
Note 26. Financial instruments
Financial risk management objectives
Market riskForeign currency risk
The Group does not enter into any derivative financial instruments to manage its exposure to foreign currency risk.
A$'000 US$'000 €'000 S$000 Other1
30 June 2017Net asset exposure (Local Currency) 195,890 27,942 1,603 5,349 336
30 June 2016Net asset exposure (Local Currency) 173,890 30,615 2,304 4,141 (107)
1. Australian dollar equivalent
On 17 August 2017, the Company declared an ordinary dividend of 10.50 cents per share (franked at 100%) to be paid on 13 September 2017. The dividend value is $20,133,000. No provision for this dividend has been recognised in the Statement of Financial Position as at 30 June 2017, as it was declared after the end of the financial year.
Consolidated
The Group’s activities expose it to a variety of financial risks: market risk (including foreign currency risk, price risk and interest rate risk), credit
risk and liquidity risk. The Group’s overall risk management program focuses on the unpredictability of financial markets and seeks to minimise
potential adverse effects on the financial performance of the Group. The Group uses different methods to measure different types of risk to which it is exposed. These methods include sensitivity analysis in the case of interest rate and foreign exchange and ageing analysis for credit risk.
The Group’s net asset exposure at the reporting date was as follows:
Cents per share
Consolidated
The Group undertakes certain transactions denominated in foreign currency and is exposed to foreign currency risk through foreign exchange rate fluctuations.
Foreign exchange risk arises from future commercial transactions and recognised financial assets and financial liabilities denominated in a currency that is not the entity’s functional currency. The risk is measured using sensitivity analysis and cash flow forecasting.
Dividend Reinvestment Plan
The Dividend Reinvestment Plan was reactiviated for the interim dividend paid on 15 March 2017. 113,155 shares were issued to participants at $4.57 per share totalling $517,000.
55
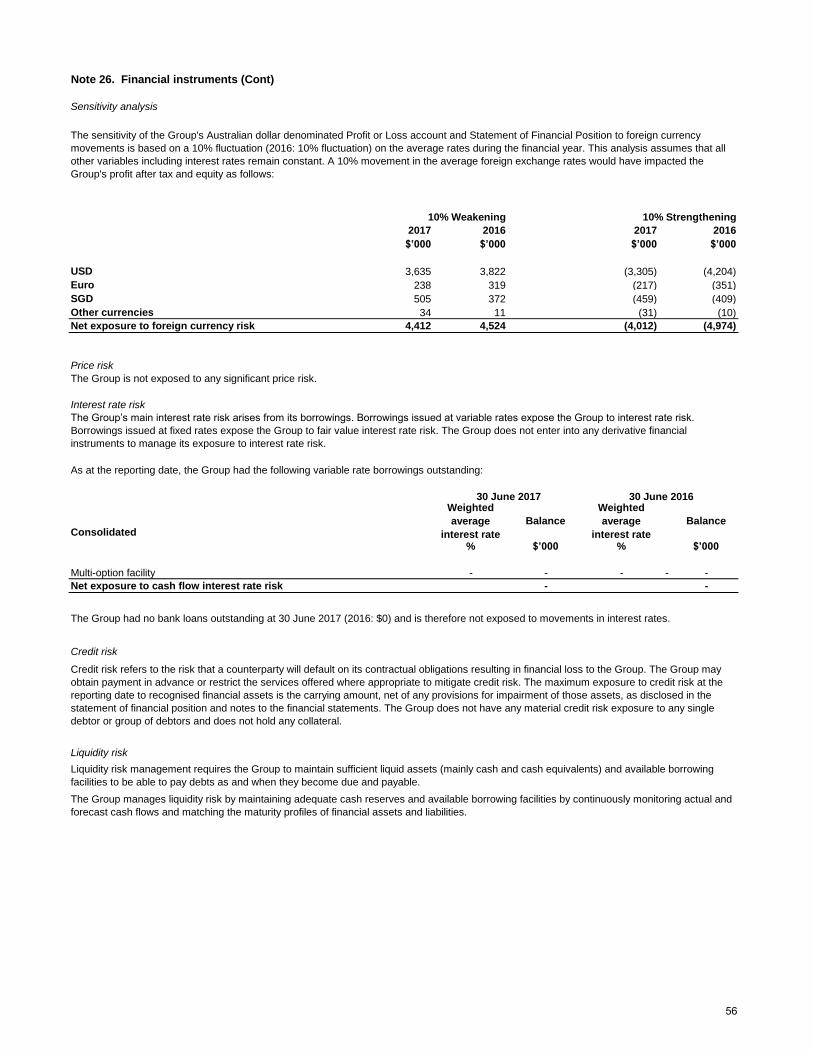
Note 26. Financial instruments (Cont)
Sensitivity analysis
2017 2016 2017 2016$’000 $’000 $’000 $’000
USD 3,635 3,822 (3,305) (4,204)Euro 238 319 (217) (351)SGD 505 372 (459) (409)Other currencies 34 11 (31) (10)Net exposure to foreign currency risk 4,412 4,524 (4,012) (4,974)
Price risk
The Group is not exposed to any significant price risk.
Interest rate risk
As at the reporting date, the Group had the following variable rate borrowings outstanding:
Consolidated% $’000 % $’000
Multi-option facility - - - - -Net exposure to cash flow interest rate risk - -
Credit risk
Liquidity risk
Liquidity risk management requires the Group to maintain sufficient liquid assets (mainly cash and cash equivalents) and available borrowing facilities to be able to pay debts as and when they become due and payable.
The Group manages liquidity risk by maintaining adequate cash reserves and available borrowing facilities by continuously monitoring actual and forecast cash flows and matching the maturity profiles of financial assets and liabilities.
Credit risk refers to the risk that a counterparty will default on its contractual obligations resulting in financial loss to the Group. The Group may obtain payment in advance or restrict the services offered where appropriate to mitigate credit risk. The maximum exposure to credit risk at the reporting date to recognised financial assets is the carrying amount, net of any provisions for impairment of those assets, as disclosed in the statement of financial position and notes to the financial statements. The Group does not have any material credit risk exposure to any single debtor or group of debtors and does not hold any collateral.
The Group’s main interest rate risk arises from its borrowings. Borrowings issued at variable rates expose the Group to interest rate risk.
Borrowings issued at fixed rates expose the Group to fair value interest rate risk. The Group does not enter into any derivative financial instruments to manage its exposure to interest rate risk.
Weighted average
interest rateBalance
Weighted average
interest rateBalance
30 June 2017 30 June 2016
The Group had no bank loans outstanding at 30 June 2017 (2016: $0) and is therefore not exposed to movements in interest rates.
10% Weakening 10% Strengthening
The sensitivity of the Group's Australian dollar denominated Profit or Loss account and Statement of Financial Position to foreign currency movements is based on a 10% fluctuation (2016: 10% fluctuation) on the average rates during the financial year. This analysis assumes that all other variables including interest rates remain constant. A 10% movement in the average foreign exchange rates would have impacted the Group's profit after tax and equity as follows:
56
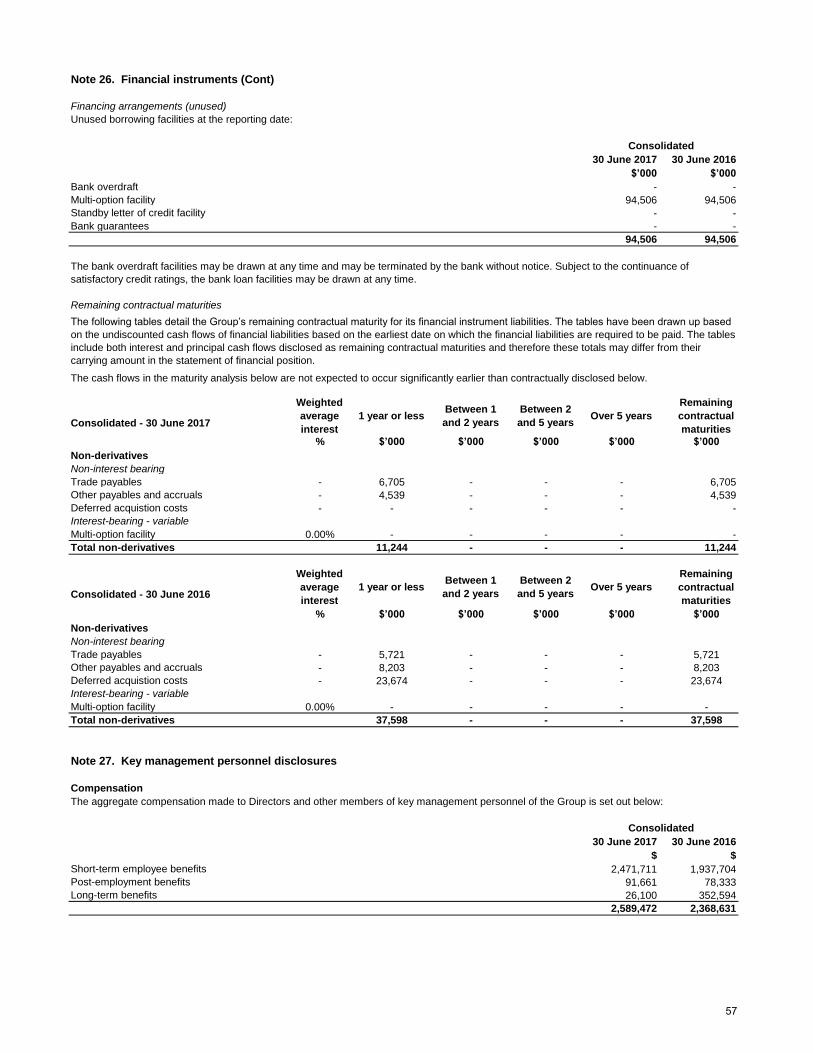
Note 26. Financial instruments (Cont)
Financing arrangements (unused)
Unused borrowing facilities at the reporting date:
30 June 2017 30 June 2016$’000 $’000
Bank overdraft - -Multi-option facility 94,506 94,506Standby letter of credit facility - -Bank guarantees - -
94,506 94,506
Remaining contractual maturities
The cash flows in the maturity analysis below are not expected to occur significantly earlier than contractually disclosed below.
Consolidated - 30 June 2017
% $’000 $’000 $’000 $’000 $’000
Non-derivatives Non-interest bearing
Trade payables - 6,705 - - - 6,705Other payables and accruals - 4,539 - - - 4,539Deferred acquistion costs - - - - - -Interest-bearing - variable
Multi-option facility 0.00% - - - - -Total non-derivatives 11,244 - - - 11,244
Consolidated - 30 June 2016
% $’000 $’000 $’000 $’000 $’000
Non-derivatives Non-interest bearing
Trade payables - 5,721 - - - 5,721Other payables and accruals - 8,203 - - - 8,203Deferred acquistion costs - 23,674 - - - 23,674Interest-bearing - variable
Multi-option facility 0.00% - - - - -Total non-derivatives 37,598 - - - 37,598
Note 27. Key management personnel disclosures
CompensationThe aggregate compensation made to Directors and other members of key management personnel of the Group is set out below:
30 June 2017 30 June 2016$ $
Short-term employee benefits 2,471,711 1,937,704Post-employment benefits 91,661 78,333Long-term benefits 26,100 352,594
2,589,472 2,368,631
Consolidated
Consolidated
The bank overdraft facilities may be drawn at any time and may be terminated by the bank without notice. Subject to the continuance of satisfactory credit ratings, the bank loan facilities may be drawn at any time.
The following tables detail the Group’s remaining contractual maturity for its financial instrument liabilities. The tables have been drawn up based
on the undiscounted cash flows of financial liabilities based on the earliest date on which the financial liabilities are required to be paid. The tables include both interest and principal cash flows disclosed as remaining contractual maturities and therefore these totals may differ from their carrying amount in the statement of financial position.
Weighted average interest
Over 5 yearsRemaining contractual maturities
Weighted average interest
1 year or lessBetween 1 and 2 years
Between 2 and 5 years
1 year or lessBetween 1 and 2 years
Between 2 and 5 years
Over 5 yearsRemaining contractual maturities
57
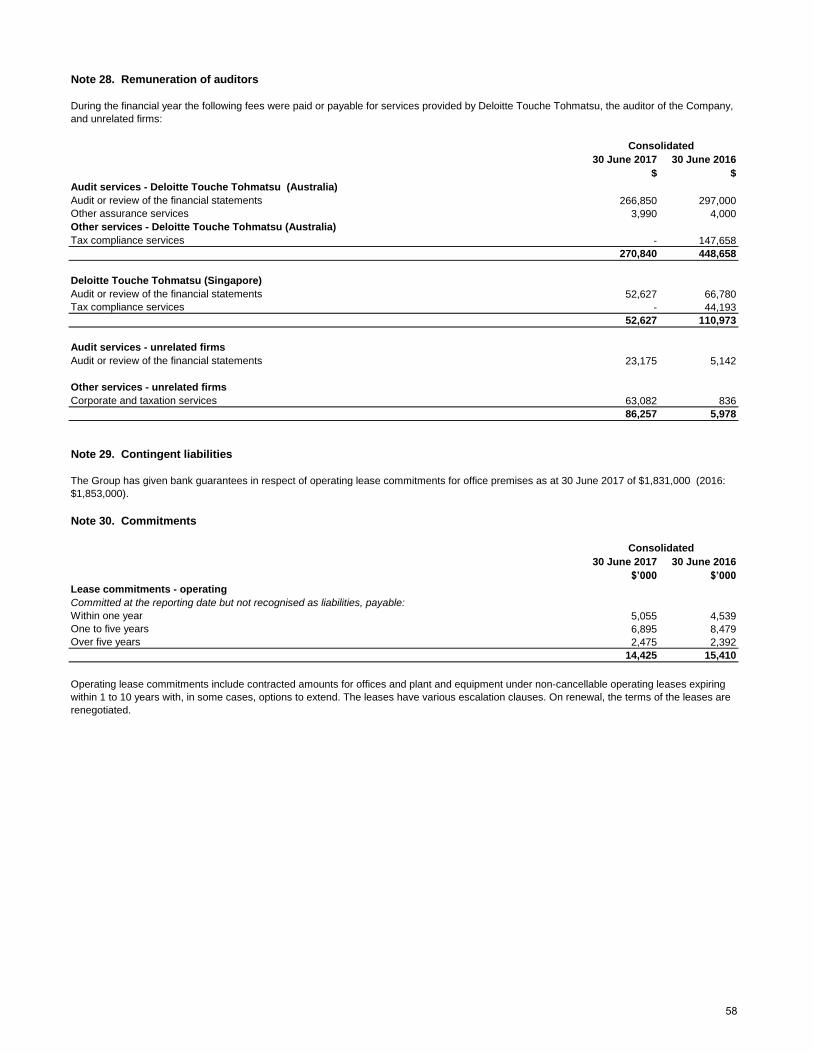
Note 28. Remuneration of auditors
30 June 2017 30 June 2016$ $
Audit services - Deloitte Touche Tohmatsu (Australia)Audit or review of the financial statements 266,850 297,000Other assurance services 3,990 4,000Other services - Deloitte Touche Tohmatsu (Australia)Tax compliance services - 147,658
270,840 448,658
Deloitte Touche Tohmatsu (Singapore)Audit or review of the financial statements 52,627 66,780Tax compliance services - 44,193
52,627 110,973
Audit services - unrelated firms Audit or review of the financial statements 23,175 5,142
Other services - unrelated firms Corporate and taxation services 63,082 836
86,257 5,978
Note 29. Contingent liabilities
Note 30. Commitments
30 June 2017 30 June 2016$’000 $’000
Lease commitments - operating Committed at the reporting date but not recognised as liabilities, payable:
Within one year 5,055 4,539One to five years 6,895 8,479Over five years 2,475 2,392
14,425 15,410
During the financial year the following fees were paid or payable for services provided by Deloitte Touche Tohmatsu, the auditor of the Company, and unrelated firms:
Consolidated
The Group has given bank guarantees in respect of operating lease commitments for office premises as at 30 June 2017 of $1,831,000 (2016: $1,853,000).
Consolidated
Operating lease commitments include contracted amounts for offices and plant and equipment under non-cancellable operating leases expiring within 1 to 10 years with, in some cases, options to extend. The leases have various escalation clauses. On renewal, the terms of the leases are renegotiated.
58
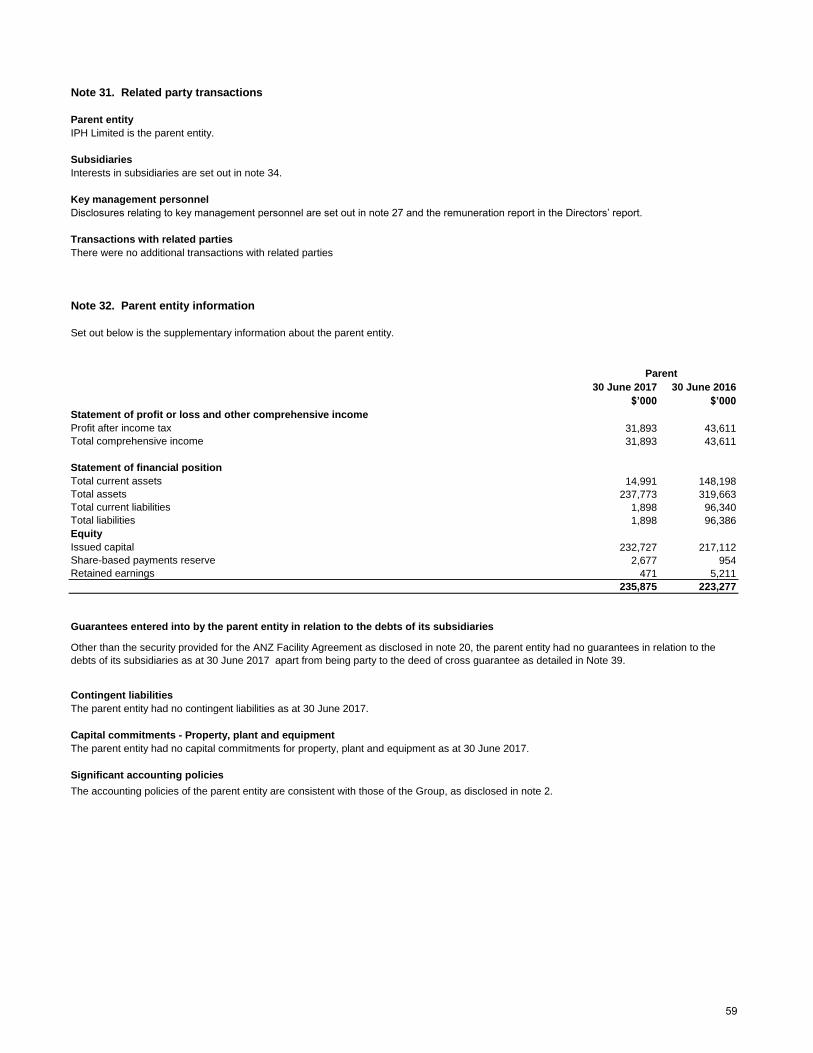
Note 31. Related party transactions
Parent entityIPH Limited is the parent entity.
SubsidiariesInterests in subsidiaries are set out in note 34.
Key management personnelDisclosures relating to key management personnel are set out in note 27 and the remuneration report in the Directors’ report.
Transactions with related partiesThere were no additional transactions with related parties
Note 32. Parent entity information
Set out below is the supplementary information about the parent entity.
30 June 2017 30 June 2016$’000 $’000
Statement of profit or loss and other comprehensive incomeProfit after income tax 31,893 43,611Total comprehensive income 31,893 43,611
Statement of financial positionTotal current assets 14,991 148,198Total assets 237,773 319,663Total current liabilities 1,898 96,340Total liabilities 1,898 96,386EquityIssued capital 232,727 217,112Share-based payments reserve 2,677 954Retained earnings 471 5,211
235,875 223,277
Guarantees entered into by the parent entity in relation to the debts of its subsidiaries
Contingent liabilitiesThe parent entity had no contingent liabilities as at 30 June 2017.
Capital commitments - Property, plant and equipmentThe parent entity had no capital commitments for property, plant and equipment as at 30 June 2017.
Significant accounting policies
The accounting policies of the parent entity are consistent with those of the Group, as disclosed in note 2.
Parent
Other than the security provided for the ANZ Facility Agreement as disclosed in note 20, the parent entity had no guarantees in relation to the debts of its subsidiaries as at 30 June 2017 apart from being party to the deed of cross guarantee as detailed in Note 39.
59
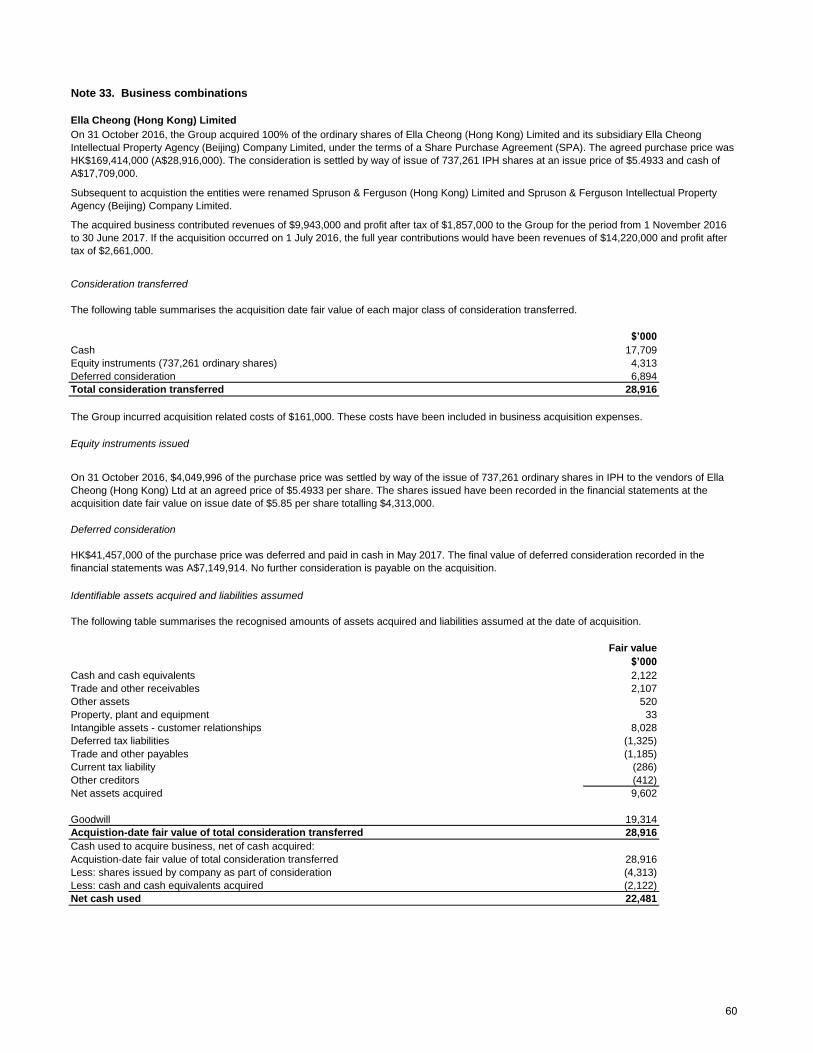
Note 33. Business combinations
Ella Cheong (Hong Kong) Limited
Consideration transferred
The following table summarises the acquisition date fair value of each major class of consideration transferred.
$’000
Cash 17,709Equity instruments (737,261 ordinary shares) 4,313Deferred consideration 6,894Total consideration transferred 28,916
The Group incurred acquisition related costs of $161,000. These costs have been included in business acquisition expenses.
Equity instruments issued
Deferred consideration
Identifiable assets acquired and liabilities assumed
The following table summarises the recognised amounts of assets acquired and liabilities assumed at the date of acquisition.
Fair value$’000
Cash and cash equivalents 2,122Trade and other receivables 2,107Other assets 520Property, plant and equipment 33Intangible assets - customer relationships 8,028Deferred tax liabilities (1,325)Trade and other payables (1,185)Current tax liability (286)Other creditors (412)Net assets acquired 9,602
Goodwill 19,314Acquistion-date fair value of total consideration transferred 28,916Cash used to acquire business, net of cash acquired:Acquistion-date fair value of total consideration transferred 28,916Less: shares issued by company as part of consideration (4,313)Less: cash and cash equivalents acquired (2,122)Net cash used 22,481
On 31 October 2016, the Group acquired 100% of the ordinary shares of Ella Cheong (Hong Kong) Limited and its subsidiary Ella Cheong Intellectual Property Agency (Beijing) Company Limited, under the terms of a Share Purchase Agreement (SPA). The agreed purchase price was HK$169,414,000 (A$28,916,000). The consideration is settled by way of issue of 737,261 IPH shares at an issue price of $5.4933 and cash of A$17,709,000.
On 31 October 2016, $4,049,996 of the purchase price was settled by way of the issue of 737,261 ordinary shares in IPH to the vendors of Ella Cheong (Hong Kong) Ltd at an agreed price of $5.4933 per share. The shares issued have been recorded in the financial statements at the acquisition date fair value on issue date of $5.85 per share totalling $4,313,000.
HK$41,457,000 of the purchase price was deferred and paid in cash in May 2017. The final value of deferred consideration recorded in the financial statements was A$7,149,914. No further consideration is payable on the acquisition.
The acquired business contributed revenues of $9,943,000 and profit after tax of $1,857,000 to the Group for the period from 1 November 2016 to 30 June 2017. If the acquisition occurred on 1 July 2016, the full year contributions would have been revenues of $14,220,000 and profit after tax of $2,661,000.
Subsequent to acquistion the entities were renamed Spruson & Ferguson (Hong Kong) Limited and Spruson & Ferguson Intellectual Property Agency (Beijing) Company Limited.
60
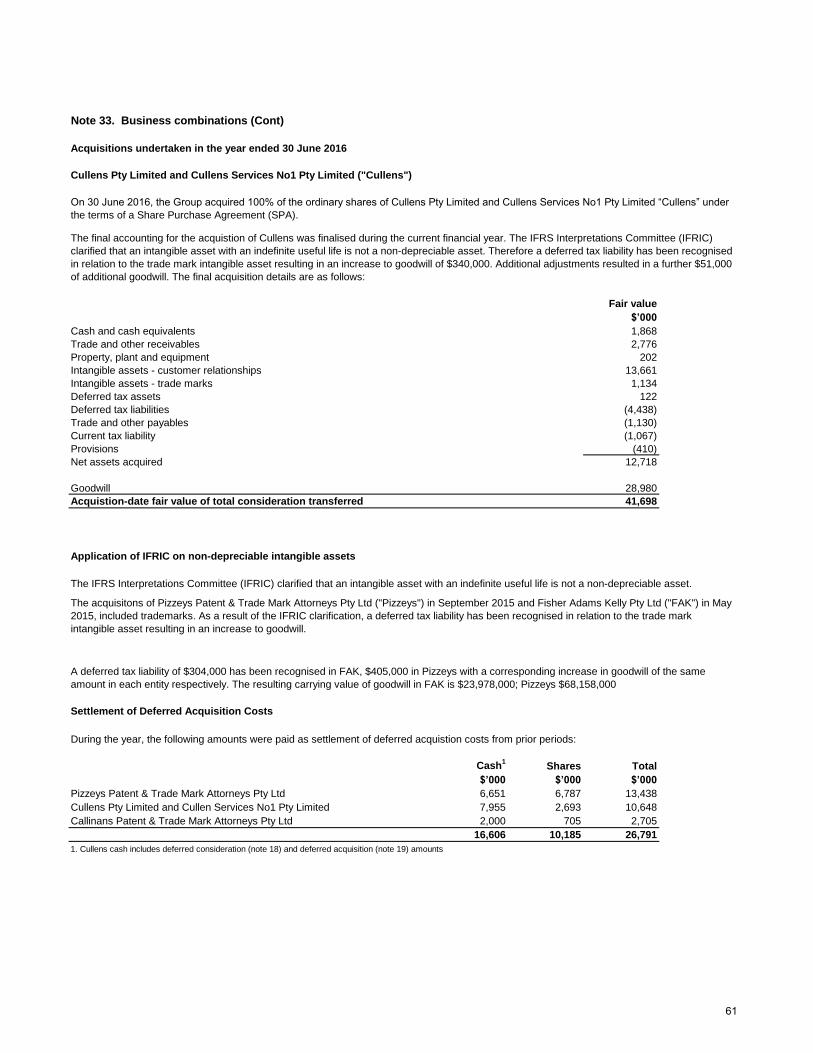
Note 33. Business combinations (Cont)
Acquisitions undertaken in the year ended 30 June 2016
Cullens Pty Limited and Cullens Services No1 Pty Limited ("Cullens")
Fair value$’000
Cash and cash equivalents 1,868Trade and other receivables 2,776Property, plant and equipment 202Intangible assets - customer relationships 13,661Intangible assets - trade marks 1,134Deferred tax assets 122Deferred tax liabilities (4,438)Trade and other payables (1,130)Current tax liability (1,067)Provisions (410)Net assets acquired 12,718
Goodwill 28,980Acquistion-date fair value of total consideration transferred 41,698
Application of IFRIC on non-depreciable intangible assets
The IFRS Interpretations Committee (IFRIC) clarified that an intangible asset with an indefinite useful life is not a non-depreciable asset.
Settlement of Deferred Acquisition Costs
Cash1 Shares Total$’000 $’000 $’000
Pizzeys Patent & Trade Mark Attorneys Pty Ltd 6,651 6,787 13,4387,955 2,693 10,648
Callinans Patent & Trade Mark Attorneys Pty Ltd 2,000 705 2,70516,606 10,185 26,791
1. Cullens cash includes deferred consideration (note 18) and deferred acquisition (note 19) amounts
On 30 June 2016, the Group acquired 100% of the ordinary shares of Cullens Pty Limited and Cullens Services No1 Pty Limited “Cullens” under
the terms of a Share Purchase Agreement (SPA).
The final accounting for the acquistion of Cullens was finalised during the current financial year. The IFRS Interpretations Committee (IFRIC) clarified that an intangible asset with an indefinite useful life is not a non-depreciable asset. Therefore a deferred tax liability has been recognised in relation to the trade mark intangible asset resulting in an increase to goodwill of $340,000. Additional adjustments resulted in a further $51,000 of additional goodwill. The final acquisition details are as follows:
The acquisitons of Pizzeys Patent & Trade Mark Attorneys Pty Ltd ("Pizzeys") in September 2015 and Fisher Adams Kelly Pty Ltd ("FAK") in May 2015, included trademarks. As a result of the IFRIC clarification, a deferred tax liability has been recognised in relation to the trade mark intangible asset resulting in an increase to goodwill.
A deferred tax liability of $304,000 has been recognised in FAK, $405,000 in Pizzeys with a corresponding increase in goodwill of the same amount in each entity respectively. The resulting carrying value of goodwill in FAK is $23,978,000; Pizzeys $68,158,000
During the year, the following amounts were paid as settlement of deferred acquistion costs from prior periods:
Cullens Pty Limited and Cullen Services No1 Pty Limited
61
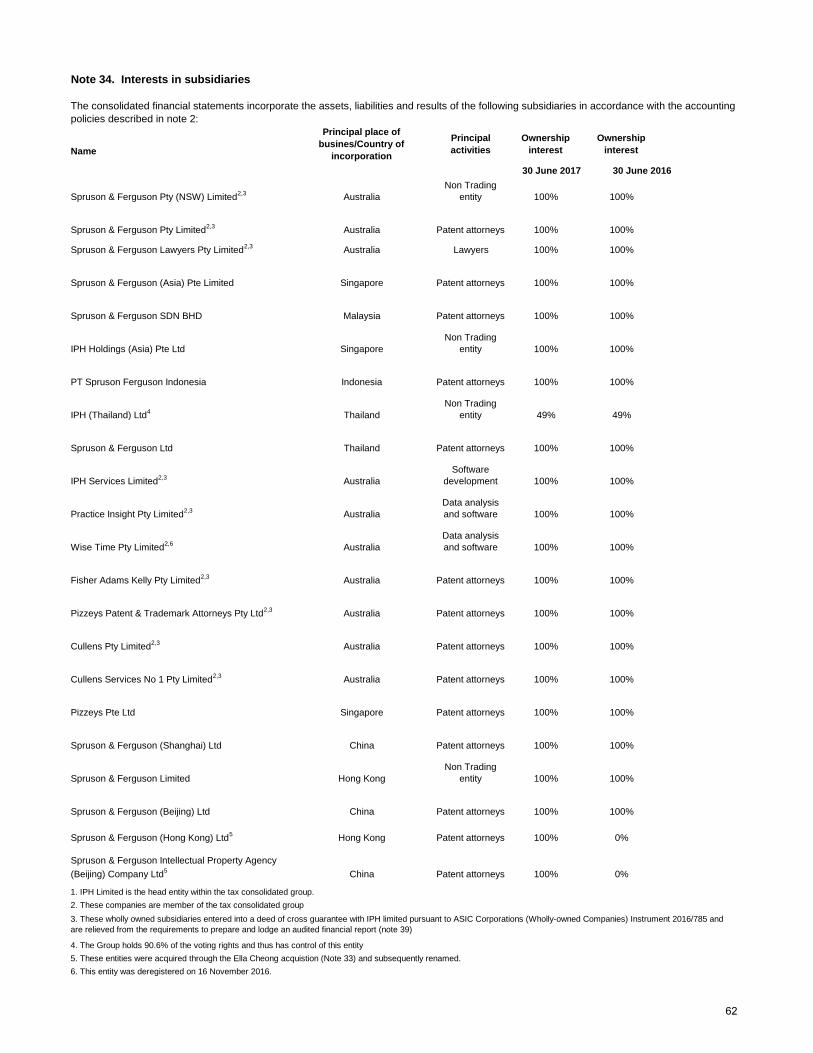
Note 34. Interests in subsidiaries
Name
30 June 2017 30 June 2016
Lawyers 100% 100%
1. IPH Limited is the head entity within the tax consolidated group.
2. These companies are member of the tax consolidated group
4. The Group holds 90.6% of the voting rights and thus has control of this entity
5. These entities were acquired through the Ella Cheong acquistion (Note 33) and subsequently renamed.
6. This entity was deregistered on 16 November 2016.
Spruson & Ferguson Intellectual Property Agency
(Beijing) Company Ltd5
Spruson & Ferguson (Beijing) Ltd China 100% 100%
Spruson & Ferguson (Hong Kong) Ltd5 Hong Kong Patent attorneys 100% 0%
China Patent attorneys 100% 0%
3. These wholly owned subsidiaries entered into a deed of cross guarantee with IPH limited pursuant to ASIC Corporations (Wholly-owned Companies) Instrument 2016/785 and are relieved from the requirements to prepare and lodge an audited financial report (note 39)
Ownership interest
Patent attorneys
Non Trading entity
Patent attorneys
The consolidated financial statements incorporate the assets, liabilities and results of the following subsidiaries in accordance with the accounting policies described in note 2:
Principal activities
Ownership interest
Patent attorneys
Patent attorneys
Software development
Data analysis and software
Spruson & Ferguson Pty (NSW) Limited2,3
Non Trading entity
Patent attorneys
Patent attorneys
Australia
Principal place of busines/Country of
incorporation
Australia
Spruson & Ferguson Lawyers Pty Limited2,3
AustraliaSpruson & Ferguson Pty Limited2,3
100% 100%
100% 100%
Spruson & Ferguson (Asia) Pte Limited Singapore 100% 100%
Non Trading entity
Spruson & Ferguson SDN BHD Malaysia 100% 100%
IPH Holdings (Asia) Pte Ltd Singapore 100% 100%
PT Spruson Ferguson Indonesia Indonesia 100% 100%
IPH (Thailand) Ltd4 Thailand 49% 49%
Spruson & Ferguson Ltd Thailand 100% 100%
IPH Services Limited2,3 Australia 100% 100%
Practice Insight Pty Limited2,3 Australia 100% 100%
Wise Time Pty Limited2,6 Australia 100% 100%Data analysis and software
100% 100%
Australia 100% 100%
Cullens Pty Limited2,3 Australia 100% 100%
Patent attorneys
Patent attorneys
Patent attorneys
Pizzeys Patent & Trademark Attorneys Pty Ltd2,3
Fisher Adams Kelly Pty Limited2,3 Australia
100% 100%
Pizzeys Pte Ltd Singapore 100% 100%
Spruson & Ferguson (Shanghai) Ltd China 100% 100%
Spruson & Ferguson Limited Hong Kong 100% 100%
Patent attorneys
Patent attorneys
Patent attorneys
Non Trading entity
Cullens Services No 1 Pty Limited2,3 Australia
62
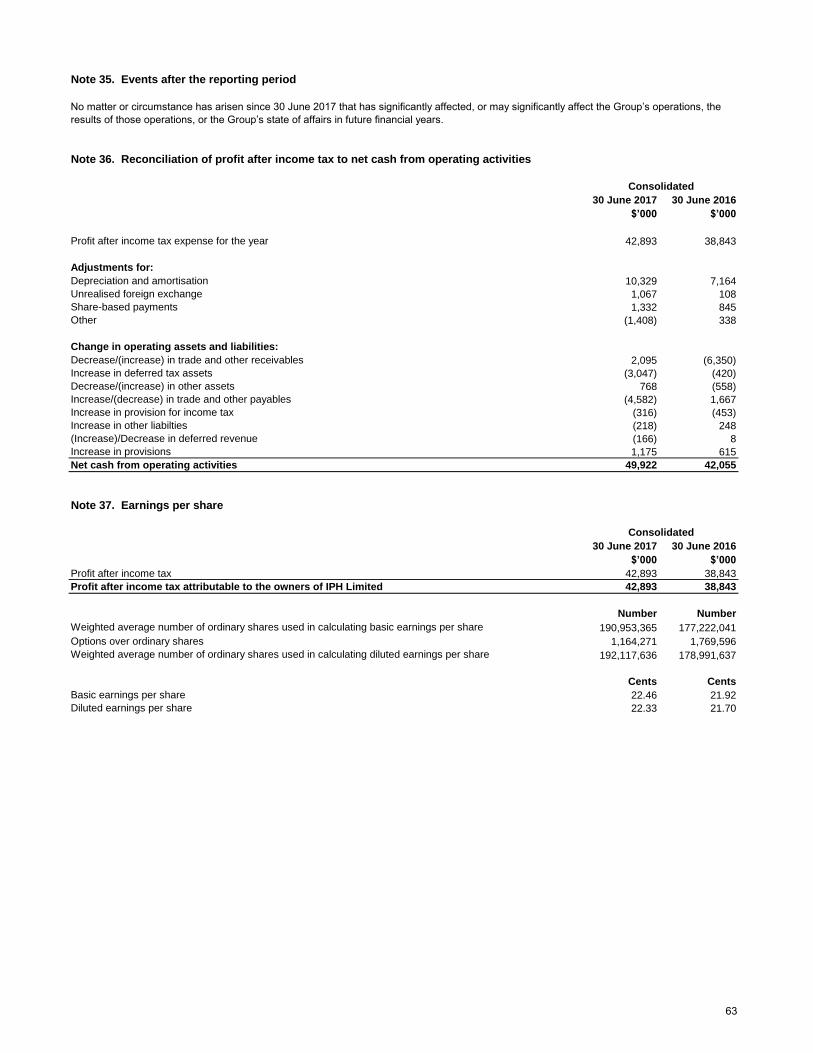
Note 35. Events after the reporting period
Note 36. Reconciliation of profit after income tax to net cash from operating activities
30 June 2017 30 June 2016$’000 $’000
Profit after income tax expense for the year 42,893 38,843
Adjustments for: Depreciation and amortisation 10,329 7,164Unrealised foreign exchange 1,067 108Share-based payments 1,332 845Other (1,408) 338
Change in operating assets and liabilities:Decrease/(increase) in trade and other receivables 2,095 (6,350)Increase in deferred tax assets (3,047) (420)Decrease/(increase) in other assets 768 (558)Increase/(decrease) in trade and other payables (4,582) 1,667Increase in provision for income tax (316) (453)Increase in other liabilties (218) 248(Increase)/Decrease in deferred revenue (166) 8Increase in provisions 1,175 615Net cash from operating activities 49,922 42,055
Note 37. Earnings per share
30 June 2017 30 June 2016$’000 $’000
Profit after income tax 42,893 38,843Profit after income tax attributable to the owners of IPH Limited 42,893 38,843
Number Number190,953,365 177,222,041
Options over ordinary shares 1,164,271 1,769,596192,117,636 178,991,637
Cents CentsBasic earnings per share 22.46 21.92Diluted earnings per share 22.33 21.70
Weighted average number of ordinary shares used in calculating diluted earnings per share
Weighted average number of ordinary shares used in calculating basic earnings per share
Consolidated
Consolidated
No matter or circumstance has arisen since 30 June 2017 that has significantly affected, or may significantly affect the Group’s operations, the
results of those operations, or the Group’s state of affairs in future financial years.
63
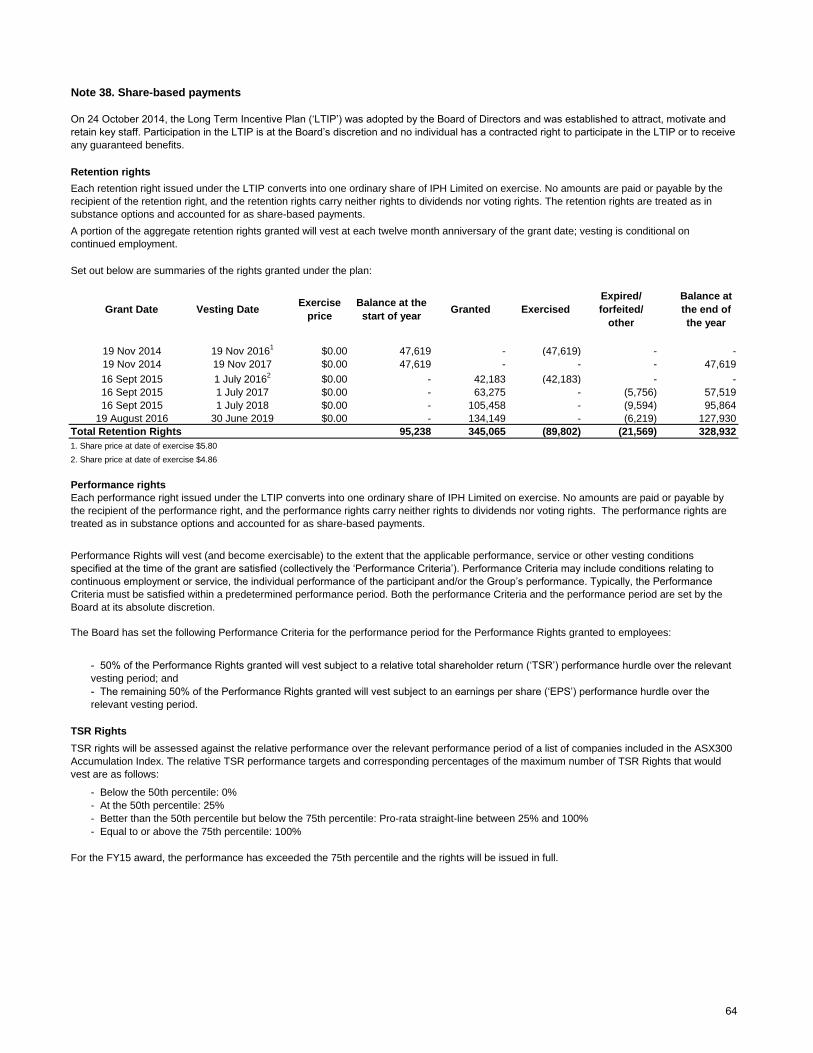
Note 38. Share-based payments
Retention rights
Set out below are summaries of the rights granted under the plan:
19 Nov 2014 19 Nov 20161 $0.00 47,619 - (47,619) - -19 Nov 2014 19 Nov 2017 $0.00 47,619 - - - 47,619
16 Sept 2015 1 July 20162 $0.00 - 42,183 (42,183) - -16 Sept 2015 1 July 2017 $0.00 - 63,275 - (5,756) 57,51916 Sept 2015 1 July 2018 $0.00 - 105,458 - (9,594) 95,864
19 August 2016 30 June 2019 $0.00 - 134,149 - (6,219) 127,930Total Retention Rights 95,238 345,065 (89,802) (21,569) 328,9321. Share price at date of exercise $5.80
2. Share price at date of exercise $4.86
Performance rights
TSR Rights
- Below the 50th percentile: 0%- At the 50th percentile: 25%- Better than the 50th percentile but below the 75th percentile: Pro-rata straight-line between 25% and 100%- Equal to or above the 75th percentile: 100%
For the FY15 award, the performance has exceeded the 75th percentile and the rights will be issued in full.
On 24 October 2014, the Long Term Incentive Plan (‘LTIP’) was adopted by the Board of Directors and was established to attract, motivate and
retain key staff. Participation in the LTIP is at the Board’s discretion and no individual has a contracted right to participate in the LTIP or to receive
any guaranteed benefits.
Each retention right issued under the LTIP converts into one ordinary share of IPH Limited on exercise. No amounts are paid or payable by the recipient of the retention right, and the retention rights carry neither rights to dividends nor voting rights. The retention rights are treated as in substance options and accounted for as share-based payments.
Balance at the end of the year
A portion of the aggregate retention rights granted will vest at each twelve month anniversary of the grant date; vesting is conditional on continued employment.
Vesting DateExercise
priceBalance at the start of year
Granted ExercisedExpired/ forfeited/
otherGrant Date
The Board has set the following Performance Criteria for the performance period for the Performance Rights granted to employees:
- 50% of the Performance Rights granted will vest subject to a relative total shareholder return (‘TSR’) performance hurdle over the relevant
vesting period; and- The remaining 50% of the Performance Rights granted will vest subject to an earnings per share (‘EPS’) performance hurdle over the
relevant vesting period.
TSR rights will be assessed against the relative performance over the relevant performance period of a list of companies included in the ASX300 Accumulation Index. The relative TSR performance targets and corresponding percentages of the maximum number of TSR Rights that would vest are as follows:
Each performance right issued under the LTIP converts into one ordinary share of IPH Limited on exercise. No amounts are paid or payable by the recipient of the performance right, and the performance rights carry neither rights to dividends nor voting rights. The performance rights are treated as in substance options and accounted for as share-based payments.
Performance Rights will vest (and become exercisable) to the extent that the applicable performance, service or other vesting conditions specified at the time of the grant are satisfied (collectively the ‘Performance Criteria’). Performance Criteria may include conditions relating to
continuous employment or service, the individual performance of the participant and/or the Group’s performance. Typically, the Performance
Criteria must be satisfied within a predetermined performance period. Both the performance Criteria and the performance period are set by the Board at its absolute discretion.
64
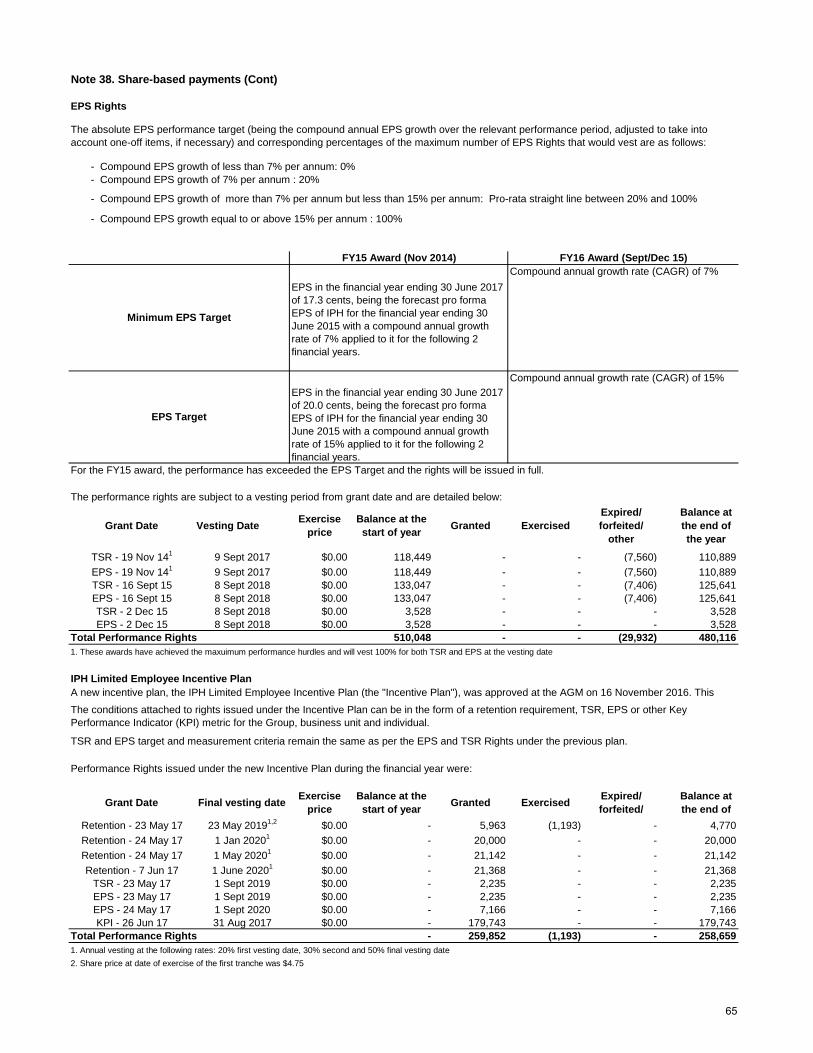
Note 38. Share-based payments (Cont)
EPS Rights
- Compound EPS growth of less than 7% per annum: 0%- Compound EPS growth of 7% per annum : 20%
- Compound EPS growth equal to or above 15% per annum : 100%
For the FY15 award, the performance has exceeded the EPS Target and the rights will be issued in full.
The performance rights are subject to a vesting period from grant date and are detailed below:
TSR - 19 Nov 141 9 Sept 2017 $0.00 118,449 - - (7,560) 110,889
EPS - 19 Nov 141 9 Sept 2017 $0.00 118,449 - - (7,560) 110,889TSR - 16 Sept 15 8 Sept 2018 $0.00 133,047 - - (7,406) 125,641EPS - 16 Sept 15 8 Sept 2018 $0.00 133,047 - - (7,406) 125,641TSR - 2 Dec 15 8 Sept 2018 $0.00 3,528 - - - 3,528EPS - 2 Dec 15 8 Sept 2018 $0.00 3,528 - - - 3,528
Total Performance Rights 510,048 - - (29,932) 480,1161. These awards have achieved the maxuimum performance hurdles and will vest 100% for both TSR and EPS at the vesting date
IPH Limited Employee Incentive Plan
Retention - 23 May 17 23 May 20191,2 $0.00 - 5,963 (1,193) - 4,770
Retention - 24 May 17 1 Jan 20201 $0.00 - 20,000 - - 20,000
Retention - 24 May 17 1 May 20201 $0.00 - 21,142 - - 21,142
Retention - 7 Jun 17 1 June 20201 $0.00 - 21,368 - - 21,368TSR - 23 May 17 1 Sept 2019 $0.00 - 2,235 - - 2,235EPS - 23 May 17 1 Sept 2019 $0.00 - 2,235 - - 2,235EPS - 24 May 17 1 Sept 2020 $0.00 - 7,166 - - 7,166KPI - 26 Jun 17 31 Aug 2017 $0.00 - 179,743 - - 179,743
Total Performance Rights - 259,852 (1,193) - 258,6591. Annual vesting at the following rates: 20% first vesting date, 30% second and 50% final vesting date
2. Share price at date of exercise of the first tranche was $4.75
Compound annual growth rate (CAGR) of 15%
Grant Date Vesting DateExercise
priceBalance at the start of year
Granted ExercisedExpired/ forfeited/
other
Balance at the end of the year
Exercise price
Balance at the start of year
Granted ExercisedExpired/ forfeited/
Balance at the end of
EPS Target
EPS in the financial year ending 30 June 2017 of 20.0 cents, being the forecast pro forma EPS of IPH for the financial year ending 30 June 2015 with a compound annual growth rate of 15% applied to it for the following 2 financial years.
FY16 Award (Sept/Dec 15)
Minimum EPS Target
EPS in the financial year ending 30 June 2017 of 17.3 cents, being the forecast pro forma EPS of IPH for the financial year ending 30 June 2015 with a compound annual growth rate of 7% applied to it for the following 2 financial years.
Compound annual growth rate (CAGR) of 7%
The absolute EPS performance target (being the compound annual EPS growth over the relevant performance period, adjusted to take into account one-off items, if necessary) and corresponding percentages of the maximum number of EPS Rights that would vest are as follows:
- Compound EPS growth of more than 7% per annum but less than 15% per annum: Pro-rata straight line between 20% and 100%
FY15 Award (Nov 2014)
A new incentive plan, the IPH Limited Employee Incentive Plan (the "Incentive Plan"), was approved at the AGM on 16 November 2016. This
The conditions attached to rights issued under the Incentive Plan can be in the form of a retention requirement, TSR, EPS or other Key Performance Indicator (KPI) metric for the Group, business unit and individual.
TSR and EPS target and measurement criteria remain the same as per the EPS and TSR Rights under the previous plan.
Performance Rights issued under the new Incentive Plan during the financial year were:
Grant Date Final vesting date
65
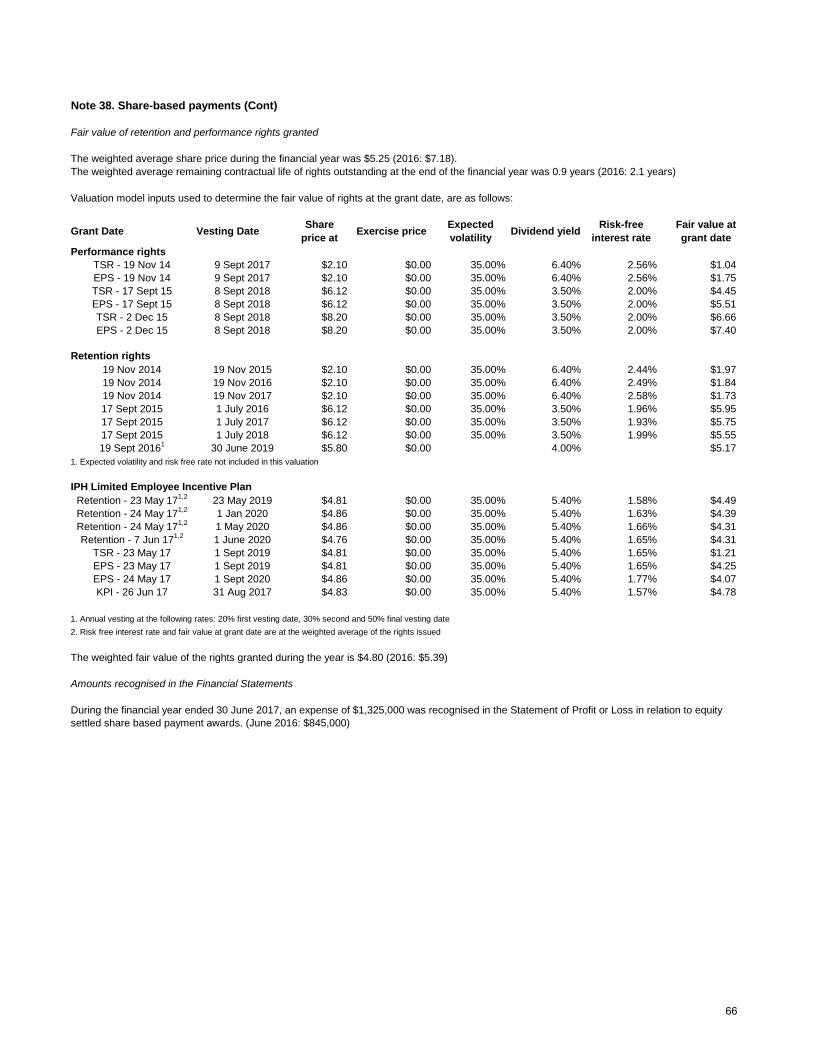
Note 38. Share-based payments (Cont)
Fair value of retention and performance rights granted
The weighted average share price during the financial year was $5.25 (2016: $7.18).The weighted average remaining contractual life of rights outstanding at the end of the financial year was 0.9 years (2016: 2.1 years)
Valuation model inputs used to determine the fair value of rights at the grant date, are as follows:
Performance rightsTSR - 19 Nov 14 9 Sept 2017 $2.10 $0.00 35.00% 6.40% 2.56% $1.04EPS - 19 Nov 14 9 Sept 2017 $2.10 $0.00 35.00% 6.40% 2.56% $1.75TSR - 17 Sept 15 8 Sept 2018 $6.12 $0.00 35.00% 3.50% 2.00% $4.45EPS - 17 Sept 15 8 Sept 2018 $6.12 $0.00 35.00% 3.50% 2.00% $5.51TSR - 2 Dec 15 8 Sept 2018 $8.20 $0.00 35.00% 3.50% 2.00% $6.66EPS - 2 Dec 15 8 Sept 2018 $8.20 $0.00 35.00% 3.50% 2.00% $7.40
Retention rights19 Nov 2014 19 Nov 2015 $2.10 $0.00 35.00% 6.40% 2.44% $1.9719 Nov 2014 19 Nov 2016 $2.10 $0.00 35.00% 6.40% 2.49% $1.8419 Nov 2014 19 Nov 2017 $2.10 $0.00 35.00% 6.40% 2.58% $1.7317 Sept 2015 1 July 2016 $6.12 $0.00 35.00% 3.50% 1.96% $5.9517 Sept 2015 1 July 2017 $6.12 $0.00 35.00% 3.50% 1.93% $5.7517 Sept 2015 1 July 2018 $6.12 $0.00 35.00% 3.50% 1.99% $5.5519 Sept 20161 30 June 2019 $5.80 $0.00 4.00% $5.17
1. Expected volatility and risk free rate not included in this valuation
IPH Limited Employee Incentive PlanRetention - 23 May 171,2 23 May 2019 $4.81 $0.00 35.00% 5.40% 1.58% $4.49Retention - 24 May 171,2 1 Jan 2020 $4.86 $0.00 35.00% 5.40% 1.63% $4.39Retention - 24 May 171,2 1 May 2020 $4.86 $0.00 35.00% 5.40% 1.66% $4.31Retention - 7 Jun 171,2 1 June 2020 $4.76 $0.00 35.00% 5.40% 1.65% $4.31
TSR - 23 May 17 1 Sept 2019 $4.81 $0.00 35.00% 5.40% 1.65% $1.21EPS - 23 May 17 1 Sept 2019 $4.81 $0.00 35.00% 5.40% 1.65% $4.25EPS - 24 May 17 1 Sept 2020 $4.86 $0.00 35.00% 5.40% 1.77% $4.07KPI - 26 Jun 17 31 Aug 2017 $4.83 $0.00 35.00% 5.40% 1.57% $4.78
1. Annual vesting at the following rates: 20% first vesting date, 30% second and 50% final vesting date
2. Risk free interest rate and fair value at grant date are at the weighted average of the rights issued
The weighted fair value of the rights granted during the year is $4.80 (2016: $5.39)
Amounts recognised in the Financial Statements
Grant Date Vesting DateShare
price at Exercise price
Expected volatility
Dividend yieldRisk-free
interest rateFair value at grant date
During the financial year ended 30 June 2017, an expense of $1,325,000 was recognised in the Statement of Profit or Loss in relation to equity settled share based payment awards. (June 2016: $845,000)
66
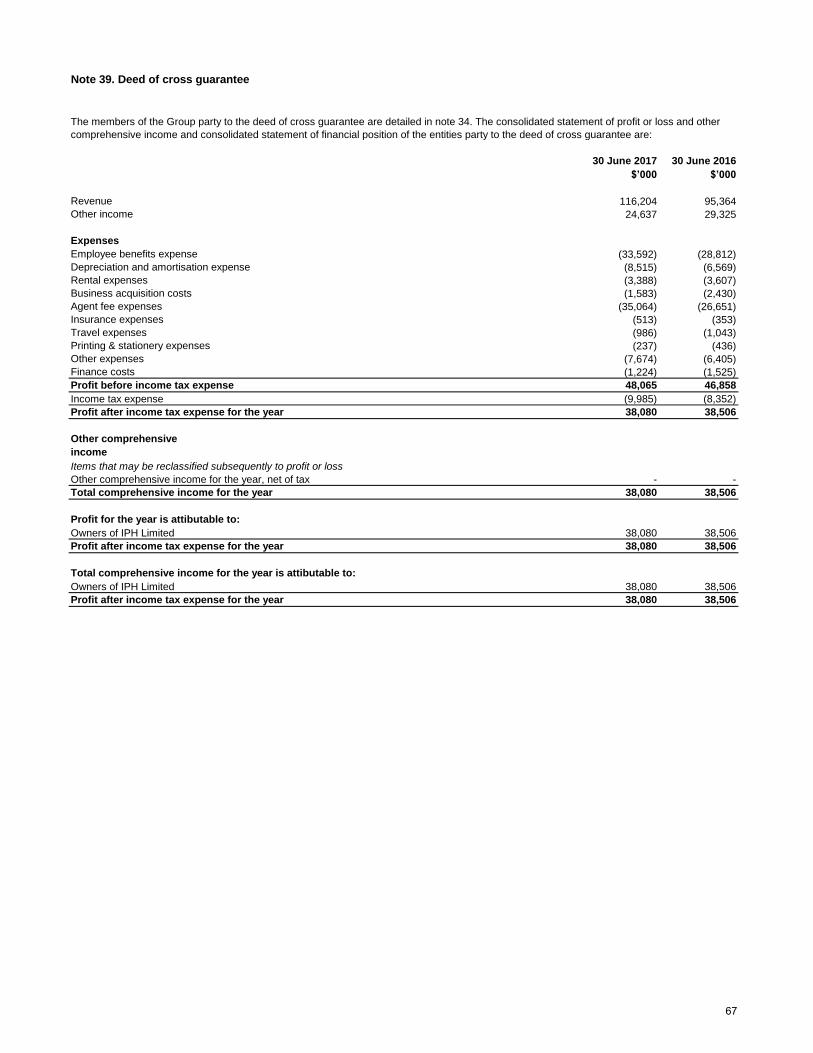
Note 39. Deed of cross guarantee
30 June 2017 30 June 2016$’000 $’000
Revenue 116,204 95,364Other income 24,637 29,325
ExpensesEmployee benefits expense (33,592) (28,812)Depreciation and amortisation expense (8,515) (6,569)Rental expenses (3,388) (3,607)Business acquisition costs (1,583) (2,430)Agent fee expenses (35,064) (26,651)Insurance expenses (513) (353)Travel expenses (986) (1,043)Printing & stationery expenses (237) (436)Other expenses (7,674) (6,405)Finance costs (1,224) (1,525)Profit before income tax expense 48,065 46,858Income tax expense (9,985) (8,352)Profit after income tax expense for the year 38,080 38,506
Other comprehensive incomeItems that may be reclassified subsequently to profit or loss
Other comprehensive income for the year, net of tax - -Total comprehensive income for the year 38,080 38,506
Profit for the year is attibutable to:Owners of IPH Limited 38,080 38,506Profit after income tax expense for the year 38,080 38,506
Total comprehensive income for the year is attibutable to:Owners of IPH Limited 38,080 38,506Profit after income tax expense for the year 38,080 38,506
The members of the Group party to the deed of cross guarantee are detailed in note 34. The consolidated statement of profit or loss and other comprehensive income and consolidated statement of financial position of the entities party to the deed of cross guarantee are:
67
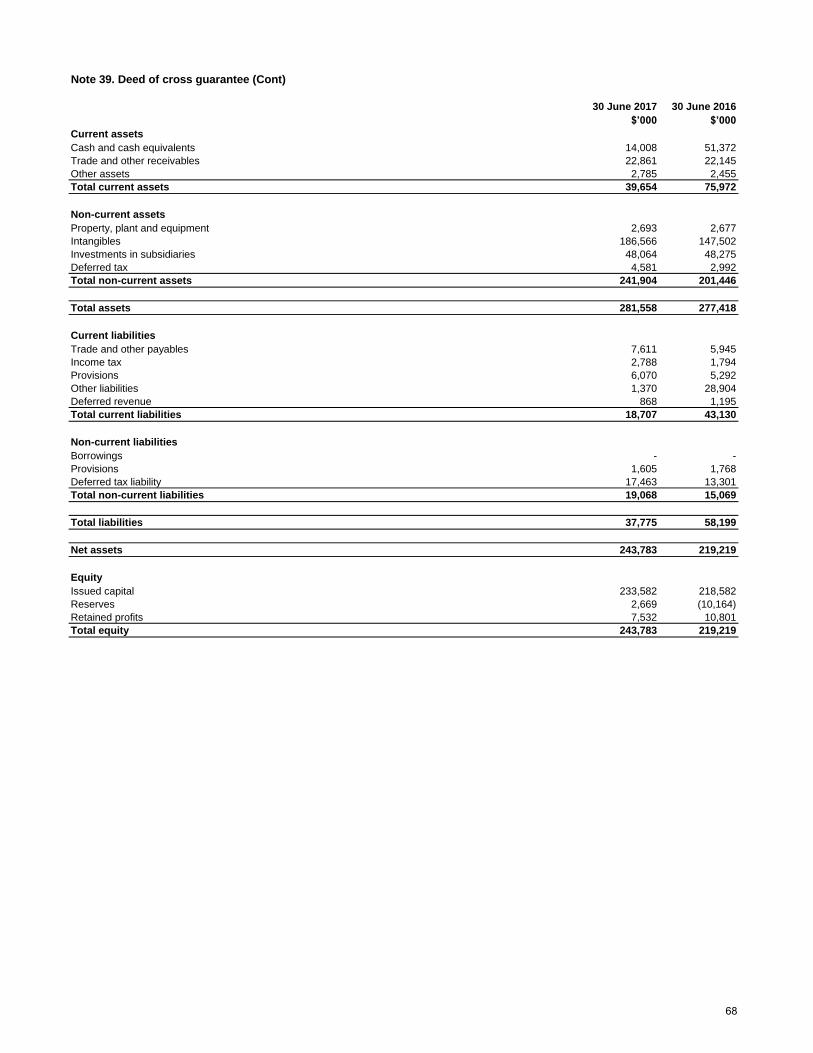
Note 39. Deed of cross guarantee (Cont)
30 June 2017 30 June 2016$’000 $’000
Current assetsCash and cash equivalents 14,008 51,372Trade and other receivables 22,861 22,145Other assets 2,785 2,455Total current assets 39,654 75,972
Non-current assetsProperty, plant and equipment 2,693 2,677Intangibles 186,566 147,502Investments in subsidiaries 48,064 48,275Deferred tax 4,581 2,992Total non-current assets 241,904 201,446
Total assets 281,558 277,418
Current liabilitiesTrade and other payables 7,611 5,945Income tax 2,788 1,794Provisions 6,070 5,292Other liabilities 1,370 28,904Deferred revenue 868 1,195Total current liabilities 18,707 43,130
Non-current liabilitiesBorrowings - -Provisions 1,605 1,768Deferred tax liability 17,463 13,301Total non-current liabilities 19,068 15,069
Total liabilities 37,775 58,199
Net assets 243,783 219,219
EquityIssued capital 233,582 218,582Reserves 2,669 (10,164)Retained profits 7,532 10,801Total equity 243,783 219,219
68
In the Directors’ opinion:
- there are reasonable grounds to believe that the Company will be able to pay its debts as and when they become due and payable.
The Directors have been given the declarations required by section 295A of the Corporations Act 2001.
Signed in accordance with a resolution of Directors made pursuant to section 295(5)(a) of the Corporations Act 2001. On behalf of the Directors
David GriffithManaging Director 17 August 2017Sydney
- the attached financial statements and notes give a true and fair view of the Group’s financial position as at 30 June 2017 and of its
performance for the financial year ended on that date; and
At the date of this declaration, the company is within the class of companies affected by ASIC Corporations (Wholly-owned Companies) Instrument 2016/785. The nature of the deed of cross guarantee is such that each company which is party to the deed guarantees to each creditor payment in full of any debt in accordance with the deed of cross guarantee.
In the directors’ opinion, there are reasonable grounds to believe that the company and the companies to which the ASIC Corporations
Instrument applies, as detailed in note 39 to the financial statements, will as a group, be able to meet any obligations or liabilities to which they are, or may become, subject by virtue of the deed of cross guarantee.
IPH LIMITED
ABN 49 169 015 838
DIRECTORS DECLARATION
- the attached financial statements and notes comply with the Corporations Act 2001, the Accounting Standards, the Corporations Regulations 2001 and other mandatory professional reporting requirements;
- the attached financial statements and notes comply with International Financial Reporting Standards as issued by the International Accounting Standards Board as described in note 2 to the financial statements;
69
Liability limited by a scheme approved under Professional Standards Legislation.
Member of Deloitte Touche Tohmatsu Limited
Deloitte Touche Tohmatsu
ABN 74 490 121 060
Grosvenor Place
225 George Street
Sydney NSW 2000
Tel: +61 2 9322 7000
www.deloitte.com.au
Independent Auditor’s Report to the Members of
IPH Limited
Report on the Audit of the Financial Report
Opinion
We have audited the financial report of IPH Limited (the “Company”) and its subsidiaries (the “Group”)
which comprises the consolidated statement of financial position as at 30 June 2017, the consolidated
statement of profit or loss and other comprehensive income, the consolidated statement of changes in
equity and the consolidated statement of cash flows for the year then ended, and notes to the financial
statements, including a summary of significant accounting policies and other explanatory information, and
the directors’ declaration.
In our opinion, the accompanying financial report of the Group is in accordance with the Corporations Act
2001, including:
(i) giving a true and fair view of the Group’s financial position as at 30 June 2017 and of its financial
performance for the year then ended; and
(ii) complying with Australian Accounting Standards and the Corporations Regulations 2001.
Basis for Opinion
We conducted our audit in accordance with Australian Auditing Standards. Our responsibilities under those
standards are further described in the Auditor’s Responsibilities for the Audit of the Financial Report section
of our report. We are independent of the Group in accordance with the auditor independence requirements
of the Corporations Act 2001 and the ethical requirements of the Accounting Professional and Ethical
Standards Board’s APES 110 Code of Ethics for Professional Accountants (the Code) that are relevant to our
audit of the financial report in Australia. We have also fulfilled our other ethical responsibilities in accordance
with the Code.
We confirm that the independence declaration required by the Corporations Act 2001, which has been given
to the directors of the Company, would be in the same terms if given to the directors as at the time of this
auditor’s report.
We believe that the audit evidence we have obtained is sufficient and appropriate to provide a basis for our
opinion.
Key Audit Matters
Key audit matters are those matters that, in our professional judgement, were of most significance in our
audit of the financial report for the current period. These matters were addressed in the context of our audit
of the financial report as a whole, and in forming our opinion thereon, and we do not provide a separate
opinion on these matters.
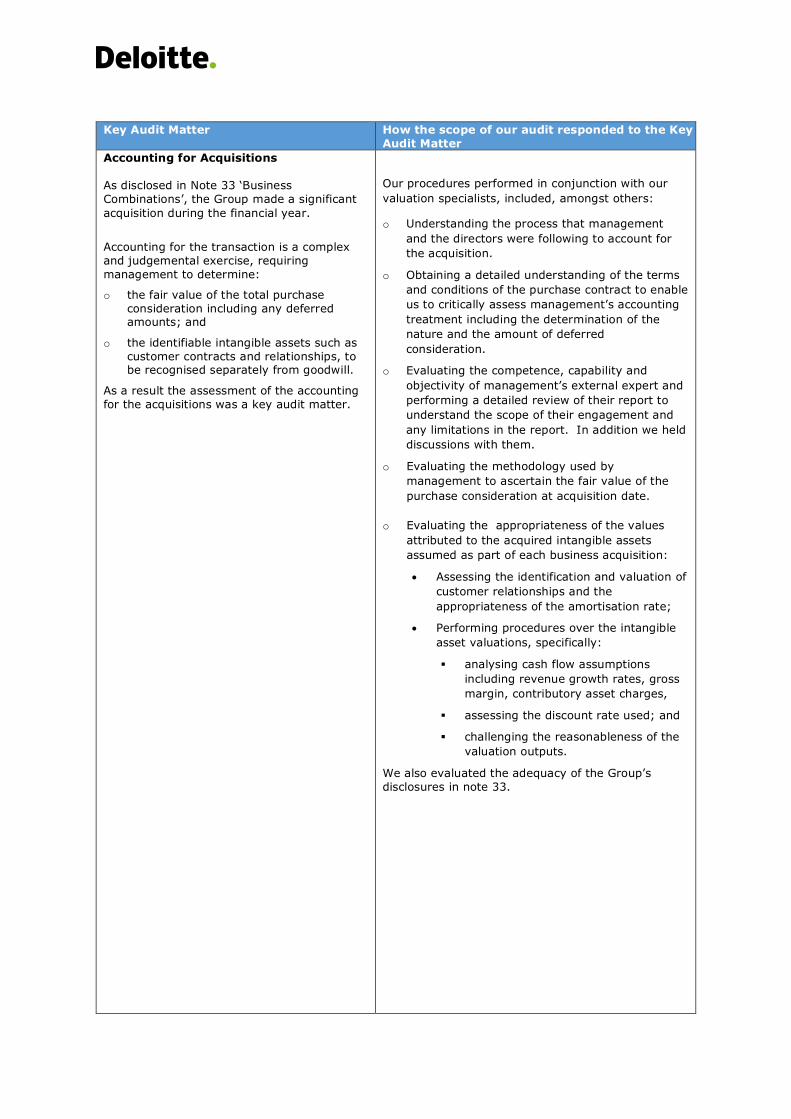
Key Audit Matter How the scope of our audit responded to the Key
Audit Matter
Accounting for Acquisitions
As disclosed in Note 33 ‘Business
Combinations’, the Group made a significant
acquisition during the financial year.
Accounting for the transaction is a complex
and judgemental exercise, requiring
management to determine:
o the fair value of the total purchase
consideration including any deferred amounts; and
o the identifiable intangible assets such as
customer contracts and relationships, to be recognised separately from goodwill.
As a result the assessment of the accounting
for the acquisitions was a key audit matter.
Our procedures performed in conjunction with our
valuation specialists, included, amongst others:
o Understanding the process that management
and the directors were following to account for
the acquisition.
o Obtaining a detailed understanding of the terms
and conditions of the purchase contract to enable
us to critically assess management’s accounting
treatment including the determination of the
nature and the amount of deferred
consideration.
o Evaluating the competence, capability and
objectivity of management’s external expert and
performing a detailed review of their report to
understand the scope of their engagement and
any limitations in the report. In addition we held
discussions with them.
o Evaluating the methodology used by
management to ascertain the fair value of the
purchase consideration at acquisition date.
o Evaluating the appropriateness of the values
attributed to the acquired intangible assets
assumed as part of each business acquisition:
Assessing the identification and valuation of
customer relationships and the
appropriateness of the amortisation rate;
Performing procedures over the intangible
asset valuations, specifically:
analysing cash flow assumptions
including revenue growth rates, gross
margin, contributory asset charges,
assessing the discount rate used; and
challenging the reasonableness of the
valuation outputs.
We also evaluated the adequacy of the Group’s
disclosures in note 33.
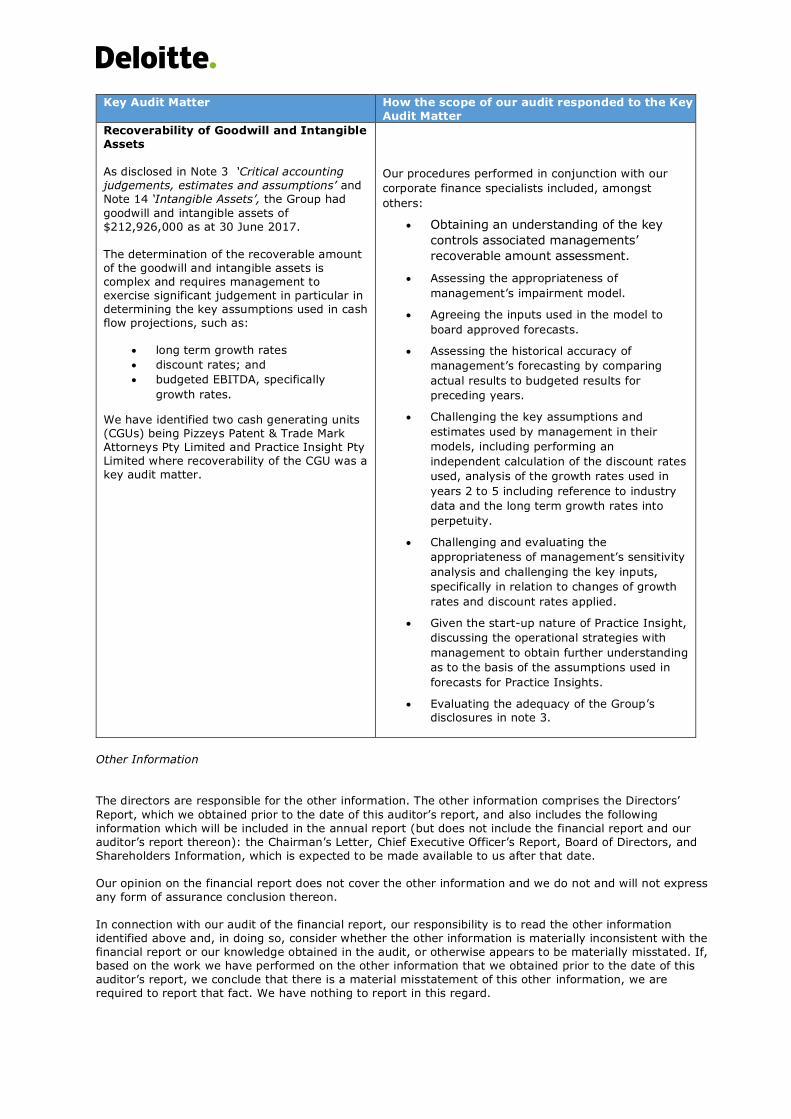
Key Audit Matter How the scope of our audit responded to the Key
Audit Matter
Recoverability of Goodwill and Intangible
Assets
As disclosed in Note 3 ‘Critical accounting
judgements, estimates and assumptions’ and
Note 14 ‘Intangible Assets’, the Group had
goodwill and intangible assets of
$212,926,000 as at 30 June 2017.
The determination of the recoverable amount
of the goodwill and intangible assets is
complex and requires management to
exercise significant judgement in particular in
determining the key assumptions used in cash
flow projections, such as:
long term growth rates
discount rates; and
budgeted EBITDA, specifically
growth rates.
We have identified two cash generating units
(CGUs) being Pizzeys Patent & Trade Mark
Attorneys Pty Limited and Practice Insight Pty
Limited where recoverability of the CGU was a
key audit matter.
Our procedures performed in conjunction with our
corporate finance specialists included, amongst
others:
Obtaining an understanding of the key
controls associated managements’
recoverable amount assessment.
Assessing the appropriateness of
management’s impairment model.
Agreeing the inputs used in the model to
board approved forecasts.
Assessing the historical accuracy of
management’s forecasting by comparing
actual results to budgeted results for
preceding years.
Challenging the key assumptions and
estimates used by management in their
models, including performing an
independent calculation of the discount rates
used, analysis of the growth rates used in
years 2 to 5 including reference to industry
data and the long term growth rates into
perpetuity.
Challenging and evaluating the
appropriateness of management’s sensitivity
analysis and challenging the key inputs,
specifically in relation to changes of growth
rates and discount rates applied.
Given the start-up nature of Practice Insight,
discussing the operational strategies with
management to obtain further understanding
as to the basis of the assumptions used in
forecasts for Practice Insights.
Evaluating the adequacy of the Group’s
disclosures in note 3.
Other Information
The directors are responsible for the other information. The other information comprises the Directors’
Report, which we obtained prior to the date of this auditor’s report, and also includes the following
information which will be included in the annual report (but does not include the financial report and our
auditor’s report thereon): the Chairman’s Letter, Chief Executive Officer’s Report, Board of Directors, and
Shareholders Information, which is expected to be made available to us after that date.
Our opinion on the financial report does not cover the other information and we do not and will not express
any form of assurance conclusion thereon.
In connection with our audit of the financial report, our responsibility is to read the other information
identified above and, in doing so, consider whether the other information is materially inconsistent with the
financial report or our knowledge obtained in the audit, or otherwise appears to be materially misstated. If,
based on the work we have performed on the other information that we obtained prior to the date of this
auditor’s report, we conclude that there is a material misstatement of this other information, we are
required to report that fact. We have nothing to report in this regard.
When we read the Chairman’s Letter, Chief Executive Officer’s Report, Board of Directors, Corporate
Governance Report, and Shareholders Information, if we conclude that there is a material misstatement
therein, we are required to communicate the matter to the directors and use our professional judgement to
determine the appropriate action.
Responsibilities of the Directors for the Financial Report
The directors of the Company are responsible for the preparation of the financial report that gives a true and
fair view in accordance with Australian Accounting Standards and the Corporations Act 2001 and for such
internal control as the directors determine is necessary to enable the preparation of the financial report that
gives a true and fair view and is free from material misstatement, whether due to fraud or error.
In preparing the financial report, the directors are responsible for assessing the ability of the Group to
continue as a going concern, disclosing, as applicable, matters related to going concern and using the going
concern basis of accounting unless the directors either intend to liquidate the Group or to cease operations,
or has no realistic alternative but to do so.
Auditor’s Responsibilities for the Audit of the Financial Report
Our objectives are to obtain reasonable assurance about whether the financial report as a whole is free from
material misstatement, whether due to fraud or error, and to issue an auditor’s report that includes our
opinion. Reasonable assurance is a high level of assurance, but is not a guarantee that an audit conducted in
accordance with the Australian Auditing Standards will always detect a material misstatement when it exists.
Misstatements can arise from fraud or error and are considered material if, individually or in the aggregate,
they could reasonably be expected to influence the economic decisions of users taken on the basis of this
financial report.
As part of an audit in accordance with the Australian Auditing Standards, we exercise professional
judgement and maintain professional scepticism throughout the audit. We also:
Identify and assess the risks of material misstatement of the financial report, whether due to fraud
or error, design and perform audit procedures responsive to those risks, and obtain audit evidence
that is sufficient and appropriate to provide a basis for our opinion. The risk of not detecting a
material misstatement resulting from fraud is higher than for one resulting from error, as fraud may
involve collusion, forgery, intentional omissions, misrepresentations, or the override of internal
control.
Obtain an understanding of internal control relevant to the audit in order to design audit procedures
that are appropriate in the circumstances, but not for the purpose of expressing an opinion on the
effectiveness of the Group’s internal control.
Evaluate the appropriateness of accounting policies used and the reasonableness of accounting
estimates and related disclosures made by the directors.
Conclude on the appropriateness of the directors’ use of the going concern basis of accounting and,
based on the audit evidence obtained, whether a material uncertainty exists related to events or
conditions that may cast significant doubt on the Group’s ability to continue as a going concern. If
we conclude that a material uncertainty exists, we are required to draw attention in our auditor’s
report to the related disclosures in the financial report or, if such disclosures are inadequate, to
modify our opinion. Our conclusions are based on the audit evidence obtained up to the date of our
auditor’s report. However, future events or conditions may cause the Group to cease to continue as
a going concern.
Evaluate the overall presentation, structure and content of the financial report, including the
disclosures, and whether the financial report represents the underlying transactions and events in a
manner that achieves fair presentation.
Obtain sufficient appropriate audit evidence regarding the financial information of the entities or
business activities within the Group to express an opinion on the financial report. We are
responsible for the direction, supervision and performance of the Group’s audit. We remain solely
responsible for our audit opinion.
We communicate with the directors regarding, among other matters, the planned scope and timing of the
audit and significant audit findings, including any significant deficiencies in internal control that we identify
during our audit.
We also provide the directors with a statement that we have complied with relevant ethical requirements
regarding independence, and to communicate with them all relationships and other matters that may
reasonably be thought to bear on our independence, and where applicable, related safeguards.
From the matters communicated with the directors, we determine those matters that were of most
significance in the audit of the financial report of the current period and are therefore the key audit matters.
We describe these matters in our auditor’s report unless law or regulation precludes public disclosure about
the matter or when, in extremely rare circumstances, we determine that a matter should not be
communicated in our report because the adverse consequences of doing so would reasonably be expected to
outweigh the public interest benefits of such communication.
Report on the Remuneration Report
Opinion on the Remuneration Report
We have audited the Remuneration Report included in pages 16 to 22 of the Directors’ Report for the year
ended 30 June 2017.
In our opinion, the Remuneration Report of IPH Limited for the year ended 30 June 2017, complies with
section 300A of the Corporations Act 2001.
Responsibilities
The directors of the Company are responsible for the preparation and presentation of the Remuneration
Report in accordance with section 300A of the Corporations Act 2001. Our responsibility is to express an
opinion on the Remuneration Report, based on our audit conducted in accordance with Australian Auditing
Standards.
DELOITTE TOUCHE TOHMATSU
Tara Hill
Partner
Chartered Accountants
Sydney, 17 August 2017