Embed Size (px)
Citation preview
5.1
Appendix 5. Laboratory Comparison between StablCal and Polymer Turbidity Standards using natural sediment and water (from the Neosho River at Neosho Rapids, Kansas, U.S. Geological Survey [USGS] station number 07182390) at the Kansas Water Science Center Laboratory, Lawrence, Kansas
Comparison Description
Station name: Kansas Water Science laboratory, Lawrence, Kansas.
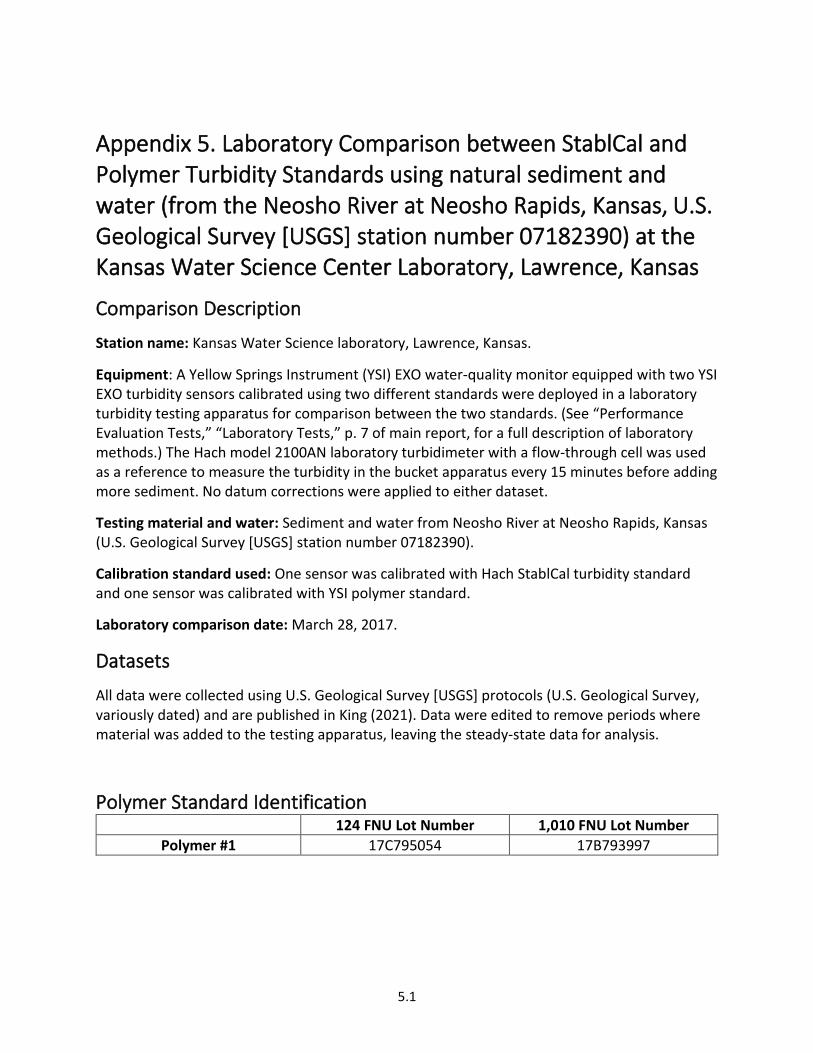
Equipment: A Yellow Springs Instrument (YSI) EXO water-quality monitor equipped with two YSI EXO turbidity sensors calibrated using two different standards were deployed in a laboratory turbidity testing apparatus for comparison between the two standards. (See “Performance Evaluation Tests,” “Laboratory Tests,” p. 7 of main report, for a full description of laboratory methods.) The Hach model 2100AN laboratory turbidimeter with a flow-through cell was used as a reference to measure the turbidity in the bucket apparatus every 15 minutes before adding more sediment. No datum corrections were applied to either dataset.
Testing material and water: Sediment and water from Neosho River at Neosho Rapids, Kansas (U.S. Geological Survey [USGS] station number 07182390).
Calibration standard used: One sensor was calibrated with Hach StablCal turbidity standard and one sensor was calibrated with YSI polymer standard.
Laboratory comparison date: March 28, 2017.
Datasets
All data were collected using U.S. Geological Survey [USGS] protocols (U.S. Geological Survey, variously dated) and are published in King (2021). Data were edited to remove periods where material was added to the testing apparatus, leaving the steady-state data for analysis.
Polymer Standard Identification 124 FNU Lot Number 1,010 FNU Lot Number
Polymer #1 17C795054 17B793997
5.2
Time Series
5.3
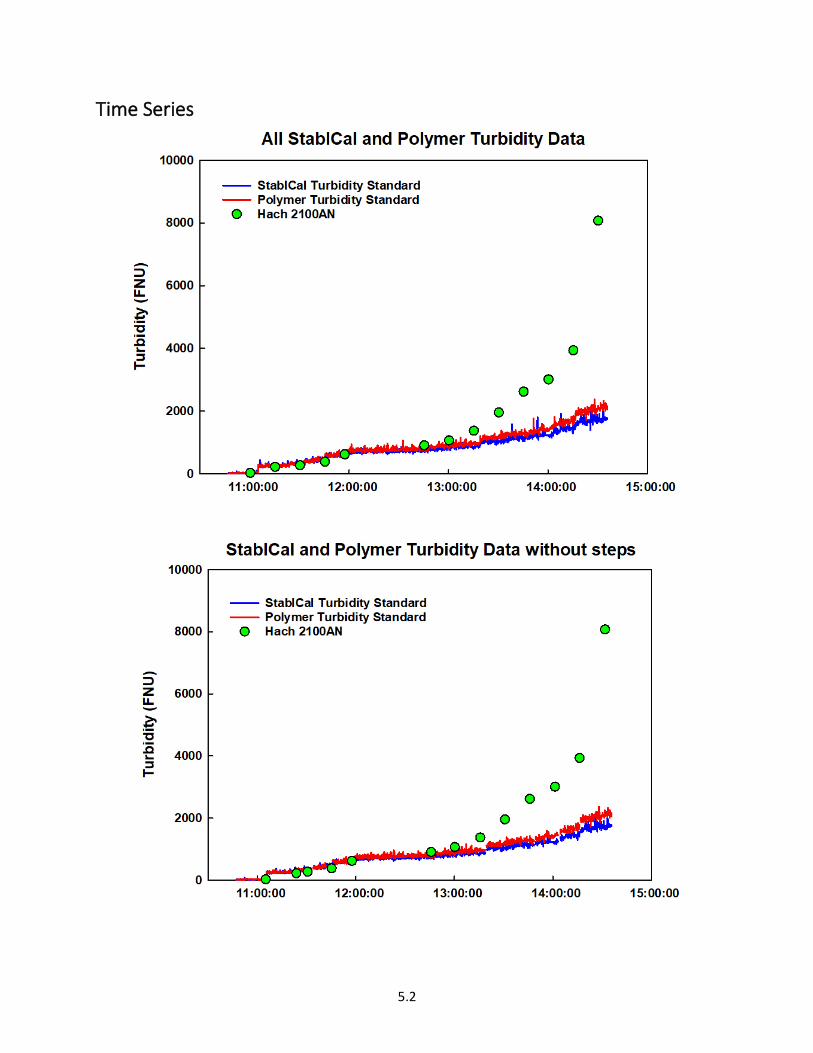
Statistical Analyses – Stablcal and Polymer Turbidity Standard Data Slope comparison
The following is a summary of final regression analysis for sensor-measured turbidity from a YSI EXO turbidity sensor calibrated by using two different calibration standards at the Kansas Water Science Center laboratory, Lawrence, Kansas, on March 28, 2017; the data used in the final regressions were averages of turbidity for each step, each of which had a duration of approximately 15 minutes once the sensor had stabilized:
y = 1.20x – 69.94
where
y = turbidity measured with Polymer-calibrated EXO sensor (FNU)
x = turbidity measured with StablCal-calibrated EXO sensor (FNU).
5.4
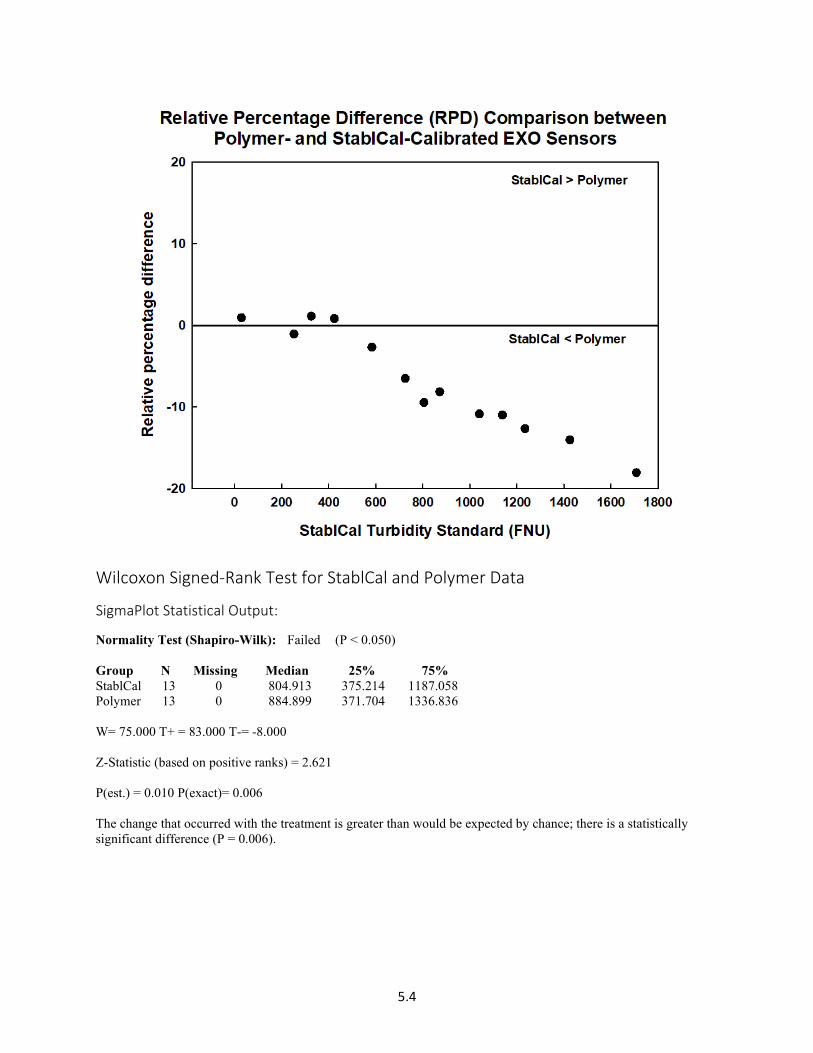
Wilcoxon Signed-Rank Test for StablCal and Polymer Data
SigmaPlot Statistical Output:
Normality Test (Shapiro-Wilk): Failed (P < 0.050) Group N Missing Median 25% 75% StablCal 13 0 804.913 375.214 1187.058 Polymer 13 0 884.899 371.704 1336.836 W= 75.000 T+ = 83.000 T-= -8.000 Z-Statistic (based on positive ranks) = 2.621 P(est.) = 0.010 P(exact)= 0.006 The change that occurred with the treatment is greater than would be expected by chance; there is a statistically significant difference (P = 0.006).
5.5
R Statistical Output:
Wilcoxon Signed-Rank test with continuity correction data: StablCal and Polymer V = 8, p-value = 0.006104 alternative hypothesis: true location shift is not equal to 0 95 percent confidence interval: -167.03427 -24.30251 sample estimates: (pseudo)median -79.98575
Summary of Results There is a strong linear association between measurements made with the two sensors (R = 1.00). Relative percentage difference ranged from 1 to 18 percent (median: 8 percent; mean: 7 percent). The data did not pass the Shapiro-Wilk test for normality (P<0.05); therefore, a Wilcoxon signed-rank test was performed. The difference between median values for the StablCal- and polymer-calibrated EXO sensors was statistically significant (P<0.05).
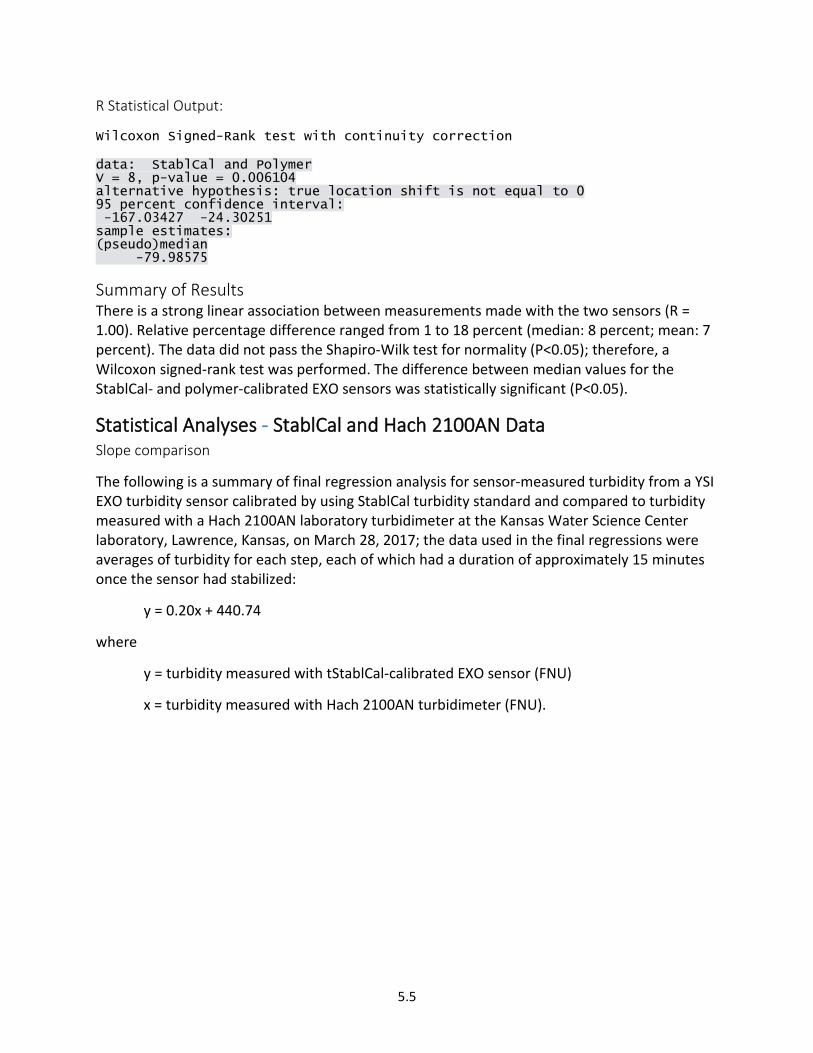
Statistical Analyses - StablCal and Hach 2100AN Data Slope comparison
The following is a summary of final regression analysis for sensor-measured turbidity from a YSI EXO turbidity sensor calibrated by using StablCal turbidity standard and compared to turbidity measured with a Hach 2100AN laboratory turbidimeter at the Kansas Water Science Center laboratory, Lawrence, Kansas, on March 28, 2017; the data used in the final regressions were averages of turbidity for each step, each of which had a duration of approximately 15 minutes once the sensor had stabilized:
y = 0.20x + 440.74
where
y = turbidity measured with tStablCal-calibrated EXO sensor (FNU)
x = turbidity measured with Hach 2100AN turbidimeter (FNU).
5.6
5.7
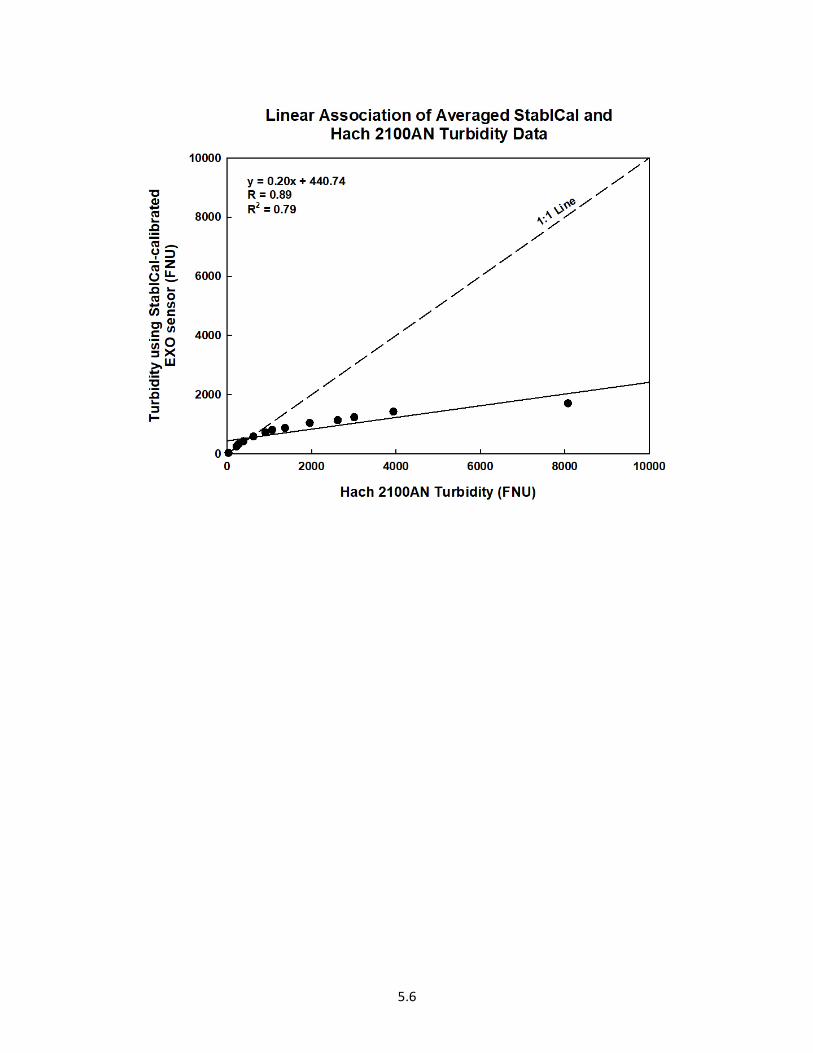
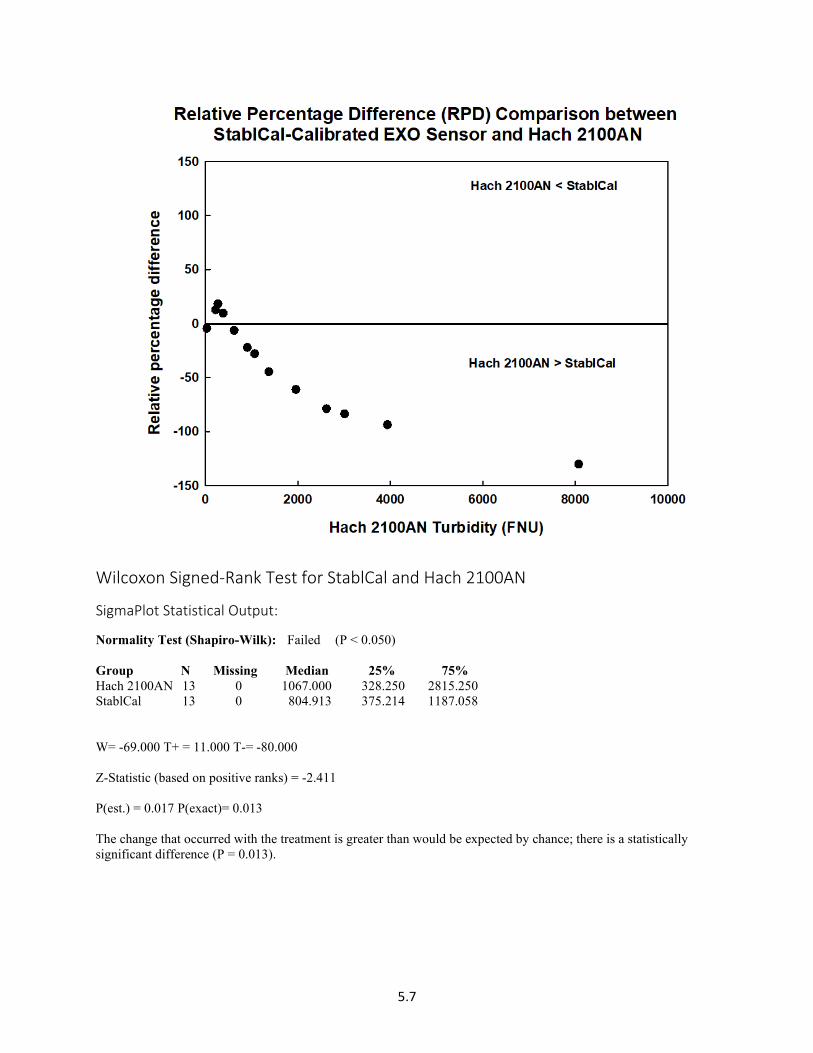
Wilcoxon Signed-Rank Test for StablCal and Hach 2100AN
SigmaPlot Statistical Output:
Normality Test (Shapiro-Wilk): Failed (P < 0.050) Group N Missing Median 25% 75% Hach 2100AN 13 0 1067.000 328.250 2815.250 StablCal 13 0 804.913 375.214 1187.058 W= -69.000 T+ = 11.000 T-= -80.000 Z-Statistic (based on positive ranks) = -2.411 P(est.) = 0.017 P(exact)= 0.013 The change that occurred with the treatment is greater than would be expected by chance; there is a statistically significant difference (P = 0.013).
5.8
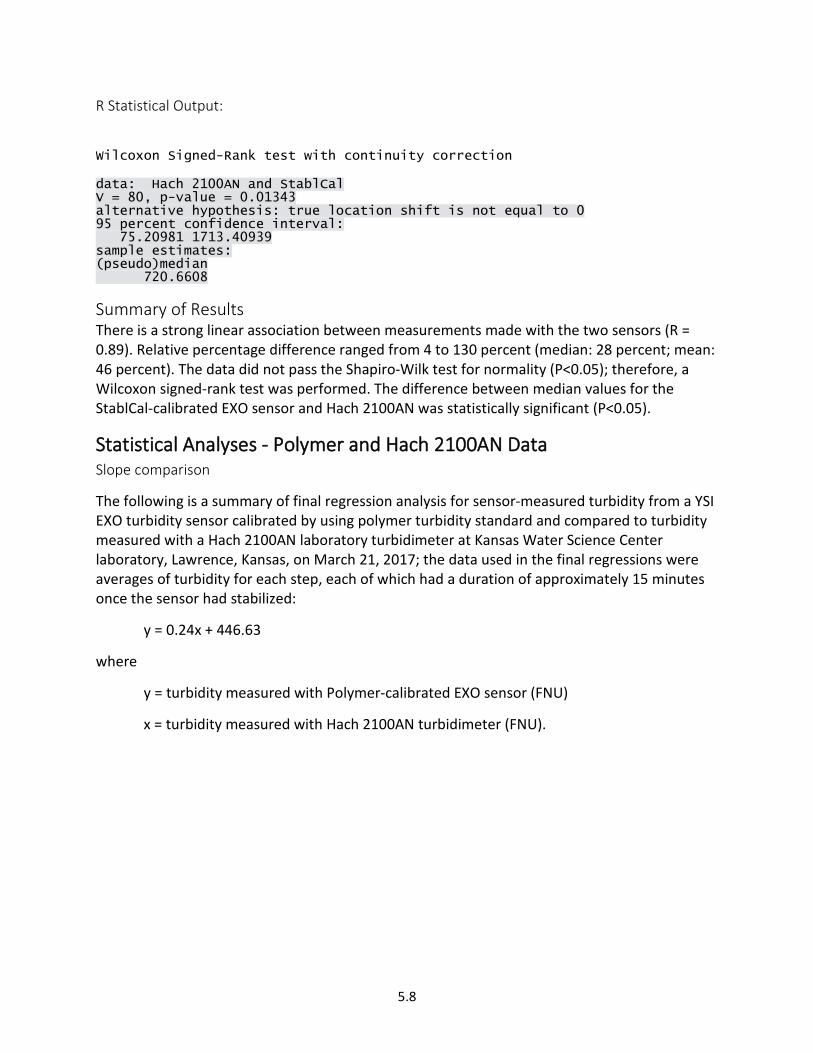
R Statistical Output:
Wilcoxon Signed-Rank test with continuity correction data: Hach 2100AN and StablCal V = 80, p-value = 0.01343 alternative hypothesis: true location shift is not equal to 0 95 percent confidence interval: 75.20981 1713.40939 sample estimates: (pseudo)median 720.6608
Summary of Results There is a strong linear association between measurements made with the two sensors (R = 0.89). Relative percentage difference ranged from 4 to 130 percent (median: 28 percent; mean: 46 percent). The data did not pass the Shapiro-Wilk test for normality (P<0.05); therefore, a Wilcoxon signed-rank test was performed. The difference between median values for the StablCal-calibrated EXO sensor and Hach 2100AN was statistically significant (P<0.05).
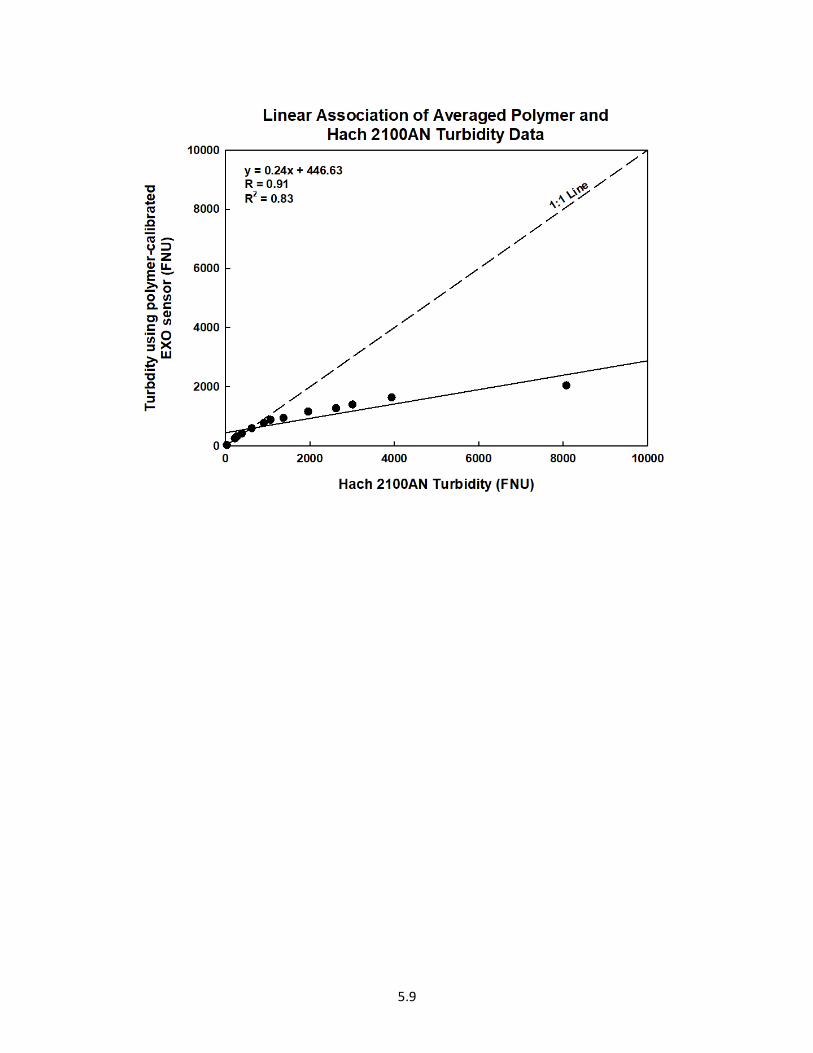
Statistical Analyses - Polymer and Hach 2100AN Data Slope comparison
The following is a summary of final regression analysis for sensor-measured turbidity from a YSI EXO turbidity sensor calibrated by using polymer turbidity standard and compared to turbidity measured with a Hach 2100AN laboratory turbidimeter at Kansas Water Science Center laboratory, Lawrence, Kansas, on March 21, 2017; the data used in the final regressions were averages of turbidity for each step, each of which had a duration of approximately 15 minutes once the sensor had stabilized:
y = 0.24x + 446.63
where
y = turbidity measured with Polymer-calibrated EXO sensor (FNU)
x = turbidity measured with Hach 2100AN turbidimeter (FNU).
5.9
5.10
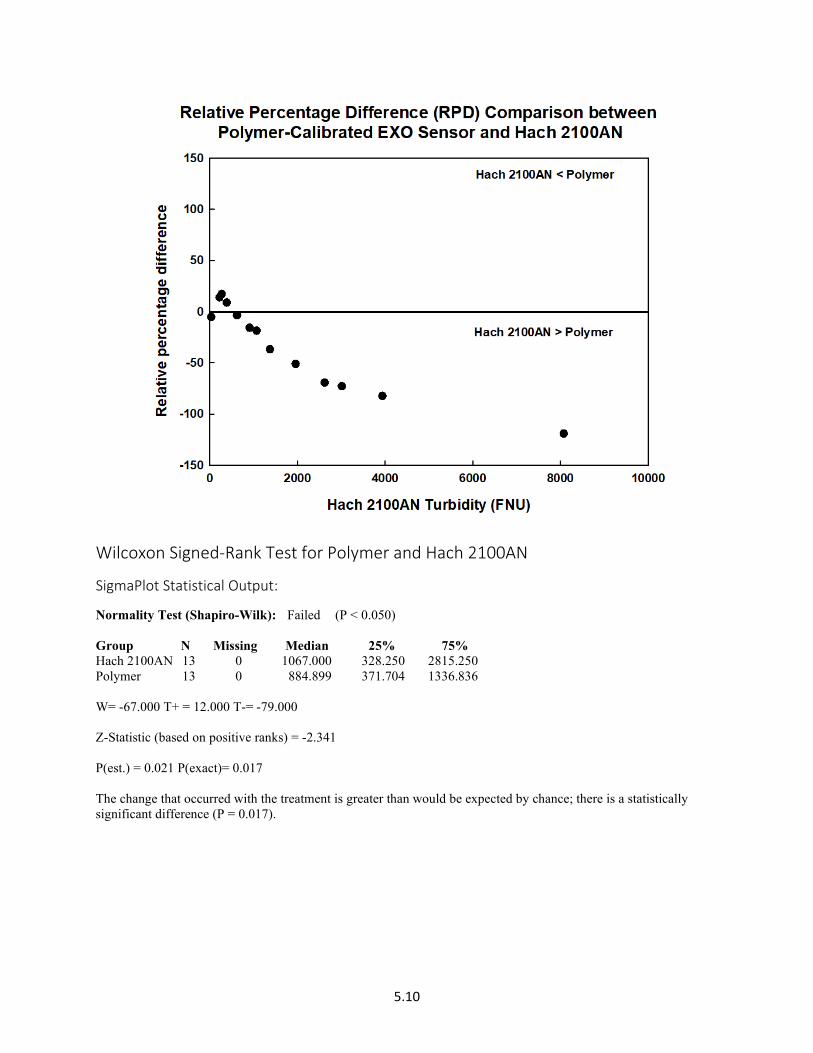
Wilcoxon Signed-Rank Test for Polymer and Hach 2100AN
SigmaPlot Statistical Output:
Normality Test (Shapiro-Wilk): Failed (P < 0.050) Group N Missing Median 25% 75% Hach 2100AN 13 0 1067.000 328.250 2815.250 Polymer 13 0 884.899 371.704 1336.836 W= -67.000 T+ = 12.000 T-= -79.000 Z-Statistic (based on positive ranks) = -2.341 P(est.) = 0.021 P(exact)= 0.017 The change that occurred with the treatment is greater than would be expected by chance; there is a statistically significant difference (P = 0.017).
5.11
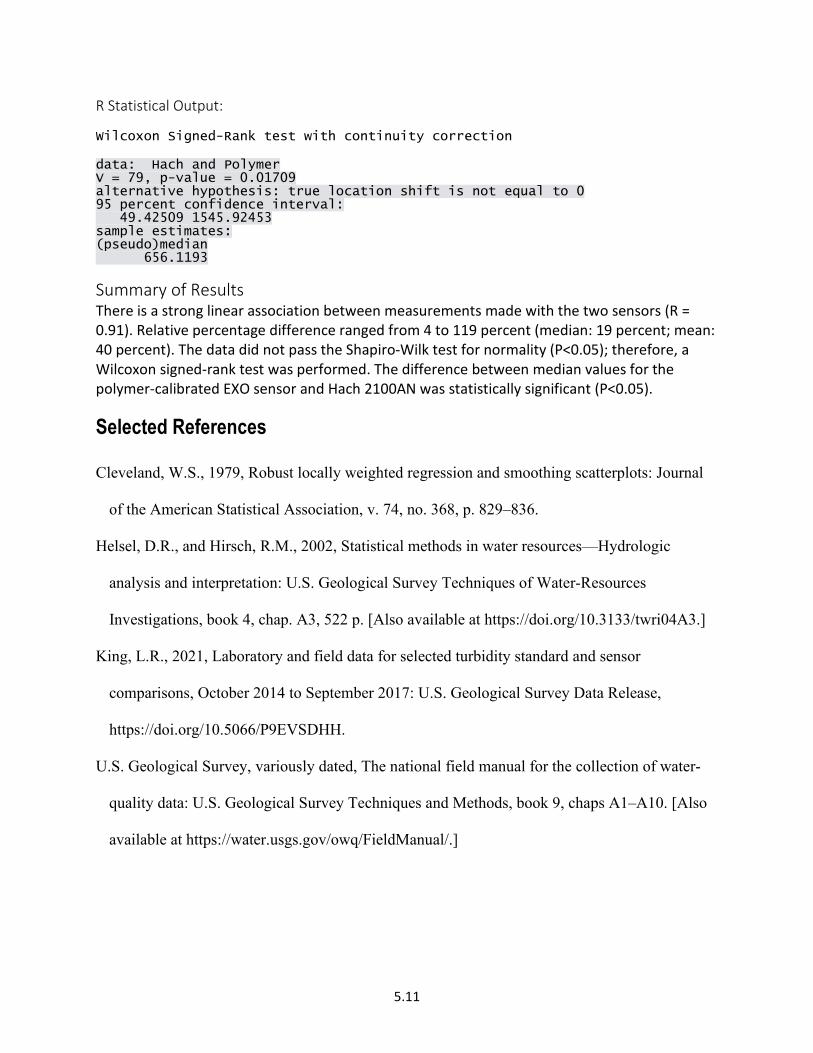
R Statistical Output:
Wilcoxon Signed-Rank test with continuity correction data: Hach and Polymer V = 79, p-value = 0.01709 alternative hypothesis: true location shift is not equal to 0 95 percent confidence interval: 49.42509 1545.92453 sample estimates: (pseudo)median 656.1193
Summary of Results There is a strong linear association between measurements made with the two sensors (R = 0.91). Relative percentage difference ranged from 4 to 119 percent (median: 19 percent; mean: 40 percent). The data did not pass the Shapiro-Wilk test for normality (P<0.05); therefore, a Wilcoxon signed-rank test was performed. The difference between median values for the polymer-calibrated EXO sensor and Hach 2100AN was statistically significant (P<0.05).
Selected References
Cleveland, W.S., 1979, Robust locally weighted regression and smoothing scatterplots: Journal
of the American Statistical Association, v. 74, no. 368, p. 829–836.
Helsel, D.R., and Hirsch, R.M., 2002, Statistical methods in water resources—Hydrologic
analysis and interpretation: U.S. Geological Survey Techniques of Water-Resources
Investigations, book 4, chap. A3, 522 p. [Also available at https://doi.org/10.3133/twri04A3.]
King, L.R., 2021, Laboratory and field data for selected turbidity standard and sensor
comparisons, October 2014 to September 2017: U.S. Geological Survey Data Release,
https://doi.org/10.5066/P9EVSDHH.
U.S. Geological Survey, variously dated, The national field manual for the collection of water-
quality data: U.S. Geological Survey Techniques and Methods, book 9, chaps A1–A10. [Also
available at https://water.usgs.gov/owq/FieldManual/.]