Embed Size (px)
Citation preview
Appendix 6:
Physical Oceanography
(Envirosphere 2009b)


Oceanographic Survey, Oceanographic Measurements— Salinity, Temperature & Turbidity, Minas Passage Study Site August 2008–March 2009 Submitted to: Minas Basin Pulp and Power Co. Ltd. May 29, 2009 Submiotted by Envirosphere Consultants Limited Windsor, Nova Scotia
Oceanographic Measurements—Salinity, Temperature & Turbidity, i Minas Passage Study Site, August 2008-March 2009 _____________________________________________________________________________________________
____________________________________________________________________________________________________________________
EXECUTIVE SUMMARY Oceanographic measurements in the Minas Passage, Black Rock area, which included possible sites for tidal device installations and cable routing, were made in August and September 2008 and February and March 2009, as part of a survey which included a seabed video and photographic survey; water column temperature, salinity and turbidity profiling; water column sampling for suspended solids; background noise measurements; and retrieval and deployment of current meter moorings. CTD (salinity-temperature-depth and turbidity) measurements were obtained, and water samples for analysis of suspended sediment levels and composition (surface, mid-water and near bottom) were obtained at stations in Minas Passage in the vicinity of Black rock. On all occasions except August 2008, CTD measurements were made on flood and ebb tides, to attempt to measure the amount of resuspension caused by tidal currents. The water column was well-mixed vertically on all occasions, showing negligible difference between surface and bottom.
Oceanographic Measurements—Salinity, Temperature & Turbidity, 1 Minas Passage Study Site, August 2008-March 2009 _____________________________________________________________________________________________
____________________________________________________________________________________________________________________
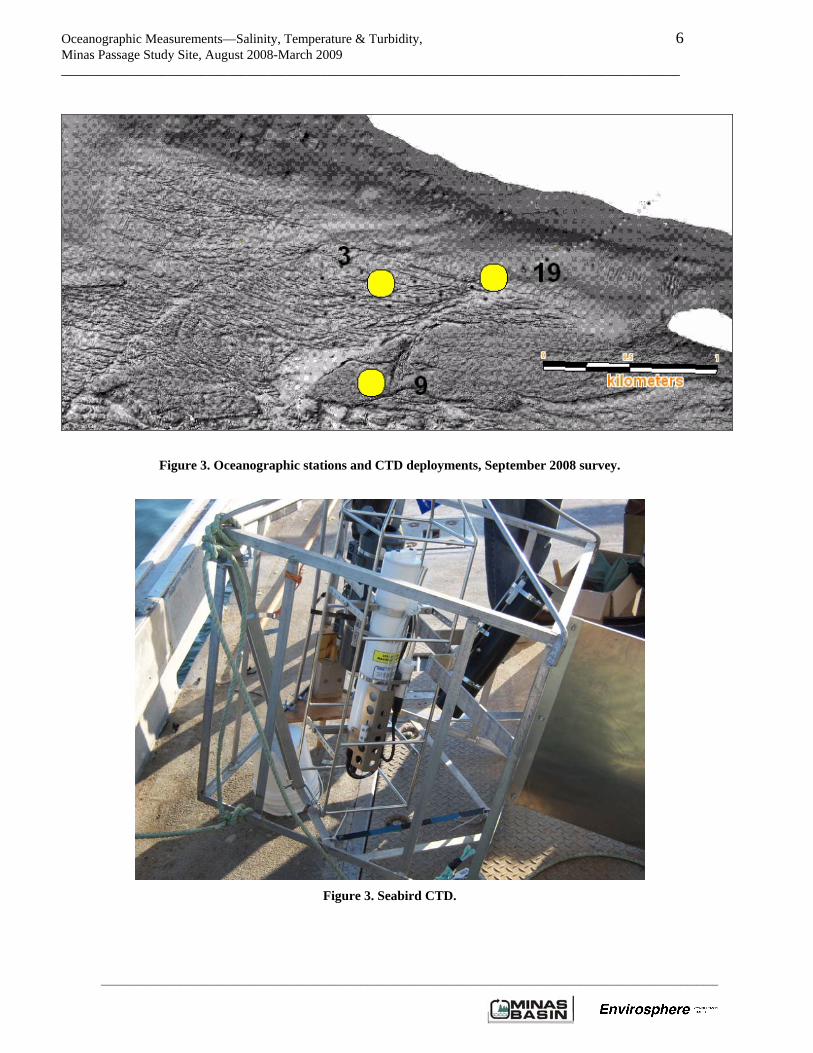
INTRODUCTION Nova Scotia’s Bay of Fundy has some of the highest tides in the world and some of the greatest potential for generation of electricity from the tides. In part to further its commitment to a sustainable future for Nova Scotians, the Province of Nova Scotia has undertaken to establish a Tidal Power demonstration research and test facility, and selected Minas Basin Pulp and Power Limited of Hantsport, Nova Scotia, to develop the necessary infrastructure and coordinate use of the site by interested companies and organizations which produce tidal energy use devices (tidal device providers) and which will partner in the project. The project to develop the test facility was inaugurated in January 2008 and includes engineering and environmental components, the latter to provide information on the physical conditions such as currents, relating to the supply of tidal energy as well as for adequate device design; seabed geology and geotechnical information for device installation; and background information on the oceanography, biology, fisheries, and socioeconomic environment, relating to the governmental and public environmental assessment/ regulatory processes under which the project must operate. To acquire information on suspended sediments and turbidity, principally for turbine design and operational considerations, a limited program of water sampling and physical oceanographic measurements was undertaken in 2008, and reported here. METHODS Survey Vessel: The survey was carried out on all dates except March 2009 from the MV Tide Force, a 50-foot wide-bodied lobster boat operated by Mark Taylor, Centreville, N.S., out of Hall’s Harbour. A 39’ lobster boat Eric Junior, also out of Halls Harbour and captained by Robert Vaughan, was used for the March 10 survey. Scientific crew included Patrick Stewart, M.Sc. (Envirosphere Consultants), Ulrich Lobsiger (Ulrich Lobsiger Consulting, Halifax) and Colin Anderson and Robert Budgell (Oceans Ltd). Water Column Measurements—Depth profiles of salinity, temperature, turbidity, and depth were obtained by a Seabird SBE 19plus V2 SEACAT CTD profiler, which was deployed mounted within protective aluminum cage used for the video camera system (August-September) or independently (February-March), after the camera was removed (Figure 3). CTD ‘casts’ were undertaken at three stations selected from the August survey: Station 3 (45˚ 22.074’ N; 64˚ 26.176’ W); Station 9 (45˚ 21.765’ N; 64˚ 26.211’ W); Station 19 (45˚ 22.098’ N; 64˚ 25.679’ W) during the incoming and outgoing tide. On separate flood and ebb tides, a 5-L Niskin water sampler was deployed and samples taken at 1 m below surface, mid-depth, and 2-5 m from bottom, to obtain information on suspended sediment levels and composition. The entire contents of the Niskin were emptied into a large, new plastic bag, which was sealed and placed in a 10 L plastic bucket; this procedure ensured that even the largest particles in the sample would be adequately subsampled. In February 2009, only a single station in the center of the array used in September 2008 was occupied (Station 1) (45 22.189 N, 64 26.699 W) on a falling tide; however Stations 2-4 were sampled along the axis of Minas Channel (Station 2, 45 21.7089N, 64 29.4891W off Cape Split; Station 3 (45 22.6921N, 64 34.0720W; and Station 4, near Halls Harbour (45 18.0180N, 64 37.1960). In February 2009, only a single station in the center of the array used in September 2008 was occupied (Station 1) (45 22.189 N, 64 26.699 W) on a falling tide. At all stations the CTD instrument was lowered into the water at about 0.5 m depth and allowed to stabilize for about 1 minute before lowering to the greatest depth available, and then returning it to the surface.
Oceanographic Measurements—Salinity, Temperature & Turbidity, 2 Minas Passage Study Site, August 2008-March 2009 _____________________________________________________________________________________________
____________________________________________________________________________________________________________________
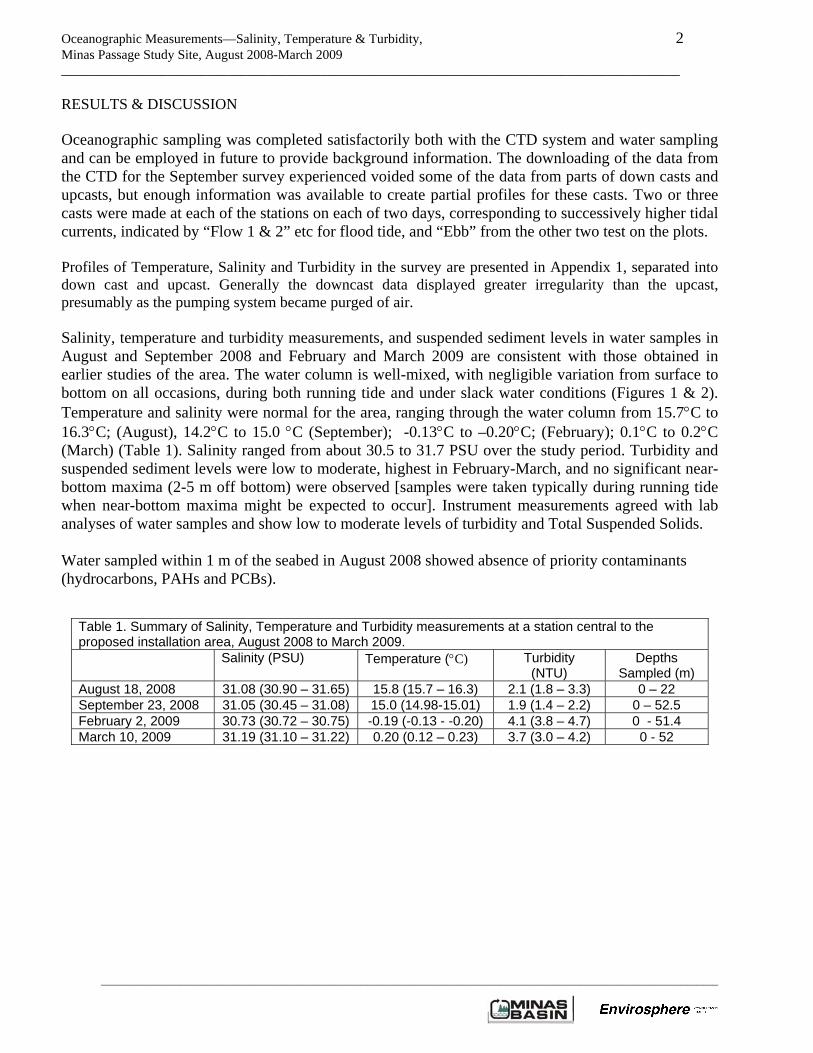
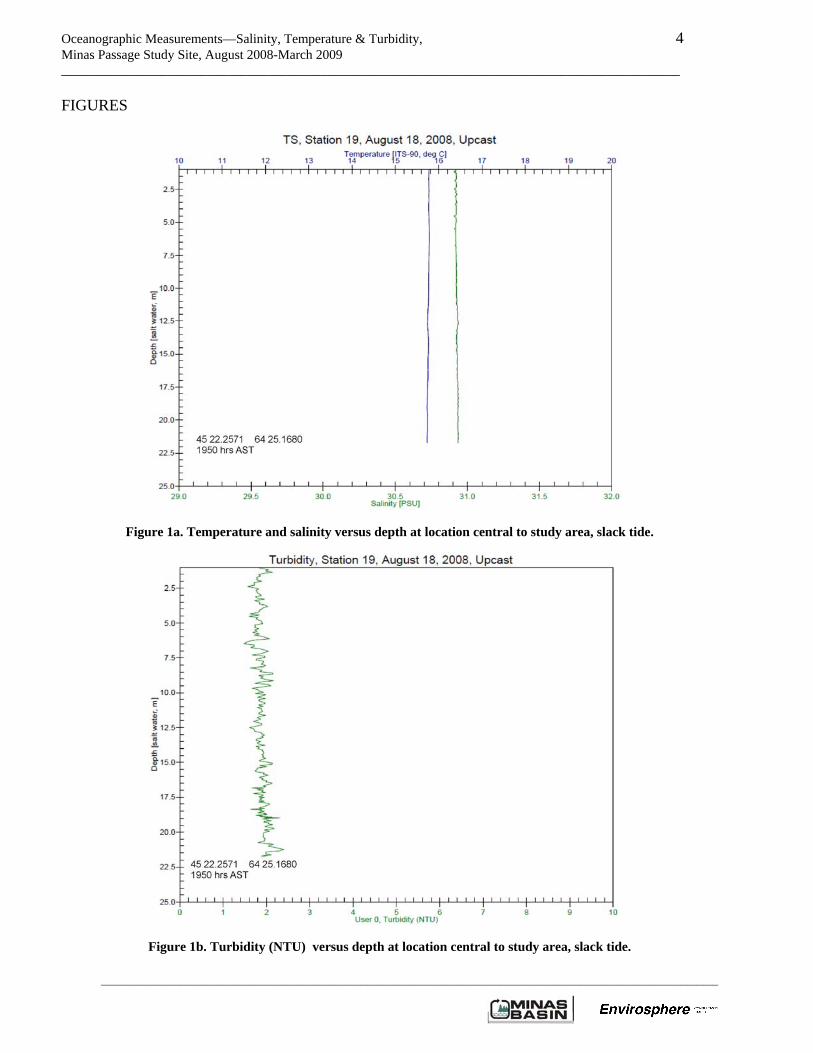
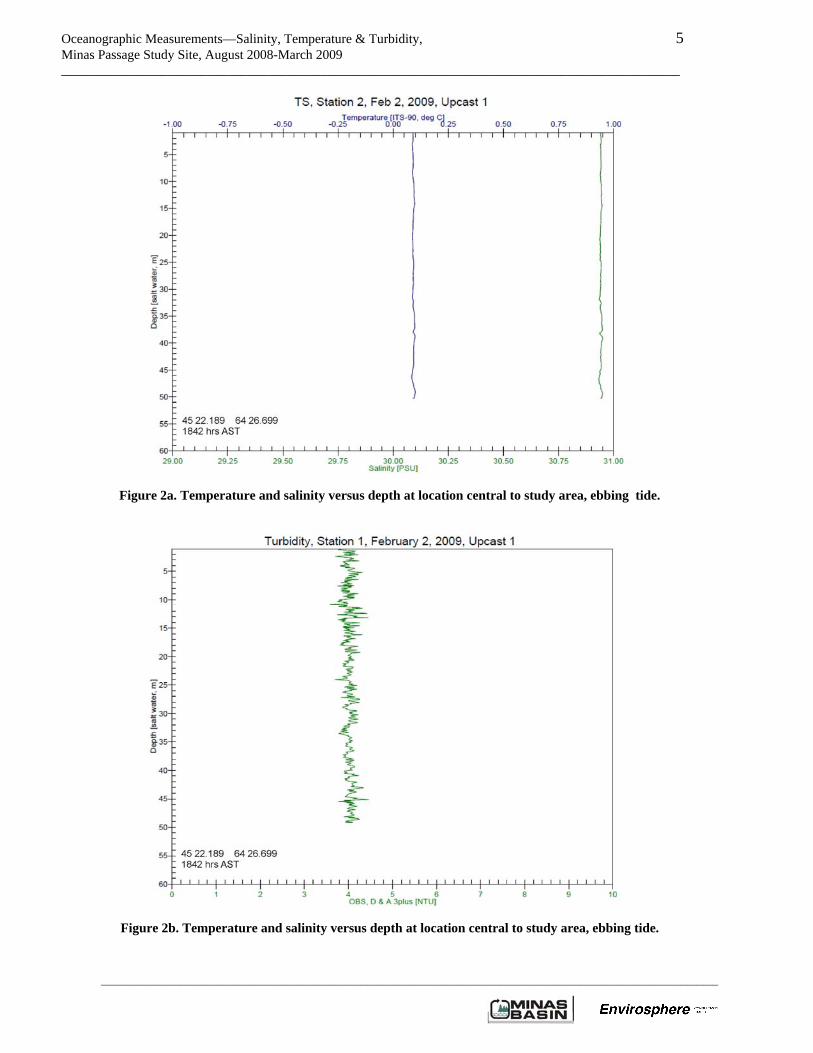
RESULTS & DISCUSSION Oceanographic sampling was completed satisfactorily both with the CTD system and water sampling and can be employed in future to provide background information. The downloading of the data from the CTD for the September survey experienced voided some of the data from parts of down casts and upcasts, but enough information was available to create partial profiles for these casts. Two or three casts were made at each of the stations on each of two days, corresponding to successively higher tidal currents, indicated by “Flow 1 & 2” etc for flood tide, and “Ebb” from the other two test on the plots. Profiles of Temperature, Salinity and Turbidity in the survey are presented in Appendix 1, separated into down cast and upcast. Generally the downcast data displayed greater irregularity than the upcast, presumably as the pumping system became purged of air. Salinity, temperature and turbidity measurements, and suspended sediment levels in water samples in August and September 2008 and February and March 2009 are consistent with those obtained in earlier studies of the area. The water column is well-mixed, with negligible variation from surface to bottom on all occasions, during both running tide and under slack water conditions (Figures 1 & 2). Temperature and salinity were normal for the area, ranging through the water column from 15.7°C to 16.3°C; (August), 14.2°C to 15.0 °C (September); -0.13°C to –0.20°C; (February); 0.1°C to 0.2°C (March) (Table 1). Salinity ranged from about 30.5 to 31.7 PSU over the study period. Turbidity and suspended sediment levels were low to moderate, highest in February-March, and no significant near-bottom maxima (2-5 m off bottom) were observed [samples were taken typically during running tide when near-bottom maxima might be expected to occur]. Instrument measurements agreed with lab analyses of water samples and show low to moderate levels of turbidity and Total Suspended Solids. Water sampled within 1 m of the seabed in August 2008 showed absence of priority contaminants (hydrocarbons, PAHs and PCBs).
Table 1. Summary of Salinity, Temperature and Turbidity measurements at a station central to the proposed installation area, August 2008 to March 2009. Salinity (PSU) Temperature (°C) Turbidity
(NTU) Depths
Sampled (m) August 18, 2008 31.08 (30.90 – 31.65) 15.8 (15.7 – 16.3) 2.1 (1.8 – 3.3) 0 – 22 September 23, 2008 31.05 (30.45 – 31.08) 15.0 (14.98-15.01) 1.9 (1.4 – 2.2) 0 – 52.5 February 2, 2009 30.73 (30.72 – 30.75) -0.19 (-0.13 - -0.20) 4.1 (3.8 – 4.7) 0 - 51.4 March 10, 2009 31.19 (31.10 – 31.22) 0.20 (0.12 – 0.23) 3.7 (3.0 – 4.2) 0 - 52
Oceanographic Measurements—Salinity, Temperature & Turbidity, 3 Minas Passage Study Site, August 2008-March 2009 _____________________________________________________________________________________________
____________________________________________________________________________________________________________________
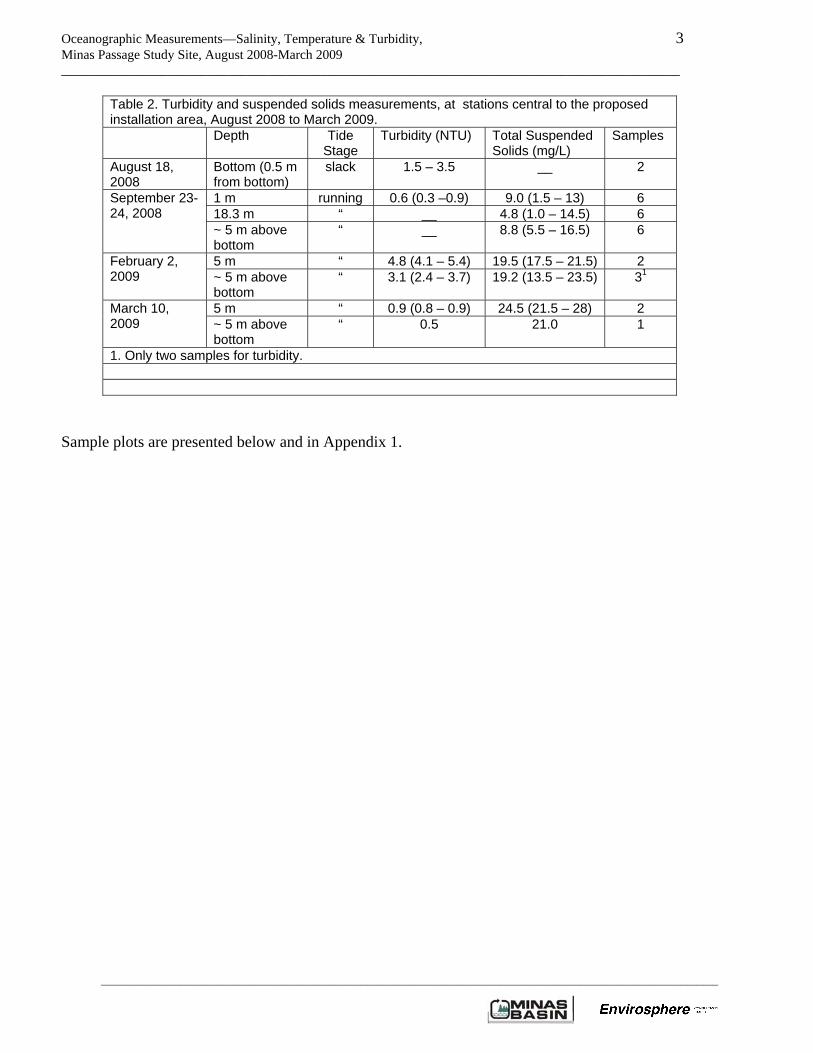
Table 2. Turbidity and suspended solids measurements, at stations central to the proposed installation area, August 2008 to March 2009. Depth Tide
Stage Turbidity (NTU) Total Suspended
Solids (mg/L) Samples
August 18, 2008
Bottom (0.5 m from bottom)
slack 1.5 – 3.5 __ 2
1 m running 0.6 (0.3 –0.9) 9.0 (1.5 – 13) 6 18.3 m “ __ 4.8 (1.0 – 14.5) 6
September 23-24, 2008
~ 5 m above bottom
“ __ 8.8 (5.5 – 16.5) 6
5 m “ 4.8 (4.1 – 5.4) 19.5 (17.5 – 21.5) 2 February 2, 2009 ~ 5 m above
bottom “ 3.1 (2.4 – 3.7) 19.2 (13.5 – 23.5) 31
5 m “ 0.9 (0.8 – 0.9) 24.5 (21.5 – 28) 2 March 10, 2009 ~ 5 m above
bottom “ 0.5 21.0 1
1. Only two samples for turbidity.
Sample plots are presented below and in Appendix 1.
Oceanographic Measurements—Salinity, Temperature & Turbidity, 4 Minas Passage Study Site, August 2008-March 2009 _____________________________________________________________________________________________
____________________________________________________________________________________________________________________
FIGURES
Figure 1a. Temperature and salinity versus depth at location central to study area, slack tide.
Figure 1b. Turbidity (NTU) versus depth at location central to study area, slack tide.
Oceanographic Measurements—Salinity, Temperature & Turbidity, 5 Minas Passage Study Site, August 2008-March 2009 _____________________________________________________________________________________________
____________________________________________________________________________________________________________________
Figure 2a. Temperature and salinity versus depth at location central to study area, ebbing tide.
Figure 2b. Temperature and salinity versus depth at location central to study area, ebbing tide.
Oceanographic Measurements—Salinity, Temperature & Turbidity, 6 Minas Passage Study Site, August 2008-March 2009 _____________________________________________________________________________________________
____________________________________________________________________________________________________________________
Figure 3. Oceanographic stations and CTD deployments, September 2008 survey.
Figure 3. Seabird CTD.

Oceanographic Measurements—Salinity, Temperature & Turbidity, 7 Minas Passage Study Site, August 2008-March 2009 _____________________________________________________________________________________________
____________________________________________________________________________________________________________________
APPENDIX Temperature, Salinity and Turbidity Plots for Oceanographic Survey

Oceanographic Measurements—Salinity, Temperature & Turbidity, 8 Minas Passage Study Site, August 2008-March 2009 _____________________________________________________________________________________________
____________________________________________________________________________________________________________________
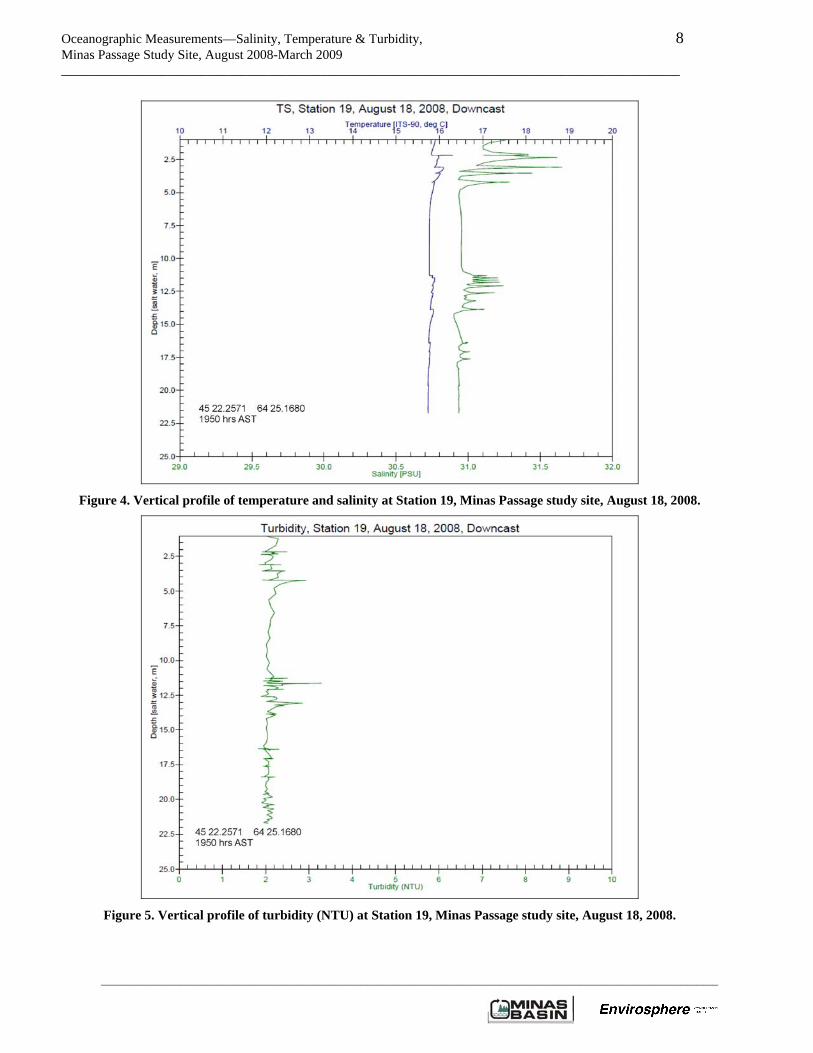
Figure 4. Vertical profile of temperature and salinity at Station 19, Minas Passage study site, August 18, 2008.
Figure 5. Vertical profile of turbidity (NTU) at Station 19, Minas Passage study site, August 18, 2008.
Oceanographic Measurements—Salinity, Temperature & Turbidity, 9 Minas Passage Study Site, August 2008-March 2009 _____________________________________________________________________________________________
____________________________________________________________________________________________________________________
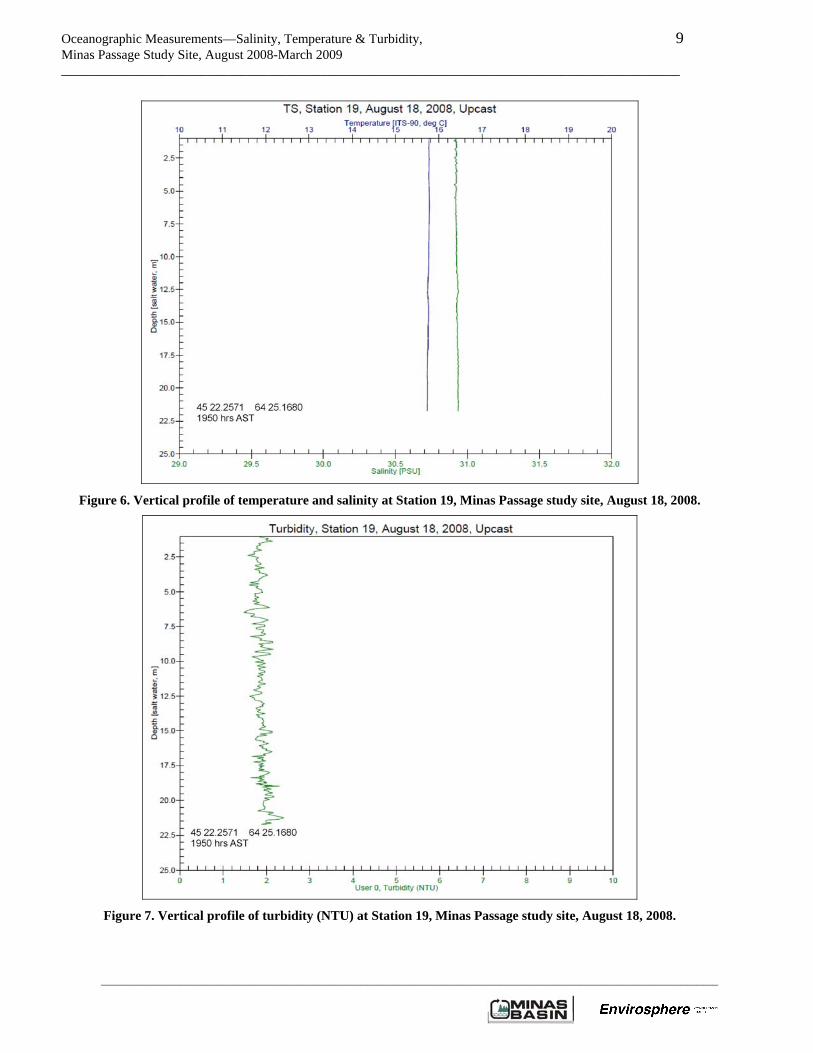
Figure 6. Vertical profile of temperature and salinity at Station 19, Minas Passage study site, August 18, 2008.
Figure 7. Vertical profile of turbidity (NTU) at Station 19, Minas Passage study site, August 18, 2008.
Oceanographic Measurements—Salinity, Temperature & Turbidity, 10 Minas Passage Study Site, August 2008-March 2009 _____________________________________________________________________________________________
____________________________________________________________________________________________________________________
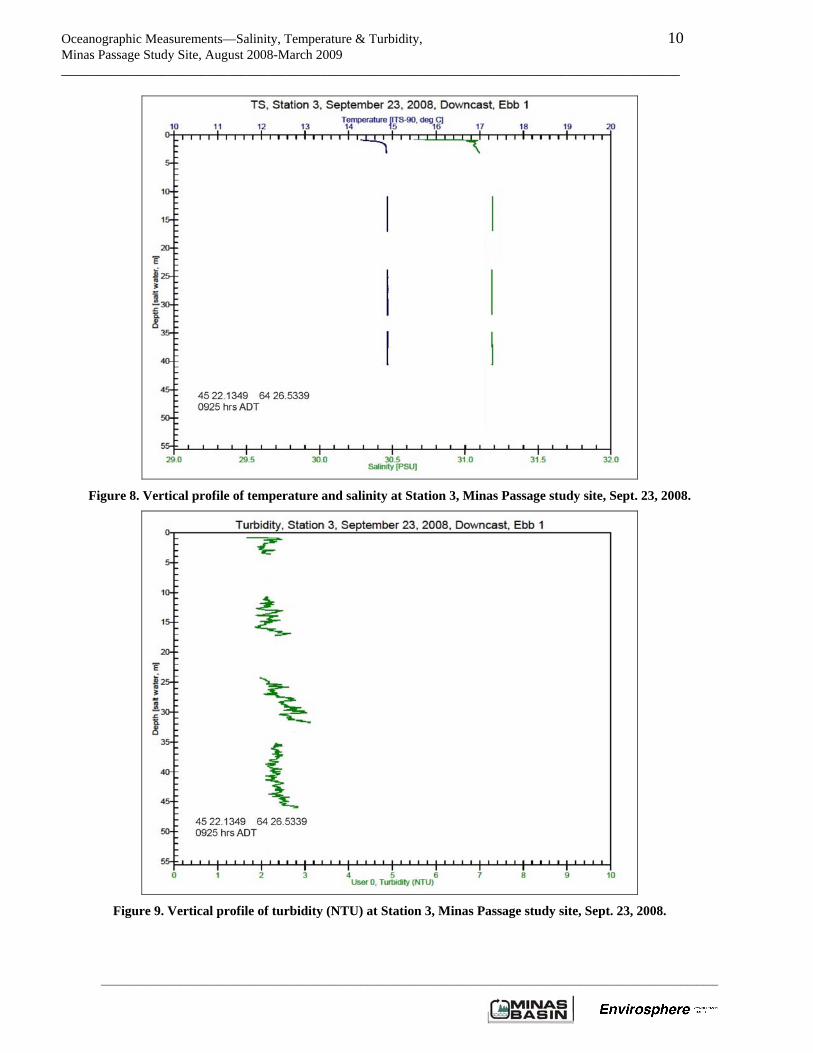
Figure 8. Vertical profile of temperature and salinity at Station 3, Minas Passage study site, Sept. 23, 2008.
Figure 9. Vertical profile of turbidity (NTU) at Station 3, Minas Passage study site, Sept. 23, 2008.
Oceanographic Measurements—Salinity, Temperature & Turbidity, 11 Minas Passage Study Site, August 2008-March 2009 _____________________________________________________________________________________________
____________________________________________________________________________________________________________________
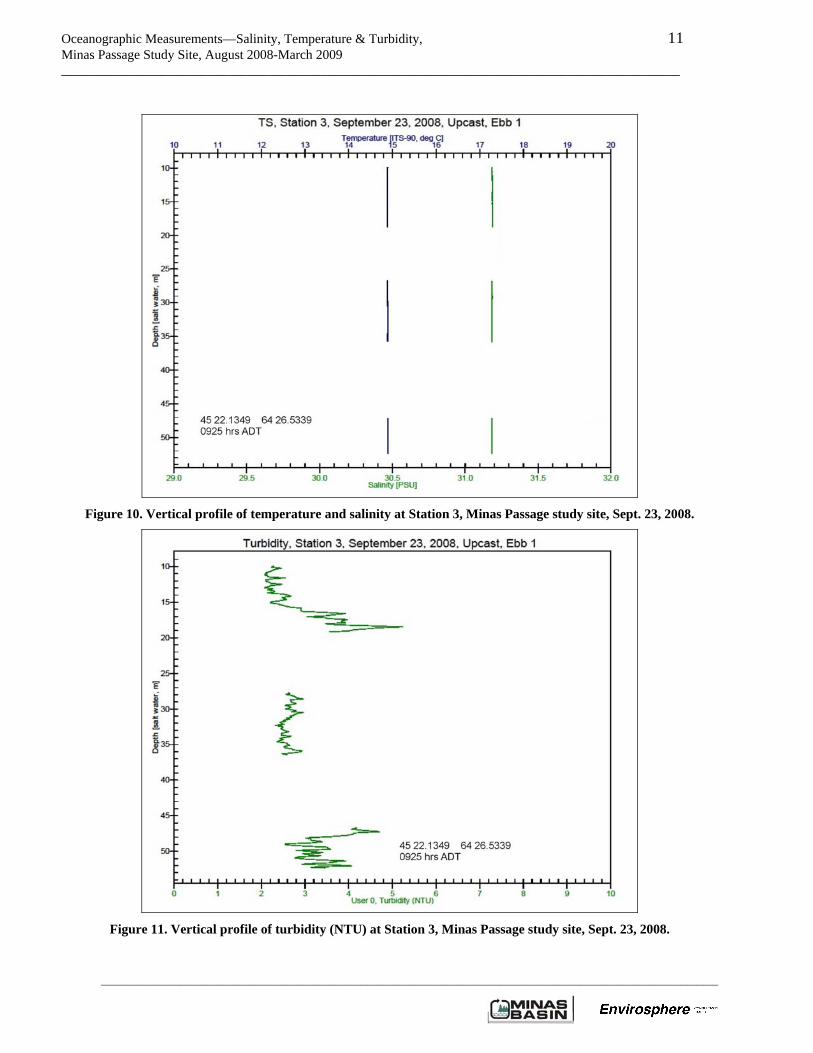
Figure 10. Vertical profile of temperature and salinity at Station 3, Minas Passage study site, Sept. 23, 2008.
Figure 11. Vertical profile of turbidity (NTU) at Station 3, Minas Passage study site, Sept. 23, 2008.
Oceanographic Measurements—Salinity, Temperature & Turbidity, 12 Minas Passage Study Site, August 2008-March 2009 _____________________________________________________________________________________________
____________________________________________________________________________________________________________________
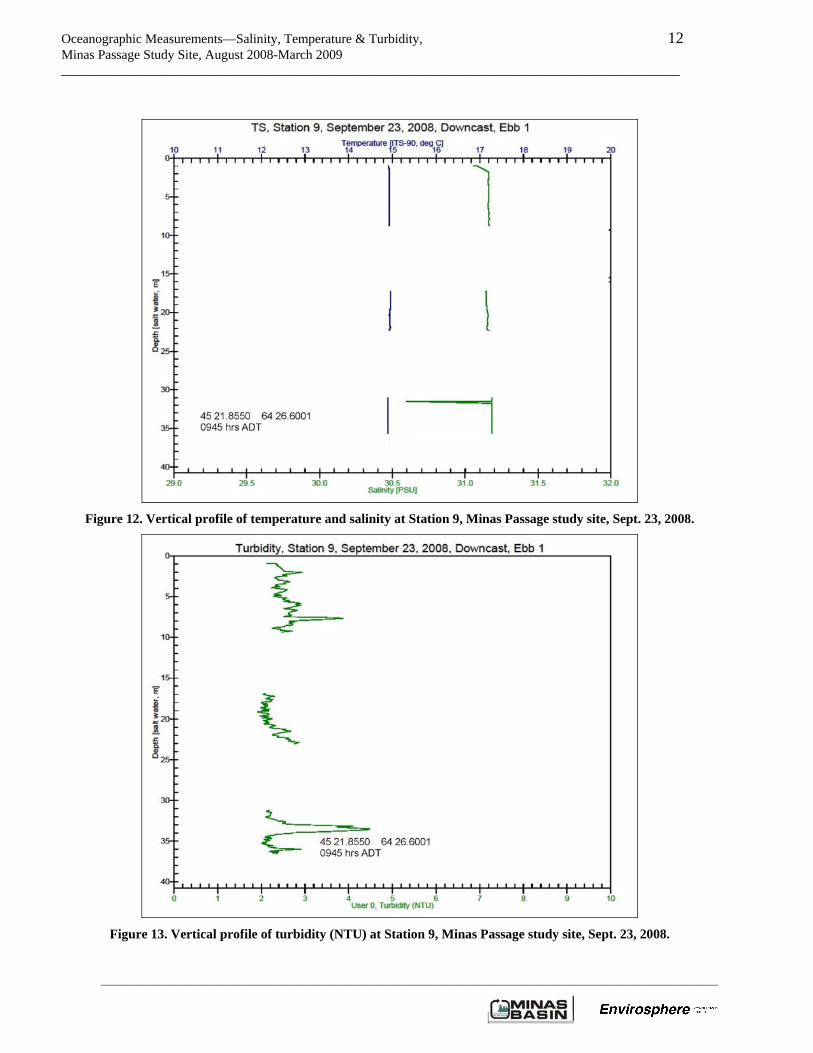
Figure 12. Vertical profile of temperature and salinity at Station 9, Minas Passage study site, Sept. 23, 2008.
Figure 13. Vertical profile of turbidity (NTU) at Station 9, Minas Passage study site, Sept. 23, 2008.
Oceanographic Measurements—Salinity, Temperature & Turbidity, 13 Minas Passage Study Site, August 2008-March 2009 _____________________________________________________________________________________________
____________________________________________________________________________________________________________________
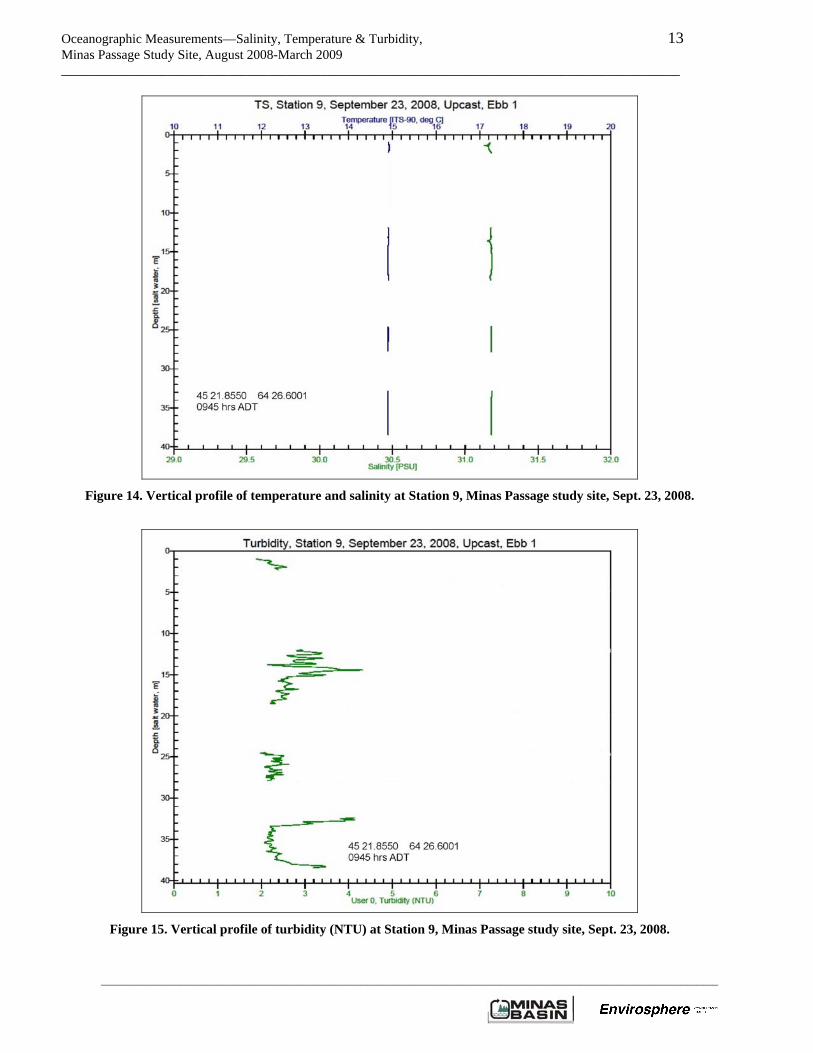
Figure 14. Vertical profile of temperature and salinity at Station 9, Minas Passage study site, Sept. 23, 2008.
Figure 15. Vertical profile of turbidity (NTU) at Station 9, Minas Passage study site, Sept. 23, 2008.
Oceanographic Measurements—Salinity, Temperature & Turbidity, 14 Minas Passage Study Site, August 2008-March 2009 _____________________________________________________________________________________________
____________________________________________________________________________________________________________________
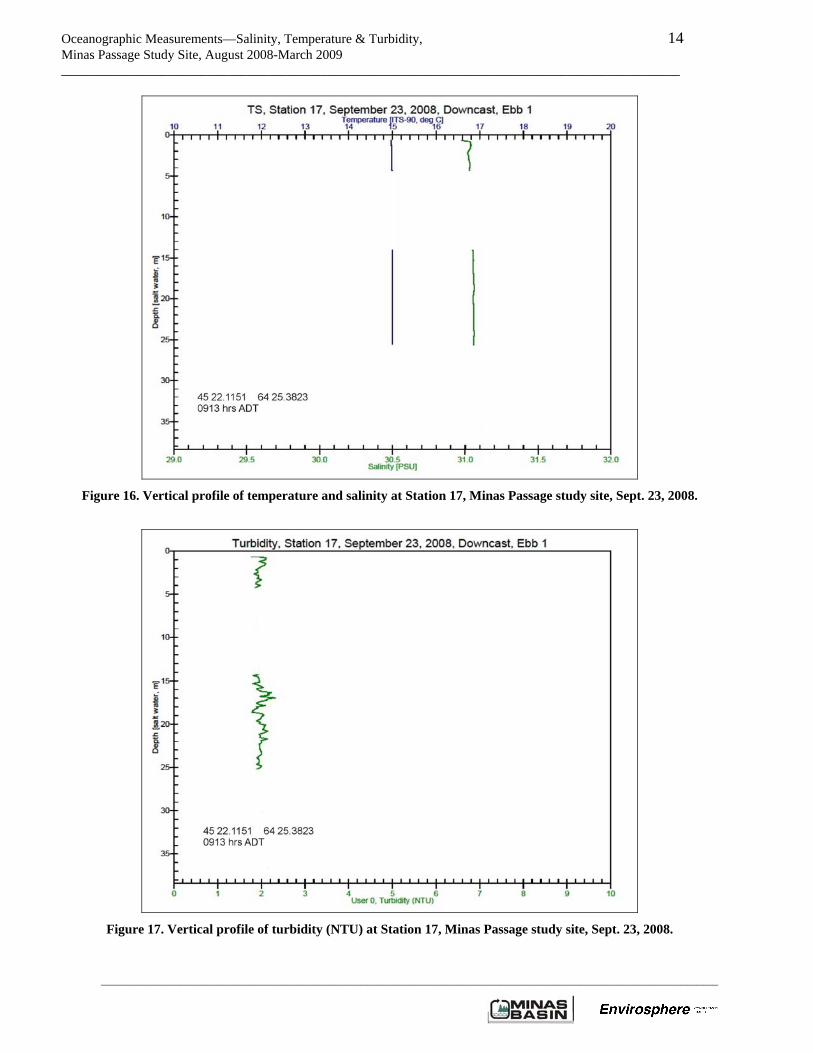
Figure 16. Vertical profile of temperature and salinity at Station 17, Minas Passage study site, Sept. 23, 2008.
Figure 17. Vertical profile of turbidity (NTU) at Station 17, Minas Passage study site, Sept. 23, 2008.
Oceanographic Measurements—Salinity, Temperature & Turbidity, 15 Minas Passage Study Site, August 2008-March 2009 _____________________________________________________________________________________________
____________________________________________________________________________________________________________________
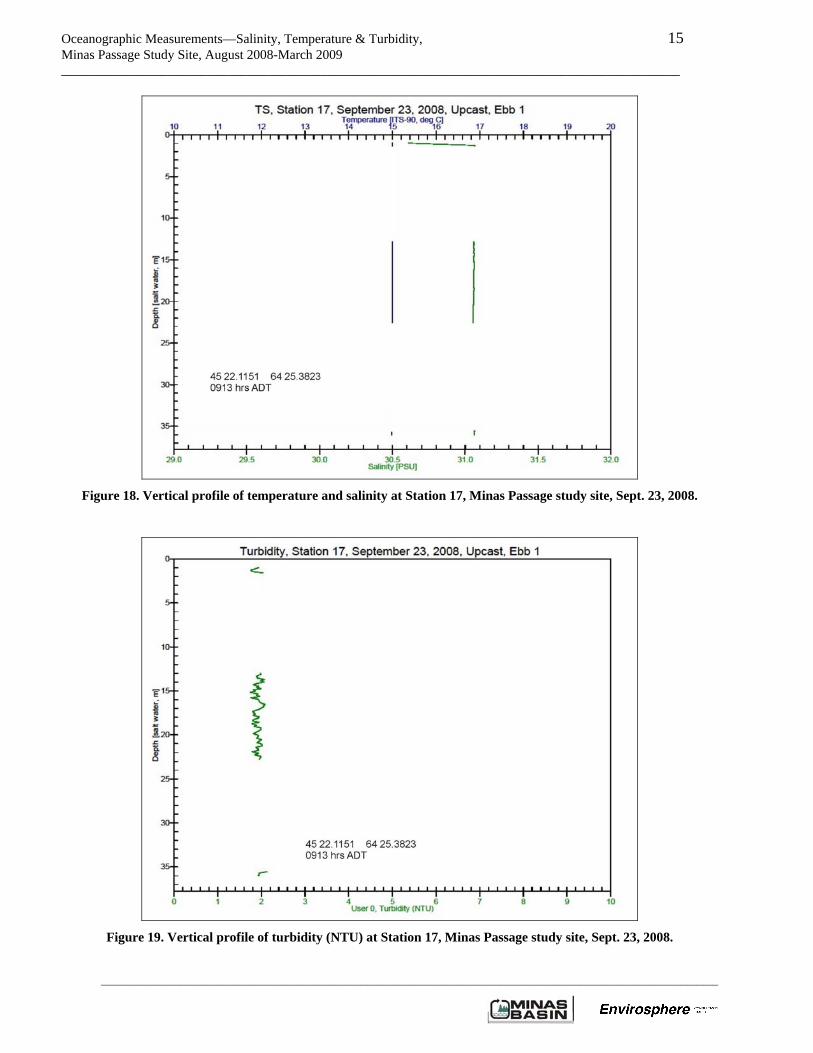
Figure 18. Vertical profile of temperature and salinity at Station 17, Minas Passage study site, Sept. 23, 2008.
Figure 19. Vertical profile of turbidity (NTU) at Station 17, Minas Passage study site, Sept. 23, 2008.
Oceanographic Measurements—Salinity, Temperature & Turbidity, 16 Minas Passage Study Site, August 2008-March 2009 _____________________________________________________________________________________________
____________________________________________________________________________________________________________________
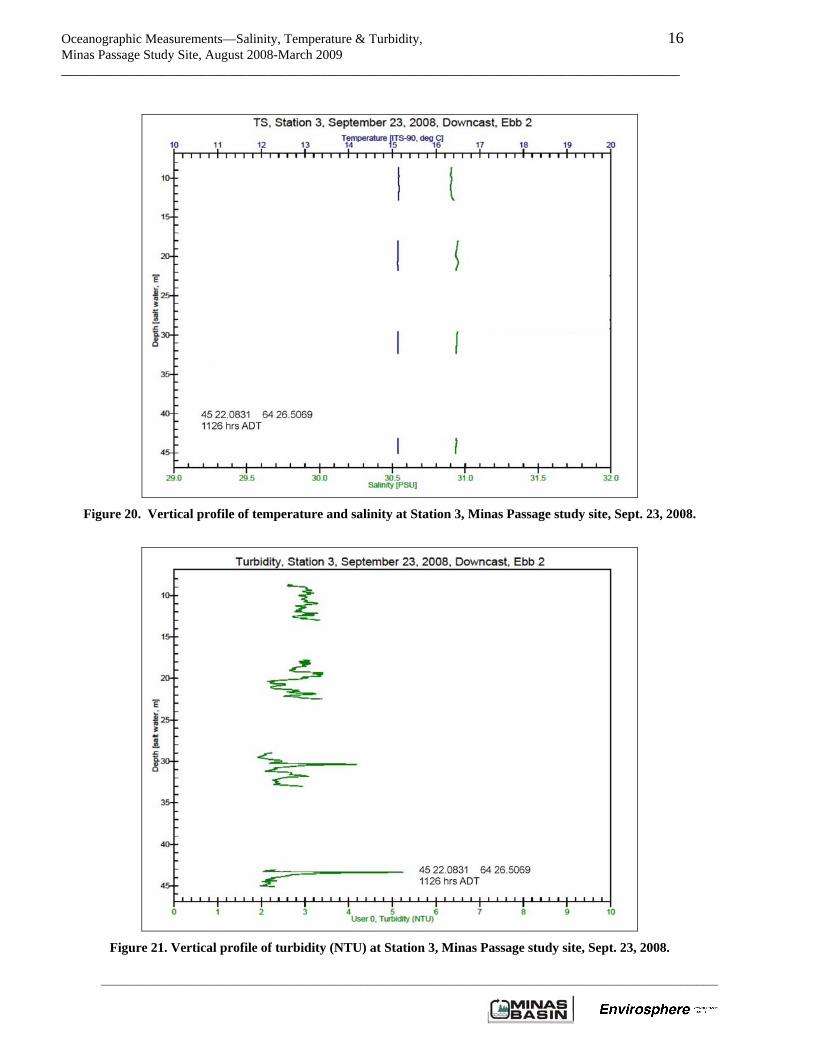
Figure 20. Vertical profile of temperature and salinity at Station 3, Minas Passage study site, Sept. 23, 2008.
Figure 21. Vertical profile of turbidity (NTU) at Station 3, Minas Passage study site, Sept. 23, 2008.
Oceanographic Measurements—Salinity, Temperature & Turbidity, 17 Minas Passage Study Site, August 2008-March 2009 _____________________________________________________________________________________________
____________________________________________________________________________________________________________________
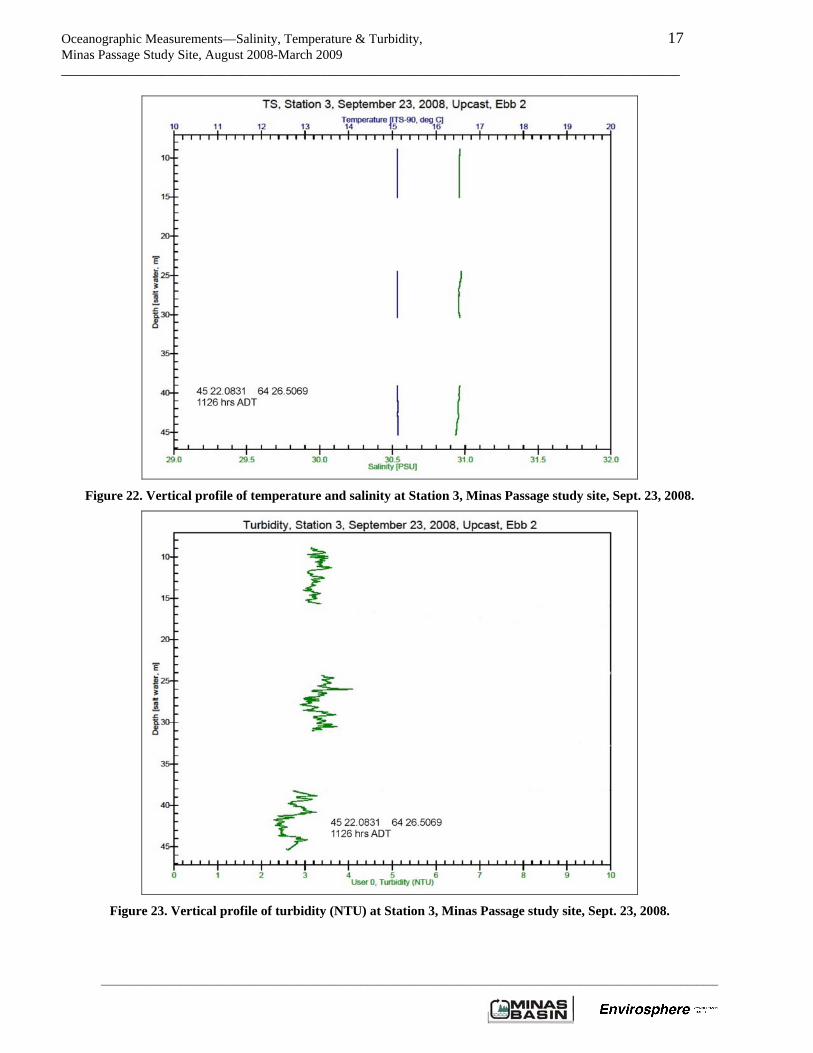
Figure 22. Vertical profile of temperature and salinity at Station 3, Minas Passage study site, Sept. 23, 2008.
Figure 23. Vertical profile of turbidity (NTU) at Station 3, Minas Passage study site, Sept. 23, 2008.
Oceanographic Measurements—Salinity, Temperature & Turbidity, 18 Minas Passage Study Site, August 2008-March 2009 _____________________________________________________________________________________________
____________________________________________________________________________________________________________________
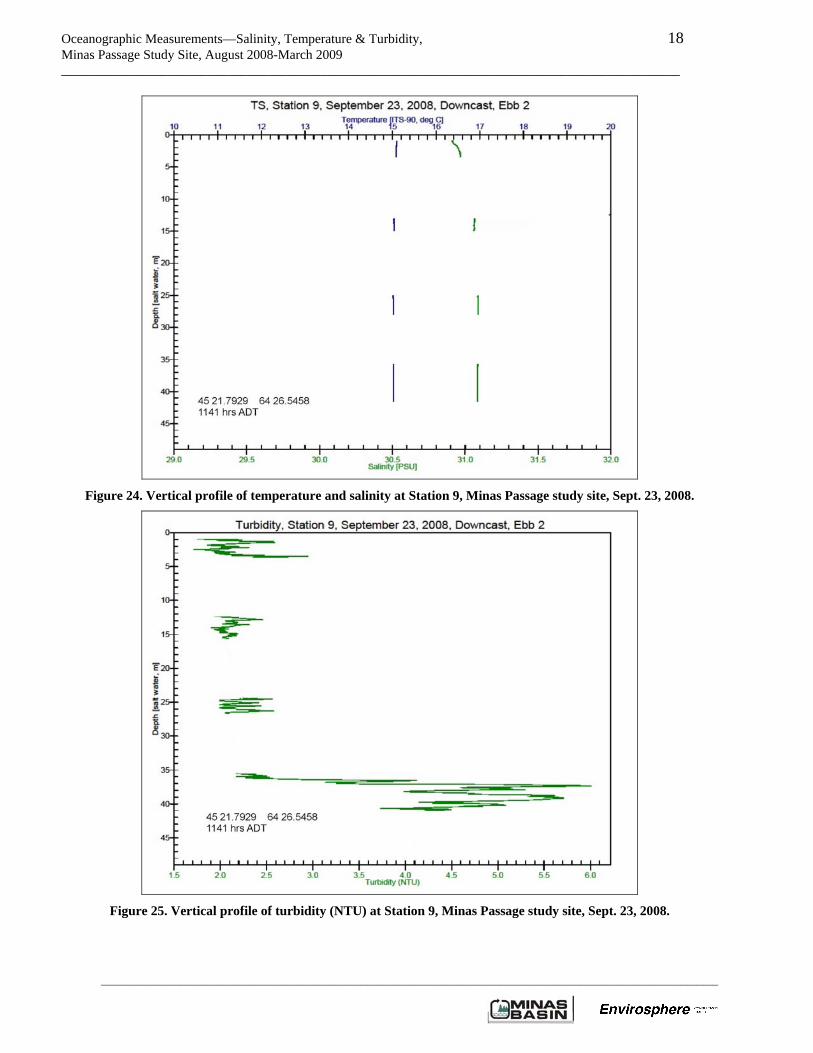
Figure 24. Vertical profile of temperature and salinity at Station 9, Minas Passage study site, Sept. 23, 2008.
Figure 25. Vertical profile of turbidity (NTU) at Station 9, Minas Passage study site, Sept. 23, 2008.
Oceanographic Measurements—Salinity, Temperature & Turbidity, 19 Minas Passage Study Site, August 2008-March 2009 _____________________________________________________________________________________________
____________________________________________________________________________________________________________________
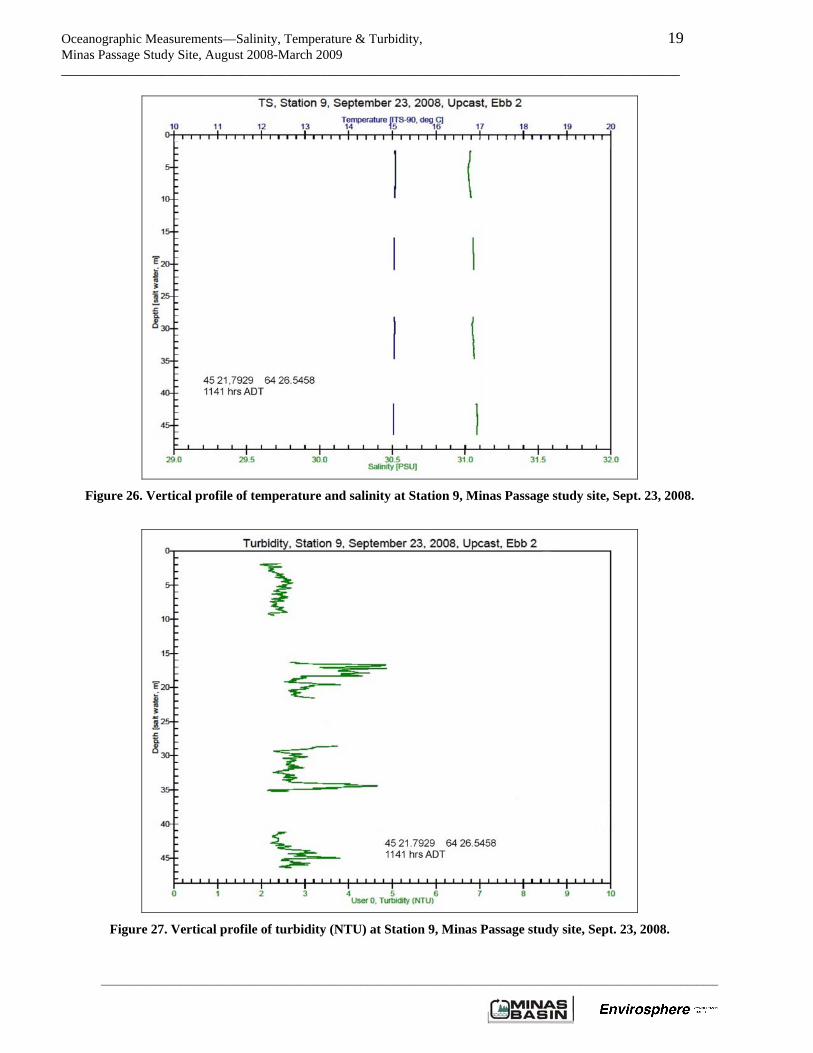
Figure 26. Vertical profile of temperature and salinity at Station 9, Minas Passage study site, Sept. 23, 2008.
Figure 27. Vertical profile of turbidity (NTU) at Station 9, Minas Passage study site, Sept. 23, 2008.
Oceanographic Measurements—Salinity, Temperature & Turbidity, 20 Minas Passage Study Site, August 2008-March 2009 _____________________________________________________________________________________________
____________________________________________________________________________________________________________________
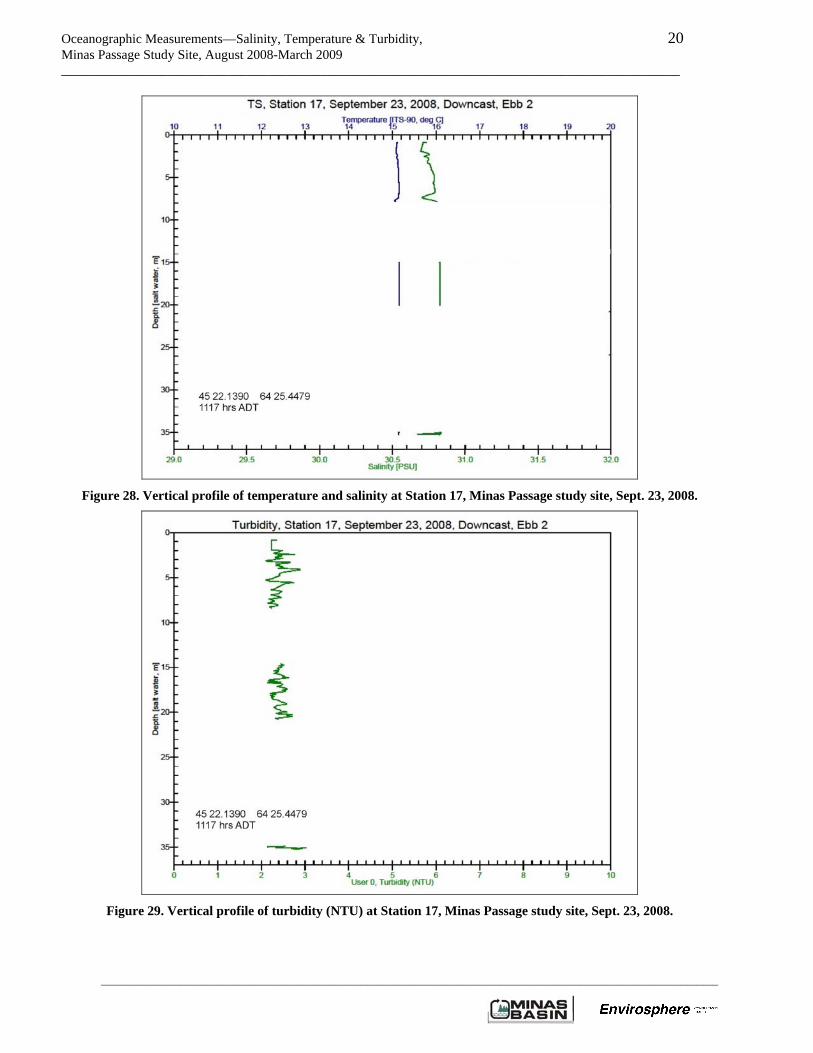
Figure 28. Vertical profile of temperature and salinity at Station 17, Minas Passage study site, Sept. 23, 2008.
Figure 29. Vertical profile of turbidity (NTU) at Station 17, Minas Passage study site, Sept. 23, 2008.
Oceanographic Measurements—Salinity, Temperature & Turbidity, 21 Minas Passage Study Site, August 2008-March 2009 _____________________________________________________________________________________________
____________________________________________________________________________________________________________________
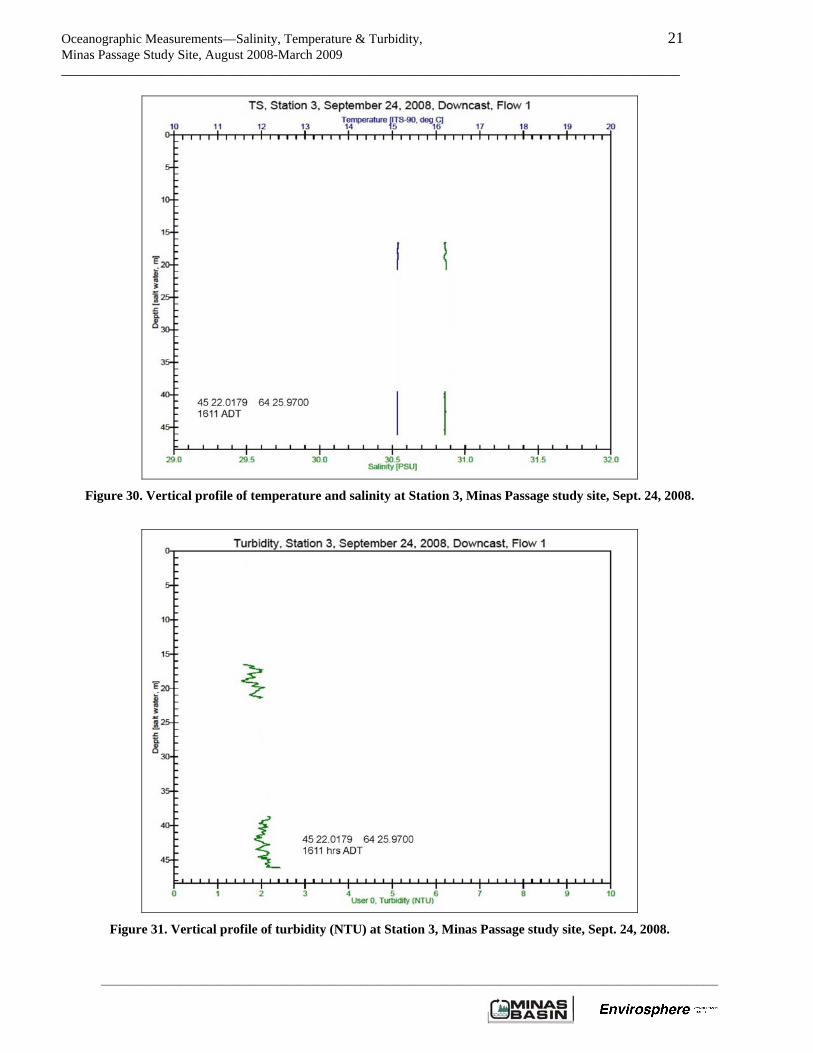
Figure 30. Vertical profile of temperature and salinity at Station 3, Minas Passage study site, Sept. 24, 2008.
Figure 31. Vertical profile of turbidity (NTU) at Station 3, Minas Passage study site, Sept. 24, 2008.
Oceanographic Measurements—Salinity, Temperature & Turbidity, 22 Minas Passage Study Site, August 2008-March 2009 _____________________________________________________________________________________________
____________________________________________________________________________________________________________________
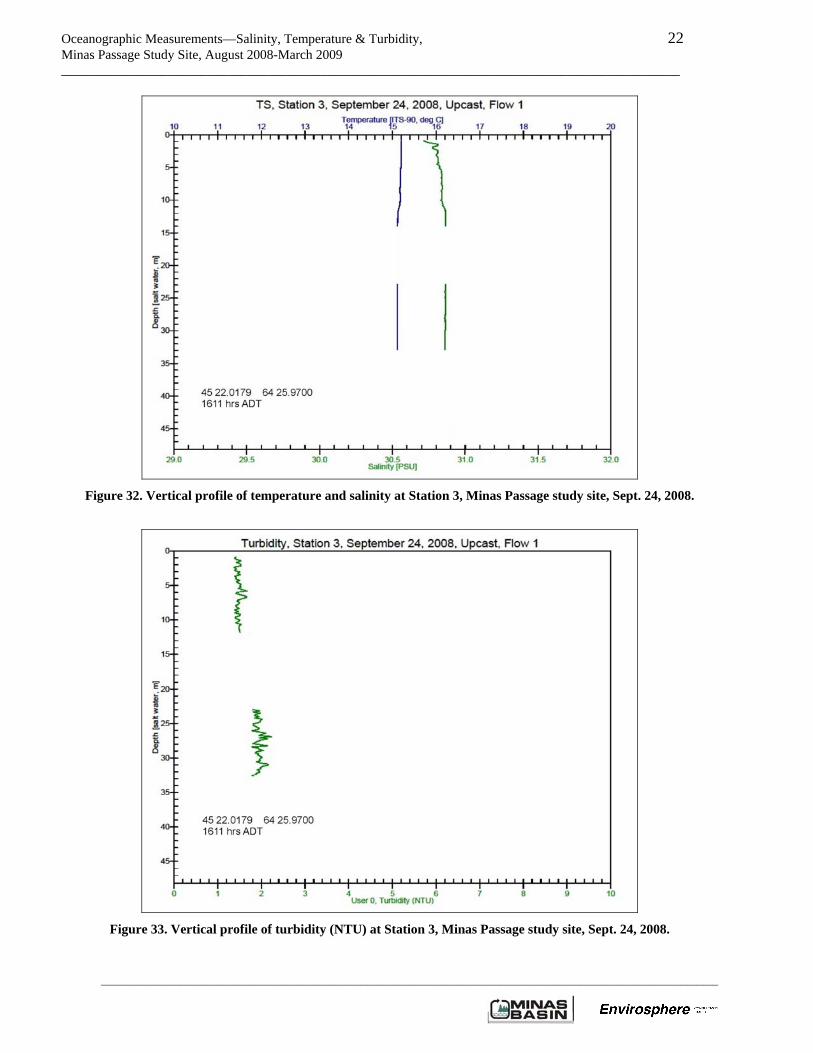
Figure 32. Vertical profile of temperature and salinity at Station 3, Minas Passage study site, Sept. 24, 2008.
Figure 33. Vertical profile of turbidity (NTU) at Station 3, Minas Passage study site, Sept. 24, 2008.
Oceanographic Measurements—Salinity, Temperature & Turbidity, 23 Minas Passage Study Site, August 2008-March 2009 _____________________________________________________________________________________________
____________________________________________________________________________________________________________________
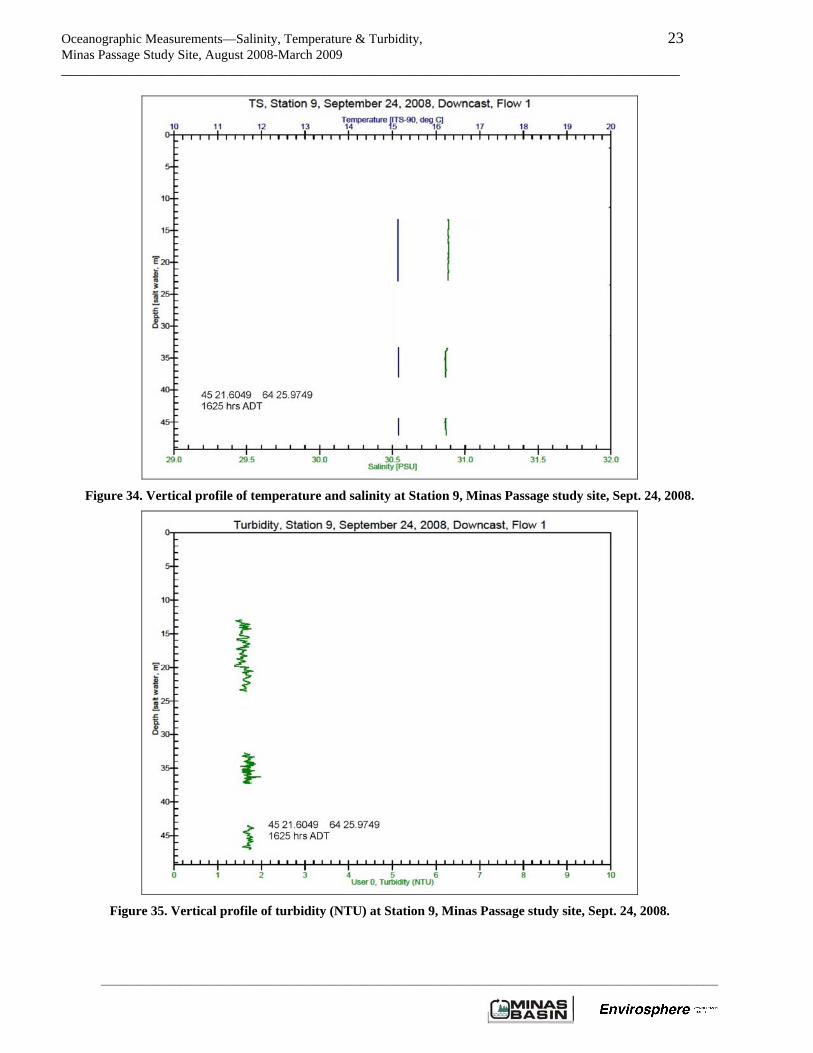
Figure 34. Vertical profile of temperature and salinity at Station 9, Minas Passage study site, Sept. 24, 2008.
Figure 35. Vertical profile of turbidity (NTU) at Station 9, Minas Passage study site, Sept. 24, 2008.
Oceanographic Measurements—Salinity, Temperature & Turbidity, 24 Minas Passage Study Site, August 2008-March 2009 _____________________________________________________________________________________________
____________________________________________________________________________________________________________________
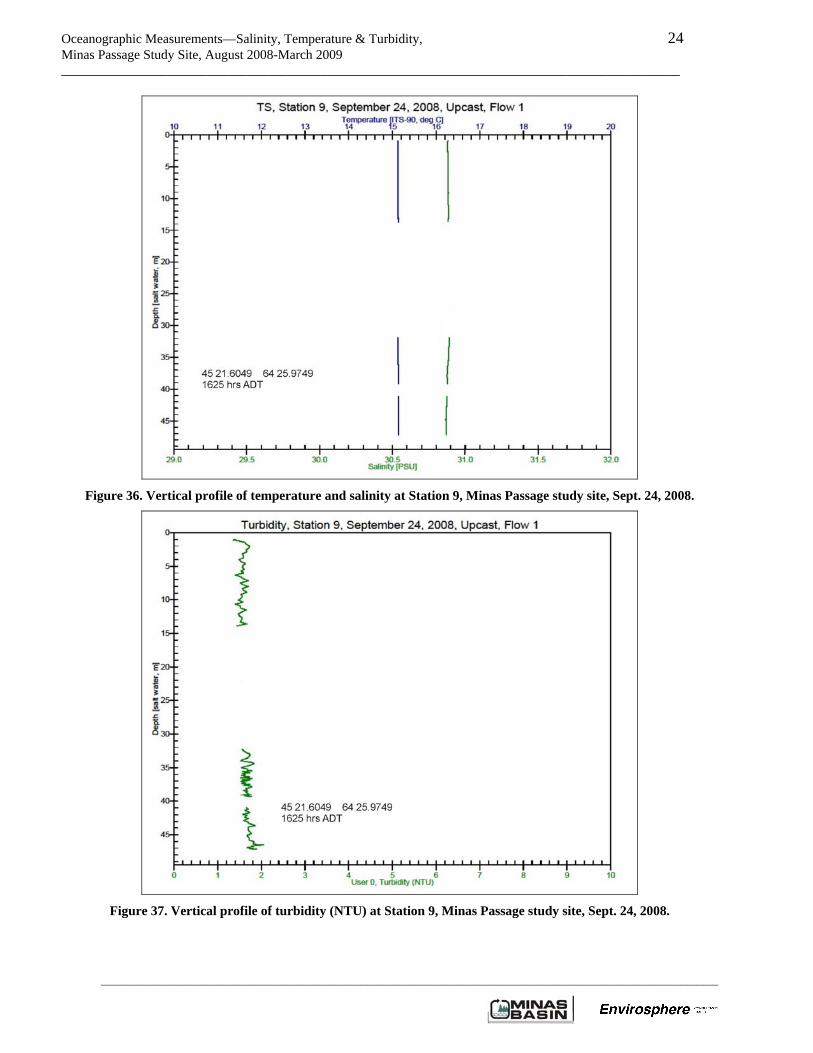
Figure 36. Vertical profile of temperature and salinity at Station 9, Minas Passage study site, Sept. 24, 2008.
Figure 37. Vertical profile of turbidity (NTU) at Station 9, Minas Passage study site, Sept. 24, 2008.
Oceanographic Measurements—Salinity, Temperature & Turbidity, 25 Minas Passage Study Site, August 2008-March 2009 _____________________________________________________________________________________________
____________________________________________________________________________________________________________________
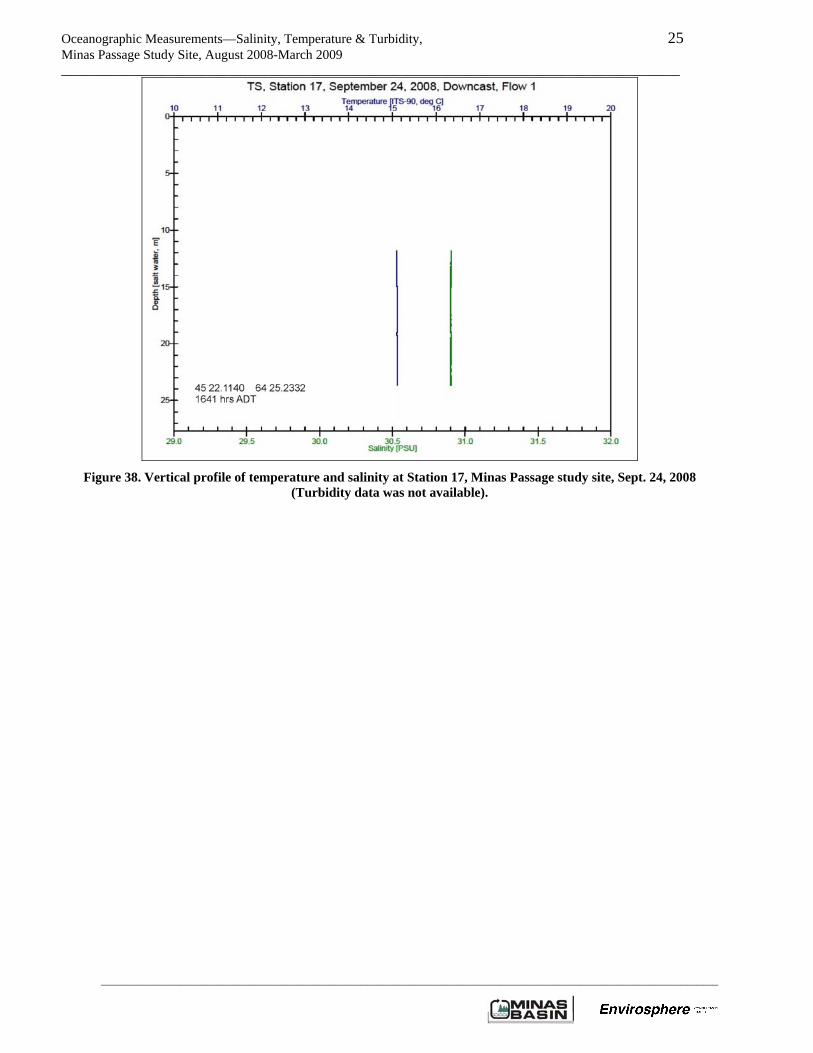
Figure 38. Vertical profile of temperature and salinity at Station 17, Minas Passage study site, Sept. 24, 2008
(Turbidity data was not available).
Oceanographic Measurements—Salinity, Temperature & Turbidity, 26 Minas Passage Study Site, August 2008-March 2009 _____________________________________________________________________________________________
____________________________________________________________________________________________________________________
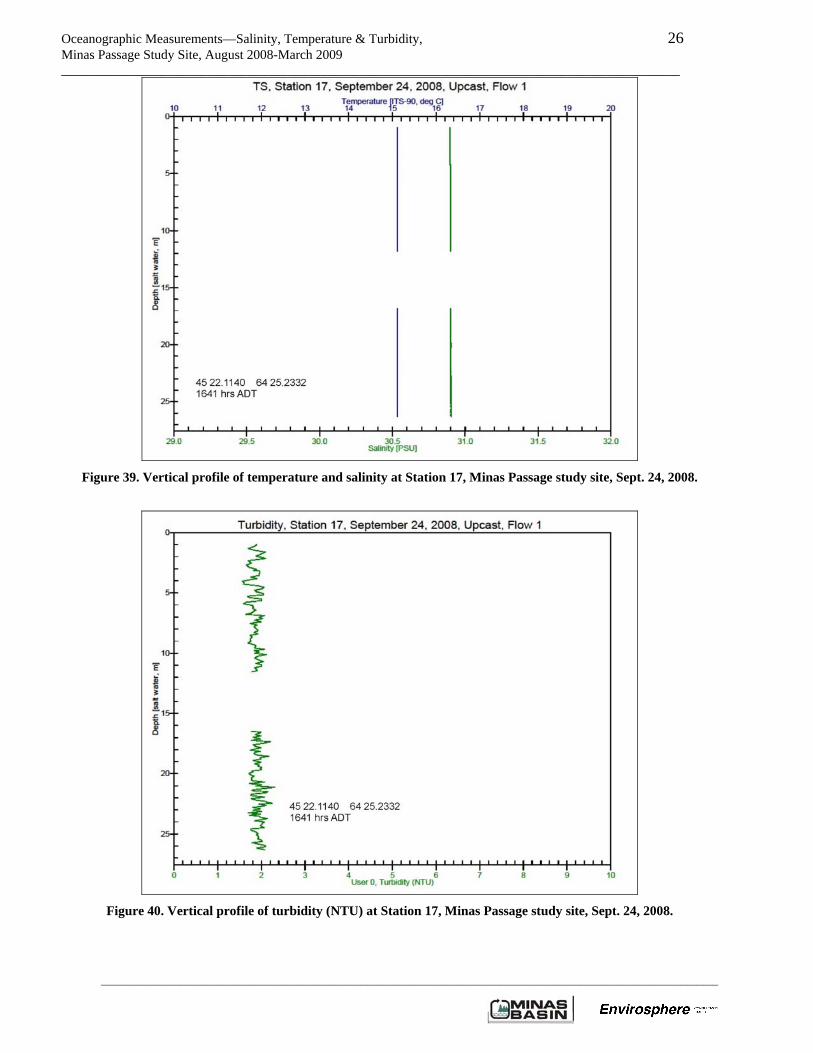
Figure 39. Vertical profile of temperature and salinity at Station 17, Minas Passage study site, Sept. 24, 2008.
Figure 40. Vertical profile of turbidity (NTU) at Station 17, Minas Passage study site, Sept. 24, 2008.
Oceanographic Measurements—Salinity, Temperature & Turbidity, 27 Minas Passage Study Site, August 2008-March 2009 _____________________________________________________________________________________________
____________________________________________________________________________________________________________________
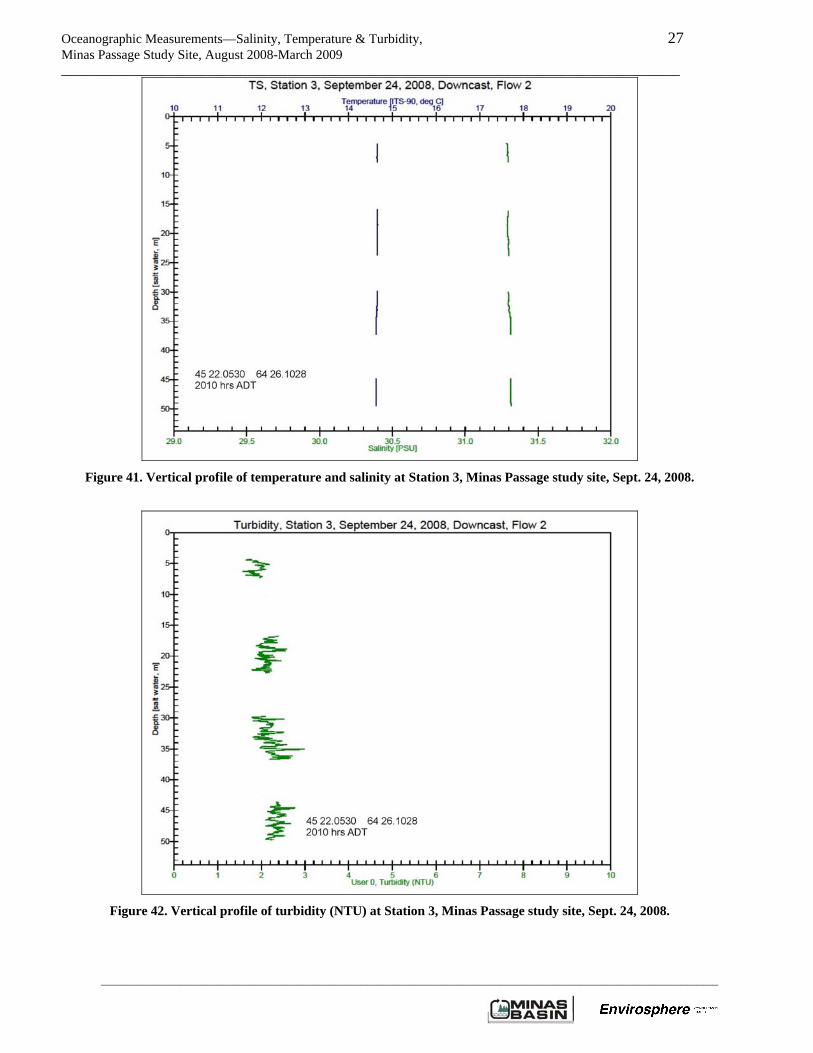
Figure 41. Vertical profile of temperature and salinity at Station 3, Minas Passage study site, Sept. 24, 2008.
Figure 42. Vertical profile of turbidity (NTU) at Station 3, Minas Passage study site, Sept. 24, 2008.
Oceanographic Measurements—Salinity, Temperature & Turbidity, 28 Minas Passage Study Site, August 2008-March 2009 _____________________________________________________________________________________________
____________________________________________________________________________________________________________________
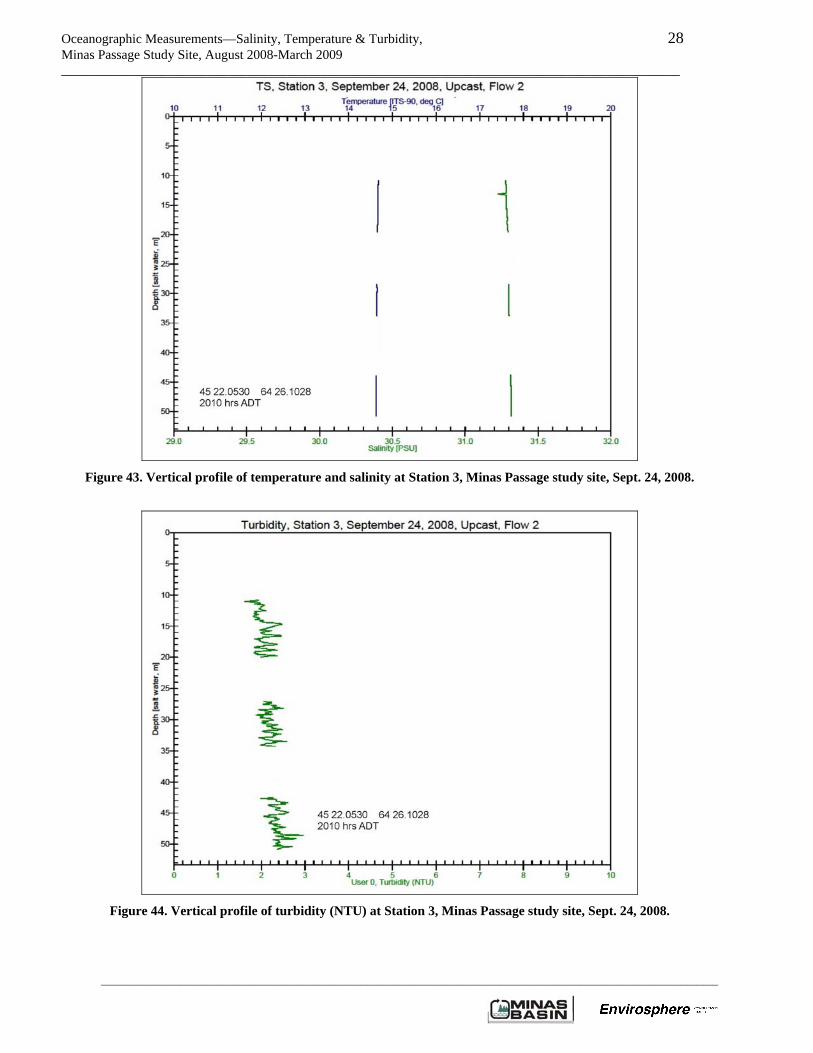
Figure 43. Vertical profile of temperature and salinity at Station 3, Minas Passage study site, Sept. 24, 2008.
Figure 44. Vertical profile of turbidity (NTU) at Station 3, Minas Passage study site, Sept. 24, 2008.
Oceanographic Measurements—Salinity, Temperature & Turbidity, 29 Minas Passage Study Site, August 2008-March 2009 _____________________________________________________________________________________________
____________________________________________________________________________________________________________________
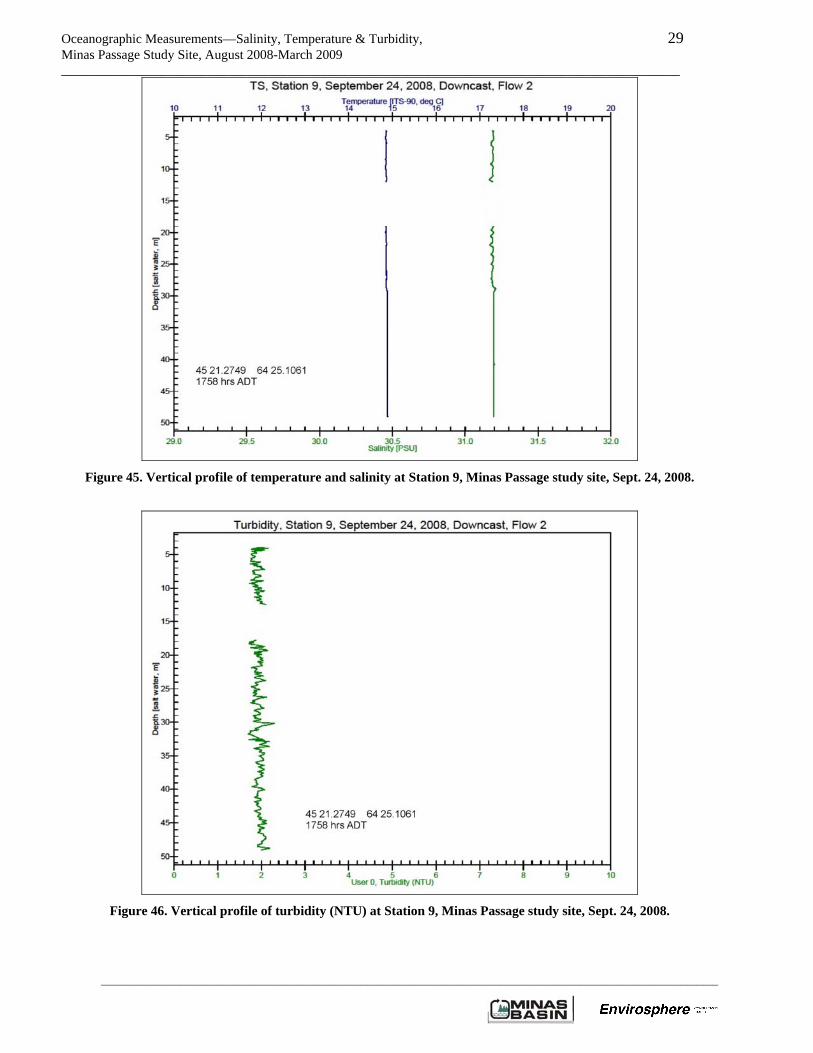
Figure 45. Vertical profile of temperature and salinity at Station 9, Minas Passage study site, Sept. 24, 2008.
Figure 46. Vertical profile of turbidity (NTU) at Station 9, Minas Passage study site, Sept. 24, 2008.
Oceanographic Measurements—Salinity, Temperature & Turbidity, 30 Minas Passage Study Site, August 2008-March 2009 _____________________________________________________________________________________________
____________________________________________________________________________________________________________________
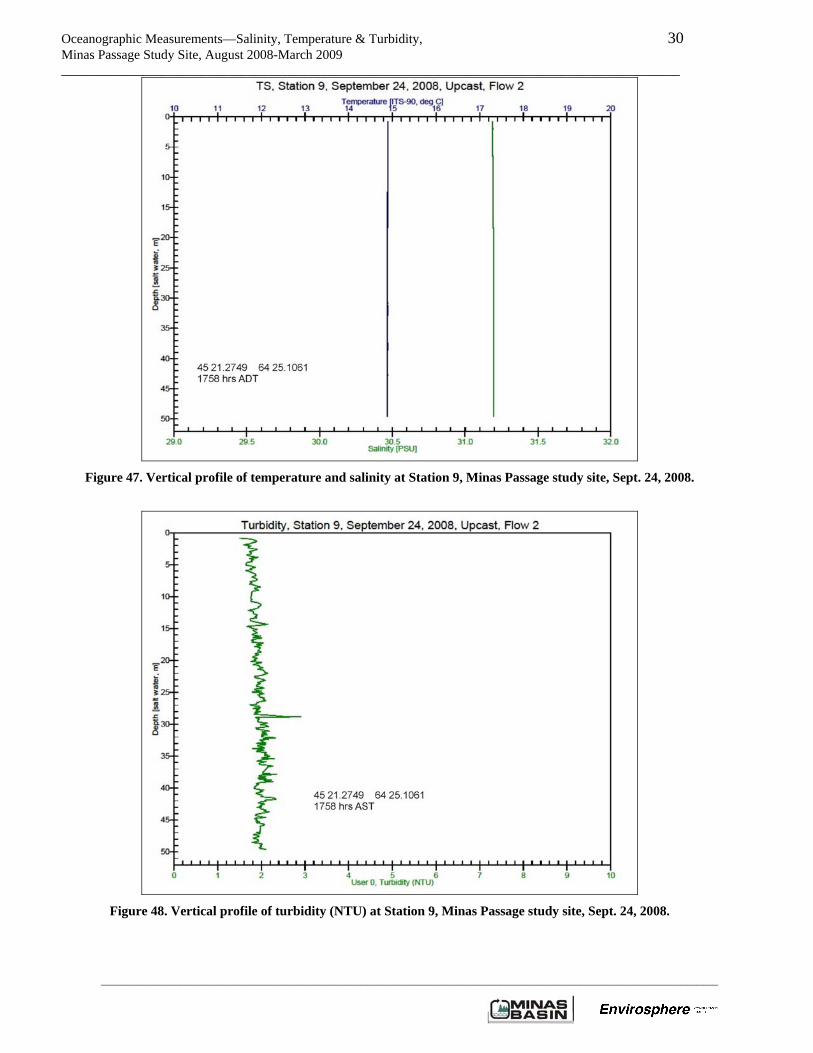
Figure 47. Vertical profile of temperature and salinity at Station 9, Minas Passage study site, Sept. 24, 2008.
Figure 48. Vertical profile of turbidity (NTU) at Station 9, Minas Passage study site, Sept. 24, 2008.
Oceanographic Measurements—Salinity, Temperature & Turbidity, 31 Minas Passage Study Site, August 2008-March 2009 _____________________________________________________________________________________________
____________________________________________________________________________________________________________________
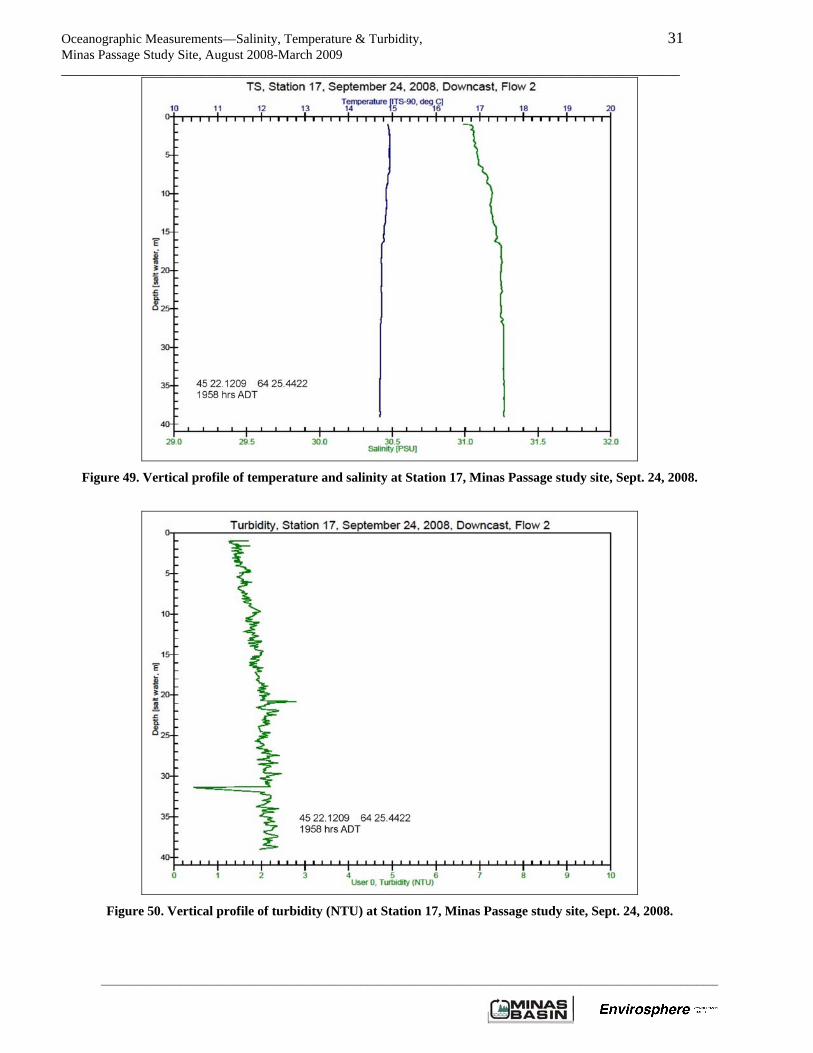
Figure 49. Vertical profile of temperature and salinity at Station 17, Minas Passage study site, Sept. 24, 2008.
Figure 50. Vertical profile of turbidity (NTU) at Station 17, Minas Passage study site, Sept. 24, 2008.
Oceanographic Measurements—Salinity, Temperature & Turbidity, 32 Minas Passage Study Site, August 2008-March 2009 _____________________________________________________________________________________________
____________________________________________________________________________________________________________________
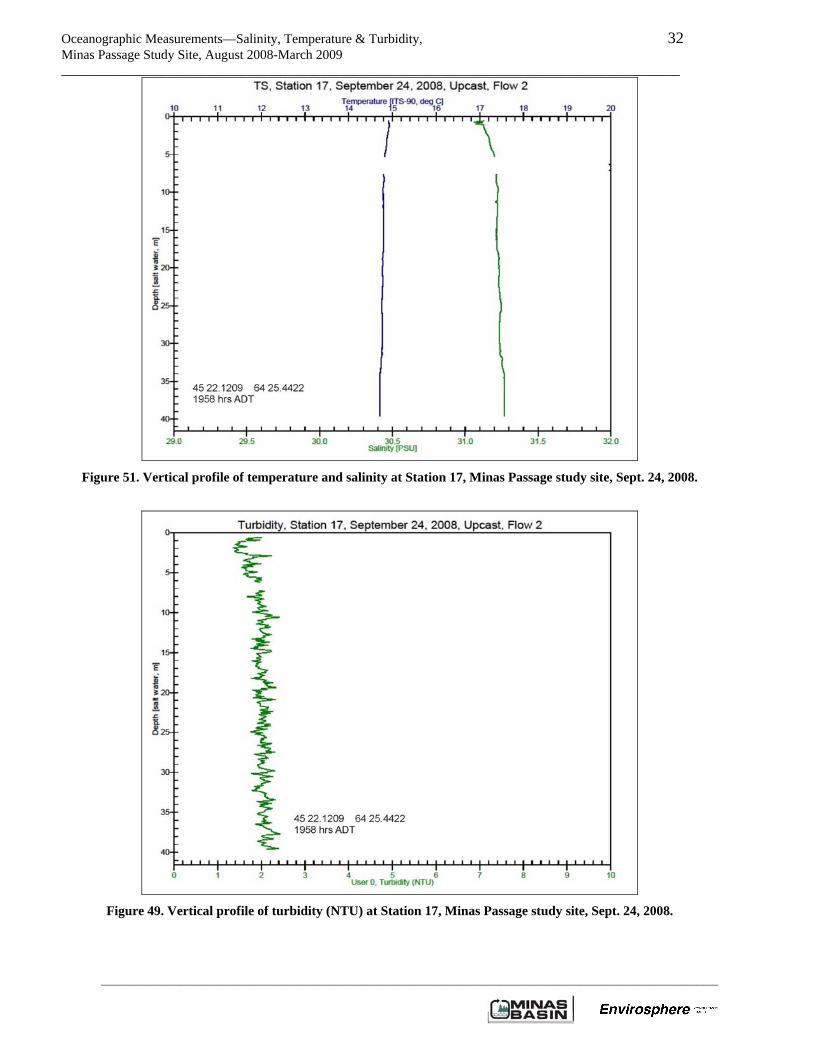
Figure 51. Vertical profile of temperature and salinity at Station 17, Minas Passage study site, Sept. 24, 2008.
Figure 49. Vertical profile of turbidity (NTU) at Station 17, Minas Passage study site, Sept. 24, 2008.
Oceanographic Measurements—Salinity, Temperature & Turbidity, 33 Minas Passage Study Site, August 2008-March 2009 _____________________________________________________________________________________________
____________________________________________________________________________________________________________________
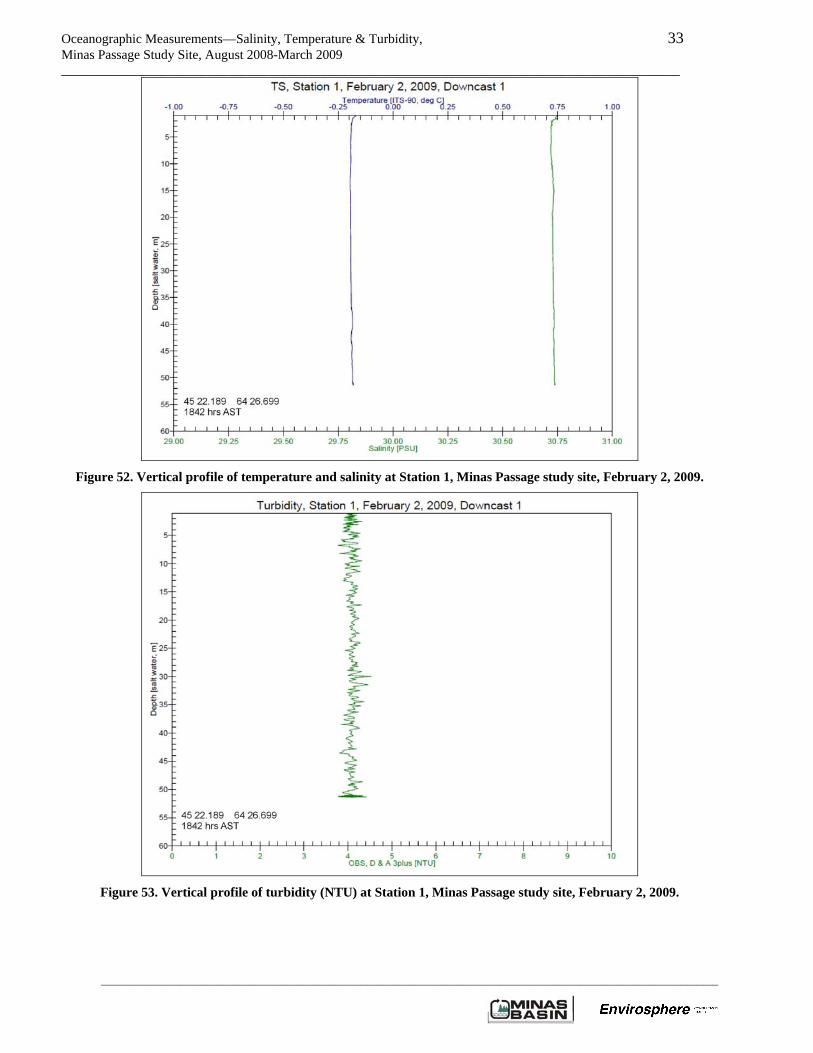
Figure 52. Vertical profile of temperature and salinity at Station 1, Minas Passage study site, February 2, 2009.
Figure 53. Vertical profile of turbidity (NTU) at Station 1, Minas Passage study site, February 2, 2009.
Oceanographic Measurements—Salinity, Temperature & Turbidity, 34 Minas Passage Study Site, August 2008-March 2009 _____________________________________________________________________________________________
____________________________________________________________________________________________________________________
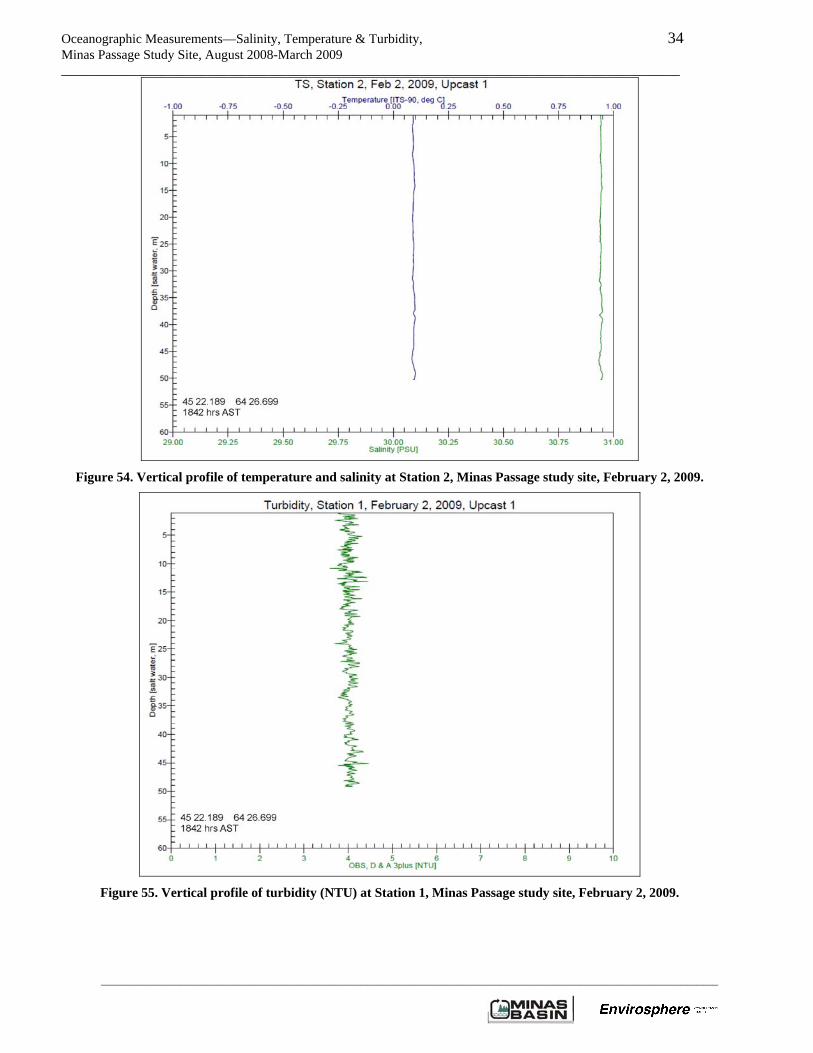
Figure 54. Vertical profile of temperature and salinity at Station 2, Minas Passage study site, February 2, 2009.
Figure 55. Vertical profile of turbidity (NTU) at Station 1, Minas Passage study site, February 2, 2009.
Oceanographic Measurements—Salinity, Temperature & Turbidity, 35 Minas Passage Study Site, August 2008-March 2009 _____________________________________________________________________________________________
____________________________________________________________________________________________________________________
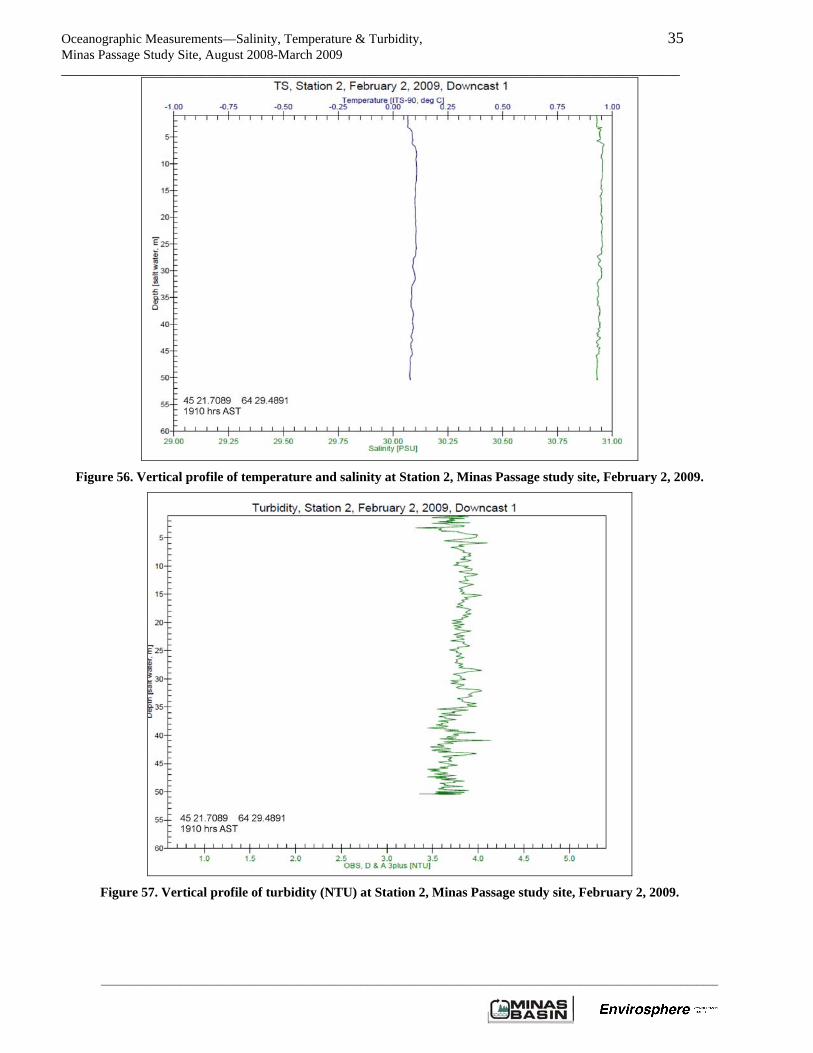
Figure 56. Vertical profile of temperature and salinity at Station 2, Minas Passage study site, February 2, 2009.
Figure 57. Vertical profile of turbidity (NTU) at Station 2, Minas Passage study site, February 2, 2009.
Oceanographic Measurements—Salinity, Temperature & Turbidity, 36 Minas Passage Study Site, August 2008-March 2009 _____________________________________________________________________________________________
____________________________________________________________________________________________________________________
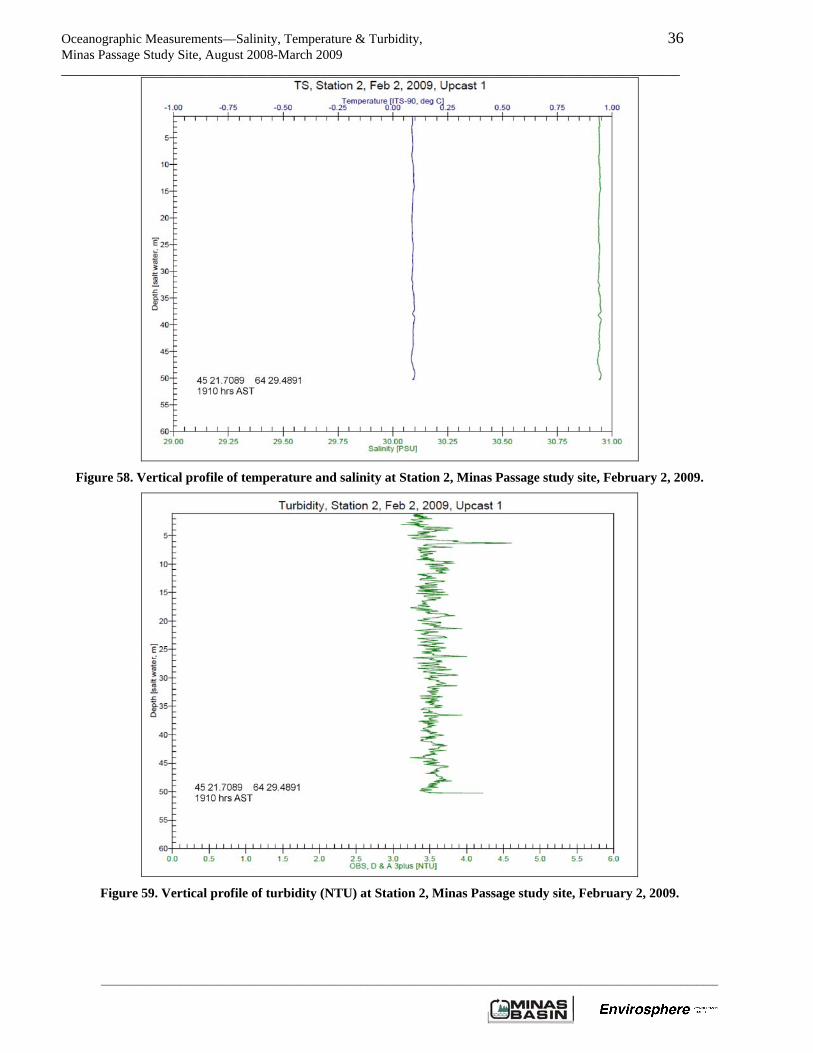
Figure 58. Vertical profile of temperature and salinity at Station 2, Minas Passage study site, February 2, 2009.
Figure 59. Vertical profile of turbidity (NTU) at Station 2, Minas Passage study site, February 2, 2009.
Oceanographic Measurements—Salinity, Temperature & Turbidity, 37 Minas Passage Study Site, August 2008-March 2009 _____________________________________________________________________________________________
____________________________________________________________________________________________________________________
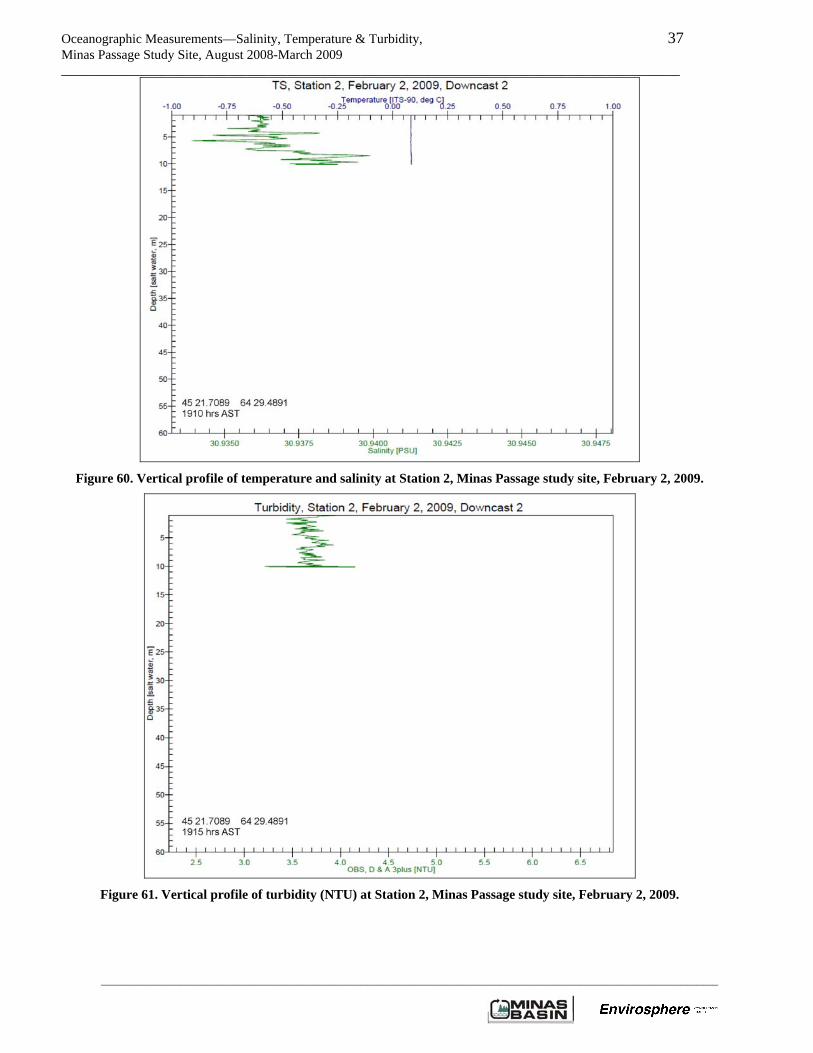
Figure 60. Vertical profile of temperature and salinity at Station 2, Minas Passage study site, February 2, 2009.
Figure 61. Vertical profile of turbidity (NTU) at Station 2, Minas Passage study site, February 2, 2009.
Oceanographic Measurements—Salinity, Temperature & Turbidity, 38 Minas Passage Study Site, August 2008-March 2009 _____________________________________________________________________________________________
____________________________________________________________________________________________________________________
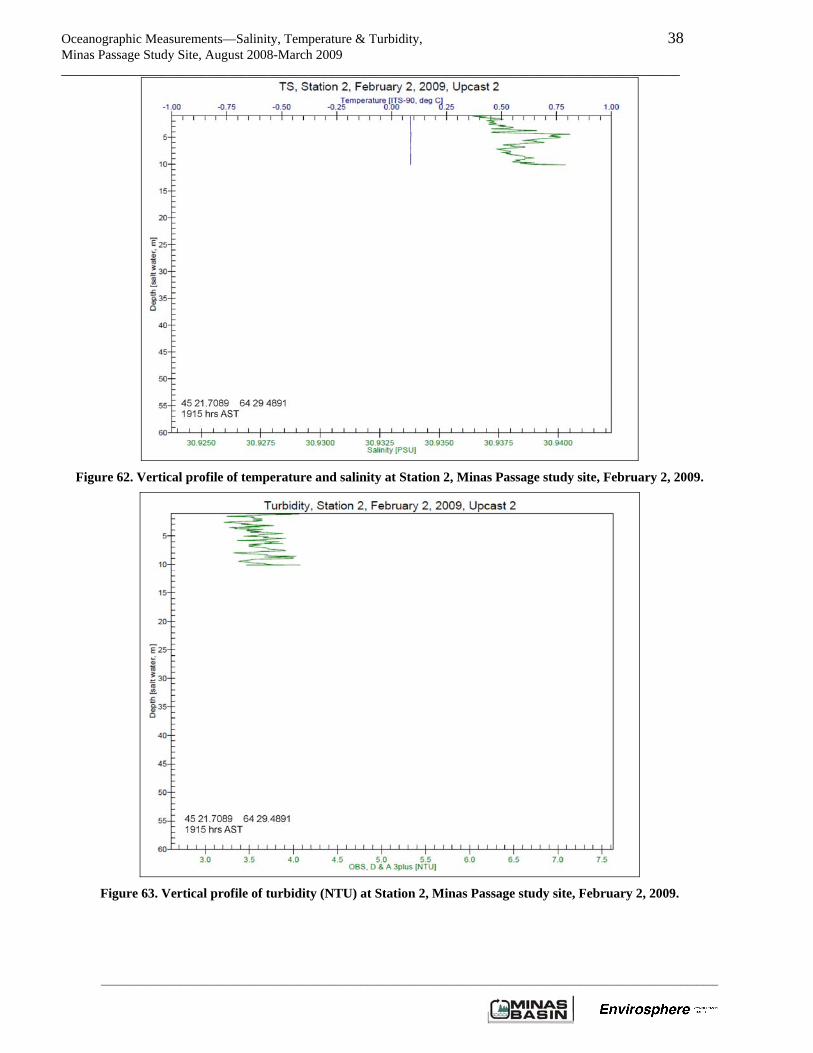
Figure 62. Vertical profile of temperature and salinity at Station 2, Minas Passage study site, February 2, 2009.
Figure 63. Vertical profile of turbidity (NTU) at Station 2, Minas Passage study site, February 2, 2009.
Oceanographic Measurements—Salinity, Temperature & Turbidity, 39 Minas Passage Study Site, August 2008-March 2009 _____________________________________________________________________________________________
____________________________________________________________________________________________________________________
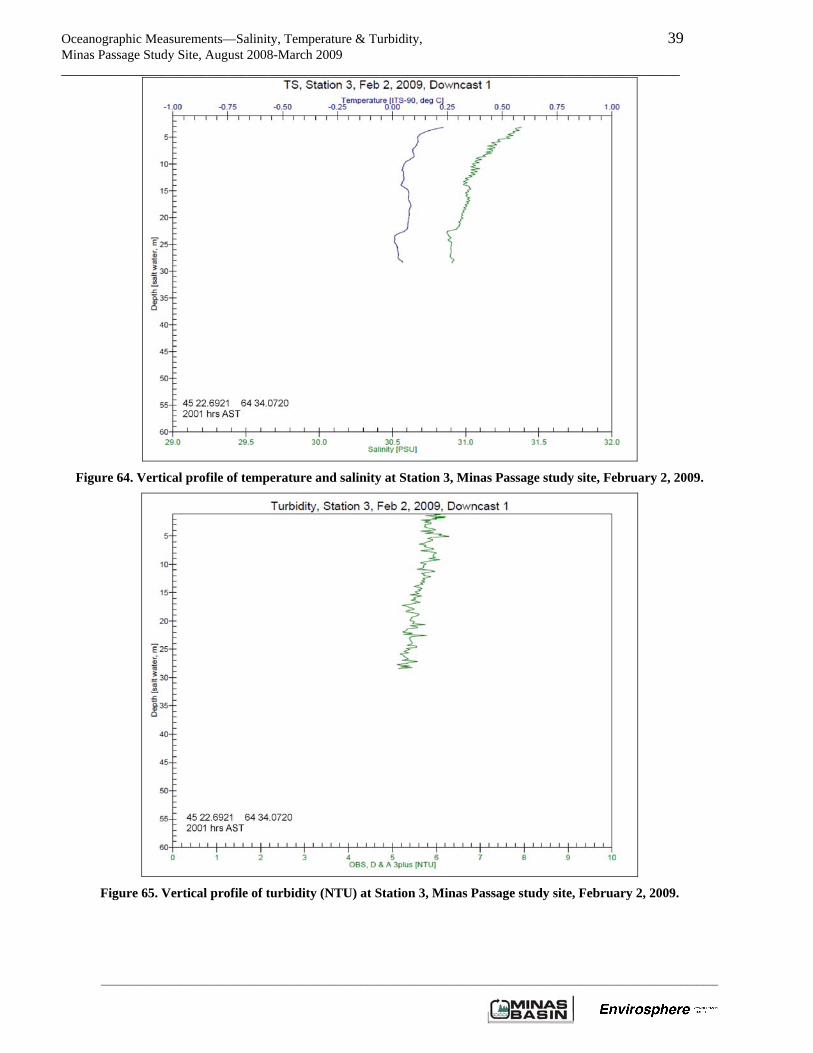
Figure 64. Vertical profile of temperature and salinity at Station 3, Minas Passage study site, February 2, 2009.
Figure 65. Vertical profile of turbidity (NTU) at Station 3, Minas Passage study site, February 2, 2009.
Oceanographic Measurements—Salinity, Temperature & Turbidity, 40 Minas Passage Study Site, August 2008-March 2009 _____________________________________________________________________________________________
____________________________________________________________________________________________________________________
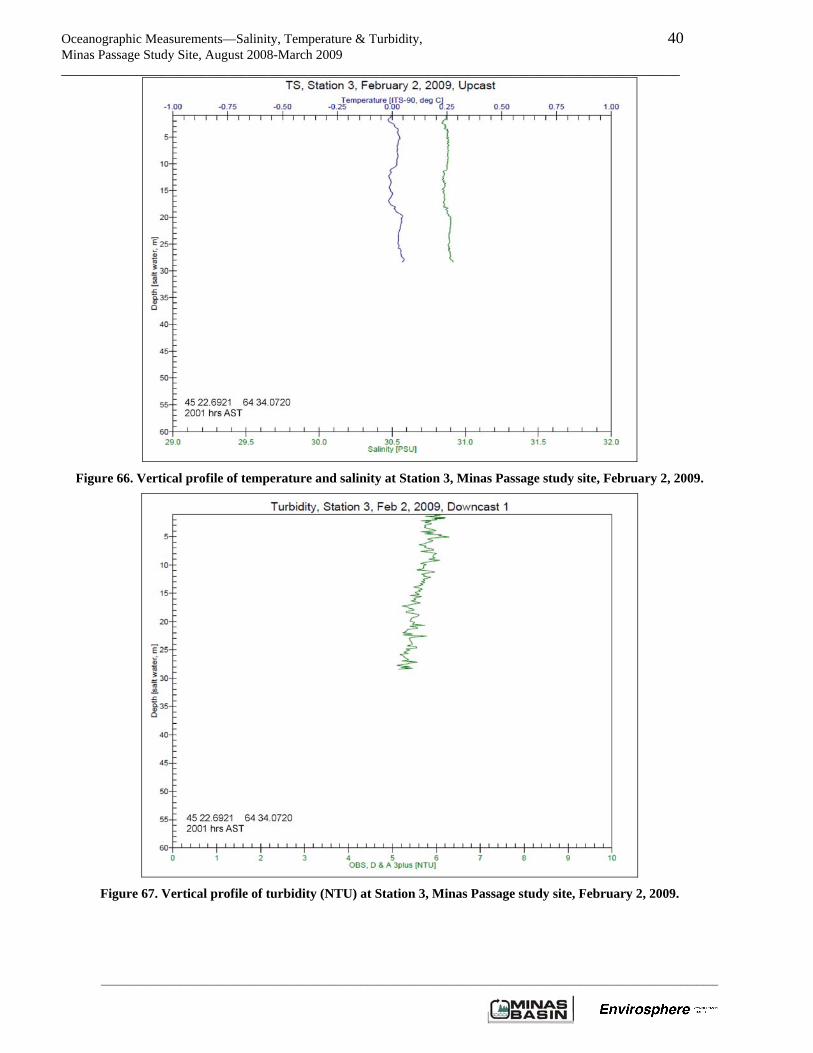
Figure 66. Vertical profile of temperature and salinity at Station 3, Minas Passage study site, February 2, 2009.
Figure 67. Vertical profile of turbidity (NTU) at Station 3, Minas Passage study site, February 2, 2009.
Oceanographic Measurements—Salinity, Temperature & Turbidity, 41 Minas Passage Study Site, August 2008-March 2009 _____________________________________________________________________________________________
____________________________________________________________________________________________________________________
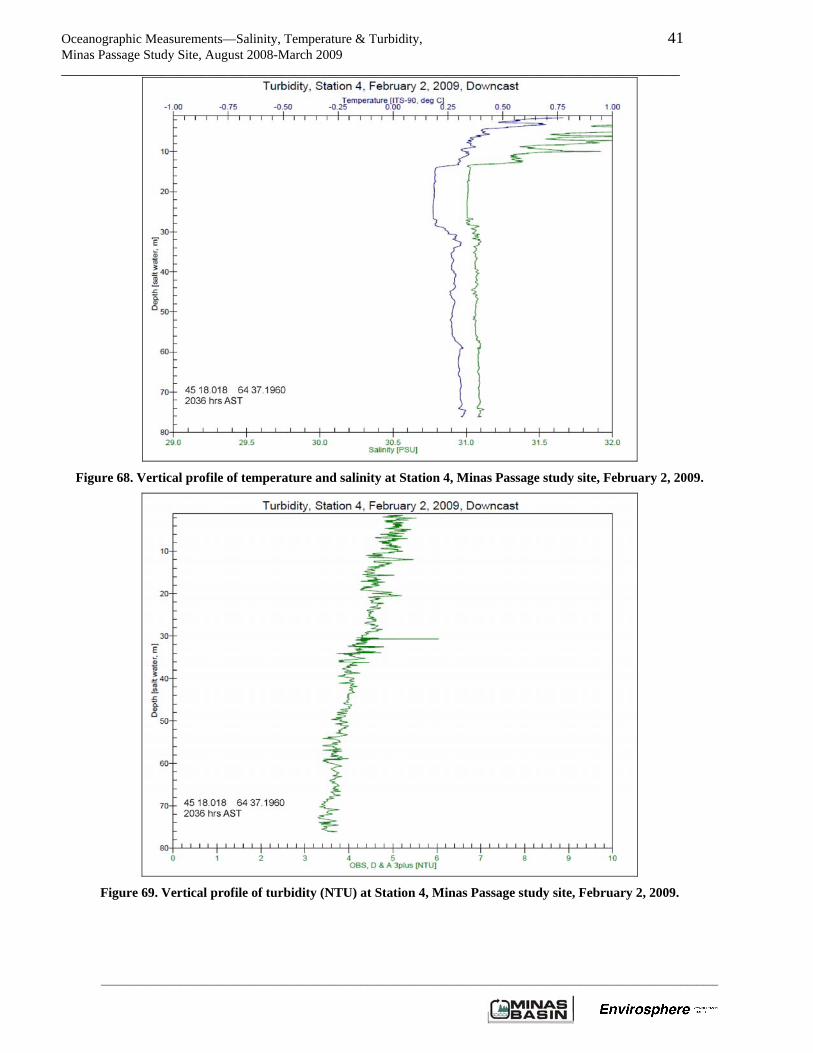
Figure 68. Vertical profile of temperature and salinity at Station 4, Minas Passage study site, February 2, 2009.
Figure 69. Vertical profile of turbidity (NTU) at Station 4, Minas Passage study site, February 2, 2009.
Oceanographic Measurements—Salinity, Temperature & Turbidity, 42 Minas Passage Study Site, August 2008-March 2009 _____________________________________________________________________________________________
____________________________________________________________________________________________________________________
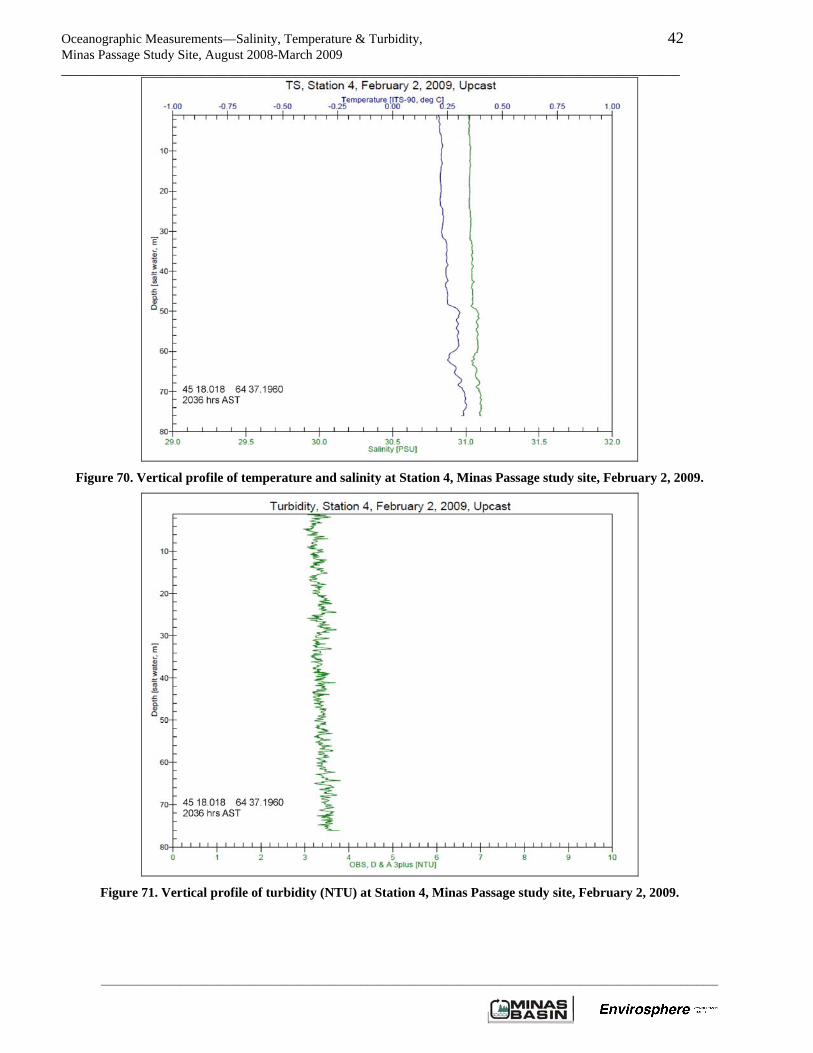
Figure 70. Vertical profile of temperature and salinity at Station 4, Minas Passage study site, February 2, 2009.
Figure 71. Vertical profile of turbidity (NTU) at Station 4, Minas Passage study site, February 2, 2009.
Oceanographic Measurements—Salinity, Temperature & Turbidity, 43 Minas Passage Study Site, August 2008-March 2009 _____________________________________________________________________________________________
____________________________________________________________________________________________________________________
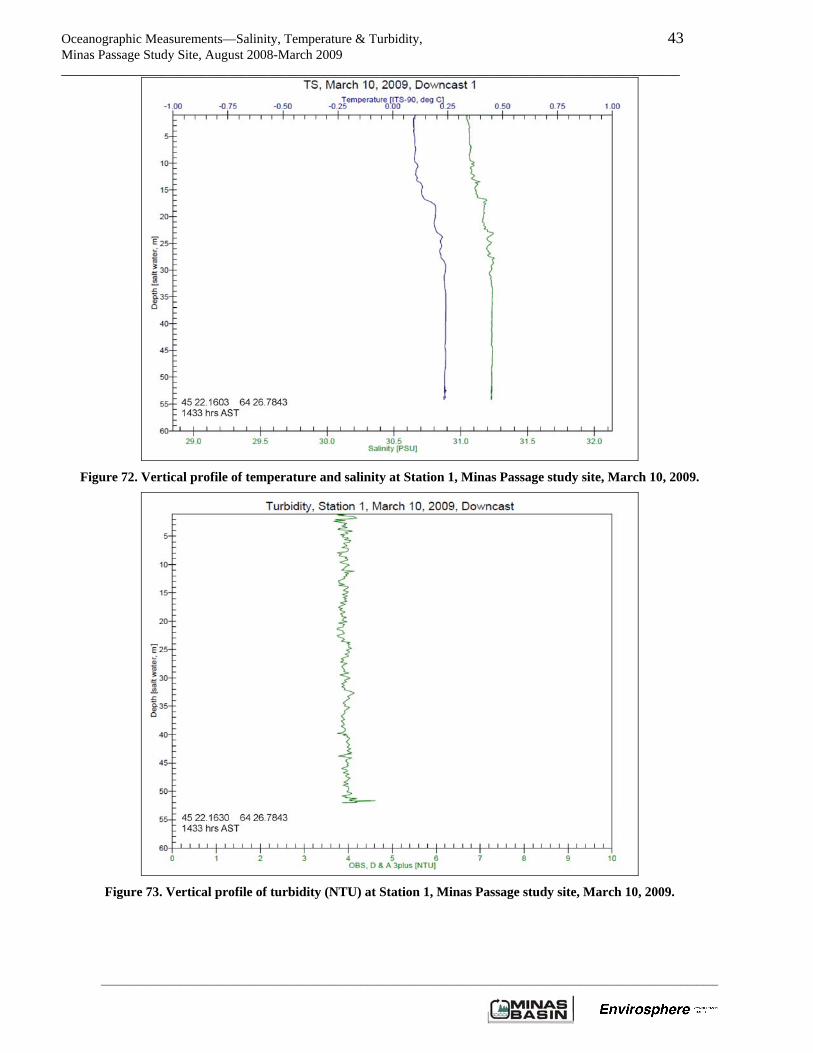
Figure 72. Vertical profile of temperature and salinity at Station 1, Minas Passage study site, March 10, 2009.
Figure 73. Vertical profile of turbidity (NTU) at Station 1, Minas Passage study site, March 10, 2009.
Oceanographic Measurements—Salinity, Temperature & Turbidity, 44 Minas Passage Study Site, August 2008-March 2009 _____________________________________________________________________________________________
____________________________________________________________________________________________________________________
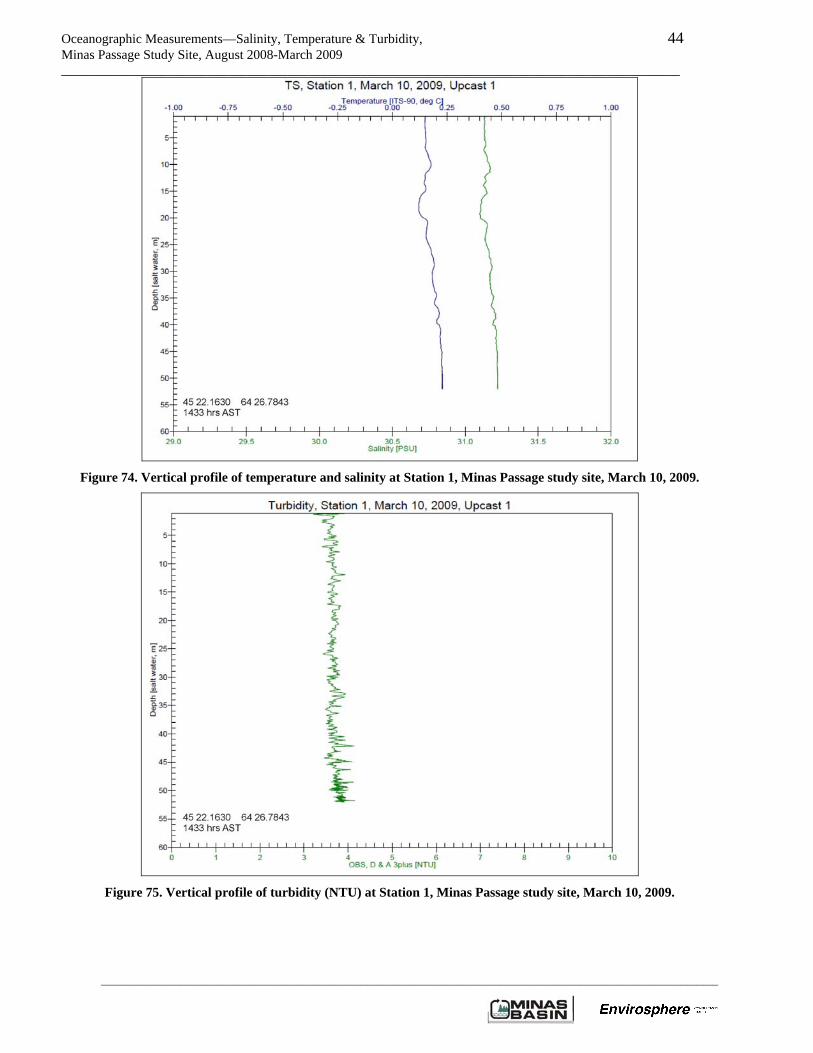
Figure 74. Vertical profile of temperature and salinity at Station 1, Minas Passage study site, March 10, 2009.
Figure 75. Vertical profile of turbidity (NTU) at Station 1, Minas Passage study site, March 10, 2009.
Oceanographic Measurements—Salinity, Temperature & Turbidity, 45 Minas Passage Study Site, August 2008-March 2009 _____________________________________________________________________________________________
____________________________________________________________________________________________________________________
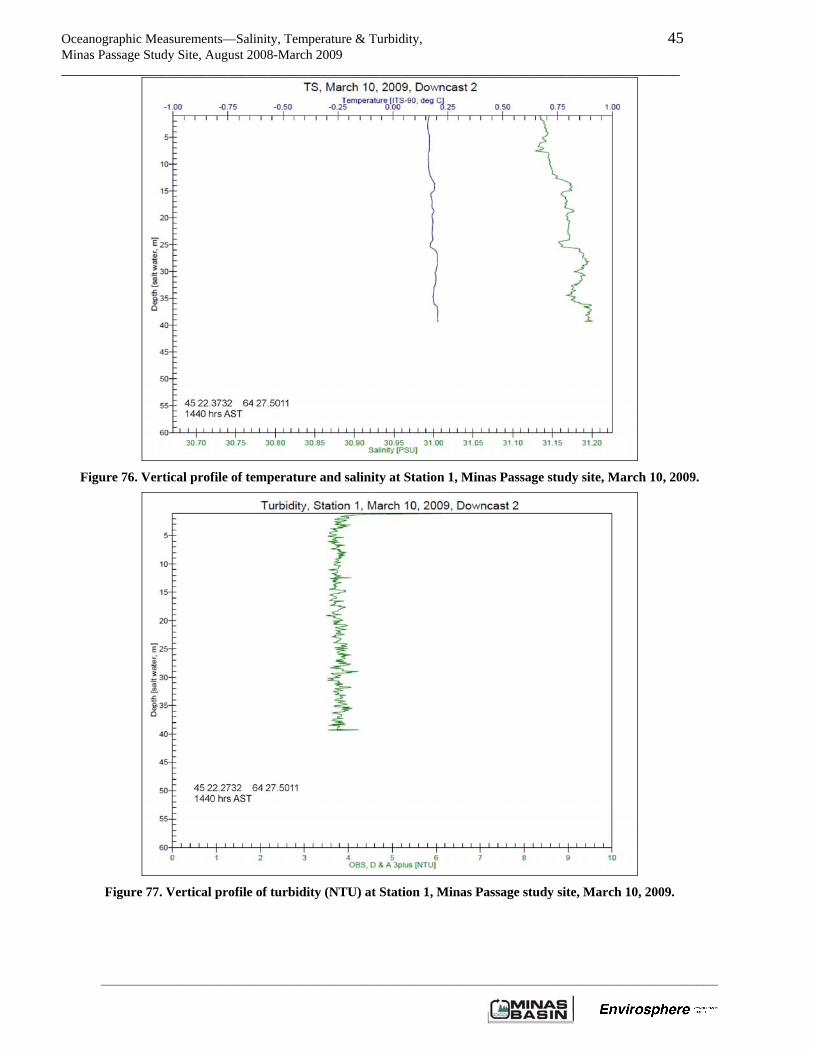
Figure 76. Vertical profile of temperature and salinity at Station 1, Minas Passage study site, March 10, 2009.
Figure 77. Vertical profile of turbidity (NTU) at Station 1, Minas Passage study site, March 10, 2009.
Oceanographic Measurements—Salinity, Temperature & Turbidity, 46 Minas Passage Study Site, August 2008-March 2009 _____________________________________________________________________________________________
____________________________________________________________________________________________________________________
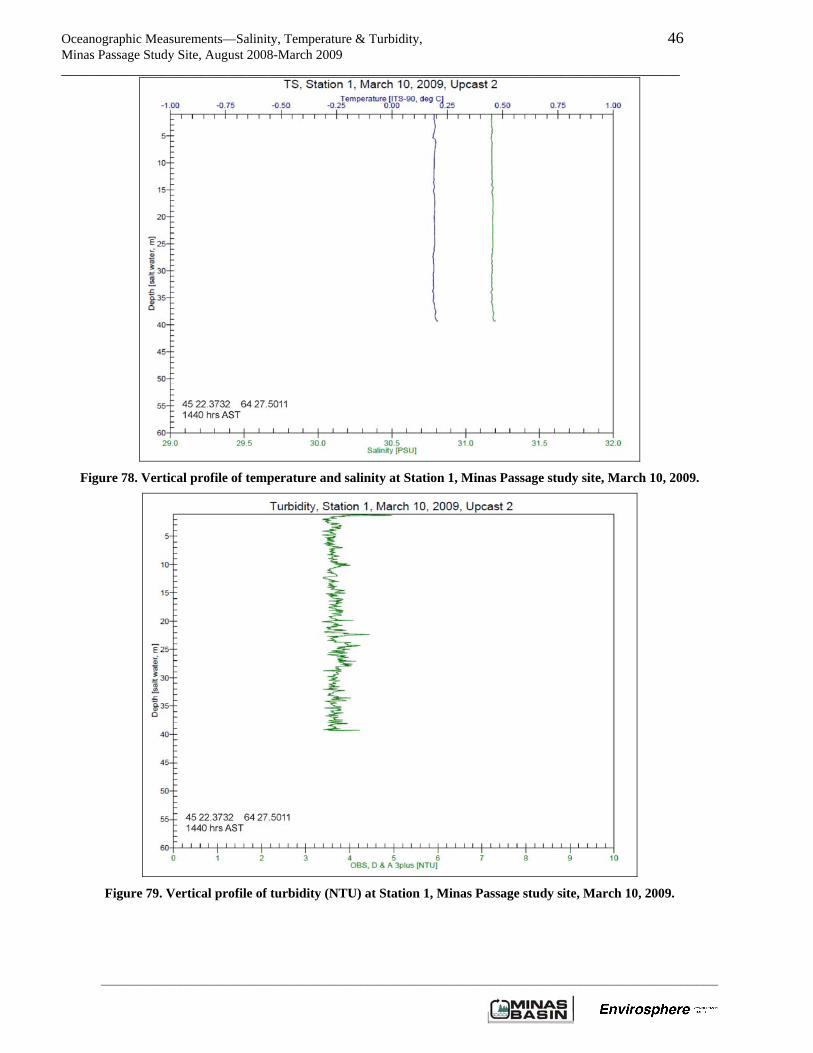
Figure 78. Vertical profile of temperature and salinity at Station 1, Minas Passage study site, March 10, 2009.
Figure 79. Vertical profile of turbidity (NTU) at Station 1, Minas Passage study site, March 10, 2009.