Embed Size (px)
Citation preview

i
Fundy Ocean Research Center for Energy
Environmental Effects Monitoring Programs Fundy Ocean Research Center for Energy (FORCE)
March 2016

ii
Executive Summary
TheFundyOceanResearchCenterforEnergy(FORCE)isCanada’sleadingresearchcentreforthedemonstrationandevaluationoftidalin-streamenergyconversion(TISEC)technology.TISECtechnology(commonlyreferredtoas“tidalenergyturbines”),isdesignedtogeneraterenewableenergyfromtidalresourcesitesacrossCanadaandtheglobe.FundamentaltoFORCE’smandateisthemonitoringandreportingofanyenvironmentaleffectsfromtidalturbinesattheFORCEsite.
FORCEisademonstrationproject,withberthsitesgrantedtoanumberoftechnologydevelopers(orberthholders)includingAtlantisOperationsCanada,DPEnergy,BlackRockTidalPower,CapeSharpTidalVentures,andMinasEnergy,ThegovernmentofNovaScotiahasgranted22.5megawatts(MW)ofTISECcapacityatFORCE,undertheprovince’sdevelopmentalfeed-intariffprogram.ThisrepresentsthedeploymentofapproximatelytwotothreeTISECturbinesbyeachdeveloperattheirberthsite.Asthesedeploymentsareexpectedtobephasedinoverthenextseveralyears,FORCEandregulatorswillhaveopportunitytoadaptenvironmentalmonitoringapproachesovertime,bothtobetterunderstandwhateffectsturbinesmayhaveontheenvironment,andtoreportonthemonitoringresultsandanyidentifiedeffectstothepublic.
EnvironmentalmonitoringhasbeenongoingatFORCEsince2007whenbackgroundstudieswereinitiatedfortheprojectEnvironmentalAssessment(EA).WhentheinitialEAwasapprovedbythefederalandprovincialgovernmentsin2009,thedevelopmentandimplementationofenvironmentaleffectsmonitoringprograms(EEMPs)werestipulatedintheTermsandConditionsofEAApproval.Inresponse,FORCEcompleted20monitoringstudiesbetween2009andlate2013,includingfishcharacterization,seabirds,marinemammals,lobstertracking,marinenoise,benthichabitat,electromagneticfields,andmore.TheresultsofthestudiesundertakentodatealongwiththeoriginalEAareavailableontheFORCEwebsite:http://fundyforce.ca/environment/.
AturbinewasoperationalattheFORCEsiteforashorttimein2009.Sinceremovalofthisunitin2010,notidalturbineshavebeenpresentattheFORCEsite.Consequently,theenvironmentalstudiesconductedbetween2009and2015havelargelyfocusedonthecollectionofbackgrounddata,ratherthanonmonitoringtheeffectsofturbines.Thissituationwillchangewiththeplanneddeploymentoftwocable-connectedturbinesin2016followedbyadditionaldeploymentsinsubsequentyears.
ThisreportdescribesnewEEMPsbasedondataandlessonslearnedfromtheenvironmentalstudiesconductedtodate.TheEEMPsaredesignedtosupplementbackgrounddatasetswhereneededbutareprimarilyaimedatverifyingpredictionsmadeintheEAandatmonitoringtheenvironmentaleffectsofoperatingturbines.TheEEMPsareintendedtomonitorpotentialeffectsfromtheinitialdemonstrationscaleproject,ratherthanfromapotentialcommercialscaleprojectthatmayoccurinthefuture.Tothisend,theEEMPsarelimitedtoeffectswithintheFORCECrownLeaseArea(CLA),anddonotattempttomeasureeffectsinthemuchlargerBayofFundy.
Monitoringprogramshavebeendevelopedforfivesubjectareas:Lobsters,Fish,MarineMammals,MarineSeabirdsandAcoustics(marinenoise).TheEEMPsareintendedtocoverinitialturbinedeploymentsoverthetimeperiod2016-2021.Theprogramsaredesignedtoaccommodateunforeseenchangesinturbinedeploymentschedulesandareadaptivetoinitialmonitoringresults.Itisalsoexpectedthatthedesignand/ormethodsofcertainprogramsmaybeupdatedinlateryearsonceearlyresultsareknown.WithintheCLAmeasuring1.0x1.6km,FORCEleasestoeachberthholderadedicatedberthsome200mindiameter.Theberthholderinturnwilldeploy,operateandtesttheirturbinetechnologies,whichwillbeconnectedtotheelectricalgridthroughdedicatedsubseacables.Giventheseoverlappingareas

iii
ofresponsibility,theberthholdersareresponsibleformonitoringwithina100mradiusoftheirturbines(theso-called“nearfield”effects),whileFORCEwillberesponsibleformonitoringoutsideofthiszonewithintheCLA(theso-called“midfield”effects).Berthholder-generatedEEMPswillbeavailabletoprovideacomprehensivepictureofallmonitoringthatwillbeundertakenwithintheCLA.FORCEwill:
• reportresultsfromboththeFORCEandberthholderEEMPstoregulators;and• makeallEEMPreportsavailabletothepublic.
TheFORCEEEMPsareintendedtobepractical,achievableusingavailabletechnologies,anddemonstrativeofnegativeornulleffects.Themonitoringapproachesalsoreflectthedifficultyinoperatinginthishighenergyenvironmentandcertaintechnologicallimitationsinherentinsomeoftheequipmentthatwillbeemployed.However,throughtheseEEMPs,FORCEintendstoprogressivelyverifytheenvironmentaleffectpredictionsmadeintheoriginalEAoverthenextfiveyears.Asummaryoftheprogramsispresentedinthetableattheendofthisreport.
FORCE March 2016 Environmental Effects Monitoring Program
FORCE iv
TABLEOFCONTENTS
INTRODUCTION ...................................................................................................................... 61.0 FORCE .......................................................................................................................... 61.1 Context ......................................................................................................................... 91.2
1.2.1 FORCE’sEAApproval ........................................................................................... 91.2.1 EEMPDevelopment ............................................................................................. 9
Objectives ................................................................................................................... 111.3 BerthHolderEEMPs ..................................................................................................... 121.4 EMACRecommendations ............................................................................................. 121.5 RegulatorReview ........................................................................................................ 121.6
SECTION2:LOBSTERS ............................................................................................................ 132.0 Objectives ................................................................................................................... 132.1 Methodology .............................................................................................................. 132.2
2.2.1 Overview .......................................................................................................... 132.2.2 MidFieldStudyDesign ....................................................................................... 132.2.3 MultipleTurbines ............................................................................................... 14
2.3Discussion ...................................................................................................................... 15 SECTION3:FISH .................................................................................................................... 173.0
Introduction ................................................................................................................ 173.1 Objectives ................................................................................................................... 173.2 MonitoredVariables .................................................................................................... 183.3 Methodology .............................................................................................................. 193.4
3.4.1 BoatPlatformandAcousticSurveySystem .......................................................... 193.4.2 SurveyDescription ............................................................................................. 193.4.3 Schedule ........................................................................................................... 213.4.4 DataProcessing ................................................................................................. 223.4.5 DataAnalysis .................................................................................................... 22
SECTION4:MARINEMAMMALS ............................................................................................. 244.0 Introduction ................................................................................................................ 244.1 EEMPContext ............................................................................................................. 244.2 EEMPObjectives ......................................................................................................... 254.3 Methodology .............................................................................................................. 264.4
SECTION5:ACOUSTICS(MARINENOISE) ................................................................................. 335.0 Introduction ................................................................................................................ 335.1 Objectives ................................................................................................................... 345.2 Methodology .............................................................................................................. 355.3
SECTION6:MARINESEABIRDS ............................................................................................... 376.0 Introduction ................................................................................................................ 376.1 Objectives ................................................................................................................... 376.2 Methodology .............................................................................................................. 376.3
6.3.1 MonitoringApproach ......................................................................................... 376.3.2 StudyDesign ..................................................................................................... 386.3.3 SamplingFrequency ........................................................................................... 386.3.4 EEMPFieldSurveys ............................................................................................ 396.3.5 ShoreBasedSurveys .......................................................................................... 39

FORCE March 2016 Environmental Effects Monitoring Program
FORCE v
6.3.6 DataAnalysis .................................................................................................... 41 SECTION7:SUMMARY .......................................................................................................... 427.0 SECTION8:REFERENCES ........................................................................................................ 458.0
LISTOFACRONYMS
CLA CrownLeaseArea
CSAS CanadianScienceAdvisorySecretariat
DFO FisheriesandOceansCanada(formerlytheDepartmentofFisheriesandOceans)
EA EnvironmentalAssessment
EC EnvironmentCanada
EEMP EnvironmentalEffectsMonitoringProgram
EMF ElectromagneticField
EMAC EnvironmentalMonitoringAdvisoryCommittee
FAST FundyAdvancedSensorTechnology
FORCE FundyOceanResearchCenterforEnergy
MARS MarineAnimalResponseSociety
MW Megawatt
NSE NovaScotiaEnvironment
TISEC TidalIn-StreamEnergyConversion
FORCE March 2016 Environmental Effects Monitoring Program 1.0 INTRODUCTION
FORCE 6
INTRODUCTION1.0
FORCE1.1
TheFundyOceanResearchCentreforEnergy(FORCE)isCanada’sleadingresearchfacilityfortidalenergytechnologylocatedintheMinasPassage,BayofFundy.FORCEisaprivate,not-for-profitdemonstrationfacility,withfundingsupportfromtheGovernmentofCanada,theProvinceofNovaScotia,EncanaCorporation,andparticipatingdevelopers.
FORCEwasdesignedtoexplorethepotentialfortidalin-streamenergyconversion(TISEC)technology–resemblinganunderwaterwindmill–tocontributetoNovaScotiaandCanada’srenewableenergysupply,andleveragetheregion’sexistingexpertiseintheoceansciencesector.
FORCEhasfourkeyroles,including:
- Host:Providingdeveloperswithanapprovedoffshoredemonstrationarea,onshoreandoffshoreelectricalequipment,anoperationsfacility,andconnectiontothetransmissiongrid.
- Monitoring:Asmentionedabove,since2009,FORCEhasconductedanindependentlyreviewedenvironmentaleffectsmonitoringprogram(EEMP),andhassharedresultswiththepublic.
- Research:FORCEsupportsnewtoolstocharacterizetheresourceandadvancenewmonitoringtechniques.Thisincludesbothonshoreradarandweatherinformationaswellasoffshoreunderwatermonitoringplatforms–allpartofaprogramcalledFAST(FundyAdvancedSensorTechnology).
- Engagement:FORCEconnectsindustry,government,academiaandthepublicinanefforttoensuredevelopmentactivityintheBayofFundyistransparentandviable.
TheFORCEprojectcurrentlyconsistsoffiveunderseaberthsforTISECsubseaturbinegenerators(tobeinstalled),foursubseapowercablesthatwillconnecttheturbinestoland-basedinfrastructure,anonshoresubstation,andpowerlinesconnectedtotheNorthAmericanpowertransmissionsystem.Themarineportionoftheprojectislocatedinaleasedareafromtheprovince(FORCE’sCrownLeaseArea,orCLA),1.6-kmby1-kminarea,intheMinasPassage,andtheonshorefacilitiesarelocatedapproximately10kmWestofParrsboro,NovaScotia.
Todate,accesstoFORCEberthsiteshasbeenawardedviaaprovincialtenderissuedbytheNovaScotiaDepartmentofEnergy.FORCEdevelopershavereceivedapprovalthroughNovaScotia’sdevelopmentalfeed-intariffprogramforatotalof22.5megawatts(MW)ofelectricity:
·MinasEnergy,4MW
·BlackRockTidalPower,5MW
·AtlantisOperationsCanada,4.5MW
·CapeSharpTidalVenture,4MW

FORCE March 2016 Environmental Effects Monitoring Program 1.0 INTRODUCTION
FORCE 7
·DPEnergy,4.5MW
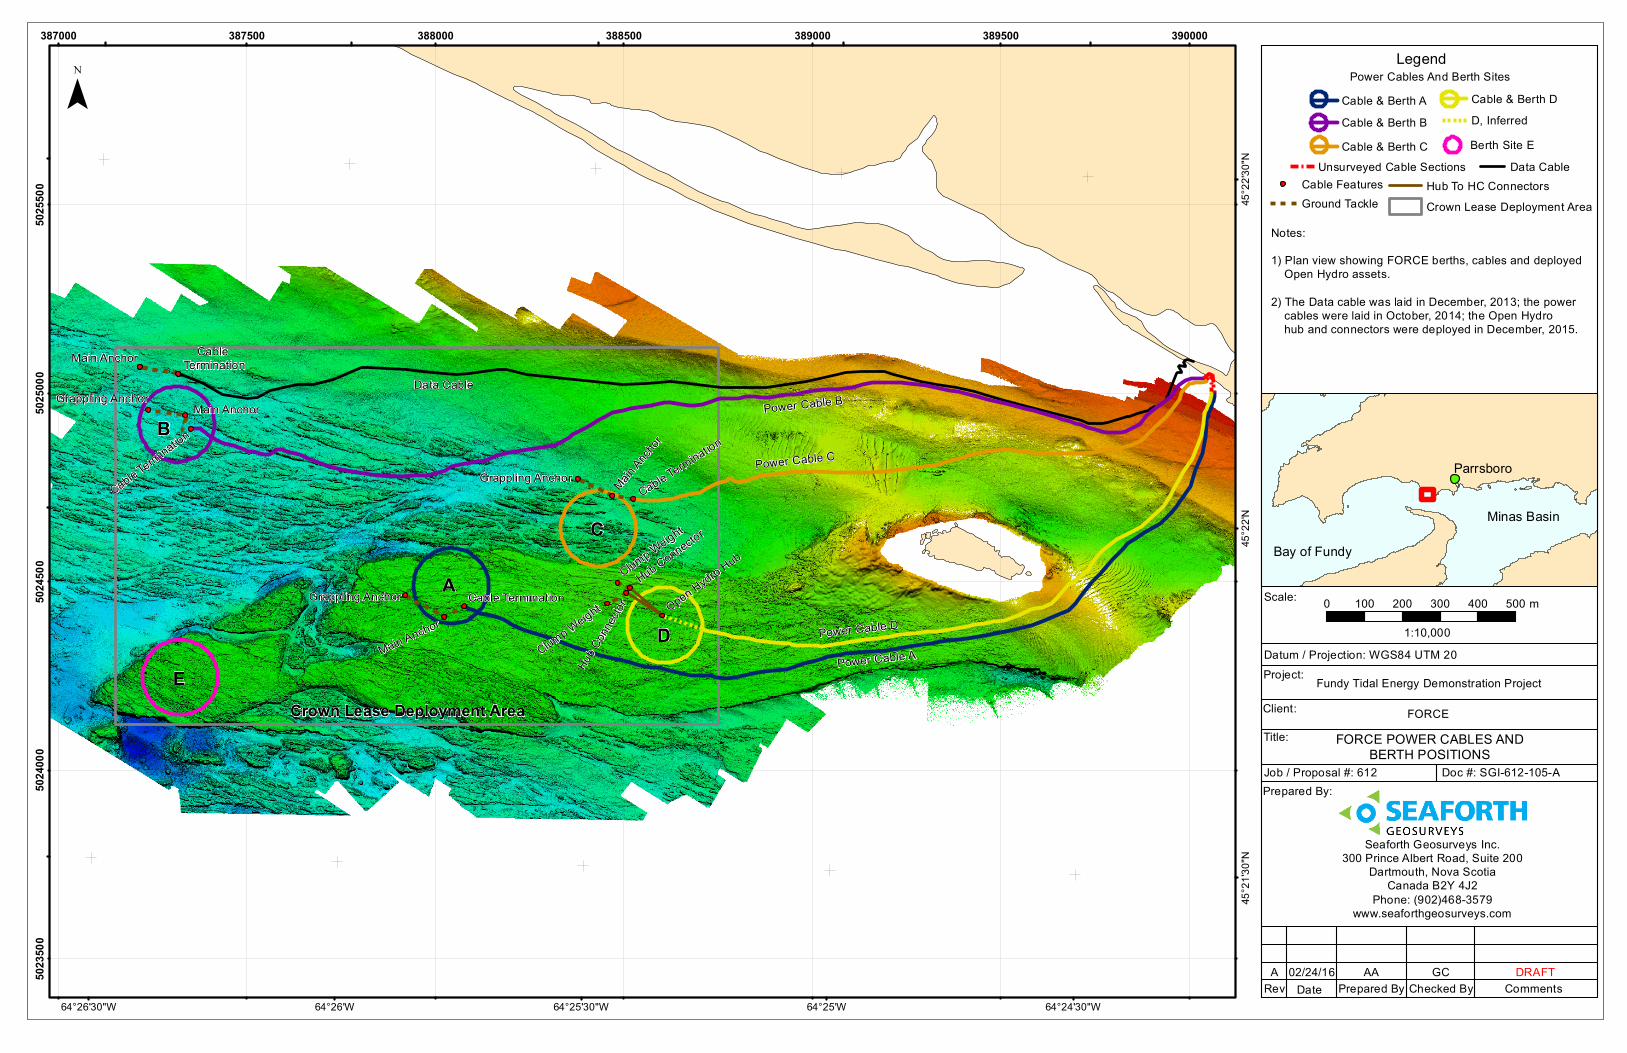
Theapprovalallowsthedeveloperstoenterintoa15-yearpowerpurchaseagreementwithNovaScotiaPower.Figure1showstheFORCEfacilityintheMinasPassage,includingthemarinedemonstrationarea,berthsitesandcablesroutes.
Figure1:FORCESiteincludingberthsandpowercablelocations
(proceedingpage)
Crown Lease Deployment Area
Cable Termination
Cable Termination
Cable Termination
Cable Termination
Main Anchor
Main Anchor
Main AnchorMain
Anchor
Grappling Anchor
Grappling Anchor
Grappling Anchor
Clump Weight
Clump Weight
Hub C
onne
ctor
Hub Connector
Open Hydro Hub
Data CablePower Cable B
Power Cable C
Power Cable D
Power Cable AE
D
A
C
B
64°24'30"W64°25'W64°25'30"W64°26'W64°26'30"W
45°2
2'30"N
45°2
2'N45
°21'3
0"N
387000 387500 388000 388500 389000 389500 39000050
2350
050
2400
050
2450
050
2500
050
2550
0
Bay of Fundy
Minas Basin
Parrsboro
¯
Seaforth Geosurveys Inc.300 Prince Albert Road, Suite 200
Dartmouth, Nova ScotiaCanada B2Y 4J2
Phone: (902)468-3579www.seaforthgeosurveys.com
Rev Date Prepared By Checked By Comments
Prepared By:Job / Proposal #: 612 Doc #: SGI-612-105-A
Title:
Client:
Project:
1:10,000
0 100 200 300 400 500 m
A 02/24/16 AA
Scale:
Datum / Projection: WGS84 UTM 20
Notes: 1) Plan view showing FORCE berths, cables and deployed Open Hydro assets.
2) The Data cable was laid in December, 2013; the power cables were laid in October, 2014; the Open Hydro hub and connectors were deployed in December, 2015.
FORCE
Fundy Tidal Energy Demonstration Project
FORCE POWER CABLES ANDBERTH POSITIONS
Legend
DRAFTGC
Cable FeaturesGround Tackle
Hub To HC ConnectorsCrown Lease Deployment Area
Power Cables And Berth Sites
Berth Site E
Cable & Berth ACable & Berth BCable & Berth C
D, InferredCable & Berth D
Unsurveyed Cable Sections Data Cable
FORCE March 2016 Environmental Effects Monitoring Program 1.0 INTRODUCTION
FORCE 9
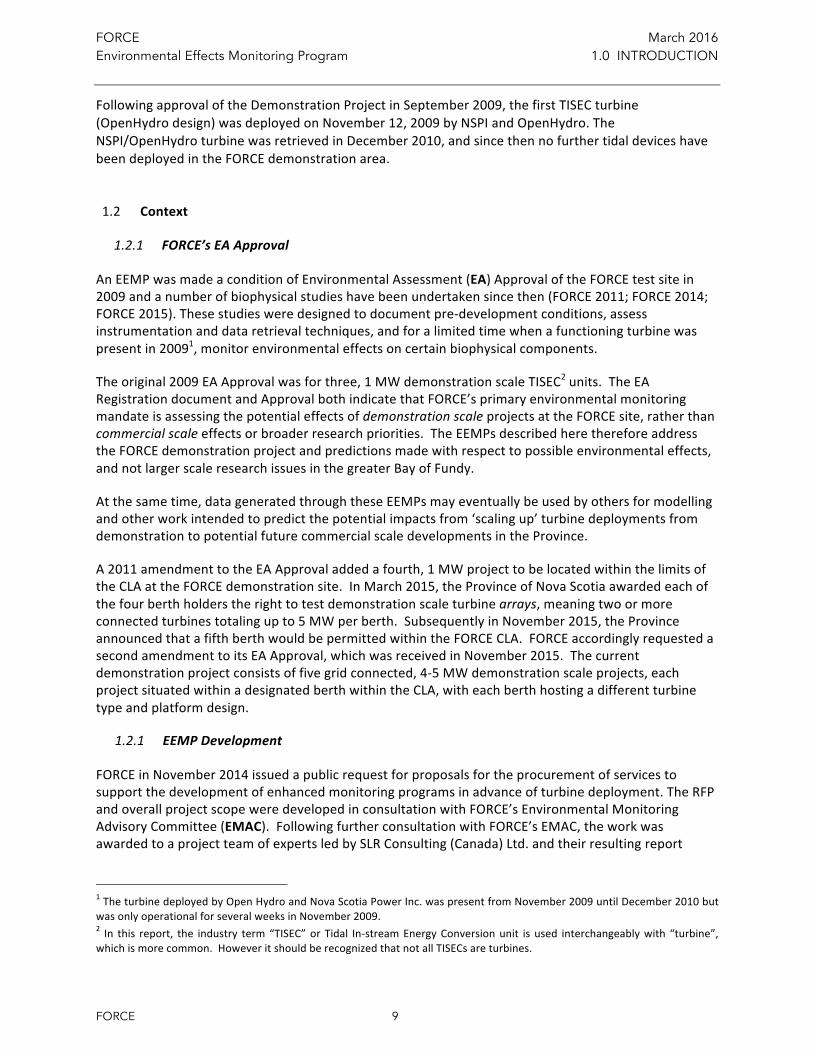
FollowingapprovaloftheDemonstrationProjectinSeptember2009,thefirstTISECturbine(OpenHydrodesign)wasdeployedonNovember12,2009byNSPIandOpenHydro.TheNSPI/OpenHydroturbinewasretrievedinDecember2010,andsincethennofurthertidaldeviceshavebeendeployedintheFORCEdemonstrationarea.
Context1.2
1.2.1 FORCE’sEAApproval
AnEEMPwasmadeaconditionofEnvironmentalAssessment(EA)ApprovaloftheFORCEtestsitein2009andanumberofbiophysicalstudieshavebeenundertakensincethen(FORCE2011;FORCE2014;FORCE2015).Thesestudiesweredesignedtodocumentpre-developmentconditions,assessinstrumentationanddataretrievaltechniques,andforalimitedtimewhenafunctioningturbinewaspresentin20091,monitorenvironmentaleffectsoncertainbiophysicalcomponents.
Theoriginal2009EAApprovalwasforthree,1MWdemonstrationscaleTISEC2units.TheEARegistrationdocumentandApprovalbothindicatethatFORCE’sprimaryenvironmentalmonitoringmandateisassessingthepotentialeffectsofdemonstrationscaleprojectsattheFORCEsite,ratherthancommercialscaleeffectsorbroaderresearchpriorities.TheEEMPsdescribedherethereforeaddresstheFORCEdemonstrationprojectandpredictionsmadewithrespecttopossibleenvironmentaleffects,andnotlargerscaleresearchissuesinthegreaterBayofFundy.
Atthesametime,datageneratedthroughtheseEEMPsmayeventuallybeusedbyothersformodellingandotherworkintendedtopredictthepotentialimpactsfrom‘scalingup’turbinedeploymentsfromdemonstrationtopotentialfuturecommercialscaledevelopmentsintheProvince.
A2011amendmenttotheEAApprovaladdedafourth,1MWprojecttobelocatedwithinthelimitsoftheCLAattheFORCEdemonstrationsite.InMarch2015,theProvinceofNovaScotiaawardedeachofthefourberthholderstherighttotestdemonstrationscaleturbinearrays,meaningtwoormoreconnectedturbinestotalingupto5MWperberth.SubsequentlyinNovember2015,theProvinceannouncedthatafifthberthwouldbepermittedwithintheFORCECLA.FORCEaccordinglyrequestedasecondamendmenttoitsEAApproval,whichwasreceivedinNovember2015.Thecurrentdemonstrationprojectconsistsoffivegridconnected,4-5MWdemonstrationscaleprojects,eachprojectsituatedwithinadesignatedberthwithintheCLA,witheachberthhostingadifferentturbinetypeandplatformdesign.
1.2.1 EEMPDevelopment
FORCEinNovember2014issuedapublicrequestforproposalsfortheprocurementofservicestosupportthedevelopmentofenhancedmonitoringprogramsinadvanceofturbinedeployment.TheRFPandoverallprojectscopeweredevelopedinconsultationwithFORCE’sEnvironmentalMonitoringAdvisoryCommittee(EMAC).FollowingfurtherconsultationwithFORCE’sEMAC,theworkwasawardedtoaprojectteamofexpertsledbySLRConsulting(Canada)Ltd.andtheirresultingreport
1TheturbinedeployedbyOpenHydroandNovaScotiaPowerInc.waspresentfromNovember2009untilDecember2010butwasonlyoperationalforseveralweeksinNovember2009.2 In this report, the industry term“TISEC”or Tidal In-streamEnergyConversionunit is used interchangeablywith “turbine”,whichismorecommon.HoweveritshouldberecognizedthatnotallTISECsareturbines.

FORCE March 2016 Environmental Effects Monitoring Program 1.0 INTRODUCTION
FORCE 10
(“Consultant’sReport”postedhere:fundyforce.ca/environment/monitoring/)formsthebasisfortheFORCEEEMPsdescribedbelow.PleaserefertotheConsultant’sReportformoredetailregardingtheprojectteam,pastresearchstudiesintheBayofFundyandadditionalrationaleforeachstudymethodologysummarizedbelow.
FollowinginitialdiscussionswithFORCEandEMAC,thestudydesignsindraftformwerepresentedtoFisheriesandOceansCanada(DFO),NovaScotiaDepartmentoftheEnvironment(NSE),andthejointfederal-provincial“OneWindow”StandingCommitteeontidalenergy.Concurrently,CapeSharpTidalVenture3presentedtheirEEMPtotheCommittee.
Atthesametime,FORCEupdatedandsoughtinputfromlocalfishersandFirstNationrepresentativeswithrespecttopastmonitoringstudyresultsandprogressontheEEMPmandate.FishersandFirstNationrepresentativesarealsomembersofEMACandattendedEEMPproject-relatedmeetingsandpresentationsrelatedtothedevelopmentofthenewEEMP.
TheEEMPsareprimarilydesignedtoverifytheimpactpredictionsmadeintheEA(AECOM2009;AECOM2010).TheyarebasedonthemonitoringrequirementsfirstdescribedintheTermsandConditionsofEnvironmentalAssessmentApproval(NSE2009),whichrequirethattheEEMPconsider:
• Fishandlobster• Marinebirds• Marinemammals• Acoustics(MarineNoise)• Physicaloceanography• Currentsandwaves• Benthicenvironment
OfthesesubjectareasandbasedoninputbyFORCE’sEMAC,thepresentEEMPislimitedtomonitoringprogramsforfish,lobster,marinemammals,marinebirds(seabirds)andacoustics(marinenoise).Thisisbecause:
• Giventheworkalreadyundertakenonthedifferentphysicaloceanographiccomponents(includingcurrentsandwaves),bothDFOandEMAChaveindicatedthatadditionaloceanographicmeasurementsarenotneededforademonstrationscaleprojectatthistime(DFO2012;EMAC2011).Nevertheless,ongoingmeasurementsofcurrents,tidesandotheroceanographicparameterswillbeundertakenbybothFORCEandtheberthholdersaspartoftheiroperationalactivities.Asanexampleoftheseactivities,FORCEisdeployinganumberofautonomousinstrumentplatformsaspartofitsongoingcommitmenttodevelopinginnovativeresearchandmonitoringtechniquesinhighcurrentenvironments.MoredetailontheFundyAdvancedSenorTechnology(FAST)platformscanbefoundontheFORCEwebsiteathttp://fundyforce.ca/fast/
• FORCEisnotcurrentlyplanningtomonitorthemidfieldbenthic(seabottom)environmentbecauseitisanticipatedthatthemostpronouncedeffects,i.e.scouring,maybeobservedinthenearfieldclosetotheturbines.FORCEwillworkwiththeberthholderstoconductthenearfieldbenthicmonitoring.Additionally,thebenthicbiotaontheexposed,current-scouredseabedwithintheCLA
3 Cape Sharp Tidal Venture is a joint venture between Emera Inc. and OpenHydro, a DCNS Company, formed to deployOpenHydro-designedturbinesattheFORCEsite.
FORCE March 2016 Environmental Effects Monitoring Program 1.0 INTRODUCTION
FORCE 11
wascharacterisedduringinitialbackgroundstudiesasrathercommonintheBayofFundy.Thishabitatexhibitslittlebiologicaldiversityorunusualspeciescomposition.Giventhesecharacteristics,anefforttodocumentminimal(ifany)actualchangestothemidfieldbenthicenvironmentwasthoughttobeanunproductiveuseoftheresourcesavailableformonitoring.
TheConsultantdidnotdevelopanEEMPforthesubjectofelectromagneticfields(EMFs).ThepotentialenvironmentaleffectsofEMFsweredescribedasbeingessentiallynegligibleinthe2009EAandsubsequentlywerenotlistedintheConditionsofEAApprovalasrequiringatopic-specificEEMP.Inaddition,adetailedliteraturereviewonthissubjectcommissionedbyFORCEin2012concludedthatinjuryorotheradverseeffectsareunlikelytoeventhemostEMF-sensitivemarineorganisms(Collins2012;seealsoWoodruffetal.2013).AsrecommendedinCollins(2012),FORCEwillcontinuetomonitortheemerginginternationalresearchliteratureregardingtheeffectsofEMFsonmarinebiota.
Objectives1.3
Globally,in-streamtidalenergyprojectsaredevelopingbeyondsingleunitdeploymentstolarger,demonstration(pre-commercial)andcommercialscalearrays,andFORCEisfollowingthedevelopmenttrajectoryofdemonstration(pre-commercial)arrays.Aspartofitsmandate,FORCEistaskedwithmonitoringandevaluatingtheenvironmentaleffectsoftheactivitiesundertakenatitssite,andreportingontheseeffectstothepublic.FORCEisnottaskedwithdeterminingpotentialeffectsfrompossiblefuturecommercialscaleprojects,sinceFORCEisademonstrationprojectandcommercialisationfallsoutsideofFORCE’smandate.Itisalsoimportanttounderlinethatitisunusuallydifficult(andexpensive)todeploy,manageandretrievemonitoringequipmentatthishighenergysite.TheFORCEEEMPsarebasedonpastexperienceinMinasPassageandthebestavailablescientificadviceregardingmonitoringapproachesandinstrumentation.TheEEMPisiterativeandwilllikelychangeasearlyresultssuggestnewapproachesordifferentinstruments.
TheultimateobjectiveistoimplementEEMPsthatwillallowtheassessmentofenvironmentaleffectsoncriticalecosystemswithintheFORCEprojectareaandnearbywatersoverthenextphaseofturbinedeployment.Ingeneral,theseprogramshavebeendesignedforthenextfiveyears,andareresponsivetochangesinturbinedeploymentschedulesandadaptabletotheultimateturbinepositionswithintheFORCECLA.TheoverarchingpurposeofeachEEMPistoverifytheaccuracyoftheenvironmentaleffectpredictionsmadeintheEAandmaintaincompliancewithconditionsofprovincialandfederalapprovals.Incontrasttotheresearch-orientedfocusofpastworkundertakenatFORCEtocharacterisebaselineconditions,theseEEMPsareaimedspecificallyatpost-deploymenteffectsmonitoring.
Asnotedabove,theEEMPsaredesignedtobeflexibleandadaptivetotheTISECdeploymentschedules.Inkeepingwiththe“adaptivemanagement”approachthatwasrecommendedbyregulatorsandFORCEsincethebeginningoftheFORCEproject,modificationstotheEEMPs(ifneeded)canbeimplementedoncedeploymentschedulesarebetterknown.Adaptivemanagementisaniterativeapproachthatapplieslessonslearnedfrompaststudiestoinformthedesignoffutureprograms.Italsoattemptstoincorporatechangingexpectationsexpressedbyregulators,thepublicandtheberthholders.Asmoreturbinesaredeployed,actualeffectsmaydifferfromeffectsmeasuredatsingledevicesandtheEEMPscanbeadjustedtoaccountforthis.

FORCE March 2016 Environmental Effects Monitoring Program 1.0 INTRODUCTION
FORCE 12
BerthHolderEEMPs1.4
Eachberthholderistaskedwithmonitoringwithin100moftheirturbinesandthuswilldeveloptheirownEEMPs.BerthholderEEMPs(oncereviewedbytheregulators)willbemadeavailableinordertoprovideacomprehensivepictureofallmonitoringthatwillbeundertakenwithintheCLA.Thenewberthholder’sEEMPswillbeavailablepriortotheirturbinedeployment.FORCEwill:
a) beresponsibleforreportingtheresultsfromboththeFORCEandberthholderEEMPstoregulators,andsubsequently
b) makethereportsavailabletothepublic.
EMACRecommendations1.5
FORCE’sEMACplayedakeyroleinreviewingandcritiquingdraftmonitoringprogrammethodsandreviewingthefinalEEMPs.EMACismadeupofindependentscientificexpertsandrepresentativesfromFirstNationsandthelocalfishingindustry.TheCommitteeistaskedwithprovidingadviceontheadequacyofthemonitoringprogramsthatFORCEisrequiredtodevelopandimplementundertheEAApproval.AlistofEMACmembers,theCommittee’sTermsofReferenceandtheircommentsregardingtheEEMPareavailableontheFORCEwebsite:fundyforce.ca/about/advisory-committees/
AsindicatedinEMAC’sRecommendationsRegardingtheFORCEEnvironmentalEffectsMonitoringProgram(EEMP)for2016andBeyond,(fundyforce.ca/environment/monitoring/),EMACsupportsthemonitoringapproachesforeachsubjectareaasdescribedinthisreport.EMACrecommendationsorsuggestionsaimedatindividualmonitoringprogramshavebeenincorporatedwhereapplicableintothechaptersbelow.
RegulatorReview1.6
PreliminaryadviceontheConsultant’sReportwasalsoreceivedfromtheNovaScotiaDepartmentofEnvironment(NSE),DFOandEnvironmentCanada(EC),whichhavebeentakenintoconsiderationwhendesigningthemonitoringprogramsdescribedbelow.Furtheradvicewillbeprovidedbytheregulatorsovertime,aspartoftheAdaptiveManagementapproach.
FORCE March 2016 Environmental Effects Monitoring Program 2.0 LOBSTERS
FORCE 13
SECTION2:LOBSTERS2.0
Objectives2.1
AsdescribedintheEA,asignificantadverseeffectisdefinedasonethatcreatesasignificantalterationtoapopulation(oraportionofit)tocauseanunnaturaldeclineorchangeintheabundanceordistributionofthepopulationtoalevelfromwhichrecoveryofthepopulationisuncertain,overonegenerationormore.
Inordertomeasurea“significantalterationinapopulation”sothatanynegativeeffectscanultimatelybedetermined,knowledgeoftheabundanceandmovementoflobstersintheMinasPassageduringvarioustimesoftheyearisneeded.Pastlobstercatchabilitystudiescombinedwithacoustictaggingsurveyshaveprovidedsufficientbackgroundinformationtoestablish,ingeneralterms,relativeabundanceandseasonalmovementpatterns.PleaserefertotheConsultantReportforadetailedreviewofpastworkinMinasPassageonthesubjectoflobster.SincecommercialfishingwastheprimaryconcernidentifiedintheEA,theEEMPbelowisdesignedtoanswerthequestion:doesthepresenceoftheturbineaffectthenumberorweightoflobsterenteringthetraps?
Methodology2.2
2.2.1 Overview
Theprimaryenvironmentaleffectsvariablethatwillbemonitoredisthenumberoflobstercaughtpertrap,combinedwith(assuggestedbyDFO2012)theweightoflobstercaughtpertrap.Asinpastcatchabilitystudiesthatusestandard,baitedcommerciallobstertraps,theprimaryevaluationofeffectswilluseAnalysisofVariancetocomparecatchabilityatdefineddistancesfromtheturbine(s).
DespitethelimitationsanddifficultiesimposedbytheBayofFundymarineenvironment,thepriorlobstercatchabilitystudiesdemonstratedthatasimpleBeforeAfterControlImpact(BACI)studycanprovideusefulenvironmentaleffectsmonitoringdata.Bayley(2010)determinedthenumberofsamples(traps)neededtodetectachangeinlobstercatchabilitywithsufficientstatisticalreliability.Basedonpreliminaryresults,areductionincatchof2lobsterspertrapwasconsideredsignificant.
2.2.2 MidFieldStudyDesign
Thetextbelowdescribesamid-fieldEEMPwithoneturbineatthecenterofthemonitoringprogram.Thestudydesignproposessamplecollectionfromrandomsamplestationslocatedwithintworingsaroundtheturbine:oneringat300-350mfromtheturbine(calledthe“treatmentring”)andoneringat450-500m(calledthe“controlring”).Bothringswouldbedividedintofourquadrats(east,west,northandsouth)andsamplesiteswouldberandomlyassignedineachringwithineachquadrant.Ideally,thequadratsshouldbealignedwiththetidalcurrentdirectionsothatdirectionaleffectsinfrontofandbehindtheturbineinactioncanbecomparedwithresultsinquadratsbesidetheoperatingturbine.
Thedouble-ring-and-quadratapproachisproposedtoaccountforpossibledirectionaleffectsduetowatercurrentsandnoisefromtheturbine,andtoallowforcurrent-inducedtrapmovement.
Regardingthetotalnumberofsamplestations,Bayley(2010)suggestsitisimportanttohaveasufficientnumberofback-upsamplestoensureasbalancedadesignaspossible.Atotalof24randomizedsample

FORCE March 2016 Environmental Effects Monitoring Program 2.0 LOBSTERS
FORCE 14
stations,12ineachring,isproposed.Withtworings(oneat300-350mandoneat450-500m),thismeanssixstationsineachquadrant.
Itisfurtherproposedthatallstationsaresampledthreetimestocompleteonesurvey.Bayley(2010)notesthatthreereplicationsandsixstationsperquadrat“wouldprovidegoodinsuranceforsinglelossesinlocationsorsitereplications,andstillretaintemporalandspatialreplication…”
Ifallsamplescouldbecompleted,thetotalsamplespersurveywouldbe72(24stationssampled3times),meaning36samplesforthe“treatmentring”and36samplesforthe“controlring,which,Bayleynotes,providesgoodpowerforthemaintreatment/controleffect.Abalanceddesignof72samplespersurveywillprovidedatatoevaluate:
1. Differencesincatchabilitywithdistancefromtheturbine(“distanceeffects”);2. Differencesincatchabilityinfront/behindvsbesidetheturbine(“directionaleffects”);3. Allowanceforlossofsamples(traps);and4. Comparabilitywithexistingdata.
Iftheresultsofthisstudydonotdetectastaticallysignificantchangeinlobstercatchability,ortheeffectsofadetectedchangearesolowastoensurethatnosignificanteffectsonthecommercialharvestwillbefelt,thentheEEMPcanbediscontinuedafteraminimumofthreesurveys.Afullthreesurveysareproposedtocaptureprogressivedevicedeploymentsovertime.Theactualnumberofsurveyscompletedwilldependonthedeploymentscheduleandinitialresults.
CEF(2010)reportsthatapproximately15stationscanbesampledroutinelyinatypicalday.Morestationscanbesampledatloweramplitudetidesbecausethesurveyvesselcanspendmoretimeinthewaterandtrapsremainclosertotheirsetlocation.Atextremehightides,buoysmayremainatthesurfaceforlessthan30minutesateachslacktide,allowingrecoveryofrelativelyfewtraps.Thisexperienceimpliesthatallstationscanbesampledoverthecourseoftwodays,andthatasinglesurveyconsistingofthreereplicateswouldrequireatotalof6days,notincludingpreparation,trapsettinganddataanalysis.
Giventhattwoturbineswillbeinstalledin2016withinBerthD,thestudydesignproposedabovecanbeeasilymodifiedtoaccommodatetwoturbineswithinasingleberth,asisproposedforBerthD.Thetwoturbineswillbelocatedwithin200mofeachothersincetheberthdiameteris200m,andsocanbetreatedasasingleunit.Oncetheexactplacementoftheturbinesisknown,theringdistancecanbeadjustedtoincludeandeffectivelyrepresentbothturbines.AswiththeotherEEMPs,studytimingwilldependontheturbinedeploymentschedule.
2.2.3 MultipleTurbines
Secondinpriorityisthequestionoffar-fieldeffects.AsBayley(2010)observes:aretherelargerscaleconsequences(i.e.,outsideof500mfromtheturbine)oftheturbinepresence?
Itisunlikelythatsignificanteffectsinthefarfieldwillbedetectedwithonlyoneortwoturbinesinstalled.Giventhis,FORCEproposestodeferanyfar-fieldstudiesuntilthreeormoreturbinesaredeployed,asrecommendedintheConsultant’sReport.Oncethreeormoreturbinesareinstalled,thestudycanbeexpandedasperDesignBintheConsultantReport,ifdeemedappropriate.
Atthistime,itappearsthefirsttwoturbineswillbedeployedin2016inBerthDandthenextturbineswillbedeployedin2017inBerthB,over1000maway.Thegreatdistanceseparatingthesetwoturbine
FORCE March 2016 Environmental Effects Monitoring Program 2.0 LOBSTERS
FORCE 15
berthssuggeststherewillbelimitedinterferenceoroverlapinenvironmentaleffectsbetweenthem.Giventhis,theyarebestmonitoredasseparateinstallations;themidfieldstudydesigncanbeappliedtotheBerthBturbines.Whenthenextberthisoccupied,studydesignsmaybemodifiedtoaccountforthepotentialcumulativeeffectsfrommultipledevices.
Oncethreeberthsareoccupied,thejointeffectofmultipleturbinescanbeassessed.Insteadofdistinguishingdistancefromturbineonacategoricalbasis(treatment/control),asimpliedbytheringsinthemidfielddesign,onecantakeacontinuousapproachbylabellingsamplesfromeachsiteintermsoftheirdistancefromoneormoreturbines(Bayley2010).Toaccomplishthis,asufficientnumberofrandomlyselectedsamplestationswouldbeselectedatdifferentdistancesfromtheturbinesandaccountingforvaryingwaterdepths.
Giventheuncertaintyregardingthetimingoffuturedeployments,planningforfuturestudiesdesignedtoaddressmultipleturbineswillbedeferreduntilshort-termstudyresultsareknownanddeploymentschedulesarefurtherdefined.
2.3Discussion
ThesestudydesignsincludesuggestionsproposedinDFO(2012):
• Thenumberofreplicatesamples(traps)isdescribed(threereplicatesformonesurvey).
• Themonitoringprogramisdesignedtoassesseffectsoncatchabilitywhiletheturbinesareinoperation.
• CatchratesexpressedasKg/traphauledwillalsoberecordedandevaluated.
• Monitoringactivitieswillbeconductedduringtheout-of-fishingseason.
Sincethenumberoflobsterscaughtpertrap-setisnotnormallydistributed4,Bayley(2010)recommendsthatfuturestatisticalanalysesofstudyresultsuseGeneralizedLinearModels(GLM)withanegativebinomialdistributionratherthanthestandardlog(count+1)transformationthatistypicallyappliedtodatathatisnormallydistributed.
Thisproposeddesignrequiresnewstationstoberandomlyselected.Sincedepthisknowntobeasignificantvariable,CEF(2012)suggestssomestratificationbydepthbeintroducedintothestationselectiontoensurethatanadequatebalanceofdepthsissampled.
Toincreasestudyefficiencyandwiththeintentionofreducingcurrent-inducedtrapmovement,certainstationsduringpastsurveysweresampledwithpairsoftrapsconnectedbya60mrope.Statisticalanalysisindicatestheresultsfromthepairedsamplesarenotcomparabletothenon-pairedsamples(Bayley2010).Thereviewerrecommendeddiscontinuingtheuseofpairedtrapsinfuturesurveys.ThisalsoreducestheentanglementsafetyhazardidentifiedinCEF2010.The2009-2010trappairdatacanstillbeusedinfutureanalyses:resultsforoneofthetwotrapsfromeachpaircanberandomlychosen,pooledandthenusedinstatisticalanalyses.
4“normal”distributionisastatisticaltermusedtodescribedatathattendstoclusteraroundacentralormeanvalue.
FORCE March 2016 Environmental Effects Monitoring Program 2.0 LOBSTERS
FORCE 16
Difficultieswereencounteredduetotheshorttimeoverwhichthetrapscouldbesetandrecovered(lessthananhouroverslacktide)andthetime(andexpense)requiredatseabecauseoflowwaterlevelsatthewharf.Inaddition,thestrongcurrentsoftenmovedtrapsfromtheirinitialdeploymentlocation,typicallyapproximately100mfrominitialdeploymentlocation(butupto1.0km).Duringthefirstfall2009survey,3of51trapswerelost.Duringthesecondfall2009survey,7of48trapswerelost.Duringthespring2010survey5of28trapswerelost.Analysisofresultsmusttakeintoaccountbothtraplossandtrapmovement.Planningandcostestimatesshouldfactorina15%traplossrate.
Itshouldalsobenotedthatlobsterpopulations(i.e.,abundance)arenoticeablyaffectedbycommercialfishingpressures.Noiseandvibrationeffectsoffourorfiveturbinesmaybeverydifficulttomeasureincomparison.Giventhis,thestudywillbedesignedtominimizetheeffectsofthecommercialharvestonstudyresultsi.e.lobsterfishingseasons.
FORCE March 2016 Environmental Effects Monitoring Program 3.0 FISH
FORCE 17
SECTION3:FISH3.0
Introduction3.1
Thefollowingparagraphdescribesthepredicteddemonstrationscaleimpactsonfish(AECOM2009):
ItisanticipatedthatmarinefishpresentormigratingthroughtheProjectareamayexperienceverylimitedbehaviouralchangessuchasavoidanceandaversion,aswellaslimitedmortalityandhabitatdisruption.Theextentoftheseeffectsisnotknowngiventhelackofspecificinformationrelatedtonoisegeneratedbytheproposeddevices,andthebackgroundnoiseintheProjectarea.Byfollowingexistingstandardconstructionpractices,availableguidelinesandassociatedmitigationmeasures,ProjectactivitiesandcomponentsarenotlikelytocausesignificantadverseresidualeffectsonmarinefishwithintheProjectareaorvicinity(i.e.,MinasPassageandMinasBasin).Ingeneral,thisisduetotherelativelysmallscaleoftheproject,combinedwiththelimiteddurationandintermittentnatureoftheProjectactivities(AECOM2009).
Possibleinteractionscanoccuratdifferentspatialscalesrelativetothedevices,beginningwiththenear-field.ATISECdevicenearfieldinteractioncouldincludefishcollisions,bladestrikes,and/orpressure-induceddamagetofishresultingfromdevicecavitation.Theseeventsaredifficulttocaptureinrealtime,especiallyinthefield.TherearenofieldstudieswhereobservationofTISECdevicebladestrikehasbeenrecordedbuttherearelaboratorystudiesthathavedocumentedsuchinteractions(Amaraletal.2015).ForthepurposesofthisEEMP,nearfieldinteractionssuchasbladestrikesandcollisionsareassumedtobethesubjectofmonitoringbythedeviceproponents.
Beforeattemptingtoanswerthequestionofwhetherornotthereareactualnearfieldphysicalinteractions(e.g.collisionsorbladestrikes)itisimportanttoaddressthelargerscalequestionofwhetherornotTISECdevicesaffectoverallfishuseofthewatercolumnatrangesfrom10-150mfromthedevice.Atthesedistancesandfarther(i.e.,themidfield),therearepossibleindirectlargescaleeffectsonfishuseofthewatercolumnduetothepresenceofTISECdevices.Forexample,doesfishdensitychangeanddoesfishverticaldistributionwithinthewatercolumnchangeduetothepresenceofaTISECdevice?TheFORCEprojectprovidesauniquesituationofdeployeddevicesandtheabilitytomonitorfishresponsesonthebasisofdensityanddepthdistribution.
Objectives3.2
ThegoalofthisEEMPistodescribeameansofquantifyingfishdistributionalchangesthatreflectbehaviouralresponsestothepresenceofadeployedTISECdevice.Theobjectivesofthisprogramareto:(1)testforindirecteffectsofTISECdevicesonwatercolumnfishdensity;(2)testforindirecteffectsofTISECdevicesonfishverticaldistribution;and(3)estimateprobabilityoffishencounteringadevicebasedonfishdensityproportionsinthewatercolumnrelativetoTISECdevicedepthinthewatercolumn.Theseobjectiveswillbemetusingestablisheddown-lookinghydroacousticmonitoringtechniques,Before-After-Control-Impact(BACI)studydesign,multivariateanalysis(HotellingsT2tests)offishverticaldistributions,andanencounterprobabilitymodel.
FORCE March 2016 Environmental Effects Monitoring Program 3.0 FISH
FORCE 18
MonitoredVariables3.3
FishDensity:Down-lookinghydroacousticsprovidesrawdatathatcanbeusedtocalculatefishdensitybyscalingmeanvolumebackscatter(Sv)bytheaveragescatteringcrosssection(σbs)oraveragingfishtrackspersampledvolume.Thisvariableisusedtorepresentfishconcentration.
FishVerticalDistribution:Thisvariableisestimatedbydividingthewatercolumnintoequaldepthbins(e.g.1m)andcalculatingtheproportionoffishdensityforeachbin.Thisvariableisusedtorepresentfishdistributionwithinthewatercolumn.
Toaddressthefirstobjective,indirecteffectsofaTISECdeviceonmonthlyfishdensityestimates(themeasuredparameter)willbecomparedusingaBefore-After-Control-Impact(BACI)design.The"before"componentmustbeestimatedfrompreviouslycollecteddatafromMelvinandCochrane(2014).The"after"componentwillbeestimatedfromdown-lookinghydroacousticssurveysfollowingthemethodsdescribedinMethodologybelow.ThiswillprovideastatisticallydefinedchangeinthedensityoffishattheFORCECLAafterdevicesaredeployed,providedthereissuchaneffect.Acontrolwillbeusedtoaccountforpotentialannualvariabilityinfishdensityestimates(Smith2002).ThiswillinformFORCEofanydifferenceinconcentrationbeforeandafterdeviceinstallationwhileaccountingforinter-annualvariability5.
Toaddressthesecondobjective,indirecteffectsofaTISECdeviceonmonthlyverticalfishdistributionsbasedon1mdepthbinsmeasuredupfromtheseafloorwillbecomparedusingaBefore-After-Control-Impact(BACI)design.Thisprovidesfishverticaldistributionby1mincrements(themeasuredparameter).The"before"componentofthestudywillusethedatasetfromMelvinandCochrane(2014).The"after"componentwillbeestimatedfromdown-lookinghydroacousticssurveydataasdescribedinMethodologybelow.Thiswillprovideastatisticallydefinedchangeinuseofthewatercolumn(verticaldistribution)byfishinthemid-fieldattheFORCECLArelativetoacontrolsite,ifinfactthereissuchaneffect(Stainesetal.submittedtoEuropeanWaveandTidalEnergyConference(EWTEC)2015).ThisinturnwillinformFORCEofanychangeinfishverticaldistributionbeforeandafterdeviceinstallationandwillaccountforinter-annualvariabilitywithcontrolsitecomparisons.
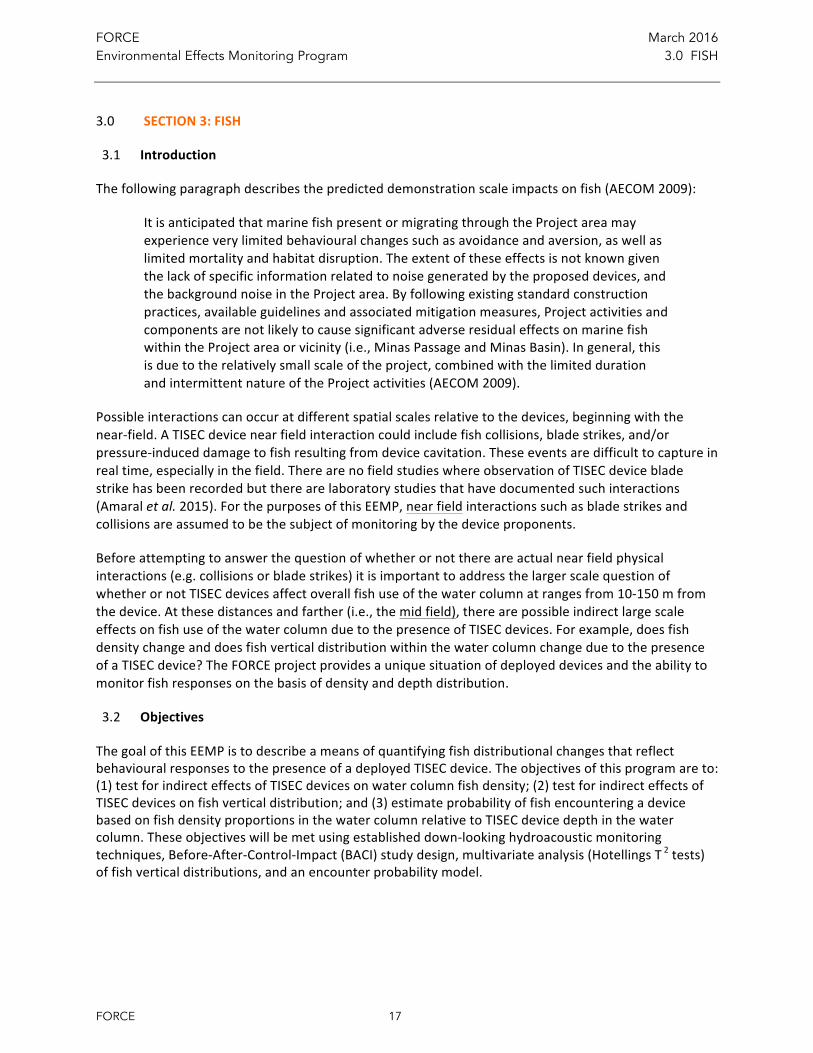
Toaddressthethirdobjective,indirecteffectsoffishwatercolumnuseatthedepthofadeployedTISECdevicewillbeassessedusinganencounterprobabilitymodel.Theprobabilitythatfishwillencounteradeployeddeviceisestimatedfromtwocomponents:1)theproportionoffishbeingatthedevicedepthwhenthedeviceabsent;and2)theproportionoffishbeingatthedevicedepthwhenthedeviceispresent.Theproductofthesetwoestimateswillprovideaprobabilityoffishencounter(Figure3-1).
5Intheirreviewofthisprogram,DFOnotesthattheproposeduseofXandYtransectsis“inadequate”sincefishabundancemid-channelmaynotbewellcorrelatedwithfishabundanceinthenorthendofthegridwheretheturbineswillbedeployed.FORCErecognizesthismaybethecasebutwillproceedontheassumptionthatfishdistributionisrelativelyuniformthroughtheCLA.Monitoringdatacollectedbythisandotherprogramsovertimeshouldhelpdemonstratefishdistribution.
FORCE March 2016 Environmental Effects Monitoring Program 3.0 FISH
FORCE 19
Figure3-1.DisplayofpartofthewatercolumnofatheoreticallyplannedsiteforTISECdeviceinstallation.Thedashedlinesrepresentthedepthinthewatercolumnofinterestbecauseitiswherethedeviceislocatedandwherepotentialfishinteractionswilloccur.(A)representsthewatercolumnpriortodeviceinstallationandprovidestheparameteroffishproportionbeforeinstallation.(B)representsthewatercolumnafterdeviceinstallationandprovidestheparameteroffishproportionafterinstallation.
Methodology3.4
3.4.1 BoatPlatformandAcousticSurveySystem
Previousmobile,down-lookinghydroacousticsurveyswereperformedusedan18.6msterntrawler(FORCE2015)anda15.4mpassengervessel(MelvinandCochrane2014).ThisEEMPproposestheuseofsimilarsizedvesselsbasedontheprevioussuccessofthesetwosurveys.
A120kHzechosoundersystemconsistingofatransceiverandlaptopcomputerhousedinsidetheboatcabinandtransducerthatispolemountedononesideoftheboatisproposed.Thetransducerwillbemounteddeeperthantheboathulltopreventinterferencewiththekeel.Thetransducerwillbemountedusingapoledesignattachedtothegunwale.AGPSunitwillbeusedtoprovideNationalMarineElectronicsAssociation(NMEA)serialstringdatatoalaptopcomputer.ForcomparabilitytotheMelvinandCochrane(2014)dataset,apingrateof1s-1isproposed.ProperinstrumentcalibrationpriortoeachsurveyisrecommendedaccordingtoFooteetal.(1987).
3.4.2 SurveyDescription
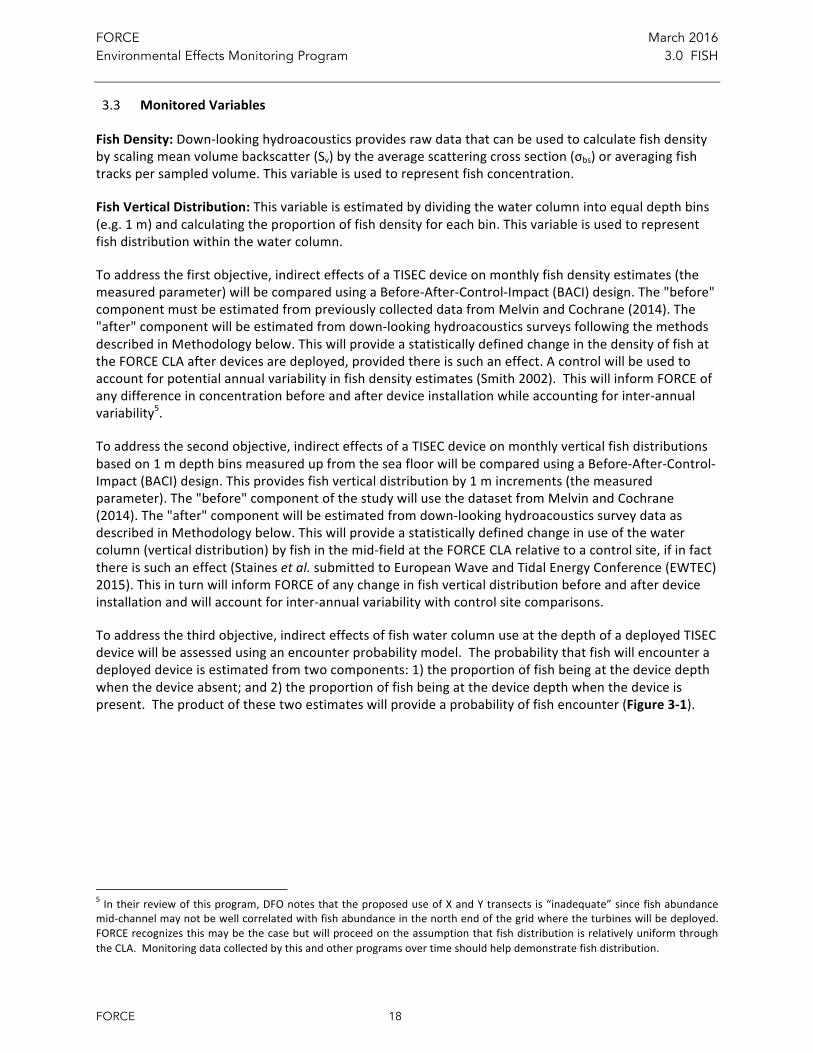
TheFORCECLAsurveyswillconsistof9paralleltransectsspaced100mapart(Table3-1).Eachtransectisapproximately1.8kmlong.Transectsarenumbered0-8startingnearesttoshore.TheparalleltransectswithintheFORCECLAwillbefollowedbythreecontroltransectsthatstartattheeasterlyendoftransect8.TransectY1isacrosstheChannel,andtheboatwilltakeasouthwestbearingacrosstheChannelfromtheeasterlyendoftransect8towardtheoppositeshoreuntilapproximately30mdepthisreached.FromheretransectX1willfollowthe30mcontoureasttothestartoftransectY2which
A B
Proportionoffishbeforeinstallation Proportionoffishafterinstallation
FORCE March 2016 Environmental Effects Monitoring Program 3.0 FISH
FORCE 20
parallelsY1backacrossthechannelgoingnorthandendingatthewesterlyendoftransect0(Figure3-2).Thissurveydesignisrepeateduntilslacktidetime.
Surveyswillbeperformed,totheextentpossibleatspeedsbetweenfiveandtenknots,althoughspeedsupto12knotsareconsistentwithMelvinandCochrane(2014).
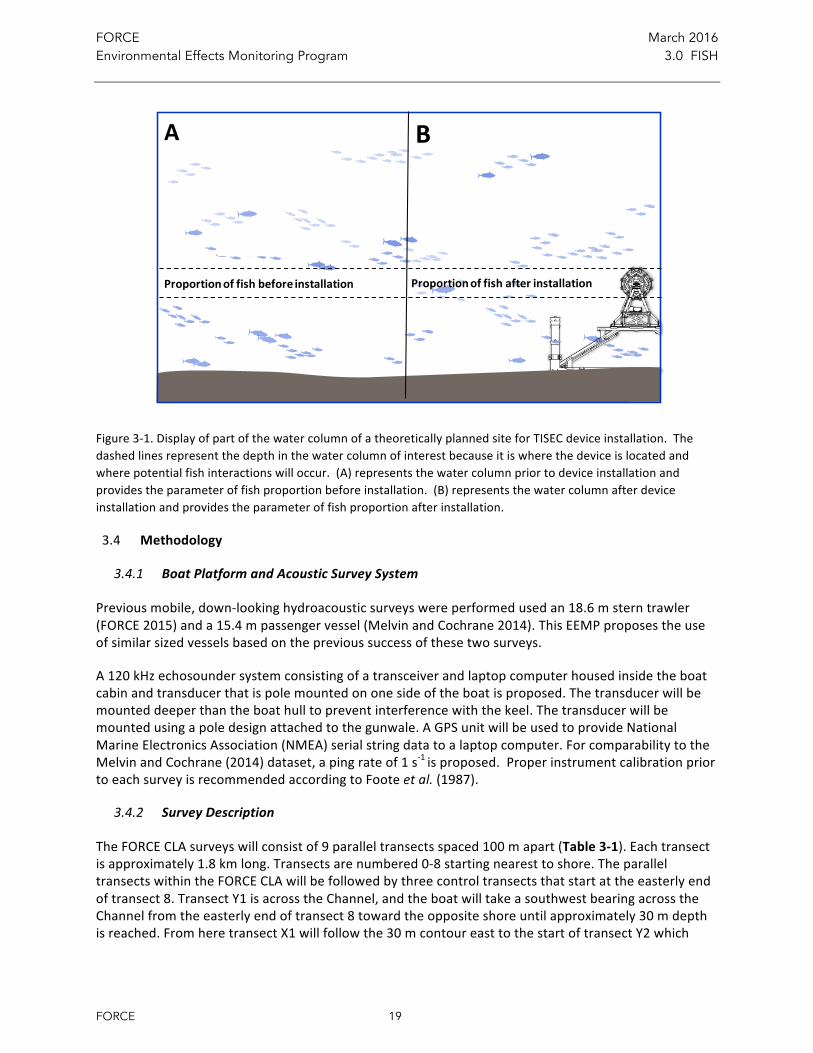
Table3-1.LatitudeandlongitudeindecimaldegreesforproposedMinasChanneltransectsfordown-lookinghydroacousticsurveys.Transectswithanasteriskareforcontrolsamples.ThesetransectlocationsaresimilartoMelvinandCochrane(2014)butareslightlylongerinlengthtoencompassallberthsiteswithintheFORCECLA.
Along-ChannelTransects WestEnd EastEnd Lat Lon Lat Lon0 45.3725 -64.4409 45.3674 -64.41841 45.3717 -64.4414 45.3666 -64.41892 45.3709 -64.4419 45.3657 -64.41933 45.3701 -64.4424 45.3649 -64.41994 45.3692 -64.4430 45.3640 -64.42035 45.3684 -64.4435 45.3631 -64.42076 45.3676 -64.4439 45.3622 -64.42127 45.3667 -64.4444 45.3613 -64.42168 45.3658 -64.4449 45.3605 -64.4221X1* 45.3378 -64.4594 45.3330 -64.4364Across-ChannelTransects NorthEnd Southend Lat Lon Lat LonY1* 45.3658 -64.4449 45.3378 -64.4594Y2* 45.3674 -64.4184 45.3330 -64.4364
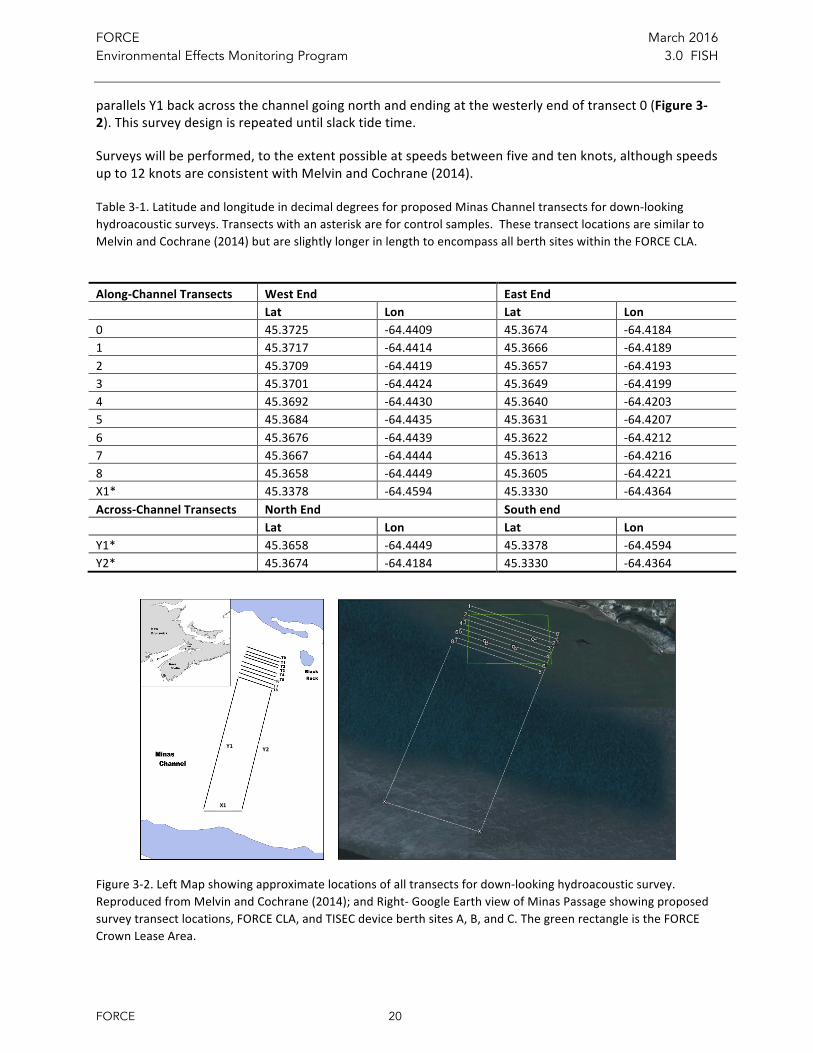
Figure3-2.LeftMapshowingapproximatelocationsofalltransectsfordown-lookinghydroacousticsurvey.ReproducedfromMelvinandCochrane(2014);andRight-GoogleEarthviewofMinasPassageshowingproposedsurveytransectlocations,FORCECLA,andTISECdeviceberthsitesA,B,andC.ThegreenrectangleistheFORCECrownLeaseArea.
Y1 Y2
X1

FORCE March 2016 Environmental Effects Monitoring Program 3.0 FISH
FORCE 21
3.4.3 Schedule
ForthesakeofcomparabilitywiththeMelvinandCochrane(2014)dataset,thisEEMPproposessamplingduringthesamemonthsonneaptides6aswasdonebyMelvinandCochrane(2014):sixsurveyeventsdistributedoversixdifferentmonths.ThemonthsofMay,June,August,September,October,andNovemberwillmatchwiththe2011-12dataset.
NosurveysareproposedforDecemberthroughAprilsincethesemonthslikelycoincidewiththelowestwatertemperaturesandlowestfishbiomass(Viehmanetal.2015;MelvinandCochrane2014).Julyisnotsurveyedbecausethismonthwasalsoskippedinthepreviousstudy.Table3-2listsproposed2016samplingdatesbasedondatesthatcoincidewithneaptides.ThesesamplingdatesmaycapturetheimmigrationandemigrationofmigratoryfishspeciesthatoccurinMinasPassageandMinasBasin.Residentfishspeciesandthoselifestagesofmigratoryspeciesthatusetheprojectareawillalsobecapturedinthesesurveys.
Table3-2.Proposed2016SamplingDatesCoincidingwithNeapTides.StartTimes=HighTideTimes.
Survey Startdate StarttimeADT
1 16May2016 9:28am
2 14June2016 8:49am
3 12August2016 8:20am
4 11September2016 8:38am
5 8October2016 6:14am
6 7November2016 5:35am
Eachsurveyeventwillconsistofafulltidalanddielcycleandthereforelast25hours.Thiscanbebrokenupintofourseparateshiftseacharound6hours.Timebetweentideswhentheflowisdecreasedcanbeusedtochangecrewsandmaintainequipment.Allsurveysshouldbeginonahightidetoensurethattheboatcanmanageentryandexitfromport.Surveyingwillbelimitedtocalmseadaysandifpossible,whenwindislessthan10knotsforsafetyandtomaximizedataquality.
TheEEMPproposesextendingthisstudyforfiveyearsinanattempttocapturemultipledeploymentsthatareplannedintheFORCECLA.Thefirstplannedinstallationwillbetwoopencentreturbinesin2016.
ExtendingthismonitoringprogramoverfiveyearswillimprovetheabilitytodeterminepotentialeffectsonfishuseinandaroundtheFORCECLAintwoways.First,itisimperativetocapturefuturedevicedeploymentstoaddressnotonlypotentialeffectsrelatedtoindividualdevicetypesbutalsotoassesscumulativeeffectsfrommultipledevicesoperatingatthesametime.Second,long-termstudieshaveahigherprobabilityofsuccessbecausetheyarelesslikelytomistakesingle,novelecologicaleventsas
6Thesurveycanbeperformedduringbothneapandspringtidesbutifdataqualityispoorenoughtoprecludeitscollectionduringacertaintidalphasethenitwouldbeadvisabletoavoidthistime.
FORCE March 2016 Environmental Effects Monitoring Program 3.0 FISH
FORCE 22
representative.Theexistenceofaneffectorlackthereofforseveralyearsofsurveyeddataisstrongerevidencewhencomparedtoasingleyear'sdata.Inotherwords,ifthereisevidenceofatrendforseveralyearsasopposedtoasingleyearthenthattrendislesslikelytohaveoccurredbychancealone.Additionally,long-termdatasetshavetheoptionoftimeseriesanalysisthatcanshowlongtermtrendsandprovideevidenceforforecasting.
EMACsuggeststestingthedownwardlookinghydroacousticprogramassoonaspossible,i.e.priortoturbinedeployment.This‘testrun’willidentifylogisticalissuesandpromoteafamiliaritywiththeinstrumentation,collectionmethodologyanddifficultworkingconditions.
3.4.4 DataProcessing
ThesurveysinMinasPassagewilllikelyhaveamajormanualprocessingcomponenttoseparatethelargeamountsofentrainedairparticulartothisarea.Anestablishedmethodforaddressingentrainedairatthesurfaceistoeliminateacertainamountofwaterdepthfromprocessingandanalysis(e.g.theupper10m)(Viehmanetal.2015).SomeresearchershavehadsuccessremovingentrainedairusingSchoolsDetectionmodulealgorithmsinEchoviewsoftware.
Additionally,whenutilizingsubjectivemanualprocessingtechniques,itisimportanttoincludeaqualityassurance(QA)andqualitycontrol(QC)protocol.Ideally,thequalityassurancecomponentisanadditionalpersonwithhydroacousticsdataprocessingexperiencetotakeasubsampleofprocesseddataandreprocessittocomparetotheresultsofthefirstperson'soutcome.Agoodmethodforqualitycontrolistofindoutliersinthefinalfishdensityestimatesandreferencethemtotheprocesseddatafiles.Oftentimesanoisespikeorothersourceofsignalcontaminationismissedduringmanualprocessingandisthereforeincludedinthefishdensityestimate.TherearenumerousotheravenuesforQA/QCandanythattheresearchershaveconfidenceinshouldbeused.
Hydroacousticsdatacanbeprocessedtoprovidedensityasametric.Fishdensitycanbecalculatedbyscalingthemeanvolumebackscatter(Sv)bytheaveragebackscattercrosssection(σbs)forasampledvolumeofwaterorbydeterminingthenumberofindividualfishtracksforasampledvolumeofwater.Additionally,usingjust(Sv)asametricisalsoeffective(Viehmanetal.2015).UsingSvaloneprovidesbiomassorrelativedensityasametricinsteadofdensity.ForObjective1,Svwillsufficeasametricfortheproposedanalysis.However,forObjectives2and3,researcherswillneedtouseareabackscattercoefficient(Sa)asametricfortheproposedanalyses(Stainesetal.2015).Researcherswithhydroacousticsexperiencewillhaveknowledgeofallofthesemetricsandtheirapplications.
Basedontheobjectivesofthisprogram,fishdensitywillneedtobeintwoseparateformsfortheproposedanalyses.First,overallfishdensityestimatesfor30or60minutetimeintervalsforthewatercolumnarerequiredforthefirstobjectiveofdeterminingseasonalfishdensityattheFORCECLA(hereafterreferredtoastheimpactsite)andcontrolsites.Second,fishdensityestimatesfor30or60minutetimeintervalsdividedinto1mdepthbinsforthewatercolumnarerequiredforthesecondobjectiveofdeterminingseasonalfishverticaldistributionattheimpactsiteandcontrolsites(Viehmanetal.2015).Objective1usesoverallfishdensityofthewatercolumnandobjectives2and3usefishdensityin1mdepthbins.
3.4.5 DataAnalysis
AnalysisforObjective1wouldinvolvea2-wayanalysisofvariance(ANOVA)basedonabefore-after-control-impact(BACI)experimentaldesign(Smith2002).The"before"componentwillbeapreviousdatasetcollectedbyMelvinandCochrane(2014)thattheaforementionedsurveymethodsarebased
FORCE March 2016 Environmental Effects Monitoring Program 3.0 FISH
FORCE 23
on.The"after"componentofthestudycouldpotentiallybeanyyearofsurveysafterTISECdeviceshavebeendeployed.The"control"componentistakenfromthexandytransectsofthesurveydesignwhilethe"impact"componentistakenfromtheparalleltransectsnumbered0-8.Theresultsofa2-wayANOVAanalysiswillprovideaneffectforthebefore/aftercomponent,thecontrol/impactcomponent,andtheinteractionofthetwo.AsignificantinteractioneffectisevidenceoftherebeinganeffectofaTISECdeviceonoverallfishdensityattheimpactsite(Stainesetal.2015).
AnalysisforObjective2shouldincludeusingHotellingsT2permutationteststocomparethedifferencebetweenthefishverticaldistributiondensitiesofcomplimentarymonthsofthe"before"surveytothe"after"surveysforboththecontrolandimpactsites.Forexample,inthe"before"surveyofMelvinandCochrane(2014),themonthofMayin2012wassampled.Assumethereisan"after"surveyperformedinthemonthofMayin2016afterTISECdevicesarepresent.BothoftheseMaysampleswouldbecomplementaryandwouldbetestedfordifferences.Thecomplementarypairfortheimpactsitetransectswouldbetestedandthecomplementarypairforthecontroltransectswouldbetested.Ifboththeimpactsiteandcontrolsitehadnon-significanttestresultsorbothhadsignificanttestresultsthenthatwouldindicatenoevidenceforeffectsfromTISECdevicepresence.However,ifonlyoneortheotherofthecontrolorimpactsitehasasignificanttestresultthenthiswouldindicatepossibleevidenceforTISECdeviceeffectsonfishverticaldistribution.
AnalysisforObjective3willinvolvere-analysisoffishverticaldistributiondatausedinanalysisofObjective2.DeterminingtheprobabilityofencounteroffishwithTISECdevicesattheimpactsitewillrequireseveraldatainputsthatwillallbeavailableafterdeviceinstallationanddown-lookinghydroacousticsurveyshavebeencompleted.ThefirstinputrequiredisthedepthofaparticulardeployedTISECdevice.Knowledgeofthisdepthisimportantbecausethisiswhereexpectedinteractionwilllikelyoccurwithfishmovingintotheimpactsite.Theprobabilitythatfishwouldencounterthedeployeddeviceisestimatedusingtwoprobabilities:1)theprobabilityoffishbeingatthedevicedepthwhenthedeviceisnotpresentattheimpactsite(p1);and2)theprobabilityoffishbeingatthedevicedepthwhenthedeviceispresent(p2).Thereforetheprobabilityoffishencounteringthedevicecanbecalculatedas:
p=p1*p2
Notethattheprobability(p1)offishbeingatthedevicedepthcanbedeterminedfromtheMelvinandCochrane(2015)datasetsincemostofthesedatawerecollectedattheimpactsitewhennodevicewaspresent.Infact,thiswouldbethebestestimateofp1.Usingthecontrolsitetodeterminep1assumesthatthecontrolsiteissimilartotheimpactsite.IfthecontrolsiteistobeusedtodeterminetheprobabilityofencounteritshouldbetestedforpotentialdifferenceswiththeFORCECLA.Thesemethodswouldbestbeundertakenin2017or2018aftersite-specificdatahavebeencollectedandsamplesizesareadequateforconfidentestimates.
FORCE March 2016 Environmental Effects Monitoring Program 4.0 MARINE MAMMALS
FORCE 24
SECTION4:MARINEMAMMALS4.0
Introduction4.1
ManyoftheimpactsofTISECdevelopmentsarelikelytobethesameasthoseassociatedwithmoreestablishedmarineindustries,suchasoilandgasexploration,constructionandextraction.However,thereareanumberofpotentialimpactsthatarespecifictothesenewtechnologies.Theseinclude,forexample:
a)deterrenteffectsofnoiseassociatedwithoperationalandinstallationactivities;
b)disruptionofcommunicationasaresultofincreasedunderwaternoise;
c)indirecteffectsthroughchangesinpreydistributionandabundance;and
d)directcollisionorphysicaldynamicinteractionwithTISECdevices.
IndividualTISECdeviceshavearelativelysmallphysicalfootprintsoitisunlikelythatthepresenceofsingledevicesorsmallarrayswillposeasignificanthabitatexclusionriskatalevellikelytoresultinmeasureableimpacts.
Environmentaleffectsfromcontinuousnoisesourcesarerelatedtosoundintensity,signaltonoiseratios,spectralfrequencyandtheexposureperiod,butalsocontextualfactorslikethenoveltyofthesoundsource(Southalletal.2007;Ellisonetal.2012).Harbourporpoise(Phocoenaphocoena),thekeymarinemammalspeciesinMinasPassage,usehighfrequencyecholocationclickstohuntandcommunicate(Kasteleinetal.2002)andareknowntobeverysusceptibletopulsednoisedisturbance(Tougaardetal.2009),butfewstudieshavefocusedonexposuretocontinuous(non-pulsed)periodsoflowfrequencynoisesourcessuchasthoseemittedbytidalturbines.
EEMPContext4.2
BaselinedatacollectedtodatecoupledwithhistoricalinformationindicatesthatonlyonemarinemammalspeciesispresentinsufficientnumberstotestEA-relateddistributionoravoidancepredictions,namelyHarbourporpoise.Lowsightingratesofharbourandgreyseals,white-sideddolphinsandsporadicsightingsoflargerwhales(mainlylong-finpilot,minkeandhumpbackwhale)resultinalackofstatisticalpowertorobustlyassesschangeinabundanceordistributionsorindeedavoidancebythesespecies,evenifcurrentbaselinemonitoringstudieswerecontinuedorexpanded.
RecognizingthatonlyasmallportionoftheBayofFundyHarbourporpoisepopulationutilizesMinasPassage,thisEEMPfocusesonthemoreobtainable‘sub-population’levelEApredictions.TheoverallgoalistoassesschangeinmidfieldareausebyHarbourporpoise,includingpermanentorlargescaleavoidance/attractionoftheFORCECLAandsurroundingmidfieldstudyarea.
MarinemammalEApredictionsweredevelopedforaminimumofonegeneration.ForHarbourporpoise,thisisconsideredtobesevenyears,therebyrequiringanEEMPthatextendsoverthisperiod.Logically,monitoringstudiescanbestaggeredtoallowtimeforsitedevelopmentofmultipleturbinesandlong-termoperationsinordertomaximizethevalueoftheEEMP.
FORCE March 2016 Environmental Effects Monitoring Program 4.0 MARINE MAMMALS
FORCE 25
Effortwillbedirectedtowardsgatheringmonitoringdatainthenearandmidfieldaroundindividualturbines.Givensafetyconsiderationsnearoperationalturbines,immediatenearfieldmonitoring(consideredtobewithin100m)isbestundertakenbydeviceowners,ratherthanthroughthedeploymentofmoveableequipmentfromsurfacebyindependentmonitoringentities.
TheproposedfocusofthemarinemammalEEMPistoassesslong-termeffectsoftwokeystressorsonHarbourporpoise:
1) Directeffectsofoperationalturbinenoise.Specifically,Harbourporpoisesmayrespondtotheacousticstressorsthroughattractionoravoidance.
2) Indirecteffectsduetochangesinpreydistributionandabundance.Duetodynamicinteractions,preyaggregationsornear-fieldavoidancebyfishduetoacousticeffects,Harbourporpoisemayrespondtolocalstudyareascalepreyaggregationsthroughattractionoravoidance.
Theassessmentofbothdirectandindirectstressorsisachievableconcurrently,asbotharepotentiallymonitoredthroughrelativechangesinporpoiseactivityandrelativesiteuse.
TurbinedeploymentattheFORCECLAisanincrementalprocessthatwilloccuroveranumberofyears.ThisEEMPproposalhasassumedthattwoturbineswillbedeployedatBerthDin2016,withdeploymentofadditional(anddifferent)turbinesintheotherberthsoccurringinsubsequentyears.
EEMPObjectives4.3
TheprimaryobjectivesofthemarinemammalEEMParetoassessthefollowingeffects:
1) Permanentavoidanceofthemidfieldstudyareaduringturbineoperations.
2) Changeinthedistributionofaportionofthepopulation,specificallylargescale(~50%)decreasesorincreasesinrelativeoccurrence(echolocationactivitylevels)acrossthemidfieldstudyarea.
ThesecondaryobjectivesofthemarinemammalEEMPareto;
1) MonitortheregionalfrequencyofstrandedcarcassesinconjunctionwiththeMarineAnimalResponseSociety(MARS)programandassesscauseofdeathwherepossibleandmaintainanadaptivemanagementapproachtonewinformationoncollisionriskandfromC-PODmonitoringstudies.
2) ProviderecommendationsonthepotentialapplicationsfortheFORCEFASTPlatformandpotentialresearchthemesthatwouldincreasescientificunderstandingofthescaleofturbine-marinemammalinteractions.
TheseobjectivesareslightlyreducedfromthosedescribedintheConsultant’sReport.Uponfurtherdiscussionwiththereportauthors,itwasdecidedtowaitfortheresultsofstudiescurrentlyunderwaybeforedecidingiftheuseofthepassiveacousticAMARisjustifiedinMinasPassage.Similarly,theyear1programwillnowbeundertakenpost-turbinedeploymentandsoithasbeenreducedfromfiveCPODs(whichwereproposedtocollectadditionalbutnon-criticalbaselinedata)tothreeCPODs(todetectbehaviouralchangesrelatedtoturbinepresence).
FORCE March 2016 Environmental Effects Monitoring Program 4.0 MARINE MAMMALS
FORCE 26
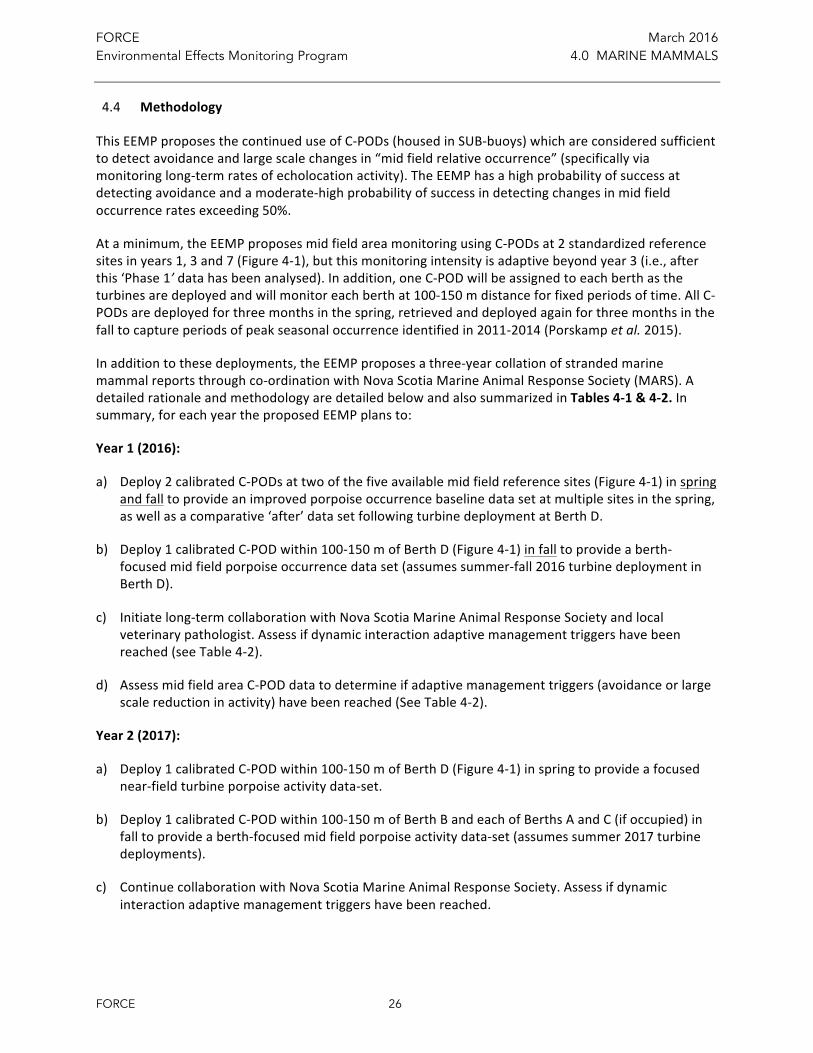
Methodology4.4
ThisEEMPproposesthecontinueduseofC-PODs(housedinSUB-buoys)whichareconsideredsufficienttodetectavoidanceandlargescalechangesin“midfieldrelativeoccurrence”(specificallyviamonitoringlong-termratesofecholocationactivity).TheEEMPhasahighprobabilityofsuccessatdetectingavoidanceandamoderate-highprobabilityofsuccessindetectingchangesinmidfieldoccurrenceratesexceeding50%.
Ataminimum,theEEMPproposesmidfieldareamonitoringusingC-PODsat2standardizedreferencesitesinyears1,3and7(Figure4-1),butthismonitoringintensityisadaptivebeyondyear3(i.e.,afterthis‘Phase1’datahasbeenanalysed).Inaddition,oneC-PODwillbeassignedtoeachberthastheturbinesaredeployedandwillmonitoreachberthat100-150mdistanceforfixedperiodsoftime.AllC-PODsaredeployedforthreemonthsinthespring,retrievedanddeployedagainforthreemonthsinthefalltocaptureperiodsofpeakseasonaloccurrenceidentifiedin2011-2014(Porskampetal.2015).
Inadditiontothesedeployments,theEEMPproposesathree-yearcollationofstrandedmarinemammalreportsthroughco-ordinationwithNovaScotiaMarineAnimalResponseSociety(MARS).AdetailedrationaleandmethodologyaredetailedbelowandalsosummarizedinTables4-1&4-2.Insummary,foreachyeartheproposedEEMPplansto:
Year1(2016):
a) Deploy2calibratedC-PODsattwoofthefiveavailablemidfieldreferencesites(Figure4-1)inspringandfalltoprovideanimprovedporpoiseoccurrencebaselinedatasetatmultiplesitesinthespring,aswellasacomparative‘after’datasetfollowingturbinedeploymentatBerthD.
b) Deploy1calibratedC-PODwithin100-150mofBerthD(Figure4-1)infalltoprovideaberth-focusedmidfieldporpoiseoccurrencedataset(assumessummer-fall2016turbinedeploymentinBerthD).
c) Initiatelong-termcollaborationwithNovaScotiaMarineAnimalResponseSocietyandlocalveterinarypathologist.Assessifdynamicinteractionadaptivemanagementtriggershavebeenreached(seeTable4-2).
d) AssessmidfieldareaC-PODdatatodetermineifadaptivemanagementtriggers(avoidanceorlargescalereductioninactivity)havebeenreached(SeeTable4-2).
Year2(2017):
a) Deploy1calibratedC-PODwithin100-150mofBerthD(Figure4-1)inspringtoprovideafocusednear-fieldturbineporpoiseactivitydata-set.
b) Deploy1calibratedC-PODwithin100-150mofBerthBandeachofBerthsAandC(ifoccupied)infalltoprovideaberth-focusedmidfieldporpoiseactivitydata-set(assumessummer2017turbinedeployments).
c) ContinuecollaborationwithNovaScotiaMarineAnimalResponseSociety.Assessifdynamicinteractionadaptivemanagementtriggershavebeenreached.

FORCE March 2016 Environmental Effects Monitoring Program 4.0 MARINE MAMMALS
FORCE 27
d) AssessmidfieldC-PODdatatodetermineifadaptivemanagementtriggers(avoidanceorlargescalereductioninactivity)havebeenreached.
Year3(2018):
a) Deploy5calibratedC-PODsat5midfieldareareferencesites(Figure4-1)inspringandfalltoprovide‘after’porpoiseactivitybaselinedata-set.IdenticalC-PODswouldbelocatedatthesamesitesasinyear1.ExactsiteslocationsforWest1andEast1shouldconsiderfinalturbineandnear-fieldC-PODplacementlocationsandassociatedcablings,aimingtodeploy>400mawayinsimilarwaterdepth.
b) Deploy1calibratedC-PODwithin100-150mofBerthBandA/C(Figure4-1)inspringtoprovideturbineberth-focusedmidfieldporpoiseactivitydata-set(assumessummer2017turbinedeployments).
c) Continuelong-termcollaborationwithNovaScotiaMarineAnimalResponseSociety.Assessifdynamicinteractionadaptivemanagementtriggershavebeenreached.
d) AssessmidfieldC-PODdatatodetermineifadaptivemanagementtriggers(avoidanceorlargescalereductioninactivity)havebeenreached.
Years4-6(2019-2021):
a) Monitoringintensityandmethodsdependentonresultsfromyears1-3andfromotherTISECprojectsworldwide(e.g.,adaptivemanagementapproach).
Year7(2022):
a) Deploy5calibratedC-PODsat5midfieldreferencesites(Figure4-1)inspringandfalltoprovide‘after’porpoiseactivitydata-setattimescaleofoneporpoisegeneration.IdenticalC-PODswouldbelocatedatthesamesitesasinyear1.ExactsiteslocationsforWest1andEast1shouldconsiderfinalturbineandnear-fieldC-PODplacementlocationsandassociatedcablings,aimingtodeploy>400mawayinsimilarwaterdepth.
b) Assessiffurtherenvironmentaleffectsmonitoringrequired.
Asrecommended,FORCEwillassesstheapplicationofshorelinemammalcarcasssurveysasanadditionalmonitoringtoolandindicatorpotentialofmammalsstrikesbyaturbine.Carcassstrandingfrequenciesintheregionarebelievedtobelow,butdatafrompre-installationperiodsmaybeusefulincomparisonwithfrequenciespost-installation.Thismethodprovidesacost-effectivemeanstopotentiallydetectlethalcollisionsbyspeciesofconservationandpublicconcern,FORCEwillcontactMARSonaroutinebasistoobtainupdatesonanymammalsstrandingsormortalitiesreportedintheMinasChannelarea.
Inaddition,FORCEwillcontinuetopublicizeitsemergencyresponsenumber(1-888-850-4625)numbersothatanymariners,fishers,andgeneralpublicwhoobserveanyunusualoccurrencesintheareaofCLA(i.e.,usualseabirdactivity,fishkills,injuredordeadmarinemammals)canquicklyreportthisinformationtoFORCE.
FORCE March 2016 Environmental Effects Monitoring Program 4.0 MARINE MAMMALS
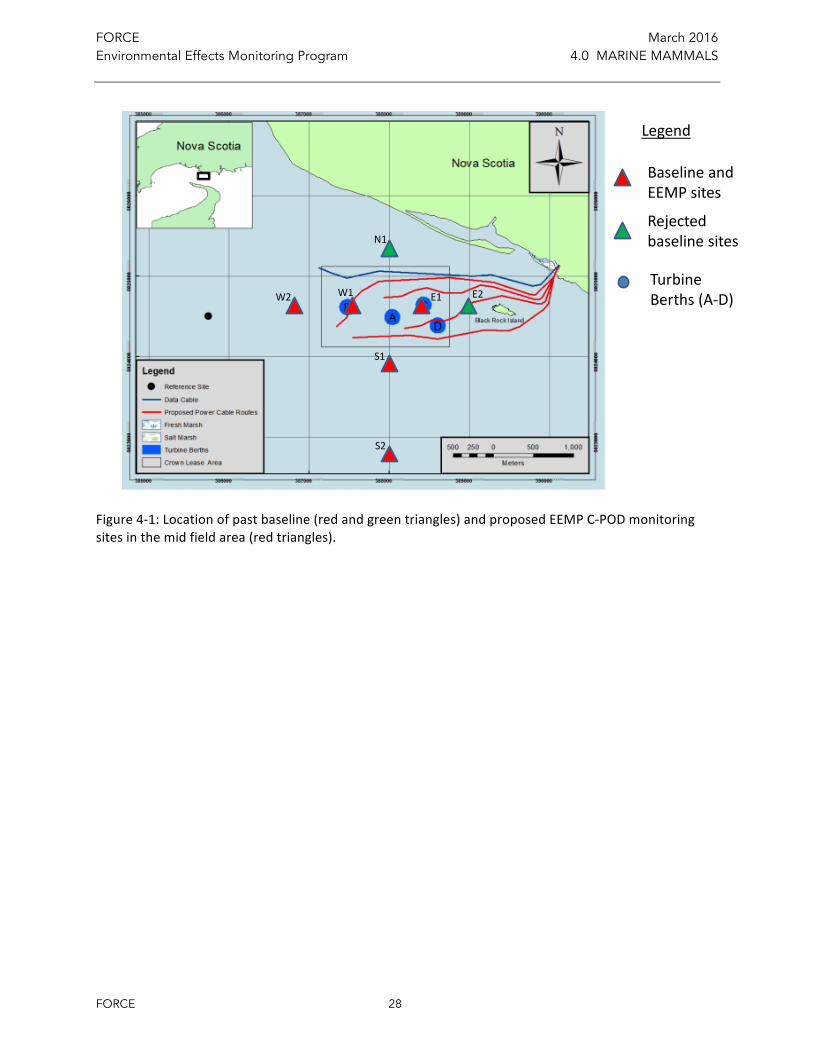
FORCE 28
BaselineandEEMPsites
Rejectedbaselinesites
Legend
TurbineBerths(A-D)W2 E1W1
N1
S2
S1
E2
Figure4-1:Locationofpastbaseline(redandgreentriangles)andproposedEEMPC-PODmonitoringsitesinthemidfieldarea(redtriangles).
FORCE March 2016 Environmental Effects Monitoring Program 4.0 MARINE MAMMALS
FORCE 29
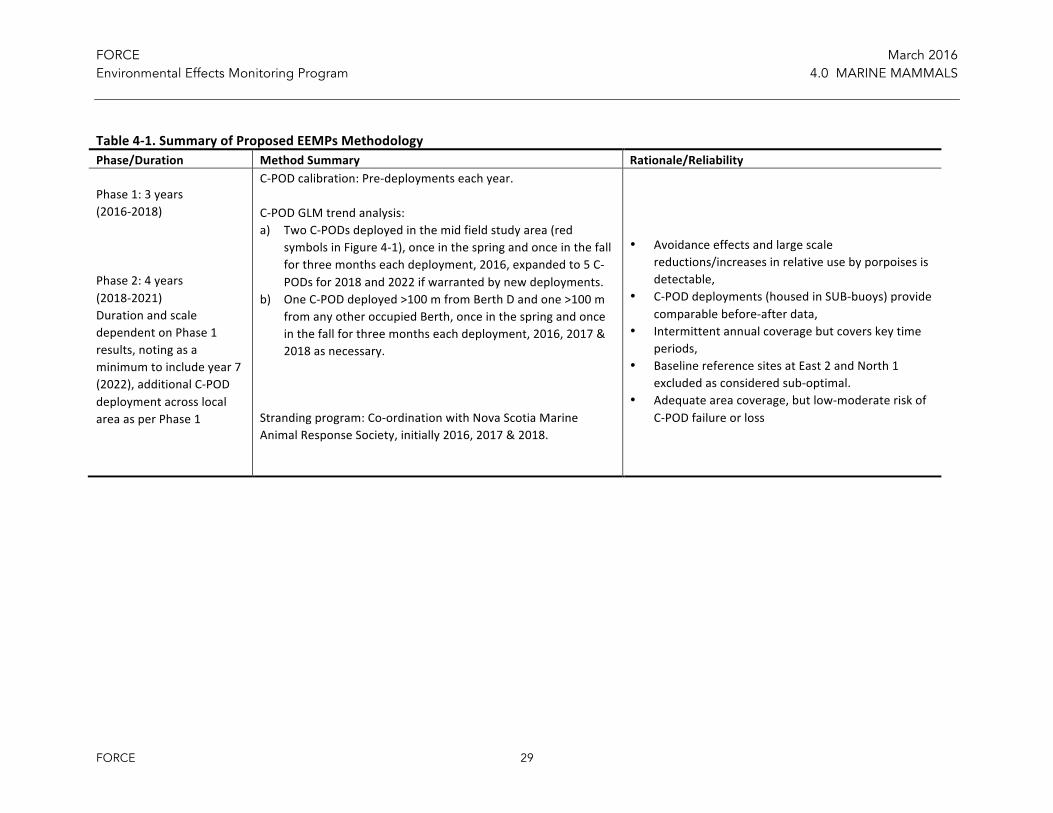
Table4-1.SummaryofProposedEEMPsMethodologyPhase/Duration MethodSummary Rationale/Reliability
Phase1:3years(2016-2018)Phase2:4years(2018-2021)DurationandscaledependentonPhase1results,notingasaminimumtoincludeyear7(2022),additionalC-PODdeploymentacrosslocalareaasperPhase1
C-PODcalibration:Pre-deploymentseachyear.C-PODGLMtrendanalysis:a) TwoC-PODsdeployedinthemidfieldstudyarea(red
symbolsinFigure4-1),onceinthespringandonceinthefallforthreemonthseachdeployment,2016,expandedto5C-PODsfor2018and2022ifwarrantedbynewdeployments.
b) OneC-PODdeployed>100mfromBerthDandone>100mfromanyotheroccupiedBerth,onceinthespringandonceinthefallforthreemonthseachdeployment,2016,2017&2018asnecessary.
Strandingprogram:Co-ordinationwithNovaScotiaMarineAnimalResponseSociety,initially2016,2017&2018.
• Avoidanceeffectsandlargescalereductions/increasesinrelativeusebyporpoisesisdetectable,
• C-PODdeployments(housedinSUB-buoys)providecomparablebefore-afterdata,
• Intermittentannualcoveragebutcoverskeytimeperiods,
• BaselinereferencesitesatEast2andNorth1excludedasconsideredsub-optimal.
• Adequateareacoverage,butlow-moderateriskofC-PODfailureorloss
FORCE March 2016 Environmental Effects Monitoring Program 4.0 MARINE MAMMALS
FORCE 30
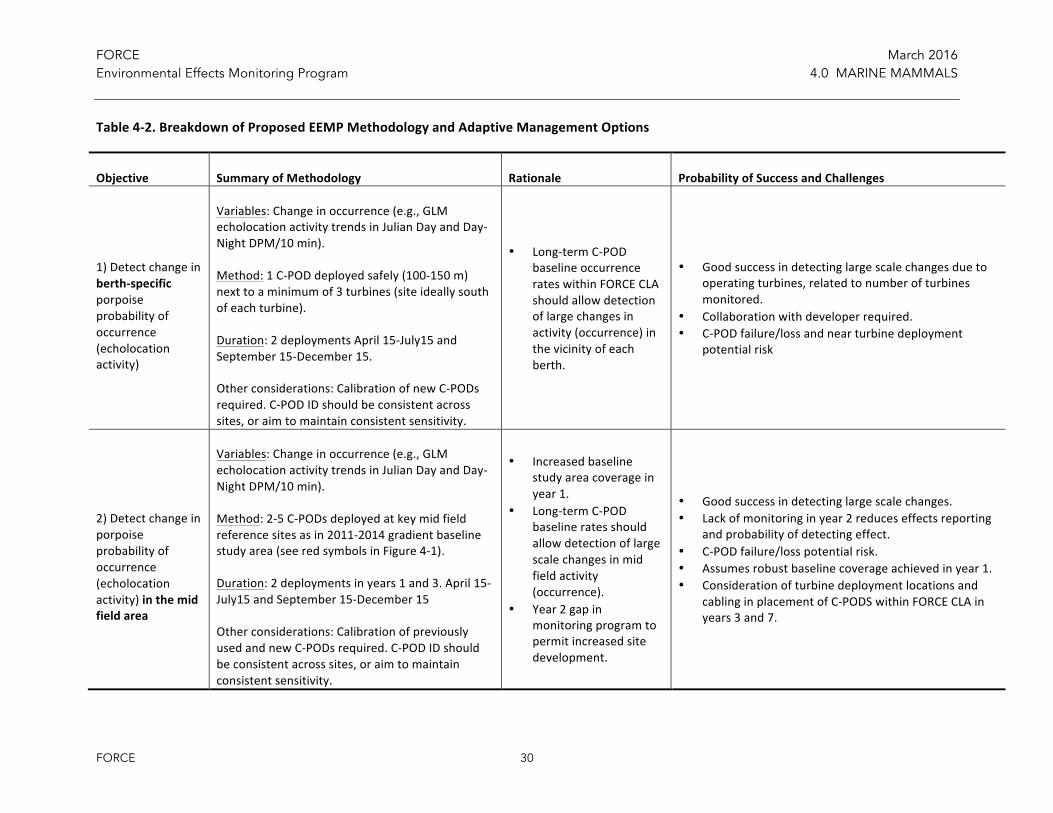
Table4-2.BreakdownofProposedEEMPMethodologyandAdaptiveManagementOptions
Objective SummaryofMethodology Rationale ProbabilityofSuccessandChallenges
1)Detectchangeinberth-specificporpoiseprobabilityofoccurrence(echolocationactivity)
Variables:Changeinoccurrence(e.g.,GLMecholocationactivitytrendsinJulianDayandDay-NightDPM/10min).
Method:1C-PODdeployedsafely(100-150m)nexttoaminimumof3turbines(siteideallysouthofeachturbine).
Duration:2deploymentsApril15-July15andSeptember15-December15.
Otherconsiderations:CalibrationofnewC-PODsrequired.C-PODIDshouldbeconsistentacrosssites,oraimtomaintainconsistentsensitivity.
• Long-termC-PODbaselineoccurrencerateswithinFORCECLAshouldallowdetectionoflargechangesinactivity(occurrence)inthevicinityofeachberth.
• Goodsuccessindetectinglargescalechangesduetooperatingturbines,relatedtonumberofturbinesmonitored.
• Collaborationwithdeveloperrequired.• C-PODfailure/lossandnearturbinedeployment
potentialrisk
2)Detectchangeinporpoiseprobabilityofoccurrence(echolocationactivity)inthemidfieldarea
Variables:Changeinoccurrence(e.g.,GLMecholocationactivitytrendsinJulianDayandDay-NightDPM/10min).
Method:2-5C-PODsdeployedatkeymidfieldreferencesitesasin2011-2014gradientbaselinestudyarea(seeredsymbolsinFigure4-1).
Duration:2deploymentsinyears1and3.April15-July15andSeptember15-December15
Otherconsiderations:CalibrationofpreviouslyusedandnewC-PODsrequired.C-PODIDshouldbeconsistentacrosssites,oraimtomaintainconsistentsensitivity.
• Increasedbaselinestudyareacoverageinyear1.
• Long-termC-PODbaselineratesshouldallowdetectionoflargescalechangesinmidfieldactivity(occurrence).
• Year2gapinmonitoringprogramtopermitincreasedsitedevelopment.
• Goodsuccessindetectinglargescalechanges.• Lackofmonitoringinyear2reduceseffectsreporting
andprobabilityofdetectingeffect.• C-PODfailure/losspotentialrisk.• Assumesrobustbaselinecoverageachievedinyear1.• Considerationofturbinedeploymentlocationsand
cablinginplacementofC-PODSwithinFORCECLAinyears3and7.
FORCE March 2016 Environmental Effects Monitoring Program 4.0 MARINE MAMMALS
FORCE 31
Objective SummaryofMethodology Rationale ProbabilityofSuccessandChallenges
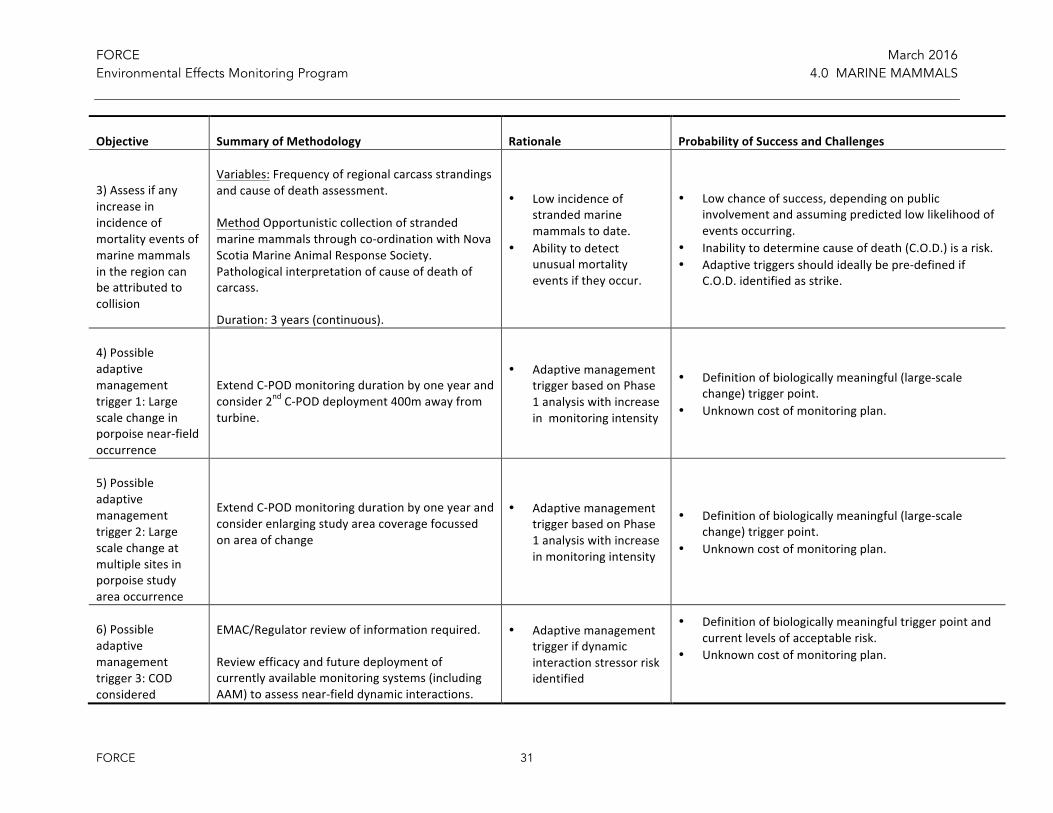
3)Assessifanyincreaseinincidenceofmortalityeventsofmarinemammalsintheregioncanbeattributedtocollision
Variables:Frequencyofregionalcarcassstrandingsandcauseofdeathassessment.
MethodOpportunisticcollectionofstrandedmarinemammalsthroughco-ordinationwithNovaScotiaMarineAnimalResponseSociety.Pathologicalinterpretationofcauseofdeathofcarcass.
Duration:3years(continuous).
• Lowincidenceofstrandedmarinemammalstodate.
• Abilitytodetectunusualmortalityeventsiftheyoccur.
• Lowchanceofsuccess,dependingonpublicinvolvementandassumingpredictedlowlikelihoodofeventsoccurring.
• Inabilitytodeterminecauseofdeath(C.O.D.)isarisk.• Adaptivetriggersshouldideallybepre-definedif
C.O.D.identifiedasstrike.
4)Possibleadaptivemanagementtrigger1:Largescalechangeinporpoisenear-fieldoccurrence
ExtendC-PODmonitoringdurationbyoneyearandconsider2ndC-PODdeployment400mawayfromturbine.
• AdaptivemanagementtriggerbasedonPhase1analysiswithincreaseinmonitoringintensity
• Definitionofbiologicallymeaningful(large-scalechange)triggerpoint.
• Unknowncostofmonitoringplan.
5)Possibleadaptivemanagementtrigger2:Largescalechangeatmultiplesitesinporpoisestudyareaoccurrence
ExtendC-PODmonitoringdurationbyoneyearandconsiderenlargingstudyareacoveragefocussedonareaofchange
• AdaptivemanagementtriggerbasedonPhase1analysiswithincreaseinmonitoringintensity
• Definitionofbiologicallymeaningful(large-scalechange)triggerpoint.
• Unknowncostofmonitoringplan.
6)Possibleadaptivemanagementtrigger3:CODconsidered
EMAC/Regulatorreviewofinformationrequired.
Reviewefficacyandfuturedeploymentofcurrentlyavailablemonitoringsystems(includingAAM)toassessnear-fielddynamicinteractions.
• Adaptivemanagementtriggerifdynamicinteractionstressorriskidentified
• Definitionofbiologicallymeaningfultriggerpointandcurrentlevelsofacceptablerisk.
• Unknowncostofmonitoringplan.

FORCE March 2016 Environmental Effects Monitoring Program 4.0 MARINE MAMMALS
FORCE 32
Objective SummaryofMethodology Rationale ProbabilityofSuccessandChallengesprobablestrikeon1endangeredspeciesorregulatordefinednumberofotherspecies
Consideruseofacousticalarmsdeployedonturbines(Wilsonetal.2013).
7)Possibleadaptivemanagementtrigger4:ExternalandrelevantEEMPstudiesprovideempiricalevidenceofsignificantrisktoporpoises(orotherkeymarinemammalsfoundinthestudyarea)
EMAC/Regulatorreviewofinformationrequired.
Acousticeffects:
ExtendC-PODstudyareamonitoringdurationandincreasecoverageofmidfieldstudyareaifwide-scaleeffectsdocumented.
Near-fielddynamiceffects:
Reviewefficacyandfuturedeploymentofcurrentlyavailablemonitoringsystems(includingAAM)toassessnear-fielddynamicinteractions.
Consideruseofacousticalarmsdeployedonturbines(Wilsonetal.2013).
• Adaptivemanagementtriggerifturbinestressorriskidentifiedandriskconsideredsignificant
• Definitionofbiologicallymeaningfultriggerpointandcurrentlevelsofacceptablerisk.
• Issuesidentifiedinotherstudiesmaybesitespecificorturbinespecific.
FORCE March 2016 Environmental Effects Monitoring Program 5.0 ACOUSTICS
FORCE 33
SECTION5:ACOUSTICS(MARINENOISE)5.0
Introduction5.1
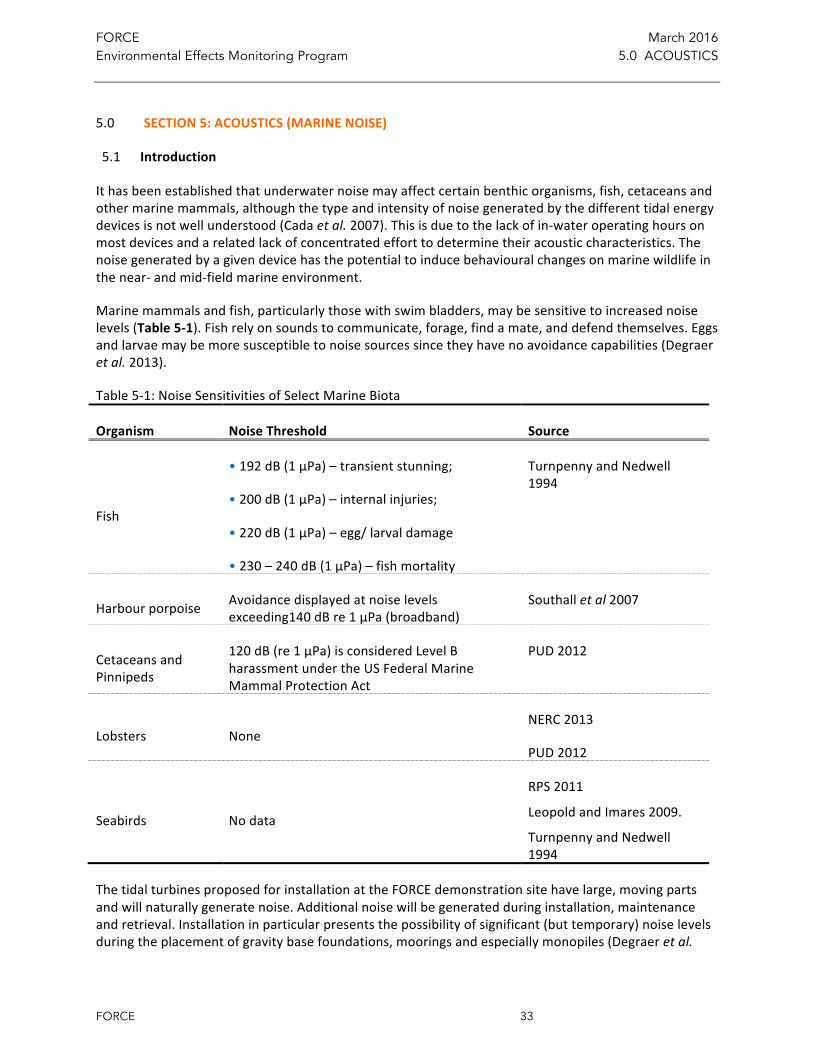
Ithasbeenestablishedthatunderwaternoisemayaffectcertainbenthicorganisms,fish,cetaceansandothermarinemammals,althoughthetypeandintensityofnoisegeneratedbythedifferenttidalenergydevicesisnotwellunderstood(Cadaetal.2007).Thisisduetothelackofin-wateroperatinghoursonmostdevicesandarelatedlackofconcentratedefforttodeterminetheiracousticcharacteristics.Thenoisegeneratedbyagivendevicehasthepotentialtoinducebehaviouralchangesonmarinewildlifeinthenear-andmid-fieldmarineenvironment.
Marinemammalsandfish,particularlythosewithswimbladders,maybesensitivetoincreasednoiselevels(Table5-1).Fishrelyonsoundstocommunicate,forage,findamate,anddefendthemselves.Eggsandlarvaemaybemoresusceptibletonoisesourcessincetheyhavenoavoidancecapabilities(Degraeretal.2013).
Table5-1:NoiseSensitivitiesofSelectMarineBiota
Organism NoiseThreshold Source
Fish
•192dB(1μPa)–transientstunning;
•200dB(1μPa)–internalinjuries;
•220dB(1μPa)–egg/larvaldamage
•230–240dB(1μPa)–fishmortality
TurnpennyandNedwell1994
Harbourporpoise Avoidancedisplayedatnoiselevelsexceeding140dBre1µPa(broadband)
Southalletal2007
CetaceansandPinnipeds
120dB(re1μPa)isconsideredLevelBharassmentundertheUSFederalMarineMammalProtectionAct
PUD2012
Lobsters NoneNERC2013
PUD2012
Seabirds Nodata
RPS2011
LeopoldandImares2009.
TurnpennyandNedwell1994
ThetidalturbinesproposedforinstallationattheFORCEdemonstrationsitehavelarge,movingpartsandwillnaturallygeneratenoise.Additionalnoisewillbegeneratedduringinstallation,maintenanceandretrieval.Installationinparticularpresentsthepossibilityofsignificant(buttemporary)noiselevelsduringtheplacementofgravitybasefoundations,mooringsandespeciallymonopiles(Degraeretal.
FORCE March 2016 Environmental Effects Monitoring Program 5.0 ACOUSTICS
FORCE 34
2013).Whilenomonopilesareplannedatthistime,itispossiblethatsuchfoundationswillbeusedinthefuturedeploymentofarraysofcertainTISECdevices.
Withinthe2009EA,nospecificnoiselevelwasidentifiedasexcessiveorlikelytocausesignificantimpact.Instead,“significantimpacts”withrespecttonoisearedefinedinrelationtoavoidanceby,orinjuryto,marinebirds,marinemammals,benthosandfish(AECOM2009).Nevertheless,anEEMPtoaddressnoiseisrequiredasaconditionofprovincialandfederalapprovalofthe2009EA.TheapprovalrequiresthattheEEMP“identifyappropriateenvironmentaleffectsindicators…and…considerprojecteffectson(amongothersubjects)acoustics.”
Tocomparenoiselevelsbetweendevicesandpredicteffectsonmarinebiota,twocriticaldatasetsareneeded:(a)thespatialandtemporaldistributionofambientnoiseand(b)turbinedevicenoiselevels,oftenreferredtoasthedevice“noiseprofile”or“sourcelevels”.Theselevelscanbeassessedbyconductingmeasurementsofambientnoiseanddevicebroadbandandnarrowbandsourcelevels.Thedevicedeveloperswillbeprovidinginformationontheirdevicenoiseprofilesinordertocomparenoiselevelsbetweendevicesandpredicteffectsonmarinebiota.
AttheFORCEsiteitisimpracticaltomeasuresoundlevelsatalllocationsanddepths.Moreover,hydrophonesdeployedontheseabottommeasurenoiseatasingle,nearbottompoint,whichmaynotprovidesufficientinformationtocharacterisesoundconditionsatdepthsfrequentedbyfishandmarinemammals.Toovercometheselimitations,acousticmodellingcanbeusedoverthelongertermtopredictsoundlevelsatalllocations,whichinturnareverifiedbytargetedpointmeasurementsundertakentovalidatethemodelpredictions.
Noiseisparticularlyamenabletonumericalmodellinggivenadequatedatarelatedtophysicaloceanography,baselinenoiselevels,andturbineacousticcharacteristics.Acousticimpactmodelshavebeensuccessfullydevelopedatothermarineenergysitesandusedtoretirerisksassociatedwithnoise(Ward2014).
Whileitisnotanticipatedthatthenoisegeneratedbytheinitialdemonstration-typeturbinedeploymentsattheFORCEsitewillhavesignificantimpactonmarinebiotaduetotheirlimitedscale(AECOM2009),noisedatacollectedatthedemonstrationstagewillprovideinformationthatcanbeusedtopredicteffectsonmarinebiota,furtherrefinethefishandmarinemammalEEMPs,andsupportanacousticmodeloverthelongerterm.AfixedautonomousrecorderwithashelteredinternalhydrophoneasdevelopedbyMartinandVallarta(2012)appearsabletodifferentiateturbinesourcenoisefromambientsounds.TheAMARequippedSmallFASTPlatformcanalsopotentiallybeusedtocollectpre-andpost-deploymentnoisedata,althoughitsdeploymentscheduleandoverallresearchobjectiveshavenotyetbeenestablished.
Theprimarydatagapsrelatedtonoisearethelimitedambientnoisedatacollectedtodate,thelackofoperatingturbinesthatcanbesubjectedtonoiseassessment,anddevicespecific“noiseprofiles”thatmustbeprovidedbythedevicedevelopers.
Objectives5.2
Giventhepresentlackofturbine“sourcenoiseprofiles”foruseinanacousticmodel,andbasedonthesummarypresentedintheConsultant’sReport,additionalfieldresearchisneededtodefinethemostsuccessfulmodelingapproachandmonitoringinstrumentationforuseintheMinasPassage.
FORCE March 2016 Environmental Effects Monitoring Program 5.0 ACOUSTICS
FORCE 35
SincetheConsultant’sReportwascompleted,theglobalperspectiveoncollectingnoisedatasuggeststhattheuseofdriftinghydrophonesisthepreferredapproach(Norrisetal.,2014).Incontrasttofixedinstrumentswherewaterflowingoverthemicrophonecombinedwiththemovementcobblesandpebblesalongtheseafloorcombinestocausesignificantnoisethatcanobscurethenoisefromturbines,driftinghydrophonesmovewiththecurrentandfloatabovetheseafloor.Thesecharacteristicspreventinterferencefromboththesoundofflowoverthehydrophoneandthesoundofrockmovementalongtheseafloor.
Overtheshortterm,thereisaneedto:
• Determinethemostappropriateacousticmodelandrelatedinputdatarequirements;
• Testdifferentinstrumentationcurrentlyunderdevelopmentbylocalacousticengineeringfirmsforbothdriftingandbottommounteddevices;
• Conductadriftinghydrophonetestsurvey;
• Testtheperformanceofoff-the-shelfacousticinstrumentsandnoiseshieldingtechniquesontheFORCE-ownedFASTplatformsinordertomorefullyestablishbaselineconditions.
• Usingoneormoreoftheinstrumentsaboveand/oradriftinghydrophoneapproach,collectadditionalnoisedatawiththeCLA;and
• UsethenoisedatatoeventuallyverifytheEApredictionsthatsuggestnoisefromoperationalturbineswillnotnegativelyaffectmarinebiota.
ForthepurposesofthisEEMP,weassumetheacousticcharacteristicsofspecificdevices,includingabsolutebroadbandandnarrowbandsourcelevelsacrosstheiroperatingrange,willbemeasuredordeterminedbythedeviceownersandthisinformationwillbesharedwithFORCE.
Methodology5.3
Ingeneral,adriftinghydrophonethatisacousticallyisolatedfromitsconveyancewillprovidebetterqualitydatathanahydrophonemooredontheseabedorrigidlyattachedtoastructuresuchasaturbine.Logistically,however,thedeploymentandcollectionofdriftinghydrophonesoverasufficienttimeperiodtoadequatelycharacterisetheacousticenvironmentishighlylabourintensiveandthismethodrequiresadditionalefforttoprocessmeasurements(Schmittetal.2015).Together,thesefactorscanmakedriftingprogramsdesignedtoestablishbaselineconditionsandfullycharacterisethenoiseprofileofanoperatingturbinemoreexpensivethanmooredprograms.Giventhis,mooredhydrophonesareinitiallyproposedinthisEEMPbutdriftinghydrophonesaresuggestedasalongertermmeanstoverifyandvalidatedatacollectedbyamooredsystem.
Ingeneral,locatingthehydrophoneclosetothedevicewillimprovethequalityofmeasurementsbyincreasingthemeasurementsignaltonoiseratioandsimplifyingrequirementsforacousticchannelmodelling.Safetyisthecriticalfactorindetermininghowcloseahydrophonecanbedeployedtoanoperatingturbine.Deploymentofafixedhydrophonewithin100mofanoperatingturbineisoptimal.Thisnear-fieldmonitoringwithin100moftheturbineistheresponsibilityoftheberthholder.
Inordertoachievetheobjectivesoutlinedabove,thefollowingactivitiesareproposed:
FORCE March 2016 Environmental Effects Monitoring Program 5.0 ACOUSTICS
FORCE 36
Collectambientmarinenoisedata
• Deployastreamlinedmooredhydrophonesystem..Adeploymentperiodontheorderofonetotwomonthsshouldbeconsideredtocapturenoiseconditionsovermultipletidalcycles.
• Thereissomeevidencetosuggestthatshielded,streamlinedhydrophonesmayinfactunder-measurenoiseduetotheactualshieldingdesignedtoreduceextraneousflownoise.Todeterminetheaccuracyofsuchamooredsystem,simultaneousdriftinghydrophonemeasurementsmaybeundertakenbyFORCEforcomparisonanddatavalidation.Alternatively,thehydrophonecanbereplacedwithadriftingnoisesourceemittingatknownfrequencies.Theaccuracyandsensitivityofthemooredsystemcanthenbeverifiedbasedonthisnoisesource.
• ReviewdatacollectedfromhydrophonesmountedontheturbinessubmittedinthetheberthholderEEMPreportsandintegratethisdatawithfuturenoisemeasurementprogramsandmodels.
• Identifyanappropriateacousticmodeltoaccommodatethedatageneratedbythedifferentinstruments.
FORCE March 2016 Environmental Effects Monitoring Program 6.0 MARINE SEABIRDS
FORCE 37
SECTION6:MARINESEABIRDS6.0
Introduction6.1
TheEEMPformarinebirdshasbeendesignedwithreferencetobirdsurveyspreviouslyundertakenatthesite(FORCE2011;2014;2015),existingguidanceonsurveymethodsandmonitoringprogramsfortidalenergyprojectsthatarecurrentlybeingundertakenbothinCanadianandScottishwaters(seeRPS2010;JacksonandWhitfield2011andRobbins2012).Ultimatelyhoweveranadaptivemanagementapproachthatallowsfor“flexibledecisionmakingthatcanbeadjustedasoutcomesfrommanagementactionsandothereventsbecomebetterunderstood”isproposedforthisprogram(FORCE2015).
Objectives6.2
Todate,marinebirdstudiesatFORCEhavenotbeenundertakeninthepresenceofafunctioningtidalturbine;turbinesareproposedfordeploymentbeginningin2016.Thepotentialfordirectcollisionbymarinedivingbirdswithtidalenergydevices,orharmfuleffectscausedbytheirpresence,includingthepotentialfordisplacementofmarinewildlifefromhabitualwaters,aretheprimaryconsiderationsaddressedinthisEEMP.
ThemainobjectiveofthisEEMPistoobtainrobustsite-specificspeciesabundanceandbehaviourdatawhichcanbeusedtoestablishwhethertheinstallation,presenceandoperationoftidalenergydevicescausesdisplacementofsurface-visiblewildlifefromhabitualwaters,andtoidentifyanydiscerniblechangestowildlifebehaviour.
TheEEMPproposedhereextendspreviousmonitoringprogramsandaimsto:
• ObtainmoredatawithrespecttotheoccurrenceandmovementofbirdspeciesinthevicinityoftheProjectsitetoverifytheexistingfindingsofshoreandboatbasedsurveys;and
• Withintheboundsofthecurrentsurveyprotocols,confirmEApredictionsrelatedtotheavoidanceand/orattractionofbirdstovesselsandtidalturbines.
Methodology6.3
6.3.1 MonitoringApproach
Post-deploymentmonitoringstudiesattheFORCEsitewillaim,wherenecessary,tobemorefocusedthanthepre-constructionbaselinesurveysalreadydescribed.Thefocuswillbeonthosespeciesidentifiedinthepre-deploymentassessmentprocesstobeofconcernalthoughoverall,birddensitiesintheProjectareawerefoundtoberatherlowinthecontextofthebroaderspatialdistributionsofbirdswithintheBayofFundy.
Thecontinuingmonitoringprogramwillaimtoquantifythemagnitudeofanychangesandprovideevidencetodemonstratewhethersuchchanges,shouldtheyarise,canbeattributedtothetidalenergydevelopmentorwhethertheyhaveoccurredforotherreasons.
JacksonandWhitfield(2011)notethatpostdeploymentmonitoringstudiesshouldprovideinformationon:

FORCE March 2016 Environmental Effects Monitoring Program 6.0 MARINE SEABIRDS
FORCE 38
• Changestotheabundance,distributionorbehaviourofspeciesconsideredtobeofhighormediumconservationimportance;
• Theextenttowhichpredictedadverseeffectssuchasdisturbanceandcollisionmortalityarerealised;and
• Theextenttowhich,overtime,speciesaffectedbydisturbanceanddisplacementhabituatetothepresenceofadevelopment.
6.3.2 StudyDesign
Althoughthestudywillneedtoberepeatableyearonyear,adegreeofflexibilityisrequiredastheuseofasitebymarinebirdsisoftenhighlyvariableandthiscanmakeitdifficulttoattributechangestoaparticularcause(suchasasingleturbinedeploymentinthemarineenvironment).Ifscientificallyvalidconclusionsaretobedrawnconcerningtheeffectsofdevelopment,studydesignmusttakeintoaccountnaturalvariationandchangeduetoothercauses.Ifthisisnotdonethenthemonitoringresultsarelikelytobeoflittlevalueastheyarelikelytolackthepowertoeitherdetectchangeoridentifythecauses(JacksonandWhitfield2011).
Thepost-deploymentmonitoringstudywilltargetthedevelopmentsiteandtheappropriatenearbyareasalreadyidentifiedinthebaselinesurveys.Theinclusionofabufferaroundthemainsurveyareawillprovideinformationonthebirdsusingtheareaimmediatelysurroundingadevelopment.
Asthisprojectis‘near-shore’(<4km)and<5km2intotalarea,abufferofatleast1kmisproposed.
6.3.3 SamplingFrequency
Thetimingofshore-basedsurveyvisitswillbeplannedsothattheyareastemporallyrepresentativeaspossible,includingthethreemaintemporalcycles:timeofday,timeofyearandstateofthetide.Althoughtimeofdayisnotgenerallyregardedasacontrollingfactorformarinebirdsurveys,surveyworkwillasfaraspossiblebeevenlydistributedthroughthedayfromdawntoduskwheredaylighthoursallow.
Birdsurveysaregenerallyundertakenatmonthlyintervalsthroughouttheyear.Althoughthereisvariationbetweenspecies,manymarinebirdsfollowabroadlysimilarannualtimetablewithregardtobreeding,moulting,migrationandwintering.Therefore,thesurveytimetablecanreflectthis,dividingtheyearupintoperiodsbasedaroundthemainannualstages,resultinginasurveythatislessthanmonthlyinfrequency(Table6-1).
Table6-1:ExamplePeriodsforMarineBirdSurveys.
YearPeriod Description ApproximateDates
1 Midwinter JanuaryandFebruary
2 Latewinter FebruaryandMarch
3 Earlybreedingseason April–midMay
4 Midbreedingseason MidMay–midJune
FORCE March 2016 Environmental Effects Monitoring Program 6.0 MARINE SEABIRDS
FORCE 39
5 Latebreedingseason MidJune–endJuly
6 Postbreeding/moult AugusttomidSeptember
7 Autumn MidSeptember–October
8 Earlywinter NovemberandDecember
(source:JacksonandWhitfield2011).Note:surveycanbeginatanytimeoftheyearbutallsampleeventsshouldbecompleted.
ForthepostdeploymentseabirdEEMP,monitoringwillbeconductedthroughouttheyear,basedontheyearperiodsdescribedinTable8-2.TheannualprogramisshownonTable6-2.ThefullmethodologiesforshoreandboatbasedsurveysaregiveninFORCE(2011)andwillbecontinuedwhererelevantforconsistencyandrepeatability.
Thebroadersurveyareahasalreadybeencharacterisedintermsofthespatialabundanceofmarinebirds;thesedataaresufficienttoprovidethewidercontextualpictureoftheavifaunasurroundingthedeploymentsite.AssuchnofurtherboatsurveysareproposedatthisstageunlessitisrequiredthatsuchsurveysprovideacontinuouspictureofbirdabundanceanddistributionintheMinasChannel.
6.3.4 EEMPFieldSurveys
Asnotedabove,thecurrentobservationalmonitoringofmarineseabirdshasprovidedacomprehensivefour-year,pre-deploymentdatasetusingstandardizedfieldproceduresanddatainterpretationguidelines.However,noturbineshavesofarbeeninstalledforasufficienttimetomonitoritseffectsonmarineseabirds.TherecommendedEEMPbuildsonthisprogram.
Demonstration-scaletidalturbineswillbedeployedinphasesoverthenextfiveyearsorso.Giventhedifferingdesigns(andhencethepotentialfordifferingeffectsonmarineseabirds)theproposedEEMPisdesignedtobeflexibleandadaptivetodifferentturbineforms,deploymentschedulesandresultsfromearlystudies.
TheproposedEEMPbeginsoncethefirsttwobottom-mountedCapeSharpTidalVentureturbinesareinstalledin2016andextendsthrough2017whenadditionalturbinesareslatedforinstallation.TheEEMPwillseektorepeatandaugmenttheprevioussurveysundertakenbetween2009and2012butwillfocusonthedeploymentareamorespecifically.
6.3.5 ShoreBasedSurveys
Toaccountforthevariabilityinthetemporalspanofshorebasedsurveysbetween2009and2012itisproposedthatfuturepostdeploymentshorebasedsurveysarerepeatableandcarriedoutduringthesamemonthsonayearbyyearbasis.ThesurveyswillmonitortheFORCEProjectareaincludingtheFORCEtestsite,theareabetweenBlackRockandshore(insideBlackRock),andtheMinasPassagebeyondBlackRock(outsideBlackRock)asinpreviousyears.
Thepre-deploymentsurveyshaveidentifiedspecificperiodsofhighabundanceanddiversity(albeitbetweenyears)withsteadyincreasesinabundancefromSpringtoearlySummer(MarchtoJuly)withapeakinJune.AfteraperiodoflowtomoderateabundancebetweenJulyandOctobernumberspeakedagainintheFallinearlyNovemberwhenlocalpopulationsweresupplementedbymigratory
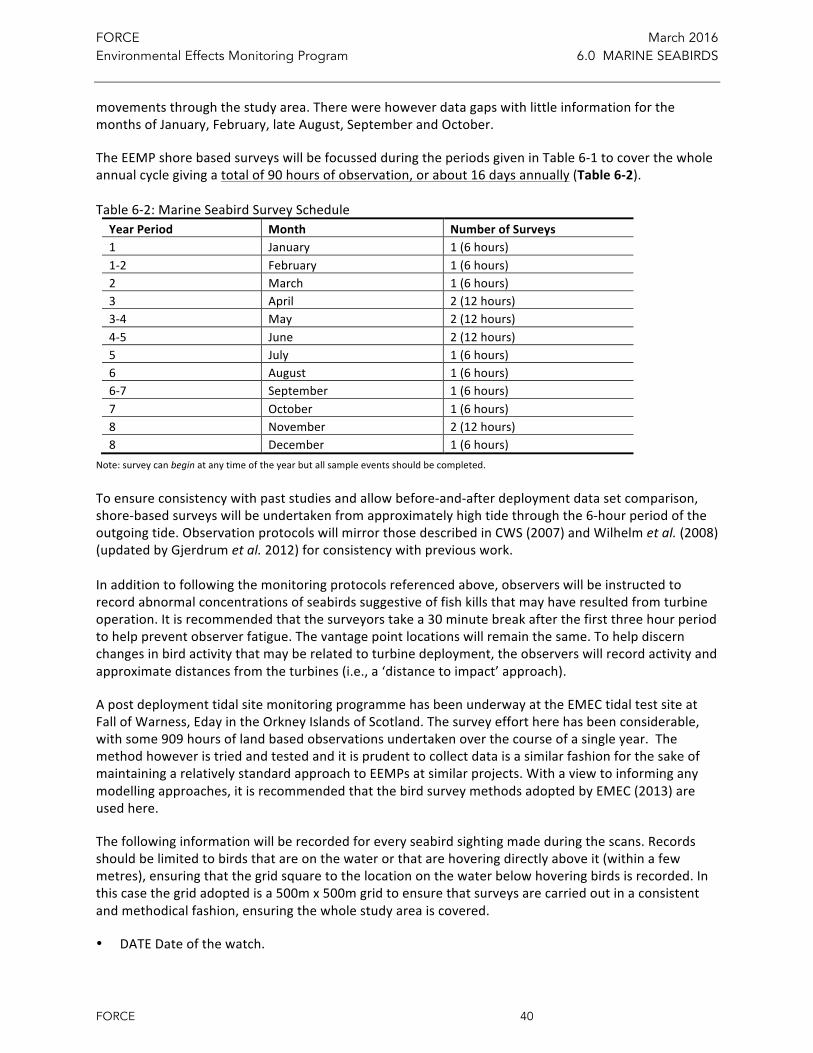
FORCE March 2016 Environmental Effects Monitoring Program 6.0 MARINE SEABIRDS
FORCE 40
movementsthroughthestudyarea.TherewerehoweverdatagapswithlittleinformationforthemonthsofJanuary,February,lateAugust,SeptemberandOctober.
TheEEMPshorebasedsurveyswillbefocussedduringtheperiodsgiveninTable6-1tocoverthewholeannualcyclegivingatotalof90hoursofobservation,orabout16daysannually(Table6-2).Table6-2:MarineSeabirdSurveyScheduleYearPeriod Month NumberofSurveys1 January 1(6hours)1-2 February 1(6hours)2 March 1(6hours)3 April 2(12hours)3-4 May 2(12hours)4-5 June 2(12hours)5 July 1(6hours)6 August 1(6hours)6-7 September 1(6hours)7 October 1(6hours)8 November 2(12hours)8 December 1(6hours)
Note:surveycanbeginatanytimeoftheyearbutallsampleeventsshouldbecompleted.Toensureconsistencywithpaststudiesandallowbefore-and-afterdeploymentdatasetcomparison,shore-basedsurveyswillbeundertakenfromapproximatelyhightidethroughthe6-hourperiodoftheoutgoingtide.ObservationprotocolswillmirrorthosedescribedinCWS(2007)andWilhelmetal.(2008)(updatedbyGjerdrumetal.2012)forconsistencywithpreviouswork.Inadditiontofollowingthemonitoringprotocolsreferencedabove,observerswillbeinstructedtorecordabnormalconcentrationsofseabirdssuggestiveoffishkillsthatmayhaveresultedfromturbineoperation.Itisrecommendedthatthesurveyorstakea30minutebreakafterthefirstthreehourperiodtohelppreventobserverfatigue.Thevantagepointlocationswillremainthesame.Tohelpdiscernchangesinbirdactivitythatmayberelatedtoturbinedeployment,theobserverswillrecordactivityandapproximatedistancesfromtheturbines(i.e.,a‘distancetoimpact’approach).
ApostdeploymenttidalsitemonitoringprogrammehasbeenunderwayattheEMECtidaltestsiteatFallofWarness,EdayintheOrkneyIslandsofScotland.Thesurveyeffortherehasbeenconsiderable,withsome909hoursoflandbasedobservationsundertakenoverthecourseofasingleyear.ThemethodhoweveristriedandtestedanditisprudenttocollectdataisasimilarfashionforthesakeofmaintainingarelativelystandardapproachtoEEMPsatsimilarprojects.Withaviewtoinforminganymodellingapproaches,itisrecommendedthatthebirdsurveymethodsadoptedbyEMEC(2013)areusedhere.
Thefollowinginformationwillberecordedforeveryseabirdsightingmadeduringthescans.Recordsshouldbelimitedtobirdsthatareonthewaterorthatarehoveringdirectlyaboveit(withinafewmetres),ensuringthatthegridsquaretothelocationonthewaterbelowhoveringbirdsisrecorded.Inthiscasethegridadoptedisa500mx500mgridtoensurethatsurveysarecarriedoutinaconsistentandmethodicalfashion,ensuringthewholestudyareaiscovered.
• DATEDateofthewatch.
FORCE March 2016 Environmental Effects Monitoring Program 6.0 MARINE SEABIRDS
FORCE 41
• TIMETimeofthesighting.• SIGHTINGEQUIPMENTTheequipmentusedtosightthebird(s).• GRIDSQUAREThegridsquaretowhichthesightingwasallocated.• NUMBEROFSPECIESAsbirdsoftenformmixedgroups,providethenumberofspecieswithineach
group.• SPECIESThespeciessighted.Asitisoftendifficulttodistinguishbirdstospecieslevels,theoptionis
giventoenter'Unidentified'.FurtherdetailscanbeprovidedintheCOMMENTSsection.• NUMBEREstimatedtotalnumberofbirds(regardlessofspecies)inthegroup.
Detailsofthefollowingbirdbehaviorsshouldalsoberecorded.Anycombinationofthemcanbeincluded.
• DIVINGFROMFLIGHTOneormorebirdsdivingunderwaterfromahoveringorflyingposition.• DIVINGFROMWATEROneormorebirdsdivingunderwaterfromapositiononthewatersurface.• SWIMMINGATSURFACEThebirdsaremakingprogressatthesurface.• STATIONARYATSURFACEThebirdsarestationaryatthesurface.• COMMENTSAnyotherrelevantinformationaboutthesightingshouldbeincludedhere.Thismay
includedetailssuchasarecordoftheageorsexclassesofthebirds(i.e.,ifthereareanyrelativelysmallanimalsinthegrouporiftherearepredominantlymalesorfemales),andinteractionswiththeturbines(resting,nesting,collisions,etc.).
6.3.6 DataAnalysis
Inprevioussurveyreportsi.e.FORCE(2011)marinebirddatahasbeenanalysedusingtwowayanalysesofvariance(ANOVA)thatconsideredthedifferenceinmarinebirdabundancebetweensitesandbetweenyearsusingdensityperkm2astheunitofmeasurement.Asimilarmethodisproposedtoassessanypotentialsitespecificeffects,ensuringthatwherecountdataarenotnormallydistributed(asislikely)thenthesedataareeithertransformedtonormalityoranequivalenttoolusedfornon-normallydistributeddata.SuchatoolmayincludeforexampleMood’smediantestoraKruskal-Wallistest.

FORCE March 2016 Environmental Effects Monitoring Program 7.0 SUMMARY
FORCE 42
SECTION7:SUMMARY7.0
EEMPshavebeencreatedforfivesubjectareas,basedonworkconductedtodateandthelessonslearnedduringbaselinedatacollection.
1.Fish;
2.Lobster;
3.MarineBirds;
4.MarineMammals;and
5.Acoustics.
Table7-1tentativelyshowshoweachEEMPwouldbedeployedonayear-to-yearbasis.TheactualscheduleofeachEEMPwilldependonanumberoffactorsincludingweatherconditions,devicedeploymentschedule,vesselavailability,etc.
AsnotedintheIntroduction,theEEMPsaredesignedtobeflexibleandadaptivetotheTISECdeploymentschedules.Inkeepingwiththe“adaptivemanagement”approachusedsincethebeginningoftheFORCEproject,modificationstotheEEMPs(ifneeded)canbeimplementedoncethedeploymentscheduleisbetterknown.Asmoreturbinesaredeployed,actualimpactsmaydifferfromimpactsmeasuredatsingledevicesandtheEEMPscanbeadjustedtoaccountforthis.
FORCE’sexperienceinMinasPassagehasdemonstratedhowchallengingitcanbetoundertakeworkinthishighenergyenvironment.Pastworkhasalsohighlightedlimitationstoequipmenttypesandmonitoringapproaches,andhasdemonstratedwhereadditionalexplorationisneeded.TheEEMPsprovideaninitial,systematicapproachtodetectingenvironmentalchangesthatcanbeattributedtotheturbines.TheresultsofthesestudiescanbeusedbyFORCE,theirEMAC,thegeneralpublic,regulatorsandtheberthholderstofirstmeasureandthenassessthelikelyenvironmentaleffectsoftheirtidalenergydevices.
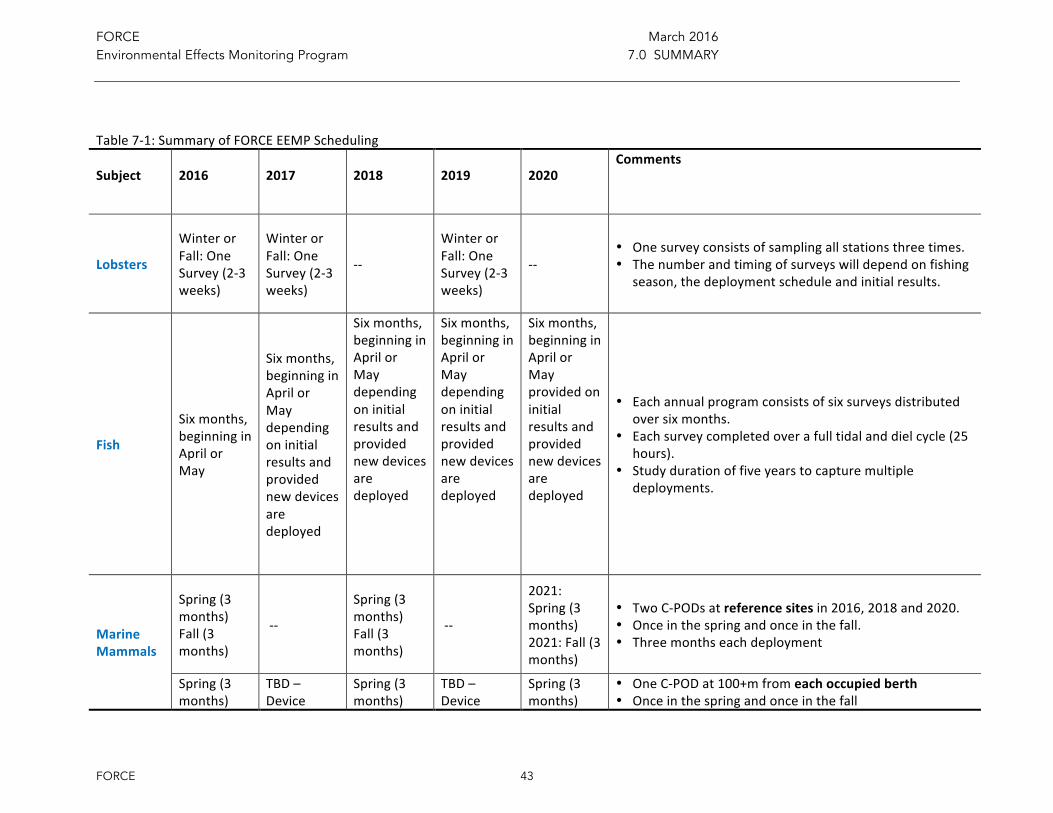
FORCE March 2016 Environmental Effects Monitoring Program 7.0 SUMMARY
FORCE 43
Table7-1:SummaryofFORCEEEMPScheduling
Subject 2016 2017 2018 2019 2020Comments
Lobsters
WinterorFall:OneSurvey(2-3weeks)
WinterorFall:OneSurvey(2-3weeks)
--
WinterorFall:OneSurvey(2-3weeks)
--• Onesurveyconsistsofsamplingallstationsthreetimes.• Thenumberandtimingofsurveyswilldependonfishing
season,thedeploymentscheduleandinitialresults.
Fish
Sixmonths,beginninginAprilorMay
Sixmonths,beginninginAprilorMaydependingoninitialresultsandprovidednewdevicesaredeployed
Sixmonths,beginninginAprilorMaydependingoninitialresultsandprovidednewdevicesaredeployed
Sixmonths,beginninginAprilorMaydependingoninitialresultsandprovidednewdevicesaredeployed
Sixmonths,beginninginAprilorMayprovidedoninitialresultsandprovidednewdevicesaredeployed
• Eachannualprogramconsistsofsixsurveysdistributedoversixmonths.
• Eachsurveycompletedoverafulltidalanddielcycle(25hours).
• Studydurationoffiveyearstocapturemultipledeployments.
MarineMammals
Spring(3months)Fall(3months)
--
Spring(3months)Fall(3months)
--
2021:Spring(3months)2021:Fall(3months)
• TwoC-PODsatreferencesitesin2016,2018and2020.• Onceinthespringandonceinthefall.• Threemonthseachdeployment
Spring(3months)
TBD–Device
Spring(3months)
TBD–Device
Spring(3months)
• OneC-PODat100+mfromeachoccupiedberth• Onceinthespringandonceinthefall
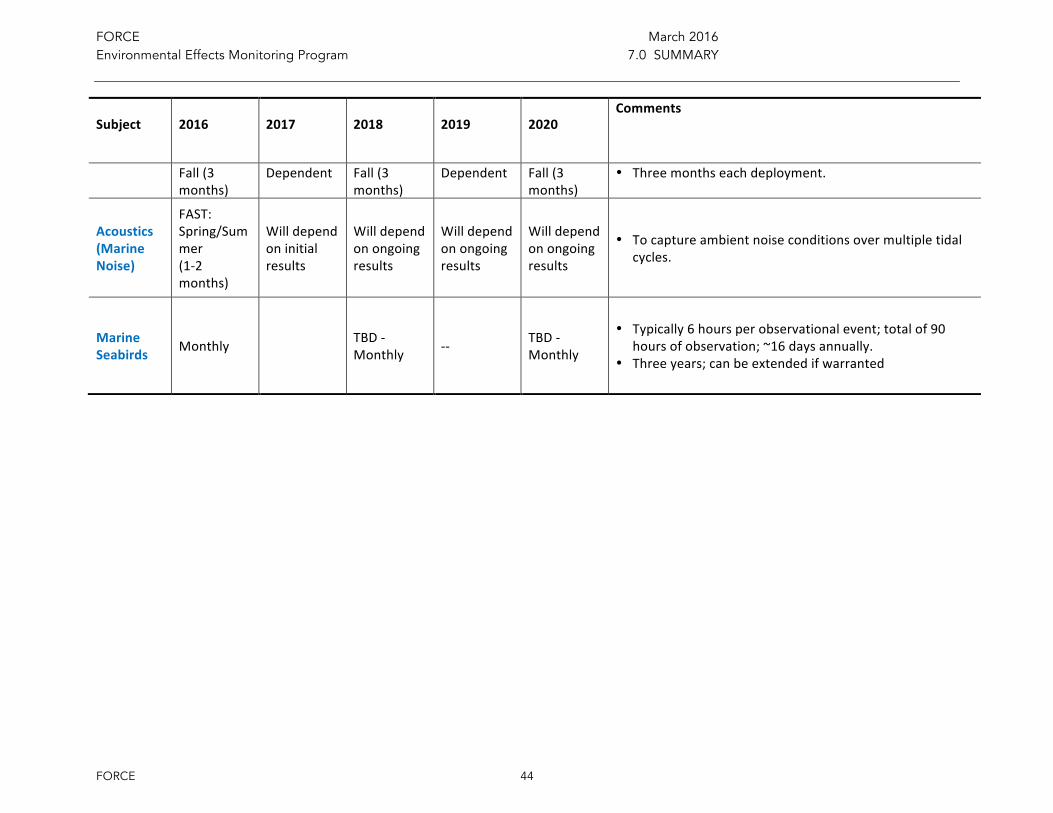
FORCE March 2016 Environmental Effects Monitoring Program 7.0 SUMMARY
FORCE 44
Subject 2016 2017 2018 2019 2020Comments
Fall(3months)
Dependent Fall(3months)
Dependent Fall(3months)
• Threemonthseachdeployment.
Acoustics(MarineNoise)
FAST:Spring/Summer(1-2months)
Willdependoninitialresults
Willdependonongoingresults
Willdependonongoingresults
Willdependonongoingresults
• Tocaptureambientnoiseconditionsovermultipletidalcycles.
MarineSeabirds Monthly TBD-
Monthly -- TBD-Monthly
• Typically6hoursperobservationalevent;totalof90hoursofobservation;~16daysannually.
• Threeyears;canbeextendedifwarranted
FORCE March 2016 Environmental Effects Monitoring Program 8.0 REFERENCES
FORCE 45
SECTION8:REFERENCES8.0
AECOM.2009.EnvironmentalAssessmentRegistrationDocument–FundytidalEnergyDemonstrationProject(Volume1:EnvironmentalAssessment;Volume2:Appendices).ProjectNumber107405.June2009.
AECOM.2010.EnvironmentalAssessmentAddendumtotheReport:EnvironmentalAssessmentRegistrationDocument–FundytidalEnergyDemonstrationProjectVolumes1and2datedJune10,2009.ProjectNumber60153932July2010.52pp.
Amaral,S.V.,M.S.Bevelhimer,G.F.Cada,D.J.Giza,P.T.Jacobson,B.J.McMahon,andB.M.Pracheil.2015.Evaluationofbehaviorandsurvivaloffishexposedtoanaxial-flowhydrokineticturbine.NorthAmericanJournalofFisheriesManagement35:97-113.
Bayley,P.2010.CommentsontheLobsterMonitoringComponentoftheFundyTidalProject.IncludedasAppendixAofCEF2011(seebelow).
Cada,G.,Ahlgrimm,M.,Bahleda,T.andSale,M.2007.Potentialimpactsofhydrokineticandwaveenergyconversiontechnologiesonaquaticenvironments.Fisheries,vol.32,no4.Pp.174-181.
CEFConsultantsLtd.2010.LobsterCatchMonitoring.AnalysisofResultsfromTwoFallSurveys:September25–October3andNovember5-18,2009.March2010.44pp.
CEFConsultantsLtd.2011.LobsterCatchMonitoring.SummaryofResultsfromThreeSurveyswithRecommendationsforaRevisedSurveyDesign.February2011.44pp.
Collins,N.2012.AssessmentofPotentialEcosystemEffectsfromElectromagneticFields(EMF)AssociatedwithSubseaPowerCablesandTISECDevicesinMinasChannel.PreparedbyCEFConsultantsforFORCE.
CWS:CanadianWildlifeService.2007RecommendedProtocolsforMonitoringImpactsofWindTurbinesonBirds.EnvironmentCanada,CanadianWildlifeService.April2007.33pp.
Degraer,S.,BrabantR,andRumes,B.2013.EnvironmentalImpactsofOffshoreWindFarmsintheBelgianPartoftheNorthSea.LearningfromthePasttoOptimiseFutureMonitoringProgrammes.
DFO:FisheriesandOceansCanada.2012.AppropriatenessofExistingMonitoringStudiesfortheFundyTidalEnergyProjectandConsiderationsforMonitoringCommercialScaleScenarios.DFOCan.Sci.Advis.Sec.Sci.Resp.2012/013.9pp.
EC:EnvironmentCanada.2014BestpracticesforstrandedbirdsencounteredoffshoreAtlanticCanada.Draft2-April2015.
Ellison,W.T.,B.L.Southall,C.W.Clark,andA.S.Frankel2012.Anewcontext-basedapproachtoassessmarinemammalbehavioralresponsestoanthropogenicsounds.Cons.Bio.,26(1):21-28.
EMEC2013FallofWarnessWildlifeObservationsMethodologyGUIDE017-0120130327.
FORCE March 2016 Environmental Effects Monitoring Program 8.0 REFERENCES
FORCE 46
EnvironmentalMonitoringAdvisoryCommittee(EMAC).March2016.EMACRecommendationsRegardingtheFORCEEnvironmentalEffectsMonitoringProgram(EEMP)for2016andBeyond.
Foote,K.G.,H.P.Knudsen,G.Vestnes,D.N.MacLennan,andE.J.Simmonds.1987.Calibrationofacousticinstrumentsfordishdensityestimation:Apracticalguide.ICESCooperativeResearchReport144.
FORCE:FundyOceanResearchCenterforEnergy.2011.EnvironmentalEffectsMonitoringReport.September2009toJanuary2011.October2011.EEMstudiespresentedasAppendixA-K.
FORCE:FundyOceanResearchCenterforEnergy.2014.Research+MonitoringPrograms2008-2013.53pp.
FORCE:FundyOceanResearchCenterforEnergy.2015.EnvironmentalEffectsMonitoringReport.January2011toDecember2013.42pp.
Gjerdrum,C.,FifieldD.A.,andS.Wilhelm2012.EasternCanadaSeabirdsatSea(ECSAS)StandardizedProtocolforPelagicSeabirdSurveysfromMovingandStationaryPlatforms.TechnicalReportSeriesNo.515April2012CanadianWildlifeServiceAtlanticRegion.
Jackson,D.,andWhitfield,P.2011.GuidanceonsurveyandmonitoringinrelationtomarinerenewablesdeploymentsinScotland.Volume4.Birds.UnpublisheddraftreporttoScottishNaturalHeritageandMarineScotland.
Kastelein,R.A.,Au,W.W.,anddeHaan,D.2002.Audiogramofaharbourporpoises(Phocoenaphocoena)measuredwithnarrow-bandfrequency-modulatedsignals.J.Acoust.Soc.Am.112:1334-344.
Martin,B.andJ.Vallarta.2012.AcousticMonitoringintheBayofFundy.JASCODocument00393,Version1.1.TechnicalReportforFORCE.
Melvin,G.D.andN.A.Cochrane.2014.Investigationoftheverticaldistribution,movement,andabundanceoffishinthevicinityofproposedtidalpowerenergyconversiondevices.FinalReportforOffshoreEnergyResearchAssociation,ResearchProject300-170-09-12.
Melvin,G.B.andN.A.Cochrane.2015.Multibeamacousticdetectionoffishandwatercolumntargetsathigh-flowsites.EstuariesandCoasts38:227-240.
Norris,J.Cowan,D.,BristowC.D.MagagnaandJ.Geibhardt.2014.D4.7:BestPracticeReportonEnvironmentalMonitoringandNewStudyTechniques.MarineRenewableInfrastructureNetwork(MARINET).105pp.
NSE:NovaScotiaDepartmentoftheEnvironment.2009.ConditionsofEAApprovalProposedFundyTidalEnergyDemonstrationProject.(September2009)DepartmentoftheEnvironment,OfficeoftheMinister.
Porskamp,P.,Redden,A.M.,Broome,J.,SandersonB.,andWood,J.2015.AssessingmarinemammalpresenceinandneartheFORCELeaseAreaduringwinterandearlyspring–addressingbaselinedatagapsandsensorperformance.FinalReporttotheOffshoreEnergyResearchAssociationandFORCE.ACERTechnicalReportNo121,35pp.
FORCE March 2016 Environmental Effects Monitoring Program 8.0 REFERENCES
FORCE 47
Robbins,A.2012.AnalysisofBirdandMarineMammalDataforFallofWarnessTidalTestSite,Orkney.ScottishNaturalHeritageCommissionedReportNo.614.
RPS.2010.BoatandaerialsurveyprotocolsforseabirdsatwaveandtidalsearchareasinnorthwesternScotland.ScottishNaturalHeritageCommissionedReportNo.623.
Schmitt,P.,Elsaesser,B.,Coffin,M.,Hood,J.,Starzmann,R.2015.Fieldtestingafull-scaletidalturbine.Part3:AcousticCharacteristics.EuropeanWaveandTidalEnergyConference,2015.
Smith,E.2002.BACIdesign.EncyclopediaofEnvironmetrics1:141-148,JohnWileyandSons.
Southall,B.,Bowles,A.,Ellison,W.,Finneran,J.,Gentry,R.,Greene,C.,Kastak,D.,Ketten,D.,Miller,J.,Nachtigall,P.,Richardson,W.,Thomas,J.,andTyack,P.2007.Marinemammalnoiseexposurecriteria:initialscientificrecommendations.AquaticMammals,33(4).Staines,G.,Zydlewski,G.B.,Viehman,H.A.,Shen,H.,andMcCleave,J.D.2015.ChangesinverticalfishdistributionsnearahydrokineticdeviceinCobscookBay,Maine,USA.Proceedingsofthe11thEuropeanWaveandTidalEnergyConference(EWTEC)September6-11,Nantes,France.
Tougaard,J.,Henriksen,O.andMilllerL.2009.UnderwaterNoiseFromThreeTypesOfOffshoreWindTurbines:EstimationOfImpactZonesForHarborPorpoisesAndHarborSeals.AcousticalSocietyofAmerica1266:3766-3773
Viehman,H.A.G.B.Zydlewski,J.D.McCleave,andG.J.Staines.2015.Usinghydroacousticstounderstandfishpresenceandverticaldistributioninatidallydynamicregiontargetedforenergyextraction.EstuariesandCoasts38:215-226.
Wilhelm,S.I.,C.Gjerdrum,andD.A.Fifield.2008.StandardizedprotocolforpelagicseabirdsurveysconductedineasternCanadafrommovingandstationaryplatforms.CanadianWildlifeService,AtlanticRegion,TechnicalReportSeriesNumber(inpress).
Woodruff,D.L.,Cullinan,V.I.,Copping,A.E.,andK.E.Marshall.2013.EffectsofElectromagneticFieldsonFishandInvertebrates.Task2.1.3:EffectsonAquaticOrganismsFiscalYear2012ProgressReport.EnvironmentalEffectsofMarineandHydrokeneticEnergy.PreparedfortheUSDOE.62pp.

FORCE March 2016 Environmental Effects Monitoring Program 8.0 REFERENCES
FORCE 48