Embed Size (px)
Citation preview

APPENDIX 7C
AQ2 2020b - SITE WATER BALANCE
Level 4, 56 William Street Perth WA 6000
Tel +61 8 9322 9733
www.aq2.com.au
AQ2 Pty Ltd ABN 38 164 858 075
Memo
F:\136\3.C&R\136B 005b.docx 1
To Craig Bovell Company Doral Mineral Sands
From Mark Nicholls Job No. 136B
Date 13/05/2020 Doc No. 136B 005b
Subject Yalyalup Mineral Sands Operation – Site Water Balance Craig, We are pleased to provide you with the following report outlining the site water balance work which has been completed for the Yalyalup Mineral Sands Operation.
1. INTRODUCTION
The Yalyalup heavy mineral resource is located ~10-14 km SE of the Busselton CBD. It is midway between Iluka’s Tutunup South Mine (closed in 2018) and Cristal’s Wonnerup Mine (expanding eastwards). Exploration by third parties, outlined heavy minerals in road reserves and selected properties prior to 2011. Doral took control of exploration leases in 2011 and began exploration drilling in 2012.
The current project areas lie completely within the “Lower Sabina” catchment. Potential north eastern extensions of the Project might overlap the modified channels of the Abba River. Surface water flows from the south of the Project are diverted around the project area via the Woddidup diversion, Sabina diversion and Vasse diversion drains (into Geographe Bay, not the Vasse-Wonnerup wetlands).
The heavy mineral sands resource is located within the Superficial Formation sediments i.e. Bassendean Sand at the top and the Yoganup Formation towards the base. These two units are separated by the Guildford Formation throughout the project area. The thickness of the Superficial Formation is irregular, with a maximum of 9 to 12 m at the site, but generally being 7 to 8 m thick. The Bassendean Sand, Guildford Formation and Yoganup Formation form an unconfined Superficial aquifer at the site. The Bassendean and Yoganup are the more transmissive units, whereas the intervening Guildford has a low permeability, owing to its clayey nature.
AQ2 was engaged by Doral to prepare a conceptual site water balance for the Yalyalup operations, to assist in Doral’s environmental submissions (i.e. Environmental Review Document (ERD)) which aim to demonstrate that the operation can meet the Department of Water and Environmental Regulation (DWER, former Environmental Protection Agency (EPA)) objectives: “To maintain the hydrological regimes and the quality of groundwater and surface water, so that environmental values are protected”. A site water balance has been created, with the model setup and results documented in the following report.
2. WATER BALANCE OBJECTIVES
The objectives of the water balance are documented in Doral’s Environmental Scoping Document (ESD) and include:
Prepare a conceptual water balance to determine the site water demands over the life of the project. This will include:
o All fluxes (and their seasonal variations);
F:\136\3.C&R\136B 005b.docx 2
o Discussion of capacity to reuse surplus mine dewater;
o Requirements for supplementary process water to be sourced from the Yarragadee aquifer.
In addition to this water balance study, AQ2 has also completed a groundwater assessment (AQ2, 2019a) and a surface water assessment (AQ2, 2019b) for the project, which provide some input and logic to this report.
A water balance was created in GoldSim for the Yalyalup project. GoldSim is a Monte Carlo simulation software, that allows users to create customised models based on built-in functions within the software. The software is well suited for water balance projects and allows users to set input data as a probability distribution, which is randomly sampled in the Monte Carlo analysis.
3. WATER BALANCE MODEL SETUP AND INPUT DATA
3.1 Model Overview
The GoldSim water balance model was set to run on a daily timestep for 100 model iterations for the 3.5-year mine life. Input data/parameters to the model have been set as either a constant value, time-series or probability distribution.
The model operation can be summarised as follows:
At each time step, open pit areas have been assumed as per the mining schedule provided by Doral.
Each open pit area has an external surface water catchment area which, reports to the pit during the period over which the pit is open.
The Process Water Dam (PWD) and Drop-Out Dam (DOD) collect local runoff from the adjacent plant, admin and impervious areas, plus receive pumped water being removed from the open pits (dewatering plus stormwater).
At each model timestep (daily), rainfall is included within the model, with runoff collected in the base of the operating pit, and within the PWD and DOD.
Dewatering inflow rates over the mine life, obtained from groundwater modelling studies, have been used as an inflow to the active pit area.
Water collected within the active pit area is pumped to the PWD/DOD at an assumed transfer rate (nominally 75L/s).
Process water demand is sourced from the PWD/DOD.
The model tracks water which exceeds the PWD/DOD capacity (i.e. potentially requires discharge), plus water shortfall from the PWD/DOD (i.e. needs to be supplemented by pumping from the Yarragadee aquifer).
The model has been run for two dewatering scenarios resulting from different rainfall patterns being applied to the groundwater model – a wet rainfall sequence (“Wet Dewatering” scenario) and a dry rainfall sequence (“Dry Dewatering” scenario). Further information is provided below.
Note that Doral will make every effort to maximise water recycling and to minimise water use. Process water will, in the first instance, be sourced from recycled water and dewatering of the pits. Additional process water sourced from the Yarragadee aquifer bore will be used only after other resources have been fully utilised. Water will not be intentionally discharged offsite when it cannot be used for any other purpose. Water will be discharged offsite when the storages at PWD/DOD are at their full capacity (overtop) in the event of sufficiently sustained period of high rainfall events results in site runoff exceeding the mine water demand.
F:\136\3.C&R\136B 005b.docx 3
3.2 Rainfall Data
The synthetic rainfall patterns programmed into the GoldSim model are based on historic daily rainfall records from the SILO enhanced climate database service for the Busselton Aero Rainfall Station location (station number 9603). The SILO rainfall data set patches any missing data records for Busselton Aero Rainfall Station, with interpolated values from other nearby weather stations to create a continuous rainfall data set between 1/1/1960 and 31/12/2018 (58 years).
The 58 years of daily rainfall data was used as an input to the eWater program SCL (Stochastic Climate Library). The SCL uses historic rainfall data as an input and produces a synthetic rainfall data set for the required duration, which is a statistical fit to observed rainfall. For this project, 100 sets of 4 years of daily rainfall data was produced by the program.
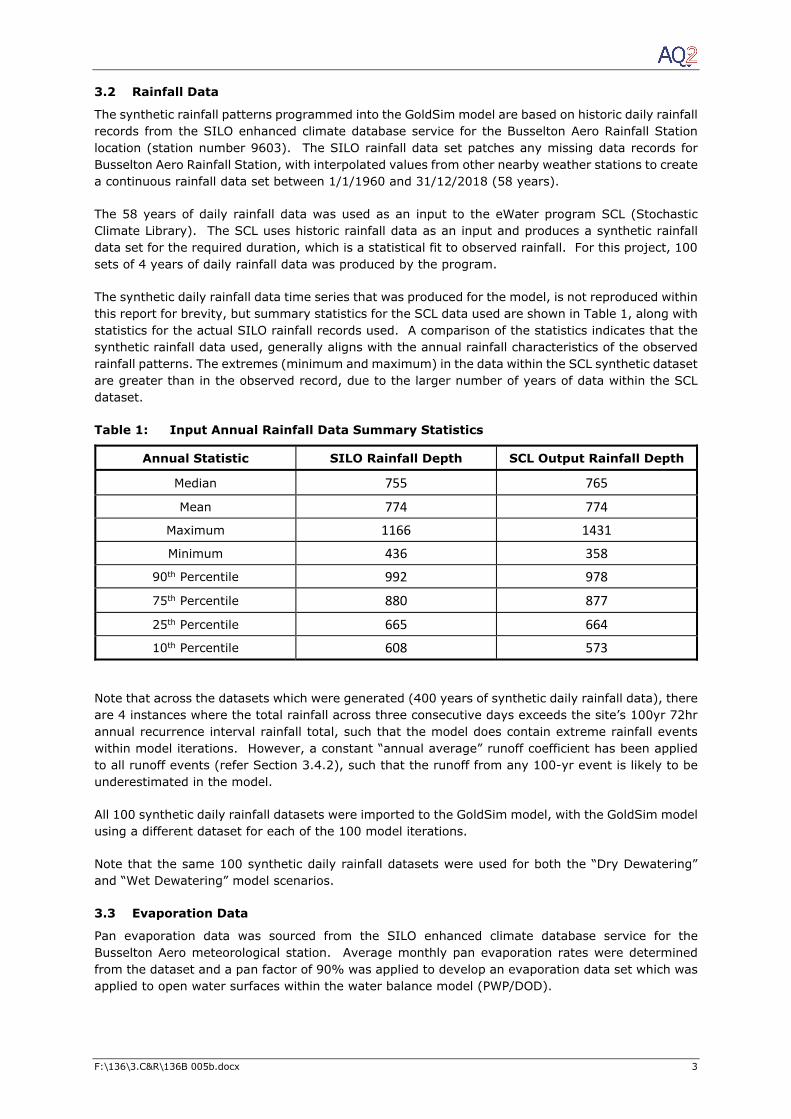
The synthetic daily rainfall data time series that was produced for the model, is not reproduced within this report for brevity, but summary statistics for the SCL data used are shown in Table 1, along with statistics for the actual SILO rainfall records used. A comparison of the statistics indicates that the synthetic rainfall data used, generally aligns with the annual rainfall characteristics of the observed rainfall patterns. The extremes (minimum and maximum) in the data within the SCL synthetic dataset are greater than in the observed record, due to the larger number of years of data within the SCL dataset.
Table 1: Input Annual Rainfall Data Summary Statistics
Annual Statistic SILO Rainfall Depth SCL Output Rainfall Depth
Median 755 765
Mean 774 774
Maximum 1166 1431
Minimum 436 358
90th Percentile 992 978
75th Percentile 880 877
25th Percentile 665 664
10th Percentile 608 573
Note that across the datasets which were generated (400 years of synthetic daily rainfall data), there are 4 instances where the total rainfall across three consecutive days exceeds the site’s 100yr 72hr annual recurrence interval rainfall total, such that the model does contain extreme rainfall events within model iterations. However, a constant “annual average” runoff coefficient has been applied to all runoff events (refer Section 3.4.2), such that the runoff from any 100-yr event is likely to be underestimated in the model.
All 100 synthetic daily rainfall datasets were imported to the GoldSim model, with the GoldSim model using a different dataset for each of the 100 model iterations.
Note that the same 100 synthetic daily rainfall datasets were used for both the “Dry Dewatering” and “Wet Dewatering” model scenarios.
3.3 Evaporation Data
Pan evaporation data was sourced from the SILO enhanced climate database service for the Busselton Aero meteorological station. Average monthly pan evaporation rates were determined from the dataset and a pan factor of 90% was applied to develop an evaporation data set which was applied to open water surfaces within the water balance model (PWP/DOD).
F:\136\3.C&R\136B 005b.docx 4
3.4 Pit Data
3.4.1 Pit Void
The volume of water stored within the open pit void was modelled within the water balance. The storage capacity of each pit void was not considered within the model, on the assumption that the volume within the pit would not be exceeded by the incoming surface water and groundwater inflows.
Water collected within the pit (groundwater plus surface water) is pumped to the DOD/PWP at a rate matching the inflow rate, up to an assumed maximum pumping rate of 75L/s (6,480m3/d). If inflows exceed 75L/s, water is assumed to be stored within the base of the pit until the inflow falls and the pump out rate removes the stored volume. Note that the assumed maximum transfer rate from the pit to the DOD/PWP exceeds the mine water demand and may lead to overflow from the DOD/PWP, if the maximum transfer rate is sustained.
No loss of ponded water within the pit was assumed due to evaporation or seepage within the water balance model. Seepage losses will be negligible given groundwater dewatering requirements, and evaporation losses are likely to be insignificant given that the pit pumping system is operated to keep the pit dry.
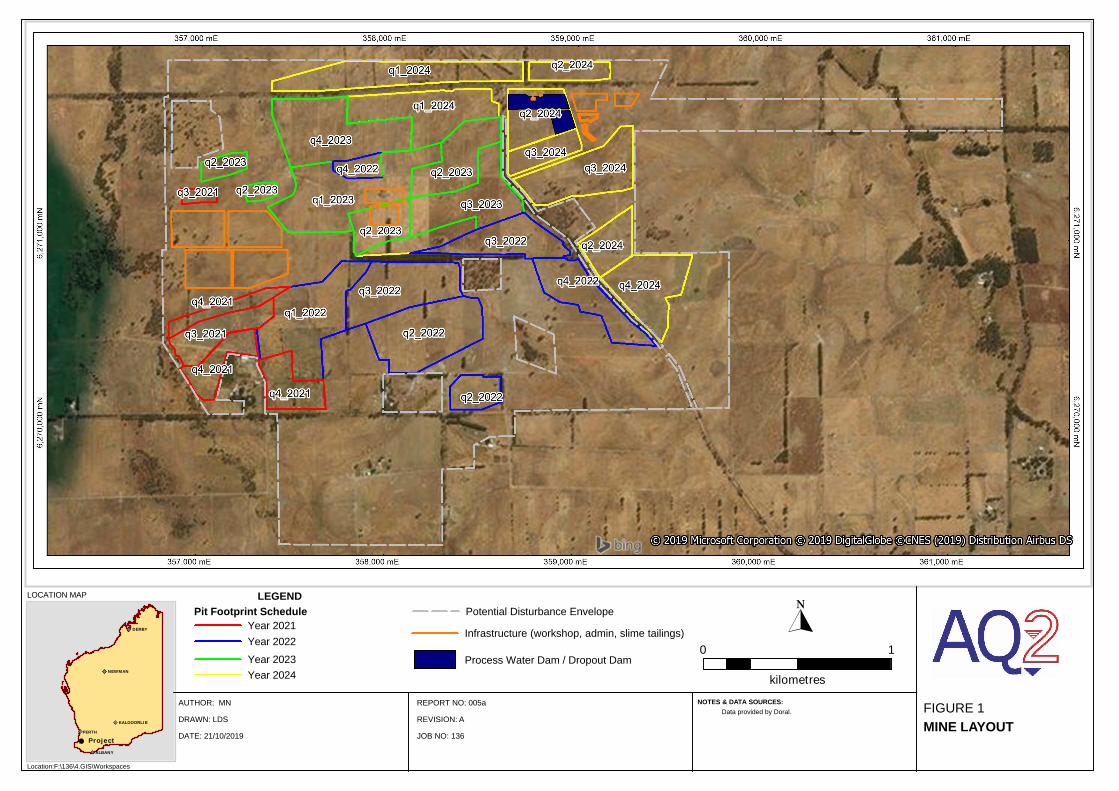
3.4.2 Pit Catchment Areas
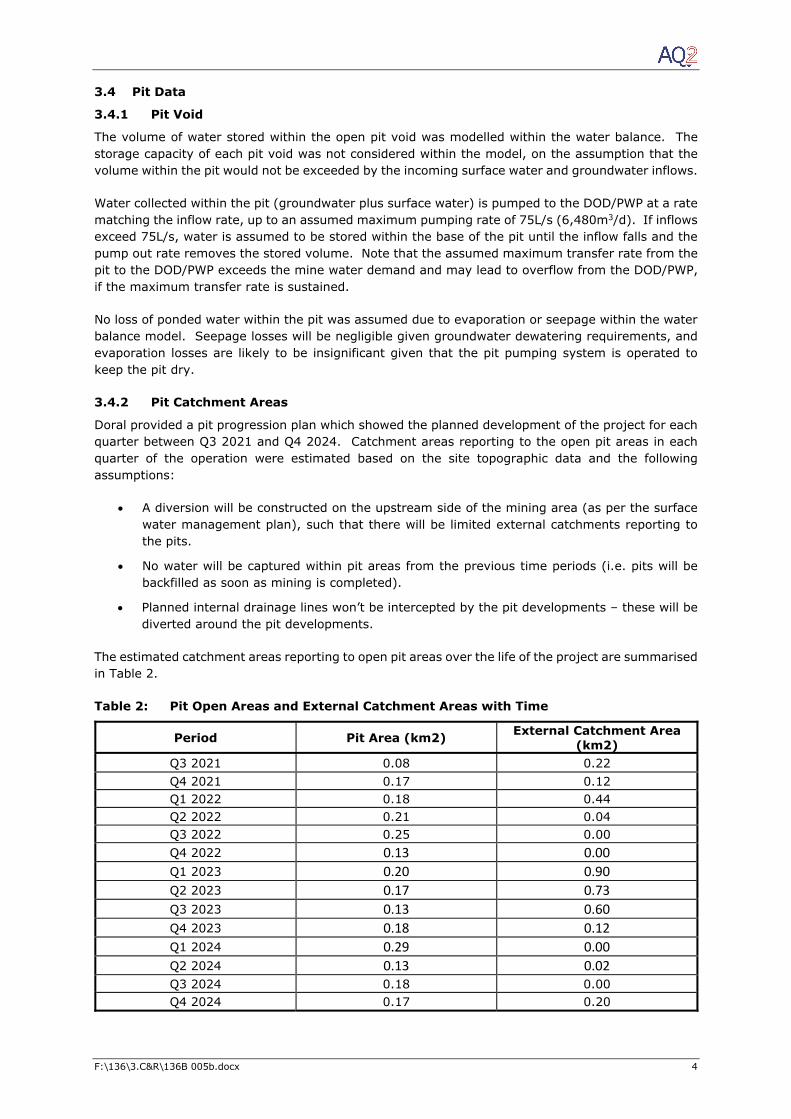
Doral provided a pit progression plan which showed the planned development of the project for each quarter between Q3 2021 and Q4 2024. Catchment areas reporting to the open pit areas in each quarter of the operation were estimated based on the site topographic data and the following assumptions:
A diversion will be constructed on the upstream side of the mining area (as per the surface water management plan), such that there will be limited external catchments reporting to the pits.
No water will be captured within pit areas from the previous time periods (i.e. pits will be backfilled as soon as mining is completed).
Planned internal drainage lines won’t be intercepted by the pit developments – these will be diverted around the pit developments.
The estimated catchment areas reporting to open pit areas over the life of the project are summarised in Table 2.
Table 2: Pit Open Areas and External Catchment Areas with Time
Period Pit Area (km2) External Catchment Area (km2)
Q3 2021 0.08 0.22 Q4 2021 0.17 0.12 Q1 2022 0.18 0.44 Q2 2022 0.21 0.04 Q3 2022 0.25 0.00 Q4 2022 0.13 0.00 Q1 2023 0.20 0.90
Q2 2023 0.17 0.73
Q3 2023 0.13 0.60
Q4 2023 0.18 0.12
Q1 2024 0.29 0.00
Q2 2024 0.13 0.02 Q3 2024 0.18 0.00 Q4 2024 0.17 0.20
F:\136\3.C&R\136B 005b.docx 5
A runoff coefficient of 10% was applied to the rainfall over the external catchment areas to estimate the runoff volume to the pit void. This number is considered appropriate for small localised catchments in disturbed areas in the south west of Western Australia. A runoff coefficient of 75% was applied to the rainfall over the pit open area.
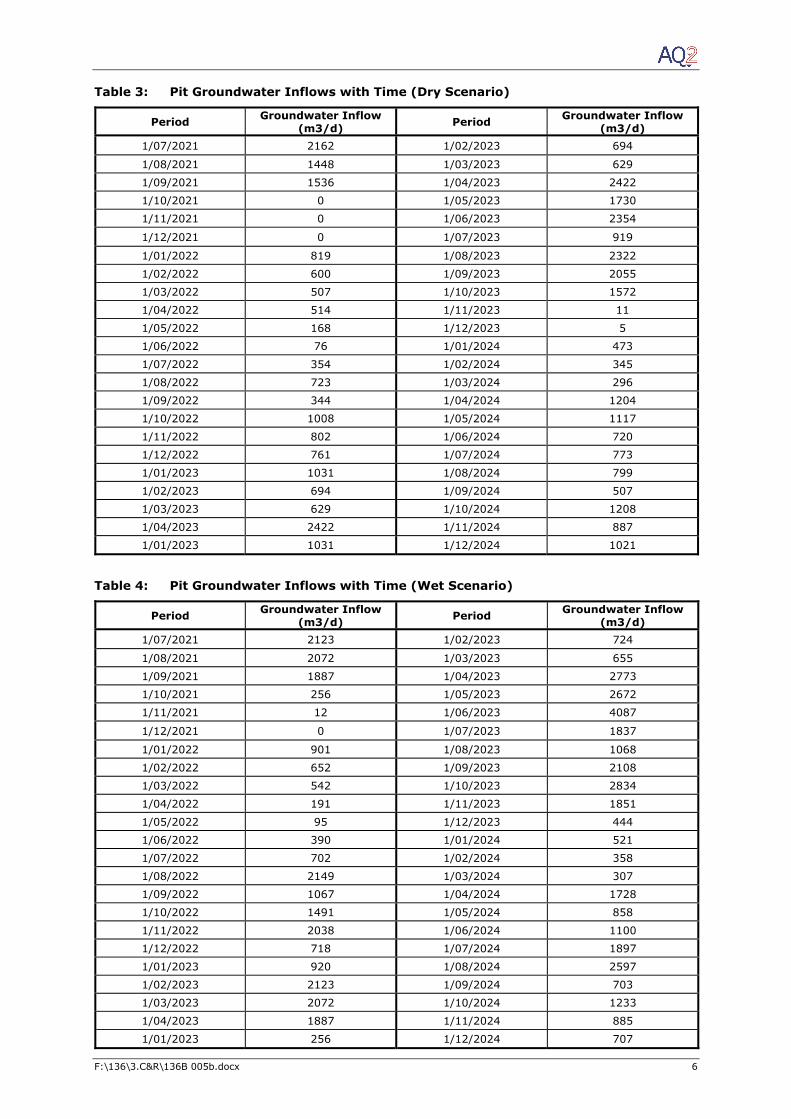
3.4.3 Pit Groundwater Inflows
A groundwater dewatering assessment for the project has been completed (AQ2, 2019a). The groundwater assessment produced dewatering estimates for a “Wet” and “Dry” climate sequence using a numerical groundwater model. The dewatering predictions with time for each of these scenarios (Dry and Wet) are summarised in Tables 3 and 4 and were included within the GoldSim water balance model as different model scenarios.
Note that the same synthetic climate sequences have been applied to the GoldSim water balance to generate surface water runoff for both the “Dry” and “Wet” dewatering scenarios. Therefore, the “Dry” dewatering water balance scenario will contain some model iterations with high rainfall sequences (which would in fact result in higher dewatering requirements), and the “Wet” dewatering water balance scenario will contain some model iterations with low rainfall sequences (where dewatering rates would be lower). As the numerical groundwater model was not run for all 100 climate sequences, the approach of running the two dewatering scenarios was taken and is considered valid as the “Dry” dewatering scenario is used to assess potential make-up water supply requirements and the “Wet” dewatering scenario is used to assess potential surplus water discharge volumes.
3.5 Water Demands
Doral provided an estimated water demand of 1.6GL/annum (equivalent of 4,400m3/d or 50L/s) which was constant over the life of the project. The water demand is effectively the make-up water required to supplement water losses within the process water circuit (such as in the tails).
3.6 Process Water Dam
A Process Water Dam (PWD) with a capacity of 40,000m3 has been proposed to support the mine operations, with an adjoining Drop Out Dam (DOD) with a storage capacity of 20,000m3 used to remove sediment from incoming water. Dewatering and stormwater collected within the open pits is pumped to the PWD/DOD, and water stored within the PWD/DOD is used to supply the mine operations. Within the GoldSim model, the PWD and DOD have been modelled as a common storage with a capacity of 60,000m3.
The PWD/DOD also receives runoff from the adjacent plant and impervious areas (car parks, buildings etc.). The adjacent plant and impervious areas reporting to the PWD/DOD are assumed to be 17ha, and a runoff coefficient of 90% has been applied.
The GoldSim model assumes that rainfall runoff reports to the PWD/DOD on the same day that the rainfall event occurs. As discussed above, the pumping rate from the open pit to the PWP/DOD is assumed to match the inflow rate to the open pit up to an assumed maximum discharge rate of 75L/s.
The water supplied to the PWD/DOD from the captured surface water runoff and groundwater dewatering is supplemented from a Yarragadee groundwater supply bore. Within the water balance model, it has been assumed that the supply rate from the groundwater bore is 4,620m3/d (5% higher than the mine water demand). Make up water supply from the Yarragadee groundwater supply bore is utilised within the water balance model, if the water storage within the PWP/DOD falls below 10,000m3 (i.e. allowance for approximately 2 days mine demand emergency storage).
F:\136\3.C&R\136B 005b.docx 6
Table 3: Pit Groundwater Inflows with Time (Dry Scenario)
Period Groundwater Inflow (m3/d) Period Groundwater Inflow
(m3/d) 1/07/2021 2162 1/02/2023 694
1/08/2021 1448 1/03/2023 629
1/09/2021 1536 1/04/2023 2422
1/10/2021 0 1/05/2023 1730
1/11/2021 0 1/06/2023 2354
1/12/2021 0 1/07/2023 919
1/01/2022 819 1/08/2023 2322
1/02/2022 600 1/09/2023 2055
1/03/2022 507 1/10/2023 1572
1/04/2022 514 1/11/2023 11
1/05/2022 168 1/12/2023 5
1/06/2022 76 1/01/2024 473
1/07/2022 354 1/02/2024 345
1/08/2022 723 1/03/2024 296
1/09/2022 344 1/04/2024 1204
1/10/2022 1008 1/05/2024 1117
1/11/2022 802 1/06/2024 720
1/12/2022 761 1/07/2024 773
1/01/2023 1031 1/08/2024 799
1/02/2023 694 1/09/2024 507
1/03/2023 629 1/10/2024 1208
1/04/2023 2422 1/11/2024 887
1/01/2023 1031 1/12/2024 1021
Table 4: Pit Groundwater Inflows with Time (Wet Scenario)
Period Groundwater Inflow (m3/d) Period Groundwater Inflow
(m3/d) 1/07/2021 2123 1/02/2023 724
1/08/2021 2072 1/03/2023 655
1/09/2021 1887 1/04/2023 2773
1/10/2021 256 1/05/2023 2672
1/11/2021 12 1/06/2023 4087
1/12/2021 0 1/07/2023 1837
1/01/2022 901 1/08/2023 1068
1/02/2022 652 1/09/2023 2108
1/03/2022 542 1/10/2023 2834
1/04/2022 191 1/11/2023 1851
1/05/2022 95 1/12/2023 444
1/06/2022 390 1/01/2024 521
1/07/2022 702 1/02/2024 358
1/08/2022 2149 1/03/2024 307
1/09/2022 1067 1/04/2024 1728
1/10/2022 1491 1/05/2024 858
1/11/2022 2038 1/06/2024 1100
1/12/2022 718 1/07/2024 1897
1/01/2023 920 1/08/2024 2597
1/02/2023 2123 1/09/2024 703
1/03/2023 2072 1/10/2024 1233
1/04/2023 1887 1/11/2024 885
1/01/2023 256 1/12/2024 707
F:\136\3.C&R\136B 005b.docx 7
4. KEY MODEL ASSUMPTIONS
The key assumptions within the GoldSim water balance model are summarised below:
The water balance model starts at the commencement of mining operations (01/07/2021) and does not include consideration of antecedent conditions but assumes that the PWD/DOD starts with an initial storage of 10,000m3.
Nett water demands of 4,400m3/d have been assumed, with all water demands supplied from the PWD/DOD.
The volume of dewatering required from the pits is dependent on groundwater responses to rainfall. Groundwater models for a “Dry” and “Wet” groundwater recharge sequence were run, and the resulting groundwater dewatering requirements incorporated within the GoldSim water balance model as two different scenarios. Note that the same synthetic climate sequences have been applied to GoldSim water balance to generate surface water runoff within the “Dry” and “Wet” dewatering scenarios, such that in the “Dry” water balance scenario model iterations with runoff from high rainfall events occur and in the “Wet” water balance scenario model iterations with runoff from low rainfall events occur.
All runoff from a rainfall event is collected on the day of the rainfall event, with no delay in runoff reaching the collection point (pit or PWD/DOD).
The Solar Evaporation Ponds (SEPs) have not been included within the water balance model, as the return water and losses at these ponds are assumed to have been taken into account when determining the net mine water demand.
A water year is assumed to commence on 1 July, with licences for groundwater abstraction and discharge assumed to cover a water year.
Potable water uses have not been included in the model.
The capacity of the PWD and DOD is 40,000m3 and 20,000m3 respectively, with the model treating these as one combined storage.
Supplementary water supply from the groundwater supply bore is pumped to the PWD/DOD, if the water storage in the dams falls below nominally 10,000m3. This minimum volume was assumed to allow some emergency storage to maintain water supply in the event of issues pumping the water supply bore, while keeping some buffer storage within the dam to reduce the volume of excess water discharge which would be required during dry periods. The pumping capacity from the groundwater supply bore is assumed to be 5% higher than the mine water demand to provide capacity for the water supply system make-up water supply deficits.
The maximum pump out rate from the open pit is nominally 75L/s. If inflows exceed this rate, water will be temporarily stored within a sump in the pit base and pumped out in successive time periods.
Only one mining area will be open at any one time, with no pumping assumed from completed mining areas (either dewatering or stormwater capture).
Evaporation loss has been applied to the PWD/DOD over an assumed area of pond footprint area of 3.4ha. The evaporation loss has been applied over this area regardless of the pond water volume (i.e. pond vertical sides assumed).
Catchment areas for each mining cell pit footprint have been assumed based on assumed drainage inside the mine disturbance area. It is assumed that runoff from upstream of the mine disturbance area is diverted around the disturbance area (as per the Surface Water Management Plan) and therefore does not contribute runoff to any of the pit voids.
Runoff coefficients which have been applied within the model, represent annual average runoff coefficients. In reality, a higher percentage of rainfall will runoff following larger events (and wet antecedent conditions) and a lower percentage of rainfall will runoff following smaller events (and dry antecedent conditions). As such, there is the potential that make-
F:\136\3.C&R\136B 005b.docx 8
up water and discharge requirements may be under-estimated by the model. The following runoff coefficients have been assumed:
o RWD/DOD catchment – 90%
o Pit footprint – 75%
o Pit external footprint – 10%
5. RESULTS
5.1 Groundwater Demands
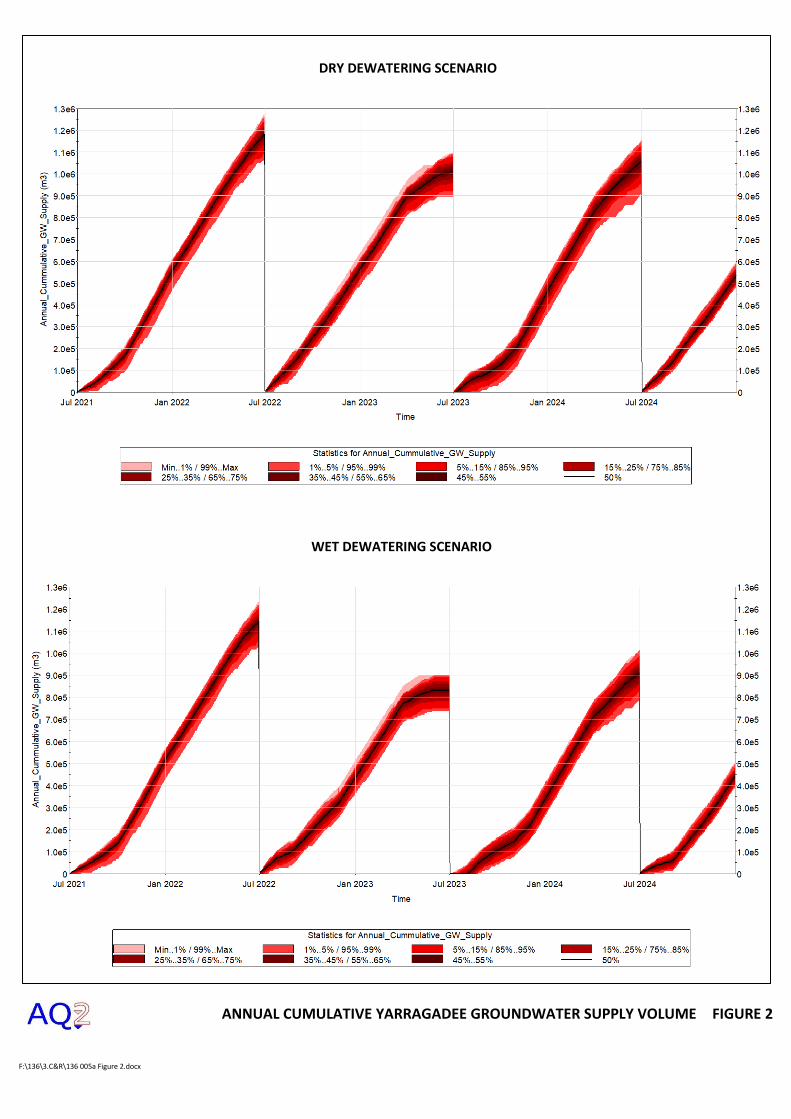
The GoldSim water balance model calculates the volume of water which needs to be supplied from the groundwater supply bore (Yarragadee aquifer) across the 100 model iterations (different synthetic rainfall timeseries). A probability distribution plot of the required groundwater supply volume with time from the model for both the “Dry” and “Wet” dewatering scenarios is shown in Figure 2.
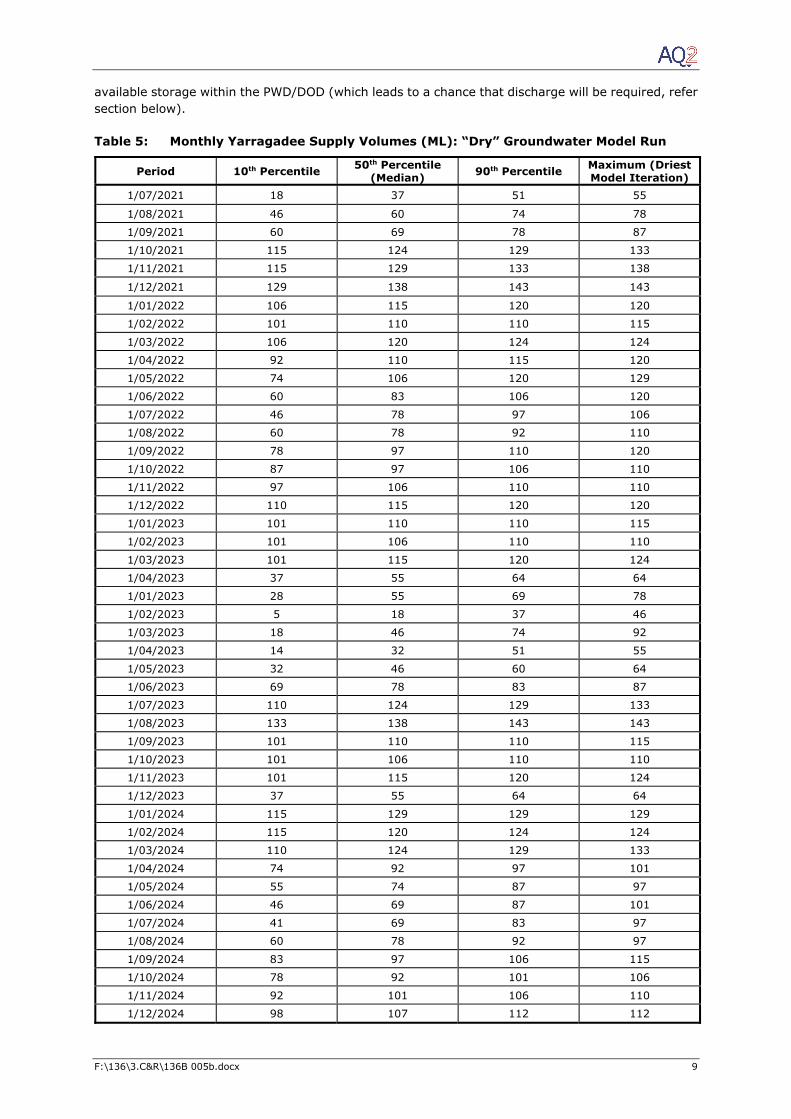
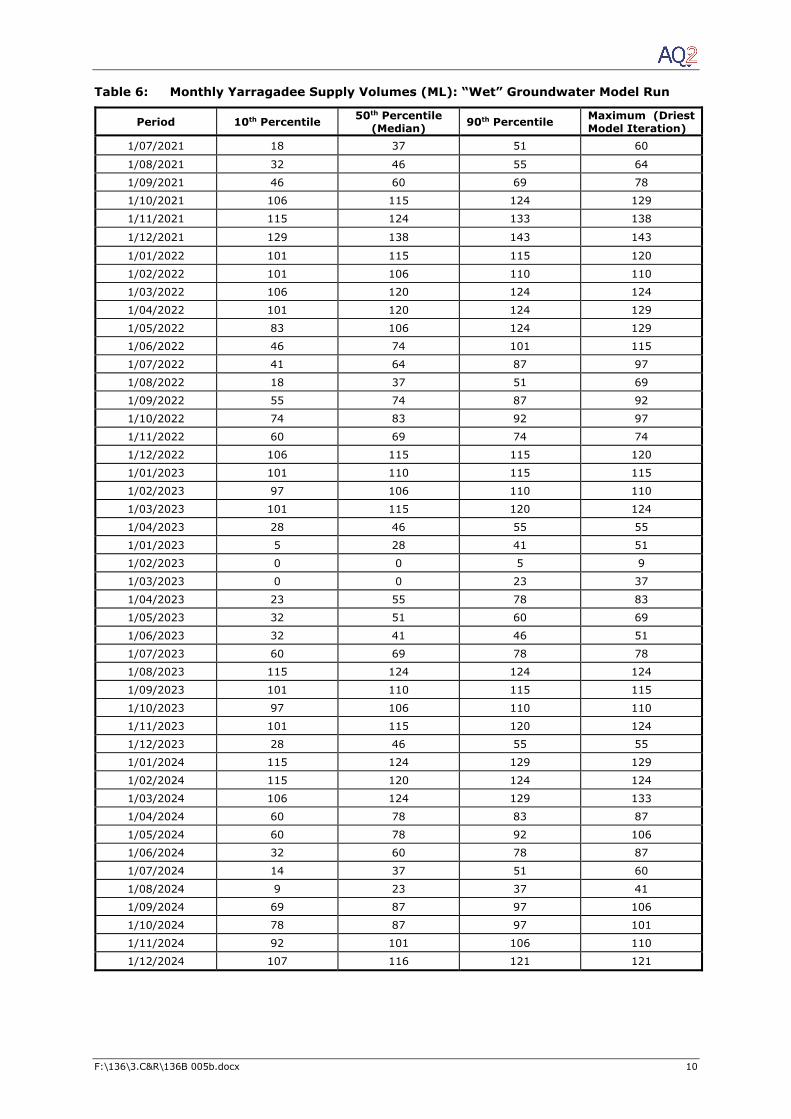
The water balance model indicates that in the driest conditions modelled, the maximum annual abstraction from the Yarragadee aquifer bore is 1.3GL, which is less than the requested groundwater abstraction licence limit of 1.6GL. The highest groundwater bore demand is predicted to occur in the first year of mining, while the second year of mining is predicted to have the lowest annual groundwater bore demand. The groundwater demand is inversely proportional to the average pit footprint and catchment areas over the year, with the higher demand during the year with the smaller average catchment areas. The total volume of make-up water estimated to be required from the Yarragadee aquifer in each mine operating month across the 100 model iterations is also presented in Table 5 (Dry) and Table 6 (Wet). As make-up water requirements are highest during drier periods, the “Dry” dewatering scenario results best represent potential maximum water annual water demands during drought periods.
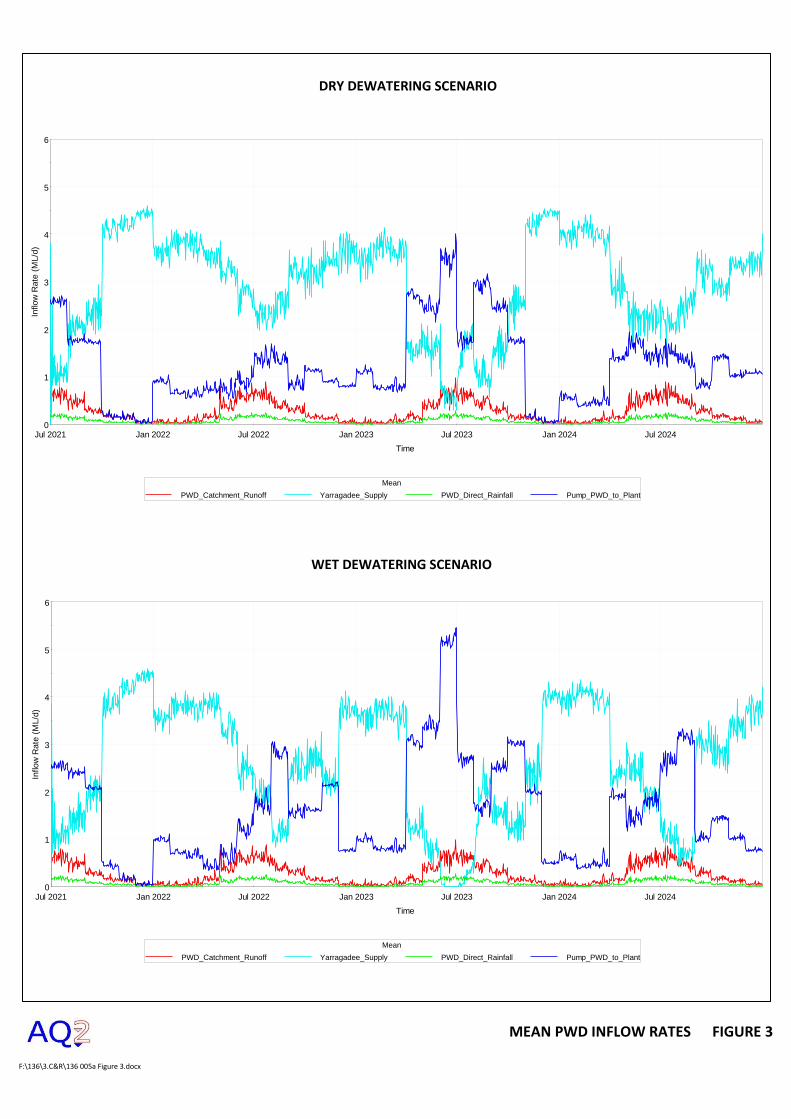
The requirement to pump from the Yarragadee aquifer is offset by the availability of surface water inflows to the PWD/DOD and groundwater and surface water inflows to the open pit. A time-series of the mean water inflows to the PWD/DOD across all model iterations is shown in Figure 3. The plot shows that demand from the Yarragadee aquifer is highest during the summer months and reduces when more surface water is available in the winter months.
5.2 Pit and PWD/DOD Storage Capacity
The water balance model tracks the stored water volume within the open pit and within the PWD/DOD. As discussed above, the results of the “Dry” dewatering scenario are most valid during dry climate sequences (i.e. when looking at water supply make-up requirements) and the “Wet” dewatering scenario is most valid during wet climate sequences (i.e. when looking at peak water storage volumes or surplus water discharge requirements).
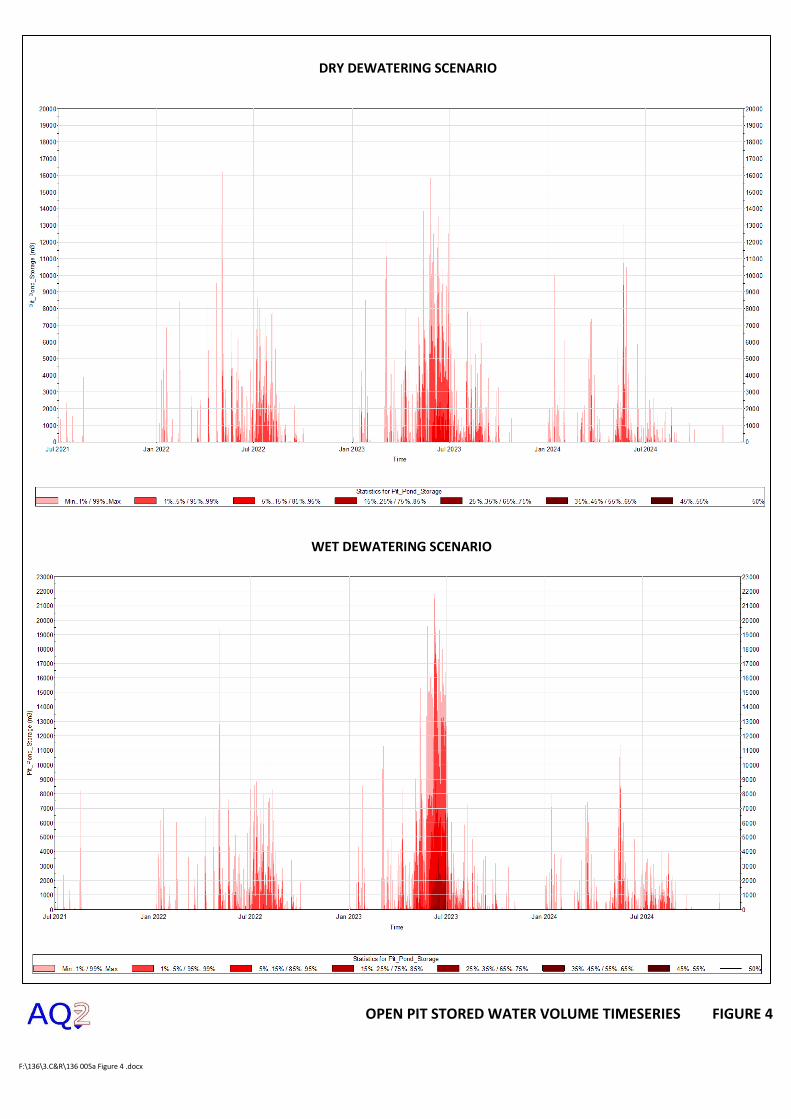
A storage capacity for the open pit wasn’t specified, however pump-out rates from the pit to the PWD/DOD were set in the model such that storage volumes within the pit didn’t regularly exceed 5ML. A probability plot of the water storage volume within the open pit is show in Figure 4 for both the “Dry” and “Wet” dewatering scenarios. The figure indicates that there is an increased likelihood of relatively large volumes of water being required to be stored within the pit during the winter period and, in particular, during Q2 2023 when the surface water capture area for the pit is greatest. During this period, the mine should include an allowance for a water storage sump in the pit (or in part of the Q1 2023 pit void prior to backfill). Note that the model predicts that there is a 65% chance that no water will collect in the pit during this period, and a 10% chance that more than 9ML would be required to be stored within the pit (or transfer pump rate and discharge allowances increased).
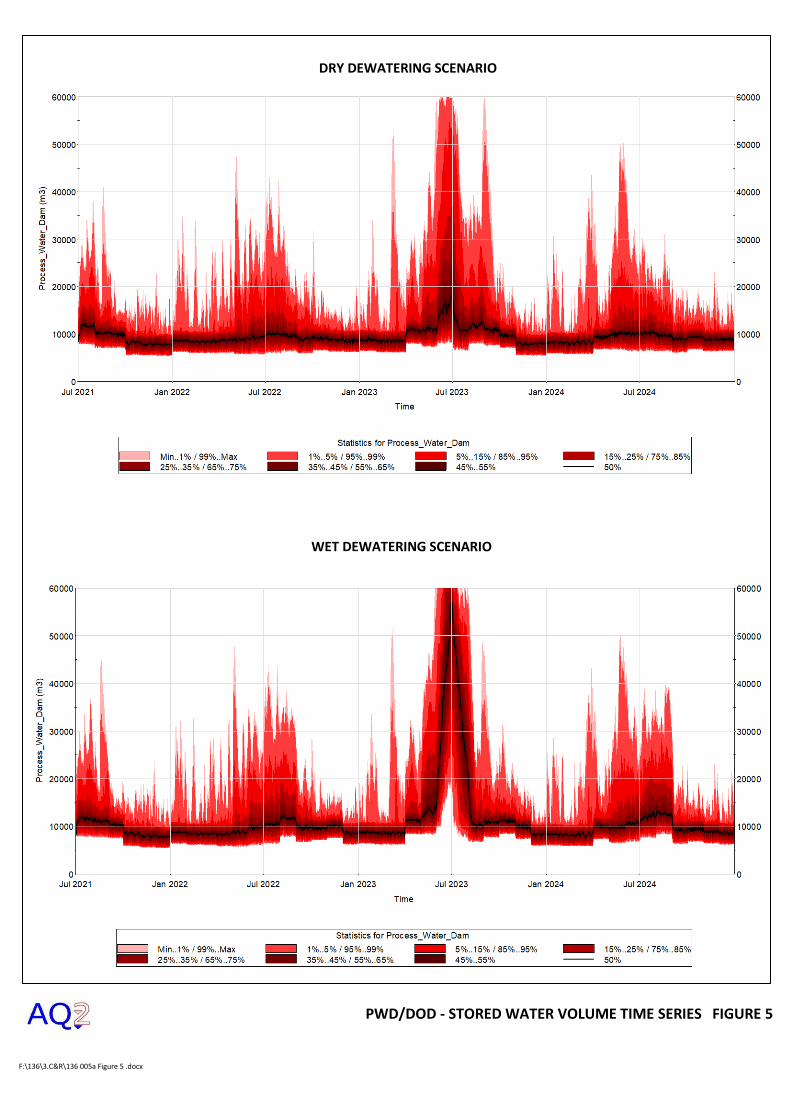
The combined storage in the PWD/DOD is 60,000m3. A probability plot of the water storage volume within the combined PWD/DOD storage is show in Figure 5 for both the “Dry” and “Wet” dewatering scenarios. Similar to the pit storage, the volume of water within the PWD/DOD is generally higher during winter periods than during summer periods. During the Q1 2023 mining period there is a higher chance of incoming water exceeding the capacity of the plant to use the water and the
F:\136\3.C&R\136B 005b.docx 9
available storage within the PWD/DOD (which leads to a chance that discharge will be required, refer section below).
Table 5: Monthly Yarragadee Supply Volumes (ML): “Dry” Groundwater Model Run
Period 10th Percentile 50th Percentile (Median) 90th Percentile Maximum (Driest
Model Iteration) 1/07/2021 18 37 51 55
1/08/2021 46 60 74 78
1/09/2021 60 69 78 87
1/10/2021 115 124 129 133
1/11/2021 115 129 133 138
1/12/2021 129 138 143 143
1/01/2022 106 115 120 120
1/02/2022 101 110 110 115
1/03/2022 106 120 124 124
1/04/2022 92 110 115 120
1/05/2022 74 106 120 129
1/06/2022 60 83 106 120
1/07/2022 46 78 97 106
1/08/2022 60 78 92 110
1/09/2022 78 97 110 120
1/10/2022 87 97 106 110
1/11/2022 97 106 110 110
1/12/2022 110 115 120 120
1/01/2023 101 110 110 115
1/02/2023 101 106 110 110
1/03/2023 101 115 120 124
1/04/2023 37 55 64 64
1/01/2023 28 55 69 78
1/02/2023 5 18 37 46
1/03/2023 18 46 74 92
1/04/2023 14 32 51 55
1/05/2023 32 46 60 64
1/06/2023 69 78 83 87
1/07/2023 110 124 129 133
1/08/2023 133 138 143 143
1/09/2023 101 110 110 115
1/10/2023 101 106 110 110
1/11/2023 101 115 120 124
1/12/2023 37 55 64 64
1/01/2024 115 129 129 129
1/02/2024 115 120 124 124
1/03/2024 110 124 129 133
1/04/2024 74 92 97 101
1/05/2024 55 74 87 97
1/06/2024 46 69 87 101
1/07/2024 41 69 83 97
1/08/2024 60 78 92 97
1/09/2024 83 97 106 115
1/10/2024 78 92 101 106
1/11/2024 92 101 106 110
1/12/2024 98 107 112 112
F:\136\3.C&R\136B 005b.docx 10
Table 6: Monthly Yarragadee Supply Volumes (ML): “Wet” Groundwater Model Run
Period 10th Percentile 50th Percentile (Median) 90th Percentile Maximum (Driest
Model Iteration) 1/07/2021 18 37 51 60
1/08/2021 32 46 55 64
1/09/2021 46 60 69 78
1/10/2021 106 115 124 129
1/11/2021 115 124 133 138
1/12/2021 129 138 143 143
1/01/2022 101 115 115 120
1/02/2022 101 106 110 110
1/03/2022 106 120 124 124
1/04/2022 101 120 124 129
1/05/2022 83 106 124 129
1/06/2022 46 74 101 115
1/07/2022 41 64 87 97
1/08/2022 18 37 51 69
1/09/2022 55 74 87 92
1/10/2022 74 83 92 97
1/11/2022 60 69 74 74
1/12/2022 106 115 115 120
1/01/2023 101 110 115 115
1/02/2023 97 106 110 110
1/03/2023 101 115 120 124
1/04/2023 28 46 55 55
1/01/2023 5 28 41 51
1/02/2023 0 0 5 9
1/03/2023 0 0 23 37
1/04/2023 23 55 78 83
1/05/2023 32 51 60 69
1/06/2023 32 41 46 51
1/07/2023 60 69 78 78
1/08/2023 115 124 124 124
1/09/2023 101 110 115 115
1/10/2023 97 106 110 110
1/11/2023 101 115 120 124
1/12/2023 28 46 55 55
1/01/2024 115 124 129 129
1/02/2024 115 120 124 124
1/03/2024 106 124 129 133
1/04/2024 60 78 83 87
1/05/2024 60 78 92 106
1/06/2024 32 60 78 87
1/07/2024 14 37 51 60
1/08/2024 9 23 37 41
1/09/2024 69 87 97 106
1/10/2024 78 87 97 101
1/11/2024 92 101 106 110
1/12/2024 107 116 121 121
F:\136\3.C&R\136B 005b.docx 11
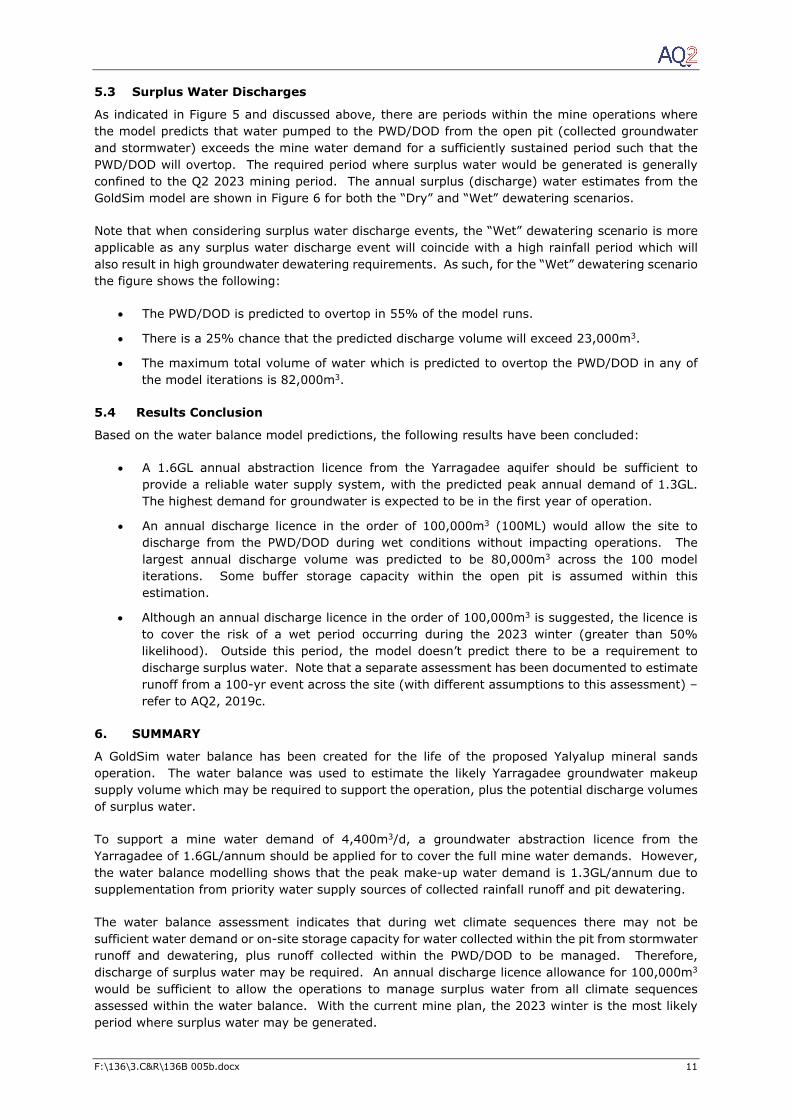
5.3 Surplus Water Discharges
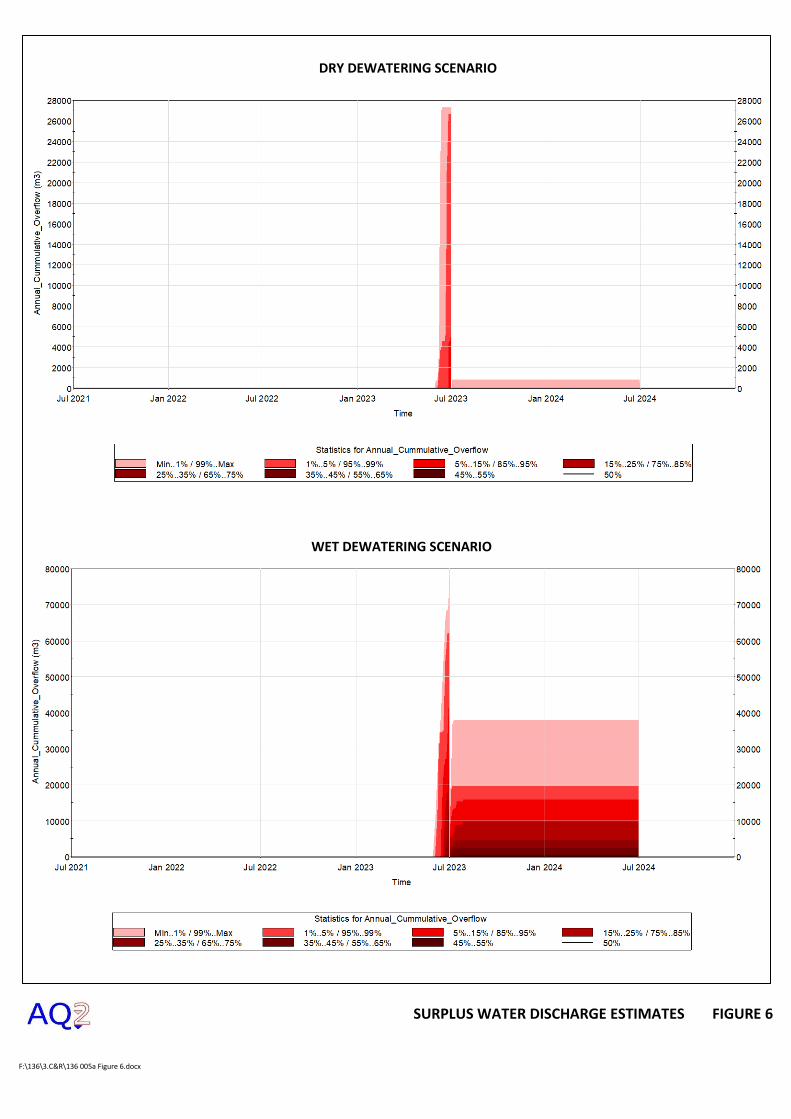
As indicated in Figure 5 and discussed above, there are periods within the mine operations where the model predicts that water pumped to the PWD/DOD from the open pit (collected groundwater and stormwater) exceeds the mine water demand for a sufficiently sustained period such that the PWD/DOD will overtop. The required period where surplus water would be generated is generally confined to the Q2 2023 mining period. The annual surplus (discharge) water estimates from the GoldSim model are shown in Figure 6 for both the “Dry” and “Wet” dewatering scenarios.
Note that when considering surplus water discharge events, the “Wet” dewatering scenario is more applicable as any surplus water discharge event will coincide with a high rainfall period which will also result in high groundwater dewatering requirements. As such, for the “Wet” dewatering scenario the figure shows the following:
The PWD/DOD is predicted to overtop in 55% of the model runs.
There is a 25% chance that the predicted discharge volume will exceed 23,000m3.
The maximum total volume of water which is predicted to overtop the PWD/DOD in any of the model iterations is 82,000m3.
5.4 Results Conclusion
Based on the water balance model predictions, the following results have been concluded:
A 1.6GL annual abstraction licence from the Yarragadee aquifer should be sufficient to provide a reliable water supply system, with the predicted peak annual demand of 1.3GL. The highest demand for groundwater is expected to be in the first year of operation.
An annual discharge licence in the order of 100,000m3 (100ML) would allow the site to discharge from the PWD/DOD during wet conditions without impacting operations. The largest annual discharge volume was predicted to be 80,000m3 across the 100 model iterations. Some buffer storage capacity within the open pit is assumed within this estimation.
Although an annual discharge licence in the order of 100,000m3 is suggested, the licence is to cover the risk of a wet period occurring during the 2023 winter (greater than 50% likelihood). Outside this period, the model doesn’t predict there to be a requirement to discharge surplus water. Note that a separate assessment has been documented to estimate runoff from a 100-yr event across the site (with different assumptions to this assessment) – refer to AQ2, 2019c.
6. SUMMARY
A GoldSim water balance has been created for the life of the proposed Yalyalup mineral sands operation. The water balance was used to estimate the likely Yarragadee groundwater makeup supply volume which may be required to support the operation, plus the potential discharge volumes of surplus water.
To support a mine water demand of 4,400m3/d, a groundwater abstraction licence from the Yarragadee of 1.6GL/annum should be applied for to cover the full mine water demands. However, the water balance modelling shows that the peak make-up water demand is 1.3GL/annum due to supplementation from priority water supply sources of collected rainfall runoff and pit dewatering.
The water balance assessment indicates that during wet climate sequences there may not be sufficient water demand or on-site storage capacity for water collected within the pit from stormwater runoff and dewatering, plus runoff collected within the PWD/DOD to be managed. Therefore, discharge of surplus water may be required. An annual discharge licence allowance for 100,000m3 would be sufficient to allow the operations to manage surplus water from all climate sequences assessed within the water balance. With the current mine plan, the 2023 winter is the most likely period where surplus water may be generated.
F:\136\3.C&R\136B 005b.docx 12
Doral will make every effort to maximise water recycling and to minimise water use. Process water will, in the first instance, be sourced from recycled water and dewatering of the pits. Additional process water sourced from the Yarragadee aquifer bore will be used only after other resources have been fully utilised (i.e. PWD /DOD water storage falls below nominal 10,000 m3, approximately 17% of the total capacity of PWD/DOD). Water will not be intentionally discharged offsite when it cannot be used for any other purpose. Water will be discharged offsite when the storages at PWD/DOD are at their full capacity (overtop) in the event of sufficiently sustained period of high rainfall events results in site runoff exceeding the mine water demand.
We trust that this memo meets your requirements. Please contact us if you require additional
information.
Regards
Mark Jeff
Consulting Water Resources Engineer Consulting Hydrogeologist
Attached: Figures 1 to 6 Author: MN (21/10/19) Checked: BDK (21/10/19) Reviewed: JLJ (21/10/19)
References
AQ2, 2019a. Hydrogeological Assessment for the proposed Yalyalup Heavy Mineral Sands Project, 136D_007a, October 2019.
AQ2, 2019b. Surface Water Assessment for the proposed Yalyalup Heavy Mineral Sands Project, 136D_005b, September 2019.
AQ2, 2019c. Doral Yalyalup Operations - Surface Water Discharge Assessment, 136D_006a, October 2019.
PERTH
Project
KALGOORLIE
PERTH
ALBANY
KALGOORLIE
Project
NEWMAN
DERBY
< No Content >
LOCATION MAP
FIGURE 1
MINE LAYOUT
Location:F:\136\4.GIS\Workspaces
LEGEND
NOTES & DATA SOURCES:
Data provided by Doral.
AUTHOR: MN REPORT NO: 005a
DRAWN: LDS REVISION: A
DATE: 21/10/2019 JOB NO: 136
0 1
kilometres
Pit Footprint Schedule
Year 2021
Year 2022
Year 2023
Year 2024
Potential Disturbance Envelope
Infrastructure (workshop, admin, slime tailings)
Process Water Dam / Dropout Dam
F:\136\3.C&R\136 005a Figure 2.docx
ANNUAL CUMULATIVE YARRAGADEE GROUNDWATER SUPPLY VOLUME FIGURE 2
DRY DEWATERING SCENARIO
WET DEWATERING SCENARIO
F:\136\3.C&R\136 005a Figure 3.docx
MEAN PWD INFLOW RATES FIGURE 3
DRY DEWATERING SCENARIO
WET DEWATERING SCENARIO
0
1
2
3
4
5
6
Jul 2021 Jan 2022 Jul 2022 Jan 2023 Jul 2023 Jan 2024 Jul 2024
Inflow
Rate
(M
L/d
)
Time
Figure 2
Mean
PWD_Catchment_Runoff Yarragadee_Supply PWD_Direct_Rainfall Pump_PWD_to_Plant
0
1
2
3
4
5
6
Jul 2021 Jan 2022 Jul 2022 Jan 2023 Jul 2023 Jan 2024 Jul 2024
Inflow
Rate
(M
L/d
)
Time
Figure 2
Mean
PWD_Catchment_Runoff Yarragadee_Supply PWD_Direct_Rainfall Pump_PWD_to_Plant
F:\136\3.C&R\136 005a Figure 4 .docx
OPEN PIT STORED WATER VOLUME TIMESERIES FIGURE 4
DRY DEWATERING SCENARIO
WET DEWATERING SCENARIO
F:\136\3.C&R\136 005a Figure 5 .docx
PWD/DOD - STORED WATER VOLUME TIME SERIES FIGURE 5
DRY DEWATERING SCENARIO
WET DEWATERING SCENARIO
F:\136\3.C&R\136 005a Figure 6.docx
SURPLUS WATER DISCHARGE ESTIMATES FIGURE 6
DRY DEWATERING SCENARIO
WET DEWATERING SCENARIO