Embed Size (px)
Citation preview

Appendix AChapter 2
See Tables A.1, A.2, A.3, A.4, A.5, A.6, A.7, A.8, A.9 and A.10.
© Shanghai Jiao Tong University Press and Springer Nature Singapore Pte Ltd. 2018S. Li, Financial Institutions in the Global Financial Crisis,https://doi.org/10.1007/978-981-10-7440-0
177

Table A.1 Diagnostic tests of instruments used in IV regression in Table 2.8
Totalsample
LargeBHCs
SmallBHCs
Panel A: Interest rate risk betas
Weak-instrument-robustinference:
Anderson-RubinWald test (p-value)
23.45***
(0.000)12.46***
(0.0060)13.16**
(0.011)
Underidentification test Kleibergen-Paap rkLM statistic(p-value)
40.26***
(0.000)42.130***
(0.000)31.29***
(0.000)
Weak identification test Cragg-DonaldWald F statistic
2942.68*** 457.639*** 1751.21***
Kleibergen-PaapWald rk F statistic
34.48*** 33.96*** 41.66***
Panel B: Exchange rate risk beta
Weak-instrument-robustinference:
Anderson-RubinWald test (p-value)
39.51***
(0.000)32.50***
(0.000)14.97***
(0.002)
Underidentification test Kleibergen-Paap rkLM statistic(p-value)
82.61***
(0.000)72.71***
(0.000)13.65***
(0.003)
Weak identification test Cragg-DonaldWald F statistic
1684.93*** 219.89*** 1605.38***
Kleibergen-PaapWald rk F statistic
36.845*** 37.65*** 16.45***
Panel C: Credit risk beta
Weak-instrument-robustinference:
Anderson-RubinWald test (p-value)
19.45***
(0.000)32.71***
(0.000)12.64**
(0.012)
Underidentification test Kleibergen-Paap rkLM statistic(p-value)
33.20***
(0.000)35.88***
(0.000)20.21***
(0.001)
Weak identification test Cragg-DonaldWald F statistic
1.4e+04*** 3938.86*** 2119.16***
Kleibergen-PaapWald rk F statistic
150.687*** 218.270*** 44.36***
*p < 0.10, **p < 0.05, ***p < 0.01
178 Appendix A: Chapter 2

Tab
leA.2
Determinantsof
interestrate,exchange
rate,andcreditrisk
betas
Variable
Total
BHCs
Large
BHCs
SmallBHCs
Pan
elA:Interestrate
risk
beta
(foreign
expo
sure
asinstrumentvariab
le)
Interestmargin
4.54
2***
0.78
4−8.46
7***
8.02
8**
8.51
5*21
8.4*
*4.19
3***
−0.06
26−1.79
5
(6.26)
(0.44)
(−2.73
)(1.99)
(1.95)
(2.53)
(5.85)
(−0.03
)(−1.56
)
C&Iloans
−0.38
52.22
0**
8.88
8***
12.20*
**14
.09*
**0.13
8−0.80
0**
0.69
90.59
3
(−0.99
)(2.26)
(3.60)
(4.11)
(4.35)
(0.14)
(−2.09
)(0.73)
(0.67)
Mortgageloans
0.12
90.75
45.30
9***
9.00
0***
9.66
2***
0.33
50.05
040.19
50.14
8
(0.54)
(1.20)
(3.52)
(3.92)
(4.07)
(0.51)
(0.22)
(0.32)
(0.29)
Other
loans
−1.55
2***
−1.34
614
.05*
**5.13
9**
5.60
8**
0.85
6−1.65
7***
−3.81
1***
1.09
4*
(−3.22
)(−1.09
)(3.56)
(2.05)
(2.03)
(1.24)
(−3.70
)(−3.18
)(1.94)
Dom
estic
depo
sits
−0.86
1***
1.78
7***
1.97
8***
1.61
51.01
1−0.24
9−1.58
0***
0.38
10.05
31
(−3.34
)(3.08)
(2.75)
(0.95)
(0.57)
(−0.49
)(−6.41
)(0.66)
(0.17)
GAPratio
−0.00
693
−0.00
453
−0.02
45**
*0.00
158
0.00
516
−0.00
199*
−0.02
74−0.10
6**
−0.08
68**
(−1.57
)(−0.92
)(−5.49
)(0.29)
(0.88)
(−1.80
)(−1.16
)(−2.14
)(−2.37
)
Size
0.64
1***
0.91
7***
4.32
3***
1.04
8**
1.16
3***
0.01
230.47
4***
0.42
6***
0.16
0
(10.41
)(5.78)
(3.95)
(2.58)
(2.81)
(0.19)
(8.65)
(3.05)
(1.26)
Capitalratio
0.09
522.94
3***
6.95
1***
4.49
63.66
5−2.88
50.04
171.20
90.13
8
(0.86)
(3.57)
(2.92)
(1.08)
(0.74)
(−1.45
)(0.69)
(1.46)
(0.24)
GDPgrow
th−0.00
625
−0.00
0173
0.00
539
0.02
610.02
830.00
529
−0.01
17**
−0.03
99***
0.00
146
(−1.28
)(−0.01
)(0.51)
(1.12)
(1.17)
(0.57)
(−2.36
)(−2.97
)(0.14)
Interestrate
derivativ
es0.11
6***
0.14
6***
1.12
7*0.09
62**
*0.10
6***
0.01
26*
0.15
7***
0.20
0***
0.15
5
(4.50)
(4.60)
(1.88)
(3.29)
(3.10)
(1.96)
(2.99)
(2.93)
(1.64)
L.interestrate
risk
beta
0.03
611.08
0***
0.25
6*
(1.04)
(81.24
)(1.80)
(con
tinued)
Appendix A: Chapter 2 179

Tab
leA.2
(con
tinued)
Variable
Total
BHCs
Large
BHCs
SmallBHCs
N11
,795
4367
3866
754
719
725
11,041
3648
3169
Adjusted-R2
0.19
90.13
80.47
30.47
40.19
10.06
67
AR(1)
0.00
80.00
00.01
4
AR(2)
0.67
60.20
60.43
6
HansenJstatistic
(p-value)
3.27
(0.514
)2.67
(0.103
)4.04
(0.401
)
Pan
elB:Excha
ngerate
risk
beta
(interestrate
expo
sure
asinstrumentvariab
le)
Assetsin
foreigncurrencies
−0.62
1−1.78
10.02
26−4.41
6***
−4.01
9***
0.77
84.86
4***
3.87
5***
−0.55
8
(−0.61
)(−1.56
)(0.05)
(−3.74
)(−3.19
)(0.99)
(4.88)
(3.15)
(−1.06
)
Foreignexchange
depo
sits
1.08
9*−0.30
3−0.27
9−1.52
8−2.11
6*0.15
81.45
0**
−1.49
80.22
0
(1.73)
(−0.34
)(−0.32
)(−1.44
)(−1.80
)(0.11)
(1.98)
(−1.22
)(0.24)
Size
−0.13
4***
−0.26
5***
0.19
9*0.16
40.11
40.18
1−0.11
8**
−0.21
2**
0.22
0*
(−2.69
)(−3.49
)(1.65)
(1.20)
(0.83)
(0.41)
(−2.23
)(−2.36
)(1.73)
Capitalratio
−0.04
05−0.32
30.25
6−2.40
6−2.80
50.28
3−0.04
99−0.16
30.29
0
(−0.78
)(−0.79
)(1.00)
(−1.15
)(−1.18
)(0.09)
(−0.87
)(−0.45
)(1.04)
GDPgrow
th0.01
69**
*0.01
69**
−0.00
514
0.02
570.01
740.01
720.01
69**
*0.02
32***
−0.01
07
(3.15)
(2.24)
(−0.72
)(1.41)
(0.92)
(0.83)
(3.04)
(2.84)
(−1.39
)
Exchang
erate
derivativ
es0.54
5***
0.65
8***
0.15
5***
0.72
1***
0.83
7***
0.14
50.79
1***
0.92
0***
0.13
0***
(6.31)
(5.80)
(4.83)
(6.84)
(6.07)
(1.54)
(5.29)
(4.19)
(4.40)
L.exchange
rate
risk
beta
0.97
3***
1.68
6***
0.98
1***
(10.95
)(3.80)
(10.61
)
N11
,803
4416
3926
759
728
707
11,044
3688
3219
Adjusted-R2
0.16
50.20
60.40
40.40
80.16
00.19
3(con
tinued)
180 Appendix A: Chapter 2

Tab
leA.2
(con
tinued)
Variable
Total
BHCs
Large
BHCs
SmallBHCs
AR(1)
0.00
00.00
30.00
0
AR(2)
0.44
50.11
00.81
6
HansenJstatistic
(p-value)
0.55
2(0.75
9)2.52
(0.640
)1.05
(0.789
)
Pan
elC:Creditrisk
beta
(interestrate
expo
sure
asinstrumentvariab
le)
Marketliq
uidity
−0.51
1***
−0.41
6***
−0.08
91−0.25
3−0.43
8*−1.51
1−0.51
8***
−0.43
7***
0.14
6
(−9.38
)(−5.21
)(−1.24
)(−1.11
)(−1.95
)(−1.00
)(−9.23
)(−5.25
)(1.32)
Fund
ingliq
uidity
−0.38
8***
−0.63
6***
0.01
39−1.56
2***
−1.59
5***
−8.24
4−0.34
6**
−0.52
7***
−0.07
80
(−2.94
)(−4.04
)(0.14)
(−3.59
)(−3.74
)(−0.88
)(−2.48
)(−3.06
)(−0.63
)
Non
-perform
ingLoans
−4.71
7***
−2.99
6***
−0.34
5−11
.42*
**−12
.56*
**6.64
1−4.26
9***
−1.42
5***
0.46
4
(−11
.39)
(−6.01
)(−1.03
)(−7.45
)(−8.53
)(0.09)
(−10
.17)
(−2.94
)(1.39)
Loancharge-offs
−5.92
2***
−4.30
8*−0.24
4−17
.73*
**−23
.56*
**49
.66
−3.87
8*−0.60
90.24
1
(−2.68
)(−1.83
)(−0.24
)(−3.13
)(−5.17
)(0.30)
(−1.65
)(−0.26
)(0.21)
Loanloss
prov
isions
6.48
8***
4.77
5**
0.32
812
.56*
**16
.69*
**−49
.98
5.59
2***
2.44
52.61
1**
(3.19)
(2.08)
(0.30)
(2.70)
(3.92)
(−0.25
)(2.60)
(1.06)
(2.18)
Size
0.04
96**
*−0.01
80−0.02
060.20
7***
0.27
8***
0.00
968
0.06
58**
*0.00
813
−0.00
276
(2.83)
(−0.68
)(−0.69
)(4.14)
(6.01)
(0.02)
(3.60)
(0.28)
(−0.07
)
Capitalratio
−0.00
646
−0.04
000.11
7**
2.16
2***
1.72
8**
−0.36
7−0.00
130
0.04
620.11
7
(−0.69
)(−0.46
)(1.97)
(3.03)
(2.17)
(−0.09
)(−0.11
)(0.53)
(1.39)
GDPgrow
th0.00
617*
**0.00
622*
*0.00
583*
*0.01
61**
0.01
64**
−0.01
870.00
520*
**0.00
454
0.00
836*
*
(3.40)
(2.27)
(2.09)
(2.41)
(2.54)
(−1.14
)(2.80)
(1.58)
(2.02)
Creditderivativ
es0.07
61**
*0.07
46***
0.02
57**
0.10
3***
0.09
48**
*0.01
110.07
08*
0.10
20.04
26***
(4.73)
(4.37)
(2.23)
(5.88)
(5.71)
(0.11)
(1.76)
(1.40)
(2.75)
(con
tinued)
Appendix A: Chapter 2 181

Tab
leA.2
(con
tinued)
Variable
Total
BHCs
Large
BHCs
SmallBHCs
L.creditrisk
beta
−0.65
4***
0.33
20.90
6***
(−6.96
)(1.24)
(7.87)
N10
,984
4152
3705
697
667
646
10,287
3485
3059
Adjusted-R2
0.16
30.21
60.59
40.62
00.14
90.16
8
AR(1)
0.00
00.02
0.00
0
AR(2)
0.78
90.26
70.40
8
HansenJstatistic
(p-value)
2.02
(0.364
)10
.18(0.17
9)0.15
(0.928
)
Estim
ationmetho
dFE
IVGMM
FEIV
GMM
FEIV
GMM
PanelA
isusingforeignexpo
sure
asinstrumentvariable,w
hile
PanelBandPanelCareusinginterestrate
expo
sure
asinstrumentvariable.T
hedependent
variable
ineach
Panelisou
restim
ates
ofrisk
beta
ofeach
BHCiatthe
starttim
eto
ffou
r-year
rolling
windo
wregression
inthefirst-stage.Weweigh
teach
observationby
theinverseof
thestandard
errorof
betacoefficientsin
thefirst-stageestim
ation.
The
regression
sinclud
edbank
-specificfixedeffectsandyearly
dummyvariables.Heteroskedasticity
-con
sistentstandard
errors
areused
andtstatisticsarerepo
rted
inparentheses.
* p<0.10
,**p<0.05
,*** p
<0.01
Source
Financialstatementsdatafrom
FRY-9C;R
iskbetasarecompu
tedfrom
thefour-factormod
elusingdatafrom
CenterforResearchin
Security
Prices
(CRSP
)database
andFederalReserve
mon
thly
Statistical
Releases
182 Appendix A: Chapter 2

Tab
leA.3
Determinantsof
interestrate,exchange
rate,andcreditrisk
betas
Variable
Total
BHCs
Large
BHCs
SmallBHCs
Pan
elA:Interestrate
risk
beta
(basisexpo
sure
asinstrumentvariab
le)
Interestmargin
4.54
2***
0.51
3−0.27
28.02
8**
7.14
794
.64*
*4.19
3***
−0.09
4314
.11*
**
(6.26)
(0.29)
(−0.14
)(1.99)
(1.61)
(2.67)
(5.85)
(−0.05
)(4.01)
C&Iloans
−0.38
52.25
7**
1.48
912
.20*
**14
.23*
**−0.19
5−0.80
0**
0.69
0−2.40
4
(−0.99
)(2.29)
(1.42)
(4.11)
(4.31)
(−0.19
)(−2.09
)(0.72)
(−1.56
)
Mortgageloans
0.12
90.69
60.40
09.00
0***
9.51
7***
−0.08
690.05
040.19
5−0.45
8
(0.54)
(1.10)
(0.65)
(3.92)
(4.00)
(−0.11
)(0.22)
(0.32)
(−0.94
)
Other
loans
−1.55
2***
−1.23
21.74
55.13
9**
5.73
1**
0.58
7−1.65
7***
−3.82
7***
−0.39
9
(−3.22
)(−0.98
)(1.62)
(2.05)
(2.01)
(0.72)
(−3.70
)(−3.19
)(−0.32
)
Dom
estic
depo
sits
−0.86
1***
1.69
6***
−0.07
071.61
50.67
4−0.14
1−1.58
0***
0.39
5−0.45
6
(−3.34
)(2.93)
(−0.18
)(0.95)
(0.37)
(−0.32
)(−6.41
)(0.68)
(−0.88
)
GAPratio
−0.00
693
−0.00
453
−0.02
38**
*0.00
158
0.00
511
−0.00
127
−0.02
74−0.10
6**
0.22
7
(−1.57
)(−0.93
)(−3.38
)(0.29)
(0.88)
(−0.88
)(−1.16
)(−2.13
)(0.90)
Size
0.64
1***
0.92
4***
0.34
81.04
8**
1.20
9***
−0.03
090.47
4***
0.42
9***
0.57
8***
(10.41
)(5.80)
(1.15)
(2.58)
(2.86)
(−0.30
)(8.65)
(3.07)
(2.80)
Capitalratio
0.09
522.90
9***
−0.09
424.49
63.97
5−3.57
50.04
171.22
00.14
3
(0.86)
(3.54)
(−0.13
)(1.08)
(0.78)
(−1.56
)(0.69)
(1.47)
(1.13)
GDPgrow
th−0.00
625
−0.00
0947
0.00
529
0.02
610.02
540.00
307
−0.01
17**
−0.03
97***
−0.00
0912
(−1.28
)(−0.08
)(0.51)
(1.12)
(1.05)
(0.33)
(−2.36
)(−2.95
)(−0.08
)
Interestrate
derivativ
es0.11
6***
0.14
6***
0.51
5*0.09
62**
*0.10
4***
0.01
07**
0.15
7***
0.20
0***
0.22
6**
(4.50)
(4.60)
(1.65)
(3.29)
(3.11)
(2.19)
(2.99)
(2.92)
(2.37)
L.interestrate
risk
beta
0.18
31.07
8***
0.54
1***
(0.61)
(77.96
)(2.99)
(con
tinued)
Appendix A: Chapter 2 183

Tab
leA.3
(con
tinued)
Variable
Total
BHCs
Large
BHCs
SmallBHCs
N11
,795
4348
3837
754
706
725
11,041
3642
3169
Adjusted-R2
0.19
90.13
60.47
30.47
10.19
10.06
66
AR(1)
0.00
00.00
00.00
0
AR(2)
0.97
80.20
00.06
8
HansenJstatistic
(p-value)
2.79
(0.646
)3.05
(0.09)
9.52
2(0.05
)
Pan
elB:Excha
ngerate
risk
beta
(basisexpo
sure
asinstrumentvariab
le)
Assetsin
foreigncurrencies
−0.62
1−1.09
70.28
7−4.41
6***
−4.00
9***
1.12
24.86
4***
4.77
3***
−0.55
0
(−0.61
)(−0.96
)(0.57)
(−3.74
)(−3.08
)(1.50)
(4.88)
(4.04)
(−1.07
)
Foreignexchange
depo
sits
1.08
9*−0.50
7−0.08
54−1.52
8−2.44
3**
0.05
501.45
0**
−1.71
00.44
6
(1.73)
(−0.56
)(−0.09
)(−1.44
)(−2.01
)(0.03)
(1.98)
(−1.36
)(0.45)
Size
−0.13
4***
−0.28
0***
0.23
8**
0.16
40.09
590.06
77−0.11
8**
−0.22
6**
0.25
4**
(−2.69
)(−3.62
)(1.98)
(1.20)
(0.69)
(0.18)
(−2.23
)(−2.46
)(1.97)
Capitalratio
−0.04
05−0.20
50.23
0−2.40
6−2.83
5−0.17
9−0.04
99−0.16
20.25
8
(−0.78
)(−0.47
)(0.83)
(−1.15
)(−1.17
)(−0.07
)(−0.87
)(−0.44
)(0.90)
GDPgrow
th0.01
69**
*0.01
61**
−0.00
738
0.02
570.01
880.01
530.01
69**
*0.02
24***
−0.01
30
(3.15)
(2.10)
(−1.01
)(1.41)
(0.99)
(0.81)
(3.04)
(2.72)
(−1.65
)
Exchang
erate
derivativ
es0.54
5***
0.67
8***
0.15
3***
0.72
1***
0.85
7***
0.11
00.79
1***
0.93
4***
0.13
5***
(6.31)
(5.81)
(4.97)
(6.84)
(5.95)
(1.35)
(5.29)
(4.15)
(4.62)
L.exchange
rate
risk
beta
0.99
3***
1.50
8***
0.98
7***
(10.89
)(4.49)
(10.63
)
N11
,803
4354
3841
759
711
682
11,044
3643
3159
Adjusted-R2
0.16
50.20
30.40
40.40
40.16
00.19
3(con
tinued)
184 Appendix A: Chapter 2

Tab
leA.3
(con
tinued)
Variable
Total
BHCs
Large
BHCs
SmallBHCs
AR(1)
0.00
00.00
20.00
0
AR(2)
0.47
20.12
80.84
7
HansenJstatistic
(p-value)
0.86
4(0.64
9)2.94
(0.568
)1.29
(0.731
)
Pan
elC:Creditrisk
beta
(foreign
expo
sure
asinstrumentvariab
le)
Marketliq
uidity
−0.51
1***
−0.44
0***
−0.11
1−0.25
3−0.43
9*−0.26
2−0.51
8***
−0.46
2***
0.11
4
(−9.38
)(−5.48
)(−1.49
)(−1.11
)(−1.95
)(−0.05
)(−9.23
)(−5.54
)(1.11)
Fund
ingliq
uidity
−0.38
8***
−0.66
3***
0.02
33−1.56
2***
−1.60
1***
13.62*
*−0.34
6**
−0.54
7***
−0.05
00
(−2.94
)(−4.04
)(0.23)
(−3.59
)(−3.76
)(2.14)
(−2.48
)(−3.04
)(−0.40
)
Non
-perform
ingloans
−4.71
7***
−3.14
7***
−0.53
2−11
.42*
**−12
.54*
**−39
.84
−4.26
9***
−1.57
0***
0.26
6
(−11
.39)
(−6.25
)(−1.62
)(−7.45
)(−8.51
)(0.77)
(−10
.17)
(−3.22
)(0.86)
Loancharge-offs
−5.92
2***
−4.50
1*−0.20
0−17
.73*
**−23
.53*
**−41
.29
−3.87
8*−0.74
30.16
5
(−2.68
)(−1.94
)(−0.20
)(−3.13
)(−5.16
)(−1.19
)(−1.65
)(−0.32
)(0.14)
Loanloss
prov
isions
6.48
8***
4.96
0**
0.19
312
.56*
**16
.65*
**80
.36*
*5.59
2***
2.57
02.68
5**
(3.19)
(2.20)
(0.18)
(2.70)
(3.91)
(2.65)
(2.60)
(1.14)
(2.23)
Size
0.04
96**
*−0.00
257
−0.01
400.20
7***
0.27
7***
−0.39
00.06
58**
*0.02
640.00
147
(2.83)
(−0.10
)(−0.47
)(4.14)
(5.99)
(−0.72
)(3.60)
(0.92)
(0.03)
Capitalratio
−0.00
646
−0.01
330.13
7**
2.16
2***
1.72
0**
−33
.11*
−0.00
130
0.07
350.08
67
(−0.69
)(−0.15
)(2.19)
(3.03)
(2.16)
(−1.81
)(−0.11
)(0.86)
(1.16)
GDPgrow
th0.00
617*
**0.00
609*
*0.00
570*
*0.01
61**
0.01
64**
−0.06
770.00
520*
**0.00
437
0.00
701*
(3.40)
(2.22)
(2.04)
(2.41)
(2.54)
(−1.63
)(2.80)
(1.52)
(1.73)
Creditderivativ
es0.07
61**
*0.07
34**
*0.02
43**
*0.10
3***
0.09
61**
*0.99
8***
0.07
08*
0.10
10.04
47***
(4.73)
(4.33)
(2.62)
(5.88)
(5.77)
(3.75)
(1.76)
(1.41)
(3.32)
(con
tinued)
Appendix A: Chapter 2 185

Tab
leA.3
(con
tinued)
Variable
Total
BHCs
Large
BHCs
SmallBHCs
L.creditrisk
beta
−0.70
3***
0.06
580.90
2***
(−7.37
)(0.19)
(7.65)
N10
,984
4121
3664
697
667
646
10,287
3454
3018
Adjusted-R2
0.16
30.21
90.59
40.62
00.14
90.16
9
AR(1)
0.00
00.00
10.00
0
AR(2)
0.83
40.48
20.12
8
HansenJstatistic
(p-value)
0.46
0(0.79
5)6.91
(0.938
)1.51
(0.470
)
Estim
ationmetho
dFE
IVGMM
FEIV
GMM
FEIV
GMM
PanelA
andPanelB
areusingbasisexpo
sure
asinstrumentv
ariable,whilePanelC
isusingforeignexpo
sure
asinstrumentv
ariable.The
depend
entv
ariablein
each
Panelisou
restim
ates
ofrisk
betaof
each
BHCiatthe
starttim
eto
ffou
r-year
rolling
windo
wregression
inthefirst-stage.Weweigh
teachob
servationby
theinverseof
thestandard
errorof
beta
coefficients
inthefirst-stageestim
ation.
The
regression
sinclud
edbank
-specificfixedeffectsandyearly
dummy
variables.Heteroskedasticity
-con
sistentstandard
errors
areused
andtstatisticsarerepo
rted
inparentheses.
* p<0.10
,**p<0.05
,*** p
<0.01
Source
FinancialS
tatementsdatafrom
FRY-9C;R
iskbetasarecompu
tedfrom
thefour-factormod
elusingdatafrom
CenterforResearchin
Security
Prices
(CRSP
)database
andFederalReserve
mon
thly
Statistical
Releases
186 Appendix A: Chapter 2
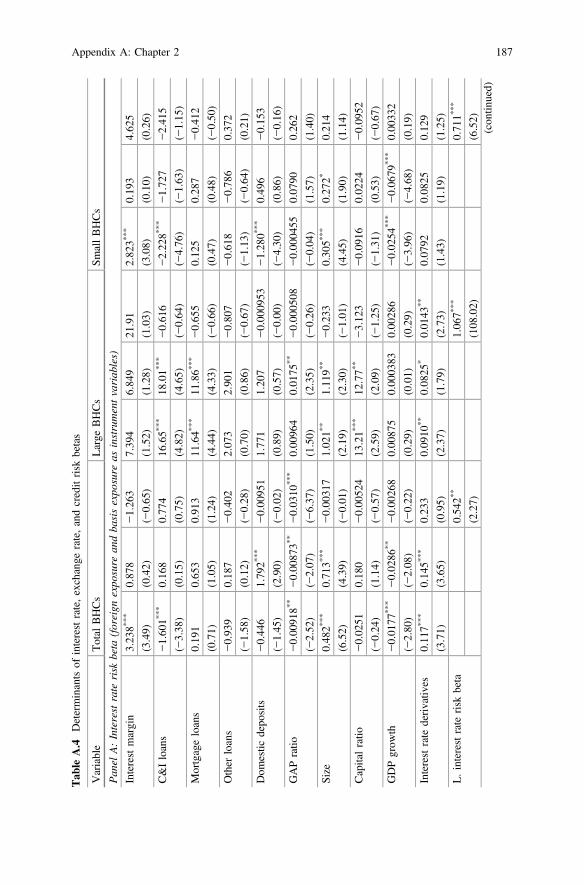
Tab
leA.4
Determinantsof
interestrate,exchange
rate,andcreditrisk
betas
Variable
Total
BHCs
Large
BHCs
SmallBHCs
Pan
elA:Interestrate
risk
beta
(foreign
expo
sure
andba
sisexpo
sure
asinstrumentvariab
les)
Interestmargin
3.23
8***
0.87
8−1.26
37.39
46.84
921
.91
2.82
3***
0.19
34.62
5
(3.49)
(0.42)
(−0.65
)(1.52)
(1.28)
(1.03)
(3.08)
(0.10)
(0.26)
C&Iloans
−1.60
1***
0.16
80.77
416
.65*
**18
.01*
**−0.61
6−2.22
8***
−1.72
7−2.41
5
(−3.38
)(0.15)
(0.75)
(4.82)
(4.65)
(−0.64
)(−4.76
)(−1.63
)(−1.15
)
Mortgageloans
0.19
10.65
30.91
311
.64*
**11
.86*
**−0.65
50.12
50.28
7−0.41
2
(0.71)
(1.05)
(1.24)
(4.44)
(4.33)
(−0.66
)(0.47)
(0.48)
(−0.50
)
Other
loans
−0.93
90.18
7−0.40
22.07
32.90
1−0.80
7−0.61
8−0.78
60.37
2
(−1.58
)(0.12)
(−0.28
)(0.70)
(0.86)
(−0.67
)(−1.13
)(−0.64
)(0.21)
Dom
estic
depo
sits
−0.44
61.79
2***
−0.00
951
1.77
11.20
7−0.00
0953
−1.28
0***
0.49
6−0.15
3
(−1.45
)(2.90)
(−0.02
)(0.89)
(0.57)
(−0.00
)(−4.30
)(0.86)
(−0.16
)
GAPratio
−0.00
918*
*−0.00
873*
*−0.03
10**
*0.00
964
0.01
75**
−0.00
0508
−0.00
0455
0.07
900.26
2
(−2.52
)(−2.07
)(−6.37
)(1.50)
(2.35)
(−0.26
)(−0.04
)(1.57)
(1.40)
Size
0.48
2***
0.71
3***
−0.00
317
1.02
1**
1.11
9**
−0.23
30.30
5***
0.27
2*0.21
4
(6.52)
(4.39)
(−0.01
)(2.19)
(2.30)
(−1.01
)(4.45)
(1.90)
(1.14)
Capitalratio
−0.02
510.18
0−0.00
524
13.21*
**12
.77*
*−3.12
3−0.09
160.02
24−0.09
52
(−0.24
)(1.14)
(−0.57
)(2.59)
(2.09)
(−1.25
)(−1.31
)(0.53)
(−0.67
)
GDPgrow
th−0.01
77**
*−0.02
86**
−0.00
268
0.00
875
0.00
0383
0.00
286
−0.02
54**
*−0.06
79***
0.00
332
(−2.80
)(−2.08
)(−0.22
)(0.29)
(0.01)
(0.29)
(−3.96
)(−4.68
)(0.19)
Interestrate
derivativ
es0.11
7***
0.14
5***
0.23
30.09
10**
0.08
25*
0.01
43**
0.07
920.08
250.12
9
(3.71)
(3.65)
(0.95)
(2.37)
(1.79)
(2.73)
(1.43)
(1.19)
(1.25)
L.interestrate
risk
beta
0.54
2**
1.06
7***
0.71
1***
(2.27)
(108
.02)
(6.52)
(con
tinued)
Appendix A: Chapter 2 187

Tab
leA.4
(con
tinued)
Variable
Total
BHCs
Large
BHCs
SmallBHCs
N14
,128
6154
5476
792
744
762
13,336
5410
4714
Adjusted-R2
0.10
60.06
330.46
00.46
10.09
850.02
09
AR(1)
0.01
40.00
00.00
0
AR(2)
0.73
60.23
70.48
7
HansenJstatistic
(p-value)
11.74
(0.228
)0.02
00(0.990
)2.40
2(0.493
)
Pan
elB:Excha
ngerate
risk
beta
(interestrate
expo
sure
andba
sisexpo
sure
asinstrumentvariab
les)
Assetsin
foreign
currencies
−0.57
0−1.81
9−0.11
3−5.00
7***
−4.76
0***
0.78
54.95
4***
3.89
6***
−1.55
5*
(−0.55
)(−1.47
)(−0.23
)(−4.14
)(−3.60
)(1.07)
(5.02)
(2.78)
(−1.72
)
Foreignexchange
depo
sits
0.82
00.37
00.54
10.04
23−0.50
40.37
10.59
5−0.78
91.30
8
(1.30)
(0.42)
(0.76)
(0.04)
(−0.42
)(0.33)
(0.78)
(−0.65
)(0.98)
Size
−0.04
34−0.12
5*0.19
1*0.15
00.06
71−0.06
43−0.03
05−0.09
100.28
2**
(−0.96
)(−1.76
)(1.95)
(1.16)
(0.53)
(−0.20
)(−0.64
)(−1.12
)(2.40)
Capitalratio
0.00
0939
−0.01
070.00
0230
−3.26
0*−3.34
1−1.06
6−0.00
229
−0.00
811
0.00
0709
(0.06)
(−0.84
)(0.18)
(−1.67
)(−1.52
)(−0.38
)(−0.16
)(−0.78
)(0.52)
GDPgrow
th0.00
678
0.01
25*
−0.00
423
−0.00
0443
−0.00
947
0.00
457
0.00
886*
0.02
24***
−0.01
15
(1.38)
(1.89)
(−0.56
)(−0.02
)(−0.50
)(0.17)
(1.75)
(3.17)
(−1.33
)
Exchang
erate
derivativ
es0.60
0***
0.69
6***
0.14
9***
0.69
3***
0.79
4***
0.05
300.82
6***
0.90
8***
0.10
1***
(6.66)
(5.74)
(4.31)
(6.36)
(5.44)
(1.23)
(4.82)
(3.68)
(3.08)
L.exchange
rate
risk
beta
1.12
3***
1.21
8***
1.23
7***
(13.03
)(5.48)
(5.80)
N14
,136
6155
5474
797
749
717
13,339
5406
4757
Adjusted-R2
0.18
90.24
00.44
10.46
30.18
20.21
7(con
tinued)
188 Appendix A: Chapter 2

Tab
leA.4
(con
tinued)
Variable
Total
BHCs
Large
BHCs
SmallBHCs
AR(1)
0.00
00.00
60.00
0
AR(2)
0.11
20.19
60.03
3
HansenJstatistic
(p-value)
0.55
8(0.906
)5.55
4(0.35
2)16
.33
(0.003
)
Pan
elC:Creditrisk
beta
(interestrate
expo
sure
andforeignexpo
sure
asinstrumentvariab
les)
Marketliq
uidity
−0.13
4***
−0.12
8***
−0.00
696
0.33
4***
0.31
5***
0.22
8−0.13
9***
−0.16
5***
0.05
87
(−4.98
)(−2.99
)(−0.23
)(3.39)
(3.07)
(0.97)
(−5.07
)(−3.70
)(1.41)
Fund
ingliq
uidity
−0.18
1***
−0.21
6**
−0.00
0983
−1.09
3***
−1.11
5***
0.61
6*−0.16
2***
−0.11
4−0.12
4***
(−3.25
)(−2.41
)(−0.03
)(−4.37
)(−4.53
)(2.05)
(−2.82
)(−1.15
)(−2.60
)
Non
-perform
ingloans
−1.87
1***
−0.95
0***
0.06
22−6.24
1***
−6.63
7***
9.03
4***
−1.85
8***
−0.76
5***
0.22
0*
(−9.93
)(−4.75
)(0.59)
(−7.14
)(−7.25
)(2.86)
(−9.98
)(−4.24
)(1.95)
Loancharge-offs
−1.71
0−2.78
3**
−0.35
3−12
.41*
**−16
.16*
**−9.12
1**
−0.88
5−1.38
40.04
07
(−1.48
)(−2.34
)(−0.79
)(−3.21
)(−4.95
)(−2.18
)(−0.75
)(−1.17
)(0.08)
Loanloss
prov
isions
3.85
7***
3.79
5***
0.37
78.54
5**
10.24*
**20
.35*
*3.34
6***
2.54
8**
0.43
4
(3.91)
(3.54)
(0.83)
(2.38)
(3.02)
(2.34)
(3.34)
(2.43)
(0.95)
Size
−0.00
759
−0.01
97−0.03
49**
*0.09
67**
*0.12
7***
−0.07
35−0.00
185
−0.01
16−0.02
15
(−0.80
)(−1.31
)(−3.88
)(3.55)
(4.19)
(−1.59
)(−0.19
)(−0.73
)(−1.50
)
Capitalratio
0.00
266
−0.00
214
0.00
0250
0.76
2*0.46
2−1.00
00.00
499
0.00
207
0.00
0422
(0.42)
(−0.59
)(0.60)
(1.95)
(0.92)
(−0.84
)(0.57)
(0.48)
(0.80)
GDPgrow
th0.00
0603
0.00
214
0.00
183
−0.00
224
−0.00
339
−0.00
0924
0.00
114
0.00
447*
**0.00
133
(0.72)
(1.44)
(1.51)
(−1.03
)(−1.46
)(−0.22
)(1.33)
(2.73)
(1.05)
Creditderivativ
es0.01
260.01
770.00
741
0.05
79**
*0.05
85**
*0.07
090.01
83**
0.00
597
0.00
497*
(1.16)
(1.40)
(1.19)
(5.36)
(5.24)
(0.66)
(2.26)
(0.63)
(1.76)
(con
tinued)
Appendix A: Chapter 2 189

Tab
leA.4
(con
tinued)
Variable
Total
BHCs
Large
BHCs
SmallBHCs
L.creditrisk
beta
−0.35
4***
2.37
9**
0.80
0***
(−3.85
)(2.78)
(9.60)
N13
,359
5934
5307
737
707
685
12,622
5227
4622
Adjusted-R2
0.08
090.07
720.56
40.58
50.09
190.10
4
AR(1)
0.00
00.04
10.00
0
AR(2)
0.14
80.24
60.10
0
HansenJstatistic
(p-value)
2.93
2(0.402
)2.35
5(0.50
2)0.46
1(0.927
)
Estim
ationmetho
dFE
IVGMM
FEIV
GMM
FEIV
GMM
Rob
ustnesscheckby
usingthechange
inthedifference
betweenBBBbo
ndyieldandtherisk-freeratein
thefirst-stageregression
asan
alternativedefinitio
nof
CreditRisk.PanelA
isusingforeignexpo
sure
andcreditexpo
sure
asinstrumentvariables,PanelBisusinginterestrate
expo
sure
andcreditexpo
sure
asinstrumentvariables,andPanelCisusinginterestrate
expo
sure
andforeignexpo
sure
asinstrumentvariables.The
depend
entvariable
ineach
Panelisou
restim
ates
ofrisk
betaof
each
BHCiatthe
starttim
eto
ffou
r-year
rolling
windo
wregression
inthefirst-stage.Weweigh
teachob
servationby
theinverseof
thestandard
errorof
beta
coefficients
inthefirst-stageestim
ation.
The
regression
sinclud
edbank
-specificfixedeffectsandyearly
dummyvariables.
Heteroskedasticity
-con
sistentstandard
errors
areused
andtstatisticsarerepo
rted
inparentheses.
* p<0.10
,**p<0.05
,**
* p<0.01
Source
FinancialS
tatementsdatafrom
FRY-9C;R
iskbetasarecompu
tedfrom
thefour-factormod
elusingdatafrom
CenterforResearchin
Security
Prices
(CRSP
)database
andFederalReserve
mon
thly
Statistical
Releases
190 Appendix A: Chapter 2

Tab
leA.5
Determinantsof
interestrate,exchange
rate,andcreditrisk
betas
Variable
Total
BHCs
Large
BHCs
SmallBHCs
Pan
elA:Interestrate
risk
beta
(foreign
expo
sure
asinstrumentvariab
le)
Interestmargin
3.23
8***
1.01
9−1.28
27.39
48.17
0−12
.24*
**2.82
3***
0.16
0−2.72
9*
(3.49)
(0.49)
(−0.66
)(1.52)
(1.56)
(−3.59
)(3.08)
(0.08)
(−1.75
)
C&Iloans
−1.60
1***
0.21
80.85
916
.65*
**17
.86*
**−0.90
1−2.22
8***
−1.61
71.03
0
(−3.38
)(0.20)
(0.84)
(4.82)
(4.71)
(−0.94
)(−4.76
)(−1.51
)(0.90)
Mortgageloans
0.19
10.72
80.97
711
.64*
**11
.97*
**0.45
20.12
50.31
60.69
8
(0.71)
(1.17)
(1.34)
(4.44)
(4.40)
(0.74)
(0.47)
(0.53)
(1.31)
Other
loans
−0.93
90.15
8−0.41
72.07
32.76
80.77
8−0.61
8−0.61
00.21
3
(−1.58
)(0.11)
(−0.29
)(0.70)
(0.85)
(1.10)
(−1.13
)(−0.49
)(0.30)
Dom
estic
Deposits
−0.44
61.79
1***
−0.08
311.77
11.48
40.05
85−1.28
0***
0.41
9−0.09
06
(−1.45
)(2.89)
(−0.19
)(0.89)
(0.71)
(0.12)
(−4.30
)(0.73)
(−0.20
)
GAPratio
−0.00
918*
*−0.00
844*
*−0.03
18**
*0.00
964
0.01
77**
0.00
177
−0.00
0455
0.07
75−0.09
46**
(−2.52
)(−2.00
)(−5.92
)(1.50)
(2.38)
(1.23)
(−0.04
)(1.54)
(−2.07
)
Size
0.48
2***
0.72
3***
−0.02
141.02
1**
1.07
6**
0.12
90.30
5***
0.29
5**
0.09
80
(6.52)
(4.42)
(−0.05
)(2.19)
(2.25)
(1.36)
(4.45)
(2.02)
(0.59)
Capitalratio
−0.02
510.18
3−0.00
434
13.21*
**12
.32*
*−1.65
3−0.09
160.02
47−0.00
254
(−0.24
)(1.14)
(−0.48
)(2.59)
(2.07)
(−0.77
)(−1.31
)(0.58)
(−0.42
)
GDPgrow
th−0.01
77**
*−0.02
71**
−0.00
192
0.00
875
0.00
546
0.00
816
−0.02
54**
*−0.06
76***
−0.00
622
(−2.80
)(−1.98
)(−0.16
)(0.29)
(0.17)
(0.73)
(−3.96
)(−4.66
)(−0.42
)
Interestrate
derivativ
es0.11
7***
0.14
4***
0.19
70.09
10**
0.08
27*
0.01
35**
0.07
920.08
220.21
6
(3.71)
(3.63)
(1.01)
(2.37)
(1.78)
(2.73)
(1.43)
(1.18)
(0.51)
l.interestrate
risk
beta
0.59
4**
1.07
3***
0.73
8**
(2.30)
(148
.99)
(2.03)
(con
tinued)
Appendix A: Chapter 2 191

Tab
leA.5
(con
tinued)
Variable
Total
BHCs
Large
BHCs
SmallBHCs
N14
,128
6173
5505
792
757
762
13,336
5416
4711
Adjusted-R2
0.10
60.06
450.46
00.46
30.09
850.02
11
AR(1)
0.01
30.00
00.03
5
AR(2)
0.78
50.26
20.47
8
HansenJstatistic
(p-value)
10.57
(0.227
)0.02
32(0.879
)3.05
6(0.880
)
Pan
elB:Excha
ngerate
risk
beta
(interestrate
expo
sure
asinstrumentvariab
le)
Assetsin
foreign
currencies
−0.57
0−1.80
6−0.31
6−5.00
7***
−4.67
4***
0.41
74.95
4***
3.88
9***
1.67
7**
(−0.55
)(−1.48
)(−0.67
)(−4.14
)(−3.64
)(0.63)
(5.02)
(2.79)
(2.54)
Foreignexchange
depo
sits
0.82
00.36
70.34
10.04
23−0.37
60.34
00.59
5−0.79
30.18
2
(1.30)
(0.42)
(0.49)
(0.04)
(−0.31
)(0.38)
(0.78)
(−0.66
)(0.15)
Size
−0.04
34−0.12
2*0.15
20.15
00.08
43−0.12
4−0.03
05−0.09
02−0.28
2***
(−0.96
)(−1.75
)(1.56)
(1.16)
(0.67)
(−0.33
)(−0.64
)(−1.13
)(−2.64
)
Capitalratio
0.00
0939
−0.00
971
0.00
0339
−3.26
0*−3.26
2−1.67
5−0.00
229
−0.00
700
0.00
334
(0.06)
(−0.79
)(0.27)
(−1.67
)(−1.50
)(−0.50
)(−0.16
)(−0.69
)(1.20)
GDPgrow
th0.00
678
0.01
24*
−0.00
367
−0.00
0443
−0.01
100.00
446
0.00
886*
0.02
24***
−0.00
277
(1.38)
(1.88)
(−0.50
)(−0.02
)(−0.59
)(0.17)
(1.75)
(3.19)
(−0.51
)
Exchang
erate
derivativ
es0.60
0***
0.69
8***
0.15
5***
0.69
3***
0.80
5***
0.05
610.82
6***
0.90
1***
0.12
3**
(6.66)
(5.85)
(4.17)
(6.36)
(5.61)
(0.82)
(4.82)
(3.69)
(2.02)
L.exchange
rate
risk
beta
1.09
8***
1.27
9***
−0.66
1***
(13.36
)(4.80)
(−5.04
)
N14
,136
6221
5565
797
766
742
13,339
5455
4823
Adjusted-R2
0.18
90.24
10.44
10.46
70.18
20.21
7(con
tinued)
192 Appendix A: Chapter 2

Tab
leA.5
(con
tinued)
Variable
Total
BHCs
Large
BHCs
SmallBHCs
AR(1)
0.00
00.00
90.00
0
AR(2)
0.10
60.18
70.32
6
HansenJstatistic
(p-value)
0.33
1(0.847
)5.15
4(0.27
2)2.14
6(0.342
)
Pan
elC:Creditrisk
beta
(interestrate
expo
sure
asinstrumentvariab
le)
Marketliq
uidity
−0.13
4***
−0.11
7***
−0.00
539
0.33
4***
0.31
5***
0.19
4−0.13
9***
−0.15
4***
0.06
65
(−4.98
)(−2.73
)(−0.18
)(3.39)
(3.07)
(0.81)
(−5.07
)(−3.45
)(1.65)
Fund
ingliq
uidity
−0.18
1***
−0.18
7**
0.00
368
−1.09
3***
−1.11
5***
0.67
6**
−0.16
2***
−0.08
53−0.12
2**
(−3.25
)(−2.12
)(0.11)
(−4.37
)(−4.53
)(2.25)
(−2.82
)(−0.88
)(−2.53
)
Non
-perform
ingLoans
−1.87
1***
−0.93
6***
0.07
86−6.24
1***
−6.63
7***
8.00
2**
−1.85
8***
−0.75
1***
0.25
0**
(−9.93
)(−4.69
)(0.75)
(−7.14
)(−7.25
)(2.38)
(−9.98
)(−4.16
)(2.17)
Loancharge-offs
−1.71
0−2.74
6**
−0.33
1−12
.41*
**−16
.16*
**−8.33
5*−0.88
5−1.35
6−0.02
19
(−1.48
)(−2.30
)(−0.73
)(−3.21
)(−4.95
)(−1.94
)(−0.75
)(−1.15
)(−0.05
)
Loanloss
Prov
isions
3.85
7***
3.75
4***
0.34
58.54
5**
10.24*
**18
.11*
*3.34
6***
2.51
6**
0.49
8
(3.91)
(3.49)
(0.74)
(2.38)
(3.02)
(2.10)
(3.34)
(2.39)
(1.09)
Size
−0.00
759
−0.02
69*
−0.03
61**
*0.09
67**
*0.12
7***
−0.07
46−0.00
185
−0.01
95−0.02
59*
(−0.80
)(−1.77
)(−4.09
)(3.55)
(4.19)
(−1.63
)(−0.19
)(−1.22
)(−1.85
)
Capitalratio
0.00
266
−0.00
247
0.00
0238
0.76
2*0.46
2−1.05
30.00
499
0.00
172
0.00
0400
(0.42)
(−0.67
)(0.57)
(1.95)
(0.92)
(−0.91
)(0.57)
(0.41)
(0.75)
GDPgrow
th0.00
0603
0.00
223
0.00
192
−0.00
224
−0.00
339
0.00
0253
0.00
114
0.00
451*
**0.00
152
(0.72)
(1.51)
(1.61)
(−1.03
)(−1.47
)(0.06)
(1.33)
(2.78)
(1.23)
Creditderivativ
es0.01
260.01
800.00
754
0.05
79**
*0.05
85**
*0.00
933*
0.01
83**
0.00
937
0.00
483*
(1.16)
(1.42)
(1.19)
(5.36)
(5.24)
(2.03)
(2.26)
(0.95)
(1.67)
(con
tinued)
Appendix A: Chapter 2 193

Tab
leA.5
(con
tinued)
Variable
Total
BHCs
Large
BHCs
SmallBHCs
L.creditrisk
beta
−0.35
3***
2.06
0**
0.79
9***
(−3.81
)(2.36)
(9.76)
N13
,359
5971
5357
737
707
685
12,622
5264
4672
Adjusted-R2
0.08
090.07
770.56
40.58
50.09
190.10
4
AR(1)
0.00
00.05
70.00
0
AR(2)
0.12
10.26
60.14
1
HansenJstatistic
(p-value)
3.29
0(0.193
)2.05
5(0.56
1)0.41
5(0.813
)
Estim
ationmetho
dFE
IVGMM
FEIV
GMM
FEIV
GMM
Rob
ustnesscheckby
usingthechange
inthedifference
betweenBBBbo
ndyieldandtherisk-freeratein
thefirst-stageregression
asan
alternativedefinitio
nof
CreditR
isk.PanelA
isusingforeignexpo
sure
asinstrumentv
ariable,whilePanelB
andPanelC
areusinginterestrateexpo
sure
asinstrumentv
ariable.The
depend
entvariable
ineach
Panelisou
restim
ates
ofrisk
beta
ofeach
BHCiat
thestarttim
etof
four-yearrolling
windo
wregression
inthefirst-stage.
We
weigh
teach
observationby
theinverseof
thestandard
errorof
beta
coefficients
inthefirst-stageestim
ation.
The
regression
sinclud
edbank
-specificfixed
effectsandyearly
dummyvariables.Heteroskedasticity
-con
sistentstandard
errors
areused
andtstatisticsarerepo
rted
inparentheses.*p
<0.10
,**p
<0.05
,*** p
<0.01
Source
FinancialS
tatementsdatafrom
FRY-9C;R
iskbetasarecompu
tedfrom
thefour-factormod
elusingdatafrom
CenterforResearchin
Security
Prices
(CRSP
)database
andFederalReserve
mon
thly
Statistical
Releases
194 Appendix A: Chapter 2

Tab
leA.6
Determinantsof
interestrate,exchange
rate,andcreditrisk
betas
Variable
Total
BHCs
Large
BHCs
SmallBHCs
Pan
elA:Interestrate
risk
beta
(foreign
expo
sure
asinstrumentvariab
le)
Interestmargin
3.23
8***
0.88
0−1.09
77.39
46.87
022
.92
2.82
3***
0.19
3−29
.45*
*
(3.49)
(0.43)
(−0.53
)(1.52)
(1.28)
(1.37)
(3.08)
(0.10)
(−1.99
)
C&Iloans
−1.60
1***
0.16
61.13
216
.65*
**17
.99*
**−0.76
7−2.22
8***
−1.72
5−1.74
8
(−3.38
)(0.15)
(1.21)
(4.82)
(4.64)
(−0.71
)(−4.76
)(−1.63
)(−0.88
)
Mortgageloans
0.19
10.65
21.07
611
.64*
**11
.84*
**−0.82
00.12
50.28
7−0.05
78
(0.71)
(1.05)
(1.56)
(4.44)
(4.33)
(−0.72
)(0.47)
(0.48)
(−0.07
)
Other
loans
−0.93
90.18
70.27
32.07
32.88
8−0.84
6−0.61
8−0.78
70.49
8
(−1.58
)(0.12)
(0.22)
(0.70)
(0.85)
(−0.64
)(−1.13
)(−0.64
)(0.27)
Dom
estic
depo
sits
−0.44
61.79
2***
−0.00
0112
1.77
11.22
60.01
49−1.28
0***
0.49
7−0.45
2
(−1.45
)(2.90)
(−0.00
)(0.89)
(0.58)
(0.04)
(−4.30
)(0.86)
(−0.42
)
GAPratio
−0.00
918*
*−0.00
873*
*−0.02
96**
*0.00
964
0.01
75**
−0.00
0466
−0.00
0455
0.07
900.20
2
(−2.52
)(−2.07
)(−7.42
)(1.50)
(2.36)
(−0.26
)(−0.04
)(1.57)
(1.45)
Size
0.48
2***
0.71
3***
0.24
01.02
1**
1.11
6**
−0.24
70.30
5***
0.27
2*0.23
0
(6.52)
(4.38)
(0.81)
(2.19)
(2.30)
(−0.98
)(4.45)
(1.90)
(1.12)
Capitalratio
−0.02
510.18
0−0.00
290
13.21*
**12
.77*
*−3.45
0−0.09
160.02
24−0.01
98
(−0.24
)(1.14)
(−0.30
)(2.59)
(2.09)
(−1.33
)(−1.31
)(0.53)
(−0.10
)
GDPgrow
th−0.01
77**
*−0.02
86**
0.00
0267
0.00
875
0.00
0190
0.00
176
−0.02
54**
*−0.06
79***
0.00
890
(−2.80
)(−2.08
)(0.02)
(0.29)
(0.01)
(0.17)
(−3.96
)(−4.68
)(0.49)
Interestrate
derivativ
es0.11
7***
0.14
4***
0.29
9*0.09
10**
0.08
03*
0.01
35**
0.07
920.08
340.15
6
(3.71)
(3.63)
(1.75)
(2.37)
(1.75)
(2.27)
(1.43)
(1.20)
(1.48)
L.interestrate
risk
beta
0.42
1**
1.06
8***
0.72
6***
(2.15)
(99.45
)(6.57)
(con
tinued)
Appendix A: Chapter 2 195

Tab
leA.6
(con
tinued)
Variable
Total
BHCs
Large
BHCs
SmallBHCs
N14
,128
6154
5476
792
744
762
13,336
5410
4714
Adjusted-R2
0.10
60.06
330.46
00.46
10.09
850.02
09
AR(1)
0.01
20.00
00.00
0
AR(2)
0.60
60.14
90.64
2
HansenJstatistic
(p-value)
12.70
(0.241
)0.20
4(0.651
)2.47
8(0.649
)
Pan
elB:Excha
ngerate
risk
beta
(basisexpo
sure
asinstrumentvariab
le)
Assetsin
foreign
currencies
−0.57
0−1.16
5−0.09
98−5.00
7***
−4.64
7***
0.70
94.95
4***
4.66
5***
1.74
5***
(−0.55
)(−0.97
)(−0.21
)(−4.14
)(−3.50
)(0.97)
(5.02)
(3.75)
(2.95)
Foreignexchange
depo
sits
0.82
00.21
20.50
80.04
23−0.68
90.45
90.59
5−0.95
40.37
9
(1.30)
(0.24)
(0.70)
(0.04)
(−0.56
)(0.43)
(0.78)
(−0.79
)(0.31)
Size
−0.04
34−0.13
1*0.18
1*0.15
00.06
61−0.11
3−0.03
05−0.09
48−0.30
1***
(−0.96
)(−1.84
)(1.84)
(1.16)
(0.52)
(−0.34
)(−0.64
)(−1.16
)(−2.83
)
Capitalratio
0.00
0939
−0.00
753
0.00
0281
−3.26
0*−3.34
1−0.62
5−0.00
229
−0.00
716
0.00
317
(0.06)
(−0.64
)(0.23)
(−1.67
)(−1.51
)(−0.22
)(−0.16
)(−0.70
)(1.19)
GDPgrow
th0.00
678
0.01
20*
−0.00
450
−0.00
0443
−0.00
910
0.00
485
0.00
886*
0.02
20***
−0.00
343
(1.38)
(1.81)
(−0.60
)(−0.02
)(−0.48
)(0.18)
(1.75)
(3.11)
(−0.67
)
Exchang
erate
derivativ
es0.60
0***
0.71
6***
0.15
0***
0.69
3***
0.82
3***
0.03
090.82
6***
0.90
5***
0.12
1**
(6.66)
(5.84)
(4.30)
(6.36)
(5.53)
(0.54)
(4.82)
(3.63)
(1.99)
L.exchange
rate
risk
beta
1.11
9***
1.15
9***
−0.68
6***
(13.06
)(4.81)
(−5.14
)
N14
,136
6160
5480
797
749
717
13,339
5411
4763
Adjusted-R2
0.18
90.23
80.44
10.46
20.18
20.21
6(con
tinued)
196 Appendix A: Chapter 2

Tab
leA.6
(con
tinued)
Variable
Total
BHCs
Large
BHCs
SmallBHCs
AR(1)
0.00
00.01
30.00
0
AR(2)
0.11
50.18
00.30
0
HansenJstatistic
(p-value)
0.10
9(0.947
)5.36
0(0.252
)0.35
9(0.836
)
Pan
elC:Creditrisk
beta
(foreign
expo
sure
asinstrumentvariab
le)
Marketliq
uidity
−0.13
4***
−0.12
7***
−0.01
640.33
4***
0.31
4***
0.07
54−0.13
9***
−0.16
5***
−0.02
28
(−4.98
)(−2.98
)(−0.53
)(3.39)
(3.06)
(0.44)
(−5.07
)(−3.69
)(−0.70
)
Fund
ingliq
uidity
−0.18
1***
−0.21
0**
−0.00
533
−1.09
3***
−1.12
1***
0.09
74−0.16
2***
−0.10
7−0.01
02
(−3.25
)(−2.34
)(−0.16
)(−4.37
)(−4.55
)(0.42)
(−2.82
)(−1.08
)(−0.29
)
Non
-perform
ingloans
−1.87
1***
−0.95
7***
0.04
87−6.24
1***
−6.62
3***
−6.95
3−1.85
8***
−0.77
3***
0.04
00
(−9.93
)(−4.76
)(0.46)
(−7.14
)(−7.23
)(−0.96
)(−9.98
)(−4.26
)(0.38)
Loancharge-offs
−1.71
0−2.84
0**
−0.27
0−12
.41*
**−16
.13*
**−3.45
7−0.88
5−1.45
5−0.03
64
(−1.48
)(−2.38
)(−0.61
)(−3.21
)(−4.94
)(−0.44
)(−0.75
)(−1.23
)(−0.08
)
Loanloss
prov
isions
3.85
7***
3.86
0***
0.24
58.54
5**
10.21*
**9.85
93.34
6***
2.63
0**
0.03
64
(3.91)
(3.59)
(0.54)
(2.38)
(3.01)
(0.93)
(3.34)
(2.50)
(0.08)
Size
−0.00
759
−0.02
15−0.03
29**
*0.09
67**
*0.12
6***
−0.13
1***
−0.00
185
−0.01
38−0.02
94***
(−0.80
)(−1.43
)(−3.77
)(3.55)
(4.16)
(−2.94
)(−0.19
)(−0.87
)(−2.96
)
Capitalratio
0.00
266
−0.00
282
0.00
0247
0.76
2*0.45
4−2.37
8*0.00
499
0.00
123
0.00
0314
(0.42)
(−0.72
)(0.59)
(1.95)
(0.90)
(−2.01
)(0.57)
(0.32)
(0.64)
GDPgrow
th0.00
0603
0.00
215
0.00
158
−0.00
224
−0.00
342
0.00
158
0.00
114
0.00
448*
**0.00
183
(0.72)
(1.44)
(1.32)
(−1.03
)(−1.48
)(0.64)
(1.33)
(2.73)
(1.35)
Creditderivativ
es0.01
260.01
790.00
864*
0.05
79**
*0.05
97**
*0.15
6***
0.01
83**
0.00
601
0.01
15***
(1.16)
(1.42)
(1.69)
(5.36)
(5.36)
(4.01)
(2.26)
(0.65)
(3.13)
L.creditrisk
beta
−0.38
1***
0.08
10**
−0.43
6***
(−4.05
)(2.73)
(−3.48
)(con
tinued)
Appendix A: Chapter 2 197

Tab
leA.6
(con
tinued)
Variable
Total
BHCs
Large
BHCs
SmallBHCs
N13
,359
5941
5316
737
707
685
12,622
5234
4631
Adjusted-R2
0.08
090.07
710.56
40.58
50.09
190.10
3
AR(1)
0.00
00.05
40.00
0
AR(2)
0.13
70.42
70.32
4
HansenJstatistic
(p-value)
0.03
0(0.985
)2.73
4(0.987
)0.59
4(0.743
)
Estim
ationmetho
dFE
IVGMM
FEIV
GMM
FEIV
GMM
Rob
ustnesscheckby
usingthechange
inthedifference
betweenBBBbo
ndyieldandtherisk-freeratein
thefirst-stageregression
asan
alternativedefinitio
nof
CreditRisk.
PanelA
andPanelB
areusingbasisexpo
sure
asinstrumentvariable,while
PanelC
isusingforeignexpo
sure
asinstrumentvariable.The
depend
entvariable
ineach
Panelisou
restim
ates
ofrisk
beta
ofeach
BHCiat
thestarttim
etof
four-yearrolling
windo
wregression
inthefirst-stage.
We
weigh
teach
observationby
theinverseof
thestandard
errorof
beta
coefficients
inthefirst-stageestim
ation.
The
regression
sinclud
edbank
-specificfixed
effectsandyearly
dummyvariables.Heteroskedasticity
-con
sistentstandard
errors
areused
andtstatisticsarerepo
rted
inparentheses.
* p<0.10
,** p
<0.05
,*** p
<0.01
Source
FinancialS
tatementsdatafrom
FRY-9C;R
iskbetasarecompu
tedfrom
thefour-factormod
elusingdatafrom
CenterforResearchin
Security
Prices
(CRSP
)database
andFederalReserve
mon
thly
Statistical
Releases
198 Appendix A: Chapter 2

Tab
leA.7
Determinantsof
interestrate,exchange
rate,andcreditrisk
betas,andinteractionterm
s
Variable
12
34
56
78
9
Pan
elA:Interestrate
risk
beta
Interestmargin
3.08
9***
1.55
3**
3.24
2***
3.24
4***
3.15
1***
3.00
2***
1.56
5**
3.08
6***
3.12
3***
(3.33)
(2.01)
(3.50)
(3.50)
(3.40)
(3.23)
(2.03)
(3.33)
(3.37)
C&Iloans
−1.57
7***
−0.77
0**
−1.60
8***
−1.60
9***
−1.55
2***
−1.53
2***
−0.68
6**
−1.53
0***
−1.58
2***
(−3.33
)(−2.29
)(−3.40
)(−3.40
)(−3.28
)(−3.24
)(−2.04
)(−3.24
)(−3.36
)
Mortgageloans
0.22
3−0.13
40.19
50.19
00.21
80.25
1−0.14
70.27
10.22
2
(0.83)
(−0.67
)(0.72)
(0.70)
(0.81)
(0.93)
(−0.74
)(1.00)
(0.83)
Other
loans
−1.00
7*−0.44
8−0.95
8−0.93
6−0.89
6−0.97
2−0.34
6−0.88
1−0.77
7
(−1.70
)(−1.13
)(−1.62
)(−1.58
)(−1.51
)(−1.64
)(−0.89
)(−1.48
)(−1.32
)
Dom
estic
depo
sits
−0.43
5−0.62
5***
−0.48
2−0.45
5−0.35
3−0.34
9−0.56
2**
−0.42
2−0.34
7
(−1.41
)(−2.69
)(−1.57
)(−1.48
)(−1.15
)(−1.13
)(−2.45
)(−1.37
)(−1.13
)
GAPratio
−0.00
950*
**−0.00
951*
**−0.00
926*
*−0.00
917*
*−0.00
850*
*−0.00
896*
*−0.00
777*
*−0.00
699*
−0.01
04***
(−2.61
)(−2.64
)(−2.54
)(−2.52
)(−2.32
)(−2.44
)(−2.14
)(−1.84
)(−2.70
)
Size
0.47
4***
0.33
1***
0.47
1***
0.48
0***
0.49
5***
0.48
7***
0.33
5***
0.48
0***
0.49
5***
(6.44)
(6.63)
(6.37)
(6.50)
(6.71)
(6.53)
(6.79)
(6.52)
(6.70)
Capitalratio
−0.03
93−0.02
63−0.02
53−0.02
27−0.03
79−0.02
32−0.02
18
(−0.40
)(−0.26
)(−0.24
)(−0.22
)(−0.38
)(−0.22
)(−0.21
)
Tier1
ratio
1.23
9*1.71
9***
(1.87)
(2.74)
GDPgrow
th−0.01
71**
*−0.02
52***
−0.01
78**
*−0.01
76**
*−0.01
81**
*−0.01
75**
*−0.02
39**
*−0.01
79***
−0.01
76***
(−2.71
)(−4.98
)(−2.81
)(−2.79
)(−2.87
)(−2.77
)(−4.74
)(−2.83
)(−2.78
)
Interestrate
derivativ
es−0.20
0***
−0.12
5***
−0.14
00.09
40
(−2.99
)(−3.26
)(−0.61
)(1.61)
(con
tinued)
Appendix A: Chapter 2 199

Tab
leA.7
(con
tinued)
Variable
12
34
56
78
9
Capitalratio
*interest
rate
derivativ
es2.58
5***
(4.62)
Tier1
ratio
*interestrate
derivativ
es3.48
5***
(4.55)
Size
*interestrate
derivativ
es0.01
24
(1.09)
SIFI
*interestrate
derivativ
es0.02
63
(0.39)
Interestrate
derivativ
esfortrading
0.10
4***
−0.20
4***
−0.15
8***
−0.57
4**
−0.16
2***
(3.33)
(−3.02
)(−4.05
)(−2.45
)(−3.35
)
Interestrate
derivativ
esforhedg
ing
0.37
4***
−0.04
721.40
5***
−2.76
80.46
2***
(3.24)
(−0.08
)(3.45)
(−1.64
)(4.21)
Capitalratio
*interest
rate
derivativ
esfor
trading
2.52
6***
(4.40)
Capitalratio
*interest
rate
derivativ
esfor
hedg
ing
3.13
5
(0.69)
Tier1
ratio
*interestrate
derivativ
esfortrading
3.75
2***
(4.66)
Tier1
ratio
*interestrate
derivativ
esforhedg
ing
−10
.12*
*
(−2.18
)(con
tinued)
200 Appendix A: Chapter 2

Tab
leA.7
(con
tinued)
Variable
12
34
56
78
9
Size
*interestrate
derivativ
esfortrading
0.03
22***
(2.76)
Size
*interestrate
derivativ
esforhedg
ing
0.19
2*
(1.82)
SIFI
*interestrate
derivativ
esfortrading
0.28
5***
(4.72)
SIFI
*interestrate
derivativ
esforhedg
ing
−0.90
8*
(−1.68
)
N14
,128
17,375
14,128
14,128
14,132
14,132
17,379
14,132
14,132
Adjusted-R2
0.10
80.10
90.10
60.10
60.10
60.10
80.11
10.10
70.10
7
Pan
elB:Excha
ngerate
risk
beta
Assetsin
foreign
currencies
−0.59
7−0.50
8−0.56
5−0.69
0−0.64
6−2.14
3*−1.74
5*−0.67
3−0.81
3
(−0.57
)(−0.49
)(−0.54
)(−0.65
)(−0.61
)(−1.94
)(−1.67
)(−0.62
)(−0.75
)
Foreignexchange
depo
sits
0.90
90.80
81.05
9*0.95
30.93
61.16
9*1.13
6*1.25
2**
1.00
7
(1.46)
(1.29)
(1.66)
(1.51)
(1.49)
(1.93)
(1.85)
(1.96)
(1.60)
Size
−0.04
46−0.04
73−0.04
90−0.04
21−0.04
90−0.05
08−0.05
75−0.05
70−0.04
92
(−0.98
)(−1.01
)(−1.07
)(−0.93
)(−1.08
)(−1.12
)(−1.23
)(−1.25
)(−1.08
)
Capitalratio
0.00
0231
0.00
0389
0.00
0867
0.00
0743
0.00
0472
0.00
0028
60.00
0746
(0.02)
(0.03)
(0.06)
(0.05)
(0.03)
(0.00)
(0.05)
Tier1
ratio
−0.20
0−0.37
4
(−0.47
)(−0.87
)(con
tinued)
Appendix A: Chapter 2 201
Tab
leA.7
(con
tinued)
Variable
12
34
56
78
9
GDPgrow
th0.00
670
0.00
681
0.00
671
0.00
686
0.00
673
0.00
637
0.00
681
0.00
662
0.00
670
(1.37)
(1.39)
(1.37)
(1.40)
(1.38)
(1.30)
(1.39)
(1.35)
(1.37)
Exchang
erate
derivativ
es0.46
6***
0.61
1***
−0.50
30.82
6***
(3.10)
(4.12)
(−0.72
)(4.97)
Capitalratio
*exchange
rate
derivativ
es0.82
8
(1.11)
Tier1
ratio
*exchange
rate
derivativ
es−0.13
7
(−0.08
)
Size
*exchange
rate
derivativ
es0.05
66
(1.62)
SIFI
*exchange
rate
derivativ
es−0.28
0
(−1.48
)
Exchang
erate
derivativ
esfortrading
0.54
9***
0.32
6**
0.45
2***
−0.83
90.67
0***
(5.97)
(2.28)
(3.28)
(−1.08
)(3.87)
Exchang
erate
derivativ
esforhedg
ing
2.56
2***
12.08*
**9.71
5***
−1.09
12.45
1***
(5.14)
(3.93)
(5.43)
(−0.09
)(5.01)
Capitalratio
*exchange
rate
derivativ
esfor
trading
1.15
4
(1.60)
−51
.80*
**
(−3.69
)(con
tinued)
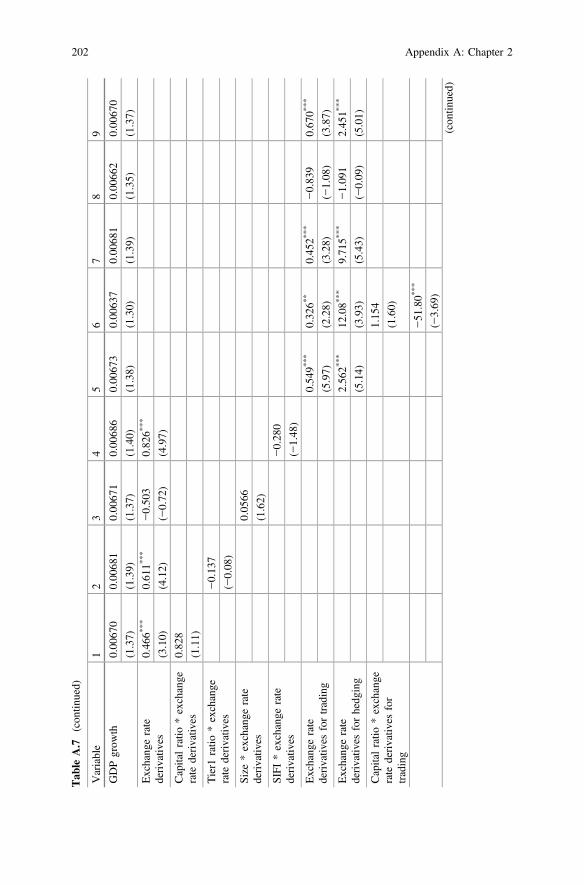
202 Appendix A: Chapter 2

Tab
leA.7
(con
tinued)
Variable
12
34
56
78
9
Capitalratio
*exchange
rate
derivativ
esfor
hedg
ing
Tier1
ratio
*exchange
rate
derivativ
esfor
trading
0.99
6
(0.63)
Tier1
ratio
*exchange
rate
derivativ
esfor
hedg
ing
−99
.96*
**
(−4.38
)
Size
*exchange
rate
derivativ
esfortrading
0.07
09*
(1.81)
Size
*exchange
rate
derivativ
esforhedg
ing
0.21
5
(0.29)
SIFI
*exchange
rate
derivativ
esfortrading
−0.17
1
(−0.85
)
SIFI
*exchange
rate
derivativ
esforhedg
ing
2.61
8
(0.91)
N14
,136
14,135
14,136
14,136
14,136
14,136
14,135
14,136
14,136
Adjusted-R2
0.18
90.18
90.18
90.18
90.18
90.19
10.19
10.19
00.19
0
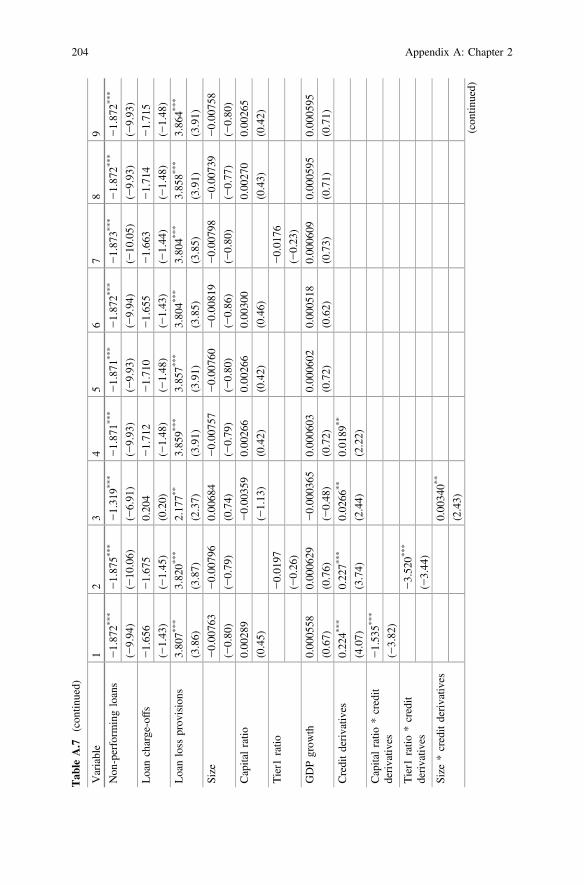
Pan
elC:Creditrisk
beta
Marketliq
uidity
−0.13
2***
−0.13
2***
−0.13
0***
−0.13
4***
−0.13
4***
−0.13
1***
−0.13
2***
−0.13
3***
−0.13
4***
(−4.91
)(−4.92
)(−4.94
)(−4.98
)(−4.98
)(−4.90
)(−4.91
)(−4.96
)(−4.98
)
Fund
ingliq
uidity
−0.18
4***
−0.18
3***
−0.10
8**
−0.18
1***
−0.18
2***
−0.18
7***
−0.18
5***
−0.18
1***
−0.18
1***
(−3.29
)(−3.28
)(−2.16
)(−3.24
)(−3.25
)(−3.35
)(−3.30
)(−3.24
)(−3.24
)(con
tinued)
Appendix A: Chapter 2 203
Tab
leA.7
(con
tinued)
Variable
12
34
56
78
9
Non
-perform
ingloans
−1.87
2***
−1.87
5***
−1.31
9***
−1.87
1***
−1.87
1***
−1.87
2***
−1.87
3***
−1.87
2***
−1.87
2***
(−9.94
)(−10
.06)
(−6.91
)(−9.93
)(−9.93
)(−9.94
)(−10
.05)
(−9.93
)(−9.93
)
Loancharge-offs
−1.65
6−1.67
50.20
4−1.71
2−1.71
0−1.65
5−1.66
3−1.71
4−1.71
5
(−1.43
)(−1.45
)(0.20)
(−1.48
)(−1.48
)(−1.43
)(−1.44
)(−1.48
)(−1.48
)
Loanloss
prov
isions
3.80
7***
3.82
0***
2.17
7**
3.85
9***
3.85
7***
3.80
4***
3.80
4***
3.85
8***
3.86
4***
(3.86)
(3.87)
(2.37)
(3.91)
(3.91)
(3.85)
(3.85)
(3.91)
(3.91)
Size
−0.00
763
−0.00
796
0.00
684
−0.00
757
−0.00
760
−0.00
819
−0.00
798
−0.00
739
−0.00
758
(−0.80
)(−0.79
)(0.74)
(−0.79
)(−0.80
)(−0.86
)(−0.80
)(−0.77
)(−0.80
)
Capitalratio
0.00
289
−0.00
359
0.00
266
0.00
266
0.00
300
0.00
270
0.00
265
(0.45)
(−1.13
)(0.42)
(0.42)
(0.46)
(0.43)
(0.42)
Tier1
ratio
−0.01
97−0.01
76
(−0.26
)(−0.23
)
GDPgrow
th0.00
0558
0.00
0629
−0.00
0365
0.00
0603
0.00
0602
0.00
0518
0.00
0609
0.00
0595
0.00
0595
(0.67)
(0.76)
(−0.48
)(0.72)
(0.72)
(0.62)
(0.73)
(0.71)
(0.71)
Creditderivativ
es0.22
4***
0.22
7***
0.02
66**
0.01
89**
(4.07)
(3.74)
(2.44)
(2.22)
Capitalratio
*credit
derivativ
es−1.53
5***
(−3.82
)
Tier1
ratio
*credit
derivativ
es−3.52
0***
(−3.44
)
Size
*creditderivativ
es0.00
340*
*
(2.43)
(con
tinued)
204 Appendix A: Chapter 2

Tab
leA.7
(con
tinued)
Variable
12
34
56
78
9
SIFI
*creditderivativ
es−0.00
697
(−0.48
)
Gross
creditprotectio
n0.01
220.16
4***
0.18
4***
0.39
90.00
891
(1.14)
(2.88)
(2.62)
(1.10)
(0.67)
Net
creditprotectio
nbo
ught
0.02
343.40
5**
2.06
4−1.95
20.39
1
(0.31)
(2.12)
(1.38)
(−0.84
)(0.96)
Capitalratio
*gross
creditprotectio
n−1.04
0**
(−2.55
)
Capitalratio
*netcredit
protectio
nbo
ught
−28
.41*
*
(−2.11
)
Tier1
ratio
*grosscredit
protectio
n−2.81
8**
(−2.43
)
Tier1
ratio
*netcredit
protectio
nbo
ught
−34
.46
(−1.39
)
Size
*grosscredit
protectio
n−0.01
82
(−1.05
)
Size
*netcredit
protectio
nbo
ught
0.09
37
(0.85)
SIFI
*grosscredit
protectio
n0.00
295
(0.17)
(con
tinued)
Appendix A: Chapter 2 205

Tab
leA.7
(con
tinued)
Variable
12
34
56
78
9
SIFI
*netcredit
protectio
nbo
ught
−0.38
5
(−0.93
)
N13
,359
13,358
10,921
13,359
13,359
13,359
13,358
13,359
13,359
Adjusted-R2
0.08
180.08
190.10
70.08
090.08
090.08
200.08
210.08
100.08
10
Estim
ationmetho
dFE
FEFE
FEFE
FEFE
FEFE
Rob
ustnesscheckby
usingthechange
inthedifference
betweenBBBbo
ndyieldandtherisk-freeratein
thefirst-stageregression
asan
alternativedefinitio
nof
CreditR
isk.The
depend
entv
ariablein
each
Panelisou
restim
ates
ofrisk
betaof
each
BHCiatthe
starttim
eto
ffou
r-year
rolling
windo
wregression
inthe
first-stage.
Weweigh
teach
observationby
theinverseof
thestandard
errorof
beta
coefficients
inthefirst-stageestim
ation.
The
regression
sinclud
edbank
-specificfixedeffectsandyearly
dummyvariables.Heteroskedasticity
-con
sistentstand
arderrorsareused
andtstatisticsarerepo
rted
inparentheses.
* p<
0.10
,**p<0.05
,**
* p<0.01
Source
FinancialS
tatementsdatafrom
FRY-9C;R
iskbetasarecompu
tedfrom
thefour-factormod
elusingdatafrom
CenterforResearchin
Security
Prices
(CRSP
)database
andFederalReserve
mon
thly
Statistical
Releases
206 Appendix A: Chapter 2

Table A.8 Impact of financial crisis on the determinants of interest rate, exchange rate, and creditrisk betas
Variable 1 2 3 4
Panel A: Interest rate risk beta
Interest margin 5.054*** 5.050*** 4.956*** 4.897***
(5.25) (5.25) (5.15) (5.12)
C&I loans −1.523*** −1.527*** −1.478*** −1.576***
(−3.21) (−3.22) (−3.12) (−3.34)
Mortgage loans 0.218 0.227 0.245 0.412
(0.80) (0.84) (0.91) (1.52)
Other loans −0.844 −0.838 −0.804 −0.660
(−1.42) (−1.41) (−1.35) (−1.13)
Domestic deposits −0.571* −0.583* −0.481 −0.518*
(−1.86) (−1.90) (−1.57) (−1.68)
GAP ratio −0.00936** −0.00939** −0.00871** −0.00597
(−2.50) (−2.51) (−2.32) (−1.59)
Size 0.482*** 0.476*** 0.495*** 0.469***
(6.53) (6.45) (6.72) (6.52)
Capital ratio −0.0252 −0.0265 −0.0229 −0.0289
(−0.24) (−0.26) (−0.22) (−0.29)
GDP growth −0.0175*** −0.0175*** −0.0179*** −0.0167***
(−2.79) (−2.77) (−2.85) (−2.66)
Interest rate derivatives 0.117*** 0.109***
(3.76) (3.58)
Crisis −0.457*** −0.462*** −0.453*** −0.576***
(−9.61) (−9.71) (−9.54) (−11.10)
Crisis * interest rate derivatives 0.0160
(1.32)
Interest rate derivatives fortrading
0.105*** 0.0914***
(3.38) (3.11)
Interest rate derivatives forhedging
0.363*** 0.341***
(3.14) (3.11)
Crisis * interest rate derivativesfor trading
0.00687
(0.69)
Crisis * interest rate derivativesfor hedging
3.832***
(5.50)
N 14,128 14,128 14,132 14,132
Adjusted-R2 0.108 0.108 0.108 0.116
Panel B: Exchange rate risk beta
Assets in foreign currencies −0.554 −0.513 −0.631 −0.498
(−0.53) (−0.49) (−0.59) (−0.46)
Foreign exchange deposits 0.831 0.848 0.950 1.020
(1.32) (1.35) (1.52) (1.63)(continued)
Appendix A: Chapter 2 207

Table A.8 (continued)
Variable 1 2 3 4
Size −0.0486 −0.0501 −0.0545 −0.0562
(−1.07) (−1.10) (−1.20) (−1.24)
Capital ratio −0.0000902 −0.000312 −0.000312 −0.000790
(−0.01) (−0.02) (−0.02) (−0.05)
GDP growth 0.00670 0.00663 0.00665 0.00655
(1.37) (1.36) (1.36) (1.34)
Exchange rate derivatives 0.599*** 0.581***
(6.64) (6.33)
Crisis 0.160*** 0.158*** 0.163*** 0.164***
(4.23) (4.18) (4.31) (4.32)
Crisis * exchange ratederivatives
0.0264
(0.78)
Exchange rate derivatives fortrading
0.548*** 0.527***
(5.94) (5.62)
Exchange rate derivatives forhedging
2.608*** 2.687***
(5.33) (5.37)
Crisis * exchange ratederivatives for trading
0.0488
(1.36)
Crisis * exchange ratederivatives for hedging
−2.889*
(−1.71)
N 14,136 14,136 14,136 14,136
Adjusted-R2 0.190 0.190 0.190 0.190
Panel C: Credit risk beta
Market liquidity −0.121*** −0.121*** −0.121*** −0.121***
(−4.49) (−4.49) (−4.49) (−4.49)
Funding liquidity −0.130** −0.130** −0.131** −0.130**
(−2.30) (−2.29) (−2.30) (−2.29)
Non-performing loans −1.894*** −1.894*** −1.894*** −1.894***
(−9.93) (−9.93) (−9.93) (−9.93)
Loan charge-offs −1.774 −1.774 −1.773 −1.774
(−1.53) (−1.53) (−1.53) (−1.53)
Loan loss provisions 3.725*** 3.726*** 3.725*** 3.726***
(3.77) (3.77) (3.77) (3.77)
Size −0.0105 −0.0105 −0.0105 −0.0105
(−1.11) (−1.11) (−1.11) (−1.11)
Capital ratio 0.00134 0.00133 0.00135 0.00133
(0.24) (0.23) (0.24) (0.23)
GDP growth 0.000520 0.000533 0.000518 0.000531
(0.63) (0.64) (0.63) (0.64)
Credit derivatives 0.0114 0.00501
(1.12) (0.61)(continued)
208 Appendix A: Chapter 2

Table A.8 (continued)
Variable 1 2 3 4
Crisis 0.0967*** 0.0965*** 0.0967*** 0.0965***
(12.37) (12.35) (12.37) (12.34)
Crisis * credit derivatives 0.00766
(1.26)
Gross credit protection 0.0109 0.00478
(1.08) (0.59)
Net credit protection bought 0.0297 0.0200
(0.52) (0.37)
Crisis * gross credit protection 0.00740
(1.17)
Crisis * net credit protectionbought
0.00642
(0.07)
N 13,359 13,359 13,359 13,359
Adjusted-R2 0.0891 0.0892 0.0891 0.0892
Estimation method FE FE FE FE
Robustness check by using the change in the difference between BBB bond yield and the risk-freerate in the first-stage regression as an alternative definition of Credit Risk. The dependent variablein each Panel is our estimates of risk beta of each BHC i at the start time t of four-year rollingwindow regression in the first-stage. We weight each observation by the inverse of the standarderror of beta coefficients in the first-stage estimation. The regressions included bank-specific fixedeffects and yearly dummy variables. Heteroskedasticity-consistent standard errors are used andt statistics are reported in parentheses. *p < 0.10, **p < 0.05, ***p < 0.01Source Financial Statements data from FR Y-9C; Risk betas are computed from the four-factormodel using data from Center for Research in Security Prices (CRSP) database and FederalReserve monthly Statistical Releases
Appendix A: Chapter 2 209

Tab
leA.9
The
impact
offinancialderivativ
eson
scaled
idiosyncratic
risk
(1−R2 )
Variable
Total
BHCs
Large
BHCs
SmallBHCs
Idiosyncratic
risk
Size
0.0492
***
0.0812
***
0.0506
***
0.0506
***
0.102*
**0.108*
**0.116*
**0.0427
***
0.0739
***
0.0436
***
(9.91)
(10.26)
(10.13)
(10.13)
(5.43)
(5.46)
(6.61)
(8.37)
(8.59)
(8.48)
Capitalratio
0.00353
0.00674
0.00354
0.00354
0.442*
*0.147
0.662*
**0.00298
0.00636
0.00273
(0.65)
(1.18)
(0.64)
(0.64)
(2.01)
(0.53)
(2.88)
(0.63)
(1.21)
(0.59)
GDPgrow
th0.00101*
0.00218*
*0.00106*
0.00106*
0.00581*
0.00393
0.00632*
*0.000292
0.000829
0.000353
(1.83)
(2.52)
(1.92)
(1.92)
(1.91)
(1.31)
(2.08)
(0.53)
(0.99)
(0.64)
Interest
rate
derivativ
es−0.00891*
**−0.00855*
**−0.00896*
**−0.00821*
**0.00962*
*0.0129
*
(−5.02)
(−4.63)
(−6.24)
(−5.48)
(2.02)
(1.95)
Exchangerate
derivativ
es−0.0586
***
−0.0742
***
−0.0668
***
−0.0765
***
−0.194*
**−0.199*
**
(−5.08)
(−5.81)
(−6.25)
(−6.02)
(−4.94)
(−4.87)
Creditderivativ
es0.0313
***
0.0211
**0.00823
0.00748
−0.0510
***
−0.0779
***
(3.15)
(2.06)
(0.77)
(0.71)
(−3.32)
(−3.68)
Total
financialderivativ
es−0.00696*
**
(−4.35)
Financialderivativ
esfortrading
−0.00697*
**−0.00911*
**−0.00846*
*
(−4.32)
(−6.07)
(−2.18)
Financialderivativ
esforhedging
−0.00545
−0.0405
**0.00160
(−0.60)
(−2.50)
(0.17)
N14263
6189
14,263
14,263
797
749
797
13,466
5440
13,466
Adjusted-R2
0.367
0.501
0.364
0.364
0.654
0.670
0.639
0.353
0.482
0.348
Estim
ationmethod
FEIV
FEFE
FEIV
FEFE
IVFE
Robustnesscheckby
usingthechange
inthedifference
betweenBBBbond
yieldandtherisk-freerate
inthefirst-stageregression
asan
alternativedefinitio
nof
CreditRisk.
The
dependent
variable
ineach
Panelisthelogistic
transformationof
1−R2,w
hich
islog
1�R2
R2
�� .W
eweighteach
observationby
theinverseof
thestandard
errorof
beta
coefficientsin
thefirst-stage
estim
ation.
The
regressionsincluded
bank-specificfixedeffectsandyearly
dummyvariables.Heteroskedasticity
-consistentstandarderrors
areused
andtstatisticsarereported
inparentheses.
*p<0.10,**p<0.05,***p
<0.01
Source
FinancialStatem
entsdata
from
FRY-9C;Riskbetasarecomputedfrom
thefour-factormodel
usingdata
from
CenterforResearchin
Security
Prices
(CRSP
)database
andFederal
Reserve
monthly
Statistical
Releases
210 Appendix A: Chapter 2
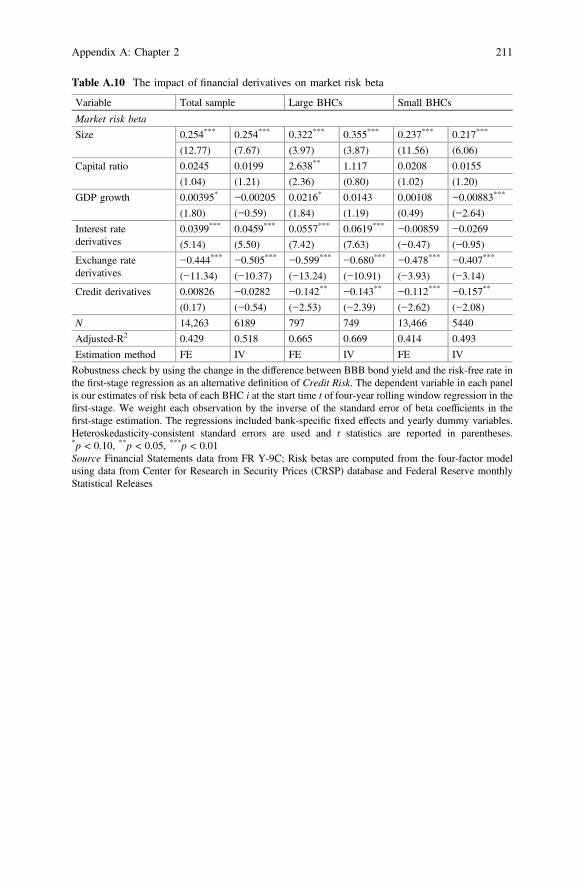
Table A.10 The impact of financial derivatives on market risk beta
Variable Total sample Large BHCs Small BHCs
Market risk beta
Size 0.254*** 0.254*** 0.322*** 0.355*** 0.237*** 0.217***
(12.77) (7.67) (3.97) (3.87) (11.56) (6.06)
Capital ratio 0.0245 0.0199 2.638** 1.117 0.0208 0.0155
(1.04) (1.21) (2.36) (0.80) (1.02) (1.20)
GDP growth 0.00395* −0.00205 0.0216* 0.0143 0.00108 −0.00883***
(1.80) (−0.59) (1.84) (1.19) (0.49) (−2.64)
Interest ratederivatives
0.0399*** 0.0459*** 0.0557*** 0.0619*** −0.00859 −0.0269
(5.14) (5.50) (7.42) (7.63) (−0.47) (−0.95)
Exchange ratederivatives
−0.444*** −0.505*** −0.599*** −0.680*** −0.478*** −0.407***
(−11.34) (−10.37) (−13.24) (−10.91) (−3.93) (−3.14)
Credit derivatives 0.00826 −0.0282 −0.142** −0.143** −0.112*** −0.157**
(0.17) (−0.54) (−2.53) (−2.39) (−2.62) (−2.08)
N 14,263 6189 797 749 13,466 5440
Adjusted-R2 0.429 0.518 0.665 0.669 0.414 0.493
Estimation method FE IV FE IV FE IV
Robustness check by using the change in the difference between BBB bond yield and the risk-free rate inthe first-stage regression as an alternative definition of Credit Risk. The dependent variable in each panelis our estimates of risk beta of each BHC i at the start time t of four-year rolling window regression in thefirst-stage. We weight each observation by the inverse of the standard error of beta coefficients in thefirst-stage estimation. The regressions included bank-specific fixed effects and yearly dummy variables.Heteroskedasticity-consistent standard errors are used and t statistics are reported in parentheses.*p < 0.10, **p < 0.05, ***p < 0.01Source Financial Statements data from FR Y-9C; Risk betas are computed from the four-factor modelusing data from Center for Research in Security Prices (CRSP) database and Federal Reserve monthlyStatistical Releases
Appendix A: Chapter 2 211

Appendix BChapter 3
See Tables B.1, B.2 and B.3.
© Shanghai Jiao Tong University Press and Springer Nature Singapore Pte Ltd. 2018S. Li, Financial Institutions in the Global Financial Crisis,https://doi.org/10.1007/978-981-10-7440-0
213

Table B.1 The construction of variables and data source
Variable Definition Source
lnGL The logarithm of gross loans BankScope(2011)
TIER1 Tier 1 capital to total risk-weighted assets ratio BankScope(2011)
TIER2 Tier 2 capital ratio, computed by subtracting Tier 1capital ratio from total capital ratio
Owncalculations
TCD The ratio of total customer deposits to total assets BankScope(2011)
DEP The ratio of interbank deposit to total assets BankScope(2011)
TA The logarithm of total assets representing the proxy forthe size, TA = log (total asset)
BankScope(2011)
LLP The ratio of loan loss provision to gross loans BankScope(2011)
FA The ratio of fixed asset to total assets representing proxyfor tangibility of bank assets
BankScope(2011)
TAXTA The ratio of tax to the bank size, TAXTA = Tax/TA BankScope(2011)
ROA The ratio of net income to average total assets in recenttwo years, ROAt = 2 * net incomet/(total assetst + totalassetst−1)
BankScope(2011)
d A dummy variable for crisis, which takes value of 1 forperiod 2008−2010 and 0 otherwise
GDP growth Annual growth rate of GDP at market prices based onconstant local currency
World Bank(2012)
Interest rate The interest rate charged by banks on loans to primecustomers.
World Bank(2012)
HHI Herfindahl–Hirschman Index, defined as the sum of thesquares of the market shares of asset of the 3 largestbanks in each country
Owncalculations
COMPTIER1 The tier 1 capital ratio of the competitor banks:
COMPTIER1 =PNj
k 6¼i TIER1k;jak;jAj, Where Nj is the
number of banks in country j, ak;j are the total assets of
bank k in country j, and Aj ¼PNj
k ak;j are the total assetsof banks in country j
Owncalculations
Overall capitalstringency
Measures the extent of regulatory requirements regardingthe amount of capital banks must hold
Barth et al.(2004)
Depositinsurance
Ordinal variable measuring deposit insurance coveragein 2003: 0: 0$, 1: 1–40,000$, 2: 40,001–100,000$, 3:>100,000$
Demirgüç-Kunt et al.(2008)
Commercialdummy
Takes value of 1 if the bank is a commercial bank and 0otherwise
BankScope(2011)
Savingsdummy
Takes value of 1 if the bank is a saving bank and 0otherwise
BankScope(2011)
(continued)
214 Appendix B: Chapter 3

Table B.1 (continued)
Variable Definition Source
Governmentdummy
Takes value of 1 if the bank is a government-owned bankand 0 otherwise
BankScope(2011)
Foreigndummy
Takes value of 1 if the bank is a foreign-owned bank and0 otherwise
BankScope(2011)
Subsidiarydummy
Takes value of 1 if the bank is a subsidiary bank and 0otherwise
BankScope(2011)
Bail-outprobability
Bail-out probabilities, based on the support ratingsprovided by the rating agency Fitch/IBCA
Gropp et al.(2010)
Appendix B: Chapter 3 215
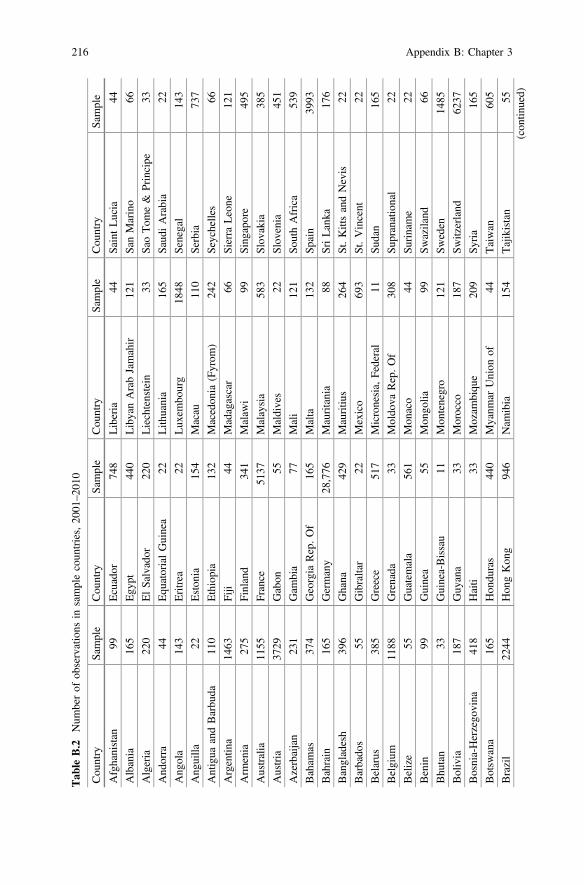
Tab
leB.2
Num
berof
observations
insamplecoun
tries,20
01–20
10
Cou
ntry
Sample
Cou
ntry
Sample
Cou
ntry
Sample
Cou
ntry
Sample
Afghanistan
99Ecuador
748
Liberia
44SaintLucia
44
Albania
165
Egy
pt44
0LibyanArabJamahir
121
SanMarino
66
Algeria
220
ElSalvador
220
Liechtenstein
33SaoTom
e&
Principe
33
And
orra
44Equ
atorialGuinea
22Lith
uania
165
Saud
iArabia
22
Ang
ola
143
Eritrea
22Lux
embo
urg
1848
Senegal
143
Ang
uilla
22Eston
ia15
4Macau
110
Serbia
737
Antigua
andBarbu
da11
0Ethiopia
132
Macedon
ia(Fyrom
)24
2Seychelles
66
Argentin
a14
63Fiji
44Madagascar
66Sierra
Leone
121
Arm
enia
275
Finland
341
Malaw
i99
Sing
apore
495
Australia
1155
France
5137
Malaysia
583
Slov
akia
385
Austria
3729
Gabon
55Maldives
22Slov
enia
451
Azerbaijan
231
Gam
bia
77Mali
121
SouthAfrica
539
Baham
as37
4Georgia
Rep.Of
165
Malta
132
Spain
3993
Bahrain
165
Germany
28,776
Mauritania
88SriLanka
176
Bangladesh
396
Ghana
429
Mauritiu
s26
4St.KittsandNevis
22
Barbado
s55
Gibraltar
22Mexico
693
St.Vincent
22
Belarus
385
Greece
517
Micronesia,
Federal
11Su
dan
165
Belgium
1188
Grenada
33Moldo
vaRep.Of
308
Supranational
22
Belize
55Guatemala
561
Mon
aco
44Su
riname
22
Benin
99Guinea
55Mon
golia
99Sw
aziland
66
Bhu
tan
33Guinea-Bissau
11Mon
tenegro
121
Sweden
1485
Bolivia
187
Guy
ana
33Morocco
187
Switzerland
6237
Bosnia-Herzego
vina
418
Haiti
33Mozam
biqu
e20
9Sy
ria
165
Botsw
ana
165
Hon
duras
440
Myanm
arUnion
of44
Taiwan
605
Brazil
2244
Hon
gKon
g94
6Nam
ibia
154
Tajikistan
55(con
tinued)
216 Appendix B: Chapter 3

Tab
leB.2
(con
tinued)
Cou
ntry
Sample
Cou
ntry
Sample
Cou
ntry
Sample
Cou
ntry
Sample
BruneiDarussalam
11Hun
gary
528
Nauru
44Tanzania
539
Bulgaria
418
Iceland
396
Nepal
275
Thailand
341
Burkina
Faso
110
India
1067
Netherlands
880
Tog
o77
Burun
di88
Indo
nesia
1210
Netherlands
Antille
132
Ton
ga22
Cam
bodia
187
Iraq
121
New
Zealand
264
TrinidadandTob
ago
99
Cam
eroo
n14
3Ireland
506
Nicaragua
231
Tun
isia
220
Canada
297
Israel
187
Niger
77Turkey
1133
CapeVerde
66Italy
16,797
Nigeria
891
Turkm
enistan
11
Cayman
island
s38
5IvoryCoast
165
Norway
2134
Tuv
alu
11
Central
African
Rep
22Jamaica
253
Oman
165
Ugand
a24
2
Chad
55Japan
9614
Pakistan
363
Ukraine
913
Chile
418
Jordan
66PalestinianTerrito
11UnitedArabEmirate
77
China
Peop
le’s
Rep
1947
Kazakhstan
363
Panama
1430
UnitedKingd
om38
28
Colom
bia
572
Kenya
616
Papu
aNew
Guinea
88Urugu
ay99
0
Con
go33
Kiribati
11Paragu
ay51
7USA
114,91
7
Con
go,Dem
ocratic
132
Korea
Rep.Of
506
Peru
506
Uzbekistan
220
Costa
Rica
946
Korea,Dpr.
11Ph
ilipp
ines
1155
Vanuatu
22
Croatia
726
Kuw
ait
66Po
land
1166
Venezuela
836
Cub
a66
Kyrgy
zstan
121
Portug
al63
8Vietnam
528
Cyp
rus
297
Laos
77Qatar
44Western
Samoa
33
Czech
Repub
lic55
0Latvia
352
Rom
ania
506
Yem
en12
1
Denmark
1738
Lebanon
638
Russian
Federatio
n14
,300
Zam
bia
176
Djib
outi
22Lesotho
44Rwanda
88Zim
babw
e41
8
Dom
inican
Repub
lic62
7
Summaryof
theob
servations
ineach
coun
tryin
thetotalsamplefor20
01–20
10
Appendix B: Chapter 3 217

Tab
leB.3
Estim
ationresultof
commercial
bank
s
(1)
(2)
(3)
(4)
(5)
(6)
(7)
(8)
Ban
kspecificvariab
les
Intercept
2.92
9***
3.18
9***
2.92
4***
2.99
7***
2.43
2***
(5.56)
(5.68)
(5.53)
(5.23)
(3.01)
△logG
Li,t−1
TIER1 i,t−1
0.46
9***
0.46
2***
0.47
7***
0.42
9***
0.58
7***
0.65
30.49
20.68
(3.61)
(3.52)
(3.66)
(3.00)
(3.09)
(1.48)
(1.19)
(1.53)
TIER1 i,t−1*d t−1
0.46
9***
0.47
2***
0.44
3***
0.48
9***
0.52
1***
0.33
1***
0.34
4***
0.30
3***
(5.90)
(6.05)
(5.52)
(6.29)
(6.30)
(3.73)
(4.07)
(3.36)
TIER2 i,t−1
0.89
0*0.89
0*0.83
9*1.02
1**
1.53
7**
0.50
50.38
20.44
7
(1.85)
(1.87)
(1.72)
(2.19)
(2.51)
(0.93)
(0.72)
(0.81)
TIER2 i,t−1*d t−1
0.61
20.38
80.76
40.66
50.07
250.53
70.35
90.74
3
(1.02)
(0.61)
(1.25)
(0.98)
(0.09)
(0.79)
(0.52)
(1.06)
TCDi,t−1
0.06
470.04
950.07
15−0.00
235
0.02
930.14
80.10
60.16
4
(0.38)
(0.29)
(0.42)
(−0.01
)(0.13)
(0.77)
(0.55)
(0.85)
TCDi,t−1*d t−1
0.26
1***
0.25
6***
0.23
3***
0.32
4***
0.28
5***
0.25
4***
0.26
7***
0.22
6***
(4.16)
(4.09)
(3.47)
(4.19)
(3.49)
(3.33)
(3.59)
(2.62)
DEP i
,t−1
0.20
50.19
30.20
80.37
5*0.15
70.23
10.17
50.24
2
(1.01)
(0.95)
(1.03)
(1.68)
(0.69)
(1.05)
(0.81)
(1.10)
DEP i
,t−1*d
t−1
0.07
090.06
190.06
660.00
115
0.05
010.09
560.11
70.08
68
(0.56)
(0.50)
(0.52)
(0.01)
(0.27)
(0.64)
(0.81)
(0.57)
TAi,t−1
−0.19
9***
−0.21
5***
−0.19
9***
−0.20
2***
−0.15
6***
−0.15
5***
−0.18
5***
−0.15
3***
(−6.39
)(−6.55
)(−6.37
)(−6.09
)(−3.51
)(−4.02
)(−4.50
)(−3.90
)
TAi,t−1*d t−1
0.00
492
0.00
794
−0.00
233
0.01
12*
0.00
408
−0.00
237
0.00
161
−0.00
937
(0.69)
(1.08)
(−0.28
)(1.74)
(0.45)
(−0.27
)(0.18)
(−0.90
)(con
tinued)
218 Appendix B: Chapter 3

Tab
leB.3
(con
tinued)
(1)
(2)
(3)
(4)
(5)
(6)
(7)
(8)
LLP i
,t−1
−1.13
2−1.13
4−1.13
3−1.23
3−0.40
7−0.4
−0.59
8−0.39
7
(−1.41
)(−1.43
)(−1.41
)(−1.52
)(−0.49
)(−0.40
)(−0.63
)(−0.40
)
FAi,t−1
0.60
80.59
60.59
40.82
82.14
9**
1.01
61.14
60.97
9
(0.88)
(0.89)
(0.85)
(1.14)
(2.16)
(1.21)
(1.41)
(1.16)
ROA
i,t−1
0.39
90.41
10.40
30.39
70.70
70.59
40.22
0.59
2
(0.60)
(0.63)
(0.60)
(0.58)
(0.93)
(0.79)
(0.31)
(0.79)
d t−1
−0.29
0**
−0.27
8**
−0.16
9−0.36
3***
−0.23
5−0.16
1−0.15
8−0.04
66
(−2.29
)(−2.14
)(−1.15
)(−2.73
)(−1.36
)(−1.00
)(−1.00
)(−0.25
)
Macroecon
omic
variab
les
GDPgrow
thi,t
0.92
3***
1.01
4***
0.96
1***
0.95
0***
0.69
7***
0.90
7***
1.06
9***
0.94
6***
(5.86)
(6.34)
(5.96)
(5.65)
(3.49)
(5.25)
(5.92)
(5.26)
Interestratei,t
−0.55
9***
−0.59
3***
−0.55
7***
−0.57
2***
−0.38
4**
−0.39
6**
−0.54
3***
−0.39
1**
(−3.66
)(−3.59
)(−3.64
)(−3.57
)(−2.33
)(−2.37
)(−3.08
)(−2.31
)
Indu
stry
structurevariab
les
HHI i,t−1
−0.88
8*−1.82
7***
(−1.87
)(−2.66
)
HHI i,t−1*d t−1
0.27
60.47
5*
(1.23)
(1.70)
COMPT
IER1 i,t−1
0.48
8***
0.67
6***
(3.04)
(4.28)
COMPT
IER1 i,t−1*d t−1
−0.63
7***
−0.87
6***
(−3.45
)(−4.60
)(con
tinued)
Appendix B: Chapter 3 219

Tab
leB.3
(con
tinued)
(1)
(2)
(3)
(4)
(5)
(6)
(7)
(8)
Ban
ktype
variab
les
Gov
ernm
entdu
mmy*d t−1
0.05
14**
0.04
68*
(2.38)
(1.72)
Foreigndu
mmy*d t−1
−0.09
13*
−0.12
6**
(−1.78
)(−2.27
)
Subsidiary
dummy*d t−1
0.01
470.06
07*
(0.53)
(1.84)
Regulationvariab
les
Overallcapitalstring
ency
*d t−1
−0.02
26**
(−2.33
)
Depositinsurance*d t−1
0.04
54*
(1.92)
Bail-ou
tprob
ability
*d t−1
−0.07
63**
(−2.05
)
N38
4938
4838
4932
5618
2227
9627
9627
96
Adjusted-R2
0.18
90.20
10.19
10.21
80.26
9
HansenJstatistic
(p-value)
5.52
5(0.06
)8.35
1(0.04
)5.96
9(0.05
)
Estim
ationmetho
dFE
FEFE
FEFE
IVIV
IV
(9)
(10)
(11)
(12)
(13)
(14)
(15)
Ban
kspecificvariab
les
Intercept
△logG
Li,t−1
−0.27
5−0.33
9*−0.29
3−0.40
7−0.30
7*
(−1.30
)(−1.78
)(−1.38
)(−1.58
)(−1.79
)
TIER1 i,t−1
0.53
80.45
50.02
250.11
0.03
72−0.22
70.12
8
(1.16)
(0.84)
(0.03)
(0.14)
(0.04)
(−0.23
)(0.55)
(con
tinued)
220 Appendix B: Chapter 3

Tab
leB.3
(con
tinued)
(9)
(10)
(11)
(12)
(13)
(14)
(15)
TIER1 i,t−1*d t−1
0.36
9***
0.33
5***
0.53
4**
0.51
5**
0.49
7**
0.59
5**
0.22
9*
(4.44)
(4.17)
(2.45)
(2.30)
(2.25)
(2.12)
(1.96)
TIER2 i,t−1
0.82
9*0.84
1.15
6**
1.18
0**
1.14
4*1.02
50.56
9
(1.82)
(1.53)
(1.98)
(2.09)
(1.95)
(1.45)
(0.80)
TIER2 i,t−1*d t−1
0.38
2−0.30
20.01
29−0.31
70.05
2−0.03
080.25
6
(0.59)
(−0.36
)(0.02)
(−0.52
)(0.09)
(−0.04
)(0.45)
TCDi,t−1
0.02
94−0.08
260.03
540.05
440.05
52−0.04
53−0.02
7
(0.15)
(−0.35
)(0.15)
(0.23)
(0.23)
(−0.15
)(−0.13
)
TCDi,t−1*d t−1
0.27
7***
0.32
7***
0.19
9**
0.20
4**
0.15
60.28
4**
0.25
6***
(2.96)
(2.79)
(2.12)
(2.17)
(1.54)
(2.09)
(2.65)
DEP i
,t−1
0.40
6*−0.01
53−0.00
369
0.06
970.01
660.23
3−0.14
5
(1.68)
(−0.05
)(−0.01
)(0.20)
(0.05)
(0.54)
(−0.61
)
DEP i
,t−1*d
t−1
−0.02
020.12
80.02
−0.03
13−0.01
19−0.00
382
−0.01
64
(−0.12
)(0.55)
(0.12)
(−0.19
)(−0.07
)(−0.02
)(−0.06
)
TA
i,t−1
−0.15
6***
−0.13
8***
−0.34
2***
−0.33
9***
−0.33
7***
−0.32
5***
−0.25
5***
(−3.76
)(−3.29
)(−5.15
)(−5.04
)(−5.00
)(−4.58
)(−3.12
)
TAi,t−1*d t−1
0.00
532
0.00
101
0.01
93*
0.02
42**
0.01
340.03
11***
−0.01
09
(0.74)
(0.09)
(1.89)
(2.41)
(1.21)
(2.82)
(−1.15
)
LLP i
,t−1
−0.61
80.15
−0.91
9−0.75
7−0.88
9−1.12
6−0.41
2
(−0.59
)(0.16)
(−0.69
)(−0.59
)(−0.67
)(−0.75
)(−1.21
)
FAi,t−1
1.28
12.26
1**
0.33
30.13
50.30
50.51
21.83
3*
(1.48)
(2.42)
(0.36)
(0.15)
(0.33)
(0.53)
(1.66)
(con
tinued)
Appendix B: Chapter 3 221
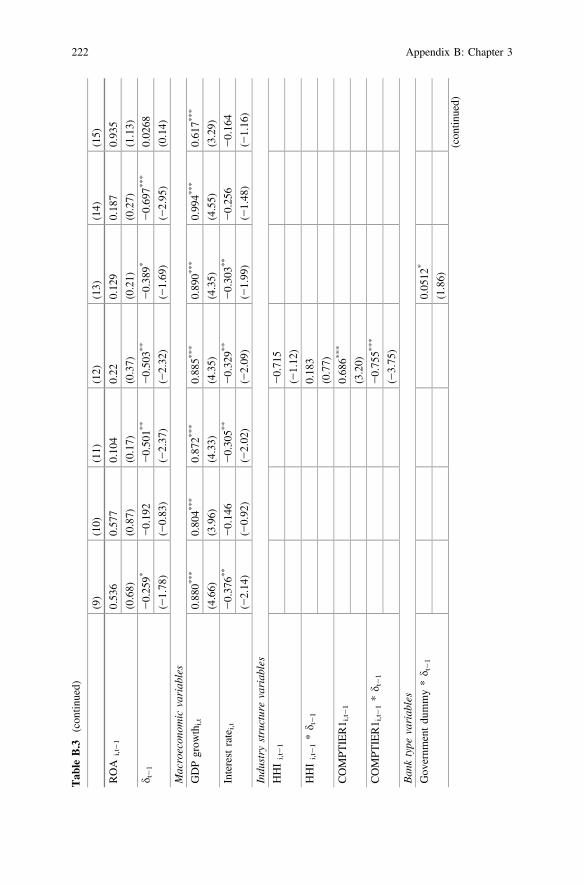
Tab
leB.3
(con
tinued)
(9)
(10)
(11)
(12)
(13)
(14)
(15)
ROA
i,t−1
0.53
60.57
70.10
40.22
0.12
90.18
70.93
5
(0.68)
(0.87)
(0.17)
(0.37)
(0.21)
(0.27)
(1.13)
d t−1
−0.25
9*−0.19
2−0.50
1**
−0.50
3**
−0.38
9*−0.69
7***
0.02
68
(−1.78
)(−0.83
)(−2.37
)(−2.32
)(−1.69
)(−2.95
)(0.14)
Macroecon
omic
variab
les
GDPgrow
thi,t
0.88
0***
0.80
4***
0.87
2***
0.88
5***
0.89
0***
0.99
4***
0.61
7***
(4.66)
(3.96)
(4.33)
(4.35)
(4.35)
(4.55)
(3.29)
Interestratei,t
−0.37
6**
−0.14
6−0.30
5**
−0.32
9**
−0.30
3**
−0.25
6−0.16
4
(−2.14
)(−0.92
)(−2.02
)(−2.09
)(−1.99
)(−1.48
)(−1.16
)
Indu
stry
structurevariab
les
HHIi,t−1
−0.71
5
(−1.12
)
HHIi,t−1*d t−1
0.18
3
(0.77)
COMPT
IER1 i,t−1
0.68
6***
(3.20)
COMPT
IER1 i,t−1*d t−1
−0.75
5***
(−3.75
)
Ban
ktype
variab
les
Gov
ernm
entdu
mmy*d t−1
0.05
12*
(1.86)
(con
tinued)
222 Appendix B: Chapter 3

Tab
leB.3
(con
tinued)
(9)
(10)
(11)
(12)
(13)
(14)
(15)
Foreigndu
mmy*d t−1
−0.03
24
(−0.76
)
Subsidiary
dummy*d t−1
0.01
38
(0.38)
Regulationvariab
les
Overallcapitalstring
ency
*d t−1
−0.01
27−0.01
93
(−1.11
)(−1.10
)
Depositinsurance*d t−1
0.02
720.01
37
(1.05)
(0.51)
Bail-ou
tprob
ability
*d t−1
−0.07
88*
−0.05
33
(−1.93
)(−1.07
)
N23
1514
6123
8223
8223
8220
2412
36
Adjusted-R2
HansenJstatistic
(p-value)
3.17
9(0.2)
2.67
2(0.3)
20.73(0.05
)29
.27(0.00
4)21
.25(0.06
)17
.13(0.1)
19.45(0.1)
Estim
ationmetho
dIV
IVGMM
GMM
GMM
GMM
GMM
The
depend
entvariable
is△logG
Li,t.Estim
ationmetho
dsareFE
,IV
andGMM.T-valuesarerepo
rted
inparentheses.
* p<0.10
,**p<0.05
,*** p
<0.01
Appendix B: Chapter 3 223

Appendix CChapter 4
See Tables C.1, C.2 and C.3.
© Shanghai Jiao Tong University Press and Springer Nature Singapore Pte Ltd. 2018S. Li, Financial Institutions in the Global Financial Crisis,https://doi.org/10.1007/978-981-10-7440-0
225

Tab
leC.1
Summaryof
empiricalanalysison
clearing
andsettlem
entinstitu
tions
(chron
olog
ically)
Autho
r(year)
Sample
Researchqu
estio
nMetho
dIndicator
Find
ings
Bauer
and
Ferrier
(199
6)
1990
–19
94,The
FederalReserve
Paym
entssystem
ScaleEcono
mies,Cost
Efficiencies,and
Techn
olog
ical
Chang
ein
FederalReserve
Paym
ents
Processing
Cross-sectio
nAnalysis
Techn
ical
Chang
es,Inpu
tPrices,Scale,
CostEfficiency
Sign
ificant
scaleecon
omiesarefoun
din
allthreeACH
processing
sitesandcost
efficiencies
canbe
improv
ed
Hancock
etal.(19
99)
1979
–19
96,
Fedw
irePaym
ent
Processing
PotentialEffectsof
Con
solid
ationon
Fedw
ire
Operatio
ns
Cross-sectio
nAnalysis
Techn
ical
Chang
es,
Scale,
Cost
Effects
The
Fedw
irefund
stransfer
operation
exhibitedlargescaleecon
omiesbu
tlittle
technicaladvancebeyo
ndthat
already
embo
died
inthetechno
logy
-adjustedinpu
tprices
ofdata
processing
and
telecommun
icationinpu
tsThe
consolidationof
Fedw
ireinto
fewer
officescontribu
tedarou
ndon
e-fourth
oftheov
erallredu
ctionin
Fedw
ireaverage
cost
Hasan
and
Malkamäki
(200
1)
1989
–19
98,38
Exchang
esin
32Cou
ntries
Investigates
theExistence
and
Extento
fEcono
miesof
Scale
andScop
eAmon
gtheStock
Exchang
es
Cross-sectio
nAnalysis
Econo
miesof
Scale,
Econo
miesof
Scop
e
The
largestexchangesshow
anincreasing
trendof
costeffectiveness
The
exchangesin
North
Americaand
Europ
erepo
rtsubstantially
high
erecon
omiesof
scalerelativ
eto
the
exchangesin
theAsia-Pacificregion
s
Lanno
oand
Levin
(200
2)
Securities
Settlem
ent
System
sin
EU
andU.S.
VerifyWhether
theCostsfor
Cross-borderSecurities
Settlem
entwereIndeed
asHighas
Often
Assum
ed
Panel
Analysis
Cost/Incom
eStructure
The
operatingcostsof
securities
settlem
entare
high
erin
theEUthan
inthe
U.S.
Cross-bordersettlem
entismuchmore
costly
than
itsdo
mestic
coun
terpart
(con
tinued)
226 Appendix C: Chapter 4

Tab
leC.1
(con
tinued)
Autho
r(year)
Sample
Researchqu
estio
nMetho
dIndicator
Find
ings
Hasan
etal.
(200
3)19
89–19
98,49
StockExchang
esThe
Prod
uctiv
ityof
Stock
Exchang
esov
erTim
eand
AcrossDifferentTyp
esand
Group
sof
Exchang
es
Cross-sectio
nAnalysis
Revenue
and
Cost
Efficiency,
Techn
olog
ical
Develop
ment
The
find
ings
indicate
sign
ificant
variability
inprod
uctiv
ity—revenu
eand
costefficiency—across
theseexchanges
North
American
exchangesarefoun
dto
bemostcostandrevenu
eefficient
Europ
eanexchangeshave
improv
edthe
most,in
respectof
costefficiency,while
exchangesin
SouthAmericaand
Asia-Pacificarefoun
dto
belagg
ingas
regardsbo
thcostandrevenu
eestim
ations
Investmentin
techno
logy
-related
developm
entseffectivelyinflu
encedcost
andrevenu
eefficiency
Organizationalstructureandmarket
competitionarefoun
dto
besign
ificantly
associated
with
both
costandrevenu
eefficiency
fortheexchangesstud
ied,
whereas
marketsize
andqu
ality
are
relatedon
lyto
revenu
eefficiency
Schm
iedel
(200
1)19
85–19
99,
Exchang
esin
Europ
ean
The
Existence
andExtentof
Techn
ical
Inefficiencies
ofFinancialExchang
esin
Europ
e
Cross-sectio
nAnalysis
Techn
ical
Inefficiencies
Scores
Size
ofexchange;marketconcentration
andqu
ality
;structural
reorganizatio
nsof
exchange
governance;diversificatio
nin
tradingserviceactiv
ities;andadop
tionof
automated
tradingsystem
ssign
ificantly
influencetheefficientprov
isionof
trading
services
inEurop
eEurop
eanexchangesno
tablyim
prov
edtheirability
toefficiently
managetheir
prod
uctio
nandinpu
tresources(con
tinued)
Appendix C: Chapter 4 227

Tab
leC.1
(con
tinued)
Autho
r(year)
Sample
Researchqu
estio
nMetho
dIndicator
Find
ings
NERA
(200
4)Clearingand
Settlem
ent
System
sin
EU
andU.S.
Investigates
theDirectCosts
ofClearingandSettlingan
Equ
ityTransactio
nin
Europ
eandin
theU.S.
Panel
Analysis
CostStructure
There
isasign
ificant
gapbetweenthe
costsof
clearing
andsettlem
entintheU.S.
andEurop
eCostdifferentialsbetweentheU.S.and
Europ
earehigh
erforno
n-do
mestic
than
fordo
mestic
transactions
Costsdiffer
very
sign
ificantly
with
inEurop
e
Rosatiand
Secola
(200
6)
1999
–20
02,
Paym
ent
System
TARGET
andEURO1
Distributionof
theTARGET
Cross-borderInterbank
Paym
entFlow
s
Tim
e-series
analysis
Trading
Volum
es,
Location
Thatbilateralpaym
entflo
wsreflectsan
organizatio
nof
interbanktradingbetween
coun
triesin
which
thesize
ofthebank
ing
sector,geog
raph
icprox
imity
andcultu
ral
similaritiesplay
asign
ificant
role
The
paym
enttrafficin
TARGETis
strong
lyaffected
bytechnicalmarket
deadlin
es
Schm
iedel
etal.(20
06)
1993
–20
00,16
Settlem
ent
Institu
tions
Investigates
theExistence
and
Extento
fEcono
miesof
Scale
inDeposito
ryandSettlem
ent
System
s
Cross-sectio
nAnalysis
Econo
miesof
Scale,
Techn
olog
ical
Develop
ment
The
degree
ofecon
omiesdiffersby
size
ofsettlem
entinstitu
tionandregion
Whilesm
allersettlem
entservice
prov
iders
reveal
ahigh
potentialof
econ
omiesfor
scale,
larger
institu
tions
show
anincreasing
trendtowardcosteffectiveness
Clearingandsettlem
entsystem
sin
coun
triesin
Europ
eandAsiarepo
rtsubstantially
larger
econ
omiesof
scale
than
thoseof
theU.S.system
Europ
eancross-bo
rder
settlem
entseemsto
bemorecostintensivethan
that
ona
(con
tinued)
228 Appendix C: Chapter 4

Tab
leC.1
(con
tinued)
Autho
r(year)
Sample
Researchqu
estio
nMetho
dIndicator
Find
ings
domestic
level,reflectingchiefly
complexities
ofEUinternationalsecurities
settlem
entsystem
sanddifferencesin
the
scop
eof
internationalsettlem
entservice
prov
iders
Investmentsin
implem
entin
gnew
system
sandup
grades
ofsettlem
enttechno
logy
continuo
usly
improv
edcosteffectiveness
over
thesampleperiod
Miln
e(200
7)19
97–20
00,16
Securities
Settlem
ent
Institu
tions
inEurop
eandU.S.
Cross-sectio
nAnalysis
Identifi
edsubstantialecon
omiesof
both
scaleandscop
eandim
portantinteractio
nswith
tradingplatform
s
Van
Cayseele
andWuy
ts(200
7)
1997
–20
04,10
Settlem
ent
Institu
tions
inEurop
e
CostEfficiency
inthe
Europ
eanSecurities
Settlem
entandDeposito
ryIndu
stry
Cross-sectio
nAnalysis
Cost
Efficiency,
Econo
miesof
Scale,
Econo
miesof
Scop
e
The
find
ings
indicate
that
especially
the
smallerinstitu
tions
still
canrealizemany
scaleecon
omies.Thisconstitutes
aratio
nale
forfurtherconsolidation
Separatin
gsettlem
entfrom
issuance
services,andho
stingthem
indifferent
entitieswill
entailefficiency
losses
and
costincreases
Beijnen
and
Bolt(200
9)19
90–20
05,8
Institu
tions
inEurop
e
The
Existence
andExtentof
Econo
miesof
Scalein
the
Europ
eanPaym
ent
Processing
Indu
stry
Cross-sectio
nAnalysis
Econo
miesof
Scale
The
existenceof
sign
ificant
econ
omiesof
scale
Ownershipstructureisan
impo
rtantfactor
toexplaincostdifferencesacross
Europ
eanprocessing
centers
(con
tinued)
Appendix C: Chapter 4 229
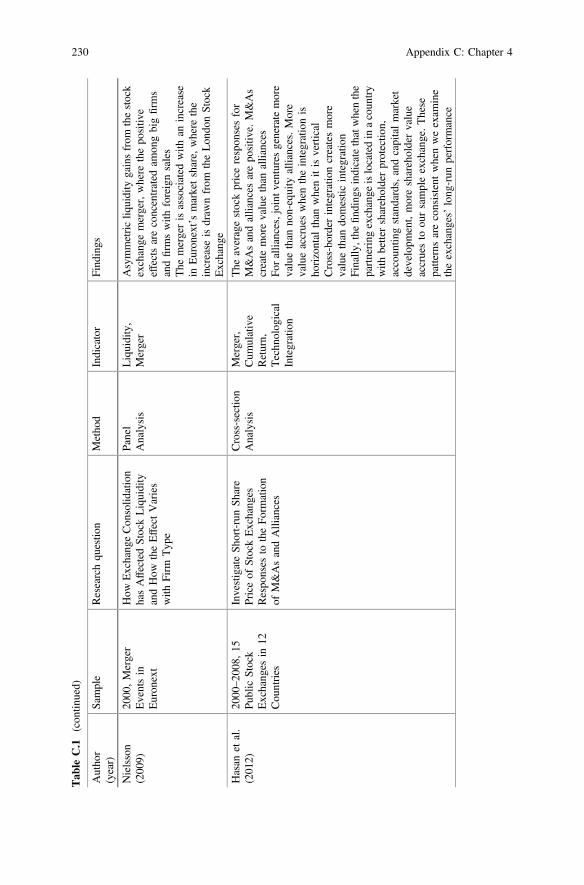
Tab
leC.1
(con
tinued)
Autho
r(year)
Sample
Researchqu
estio
nMetho
dIndicator
Find
ings
Nielsson
(200
9)20
00,Merger
Eventsin
Euron
ext
How
Exchang
eCon
solid
ation
hasAffectedStockLiquidity
andHow
theEffectVaries
with
Firm
Typ
e
Panel
Analysis
Liquidity,
Merger
Asymmetricliq
uidity
gainsfrom
thestock
exchange
merger,where
thepo
sitiv
eeffectsareconcentrated
amon
gbigfirm
sandfirm
swith
foreignsales
The
mergerisassociated
with
anincrease
inEuron
ext’smarketshare,
where
the
increase
isdraw
nfrom
theLon
donStock
Exchang
e
Hasan
etal.
(201
2)20
00–20
08,15
Public
Stock
Exchang
esin
12Cou
ntries
InvestigateSh
ort-runSh
are
Priceof
StockExchang
esRespo
nses
totheFo
rmation
ofM&AsandAlliances
Cross-sectio
nAnalysis
Merger,
Cum
ulative
Return,
Techn
olog
ical
Integration
The
averagestockpricerespon
sesfor
M&Asandalliances
arepo
sitiv
e.M&As
create
morevaluethan
alliances
Foralliances,joint
ventures
generatemore
valuethan
non-equity
alliances.More
valueaccrueswhentheintegrationis
horizontal
than
whenitisvertical
Cross-borderintegrationcreatesmore
valuethan
domestic
integration
Finally
,the
find
ings
indicatethatwhenthe
partnering
exchange
islocatedin
acoun
try
with
bettershareholderprotectio
n,accoun
tingstandards,andcapitalmarket
developm
ent,moreshareholdervalue
accruesto
oursampleexchange.These
patternsareconsistent
whenweexam
ine
theexchanges’
long
-run
performance
230 Appendix C: Chapter 4

Tab
leC.2
Empiricalevidence
ontheuseof
Panzar-Rosse
mod
elandLernerindex(chron
olog
ically)
Autho
r(year)
Sample
Financial
indicators
Dependent
variable
Scaling
Key
find
ings
Shaffer(198
2)19
79,New
Yearbank
sPanzar-Rosse
H-statistic
lnII
lnTA
Mon
opolistic
competition
NathanandNeave
(198
9)19
82–19
84,Canadianbank
sPanzar-Rosse
H-statistic
lnTI
lnTA
1982
:perfectcompetition;
1983
and
1984
:mon
opolistic
competition
Shaffer(199
3)19
65–19
89,CanadianBanks
Lernerindex
Perfectcompetition
Molyn
euxet
al.(199
4)19
86–19
89,France,Germany,
Italy,
SpainandUK
Panzar-Rosse
H-statistic
lnII
lnTA
Mon
opoly:
Italy
Mon
opolistic
competition:
France,
Germany,
Spain,
UK
Vesala(199
5)19
85–19
92,Finland
Panzar-Rosse
H-statistic
lnII
lnTA
Mon
opoly:
1989
–19
90Mon
opolistic
competition:
1985
–
1988
,19
91–19
92
Molyn
euxet
al.(199
6)19
86–19
88,Japan
Panzar-Rosse
H-statistic
lnII
lnTA
lnTD
Mon
opoly:
1986
Mon
opolistic
competition:
1987
–
1988
Coccorese
(199
8)19
88–19
96,Italy
Panzar-Rosse
H-statistic
lnTI
lnTA
lnTD
Mon
opolistic
competition
Shaffer(199
9)19
84–19
93,U.S.
Lernerindex
Mon
opolistic
competition
Hon
droy
iann
iset
al.
(199
9)19
93–19
95,Greece
Panzar-Rosse
H-statistic
ln(TI/TA)
lnTA
Mon
opolistic
competition
BikkerandGroeneveld
(200
0)19
89–19
96,15
EU
coun
tries
Panzar-Rosse
H-statistic
ln(II/TA)
lnTA
Mon
opolistic
competition
DeBandt
andDavis
(200
0)19
92–19
96,France,Germanyand
Italy
Panzar-Rosse
H-statistic
lnII
lnTI
lnEQ
Mon
opolistic
competition:
Large
Banks;Sm
allBanks
inItaly
Mon
opoly:
SmallBanks
inFrance
andGermany
(con
tinued)
Appendix C: Chapter 4 231

Tab
leC.2
(con
tinued)
Autho
r(year)
Sample
Financial
indicators
Dependent
variable
Scaling
Key
find
ings
Levineet
al.(200
0)19
60–19
95,74
coun
tries
Panzar-Rosse
H-statistic
GDPgrow
thLegal
andaccoun
tingreform
sthat
streng
then
credito
rrigh
ts,contract
enforcem
ent,andaccoun
ting
practices
canbo
ostfinancial
developm
entandaccelerate
econ
omic
grow
th
Hem
pell(200
2)19
93–19
98,Germany
Panzar-Rosse
H-statistic
ln(TI/TA)
Mon
opolistic
competition
BikkerandHaaf(200
2)19
88–19
98,23
OECD
coun
tries
Panzar-Rosse
H-statistic
ln(II/TA)
lnTA
Mon
opolistic
competition
Shaffer(200
2)19
85–20
00,U.S.bank
sPanzar-Rosse
H-statistic
lnTI
lnTA
Mon
opolistic
competition
MurjanandRuza
(200
2)19
93–19
97,ArabMiddleEast
Panzar-Rosse
H-statistic
lnII
lnTA
Mon
opolistic
competition
Collend
erandSh
affer
(200
3)Panzar-Rosse
H-statistic
YeyatiandMicco
(200
3)19
93–20
02,Latin
America
Panzar-Rosse
H-statistic
ln(TI/TA)
lnTA
Mon
opolistic
competition:
Argentin
a,Brazil,Colom
bia,
Costa
Rica,
Peru,
EISalvador
PerfectCom
petition:
Chile
Coccorese
(200
4)19
97–19
99,Italy
Panzar-Rosse
H-statistic
lnII
lnTI
lnTA
Mon
opolistic
competition
Claessens
andLeaven
(200
4)19
94–20
01,50
coun
tries
Panzar-Rosse
H-statistic
ln(TI/TA)
ln(II/TA)
lnTA
Mon
opolistic
competition
(con
tinued)
232 Appendix C: Chapter 4
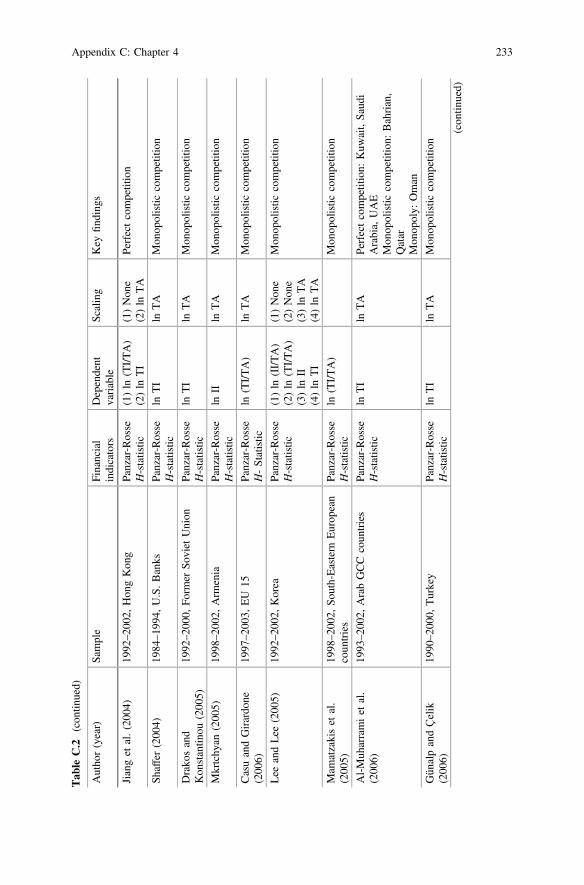
Tab
leC.2
(con
tinued)
Autho
r(year)
Sample
Financial
indicators
Dependent
variable
Scaling
Key
find
ings
Jianget
al.(200
4)19
92–20
02,Hon
gKon
gPanzar-Rosse
H-statistic
(1)ln
(TI/TA)
(2)ln
TI
(1)Non
e(2)ln
TA
Perfectcompetition
Shaffer(200
4)19
84–19
94,U.S.Banks
Panzar-Rosse
H-statistic
lnTI
lnTA
Mon
opolistic
competition
Drako
sand
Kon
stantin
ou(200
5)19
92–20
00,Fo
rmer
Soviet
Union
Panzar-Rosse
H-statistic
lnTI
lnTA
Mon
opolistic
competition
Mkrtchy
an(200
5)19
98–20
02,Arm
enia
Panzar-Rosse
H-statistic
lnII
lnTA
Mon
opolistic
competition
CasuandGirardo
ne(200
6)19
97–20
03,EU
15Panzar-Rosse
H-Statistic
ln(TI/TA)
lnTA
Mon
opolistic
competition
Lee
andLee
(200
5)19
92–20
02,Korea
Panzar-Rosse
H-statistic
(1)ln
(II/TA)
(2)ln
(TI/TA)
(3)ln
II(4)ln
TI
(1)Non
e(2)Non
e(3)ln
TA
(4)ln
TA
Mon
opolistic
competition
Mam
atzakiset
al.
(200
5)19
98–20
02,So
uth-Eastern
Europ
ean
coun
tries
Panzar-Rosse
H-statistic
ln(TI/TA)
Mon
opolistic
competition
Al-Muh
arramiet
al.
(200
6)19
93–20
02,ArabGCC
coun
tries
Panzar-Rosse
H-statistic
lnTI
lnTA
Perfectcompetition:
Kuw
ait,Saud
iArabia,
UAE
Mon
opolistic
competition:
Bahrian,
Qatar
Mon
opoly:
Oman
Gün
alpandÇelik
(200
6)19
90–20
00,Turkey
Panzar-Rosse
H-statistic
lnTI
lnTA
Mon
opolistic
competition
(con
tinued)
Appendix C: Chapter 4 233

Tab
leC.2
(con
tinued)
Autho
r(year)
Sample
Financial
indicators
Dependent
variable
Scaling
Key
find
ings
Staiko
uras
and
Kou
tsom
anoli-Fillipaki
(200
6)
1998
–20
02,EU
10versus
EU
15Panzar-Rosse
H-statistic
ln(TI/TA)
Mon
opolistic
competition
Yild
irim
and
Philipp
atos
(200
7)19
93–20
00,11
Latin
American
coun
tries
Panzar-Rosse
H-statistic
ln(TI/TA)
lnTA
lnEQ
lnFA
Mon
opolistic
competition
Bikkeret
al.(200
7)19
86–20
05,10
1coun
tries
Panzar-Rosse
H-statistic
(1)ln
II(2)ln
(II/TA)
(3)ln
II(4)ln
TI
(5)ln
(TI/TA)
(6)ln
TI
(1)Non
e(2)Non
e(3)ln
TA
(4)Non
e(5)Non
e(6)ln
TA
Matthew
set
al.(200
7)19
80–20
04,12
U.K.bank
sPanzar-Rosse
H-statistic
ln(TI/TA),ln
(II/TA)
lnTA
The
results
confi
rmtheconsensus
find
ingthat
competitionin
British
bank
ingismostaccurately
characterizedby
thetheoretical
mod
elof
mon
opolistic
competition.
There
isevidence
thattheintensity
ofcompetitionin
thecore
marketfor
bank
lend
ingremained
approx
imatelyun
changedthroug
hout
the19
80sand19
90s.How
ever,
competitionappearsto
have
become
less
intensein
theno
n-core
(off-balance
sheet)bu
siness
ofBritish
bank
s(con
tinued)
234 Appendix C: Chapter 4

Tab
leC.2
(con
tinued)
Autho
r(year)
Sample
Financial
indicators
Dependent
variable
Scaling
Key
find
ings
Deliset
al.(200
8)19
93–20
04,Greece,
Spain,
Latvia
Panzar-Rosse
H-statistic
lnTI
Mon
opolistic
competition
Lee
andNagano(200
8)19
93–20
05,Korea,Japan
Panzar-Rosse
H-statistic
ln(II/TA)
Highlevelsof
bank
ingmarket
competitivenessaredetected
after
mergers
inbo
ththeKoreanand
Japanese
metropo
litan
areas.
Alth
ough
thelevelof
market
competitionremains
low
throug
hout
Japanese
localcities,itiscompetitive
comparedwith
themetropo
litan
area
ofKorea.Thispaperconcludesthat
marketconcentrationbrou
ghtabou
tby
bank
mergers
does
notalways
resultin
low
competitiveness
Carbó
etal.(200
9)19
95–20
01,14
EU
coun
tries
Panzar-Rosse
H-statistic
lnTI
lnTA
Coccorese
(200
9)19
98–20
05,Italy
Panzar-Rosse
H-statistic
lnTI
lnTA
Gischer
andStiele
(200
9)19
93–20
02,Germany
Panzar-Rosse
H-statistic
lnII
lnEQ
Mon
opolistic
competition
God
dard
andWilson
(200
9)20
01–20
07,Canada,
France,
Germany,
Italy,
Japan,
United
Kingd
om,UnitedStates
Panzar-Rosse
H-statistic
(1)ln
II(2)ln
TI
(1)Non
e(2)ln
TA
Schaecket
al.(200
9)19
80–20
05,45
coun
tries
Panzar-Rosse
H-statistic
ln(II/TA)
(con
tinued)
Appendix C: Chapter 4 235

Tab
leC.2
(con
tinued)
Autho
r(year)
Sample
Financial
indicators
Dependent
variable
Scaling
Key
find
ings
Turk-Ariss
(201
0)19
99–20
05,6
0developing
coun
tries:
includ
ingAfrica,East/S
outh
Asiaand
Pacific,
Eastern
Europ
eandCentral
Asia,
Latin
AmericaandCaribbean,
andtheMiddleEast
Lernerindex
andfund
ing
adjusted
Lernerindex
The
conv
entio
nalLernerfigu
res
show
varyingdegreesof
market
power
across
coun
tries,bu
tthe
figu
resaregenerally
closelyaligned
across
allregion
s(aroun
d30
%price
mark-up
over
marginalcosts)
except
forLatin
AmericaandtheCaribbean
where
theconv
entio
nalLernerisas
low
as17
%.T
heestim
ated
efficiency
andfund
ing-adjusted
Lernerindices
also
vary
across
coun
triesandregion
s
Oliv
eroet
al.(201
1)19
96–20
06,10
Asian
coun
triesand
10Latin
American
coun
tries
Panzar-Rosse
H-statistic
Mostestim
ates
arepo
sitiv
eandless
than
1indicatesthat
bank
sin
Latin
American
andAsian
coun
triesseem
toop
eratein
amon
opolistically
competitiveenvironm
ent.Exceptio
nsinclud
eIndia,Korea,and
China
from
AsiaandVenezuela
from
Latin
Americawhich
areshow
nto
have
negativ
evalues
oftheH
statistics.
Thisim
pliesapo
tentialmon
opolistic
environm
entor
thepresence
ofa
structural
disequ
ilibrium
intheir
bank
ingmarkets.Banking
indu
stries
inLatin
Americaseem
tobe
more
competitivethan
thosein
Asia
(con
tinued)
236 Appendix C: Chapter 4

Tab
leC.2
(con
tinued)
Autho
r(year)
Sample
Financial
indicators
Dependent
variable
Scaling
Key
find
ings
Stavarek
andRepko
va(201
1)20
01–20
09,Czech
Repub
licPanzar-Rosse
H-statistic
Highlycompetitivemarketin
period
2001
–20
05andmon
opolistic
competitionin
2005
–20
09
Cipollin
iandFiordelisi
(201
2)19
96–20
09,Europ
eancoun
tries:
Austria,Belgium
,Denmark,
Finland,
France,Germany,
Greece,
Ireland,
Italy,
Netherlands,Po
rtug
al,Sp
ain,
Sweden,UnitedKingd
om
Lernerindex
The
meanvalueof
theLernerindex
sugg
estsmon
opolistic
competition
CasuandGirardo
ne(200
6)20
00–20
05,Europ
eancoun
tries:
France,Germany,
Italy,
Spain,
UK
Lernerindex
Valuesof
both
indicesarediversified
across
timeandacross
coun
tries,and
sugg
estmon
opolistic
competition.
SpanishandItalianbank
ing
indu
stries
seem
tobe
themost
competitive,
with
Lernerindexclose
to0
Bikkeret
al.(201
2)19
86–20
04,67coun
tries
Panzar-Rosse
H-statistic
(1)ln
II(2)ln
(II/TA)
(3)ln
II(4)ln
TI
(5)ln
(TI/TA)
(6)ln
TI
(1)Non
e(2)Non
e(3)ln
TA
(4)Non
e(5)Non
e(6)ln
TA
Becket
al.(201
3)19
94–20
09,79
coun
tries
Lernerindex
The
values
oftheindexarepo
sitiv
eandsugg
estmon
opolistic
competition
(con
tinued)
Appendix C: Chapter 4 237

Tab
leC.2
(con
tinued)
Autho
r(year)
Sample
Financial
indicators
Dependent
variable
Scaling
Key
find
ings
Fuet
al.(201
4)20
03–20
10,AsiaPacificcoun
tries:
Australia,China,Hon
gKon
g,India,
Indo
nesia,
Japan,
Korea,Malaysia,
Pakistan,Ph
ilipp
ines,Sing
apore,
Sri
Lanka,Taiwan,Thailand
Lernerindex
andefficiency
adjusted
Lernerindex
Valuesof
both
indicesarediversified
across
timeandacross
coun
tries,and
sugg
estmon
opolistic
competition.
The
trendfortheLernerindex
(non
-structuralmeasure)is
descending
between20
05and20
08sugg
estin
gadecrease
inpricing
power.The
Lernerindexexhibits
varyingdegreesof
marketpo
wer
across
coun
tries.Sing
aporehasthe
high
estefficiency
adjusted
Lerner
indexvalue(0.44),whereas
Taiwan
hasthelowestvalue(0.22)
IIInterestincome,
TATotal
assets,EQ
Equ
ity,FAFixedassets,TD
Total
depo
sits,TI
Total
income
238 Appendix C: Chapter 4

References
Al-Muharrami, S., Matthews, K., and Khabari, Y. (2006). Market structure and competitiveconditions in the Arab GCC banking system. Journal of Banking & Finance, 30(12), 3487–3501.
Barth, J. R., Caprio, G., and Levine, R. (2004). Bank regulation and supervision: what works best?Journal of Financial Intermediation, 13(2), 205–248.
Bauer, P. W., and Ferrier, G. D. (1996). Scale economies, cost efficiencies, and technologicalchange in federal reserve payments processing. Journal of Money, Credit and Banking, 28(4),1004–1039.
Beck, T., De Jonghe, O., and Schepens, G. (2013). Bank competition and stability: cross-countryheterogeneity. Journal of Financial Intermediation, 22(2), 218–244.
Beijnen, C., and Bolt, W. (2009). Size matters: Economies of scale in European paymentsprocessing. Journal of Banking & Finance, 33(2), 203–210.
Bikker, J. A., and Groeneveld, J. M. (2000). Competition and concentration in the EU bankingindustry. Kredit und Kapital, 33(1), 62–98.
Bikker, J. A., and Haaf, K. (2002). Competition, concentration and their relationship: An empiricalanalysis of the banking industry. Journal of Banking & Finance, 26(11), 2191–2214.
Bikker, J. A., Shaffer, S., and Spierdijk, L. (2012). Assessing competition with the Panzar-Rossemodel: The role of scale, costs, and equilibrium. Review of Economics and Statistics, 94(4),1025–1044.
Bikker, J. A., Spierdijk, L., and Finnie, P. (2007). Misspecifiation of the Panzar-Rosse Model:assessing competition in the banking industry. DNB Working Papers No.114. DeNederlandsche Bank. Amsterdam.
Carbó, S., Humphrey, D., Maudos, J., and Molyneux, P. (2009). Cross-country comparisons ofcompetition and pricing power in European banking. Journal of International Money andFinance, 28(1), 115–134.
Casu, B., and Girardone, C. (2006). Bank competition, concentration and efficiency in the singleEuropean market. The Manchester School, 74(4), 441–468.
Cipollini, A., and Fiordelisi, F. (2012). Economic value, competition and financial distress in theEuropean banking system. Journal of Banking & Finance, 36(11), 3101–3109.
Claessens, S., and Laeven, L. (2004). What drives bank competition? Some international evidence.Journal of Money, Credit and Banking, 36(3), 563–583.
Coccorese, P. (1998). Assessing the competitive conditions in the Italian banking system: someempirical evidence. Banca Nazionale del Lavoro Quarterly Review, 51(205), 171–191.
Table C.3 Discriminatory power of H-statistic
Values ofH
Competitive environment test
H � 0 Monopoly equilibrium: each institution operates independently as undermonopoly profit maximization conditions (H is a decreasing function of theperceived demand elasticity) or perfect cartel
0 < H < 1 Monopolistic competition: free entry equilibrium (H is an increasing function ofthe perceived demand elasticity)
H = 1 Perfect competition: free entry equilibrium with full efficient capacity utilization
Source Molyneux et al. (1994)
Appendix C: Chapter 4 239

Coccorese, P. (2004). Banking competition and macroeconomic conditions: a disaggregateanalysis. Journal of International Financial Markets, Institutions and Money, 14(3), 203–219.
Coccorese, P. (2009). Market power in local banking monopolies. Journal of Banking & Finance,33(7), 1196–1210.
Collender, R. N., and Shaffer, S. (2003). Local bank office ownership, deposit control, marketstructure, and economic growth. Journal of Banking & Finance, 27(1), 27–57.
De Bandt, O., and Davis, E. P. (2000). Competition, contestability and market structure inEuropean banking sectors on the eve of EMU. Journal of Banking & Finance, 24(6), 1045–1066.
Delis, M. D., Staikouras, K. C., and Varlagas, P. T. (2008). On the measurement of market powerin the banking industry. Journal of Business Finance & Accounting, 35(7–8), 1023–1047.
Demirgüç-Kunt, A., Detragiache, E., and Tressel, T. (2008). Banking on the principles:Compliance with Basel Core Principles and bank soundness. Journal of FinancialIntermediation, 17(4), 511–542.
Drakos, K., and Konstantinou, P. (2005). Competition and contestability in transition banking: Anempirical analysis. South-Eastern Europe Journal of Economics, 2, 183–209.
Fu, X. M., Lin, Y. R., and Molyneux, P. (2014). Bank competition and financial stability in AsiaPacific. Journal of Banking & Finance, 38, 64–77.
Günalp, B., and Çelik, T. (2006). Competition in the Turkish banking industry. AppliedEconomics, 38(11), 1335–1342.
Gischer, H., and Stiele, M. (2009). Competition Tests with a Non-Structural Model: the Panzar–Rosse Method Applied to Germany’s Savings Banks. German Economic Review, 10(1),50–70.
Goddard, J., and Wilson, J. O. (2009). Competition in banking: a disequilibrium approach. Journalof Banking & Finance, 33(12), 2282–2292.
Gropp, R., Hakenes, H., and Schnabel, I. (2010). Competition, risk-shifting, and public bail-outpolicies. Review of Financial Studies, 24(6), 2084.
Hancock, D., Humphrey, D. B., and Wilcox, J. A. (1999). Cost reductions in electronic payments:The roles of consolidation, economies of scale, and technical change. Journal of Banking &Finance, 23(2), 391–421.
Hasan, I., and Malkamäki, M. (2001). Are expansions cost effective for stock exchanges? A globalperspective. Journal of Banking & Finance, 25(12), 2339–2366.
Hasan, I., Malkamäki, M., and Schmiedel, H. (2003). Technology, automation, and productivity ofstock exchanges: International evidence. Journal of Banking & Finance, 27(9), 1743–1773.
Hasan, I., Schmiedel, H., and Song, L. (2012). Growth strategies and value creation: what worksbest for stock exchanges? Financial Review, 47(3), 469–499.
Hempell, H. (2002). Testing for competition among German banks. Economic Research Centre ofthe Deutsche Bundesbank discussion paper No. 04/02.
Hondroyiannis, G., Lolos, S., and Papapetrou, E. (1999). Assessing competitive conditions in theGreek banking system. Journal of International Financial Markets, Institutions and Money, 9(4), 377–391.
Jiang, G., Wong, J., Tang, N., and Sze, A. (2004). Banking sector competition in Hong Kong–Measurement and evolution over time Hong Kong Monetary Authority (Vol. 30, pp. 40).
Lannoo, K., and Levin, M. (2002). The securities settlement industry in the EU: structure, costsand the way forward. CEPS Reports in Finance and Banking No. 26. CEPS.
Lee, M. H., and Nagano, M. (2008). Market competition before and after bank merger wave: Acomparative study of Korea and Japan. Pacific Economic Review, 13(5), 604–619.
Lee, S., and Lee, J. (2005). Bank consolidation and bank competition: An empirical analysis of theKorean banking industry. Bank of Korea Economic Paper 8.
240 Appendix C: Chapter 4

Levine, R., Loayza, N., and Beck, T. (2000). Financial intermediation and growth: Causality andcauses. Journal of Monetary Economics, 46(1), 31–77.
Mamatzakis, E., Staikouras, C., and Koutsomanoli-Fillipaki, N. (2005). Competition andconcentration in the banking sector of the South Eastern European region. EmergingMarkets Review, 6(2), 192–209.
Matthews, K., Murinde, V., and Zhao, T. (2007). Competitive conditions among the major Britishbanks. Journal of Banking & Finance, 31(7), 2025–2042.
Milne, A. (2007). The industrial organization of post-trade clearing and settlement. Journal ofBanking & Finance, 31(10), 2945–2961.
Mkrtchyan, A. (2005). The evolution of competition in banking in a transition economy: anapplication of the Panzar-Rosse model to Armenia. The European Journal of ComparativeEconomics, 2(1), 67–82.
Molyneux, P., Lloyd-Williams, D. M., and Thornton, J. (1994). Competitive conditions inEuropean banking. Journal of Banking & Finance, 18(3), 445–459.
Molyneux, P., Thornton, J., and Llyod-Williams, D. M. (1996). Competition and marketcontestability in Japanese commercial banking. Journal of Economics and Business, 48(1),33–45.
Murjan, W., and Ruza, C. (2002). The competitive nature of the Arab Middle Eastern bankingmarkets. International Advances in Economic Research, 8(4), 267–274.
Nathan, A., and Neave, E. H. (1989). Competition and contestability in Canada’s financial system:Empirical results. Canadian Journal of Economics, 19(3), 576–594.
NERA Economic Consulting. (2004). The direct costs of clearing and settlement: An EU-UScomparison. City Research Series.
Nielsson, U. (2009). Stock exchange merger and liquidity: The case of Euronext. Journal ofFinancial Markets, 12(2), 229–267.
Olivero, M. P., Li, Y., and Jeon, B. N. (2011). Competition in banking and the lending channel:Evidence from bank-level data in Asia and Latin America. Journal of Banking & Finance, 35(3), 560–571.
Rosati, S., and Secola, S. (2006). Explaining cross-border large-value payment flows: Evidencefrom TARGET and EURO1 data. Journal of Banking & Finance, 30(6), 1753–1782.
Schaeck, K., Cihak, M., and Wolfe, S. (2009). Are competitive banking systems more stable?Journal of Money, Credit and Banking, 41(4), 711–734.
Schmiedel, H. (2001). Technological development and concentration of stock exchanges inEurope. Bank of Finland Discussion Paper Series, 21/2001. Helsinki.
Schmiedel, H., Malkamäki, M., and Tarkka, J. (2006). Economies of scale and technologicaldevelopment in securities depository and settlement systems. Journal of Banking & Finance,30(6), 1783–1806.
Shaffer, S. (1982). A non-structural test for competition in financial markets. Paper presented atthe Proceedings of a Conference on Bank Structure and Competition.
Shaffer, S. (1993). A test of competition in Canadian banking. Journal of Money, Credit andBanking, 25(1), 49–61.
Shaffer, S. (1999). The competitive impact of disclosure requirements in the credit card industry.Journal of Regulatory Economics, 15(2), 183–198.
Shaffer, S. (2002). Conduct in a banking monopoly. Review of Industrial Organization, 20(3),221–238.
Shaffer, S. (2004). Patterns of competition in banking. Journal of Economics and Business, 56(4),287–313.
Appendix C: Chapter 4 241

Staikouras, C. K., and Koutsomanoli-Fillipaki, A. (2006). Competition and concentration in thenew European banking landscape. European Financial Management, 12(3), 443–482.
Stavarek, D., and Repkova, I. (2011). Estimation of the competitive conditions in the Czechbanking sector. Acta Universitatis Agriculturae et Silviculturae Mendelianae Brunensis, 59(2),299–305.
Turk-Ariss, R. (2010). On the implications of market power in banking: Evidence from developingcountries. Journal of Banking & Finance, 34(4), 765–775.
Van Cayseele, P., and Wuyts, C. (2007). Cost efficiency in the European securities settlement anddepository industry. Journal of Banking & Finance, 31(10), 3058–3079.
Vesala, J. (1995). Testing for competition in banking: Behavioral evidence from Finland. Bank ofFinland Studies Working Paper E:1,. Bank of Finland. Helsinki.
Yeyati, E. L., and Micco, A. (2003). Banking Competition in Latin America. Paper presented at theLatin American Competition Forum.
Yildirim, H. S., and Philippatos, G. C. (2007). Restructuring, consolidation and competition inLatin American banking markets. Journal of Banking & Finance, 31(3), 629–639.
242 Appendix C: Chapter 4

Appendix DChapter 5
See Table D.1.
Table D.1 Summaries of the hypotheses and findings in Chaps. 2, 3, and 4
Chapter (title) hypothesis Main findings
Chapter 2: The Use of Financial Derivatives and Risks of U.S. Bank Holding Companies
Hypothesis 2.1: Financial derivatives impact(systematic interest rate, exchange rate andcredit) risks of a BHC
The use of interest rate derivatives, exchangerate derivatives and credit derivatives ispositively and significantly related tosystematic interest rate, exchange rate andcredit risk
Hypothesis 2.1a: Financial derivatives forhedging impact risks of a BHCHypothesis 2.1b: Financial derivatives fortrading impact risks of a BHC
Both financial derivatives for hedging andfinancial derivatives for trading impactsystematic risks of BHCs. This relationship ispositive and highly statistically significant
Hypothesis 2.2: The relationship betweenfinancial derivatives and risks is affected by aBHC’s capital strength
High capital reinforces the positiverelationship between financial derivativesfor trading and systematic risks, butweakens the positive relationship betweenfinancial derivatives for hedging andsystematic risk
Hypothesis 2.3: The positive relationshipbetween financial derivatives and risksintensifies for larger BHCs
The positive relationship between financialderivatives and systematic risks is strongerfor larger BHCs (especially for Exchangerate derivatives and Credit derivatives)
Chapter 3: Quality of Bank Capital and Bank Lending Behavior during the Global FinancialCrisis
Hypothesis 3.1: Tier 1 capital positivelyaffects credit growth. This effect was morepronounced during the global financial crisis
The results find a positive relationshipbetween the highest quality bank capitaland the credit growth, and the interactionterm constructed as a product of the tier 1ratio and crisis dummy also demonstrates apositive relationship with loan growth. Thissupports the notion of tier 1 serving as abuffer and not an incentive mechanism forbanks
(continued)
© Shanghai Jiao Tong University Press and Springer Nature Singapore Pte Ltd. 2018S. Li, Financial Institutions in the Global Financial Crisis,https://doi.org/10.1007/978-981-10-7440-0
243

Table D.1 (continued)
Chapter (title) hypothesis Main findings
Hypothesis 3.2: Tier 2 capital positivelyaffects loan growth during normal times.During the global financial crisis, tier 2capital negatively affected loan growth
We find some evidence that tier 2 positivelyaffects lending growth in normal times.Contrary to Hypothesis 3.2, tier 2 capitalhad no significant effect on credit growthduring the global financial crisis
Hypothesis 3.3: The decline in bank lendingduring the global financial crisis was higherfor banks with higher levels of interbankdeposits and lower levels of customerdeposits
Customer deposits positively andsignificantly affected bank lending duringthe global financial crisis. Interbanklending is positively associated with banklending during normal times and negativelyduring the global financial crisis
Hypothesis 3.4a: Higher marketconcentration (HHI) is associated with lowerlending during normal times, but wasassociated with higher lending during theglobal financial crisis
We observe a negative effect of theconcentration index (HHIi,t−1) on creditgrowth (although mostly insignificant)during normal times
Hypothesis 3.4b: Higher tier 1 capital ratiosof competing banks are positively associatedwith bank lending during normal times butwere negatively associated during the globalfinancial crisis
Competitors’ tier 1 capital ratios have asignificantly positive impact on loan growthduring normal times, but this coefficientreversed during the global financial crisis.This provides support only for Hypothesis3.4b
Hypothesis 3.5a: Government owned bankssustained lending better during the globalfinancial crisis than non-government ownedbanks
We find a significant and positive effect ofgovernment ownership on credit growth inthe global financial crisis. This corresponds todirect support of governments throughownership participation in banks and alsoconfirms our Hypothesis 3.5a
Hypothesis 3.5b: Foreign ownership wasassociated with weaker lending during theglobal financial crisis
We find some limited support for thenegative effect of foreign ownership onlending growth during the global financialcrisis. This is in line with Hypothesis 3.5b
Hypothesis 3.5c: The subsidiary status ofbanks was associated with stronger creditgrowth during the global financial crisis
We find limited evidence that credit growthduring the global financial crisis wasaffected by the organizational structure ofthe bank. That is, we find that a subsidiarybank cut back on lending less during theglobal financial crisis than a stand-aloneentity. This is in line with Hypothesis 3.5c
Chapter 4: Competition in the Clearing and Settlement Industry
Hypothesis 4.1: Competition betweenclearing and settlement institutions during thefinancial crises is higher than in normal time
The H-statistic significantly increasedduring the global financial crisisThe negative Boone indicator during thefinancial crisis is lower than in normal timesDummy variable of the global financialcrisis is negatively and statisticallysignificantly associated with Lerner indexCompetition between clearing and settlementinstitutions is higher during the financialcrises period than in normal times
(continued)
244 Appendix D: Chapter 5

Table D.1 (continued)
Chapter (title) hypothesis Main findings
Hypothesis 4.2: ICSDs are exposed to thehigher level of competition than CSDs
The regression coefficient of the interactionterms between H-statistics and ICSD isstatistically significantly positiveThe negative coefficient of the interactionterm between International CSDs andmarginal cost indicates that the negativeBoone indicator of International CSDs islower than CSDs and international CSDsface higher competition than domestic CSDsICSD is negatively and highly statisticallysignificantly associated with Lerner index
Hypothesis 4.3: The size of clearing andsettlement institutions positively affects thelevel of competition between clearing andsettlement institutions
The regression coefficient of the interactionterms between H-statistics and institutionsize is statistically significantly positiveThe result of Boone indicator shows theinteraction term between institution size andmarginal cost is negatively and statisticallysignificantly associate with the profit ofclearing and settlement institutionsLerner index is negatively related to the sizeof a clearing and settlement institution.Hence, larger institutions are exposed tohigher competition
Hypothesis 4.4: Mergers between CSDs areassociated with higher competition betweenclearing and settlement institutions
The regression coefficient of the interactionterm between the H-statistics and dummyvariable Merger is statistically significantlypositiveThe interaction term between merger andmarginal cost is negatively related to theprofit, although it is insignificant, whichindicates the negative Boone indicator ofmerged clearing and settlement institutions islower than not merged institutionsMerger is negatively but mostlyinsignificantly related to the Lerner index.This provides some but limited support thatmergers between clearing and settlementinstitutions improve competition
Hypothesis 4.5: Technological developmentincreases competition between clearing andsettlement institutions
ICT ratio is statistically significantlypositively associated with H-statisticThe ICT ratio has a negative and significanteffect on Boone indicator and technologicaldevelopment increases competition betweenclearing and settlement institutionsVariables ICT ratio and Time are negativelyand significantly related to Lerner indexWe conclude that technological developmentincreases competition between clearing andsettlement institutions
(continued)
Appendix D: Chapter 5 245

Table D.1 (continued)
Chapter (title) hypothesis Main findings
Hypothesis 4.6: Competition betweenclearing and settlement institutions in theU.S. market is higher than in the Europe
H-statistic is higher in the U.S. market thanin EuropeBoone indicator of the clearing andsettlement institutions in U.S. marker islower than in the European marketDummy variable USregion is negatively andstatistically significantly related to LernerindexThese results indicate that competitionbetween clearing and settlement institutions ishigher in the U.S. market than in theEuropean market
246 Appendix D: Chapter 5