Embed Size (px)
Citation preview

A1 © AMEC Environment & Infrastructure UK Limited
16 December 2016 Doc Ref. ERea008i1R
Appendix A Input data and modelling outputs (Excel workbook)
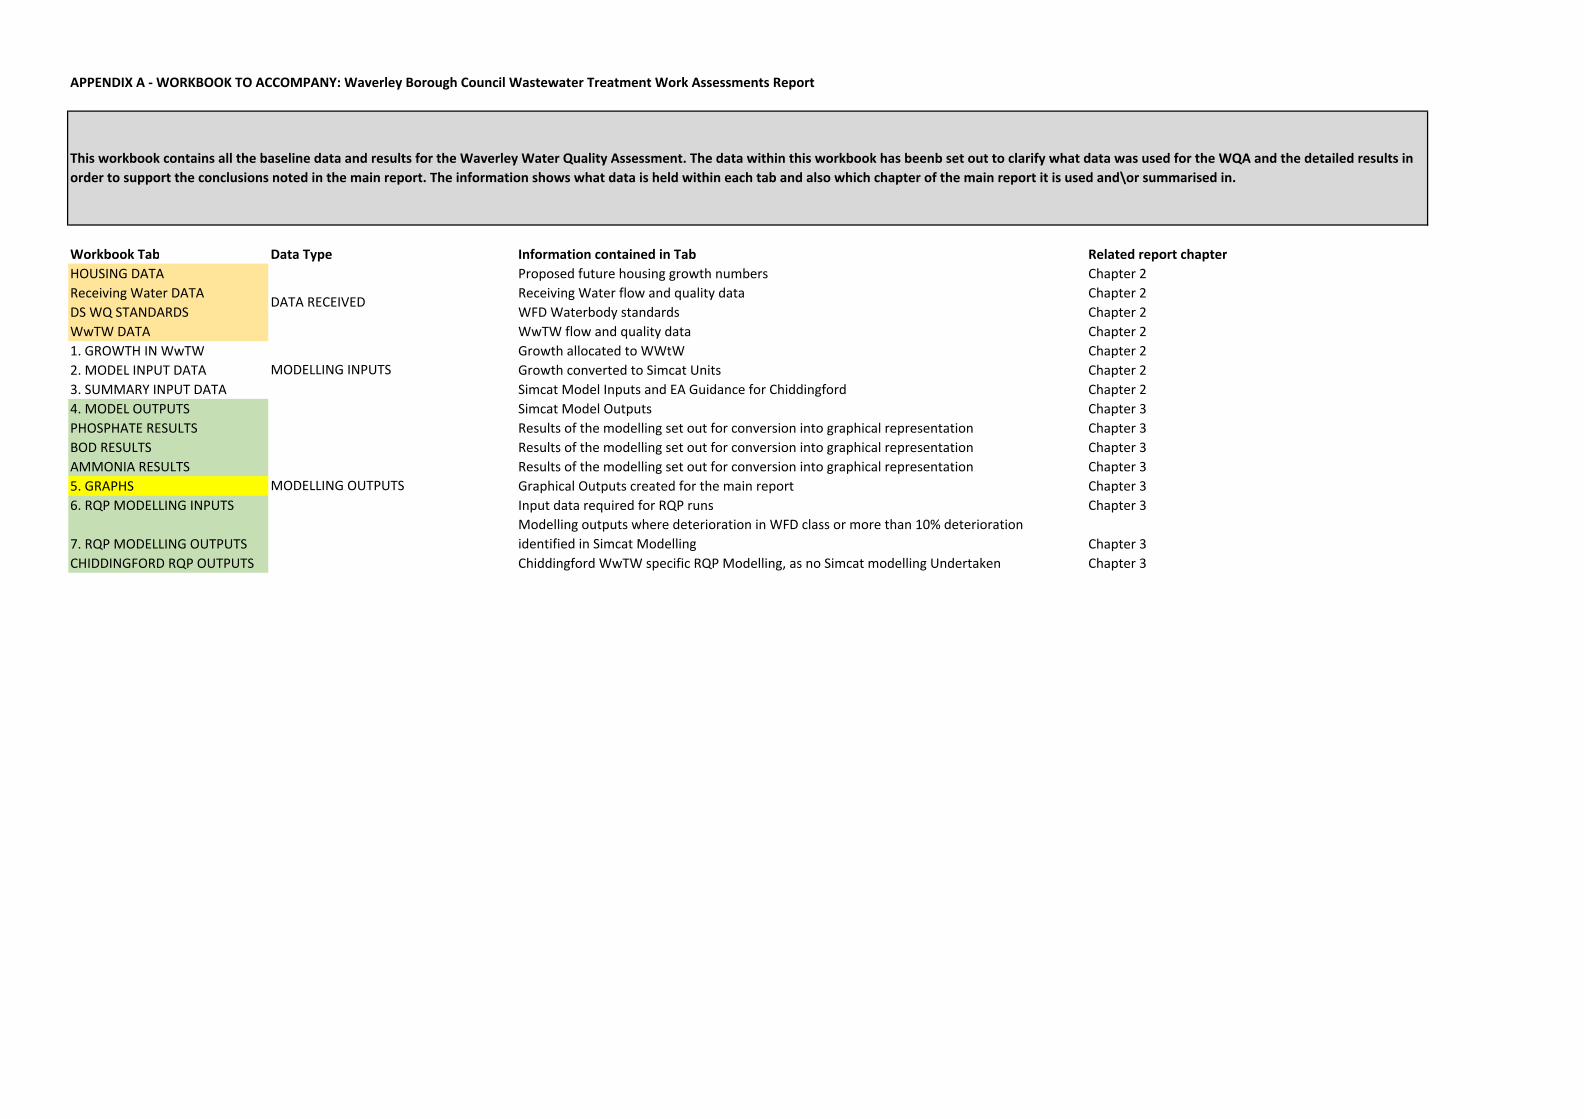
APPENDIX A - WORKBOOK TO ACCOMPANY: Waverley Borough Council Wastewater Treatment Work Assessments Report
Workbook Tab Data Type Information contained in Tab Related report chapter
HOUSING DATA Proposed future housing growth numbers Chapter 2
Receiving Water DATA Receiving Water flow and quality data Chapter 2
DS WQ STANDARDS WFD Waterbody standards Chapter 2
WwTW DATA WwTW flow and quality data Chapter 2
1. GROWTH IN WwTW Growth allocated to WWtW Chapter 2
2. MODEL INPUT DATA Growth converted to Simcat Units Chapter 2
3. SUMMARY INPUT DATA Simcat Model Inputs and EA Guidance for Chiddingford Chapter 2
4. MODEL OUTPUTS Simcat Model Outputs Chapter 3
PHOSPHATE RESULTS Results of the modelling set out for conversion into graphical representation Chapter 3
BOD RESULTS Results of the modelling set out for conversion into graphical representation Chapter 3
AMMONIA RESULTS Results of the modelling set out for conversion into graphical representation Chapter 3
5. GRAPHS Graphical Outputs created for the main report Chapter 3
6. RQP MODELLING INPUTS Input data required for RQP runs Chapter 3
7. RQP MODELLING OUTPUTS
Modelling outputs where deterioration in WFD class or more than 10% deterioration
identified in Simcat Modelling Chapter 3
CHIDDINGFORD RQP OUTPUTS Chiddingford WwTW specific RQP Modelling, as no Simcat modelling Undertaken Chapter 3
MODELLING OUTPUTS
DATA RECEIVED
MODELLING INPUTS
This workbook contains all the baseline data and results for the Waverley Water Quality Assessment. The data within this workbook has beenb set out to clarify what data was used for the WQA and the detailed results in
order to support the conclusions noted in the main report. The information shows what data is held within each tab and also which chapter of the main report it is used and\or summarised in.
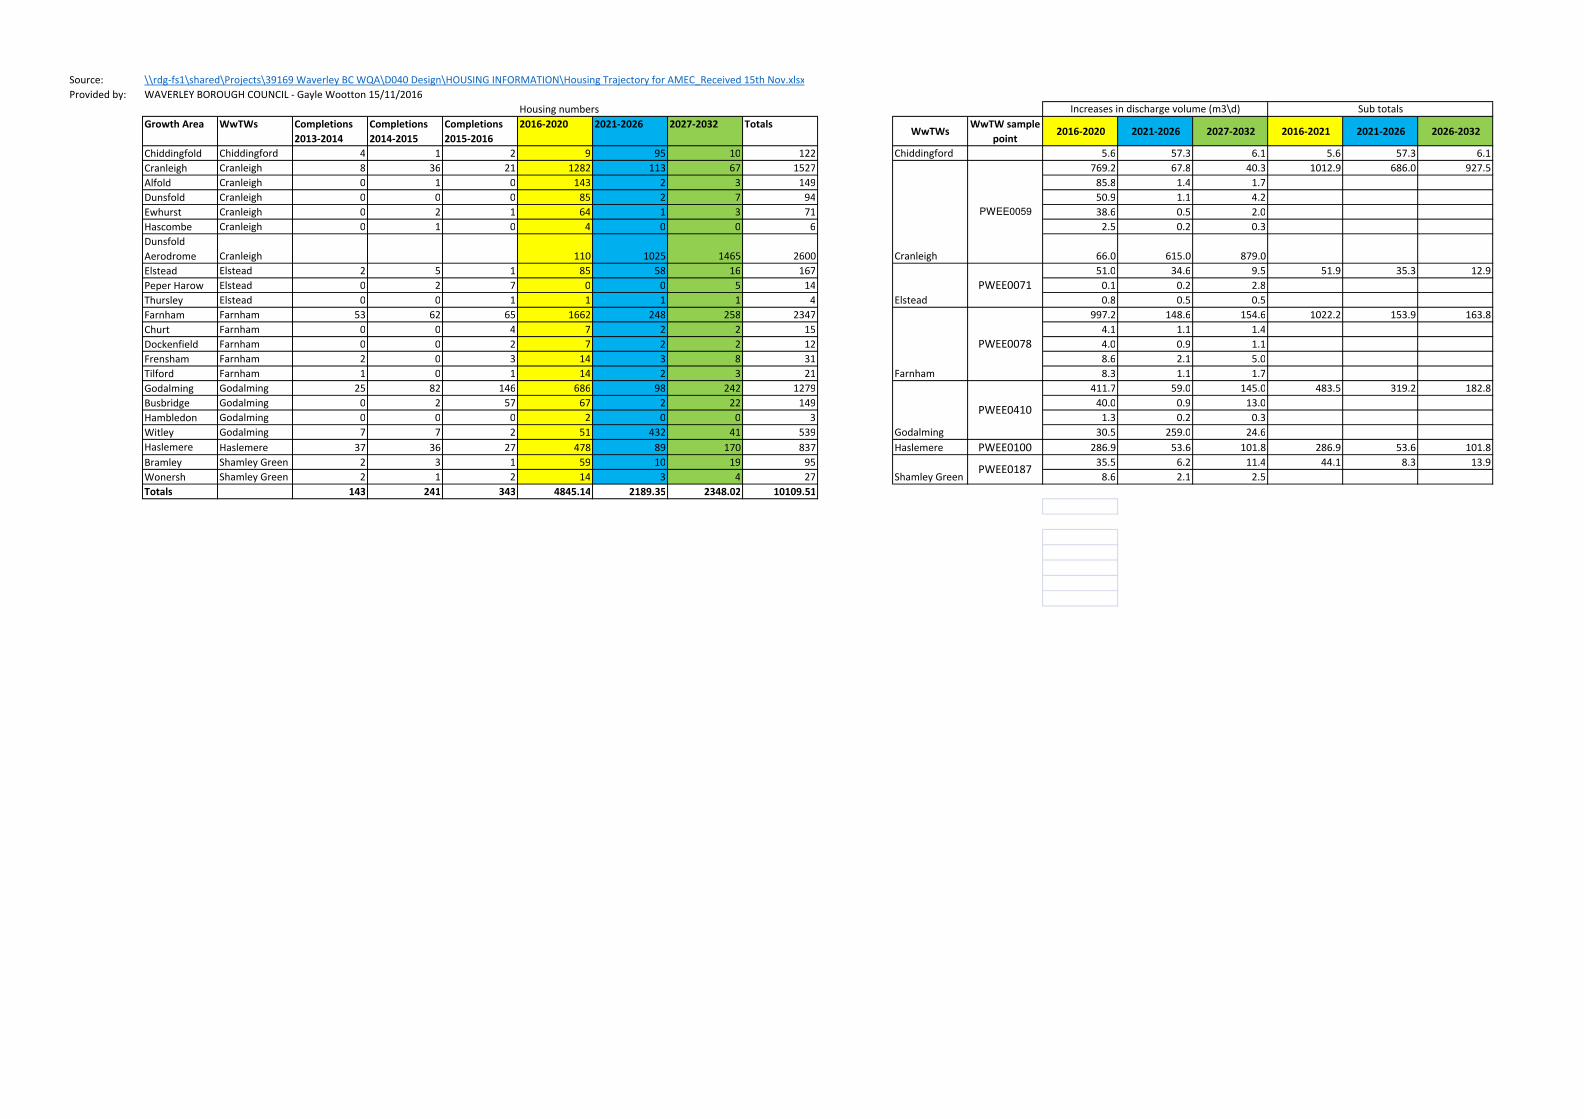
Source: \\rdg-fs1\shared\Projects\39169 Waverley BC WQA\D040 Design\HOUSING INFORMATION\Housing Trajectory for AMEC_Received 15th Nov.xlsx
Provided by: WAVERLEY BOROUGH COUNCIL - Gayle Wootton 15/11/2016
Growth Area WwTWs Completions
2013-2014
Completions
2014-2015
Completions
2015-2016
2016-2020 2021-2026 2027-2032 TotalsWwTWs
WwTW sample
point2016-2020 2021-2026 2027-2032 2016-2021 2021-2026 2026-2032
Chiddingfold Chiddingford 4 1 2 9 95 10 122 Chiddingford 5.6 57.3 6.1 5.6 57.3 6.1
Cranleigh Cranleigh 8 36 21 1282 113 67 1527 769.2 67.8 40.3 1012.9 686.0 927.5
Alfold Cranleigh 0 1 0 143 2 3 149 85.8 1.4 1.7
Dunsfold Cranleigh 0 0 0 85 2 7 94 50.9 1.1 4.2
Ewhurst Cranleigh 0 2 1 64 1 3 71 38.6 0.5 2.0
Hascombe Cranleigh 0 1 0 4 0 0 6 2.5 0.2 0.3
Dunsfold
Aerodrome Cranleigh 110 1025 1465 2600 66.0 615.0 879.0
Elstead Elstead 2 5 1 85 58 16 167 51.0 34.6 9.5 51.9 35.3 12.9
Peper Harow Elstead 0 2 7 0 0 5 14 0.1 0.2 2.8
Thursley Elstead 0 0 1 1 1 1 4 0.8 0.5 0.5
Farnham Farnham 53 62 65 1662 248 258 2347 997.2 148.6 154.6 1022.2 153.9 163.8
Churt Farnham 0 0 4 7 2 2 15 4.1 1.1 1.4
Dockenfield Farnham 0 0 2 7 2 2 12 4.0 0.9 1.1
Frensham Farnham 2 0 3 14 3 8 31 8.6 2.1 5.0
Tilford Farnham 1 0 1 14 2 3 21 8.3 1.1 1.7
Godalming Godalming 25 82 146 686 98 242 1279 411.7 59.0 145.0 483.5 319.2 182.8
Busbridge Godalming 0 2 57 67 2 22 149 40.0 0.9 13.0
Hambledon Godalming 0 0 0 2 0 0 3 1.3 0.2 0.3
Witley Godalming 7 7 2 51 432 41 539 30.5 259.0 24.6
Haslemere Haslemere 37 36 27 478 89 170 837 Haslemere PWEE0100 286.9 53.6 101.8 286.9 53.6 101.8
Bramley Shamley Green 2 3 1 59 10 19 95 35.5 6.2 11.4 44.1 8.3 13.9
Wonersh Shamley Green 2 1 2 14 3 4 27 8.6 2.1 2.5
Totals 143 241 343 4845.14 2189.35 2348.02 10109.51
Housing numbers Increases in discharge volume (m3\d) Sub totals
Shamley Green
Godalming
PWEE0187
PWEE0410
PWEE0078
Farnham
Elstead
PWEE0071
PWEE0059
Cranleigh
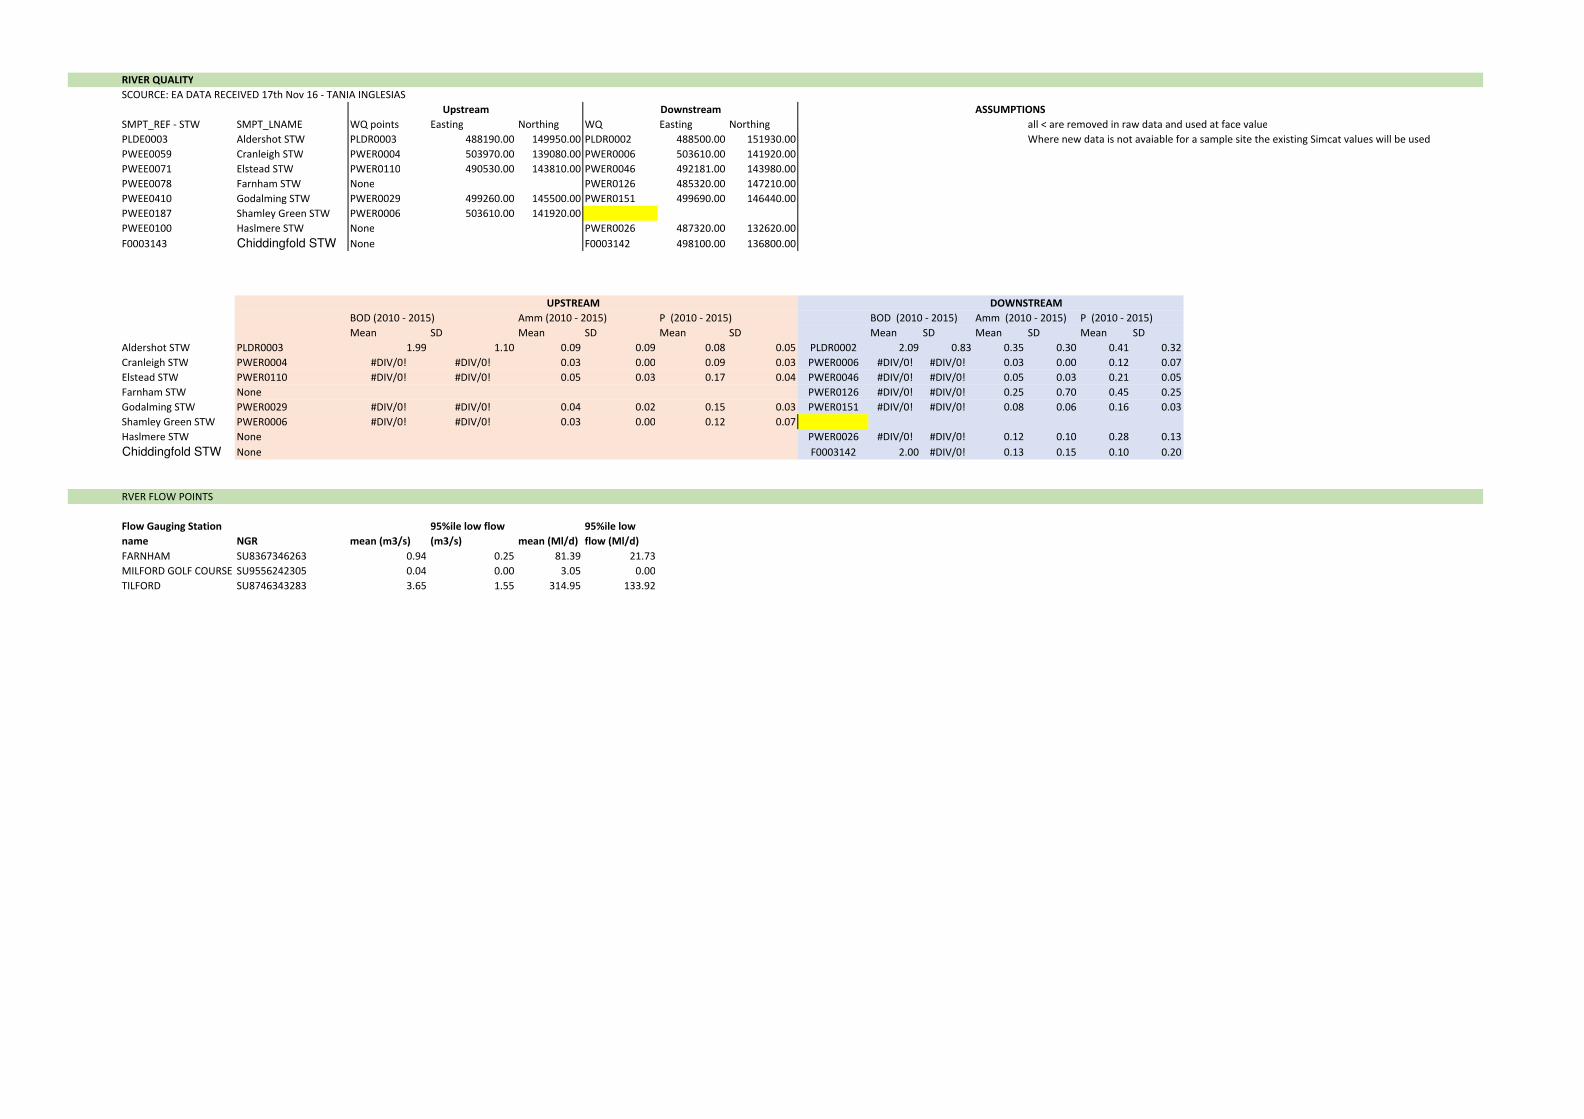
RIVER QUALITY
SCOURCE: EA DATA RECEIVED 17th Nov 16 - TANIA INGLESIAS
ASSUMPTIONS
SMPT_REF - STW SMPT_LNAME WQ points Easting Northing WQ Easting Northing all < are removed in raw data and used at face value
PLDE0003 Aldershot STW PLDR0003 488190.00 149950.00 PLDR0002 488500.00 151930.00 Where new data is not avaiable for a sample site the existing Simcat values will be used.
PWEE0059 Cranleigh STW PWER0004 503970.00 139080.00 PWER0006 503610.00 141920.00
PWEE0071 Elstead STW PWER0110 490530.00 143810.00 PWER0046 492181.00 143980.00
PWEE0078 Farnham STW None PWER0126 485320.00 147210.00
PWEE0410 Godalming STW PWER0029 499260.00 145500.00 PWER0151 499690.00 146440.00
PWEE0187 Shamley Green STW PWER0006 503610.00 141920.00
PWEE0100 Haslmere STW None PWER0026 487320.00 132620.00
F0003143 Chiddingfold STW None F0003142 498100.00 136800.00
BOD (2010 - 2015) Amm (2010 - 2015) P (2010 - 2015) BOD (2010 - 2015) Amm (2010 - 2015) P (2010 - 2015)
Mean SD Mean SD Mean SD Mean SD Mean SD Mean SD
Aldershot STW PLDR0003 1.99 1.10 0.09 0.09 0.08 0.05 PLDR0002 2.09 0.83 0.35 0.30 0.41 0.32
Cranleigh STW PWER0004 #DIV/0! #DIV/0! 0.03 0.00 0.09 0.03 PWER0006 #DIV/0! #DIV/0! 0.03 0.00 0.12 0.07
Elstead STW PWER0110 #DIV/0! #DIV/0! 0.05 0.03 0.17 0.04 PWER0046 #DIV/0! #DIV/0! 0.05 0.03 0.21 0.05
Farnham STW None PWER0126 #DIV/0! #DIV/0! 0.25 0.70 0.45 0.25
Godalming STW PWER0029 #DIV/0! #DIV/0! 0.04 0.02 0.15 0.03 PWER0151 #DIV/0! #DIV/0! 0.08 0.06 0.16 0.03
Shamley Green STW PWER0006 #DIV/0! #DIV/0! 0.03 0.00 0.12 0.07
Haslmere STW None PWER0026 #DIV/0! #DIV/0! 0.12 0.10 0.28 0.13
Chiddingfold STW None F0003142 2.00 #DIV/0! 0.13 0.15 0.10 0.20
RVER FLOW POINTS
Flow Gauging Station
name NGR mean (m3/s)
95%ile low flow
(m3/s) mean (Ml/d)
95%ile low
flow (Ml/d)
FARNHAM SU8367346263 0.94 0.25 81.39 21.73
MILFORD GOLF COURSE SU9556242305 0.04 0.00 3.05 0.00
TILFORD SU8746343283 3.65 1.55 314.95 133.92
Upstream Downstream
UPSTREAM DOWNSTREAM
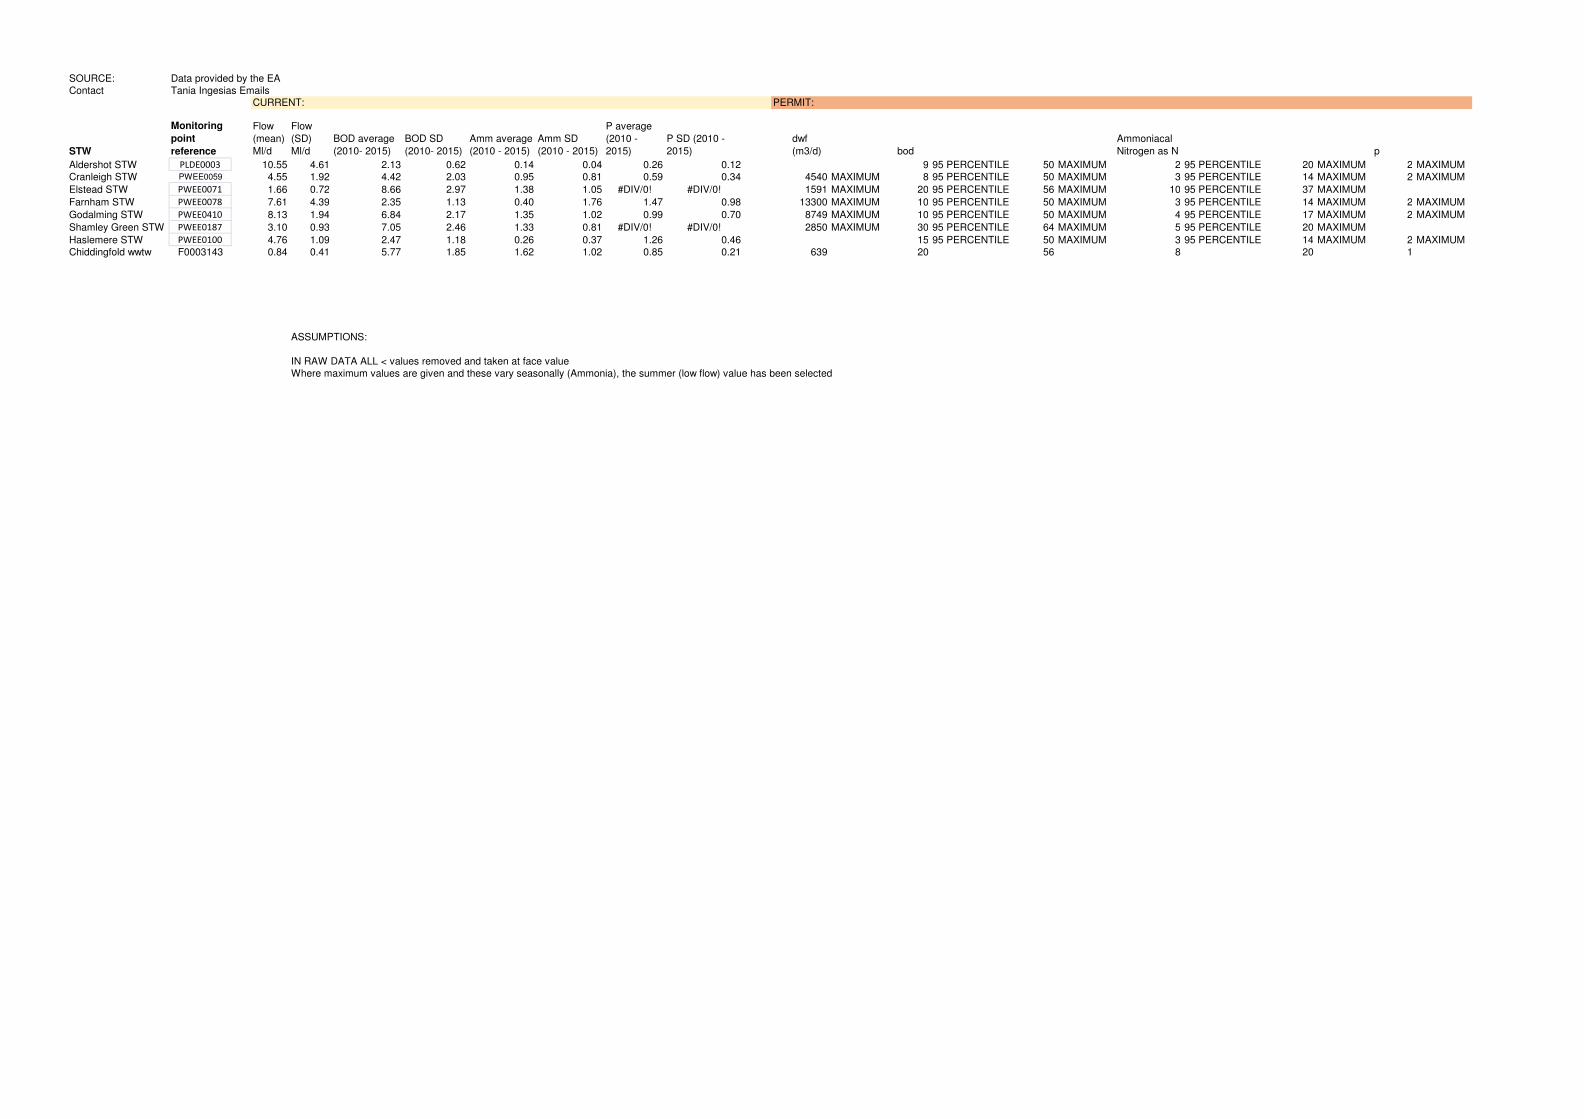
SOURCE: Data provided by the EA
Contact Tania Ingesias Emails
PERMIT:
STW
Monitoring
point
reference
Flow
(mean)
Ml/d
Flow
(SD)
Ml/d
BOD average
(2010- 2015)
BOD SD
(2010- 2015)
Amm average
(2010 - 2015)
Amm SD
(2010 - 2015)
P average
(2010 -
2015)
P SD (2010 -
2015)
dwf
(m3/d) bod
Ammoniacal
Nitrogen as N p
Aldershot STW PLDE0003 10.55 4.61 2.13 0.62 0.14 0.04 0.26 0.12 9 95 PERCENTILE 50 MAXIMUM 2 95 PERCENTILE 20 MAXIMUM 2 MAXIMUM
Cranleigh STW PWEE0059 4.55 1.92 4.42 2.03 0.95 0.81 0.59 0.34 4540 MAXIMUM 8 95 PERCENTILE 50 MAXIMUM 3 95 PERCENTILE 14 MAXIMUM 2 MAXIMUM
Elstead STW PWEE0071 1.66 0.72 8.66 2.97 1.38 1.05 #DIV/0! #DIV/0! 1591 MAXIMUM 20 95 PERCENTILE 56 MAXIMUM 10 95 PERCENTILE 37 MAXIMUM
Farnham STW PWEE0078 7.61 4.39 2.35 1.13 0.40 1.76 1.47 0.98 13300 MAXIMUM 10 95 PERCENTILE 50 MAXIMUM 3 95 PERCENTILE 14 MAXIMUM 2 MAXIMUM
Godalming STW PWEE0410 8.13 1.94 6.84 2.17 1.35 1.02 0.99 0.70 8749 MAXIMUM 10 95 PERCENTILE 50 MAXIMUM 4 95 PERCENTILE 17 MAXIMUM 2 MAXIMUM
Shamley Green STW PWEE0187 3.10 0.93 7.05 2.46 1.33 0.81 #DIV/0! #DIV/0! 2850 MAXIMUM 30 95 PERCENTILE 64 MAXIMUM 5 95 PERCENTILE 20 MAXIMUM
Haslemere STW PWEE0100 4.76 1.09 2.47 1.18 0.26 0.37 1.26 0.46 15 95 PERCENTILE 50 MAXIMUM 3 95 PERCENTILE 14 MAXIMUM 2 MAXIMUM
Chiddingfold wwtw F0003143 0.84 0.41 5.77 1.85 1.62 1.02 0.85 0.21 639 20 56 8 20 1
ASSUMPTIONS:
IN RAW DATA ALL < values removed and taken at face value
Where maximum values are given and these vary seasonally (Ammonia), the summer (low flow) value has been selected
CURRENT:
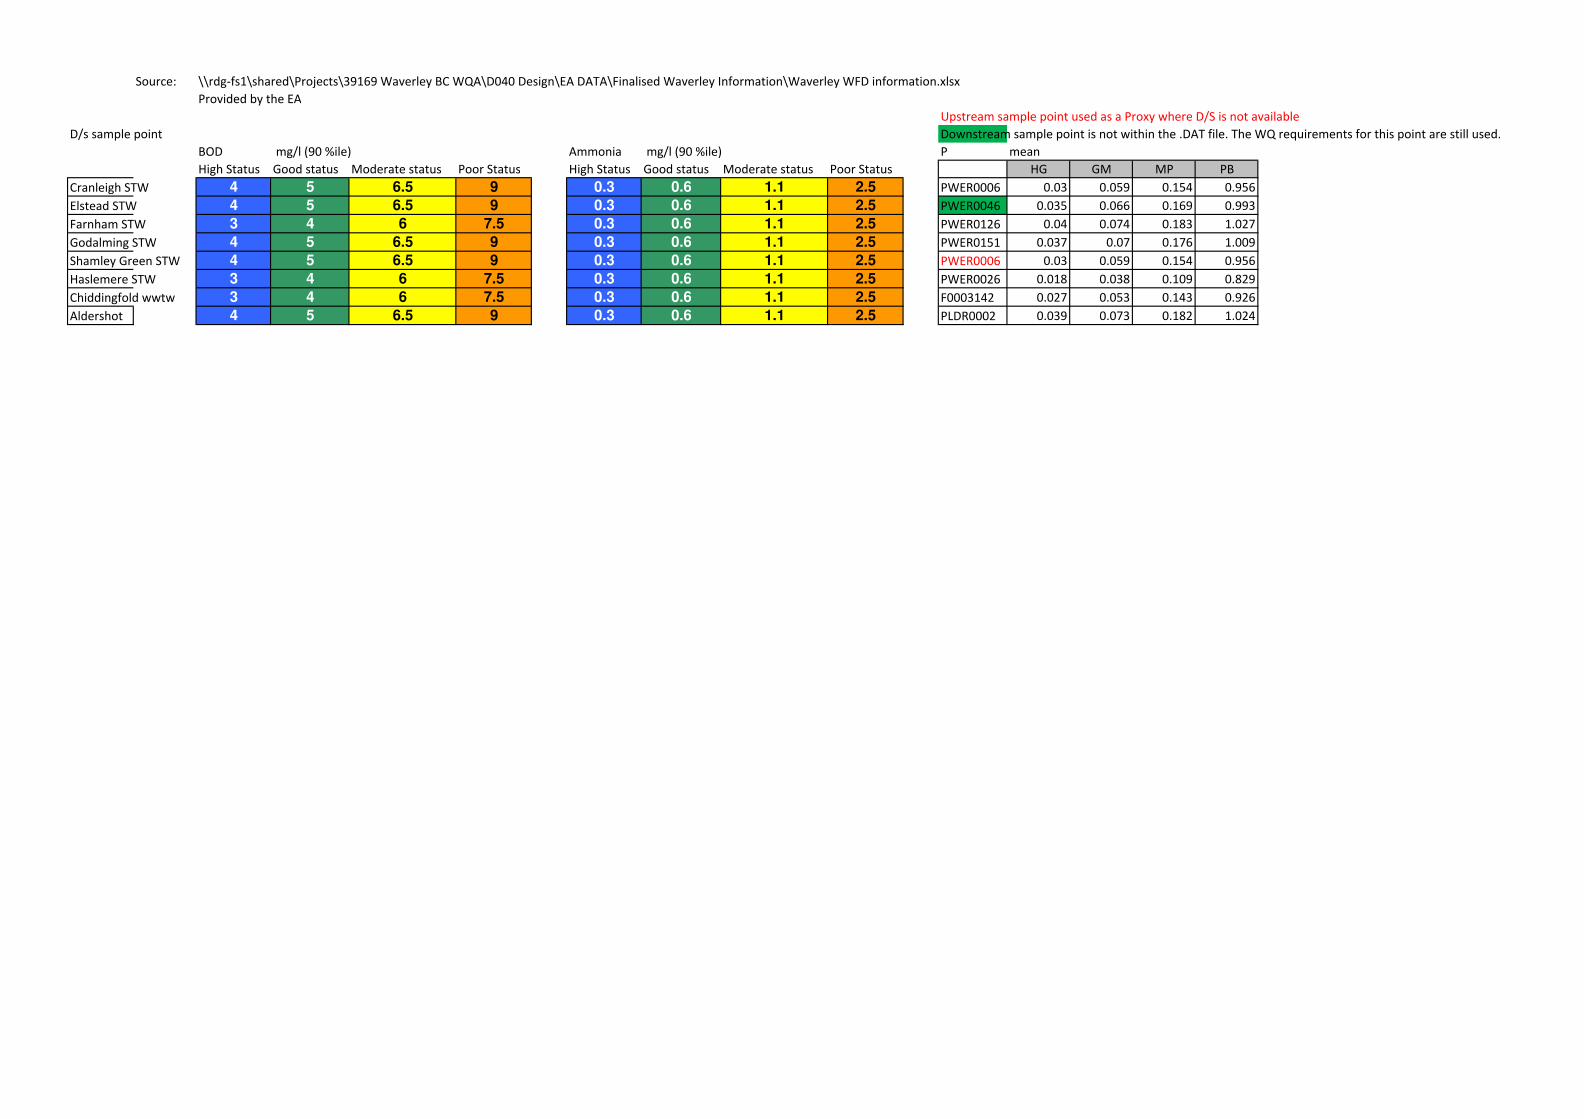
Source: \\rdg-fs1\shared\Projects\39169 Waverley BC WQA\D040 Design\EA DATA\Finalised Waverley Information\Waverley WFD information.xlsx
Provided by the EA
Upstream sample point used as a Proxy where D/S is not available
D/s sample point Downstream sample point is not within the .DAT file. The WQ requirements for this point are still used.
BOD mg/l (90 %ile) Ammonia mg/l (90 %ile) P mean
High Status Good status Moderate status Poor Status High Status Good status Moderate status Poor Status HG GM MP PB
Cranleigh STW 4 5 6.5 9 0.3 0.6 1.1 2.5 PWER0006 0.03 0.059 0.154 0.956
Elstead STW 4 5 6.5 9 0.3 0.6 1.1 2.5 PWER0046 0.035 0.066 0.169 0.993
Farnham STW 3 4 6 7.5 0.3 0.6 1.1 2.5 PWER0126 0.04 0.074 0.183 1.027
Godalming STW 4 5 6.5 9 0.3 0.6 1.1 2.5 PWER0151 0.037 0.07 0.176 1.009
Shamley Green STW 4 5 6.5 9 0.3 0.6 1.1 2.5 PWER0006 0.03 0.059 0.154 0.956
Haslemere STW 3 4 6 7.5 0.3 0.6 1.1 2.5 PWER0026 0.018 0.038 0.109 0.829
Chiddingfold wwtw 3 4 6 7.5 0.3 0.6 1.1 2.5 F0003142 0.027 0.053 0.143 0.926
Aldershot 4 5 6.5 9 0.3 0.6 1.1 2.5 PLDR0002 0.039 0.073 0.182 1.024
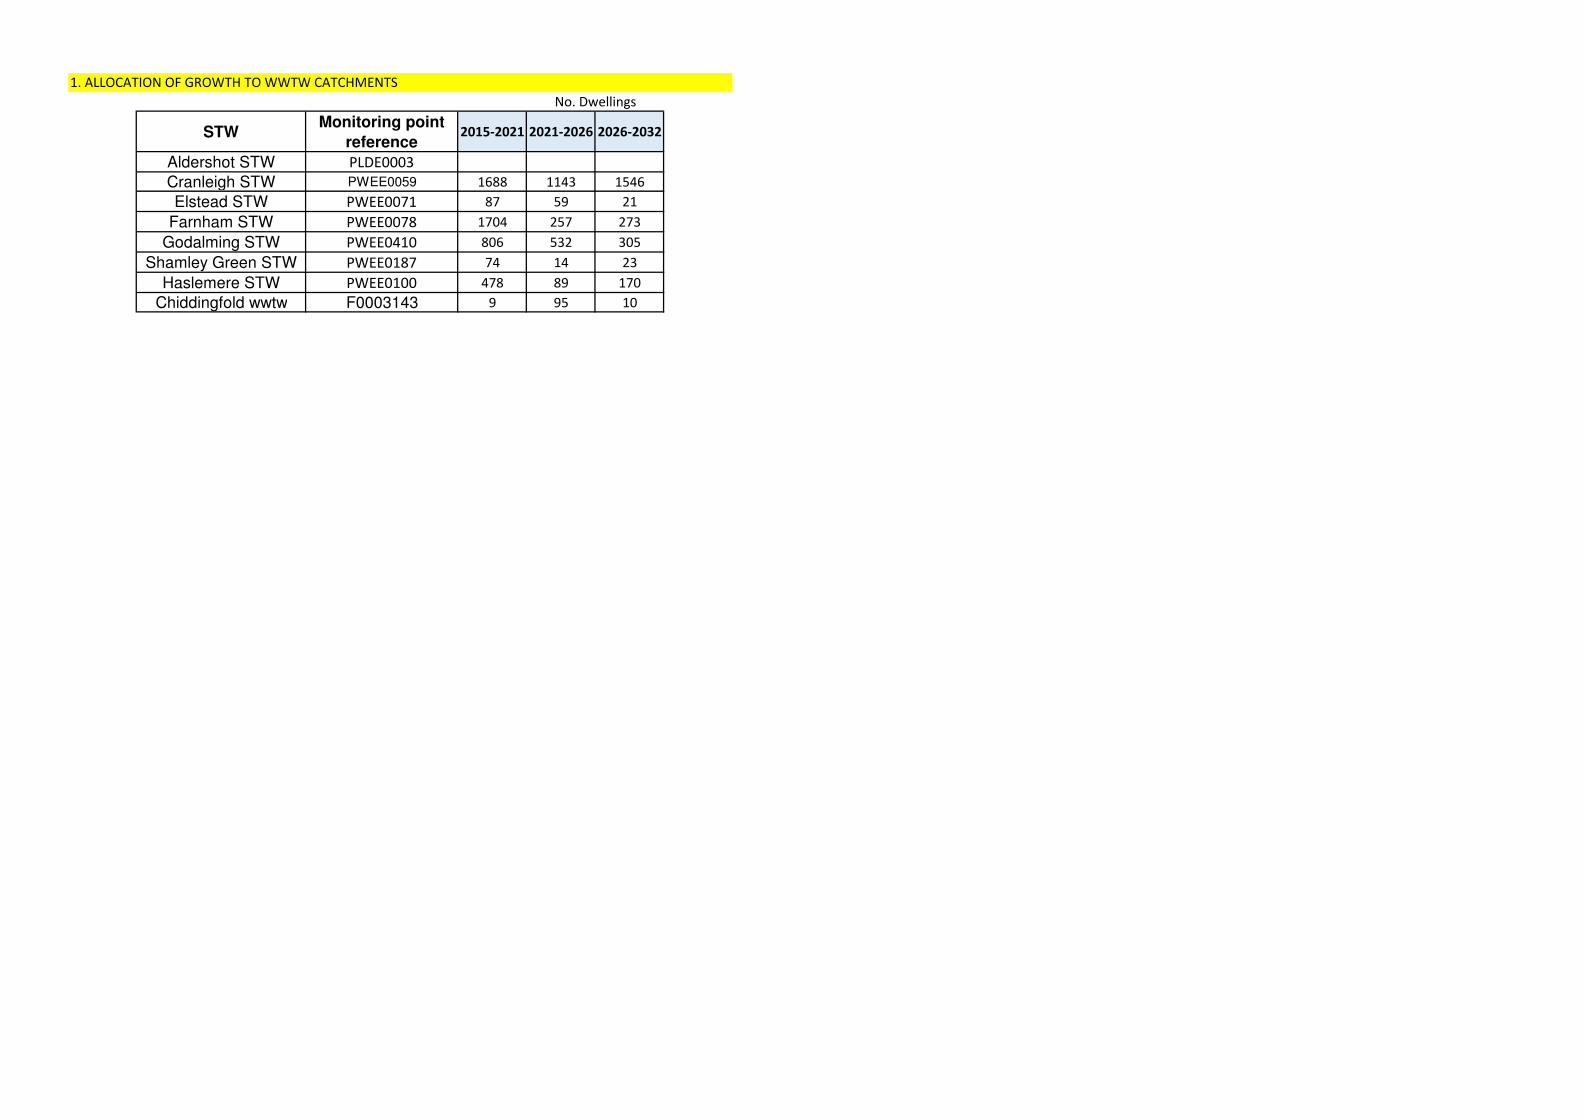
1. ALLOCATION OF GROWTH TO WWTW CATCHMENTS
STWMonitoring point
reference2015-2021 2021-2026 2026-2032
Aldershot STW PLDE0003
Cranleigh STW PWEE0059 1688 1143 1546
Elstead STW PWEE0071 87 59 21
Farnham STW PWEE0078 1704 257 273
Godalming STW PWEE0410 806 532 305
Shamley Green STW PWEE0187 74 14 23
Haslemere STW PWEE0100 478 89 170
Chiddingfold wwtw F0003143 9 95 10
No. Dwellings
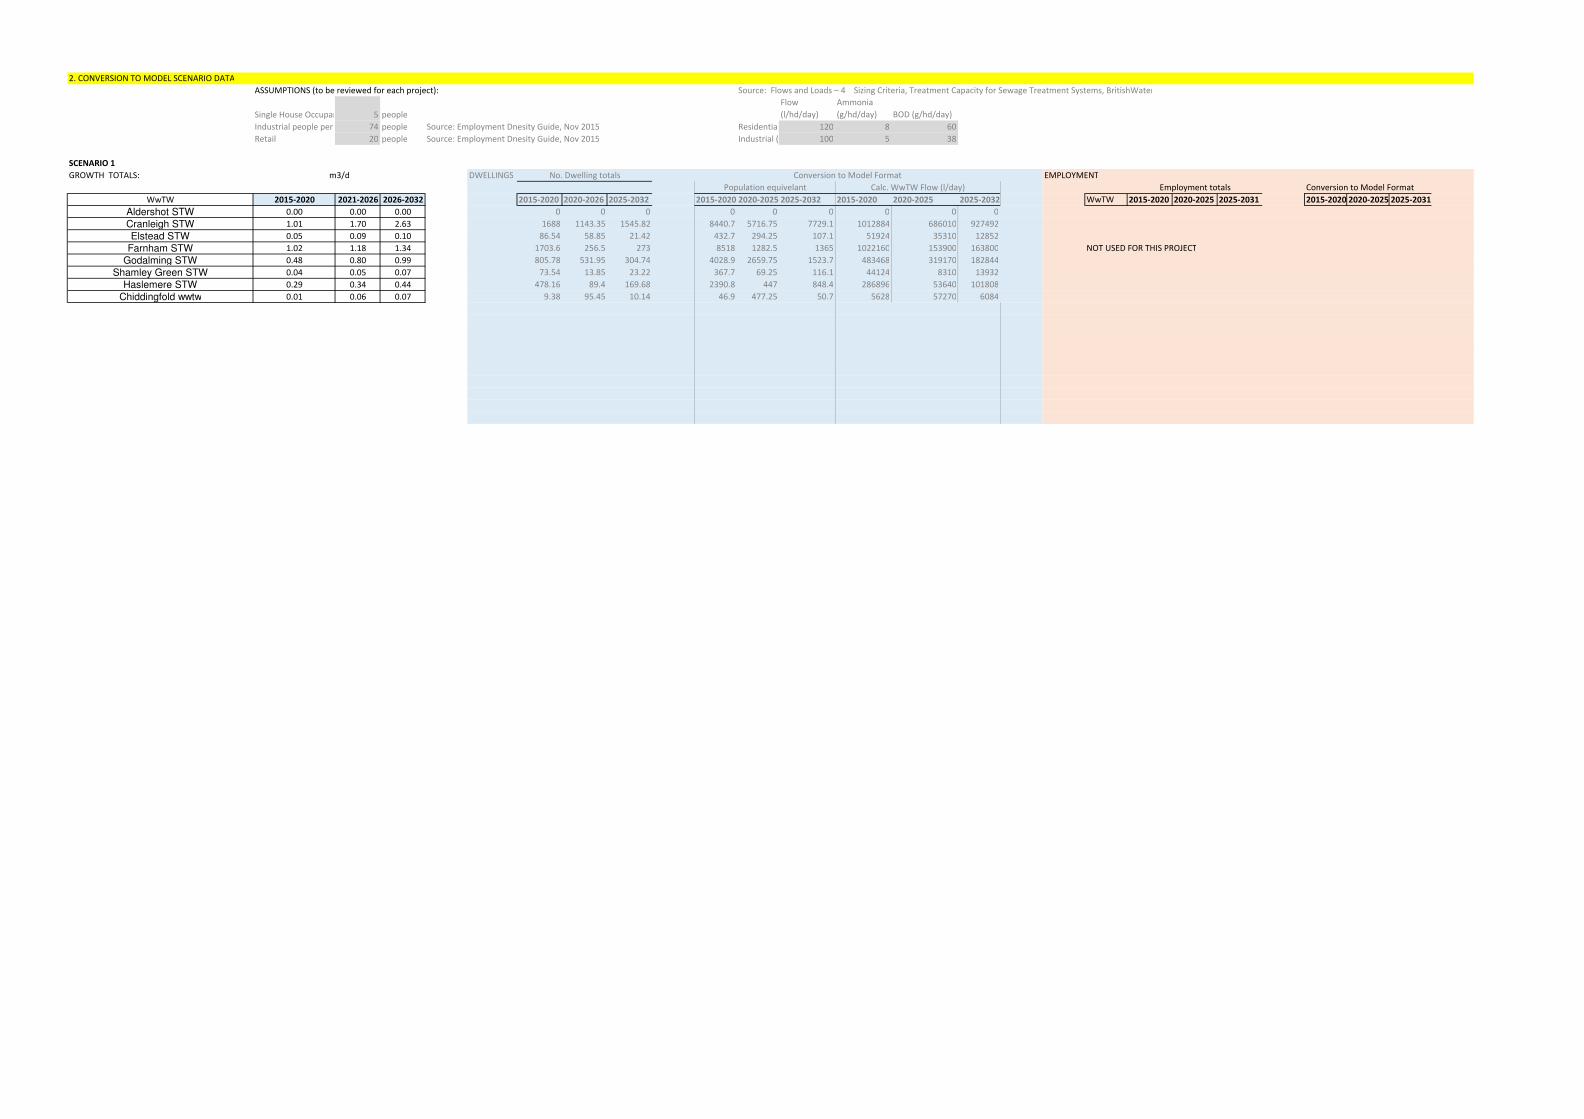
2. CONVERSION TO MODEL SCENARIO DATA
ASSUMPTIONS (to be reviewed for each project): Source: Flows and Loads – 4 Sizing Criteria, Treatment Capacity for Sewage Treatment Systems, BritishWater
Single House Occupancy: 5 people
Flow
(l/hd/day)
Ammonia
(g/hd/day) BOD (g/hd/day)
Industrial people per m2 74 people Source: Employment Dnesity Guide, Nov 2015 Residential 120 8 60
Retail 20 people Source: Employment Dnesity Guide, Nov 2015 Industrial (office/factory)100 5 38
SCENARIO 1
GROWTH TOTALS: DWELLINGS EMPLOYMENT
Conversion to Model Format
WwTW 2015-2020 2021-2026 2026-2032 2015-2020 2020-2026 2025-2032 2015-2020 2020-2025 2025-2032 2015-2020 2020-2025 2025-2032 WwTW 2015-2020 2020-2025 2025-2031 2015-2020 2020-2025 2025-2031
Aldershot STW 0.00 0.00 0.00 0 0 0 0 0 0 0 0 0
Cranleigh STW 1.01 1.70 2.63 1688 1143.35 1545.82 8440.7 5716.75 7729.1 1012884 686010 927492
Elstead STW 0.05 0.09 0.10 86.54 58.85 21.42 432.7 294.25 107.1 51924 35310 12852
Farnham STW 1.02 1.18 1.34 1703.6 256.5 273 8518 1282.5 1365 1022160 153900 163800 NOT USED FOR THIS PROJECT
Godalming STW 0.48 0.80 0.99 805.78 531.95 304.74 4028.9 2659.75 1523.7 483468 319170 182844
Shamley Green STW 0.04 0.05 0.07 73.54 13.85 23.22 367.7 69.25 116.1 44124 8310 13932
Haslemere STW 0.29 0.34 0.44 478.16 89.4 169.68 2390.8 447 848.4 286896 53640 101808
Chiddingfold wwtw 0.01 0.06 0.07 9.38 95.45 10.14 46.9 477.25 50.7 5628 57270 6084
m3/d No. Dwelling totals
Employment totalsPopulation equivelant Calc. WwTW Flow (l/day)
Conversion to Model Format
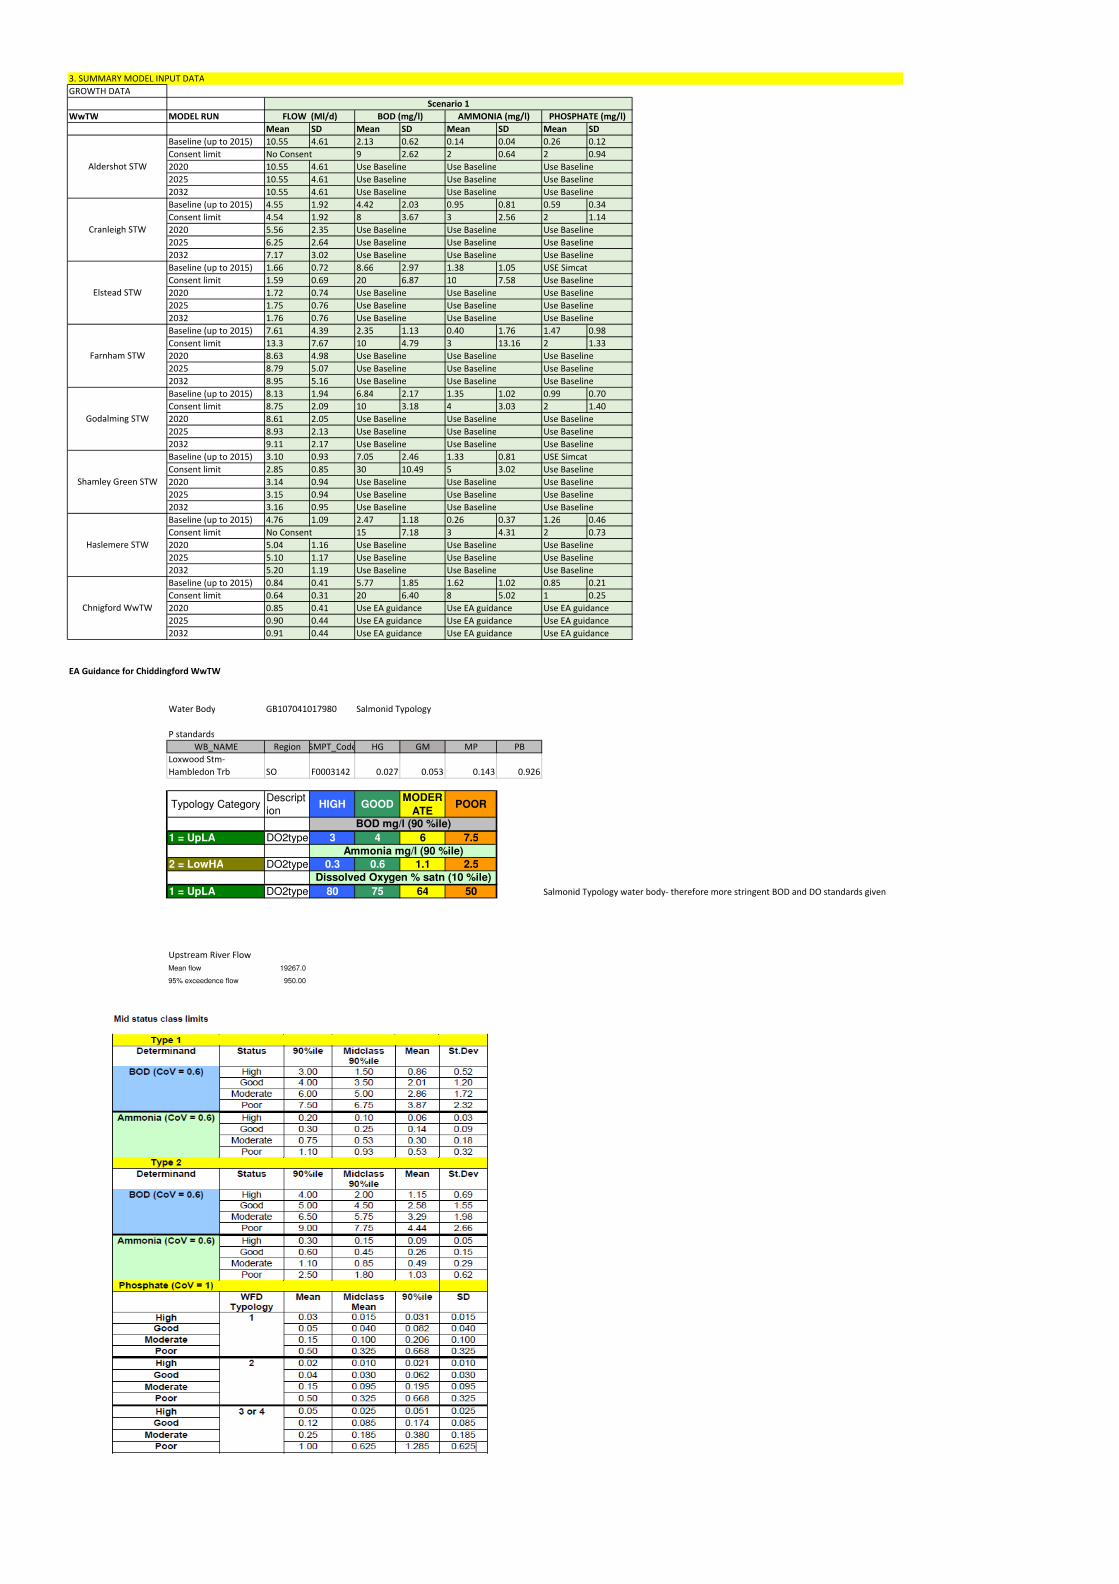
3. SUMMARY MODEL INPUT DATA
GROWTH DATA
WwTW MODEL RUN
Mean SD Mean SD Mean SD Mean SD
Baseline (up to 2015) 10.55 4.61 2.13 0.62 0.14 0.04 0.26 0.12
Consent limit No Consent 9 2.62 2 0.64 2 0.94
2020 10.55 4.61 Use Baseline Use Baseline Use Baseline
2025 10.55 4.61 Use Baseline Use Baseline Use Baseline
2032 10.55 4.61 Use Baseline Use Baseline Use Baseline
Baseline (up to 2015) 4.55 1.92 4.42 2.03 0.95 0.81 0.59 0.34
Consent limit 4.54 1.92 8 3.67 3 2.56 2 1.14
2020 5.56 2.35 Use Baseline Use Baseline Use Baseline
2025 6.25 2.64 Use Baseline Use Baseline Use Baseline
2032 7.17 3.02 Use Baseline Use Baseline Use Baseline
Baseline (up to 2015) 1.66 0.72 8.66 2.97 1.38 1.05 USE Simcat
Consent limit 1.59 0.69 20 6.87 10 7.58 Use Baseline
2020 1.72 0.74 Use Baseline Use Baseline Use Baseline
2025 1.75 0.76 Use Baseline Use Baseline Use Baseline
2032 1.76 0.76 Use Baseline Use Baseline Use Baseline
Baseline (up to 2015) 7.61 4.39 2.35 1.13 0.40 1.76 1.47 0.98
Consent limit 13.3 7.67 10 4.79 3 13.16 2 1.33
2020 8.63 4.98 Use Baseline Use Baseline Use Baseline
2025 8.79 5.07 Use Baseline Use Baseline Use Baseline
2032 8.95 5.16 Use Baseline Use Baseline Use Baseline
Baseline (up to 2015) 8.13 1.94 6.84 2.17 1.35 1.02 0.99 0.70
Consent limit 8.75 2.09 10 3.18 4 3.03 2 1.40
2020 8.61 2.05 Use Baseline Use Baseline Use Baseline
2025 8.93 2.13 Use Baseline Use Baseline Use Baseline
2032 9.11 2.17 Use Baseline Use Baseline Use Baseline
Baseline (up to 2015) 3.10 0.93 7.05 2.46 1.33 0.81 USE Simcat
Consent limit 2.85 0.85 30 10.49 5 3.02 Use Baseline
2020 3.14 0.94 Use Baseline Use Baseline Use Baseline
2025 3.15 0.94 Use Baseline Use Baseline Use Baseline
2032 3.16 0.95 Use Baseline Use Baseline Use Baseline
Baseline (up to 2015) 4.76 1.09 2.47 1.18 0.26 0.37 1.26 0.46
Consent limit No Consent 15 7.18 3 4.31 2 0.73
2020 5.04 1.16 Use Baseline Use Baseline Use Baseline
2025 5.10 1.17 Use Baseline Use Baseline Use Baseline
2032 5.20 1.19 Use Baseline Use Baseline Use Baseline
Baseline (up to 2015) 0.84 0.41 5.77 1.85 1.62 1.02 0.85 0.21
Consent limit 0.64 0.31 20 6.40 8 5.02 1 0.25
2020 0.85 0.41 Use EA guidance Use EA guidance Use EA guidance
2025 0.90 0.44 Use EA guidance Use EA guidance Use EA guidance
2032 0.91 0.44 Use EA guidance Use EA guidance Use EA guidance
EA Guidance for Chiddingford WwTW
Water Body GB107041017980 Salmonid Typology
P standards
WB_NAME Region SMPT_Code HG GM MP PB
Loxwood Stm-
Hambledon Trb SO F0003142 0.027 0.053 0.143 0.926
Typology CategoryDescript
ionHIGH GOOD
MODER
ATEPOOR
1 = UpLA DO2type (Basic types: 1, 2, 4, 6)3 4 6 7.5
2 = LowHA DO2type (Basic types: 3, 5, 7)0.3 0.6 1.1 2.5
1 = UpLA DO2type (Basic types: 1, 2, 4, 6)80 75 64 50 Salmonid Typology water body- therefore more stringent BOD and DO standards given
Upstream River Flow
Mean flow 19267.0
95% exceedence flow 950.00
BOD mg/l (90 %ile)
Ammonia mg/l (90 %ile)
Dissolved Oxygen % satn (10 %ile)
Godalming STW
Shamley Green STW
Haslemere STW
Chnigford WwTW
Elstead STW
Farnham STW
PHOSPHATE (mg/l)
Scenario 1
Cranleigh STW
Aldershot STW
FLOW (Ml/d) BOD (mg/l) AMMONIA (mg/l)
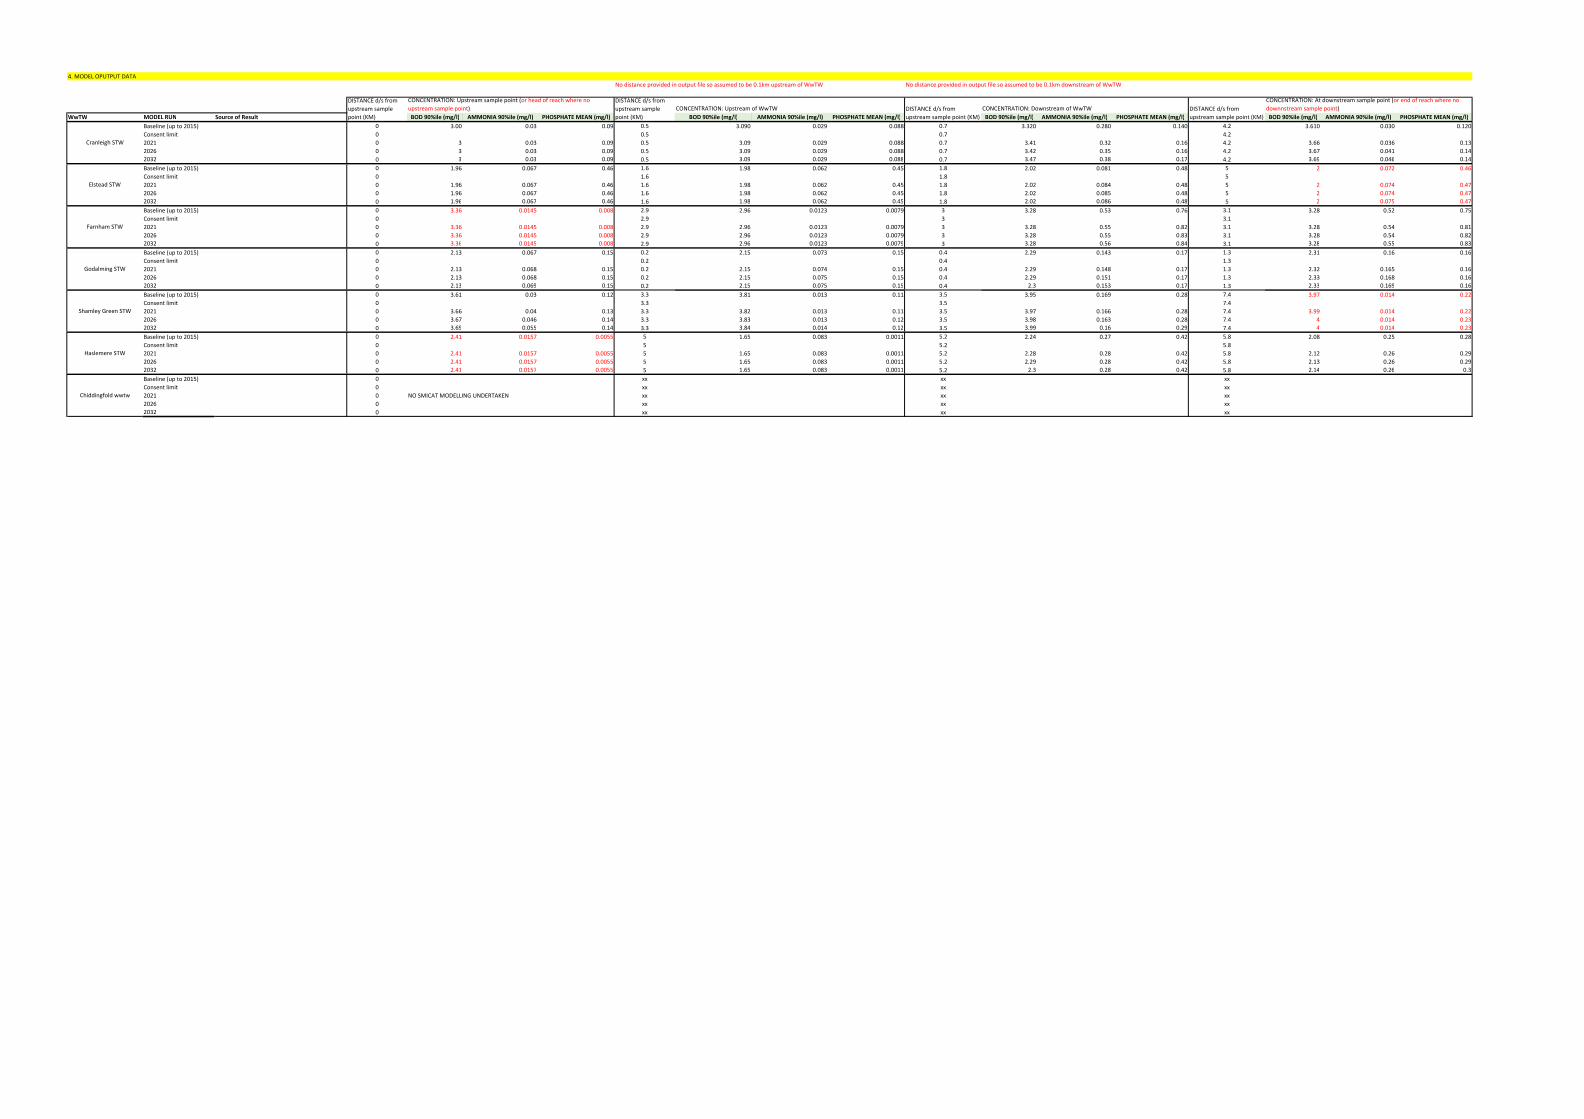
4. MODEL OPUTPUT DATA
No distance provided in output file so assumed to be 0.1km upstream of WwTW No distance provided in output file so assumed to be 0.1km downstream of WwTW
WwTW MODEL RUN Source of Result BOD 90%ile (mg/l) AMMONIA 90%ile (mg/l) PHOSPHATE MEAN (mg/l) BOD 90%ile (mg/l) AMMONIA 90%ile (mg/l) PHOSPHATE MEAN (mg/l) BOD 90%ile (mg/l) AMMONIA 90%ile (mg/l) PHOSPHATE MEAN (mg/l) BOD 90%ile (mg/l) AMMONIA 90%ile (mg/l) PHOSPHATE MEAN (mg/l)
Baseline (up to 2015) 0 3.00 0.03 0.09 0.5 3.090 0.029 0.088 0.7 3.320 0.280 0.140 4.2 3.610 0.030 0.120
Consent limit 0 0.5 0.7 4.2
2021 0 3 0.03 0.09 0.5 3.09 0.029 0.088 0.7 3.41 0.32 0.16 4.2 3.66 0.036 0.13
2026 0 3 0.03 0.09 0.5 3.09 0.029 0.088 0.7 3.42 0.35 0.16 4.2 3.67 0.041 0.14
2032 0 3 0.03 0.09 0.5 3.09 0.029 0.088 0.7 3.47 0.38 0.17 4.2 3.69 0.046 0.14
Baseline (up to 2015) 0 1.96 0.067 0.46 1.6 1.98 0.062 0.45 1.8 2.02 0.081 0.48 5 2 0.072 0.46
Consent limit 0 1.6 1.8 5
2021 0 1.96 0.067 0.46 1.6 1.98 0.062 0.45 1.8 2.02 0.084 0.48 5 2 0.074 0.47
2026 0 1.96 0.067 0.46 1.6 1.98 0.062 0.45 1.8 2.02 0.085 0.48 5 2 0.074 0.47
2032 0 1.96 0.067 0.46 1.6 1.98 0.062 0.45 1.8 2.02 0.086 0.48 5 2 0.075 0.47
Baseline (up to 2015) 0 3.36 0.0145 0.008 2.9 2.96 0.0123 0.0079 3 3.28 0.53 0.76 3.1 3.28 0.52 0.75
Consent limit 0 2.9 3 3.1
2021 0 3.36 0.0145 0.008 2.9 2.96 0.0123 0.0079 3 3.28 0.55 0.82 3.1 3.28 0.54 0.81
2026 0 3.36 0.0145 0.008 2.9 2.96 0.0123 0.0079 3 3.28 0.55 0.83 3.1 3.28 0.54 0.82
2032 0 3.36 0.0145 0.008 2.9 2.96 0.0123 0.0079 3 3.28 0.56 0.84 3.1 3.28 0.55 0.83
Baseline (up to 2015) 0 2.13 0.067 0.15 0.2 2.15 0.073 0.15 0.4 2.29 0.143 0.17 1.3 2.31 0.16 0.16
Consent limit 0 0.2 0.4 1.3
2021 0 2.13 0.068 0.15 0.2 2.15 0.074 0.15 0.4 2.29 0.148 0.17 1.3 2.32 0.165 0.16
2026 0 2.13 0.068 0.15 0.2 2.15 0.075 0.15 0.4 2.29 0.151 0.17 1.3 2.33 0.168 0.16
2032 0 2.13 0.069 0.15 0.2 2.15 0.075 0.15 0.4 2.3 0.153 0.17 1.3 2.33 0.169 0.16
Baseline (up to 2015) 0 3.61 0.03 0.12 3.3 3.81 0.013 0.11 3.5 3.95 0.169 0.28 7.4 3.97 0.014 0.22
Consent limit 0 3.3 3.5 7.4
2021 0 3.66 0.04 0.13 3.3 3.82 0.013 0.11 3.5 3.97 0.166 0.28 7.4 3.99 0.014 0.22
2026 0 3.67 0.046 0.14 3.3 3.83 0.013 0.12 3.5 3.98 0.163 0.28 7.4 4 0.014 0.23
2032 0 3.69 0.055 0.14 3.3 3.84 0.014 0.12 3.5 3.99 0.16 0.29 7.4 4 0.014 0.23
Baseline (up to 2015) 0 2.41 0.0157 0.0055 5 1.65 0.083 0.0011 5.2 2.24 0.27 0.42 5.8 2.08 0.25 0.28
Consent limit 0 5 5.2 5.8
2021 0 2.41 0.0157 0.0055 5 1.65 0.083 0.0011 5.2 2.28 0.28 0.42 5.8 2.12 0.26 0.29
2026 0 2.41 0.0157 0.0055 5 1.65 0.083 0.0011 5.2 2.29 0.28 0.42 5.8 2.13 0.26 0.29
2032 0 2.41 0.0157 0.0055 5 1.65 0.083 0.0011 5.2 2.3 0.28 0.42 5.8 2.14 0.26 0.3
Baseline (up to 2015) 0 xx xx xx
Consent limit 0 xx xx xx
2021 0 NO SMICAT MODELLING UNDERTAKEN xx xx xx
2026 0 xx xx xx
2032 0 xx xx xx
Shamley Green STW
Haslemere STW
Chiddingfold wwtw
Farnham STW
Godalming STW
CONCENTRATION: At downstream sample point (or end of reach where no
downnstream sample point)
CONCENTRATION: Upstream sample point (or head of reach where no
upstream sample point) CONCENTRATION: Downstream of WwTW
Cranleigh STW
Elstead STW
CONCENTRATION: Upstream of WwTW
DISTANCE d/s from
upstream sample
point (KM)
DISTANCE d/s from
upstream sample
point (KM)
DISTANCE d/s from
upstream sample point (KM)
DISTANCE d/s from
upstream sample point (KM)
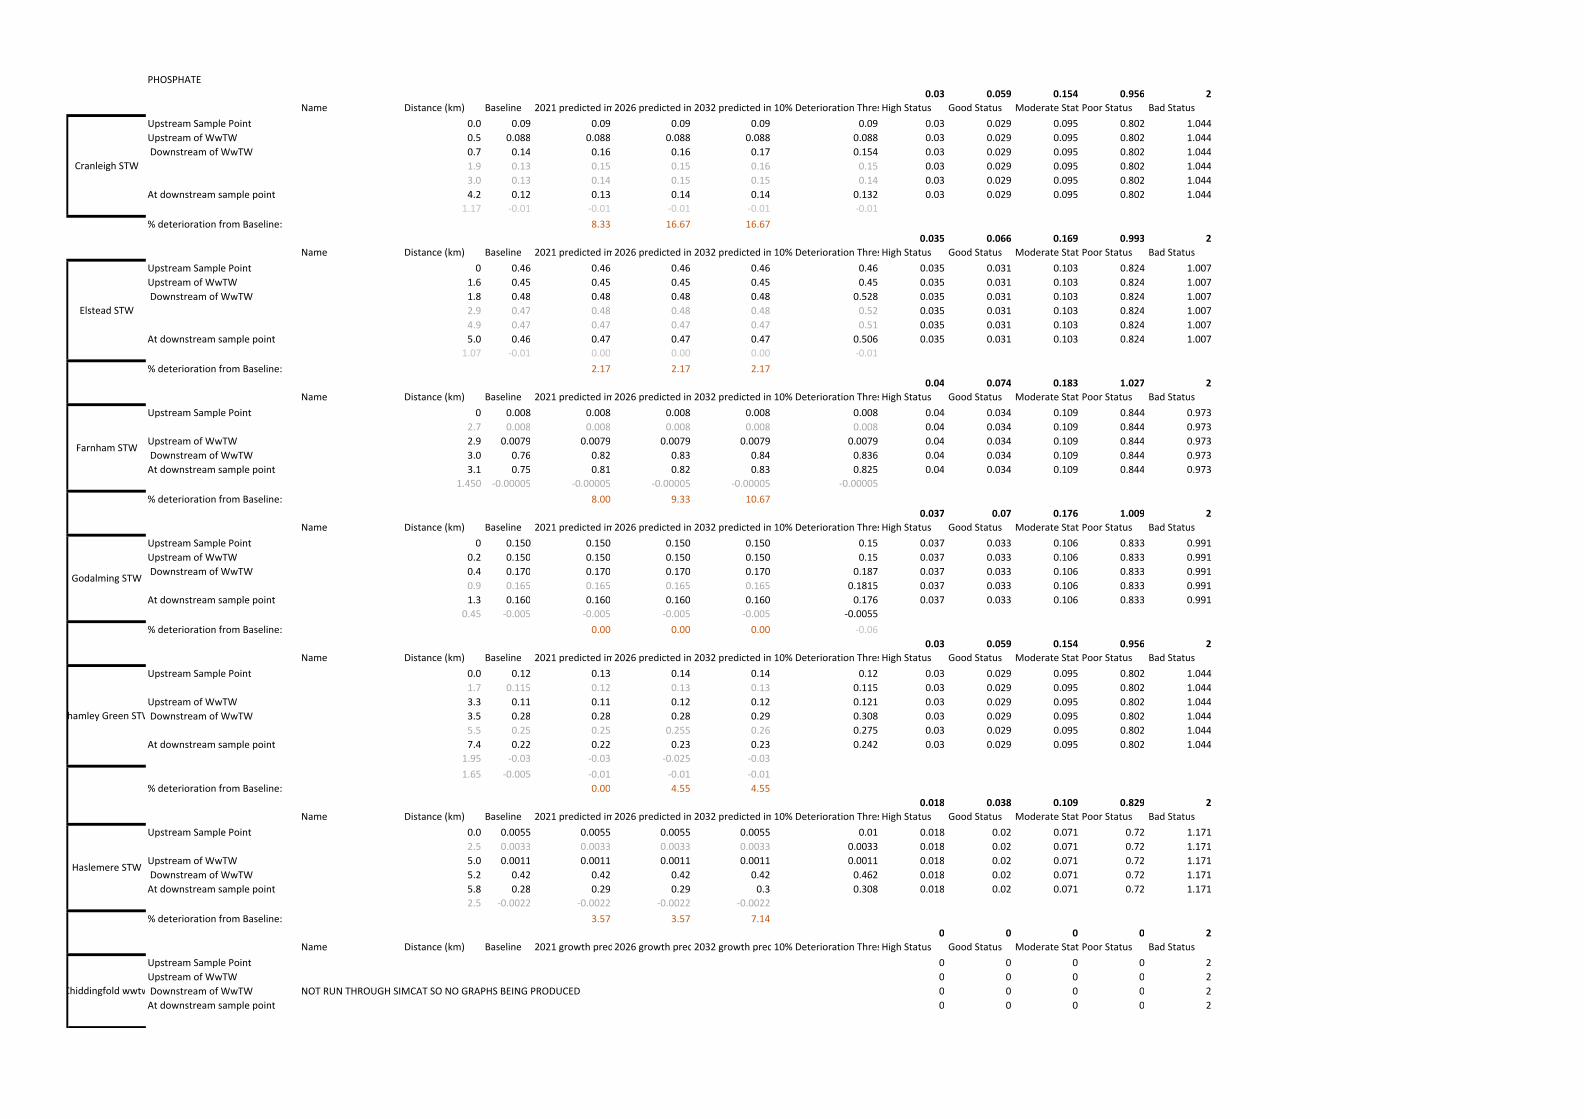
PHOSPHATE
0.03 0.059 0.154 0.956 2
Name Distance (km) Baseline 2021 predicted impact2026 predicted impact2032 predicted impact10% Deterioration ThresholdHigh Status Good Status Moderate StatusPoor Status Bad Status
Upstream Sample Point 0.0 0.09 0.09 0.09 0.09 0.09 0.03 0.029 0.095 0.802 1.044
Upstream of WwTW 0.5 0.088 0.088 0.088 0.088 0.088 0.03 0.029 0.095 0.802 1.044
Downstream of WwTW 0.7 0.14 0.16 0.16 0.17 0.154 0.03 0.029 0.095 0.802 1.044
1.9 0.13 0.15 0.15 0.16 0.15 0.03 0.029 0.095 0.802 1.044
3.0 0.13 0.14 0.15 0.15 0.14 0.03 0.029 0.095 0.802 1.044
At downstream sample point 4.2 0.12 0.13 0.14 0.14 0.132 0.03 0.029 0.095 0.802 1.044
1.17 -0.01 -0.01 -0.01 -0.01 -0.01
% deterioration from Baseline: 8.33 16.67 16.67
0.035 0.066 0.169 0.993 2
Name Distance (km) Baseline 2021 predicted impact2026 predicted impact2032 predicted impact10% Deterioration ThresholdHigh Status Good Status Moderate StatusPoor Status Bad Status
Upstream Sample Point 0 0.46 0.46 0.46 0.46 0.46 0.035 0.031 0.103 0.824 1.007
Upstream of WwTW 1.6 0.45 0.45 0.45 0.45 0.45 0.035 0.031 0.103 0.824 1.007
Downstream of WwTW 1.8 0.48 0.48 0.48 0.48 0.528 0.035 0.031 0.103 0.824 1.007
2.9 0.47 0.48 0.48 0.48 0.52 0.035 0.031 0.103 0.824 1.007
4.9 0.47 0.47 0.47 0.47 0.51 0.035 0.031 0.103 0.824 1.007
At downstream sample point 5.0 0.46 0.47 0.47 0.47 0.506 0.035 0.031 0.103 0.824 1.007
1.07 -0.01 0.00 0.00 0.00 -0.01
% deterioration from Baseline: 2.17 2.17 2.17
0.04 0.074 0.183 1.027 2
Name Distance (km) Baseline 2021 predicted impact2026 predicted impact2032 predicted impact10% Deterioration ThresholdHigh Status Good Status Moderate StatusPoor Status Bad Status
Upstream Sample Point 0 0.008 0.008 0.008 0.008 0.008 0.04 0.034 0.109 0.844 0.973
2.7 0.008 0.008 0.008 0.008 0.008 0.04 0.034 0.109 0.844 0.973
Upstream of WwTW 2.9 0.0079 0.0079 0.0079 0.0079 0.0079 0.04 0.034 0.109 0.844 0.973
Downstream of WwTW 3.0 0.76 0.82 0.83 0.84 0.836 0.04 0.034 0.109 0.844 0.973
At downstream sample point 3.1 0.75 0.81 0.82 0.83 0.825 0.04 0.034 0.109 0.844 0.973
1.450 -0.00005 -0.00005 -0.00005 -0.00005 -0.00005
% deterioration from Baseline: 8.00 9.33 10.67
0.037 0.07 0.176 1.009 2
Name Distance (km) Baseline 2021 predicted impact2026 predicted impact2032 predicted impact10% Deterioration ThresholdHigh Status Good Status Moderate StatusPoor Status Bad Status
Upstream Sample Point 0 0.150 0.150 0.150 0.150 0.15 0.037 0.033 0.106 0.833 0.991
Upstream of WwTW 0.2 0.150 0.150 0.150 0.150 0.15 0.037 0.033 0.106 0.833 0.991
Downstream of WwTW 0.4 0.170 0.170 0.170 0.170 0.187 0.037 0.033 0.106 0.833 0.991
0.9 0.165 0.165 0.165 0.165 0.1815 0.037 0.033 0.106 0.833 0.991
At downstream sample point 1.3 0.160 0.160 0.160 0.160 0.176 0.037 0.033 0.106 0.833 0.991
0.45 -0.005 -0.005 -0.005 -0.005 -0.0055
% deterioration from Baseline: 0.00 0.00 0.00 -0.06
0.03 0.059 0.154 0.956 2
Name Distance (km) Baseline 2021 predicted impact2026 predicted impact2032 predicted impact10% Deterioration ThresholdHigh Status Good Status Moderate StatusPoor Status Bad Status
Upstream Sample Point 0.0 0.12 0.13 0.14 0.14 0.12 0.03 0.029 0.095 0.802 1.044
1.7 0.115 0.12 0.13 0.13 0.115 0.03 0.029 0.095 0.802 1.044
Upstream of WwTW 3.3 0.11 0.11 0.12 0.12 0.121 0.03 0.029 0.095 0.802 1.044
Downstream of WwTW 3.5 0.28 0.28 0.28 0.29 0.308 0.03 0.029 0.095 0.802 1.044
5.5 0.25 0.25 0.255 0.26 0.275 0.03 0.029 0.095 0.802 1.044
At downstream sample point 7.4 0.22 0.22 0.23 0.23 0.242 0.03 0.029 0.095 0.802 1.044
1.95 -0.03 -0.03 -0.025 -0.03
1.65 -0.005 -0.01 -0.01 -0.01
% deterioration from Baseline: 0.00 4.55 4.55
0.018 0.038 0.109 0.829 2
Name Distance (km) Baseline 2021 predicted impact2026 predicted impact2032 predicted impact10% Deterioration ThresholdHigh Status Good Status Moderate StatusPoor Status Bad Status
Upstream Sample Point 0.0 0.0055 0.0055 0.0055 0.0055 0.01 0.018 0.02 0.071 0.72 1.171
2.5 0.0033 0.0033 0.0033 0.0033 0.0033 0.018 0.02 0.071 0.72 1.171
Upstream of WwTW 5.0 0.0011 0.0011 0.0011 0.0011 0.0011 0.018 0.02 0.071 0.72 1.171
Downstream of WwTW 5.2 0.42 0.42 0.42 0.42 0.462 0.018 0.02 0.071 0.72 1.171
At downstream sample point 5.8 0.28 0.29 0.29 0.3 0.308 0.018 0.02 0.071 0.72 1.171
2.5 -0.0022 -0.0022 -0.0022 -0.0022
% deterioration from Baseline: 3.57 3.57 7.14
0 0 0 0 2
Name Distance (km) Baseline 2021 growth prediction2026 growth prediction2032 growth prediction10% Deterioration ThresholdHigh Status Good Status Moderate StatusPoor Status Bad Status
Upstream Sample Point 0 0 0 0 2
Upstream of WwTW 0 0 0 0 2
Downstream of WwTW NOT RUN THROUGH SIMCAT SO NO GRAPHS BEING PRODUCED 0 0 0 0 2
At downstream sample point 0 0 0 0 2
Chiddingfold wwtw
Cranleigh STW
Elstead STW
Farnham STW
Godalming STW
Shamley Green STW
Haslemere STW
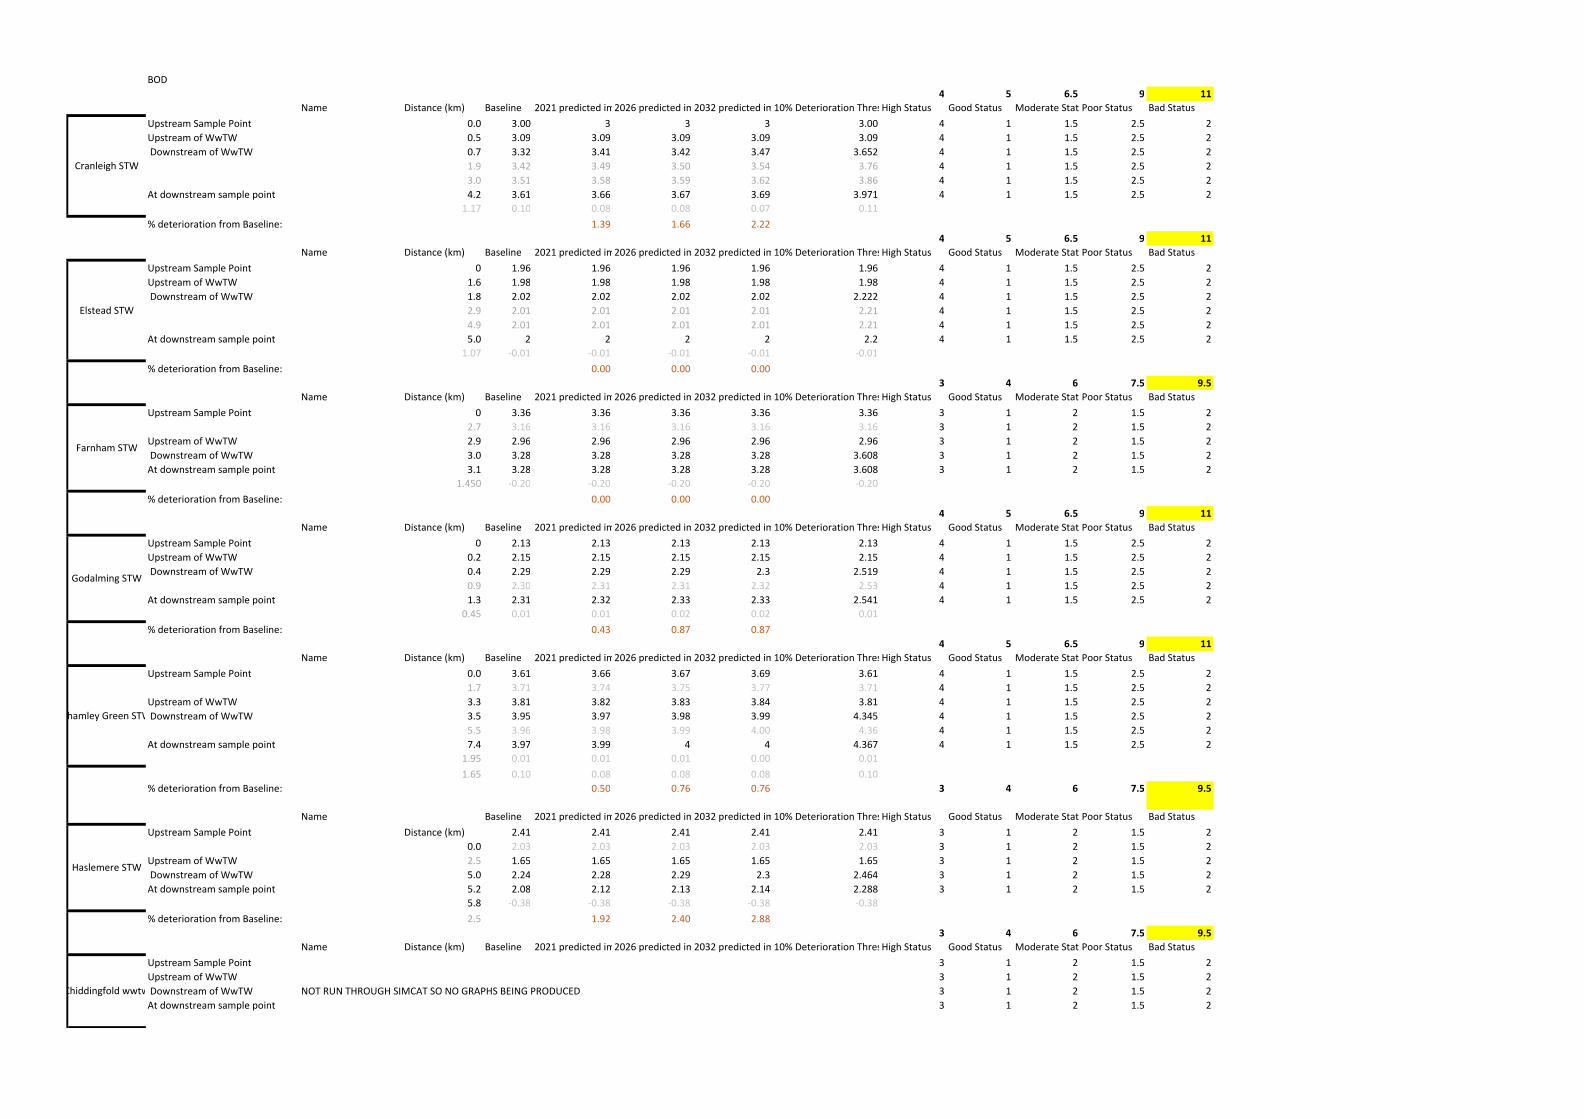
BOD
4 5 6.5 9 11
Name Distance (km) Baseline 2021 predicted impact2026 predicted impact2032 predicted impact10% Deterioration ThresholdHigh Status Good Status Moderate StatusPoor Status Bad Status
Upstream Sample Point 0.0 3.00 3 3 3 3.00 4 1 1.5 2.5 2
Upstream of WwTW 0.5 3.09 3.09 3.09 3.09 3.09 4 1 1.5 2.5 2
Downstream of WwTW 0.7 3.32 3.41 3.42 3.47 3.652 4 1 1.5 2.5 2
1.9 3.42 3.49 3.50 3.54 3.76 4 1 1.5 2.5 2
3.0 3.51 3.58 3.59 3.62 3.86 4 1 1.5 2.5 2
At downstream sample point 4.2 3.61 3.66 3.67 3.69 3.971 4 1 1.5 2.5 2
1.17 0.10 0.08 0.08 0.07 0.11
% deterioration from Baseline: 1.39 1.66 2.22
4 5 6.5 9 11
Name Distance (km) Baseline 2021 predicted impact2026 predicted impact2032 predicted impact10% Deterioration ThresholdHigh Status Good Status Moderate StatusPoor Status Bad Status
Upstream Sample Point 0 1.96 1.96 1.96 1.96 1.96 4 1 1.5 2.5 2
Upstream of WwTW 1.6 1.98 1.98 1.98 1.98 1.98 4 1 1.5 2.5 2
Downstream of WwTW 1.8 2.02 2.02 2.02 2.02 2.222 4 1 1.5 2.5 2
2.9 2.01 2.01 2.01 2.01 2.21 4 1 1.5 2.5 2
4.9 2.01 2.01 2.01 2.01 2.21 4 1 1.5 2.5 2
At downstream sample point 5.0 2 2 2 2 2.2 4 1 1.5 2.5 2
1.07 -0.01 -0.01 -0.01 -0.01 -0.01
% deterioration from Baseline: 0.00 0.00 0.00
3 4 6 7.5 9.5
Name Distance (km) Baseline 2021 predicted impact2026 predicted impact2032 predicted impact10% Deterioration ThresholdHigh Status Good Status Moderate StatusPoor Status Bad Status
Upstream Sample Point 0 3.36 3.36 3.36 3.36 3.36 3 1 2 1.5 2
2.7 3.16 3.16 3.16 3.16 3.16 3 1 2 1.5 2
Upstream of WwTW 2.9 2.96 2.96 2.96 2.96 2.96 3 1 2 1.5 2
Downstream of WwTW 3.0 3.28 3.28 3.28 3.28 3.608 3 1 2 1.5 2
At downstream sample point 3.1 3.28 3.28 3.28 3.28 3.608 3 1 2 1.5 2
1.450 -0.20 -0.20 -0.20 -0.20 -0.20
% deterioration from Baseline: 0.00 0.00 0.00
4 5 6.5 9 11
Name Distance (km) Baseline 2021 predicted impact2026 predicted impact2032 predicted impact10% Deterioration ThresholdHigh Status Good Status Moderate StatusPoor Status Bad Status
Upstream Sample Point 0 2.13 2.13 2.13 2.13 2.13 4 1 1.5 2.5 2
Upstream of WwTW 0.2 2.15 2.15 2.15 2.15 2.15 4 1 1.5 2.5 2
Downstream of WwTW 0.4 2.29 2.29 2.29 2.3 2.519 4 1 1.5 2.5 2
0.9 2.30 2.31 2.31 2.32 2.53 4 1 1.5 2.5 2
At downstream sample point 1.3 2.31 2.32 2.33 2.33 2.541 4 1 1.5 2.5 2
0.45 0.01 0.01 0.02 0.02 0.01
% deterioration from Baseline: 0.43 0.87 0.87
4 5 6.5 9 11
Name Distance (km) Baseline 2021 predicted impact2026 predicted impact2032 predicted impact10% Deterioration ThresholdHigh Status Good Status Moderate StatusPoor Status Bad Status
Upstream Sample Point 0.0 3.61 3.66 3.67 3.69 3.61 4 1 1.5 2.5 2
1.7 3.71 3.74 3.75 3.77 3.71 4 1 1.5 2.5 2
Upstream of WwTW 3.3 3.81 3.82 3.83 3.84 3.81 4 1 1.5 2.5 2
Downstream of WwTW 3.5 3.95 3.97 3.98 3.99 4.345 4 1 1.5 2.5 2
5.5 3.96 3.98 3.99 4.00 4.36 4 1 1.5 2.5 2
At downstream sample point 7.4 3.97 3.99 4 4 4.367 4 1 1.5 2.5 2
1.95 0.01 0.01 0.01 0.00 0.01
1.65 0.10 0.08 0.08 0.08 0.10
% deterioration from Baseline: 0.50 0.76 0.76 3 4 6 7.5 9.5
Name Baseline 2021 predicted impact2026 predicted impact2032 predicted impact10% Deterioration ThresholdHigh Status Good Status Moderate StatusPoor Status Bad Status
Upstream Sample Point Distance (km) 2.41 2.41 2.41 2.41 2.41 3 1 2 1.5 2
0.0 2.03 2.03 2.03 2.03 2.03 3 1 2 1.5 2
Upstream of WwTW 2.5 1.65 1.65 1.65 1.65 1.65 3 1 2 1.5 2
Downstream of WwTW 5.0 2.24 2.28 2.29 2.3 2.464 3 1 2 1.5 2
At downstream sample point 5.2 2.08 2.12 2.13 2.14 2.288 3 1 2 1.5 2
5.8 -0.38 -0.38 -0.38 -0.38 -0.38
% deterioration from Baseline: 2.5 1.92 2.40 2.88
3 4 6 7.5 9.5
Name Distance (km) Baseline 2021 predicted impact2026 predicted impact2032 predicted impact10% Deterioration ThresholdHigh Status Good Status Moderate StatusPoor Status Bad Status
Upstream Sample Point 3 1 2 1.5 2
Upstream of WwTW 3 1 2 1.5 2
Downstream of WwTW NOT RUN THROUGH SIMCAT SO NO GRAPHS BEING PRODUCED 3 1 2 1.5 2
At downstream sample point 3 1 2 1.5 2
Chiddingfold wwtw
Cranleigh STW
Elstead STW
Farnham STW
Godalming STW
Shamley Green STW
Haslemere STW
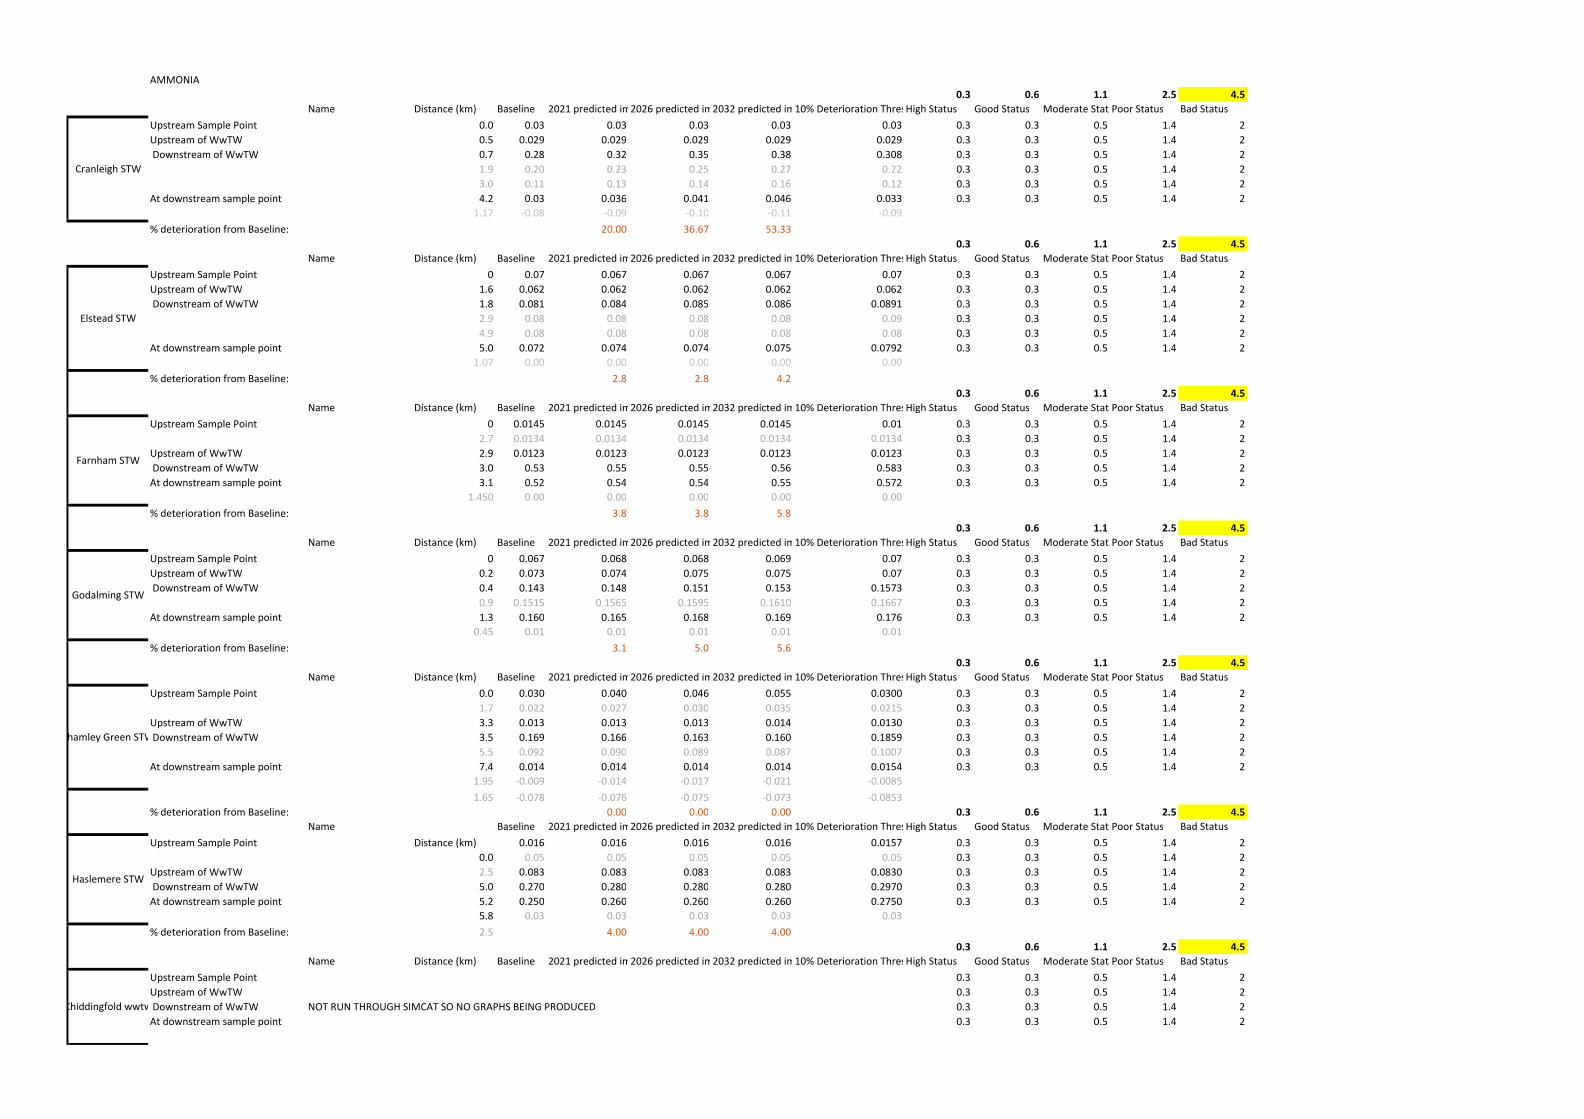
AMMONIA
0.3 0.6 1.1 2.5 4.5
Name Distance (km) Baseline 2021 predicted impact2026 predicted impact2032 predicted impact10% Deterioration ThresholdHigh Status Good Status Moderate StatusPoor Status Bad Status
Upstream Sample Point 0.0 0.03 0.03 0.03 0.03 0.03 0.3 0.3 0.5 1.4 2
Upstream of WwTW 0.5 0.029 0.029 0.029 0.029 0.029 0.3 0.3 0.5 1.4 2
Downstream of WwTW 0.7 0.28 0.32 0.35 0.38 0.308 0.3 0.3 0.5 1.4 2
1.9 0.20 0.23 0.25 0.27 0.22 0.3 0.3 0.5 1.4 2
3.0 0.11 0.13 0.14 0.16 0.12 0.3 0.3 0.5 1.4 2
At downstream sample point 4.2 0.03 0.036 0.041 0.046 0.033 0.3 0.3 0.5 1.4 2
1.17 -0.08 -0.09 -0.10 -0.11 -0.09
% deterioration from Baseline: 20.00 36.67 53.33
0.3 0.6 1.1 2.5 4.5
Name Distance (km) Baseline 2021 predicted impact2026 predicted impact2032 predicted impact10% Deterioration ThresholdHigh Status Good Status Moderate StatusPoor Status Bad Status
Upstream Sample Point 0 0.07 0.067 0.067 0.067 0.07 0.3 0.3 0.5 1.4 2
Upstream of WwTW 1.6 0.062 0.062 0.062 0.062 0.062 0.3 0.3 0.5 1.4 2
Downstream of WwTW 1.8 0.081 0.084 0.085 0.086 0.0891 0.3 0.3 0.5 1.4 2
2.9 0.08 0.08 0.08 0.08 0.09 0.3 0.3 0.5 1.4 2
4.9 0.08 0.08 0.08 0.08 0.08 0.3 0.3 0.5 1.4 2
At downstream sample point 5.0 0.072 0.074 0.074 0.075 0.0792 0.3 0.3 0.5 1.4 2
1.07 0.00 0.00 0.00 0.00 0.00
% deterioration from Baseline: 2.8 2.8 4.2
0.3 0.6 1.1 2.5 4.5
Name Distance (km) Baseline 2021 predicted impact2026 predicted impact2032 predicted impact10% Deterioration ThresholdHigh Status Good Status Moderate StatusPoor Status Bad Status
Upstream Sample Point 0 0.0145 0.0145 0.0145 0.0145 0.01 0.3 0.3 0.5 1.4 2
2.7 0.0134 0.0134 0.0134 0.0134 0.0134 0.3 0.3 0.5 1.4 2
Upstream of WwTW 2.9 0.0123 0.0123 0.0123 0.0123 0.0123 0.3 0.3 0.5 1.4 2
Downstream of WwTW 3.0 0.53 0.55 0.55 0.56 0.583 0.3 0.3 0.5 1.4 2
At downstream sample point 3.1 0.52 0.54 0.54 0.55 0.572 0.3 0.3 0.5 1.4 2
1.450 0.00 0.00 0.00 0.00 0.00
% deterioration from Baseline: 3.8 3.8 5.8
0.3 0.6 1.1 2.5 4.5
Name Distance (km) Baseline 2021 predicted impact2026 predicted impact2032 predicted impact10% Deterioration ThresholdHigh Status Good Status Moderate StatusPoor Status Bad Status
Upstream Sample Point 0 0.067 0.068 0.068 0.069 0.07 0.3 0.3 0.5 1.4 2
Upstream of WwTW 0.2 0.073 0.074 0.075 0.075 0.07 0.3 0.3 0.5 1.4 2
Downstream of WwTW 0.4 0.143 0.148 0.151 0.153 0.1573 0.3 0.3 0.5 1.4 2
0.9 0.1515 0.1565 0.1595 0.1610 0.1667 0.3 0.3 0.5 1.4 2
At downstream sample point 1.3 0.160 0.165 0.168 0.169 0.176 0.3 0.3 0.5 1.4 2
0.45 0.01 0.01 0.01 0.01 0.01
% deterioration from Baseline: 3.1 5.0 5.6
0.3 0.6 1.1 2.5 4.5
Name Distance (km) Baseline 2021 predicted impact2026 predicted impact2032 predicted impact10% Deterioration ThresholdHigh Status Good Status Moderate StatusPoor Status Bad Status
Upstream Sample Point 0.0 0.030 0.040 0.046 0.055 0.0300 0.3 0.3 0.5 1.4 2
1.7 0.022 0.027 0.030 0.035 0.0215 0.3 0.3 0.5 1.4 2
Upstream of WwTW 3.3 0.013 0.013 0.013 0.014 0.0130 0.3 0.3 0.5 1.4 2
Downstream of WwTW 3.5 0.169 0.166 0.163 0.160 0.1859 0.3 0.3 0.5 1.4 2
5.5 0.092 0.090 0.089 0.087 0.1007 0.3 0.3 0.5 1.4 2
At downstream sample point 7.4 0.014 0.014 0.014 0.014 0.0154 0.3 0.3 0.5 1.4 2
1.95 -0.009 -0.014 -0.017 -0.021 -0.0085
1.65 -0.078 -0.076 -0.075 -0.073 -0.0853
% deterioration from Baseline: 0.00 0.00 0.00 0.3 0.6 1.1 2.5 4.5
Name Baseline 2021 predicted impact2026 predicted impact2032 predicted impact10% Deterioration ThresholdHigh Status Good Status Moderate StatusPoor Status Bad Status
Upstream Sample Point Distance (km) 0.016 0.016 0.016 0.016 0.0157 0.3 0.3 0.5 1.4 2
0.0 0.05 0.05 0.05 0.05 0.05 0.3 0.3 0.5 1.4 2
Upstream of WwTW 2.5 0.083 0.083 0.083 0.083 0.0830 0.3 0.3 0.5 1.4 2
Downstream of WwTW 5.0 0.270 0.280 0.280 0.280 0.2970 0.3 0.3 0.5 1.4 2
At downstream sample point 5.2 0.250 0.260 0.260 0.260 0.2750 0.3 0.3 0.5 1.4 2
5.8 0.03 0.03 0.03 0.03 0.03
% deterioration from Baseline: 2.5 4.00 4.00 4.00
0.3 0.6 1.1 2.5 4.5
Name Distance (km) Baseline 2021 predicted impact2026 predicted impact2032 predicted impact10% Deterioration ThresholdHigh Status Good Status Moderate StatusPoor Status Bad Status
Upstream Sample Point 0.3 0.3 0.5 1.4 2
Upstream of WwTW 0.3 0.3 0.5 1.4 2
Downstream of WwTW NOT RUN THROUGH SIMCAT SO NO GRAPHS BEING PRODUCED 0.3 0.3 0.5 1.4 2
At downstream sample point 0.3 0.3 0.5 1.4 2
Chiddingfold wwtw
Cranleigh STW
Elstead STW
Farnham STW
Godalming STW
Shamley Green STW
Haslemere STW
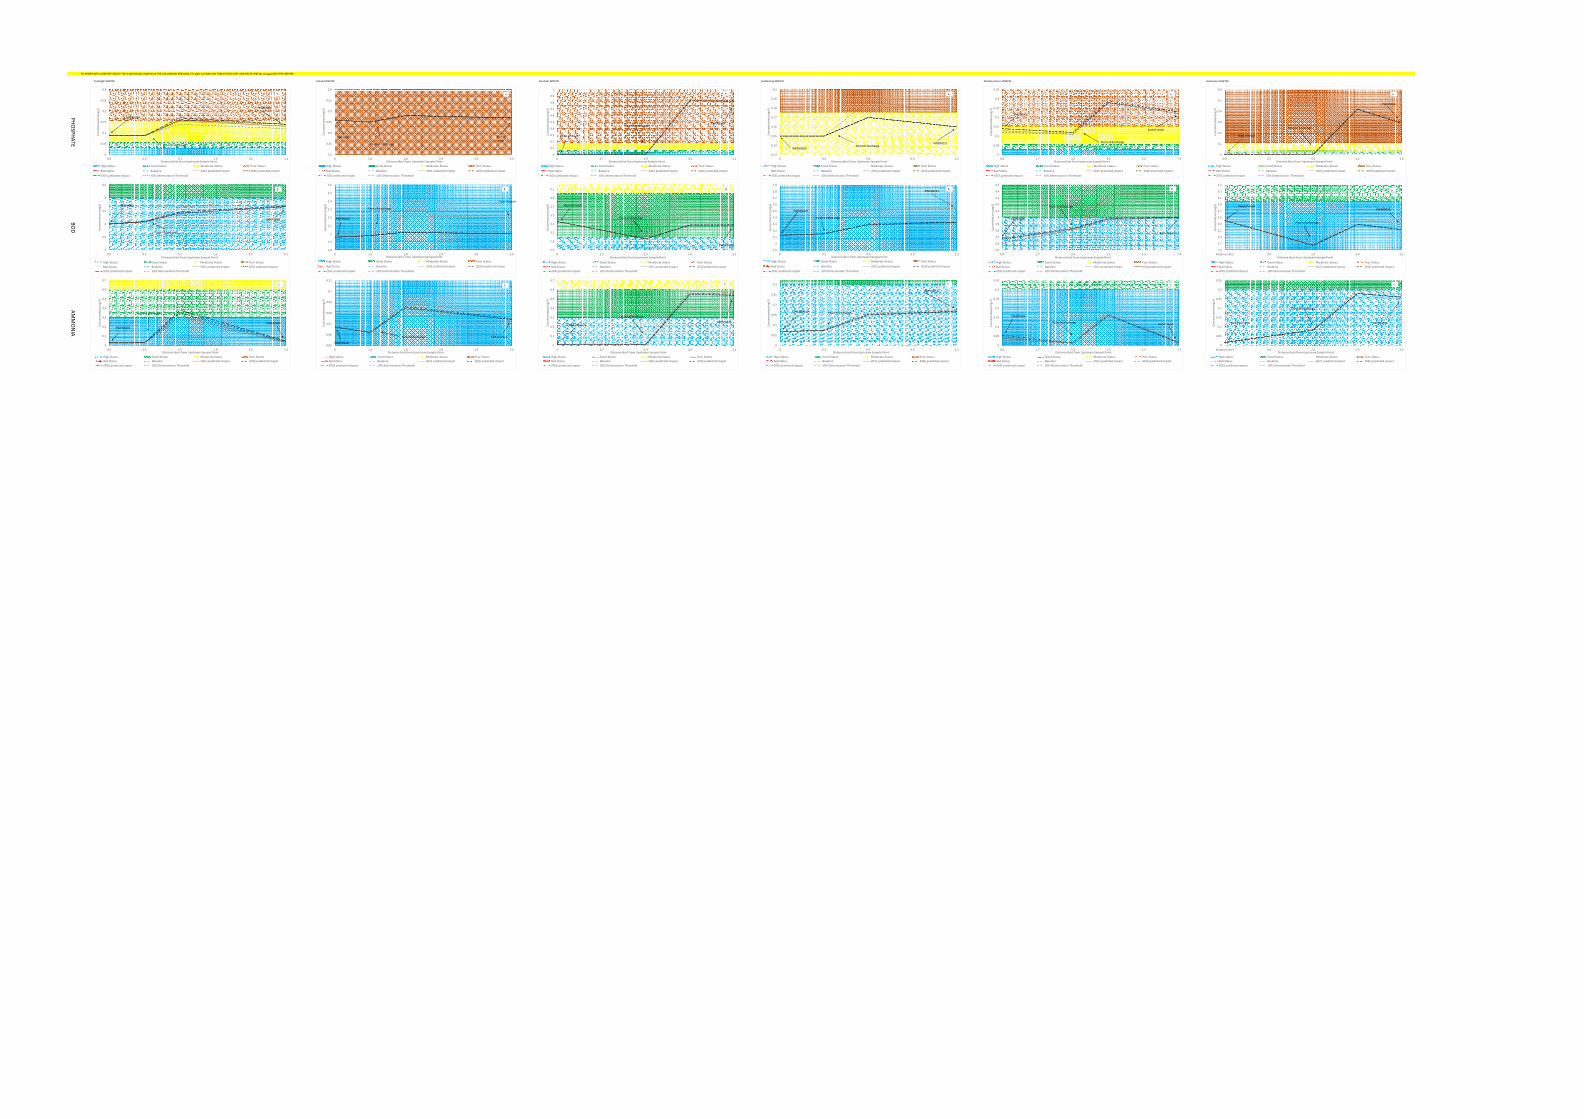
TO INSERT INTO A REPORT SELECT THE 3 INDIVIDUAL GRAPHS IN THE COLUMN (BY PRESSING CTL AND CLICKING ON THEM) THEN COPY AND PASTE SPECIAL (image) INTO THE REPORT.
Cranleigh WWTW Elstead WWTW Farnham WWTW Godalming WWTW Shamley Green WWTW Haslemere WWTW
PH
OS
PH
AT
EB
OD
AM
MO
NIA
0
0.05
0.1
0.15
0.2
0.25
0.3
0 0.2 0.4 0.9 1.3
Co
nce
ntr
ati
on
(m
g/l
)
Distance (km) from Upstream Sample Point
High Status Good Status Moderate Status Poor Status
Bad Status Baseline 2021 predicted impact 2026 predicted impact
2032 predicted impact 10% Deterioration Threshold
Point of discharge
C
0.3
0.35
0.4
0.45
0.5
0.55
0.6
0 1.6 1.8 2.9 4.9 5.0
Co
nce
ntr
ati
on
(m
g/l
)
Distance (km) from Upstream Sample Point
High Status Good Status Moderate Status Poor Status
Bad Status Baseline 2021 predicted impact 2026 predicted impact
2032 predicted impact 10% Deterioration Threshold
Point of discharge
PWER0110
0
0.05
0.1
0.15
0.2
0.25
0.3
0.0 0.5 0.7 1.9 3.0 4.2
Co
nce
ntr
ati
on
(m
g/l
)
Distance (km) from Upstream Sample Point
High Status Good Status Moderate Status Poor Status
Bad Status Baseline 2021 predicted impact 2026 predicted impact
2032 predicted impact 10% Deterioration Threshold
Point of discharge
PWER0004
A
2
2.5
3
3.5
4
4.5
0.0 0.5 0.7 1.9 3.0 4.2
Co
nce
ntr
ati
on
(m
g/l
)
Distance (km) from Upstream Sample Point
High Status Good Status Moderate Status Poor Status
Bad Status Baseline 2021 predicted impact 2026 predicted impact
2032 predicted impact 10% Deterioration Threshold
Point of discharge
PWER0004
B
0
0.1
0.2
0.3
0.4
0.5
0.6
0.7
0.0 0.5 0.7 1.9 3.0 4.2
Co
nce
ntr
ati
on
(m
g/l
)
Distance (km) from Upstream Sample Point
High Status Good Status Moderate Status Poor Status
Bad Status Baseline 2021 predicted impact 2026 predicted impact
2032 predicted impact 10% Deterioration Threshold
Point of discharge
PWER0004
C
PWER0006
End of
reach
1.8
1.9
2
2.1
2.2
2.3
2.4
2.5
2.6
0 1.6 1.8 2.9 4.9 5.0
Co
nce
ntr
ati
on
(m
g/l
)
Distance (km) from Upstream Sample Point
High Status Good Status Moderate Status Poor Status
Bad Status Baseline 2021 predicted impact 2026 predicted impact
2032 predicted impact 10% Deterioration Threshold
Point of discharge
PWER0110
B
End of reach
0.05
0.06
0.07
0.08
0.09
0.1
0.11
0 1.6 1.8 2.9 4.9 5.0
Co
nce
ntr
ati
on
(m
g/l
)
Distance (km) from Upstream Sample Point
High Status Good Status Moderate Status Poor Status
Bad Status Baseline 2021 predicted impact 2026 predicted impact
2032 predicted impact 10% Deterioration Threshold
Point of discharge End of reach
C
0
0.1
0.2
0.3
0.4
0.5
0.6
0.7
0.8
0.9
1
0 2.7 2.9 3.0 3.1
Co
nce
ntr
ati
on
(m
g/l
)
Distance (km) from Upstream Sample Point
High Status Good Status Moderate Status Poor Status
Bad Status Baseline 2021 predicted impact 2026 predicted impact
2032 predicted impact 10% Deterioration Threshold
Point of discharge
Head of reach
PWER0126
A
2.7
2.9
3.1
3.3
3.5
3.7
3.9
4.1
0 2.7 2.9 3.0 3.1
Co
nce
ntr
ati
on
(m
g/l
)
Distance (km) from Upstream Sample Point
High Status Good Status Moderate Status Poor Status
Bad Status Baseline 2021 predicted impact 2026 predicted impact
2032 predicted impact 10% Deterioration Threshold
Point of discharge
B
Head of reach
0
0.1
0.2
0.3
0.4
0.5
0.6
0.7
0 2.7 2.9 3.0 3.1
Co
nce
ntr
ati
on
(m
g/l
)
Distance (km) from Upstream Sample Point
High Status Good Status Moderate Status Poor Status
Bad Status Baseline 2021 predicted impact 2026 predicted impact
2032 predicted impact 10% Deterioration Threshold
Point of discharge
C
Head of reach
PWER0126
PWER0126
0.13
0.14
0.15
0.16
0.17
0.18
0.19
0.2
0 0.2 0.4 0.9 1.3
Co
nce
ntr
ati
on
(m
g/l
)
Distance (km) from Upstream Sample Point
High Status Good Status Moderate Status Poor Status
Bad Status Baseline 2021 predicted impact 2026 predicted impact
2032 predicted impact 10% Deterioration Threshold
Point of dischargePWER0029
A
1.9
2
2.1
2.2
2.3
2.4
2.5
2.6
2.7
2.8
2.9
0 0.2 0.4 0.9 1.3
Co
nce
ntr
ati
on
(m
g/l
)
Distance (km) from Upstream Sample Point
High Status Good Status Moderate Status Poor Status
Bad Status Baseline 2021 predicted impact 2026 predicted impact
2032 predicted impact 10% Deterioration Threshold
Point of discharge
BPWER0151
PWER0151
PWER0151
0
0.05
0.1
0.15
0.2
0.25
0.3
0.35
0.0 1.7 3.3 3.5 5.5 7.4
Co
nce
ntr
ati
on
(m
g/l
)
Distance (km) from Upstream Sample Point
High Status Good Status Moderate Status Poor Status
Bad Status Baseline 2021 predicted impact 2026 predicted impact
2032 predicted impact 10% Deterioration Threshold
Point of discharge
PWER0006
A
End of reach
3.5
3.6
3.7
3.8
3.9
4
4.1
4.2
4.3
4.4
4.5
0.0 1.7 3.3 3.5 5.5 7.4
Co
nce
ntr
ati
on
(m
g/l
)
Distance (km) from Upstream Sample Point
High Status Good Status Moderate Status Poor Status
Bad Status Baseline 2021 predicted impact 2026 predicted impact
2032 predicted impact 10% Deterioration Threshold
Point of discharge
B
0
0.05
0.1
0.15
0.2
0.25
0.3
0.35
0.0 1.7 3.3 3.5 5.5 7.4
Co
nce
ntr
ati
on
(m
g/l
)
Distance (km) from Upstream Sample Point
High Status Good Status Moderate Status Poor Status
Bad Status Baseline 2021 predicted impact 2026 predicted impact
2032 predicted impact 10% Deterioration Threshold
Point of discharge
C
End of reach
End of reach
PWER0006
PWER0006
0
0.1
0.2
0.3
0.4
0.5
0.6
0.0 2.5 5.0 5.2 5.8
Co
nce
ntr
ati
on
(m
g/l
)
Distance (km) from Upstream Sample Point
High Status Good Status Moderate Status Poor Status
Bad Status Baseline 2021 predicted impact 2026 predicted impact
2032 predicted impact 10% Deterioration Threshold
Point of discharge
A
Head of reach
PWER0026
1.5
1.7
1.9
2.1
2.3
2.5
2.7
2.9
3.1
3.3
3.5
Distance (km) 0.0 2.5 5.0 5.2
Co
nce
ntr
ati
on
(m
g/l
)
Distance (km) from Upstream Sample Point
High Status Good Status Moderate Status Poor Status
Bad Status Baseline 2021 predicted impact 2026 predicted impact
2032 predicted impact 10% Deterioration Threshold
Point of discharge
B
PWER0026Head of reach
0
0.05
0.1
0.15
0.2
0.25
0.3
0.35
Distance (km) 0.0 2.5 5.0 5.2
Co
nce
ntr
ati
on
(m
g/l
)
Distance (km) from Upstream Sample Point
High Status Good Status Moderate Status Poor Status
Bad Status Baseline 2021 predicted impact 2026 predicted impact
2032 predicted impact 10% Deterioration Threshold
Point of discharge
C
PWER0026Head of reach
PWER0006
PWER0006
PWER0110
PWER0029
PWER0029
A
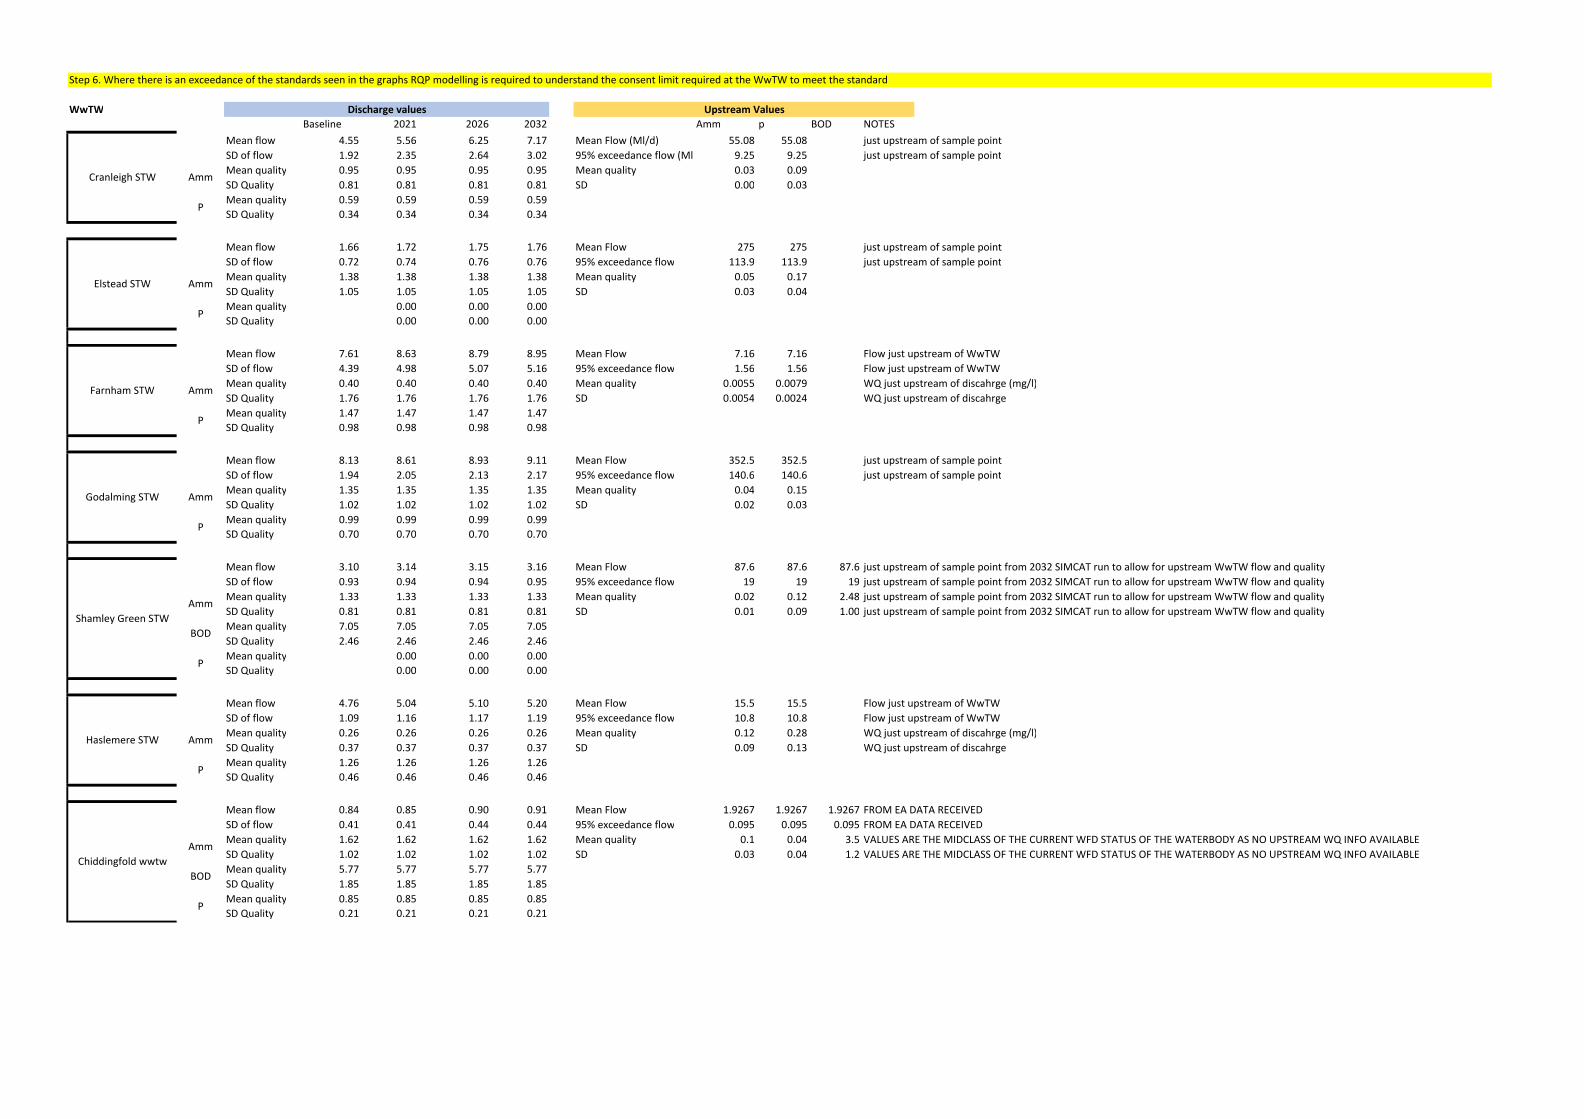
Step 6. Where there is an exceedance of the standards seen in the graphs RQP modelling is required to understand the consent limit required at the WwTW to meet the standards
WwTW
Baseline 2021 2026 2032 Amm p BOD NOTES
Mean flow 4.55 5.56 6.25 7.17 Mean Flow (Ml/d) 55.08 55.08 just upstream of sample point
SD of flow 1.92 2.35 2.64 3.02 95% exceedance flow (Ml/d) 9.25 9.25 just upstream of sample point
Mean quality 0.95 0.95 0.95 0.95 Mean quality 0.03 0.09
SD Quality 0.81 0.81 0.81 0.81 SD 0.00 0.03
Mean quality 0.59 0.59 0.59 0.59
SD Quality 0.34 0.34 0.34 0.34
Mean flow 1.66 1.72 1.75 1.76 Mean Flow 275 275 just upstream of sample point
SD of flow 0.72 0.74 0.76 0.76 95% exceedance flow 113.9 113.9 just upstream of sample point
Mean quality 1.38 1.38 1.38 1.38 Mean quality 0.05 0.17
SD Quality 1.05 1.05 1.05 1.05 SD 0.03 0.04
Mean quality 0.00 0.00 0.00
SD Quality 0.00 0.00 0.00
Mean flow 7.61 8.63 8.79 8.95 Mean Flow 7.16 7.16 Flow just upstream of WwTW
SD of flow 4.39 4.98 5.07 5.16 95% exceedance flow 1.56 1.56 Flow just upstream of WwTW
Mean quality 0.40 0.40 0.40 0.40 Mean quality 0.0055 0.0079 WQ just upstream of discahrge (mg/l)
SD Quality 1.76 1.76 1.76 1.76 SD 0.0054 0.0024 WQ just upstream of discahrge
Mean quality 1.47 1.47 1.47 1.47
SD Quality 0.98 0.98 0.98 0.98
Mean flow 8.13 8.61 8.93 9.11 Mean Flow 352.5 352.5 just upstream of sample point
SD of flow 1.94 2.05 2.13 2.17 95% exceedance flow 140.6 140.6 just upstream of sample point
Mean quality 1.35 1.35 1.35 1.35 Mean quality 0.04 0.15
SD Quality 1.02 1.02 1.02 1.02 SD 0.02 0.03
Mean quality 0.99 0.99 0.99 0.99
SD Quality 0.70 0.70 0.70 0.70
Mean flow 3.10 3.14 3.15 3.16 Mean Flow 87.6 87.6 87.6 just upstream of sample point from 2032 SIMCAT run to allow for upstream WwTW flow and quality
SD of flow 0.93 0.94 0.94 0.95 95% exceedance flow 19 19 19 just upstream of sample point from 2032 SIMCAT run to allow for upstream WwTW flow and quality
Mean quality 1.33 1.33 1.33 1.33 Mean quality 0.02 0.12 2.48 just upstream of sample point from 2032 SIMCAT run to allow for upstream WwTW flow and quality
SD Quality 0.81 0.81 0.81 0.81 SD 0.01 0.09 1.00 just upstream of sample point from 2032 SIMCAT run to allow for upstream WwTW flow and quality
Mean quality 7.05 7.05 7.05 7.05
SD Quality 2.46 2.46 2.46 2.46
Mean quality 0.00 0.00 0.00
SD Quality 0.00 0.00 0.00
Mean flow 4.76 5.04 5.10 5.20 Mean Flow 15.5 15.5 Flow just upstream of WwTW
SD of flow 1.09 1.16 1.17 1.19 95% exceedance flow 10.8 10.8 Flow just upstream of WwTW
Mean quality 0.26 0.26 0.26 0.26 Mean quality 0.12 0.28 WQ just upstream of discahrge (mg/l)
SD Quality 0.37 0.37 0.37 0.37 SD 0.09 0.13 WQ just upstream of discahrge
Mean quality 1.26 1.26 1.26 1.26
SD Quality 0.46 0.46 0.46 0.46
Mean flow 0.84 0.85 0.90 0.91 Mean Flow 1.9267 1.9267 1.9267 FROM EA DATA RECEIVED
SD of flow 0.41 0.41 0.44 0.44 95% exceedance flow 0.095 0.095 0.095 FROM EA DATA RECEIVED
Mean quality 1.62 1.62 1.62 1.62 Mean quality 0.1 0.04 3.5 VALUES ARE THE MIDCLASS OF THE CURRENT WFD STATUS OF THE WATERBODY AS NO UPSTREAM WQ INFO AVAILABLE
SD Quality 1.02 1.02 1.02 1.02 SD 0.03 0.04 1.2 VALUES ARE THE MIDCLASS OF THE CURRENT WFD STATUS OF THE WATERBODY AS NO UPSTREAM WQ INFO AVAILABLE
Mean quality 5.77 5.77 5.77 5.77
SD Quality 1.85 1.85 1.85 1.85
Mean quality 0.85 0.85 0.85 0.85
SD Quality 0.21 0.21 0.21 0.21P
Shamley Green STW
Haslemere STW
Chiddingfold wwtw
P
AmmGodalming STW
P
Amm
P
Amm
P
Amm
BOD
BOD
Upstream ValuesDischarge values
Cranleigh STW
Elstead STW
Farnham STW
Amm
Amm
P
Amm
P
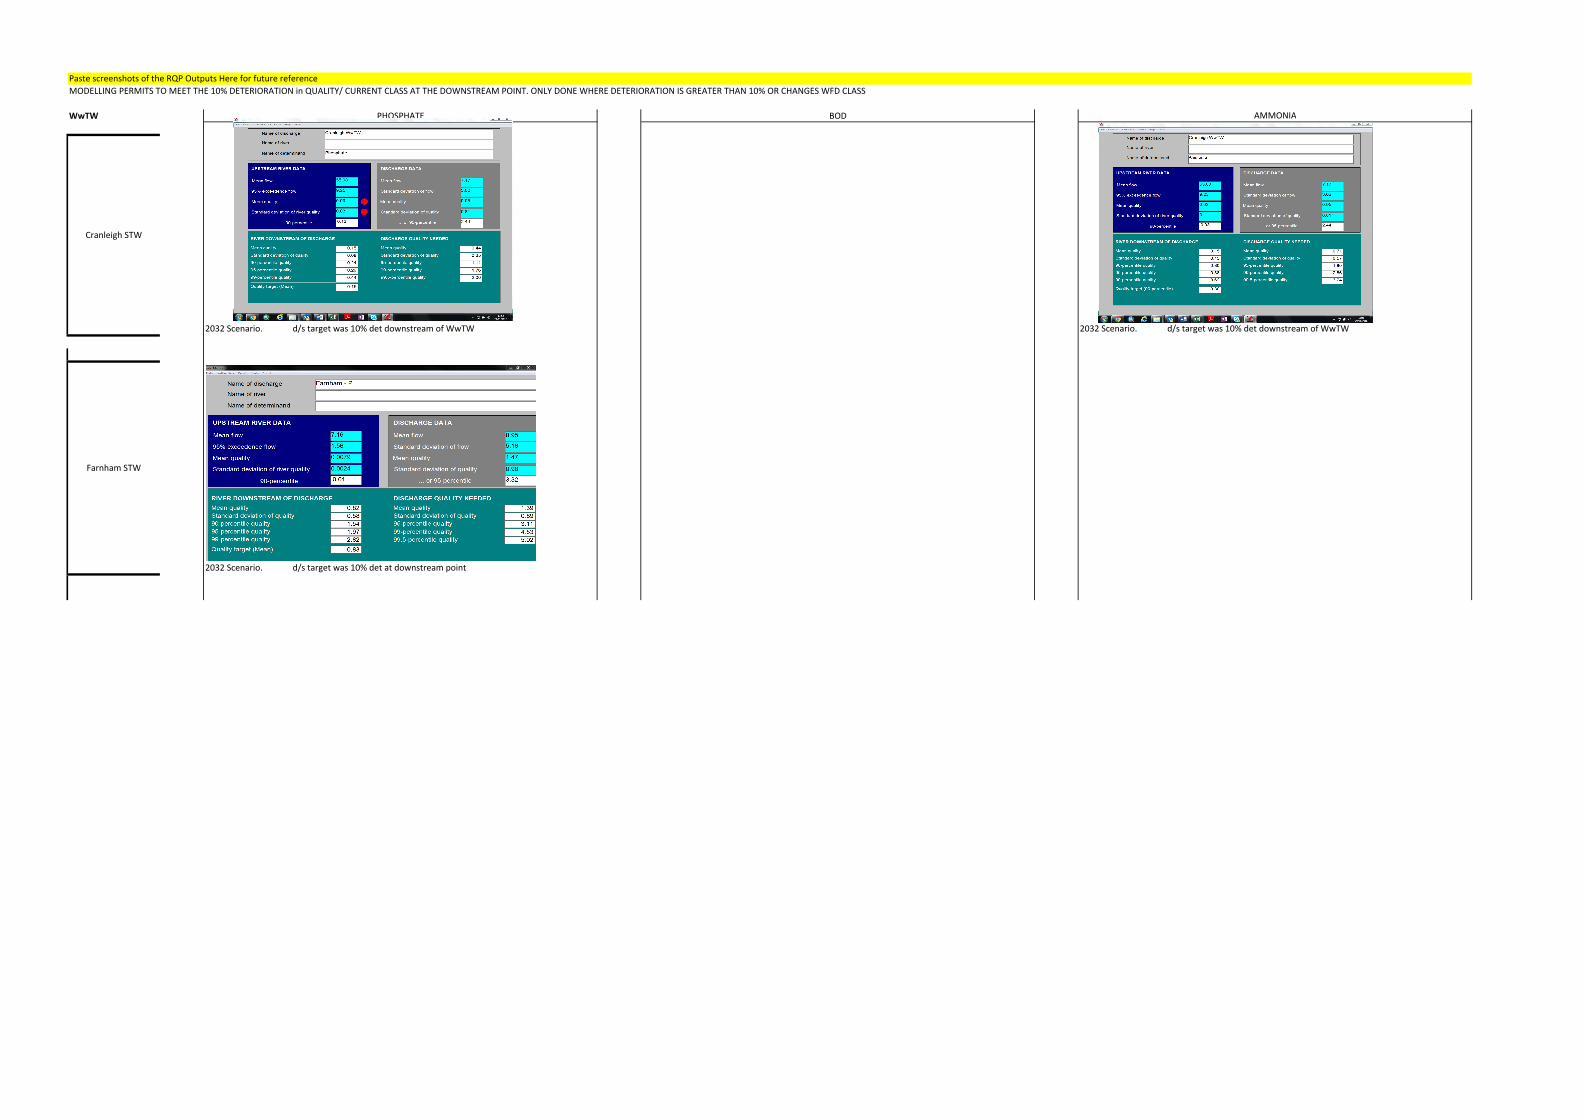
Paste screenshots of the RQP Outputs Here for future reference
MODELLING PERMITS TO MEET THE 10% DETERIORATION in QUALITY/ CURRENT CLASS AT THE DOWNSTREAM POINT. ONLY DONE WHERE DETERIORATION IS GREATER THAN 10% OR CHANGES WFD CLASS
WwTW
2032 Scenario. d/s target was 10% det downstream of WwTW 2032 Scenario. d/s target was 10% det downstream of WwTW
2032 Scenario. d/s target was 10% det at downstream point
PHOSPHATE BOD AMMONIA
Cranleigh STW
Farnham STW
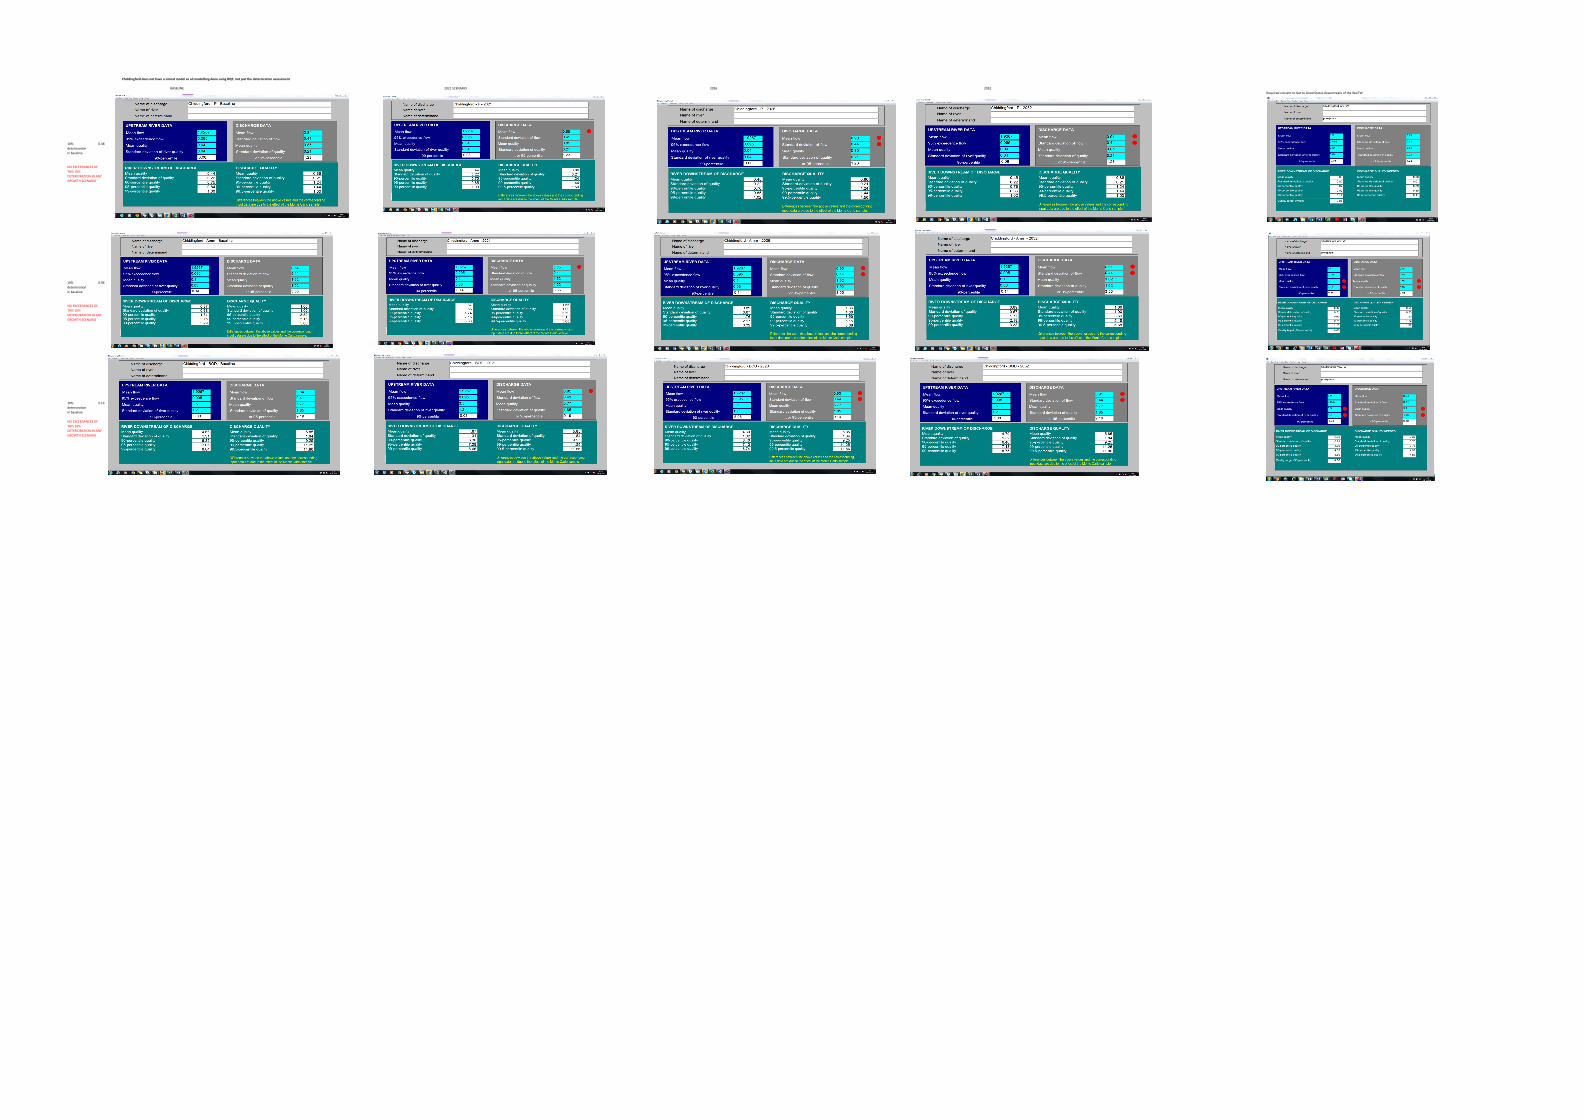
Chiddingford does not have a simcat model so all modellling done using RQP, not just the deterioration assessment
BASELINE 2021 SCENARIO 2026 2032
Required consent to Get to Good Status downstream of the WwTW
0.48
0.96
5.13
NO EXCEEDANCES OF
THIS 10%
DETERIORATION IN ANY
GROWTH SCENARIO
10%
deterioration
in baseline
10%
deterioration
in baseline
10%
deterioration
in baseline
NO EXCEEDANCES OF
THIS 10%
DETERIORATION IN ANY
GROWTH SCENARIO
NO EXCEEDANCES OF
THIS 10%
DETERIORATION IN ANY
GROWTH SCENARIO