Embed Size (px)
Citation preview

32102902/EIAR/2B
Appendix A3.1 Assessment of Domestic and Non-Domestic Load of Proposed Regional Wastewater Treatment Plant
Environmental Impact Assessment Report: Volume 2
Part B of 6: Appendices

Greater Dublin Drainage
Irish Water
Assessment of Domestic & Non-Domestic Load on Proposed Regional
WwTP
32102902 – 2B – A3.1
December 2017
Assessment of Domestic & Non-Domestic Load on
Proposed Regional WwTP
32102902_01 ii
Contents
1. Introduction ................................................................................................................................................ 1
1.1 Title .............................................................................................................................................................. 1
1.2 Client............................................................................................................................................................ 1
1.3 Previous Reference Studies ........................................................................................................................ 1
1.4 Project Stages ............................................................................................................................................. 1
1.5 Objectives .................................................................................................................................................... 2
1.6 Commencement Date .................................................................................................................................. 2
2. Background and Purpose of Report ........................................................................................................ 3
2.1 Introduction .................................................................................................................................................. 3
2.1.1 GDSDS – Assessment of Future Growth .................................................................................................... 3
2.2 Purpose of this Report ................................................................................................................................. 5
2.3 Study Area ................................................................................................................................................... 6
2.4 Contributing Catchment to Ringsend WwTP ............................................................................................... 6
2.5 Potential Contributing Catchment to Regional WwTP ................................................................................. 6
3. Existing Population and Future Growth Rates ....................................................................................... 8
3.1 Current Population within the GDA ............................................................................................................. 8
3.2 Historic Population Trends within the GDA ................................................................................................. 9
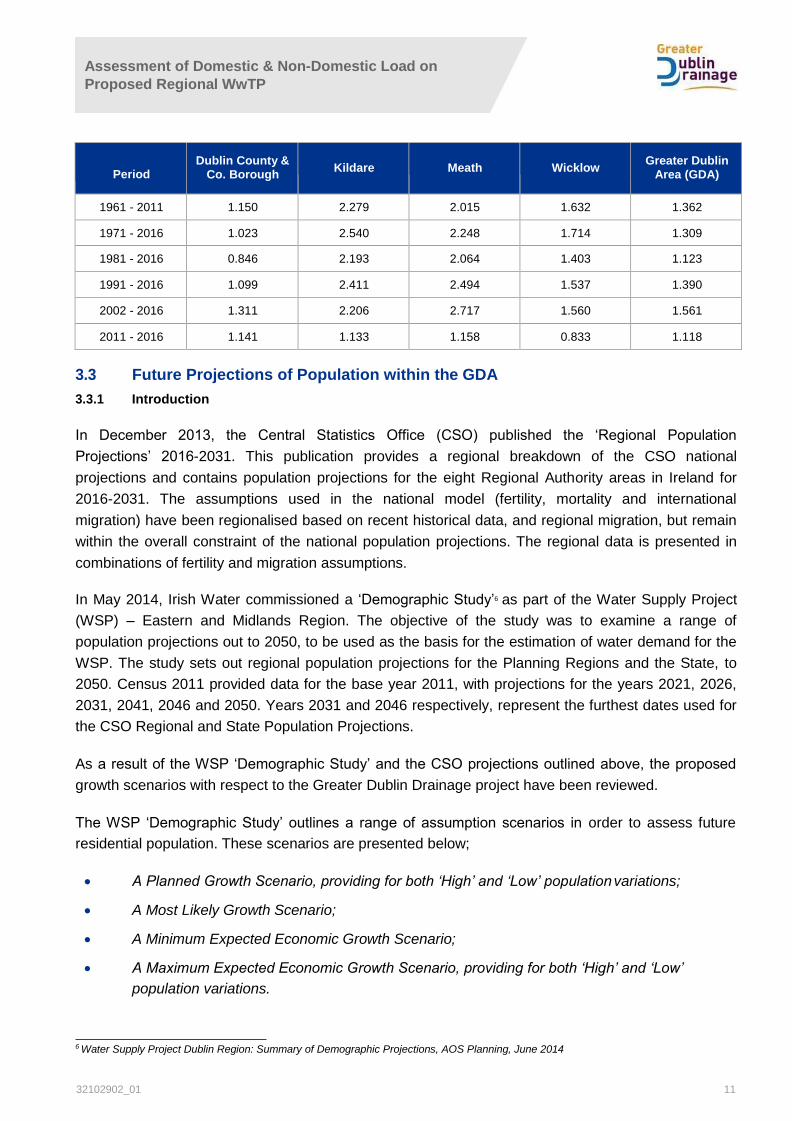
3.2.1 Historic Average Annual Growth Rates ..................................................................................................... 10
3.3 Future Projections of Population within the GDA ...................................................................................... 11
3.3.1 Introduction ................................................................................................................................................ 11
4. Existing and Future Industrial, Commercial & Institutional Load ...................................................... 15
4.1 Industrial Loadings .................................................................................................................................... 15
4.1.1 Existing Industrial Loadings ....................................................................................................................... 15
4.1.2 Future Industrial Loadings ......................................................................................................................... 15
4.2 Commercial & Institutional Loadings ......................................................................................................... 15
4.2.1 Future Commercial & Institutional Loadings .............................................................................................. 15
5. Analysis of Ringsend Catchment .......................................................................................................... 16
5.1 Existing Load on Ringsend WwTP ............................................................................................................ 16
5.2 Residential Population in Ringsend Catchment ........................................................................................ 16
5.2.1 Existing Population .................................................................................................................................... 16
5.2.2 Future Population ...................................................................................................................................... 16
5.3 Existing Industrial Loadings in the Ringsend WwTP ................................................................................. 16
5.3.1 Future Industrial Loadings in the Ringsend WwTP catchment .................................................................. 17
5.4 Existing Commercial and Institutional Loading in the Ringsend WwTP .................................................... 17
5.4.1 Future Commercial and Institutional Loading in the Ringsend WwTP ...................................................... 17
5.5 Projected Treatment Capacity Requirements at Ringsend ....................................................................... 17
5.6 Appraisal of Ringsend WwTP’s treatment capacity ................................................................................... 18
5.7 Conclusions ............................................................................................................................................... 19
6. Analysis of Existing Regional WwTPs .................................................................................................. 20
6.1 Introduction ................................................................................................................................................ 20
Assessment of Domestic & Non-Domestic Load on
Proposed Regional WwTP
32102902_01 iii
6.2 Malahide WwTP ......................................................................................................................................... 20
6.2.1 Existing Organic Load ............................................................................................................................... 20
6.2.2 Growth in the Malahide WwTP Catchment ................................................................................................ 20
6.2.3 Impact of Future Growth ............................................................................................................................ 20
6.3 Swords WwTP ........................................................................................................................................... 21
6.3.1 Existing Population .................................................................................................................................... 21
6.3.2 Growth in the Swords Catchment .............................................................................................................. 21
6.3.3 Impact of Future Growth ............................................................................................................................ 21
6.4 Lower Liffey Valley (Leixlip WwTP) Catchment ......................................................................................... 22
6.4.1 Existing Population .................................................................................................................................... 22
6.4.2 Growth in the Leixlip Catchment ................................................................................................................ 22
6.4.3 Impact of Future Growth ............................................................................................................................ 22
6.5 Upper Liffey Valley (Osberstown WwTP) Catchment ................................................................................ 23
6.5.1 Existing Population .................................................................................................................................... 23
6.5.2 Growth in Osberstown Catchment ............................................................................................................ 23
6.5.3 Impact of Future Growth ............................................................................................................................ 23
6.6 Summary ................................................................................................................................................... 23
6.7 Conclusions ............................................................................................................................................... 24
7. Analysis of Northern & Western Sub-Catchments .............................................................................. 25
7.1 Introduction ................................................................................................................................................ 25
7.2 Analysis of Projected Treatment Capacity Requirements ......................................................................... 25
7.2.1 Blanchardstown (9C Sewer) Sub-Catchment ........................................................................................... 25
7.2.2 North Dublin (North Fringe Sewer) Sub-Catchment .................................................................................. 26
7.2.3 North Dublin (NDDS Sewer) Sub-Catchment ............................................................................................ 26
7.2.4 South Dublin – Lucan/Clondalkin (9B Sewer) Sub-Catchment ................................................................. 26
7.3 Discussion on Projected Treatment Capacity Requirements .................................................................... 26
7.3.1 Blanchardstown (9C Sewer) Catchment ................................................................................................... 27
7.3.2 North Dublin (North Fringe Sewer) Catchment ......................................................................................... 27
7.3.3 North Dublin (NDDS Sewer) Catchment ................................................................................................... 28
7.3.4 South Dublin – Lucan/Clondalkin (9B Sewer) Catchment ......................................................................... 28
8. Options for Diverting the Northern & Western Sub-Catchments ....................................................... 29
8.1 Introduction ................................................................................................................................................ 29
8.2 Blanchardstown (9C Sewer) Catchment ................................................................................................... 29
8.3 North Fringe Sewer (NFS) Catchment ...................................................................................................... 33
8.4 North Dublin Drainage Scheme (NDDS) Sewer Catchment ..................................................................... 34
8.5 9B (Lucan/ Clondalkin) Sub-Catchment .................................................................................................... 36
9. Conclusions and Recommendations .................................................................................................... 39
9.1 Conclusions ............................................................................................................................................... 39
9.2 Recommendations ..................................................................................................................................... 39
9.3 Projected Utilisation of Treatment Capacity provided at Regional WwTP................................................. 39
9.4 Catchment of the Regional Wastewater Treatment Plant ......................................................................... 40

Assessment of Domestic & Non-Domestic Load on
Proposed Regional WwTP
32102902_01 iv
Appendix A. Loading Analysis on Wastewater Treatment Plants
Appendix B. Drawings

Assessment of Domestic & Non-Domestic Load on
Proposed Regional WwTP
32102902_01 1
1. Introduction
1.1 Title
The official name of the project is Greater Dublin Drainage – Regional Wastewater Treatment Plant,
Marine Outfall & Orbital Drainage System.
1.2 Client
At the commencement of the GDD project in 2011, the 34 local authorities of Ireland were responsible
for providing water and wastewater services and infrastructure in their respective administrative areas
under the Local Government Act 2001. Jacobs Engineering Ireland Ltd. (Jacobs) in association with
TOBIN Consulting Engineers (Tobin) were appointed by Fingal County Council (FCC) (as the
Contracting Authority on behalf of Meath, Kildare, Dun Laoghaire / Rathdown and South Dublin
County Councils and Dublin City Council) in March 2011 to act as Project Engineering Consultant on
this project.
However, under the Water Services (No. 2) Act 2013, the responsibilities of FCC on this project were
transferred to Irish Water/ Uisce Éireann (IW), a subsidiary of Ervia (formerly Bord Gáis Éireann) on
1st January 2014. At that point the existing Jacobs / Tobin contract was novated across to IW who
thereafter became the Project Client.
1.3 Previous Reference Studies
Greater Dublin Strategic Drainage Study (GDSDS) completed in April 2005, and
Strategic Environmental Assessment of the Greater Dublin Strategic Drainage Study (SEA ofGDSDS) completed in May 2008.
1.4 Project Stages
The Project is divided into a number of stages as follows:
Sub – Stage (a): Project Inception
Sub - Stage (b): Alternative WwTP Site Assessment(ASA)/Pipeline and Marine Route
Selection Report
Sub – Stage (c): Concept Design Report
Sub – Stage (d): Environmental Impact Assessment
Sub – Stage (e): Wayleave / Land Acquisition
Sub – Stage (f): Additional Reports
Sub – Stage (g): Planning Process
Sub – Stage (h): Any Other Work
Assessment of Domestic & Non-Domestic Load on
Proposed Regional WwTP
32102902_01 2
1.5 Objectives
The primary project objective is to provide a long-term drainage solution that shall cater for existing &
future development in the Greater Dublin Area (GDA) by implementing the recommendations of the
Greater Dublin Strategic Drainage Study (GDSDS) Final Strategy and the Strategic Environmental
Assessment (SEA) of the GDSDS. This requires an integrated programme of works to provide
sustainable wastewater treatment and sewer network capacity in the region.
The key objectives of the GDD are to safely deliver through the planning process a:
Regional Wastewater Treatment Plant (WwTP) and associated marine outfall located at a
site in the Northern part of the Greater Dublin Area (GDA), and
an orbital sewer, associated pumping stations and outfall pipeline linking the regional WwTP
to the existing regional sewer network and to provide for future connections for identified
developing areas within the catchment.
In April 2013, a review of Fingal’s Sludge Management Plan (SMP) was completed which
recommended that Fingal develop a single Sludge Hub Centre (SHC) to treat all wastewater sludges
arising in Fingal and that this SHC should be co-located with the proposed Regional WwTP.
Irish Water reviewed this proposal as part of its national wastewater sludge management plan1 and
considered it to provide the most appropriate option for a sludge hub in Fingal.
The SHC is an element of the treatment process provided by the proposed WwTP, therefore any
further reference to the WwTP includes the SHC.
1.6 Commencement Date
The official commencement date of the project is set as the 14th March 2011.
1 National Sludge Management Plan, Irish Water; 2016
Assessment of Domestic & Non-Domestic Load on
Proposed Regional WwTP
32102902_01 3
2. Background and Purpose of Report
2.1 Introduction
The Greater Dublin Drainage (GDD) project has its origins in the Greater Dublin Strategic Drainage
Study (GDSDS)2, which was a major region wide strategic study conducted between 2001 and 2005
to examine and report on the medium and long-term urban drainage needs. The GDSDS was
commissioned as a result of the broadening gap between the developing load in the Greater Dublin
Area (GDA) and the maximum load which can be delivered to and treated at the existing Wastewater
Treatment Plants (WwTPs) in the catchment and primarily at Ringsend WwTP. In order to address
this, the GDSDS Final Strategy Report, April 2005, made detailed recommendations on wastewater
infrastructure requirements, which included the optimisation of the capacity of existing WwTPs and
networks for near-term requirements, coupled with the development of new infrastructure to meet
growth in the medium and long-term.
The key findings of the GDSDS were the subject of a Strategic Environmental Assessment (SEA),
which was completed in 2008. The SEA endorsed the fundamental concept and scale of the GDSDS
Final Strategy Report, but cautioned that the site selection needed to take place in a process of
rigorous appraisal of alternatives. The key recommendations of the SEA are as follows:
The upgrade of all wastewater treatment plants (WwTPs) in the region, including Ringsend, to their ultimate capacity;
Construction of a new regional WwTP, associated orbital sewer and marine outfall in the northern part of the Greater Dublin Area (GDA);
Completion of a rigorous 4-stage ‘Alternative Sites Assessment Study’ to determine the
preferred location for the Regional WwTP;
The associated orbital sewer and marine outfall route to be defined; and
A suite of mitigation measures and a Monitoring Programme to be undertaken during theconstruction and operation of the project.
In the absence of the implementation of the above proposed drainage strategy the SEA considered
that inadequate wastewater treatment and drainage management would result in development
constraints within the area covered by the strategy. Thus, Local Authorities (LAs) would be inhibited
from effectively implementing their respective County and City Development Plans.
2.1.1 GDSDS – Assessment of Future Growth
In the preparation of the GDSDS Final Strategy Report a Population and Land Use Study was carried
out to determine land usage and planning requirements within the study area so that the capability of
existing drainage infrastructure could be assessed against projected future flows and loads. The final
report of this Population and Land Use study was published in March 20033. This report estimated
the future wastewater treatment requirements, defined on a WwTP catchment basis rather than
2 The GDSDS was proposed by the Dublin Region Local Authorities in the Greater Dublin Area and was supported by the Department of the Environment, Heritage and Local Government. Dublin City Council was appointed as the contracting authority for the study which was conducted by the Dublin Drainage Consultancy.
3 GDSDS – Population and Land Use – Final Report, March 2003 (Ref.GDSDS/NE02057/094v2)
Assessment of Domestic & Non-Domestic Load on
Proposed Regional WwTP
32102902_01 4
administrative boundaries within the GDA for three design scenarios: 2002, 2011 and 2031, with a
view to using these projections as the basis for determining the extent of additional wastewater
infrastructure required to meet this future demand.
The first scenario (2002) represented the then baseline or existing situation. The second (2011)
corresponded to the planning horizon of the Strategic Planning Guidelines at that time. The third
(2031) represented a long-term horizon appropriate for the planning of major strategic infrastructure.
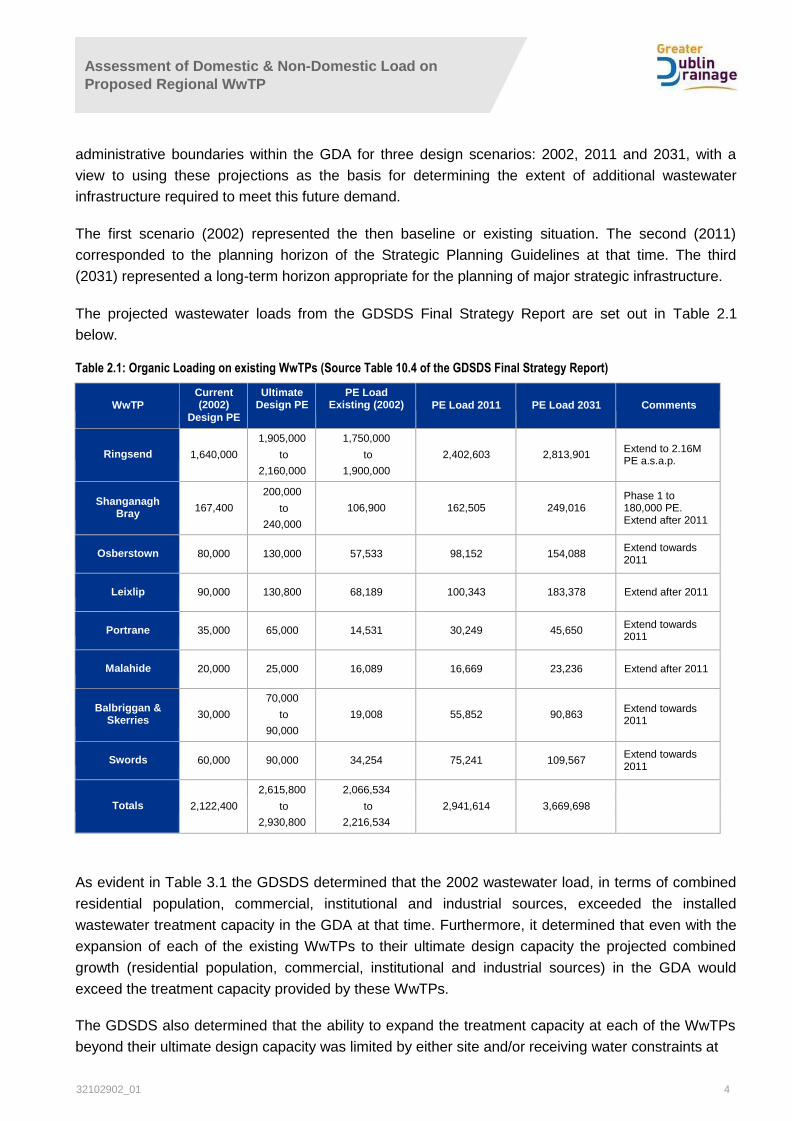
The projected wastewater loads from the GDSDS Final Strategy Report are set out in Table 2.1
below.
Table 2.1: Organic Loading on existing WwTPs (Source Table 10.4 of the GDSDS Final Strategy Report)
WwTP
Current (2002)
Design PE
Ultimate Design PE
PE Load Existing (2002)
PE Load 2011
PE Load 2031
Comments
Ringsend
1,640,000
1,905,000
to
2,160,000
1,750,000
to
1,900,000
2,402,603
2,813,901
Extend to 2.16M PE a.s.a.p.
Shanganagh
Bray
167,400
200,000
to
240,000
106,900
162,505
249,016
Phase 1 to 180,000 PE. Extend after 2011
Osberstown
80,000
130,000
57,533
98,152
154,088 Extend towards 2011
Leixlip
90,000
130,800
68,189
100,343
183,378
Extend after 2011
Portrane
35,000
65,000
14,531
30,249
45,650 Extend towards 2011
Malahide
20,000
25,000
16,089
16,669
23,236
Extend after 2011
Balbriggan &
Skerries
30,000
70,000
to
90,000
19,008
55,852
90,863
Extend towards 2011
Swords
60,000
90,000
34,254
75,241
109,567 Extend towards 2011
Totals
2,122,400
2,615,800 2,066,534 2,941,614
3,669,698
to to
2,930,800 2,216,534
As evident in Table 3.1 the GDSDS determined that the 2002 wastewater load, in terms of combined
residential population, commercial, institutional and industrial sources, exceeded the installed
wastewater treatment capacity in the GDA at that time. Furthermore, it determined that even with the
expansion of each of the existing WwTPs to their ultimate design capacity the projected combined
growth (residential population, commercial, institutional and industrial sources) in the GDA would
exceed the treatment capacity provided by these WwTPs.
The GDSDS also determined that the ability to expand the treatment capacity at each of the WwTPs
beyond their ultimate design capacity was limited by either site and/or receiving water constraints at
Assessment of Domestic & Non-Domestic Load on
Proposed Regional WwTP
32102902_01 5
each WwTP. It also found that there was limited capacity in the existing drainage networks to accept
flows from future development, noting significant overloading of sewers, deficiencies at combined
sewer overflows and increased risk of sewer flooding throughout the network. Constraints on further
upgrade works to address these capacity issues, particularly in the network serving Ringsend,
included the intensity of urban development, associated utilities and traffic. Considering the scale of
the network upgrade work required GDSDS described them as representing:
“a major engineering challenge, particularly where large diameter pipelines have to be constructed in roadways
already saturated with utility services and traffic. Even with tunnel construction, the accommodation of shafts
and protection of existing works, traffic management and general management of environmental impacts would
be extremely difficult.”
The GDSDS therefore determined that the optimum solution to the above treatment and network
capacity deficits was to provide new wastewater treatment capacity in north County Dublin.
The proposed new wastewater treatment plant would primarily augment the treatment capacity
provided at Ringsend WwTP through the diversion of flow and load out of the Ringsend catchment to
the new WwTP thereby freeing up capacity at Ringsend WwTP and in its contributing network.
Furthermore, the proposed new WwTP would also augment other WwTPs in the GDA through
diversion of flow & load in excess of their ultimate treatment capacity to the proposed new WwTP.
2.2 Purpose of this Report
The strategies proposed by GDSDS to meet the GDA drainage infrastructural requirements, at the
2011 and 2031 design horizons adopted in that Study, were predicated on population projections
base-lined on the 2002 Census, with non-domestic and trade effluent data built up from
considerations of sub-catchment planning potential. The detailed Population and Land Use Study,
undertaken as part of the GDSDS and reported on in March 20034 did not foresee the large inward
migration that occurred, post 2004, following expansion of the EU nor did it foresee the extent of
emigration that occurred during the economic recession between 2008 - 2013. It is clear that the
economic landscape has altered markedly since the GDSDS Population and Land Use Study was
undertaken. It is therefore prudent to re-examine population and load projections within the GDA to
assess whether the recommendations of GDSDS and its SEA remain valid.
The release of the results from Census 2016 presents an opportunity on which to base this review of
population and load projections and to re-baseline the proposed growth projections to 2016 data. The
2013 updates by the Central Statistics Office (CSO) of the Population and Labour Force Projections,
2016 – 2046 (published April 2013) and the Regional Population Projections 2016 - 2031 (published
December 2013) also permitted a re-examination of population growth rates in the GDA, with
particular emphasis on the contributing catchment to Ringsend WwTP.
In addition, a ‘Demographic Study’5 was commissioned by Irish Water in May 2014 as part of the
Water Supply Project Eastern and Midlands Region (WSP). The objective of this study was to
examine a range of population projections out to 2050, to be used as the basis for the estimation of
4 GDSDS – Population and Land Use – Final Report, March 2003 (Ref.GDSDS/NE02057/094v2) 5 Water Supply Project Dublin Region: Summary of Demographic Projections, AOS Planning, June 2014
Assessment of Domestic & Non-Domestic Load on
Proposed Regional WwTP
32102902_01 6
water demand for the WSP. The study sets out regional population projections for the Planning
Regions and the State to 2050. The projections were prepared as per the last census for the base
year 2011, with projections for the years 2021, 2026, 2031, 2041, 2046 and 2050. Years 2031 and
2046 respectively, represent the furthest dates used for the CSO Regional and State Population
Projections.
The purpose of this report (GDD Assessment of Domestic & Non-Domestic Load Report) is to:
i. Re-examine population and required treatment capacity projections within the GDA to assess
whether the recommendations of GDSDS and its SEA remain valid.
ii. Determine the requirement, both in terms of timing and treatment capacity, for the proposed
Regional WwTP.
This determination is closely linked to the capacity of the existing plant at Ringsend and to the limited
capacity and significant constraints in the existing drainage network serving Ringsend WwTP.
Given the passage of time since the GDSDS Final Strategy Report was published the baseline year
for the review of future growth has been set at 2016. A design year horizon of 2050 has also being
adopted as this represents a long-term horizon appropriate for the planning of major strategic
infrastructure based on the anticipated commissioning date of the proposed Project.
2.3 Study Area
The study area for the GDD project is illustrated. in Figure 2.1 in Appendix B.
2.4 Contributing Catchment to Ringsend WwTP
The contributing catchment to Ringsend WwTP is illustrated in Figure 2.2 in Appendix B.
2.5 Potential Contributing Catchment to Regional WwTP
The GDD project will primarily serve the northern, north-western and western sub-catchments of the
current Ringsend catchment. It is proposed to divert flow and load from these sub-catchments to the
proposed Regional WwTP. The timing of these diversions will depend on the development of load in
the Ringsend catchment and in each of the individual sub-catchments over time.
The sub-catchments located on the northern, north-western and western fringe of the Ringsend
catchment are indicated in Figures 2.3 – 2.5 in Appendix B and comprise of;
The Blanchardstown (9C Sewer) sub-catchment of Ringsend WwTP (includes the Meath
towns & villages of Ashbourne, Ratoath, Kilbride, Dunboyne & Clonee),
The North Dublin (North Fringe Sewer &North Dublin Drainage Scheme (NDDS) Sewer) sub-
catchment of Ringsend WwTP,
The South Dublin – Lucan/Clondalkin (9B Sewer) sub-catchment of Ringsend WwTP.
Additional catchments in the GDA, which may also influence future required treatment capacity of the
new Regional WwTP, through diversion of flows & load in excess of ultimate treatment capability of

Assessment of Domestic & Non-Domestic Load on
Proposed Regional WwTP
32102902_01 7
the individual wastewater treatment plants in these catchments, are indicated in Figure 2.6 in
Appendix B and comprise;
Swords WwTP Catchment,
Malahide WwTP Catchment,
Lower Liffey Valley (Leixlip WwTP) Catchment (Includes Leixlip, Celbridge, Maynooth,
Kilcock and Straffan),
Upper Liffey Valley (Osberstown WwTP) Catchment (Includes Naas, Prosperous, Clane,
Sallins, Kill, Johnstown, Newbridge, Athgarvan and Kilcullen).
Assessment of Domestic & Non-Domestic Load on
Proposed Regional WwTP
32102902_01 8
3. Existing Population and Future Growth Rates
3.1 Current Population within the GDA
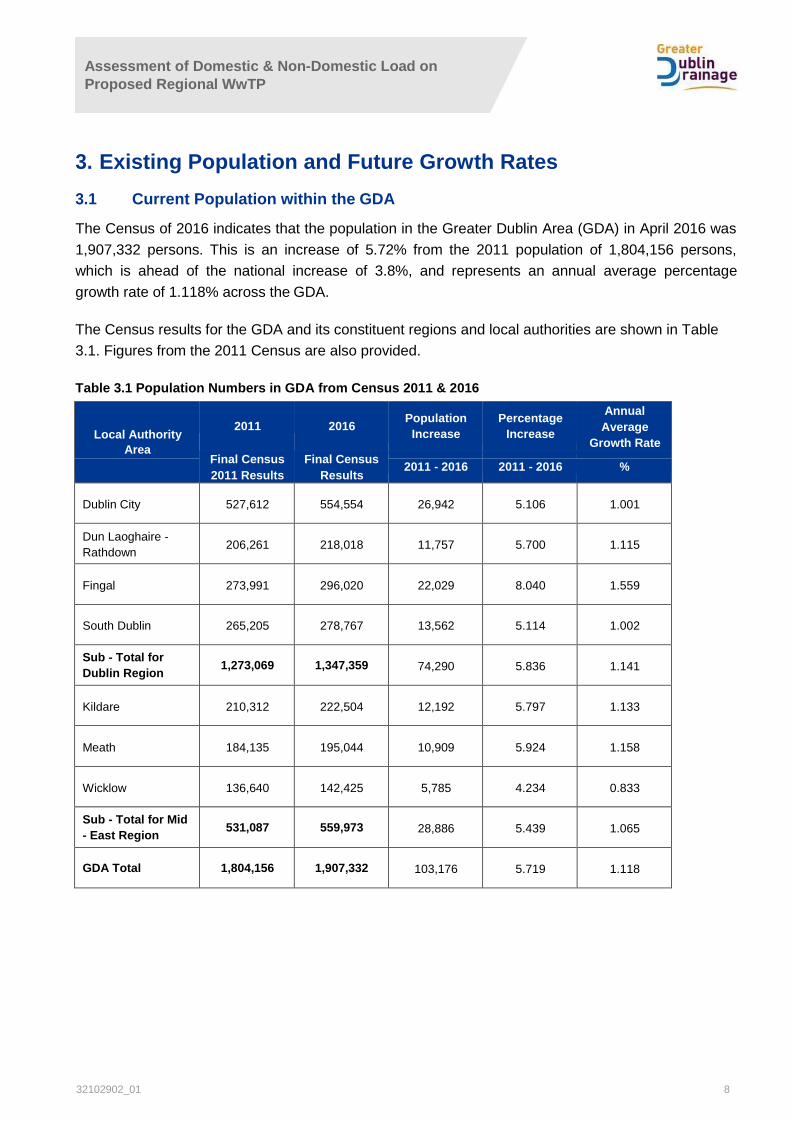
The Census of 2016 indicates that the population in the Greater Dublin Area (GDA) in April 2016 was
1,907,332 persons. This is an increase of 5.72% from the 2011 population of 1,804,156 persons,
which is ahead of the national increase of 3.8%, and represents an annual average percentage
growth rate of 1.118% across the GDA.
The Census results for the GDA and its constituent regions and local authorities are shown in Table
3.1. Figures from the 2011 Census are also provided.
Table 3.1 Population Numbers in GDA from Census 2011 & 2016
Local Authority
Area
2011 2016 Population
Increase
Percentage
Increase
Annual
Average
Growth Rate
Final Census
2011 Results
Final Census
Results 2011 - 2016 2011 - 2016 %
Dublin City 527,612 554,554 26,942 5.106 1.001
Dun Laoghaire -
Rathdown 206,261 218,018 11,757 5.700 1.115
Fingal 273,991 296,020 22,029 8.040 1.559
South Dublin 265,205 278,767 13,562 5.114 1.002
Sub - Total for
Dublin Region 1,273,069 1,347,359 74,290 5.836 1.141
Kildare 210,312 222,504 12,192 5.797 1.133
Meath 184,135 195,044 10,909 5.924 1.158
Wicklow 136,640 142,425 5,785 4.234 0.833
Sub - Total for Mid
- East Region531,087 559,973 28,886 5.439 1.065
GDA Total 1,804,156 1,907,332 103,176 5.719 1.118
Assessment of Domestic & Non-Domestic Load on
Proposed Regional WwTP
32102902_01 9
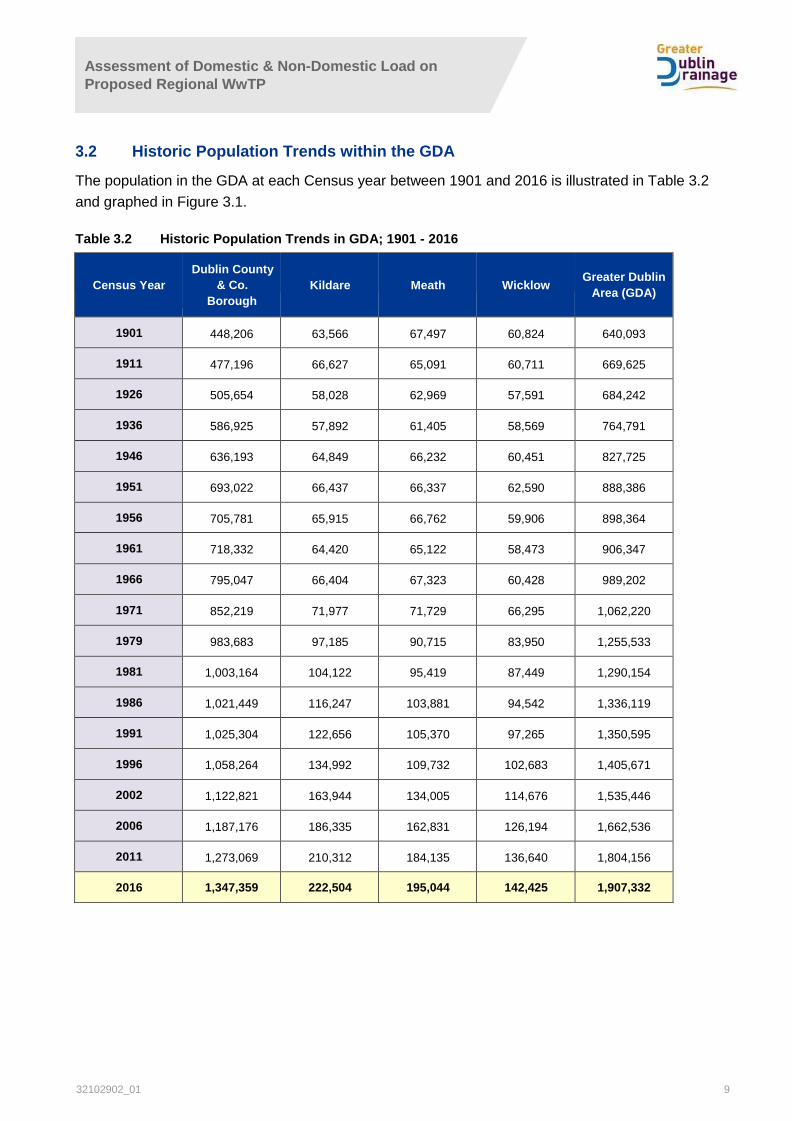
3.2 Historic Population Trends within the GDA
The population in the GDA at each Census year between 1901 and 2016 is illustrated in Table 3.2
and graphed in Figure 3.1.
Table 3.2 Historic Population Trends in GDA; 1901 - 2016
Census Year
Dublin County
& Co.
Borough
Kildare Meath Wicklow Greater Dublin
Area (GDA)
1901 448,206 63,566 67,497 60,824 640,093
1911 477,196 66,627 65,091 60,711 669,625
1926 505,654 58,028 62,969 57,591 684,242
1936 586,925 57,892 61,405 58,569 764,791
1946 636,193 64,849 66,232 60,451 827,725
1951 693,022 66,437 66,337 62,590 888,386
1956 705,781 65,915 66,762 59,906 898,364
1961 718,332 64,420 65,122 58,473 906,347
1966 795,047 66,404 67,323 60,428 989,202
1971 852,219 71,977 71,729 66,295 1,062,220
1979 983,683 97,185 90,715 83,950 1,255,533
1981 1,003,164 104,122 95,419 87,449 1,290,154
1986 1,021,449 116,247 103,881 94,542 1,336,119
1991 1,025,304 122,656 105,370 97,265 1,350,595
1996 1,058,264 134,992 109,732 102,683 1,405,671
2002 1,122,821 163,944 134,005 114,676 1,535,446
2006 1,187,176 186,335 162,831 126,194 1,662,536
2011 1,273,069 210,312 184,135 136,640 1,804,156
2016 1,347,359 222,504 195,044 142,425 1,907,332
Assessment of Domestic & Non-Domestic Load on
Proposed Regional WwTP
32102902_01 10
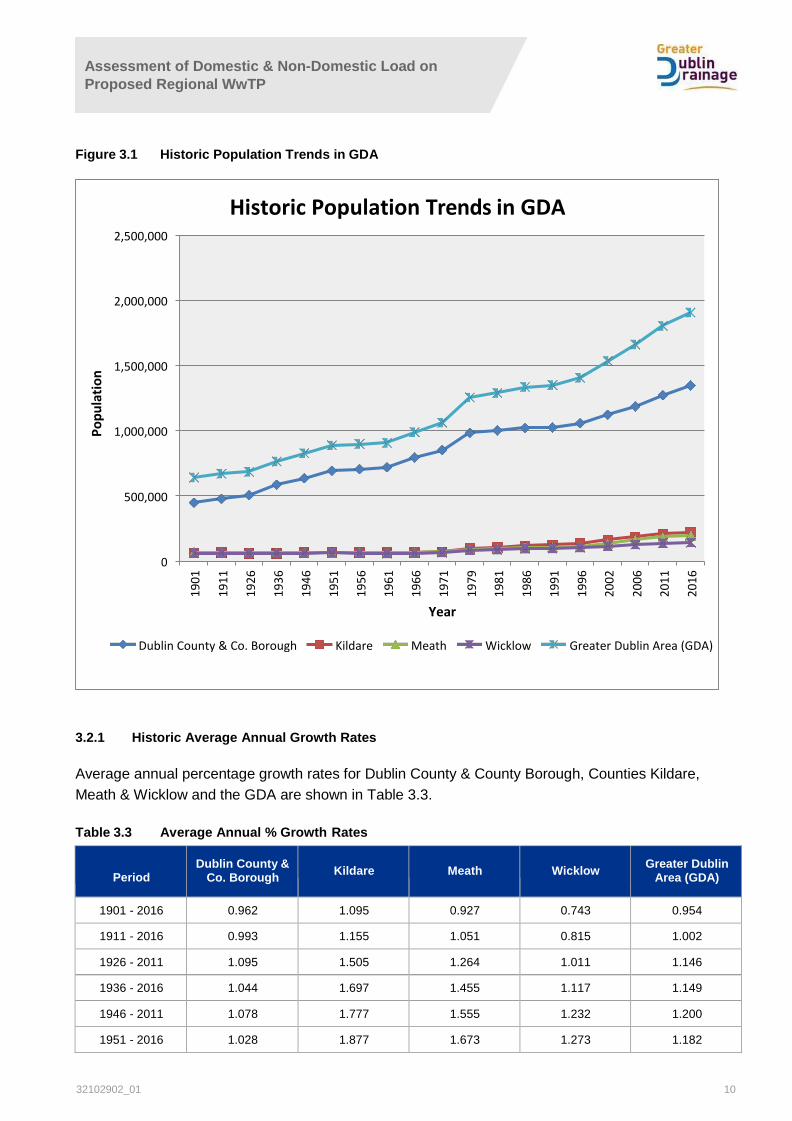
Figure 3.1 Historic Population Trends in GDA
3.2.1 Historic Average Annual Growth Rates
Average annual percentage growth rates for Dublin County & County Borough, Counties Kildare,
Meath & Wicklow and the GDA are shown in Table 3.3.
Table 3.3 Average Annual % Growth Rates
Period Dublin County &
Co. Borough Kildare Meath Wicklow
Greater Dublin Area (GDA)
1901 - 2016 0.962 1.095 0.927 0.743 0.954
1911 - 2016 0.993 1.155 1.051 0.815 1.002
1926 - 2011 1.095 1.505 1.264 1.011 1.146
1936 - 2016 1.044 1.697 1.455 1.117 1.149
1946 - 2011 1.078 1.777 1.555 1.232 1.200
1951 - 2016 1.028 1.877 1.673 1.273 1.182
Greater Dublin Area (GDA) Wicklow Meath Kildare Dublin County & Co. Borough
Year
0
500,000
1,000,000
1,500,000
2,000,000
2,500,000
Historic Population Trends in GDA
Po
pu
lati
on
19
01
19
11
19
26
19
36
19
46
19
51
19
56
19
61
19
66
19
71
19
79
19
81
19
86
19
91
19
96
20
02
20
06
20
11
20
16
Assessment of Domestic & Non-Domestic Load on
Proposed Regional WwTP
32102902_01 11
Period Dublin County &
Co. Borough
Kildare
Meath
Wicklow
Greater Dublin Area (GDA)
1961 - 2011 1.150 2.279 2.015 1.632 1.362
1971 - 2016 1.023 2.540 2.248 1.714 1.309
1981 - 2016 0.846 2.193 2.064 1.403 1.123
1991 - 2016 1.099 2.411 2.494 1.537 1.390
2002 - 2016 1.311 2.206 2.717 1.560 1.561
2011 - 2016 1.141 1.133 1.158 0.833 1.118
3.3 Future Projections of Population within the GDA
3.3.1 Introduction
In December 2013, the Central Statistics Office (CSO) published the ‘Regional Population
Projections’ 2016-2031. This publication provides a regional breakdown of the CSO national
projections and contains population projections for the eight Regional Authority areas in Ireland for
2016-2031. The assumptions used in the national model (fertility, mortality and international
migration) have been regionalised based on recent historical data, and regional migration, but remain
within the overall constraint of the national population projections. The regional data is presented in
combinations of fertility and migration assumptions.
In May 2014, Irish Water commissioned a ‘Demographic Study’6 as part of the Water Supply Project
(WSP) – Eastern and Midlands Region. The objective of the study was to examine a range of
population projections out to 2050, to be used as the basis for the estimation of water demand for the
WSP. The study sets out regional population projections for the Planning Regions and the State, to
2050. Census 2011 provided data for the base year 2011, with projections for the years 2021, 2026,
2031, 2041, 2046 and 2050. Years 2031 and 2046 respectively, represent the furthest dates used for
the CSO Regional and State Population Projections.
As a result of the WSP ‘Demographic Study’ and the CSO projections outlined above, the proposed
growth scenarios with respect to the Greater Dublin Drainage project have been reviewed.
The WSP ‘Demographic Study’ outlines a range of assumption scenarios in order to assess future
residential population. These scenarios are presented below;
A Planned Growth Scenario, providing for both ‘High’ and ‘Low’ population variations;
A Most Likely Growth Scenario;
A Minimum Expected Economic Growth Scenario;
A Maximum Expected Economic Growth Scenario, providing for both ‘High’ and ‘Low’
population variations.
6 Water Supply Project Dublin Region: Summary of Demographic Projections, AOS Planning, June 2014
Assessment of Domestic & Non-Domestic Load on
Proposed Regional WwTP
32102902_01 12
As emphasised in the WSP ‘Demographic Study’ the strategic approach adopted was to utilise the
available CSO 2011 census population projection documentation as the ‘spinal structure’ upon which
all projections were based. Specifically, the CSO Regional Population Projections to 2031 served to
inform all projections up to and including that year. All subsequent date projections utilised the State
projections to 2046.
As a result, the assumption scenarios contained in the WSP ‘Demographic Study’ also align with the
assumptions scenarios presented in the CSO Projections as outlined below.
1. Planned Growth Scenario ‘Low’ - (CSO ‘M2F2 Recent’ Scenario)
2. Planned Growth Scenario ‘High’ - (CSO ‘M2F2 Traditional’ Scenario)
3. A Most Likely Growth Scenario - (CSO ‘M2F2 Modified’ Scenario)
4. A Minimum Expected Economic Growth Scenario – (CSO ‘M3F2’ Scenario)
5. A Maximum Expected Economic Growth Scenario, providing for both ‘High’ and ‘Low’
population variations – (Combinations of CSO ‘M2F1’ and ‘M1F2’ Scenarios)
Examination of the underlying characteristics and assumptions of each of the above growth scenarios
determined that scenarios 4 and 5 were unlikely to be reasonable growth scenarios to plan the major
strategic infrastructure required for the GDD and were therefore removed from further consideration.
Three future population growth scenarios were therefore selected for the Greater Dublin Drainage
project. These growth scenarios are outlined below and in Table 3.4.
Growth Scenario 1 – Planned ‘Low’ - (CSO ‘M2F2 Recent’ Scenario)
Growth Scenario 2- Planned ‘High’ - (CSO ‘M2F2 Traditional’ Scenario)
Growth Scenario 3 - ‘Most Likely’ - (CSO ‘M2F2 Modified’ Scenario)
Table 3.4 Proposed Residential Population Growth Scenarios
Growth Scenario
Time Period Annual Average Growth Rate
Growth Scenario
1 – Planned
‘Low’.
2016- 2021 Adopt the annual average growth rates derived from the ‘M2F2 Recent’
2016 - 2021 population figures as set out in the CSO Regional Population
Projections 2016 - 2031.
2021- 2031 Adopt the annual average growth rates derived from the ‘M2F2 Recent’
2021 - 2031 population figures as set out in the CSO Regional Population
Projections 2016 - 2031.
2031- 2041 Adopt the annual average growth rates derived from the ‘Growth Scenario 1
– Low’ 2031 - 2041 population figures as set out in the WSP ‘Demographic
Study’ 2014.
2041- 2050 Adopt the annual average growth rates derived from the ‘Growth Scenario 1
– Low’ 2041 - 2050 population figures as set out in the WSP ‘Demographic
Study’ 2014.
Assessment of Domestic & Non-Domestic Load on
Proposed Regional WwTP
32102902_01 13
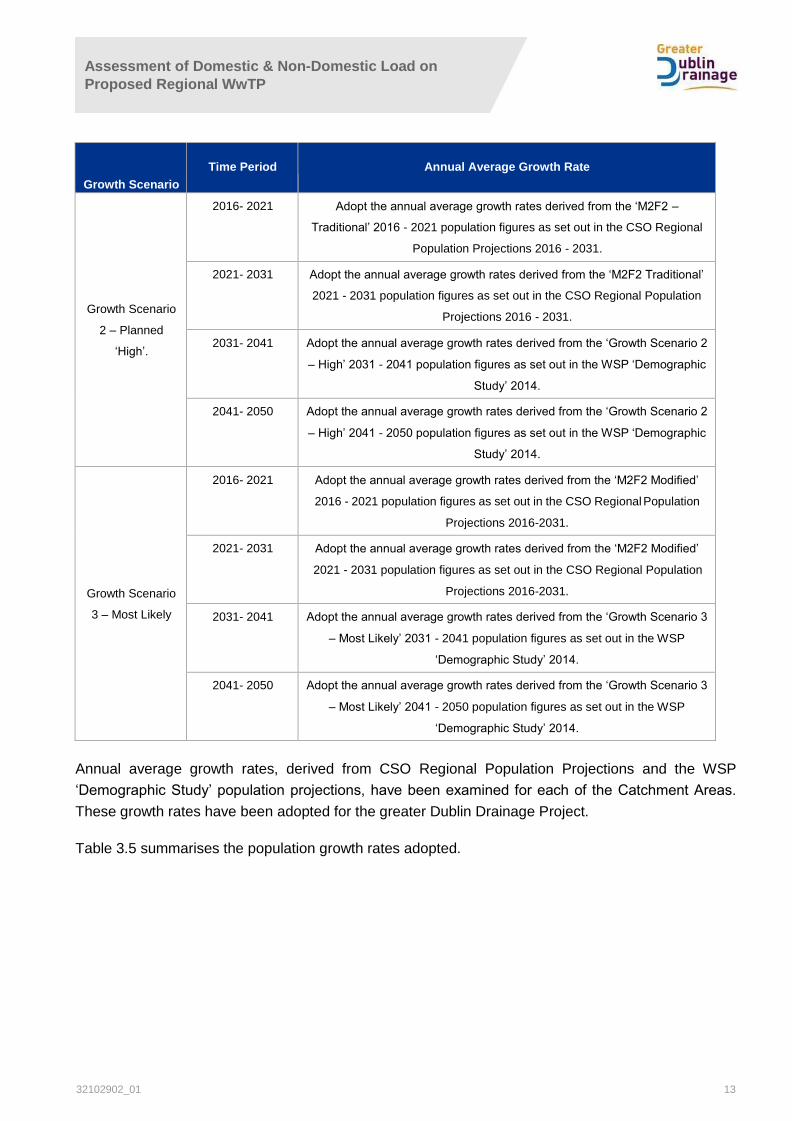
Growth Scenario
Time Period
Annual Average Growth Rate
Growth Scenario
2 – Planned
‘High’.
2016- 2021 Adopt the annual average growth rates derived from the ‘M2F2 –
Traditional’ 2016 - 2021 population figures as set out in the CSO Regional
Population Projections 2016 - 2031.
2021- 2031 Adopt the annual average growth rates derived from the ‘M2F2 Traditional’
2021 - 2031 population figures as set out in the CSO Regional Population
Projections 2016 - 2031.
2031- 2041 Adopt the annual average growth rates derived from the ‘Growth Scenario 2
– High’ 2031 - 2041 population figures as set out in the WSP ‘Demographic
Study’ 2014.
2041- 2050 Adopt the annual average growth rates derived from the ‘Growth Scenario 2
– High’ 2041 - 2050 population figures as set out in the WSP ‘Demographic
Study’ 2014.
Growth Scenario
3 – Most Likely
2016- 2021 Adopt the annual average growth rates derived from the ‘M2F2 Modified’
2016 - 2021 population figures as set out in the CSO Regional Population
Projections 2016-2031.
2021- 2031 Adopt the annual average growth rates derived from the ‘M2F2 Modified’
2021 - 2031 population figures as set out in the CSO Regional Population
Projections 2016-2031.
2031- 2041 Adopt the annual average growth rates derived from the ‘Growth Scenario 3
– Most Likely’ 2031 - 2041 population figures as set out in the WSP
‘Demographic Study’ 2014.
2041- 2050 Adopt the annual average growth rates derived from the ‘Growth Scenario 3
– Most Likely’ 2041 - 2050 population figures as set out in the WSP
‘Demographic Study’ 2014.
Annual average growth rates, derived from CSO Regional Population Projections and the WSP
‘Demographic Study’ population projections, have been examined for each of the Catchment Areas.
These growth rates have been adopted for the greater Dublin Drainage Project.
Table 3.5 summarises the population growth rates adopted.
Assessment of Domestic & Non-Domestic Load on
Proposed Regional WwTP
32102902_01 14
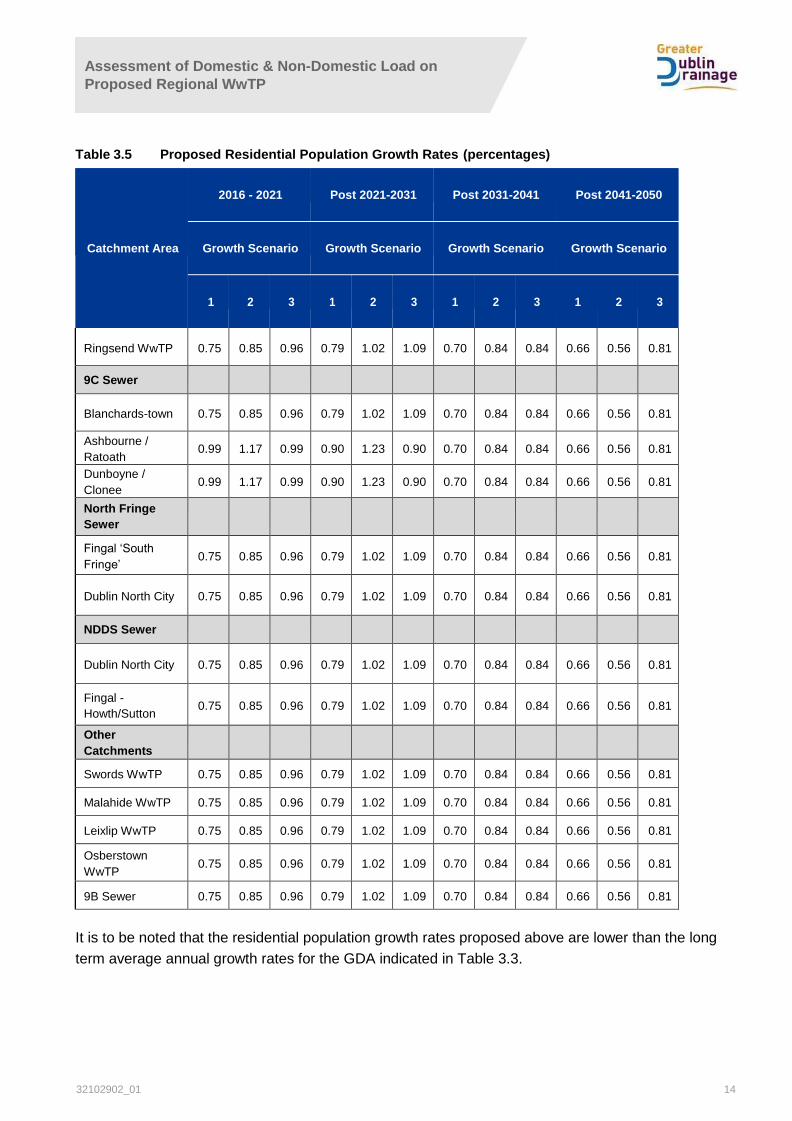
Table 3.5 Proposed Residential Population Growth Rates (percentages)
Catchment Area
2016 - 2021 Post 2021-2031 Post 2031-2041 Post 2041-2050
Growth Scenario Growth Scenario Growth Scenario Growth Scenario
1 2 3 1 2 3 1 2 3 1 2 3
Ringsend WwTP 0.75 0.85 0.96 0.79 1.02 1.09 0.70 0.84 0.84 0.66 0.56 0.81
9C Sewer
Blanchards-town 0.75 0.85 0.96 0.79 1.02 1.09 0.70 0.84 0.84 0.66 0.56 0.81
Ashbourne /
Ratoath 0.99 1.17 0.99 0.90 1.23 0.90 0.70 0.84 0.84 0.66 0.56 0.81
Dunboyne /
Clonee 0.99 1.17 0.99 0.90 1.23 0.90 0.70 0.84 0.84 0.66 0.56 0.81
North Fringe
Sewer
Fingal ‘South
Fringe’ 0.75 0.85 0.96 0.79 1.02 1.09 0.70 0.84 0.84 0.66 0.56 0.81
Dublin North City 0.75 0.85 0.96 0.79 1.02 1.09 0.70 0.84 0.84 0.66 0.56 0.81
NDDS Sewer
Dublin North City 0.75 0.85 0.96 0.79 1.02 1.09 0.70 0.84 0.84 0.66 0.56 0.81
Fingal -
Howth/Sutton 0.75 0.85 0.96 0.79 1.02 1.09 0.70 0.84 0.84 0.66 0.56 0.81
Other
Catchments
Swords WwTP 0.75 0.85 0.96 0.79 1.02 1.09 0.70 0.84 0.84 0.66 0.56 0.81
Malahide WwTP 0.75 0.85 0.96 0.79 1.02 1.09 0.70 0.84 0.84 0.66 0.56 0.81
Leixlip WwTP 0.75 0.85 0.96 0.79 1.02 1.09 0.70 0.84 0.84 0.66 0.56 0.81
Osberstown
WwTP 0.75 0.85 0.96 0.79 1.02 1.09 0.70 0.84 0.84 0.66 0.56 0.81
9B Sewer 0.75 0.85 0.96 0.79 1.02 1.09 0.70 0.84 0.84 0.66 0.56 0.81
It is to be noted that the residential population growth rates proposed above are lower than the long
term average annual growth rates for the GDA indicated in Table 3.3.
Assessment of Domestic & Non-Domestic Load on
Proposed Regional WwTP
32102902_01 15
4. Existing and Future Industrial, Commercial & InstitutionalLoad
4.1 Industrial Loadings
Industrial discharges are licensed under either the Integrated Pollution Prevention Control (IPPC)
License with the EPA as the competent authority or Waste License (Section 16) issued by the Local
Authority / Irish Water.
4.1.1 Existing Industrial Loadings
Information on existing industrial discharges has been obtained from a review of the 2016 AER
(Annual Environmental Reports) for the various industries.
4.1.2 Future Industrial Loadings
The basis for provision for industry within the assessment of required design capacity is as follows:
Existing industrial load to remain unchanged out to the 2050 Design Year; and
In accordance with Irish Water’s Water Service Strategic Plan (WSSP) a headroom
allowance of 20% of the sum of the residential and commercial loads is provided in the
design, from which capacity can be made available for future industrial loads.
4.2 Commercial & Institutional Loadings
The existing load contribution from commercial and institutional sources, (e.g. shops, offices, schools,
etc) has been estimated as follows:
Where the complete catchment to a wastewater treatment plant is being considered the
commercial and institutional load contribution has been estimated by deducting the known
population and industrial loadings from the measured BOD load at the treatment plant.
Where individual sub-catchments are being considered the commercial and institutional load
contribution has been assumed as 16% of the population load. This relationship has been
used extensively in the estimation of flow and load for design purposes and is widely
accepted at a local and national level in Ireland (source: National Urban Waste Water Study,
DEHLG, vol 2, part A, section 5, 2004).
4.2.1 Future Commercial & Institutional Loadings
Future commercial & institutional loadings are assumed to grow in line with population growth.
Assessment of Domestic & Non-Domestic Load on
Proposed Regional WwTP
32102902_01 16
5. Analysis of Ringsend Catchment
5.1 Existing Load on Ringsend WwTP
The organic loading, expressed in terms of population equivalent (PE) on Ringsend WwTP as of 2016
was approximately 1.808 million. This was the average day loading for 2016 and it is noted that daily
load measurements at Ringsend WwTP show wide fluctuations and variability7.
5.2 Residential Population in Ringsend Catchment
5.2.1 Existing Population
The residential population contributing to the Ringsend WwTP in 2016 is calculated at 1,160,553
persons.
5.2.2 Future Population
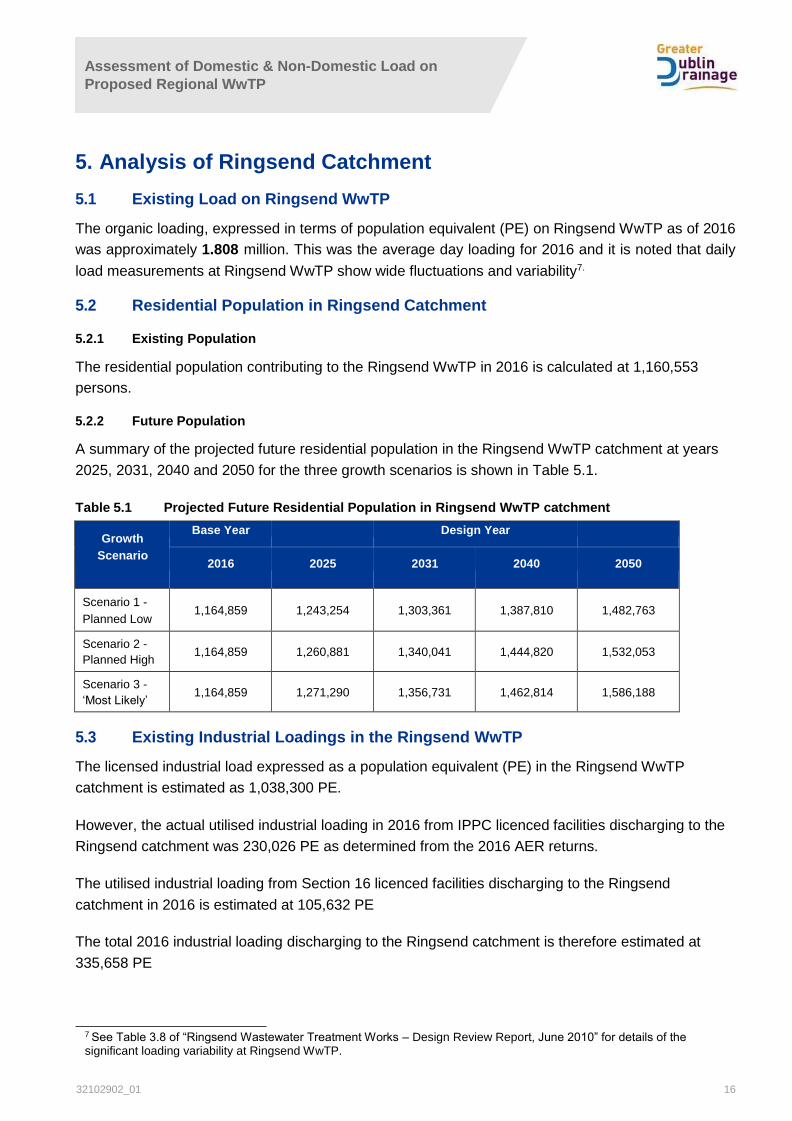
A summary of the projected future residential population in the Ringsend WwTP catchment at years
2025, 2031, 2040 and 2050 for the three growth scenarios is shown in Table 5.1.
Table 5.1 Projected Future Residential Population in Ringsend WwTP catchment
Growth
Scenario
Base Year Design Year
2016 2025 2031 2040 2050
Scenario 1 -
Planned Low 1,164,859 1,243,254 1,303,361 1,387,810 1,482,763
Scenario 2 -
Planned High 1,164,859 1,260,881 1,340,041 1,444,820 1,532,053
Scenario 3 -
‘Most Likely’ 1,164,859 1,271,290 1,356,731 1,462,814 1,586,188
5.3 Existing Industrial Loadings in the Ringsend WwTP
The licensed industrial load expressed as a population equivalent (PE) in the Ringsend WwTP
catchment is estimated as 1,038,300 PE.
However, the actual utilised industrial loading in 2016 from IPPC licenced facilities discharging to the
Ringsend catchment was 230,026 PE as determined from the 2016 AER returns.
The utilised industrial loading from Section 16 licenced facilities discharging to the Ringsend
catchment in 2016 is estimated at 105,632 PE
The total 2016 industrial loading discharging to the Ringsend catchment is therefore estimated at
335,658 PE
7 See Table 3.8 of “Ringsend Wastewater Treatment Works – Design Review Report, June 2010” for details of the significant loading variability at Ringsend WwTP.
Assessment of Domestic & Non-Domestic Load on
Proposed Regional WwTP
32102902_01 17
5.3.1 Future Industrial Loadings in the Ringsend WwTP catchment
Provision for future industry within Ringsend catchment is as follows:
Existing industrial load to remain unchanged at 335,658 PE out to the 2050 Design Year.
An allowance of 150,000 PE is added from 2019 to provide for expansion plans of a specific
Significant Industrial Customer (SIC), identified in confidential briefings to Irish Water, and.
In accordance with Irish Water’s Water Service Strategic Plan (WSSP) a headroom
allowance of 20% of the sum of the residential and commercial loads is provided in the
design, from which capacity can be made available for future industrial loads.
5.4 Existing Commercial and Institutional Loading in the Ringsend WwTP
The load contribution from commercial and institutional sources in the Ringsend WwTP catchment
have been estimated by deducting known residential and industrial contributions from the total load
measured at the treatment plant. In this manner the commercial and institutional load contribution to
Ringsend WwTP in 2016 has been estimated at 311,835 PE or c.27% of residential contribution.
5.4.1 Future Commercial and Institutional Loading in the Ringsend WwTP
Future commercial & institutional loadings in the Ringsend WwTP catchment are assumed to grow in
line with population growth.
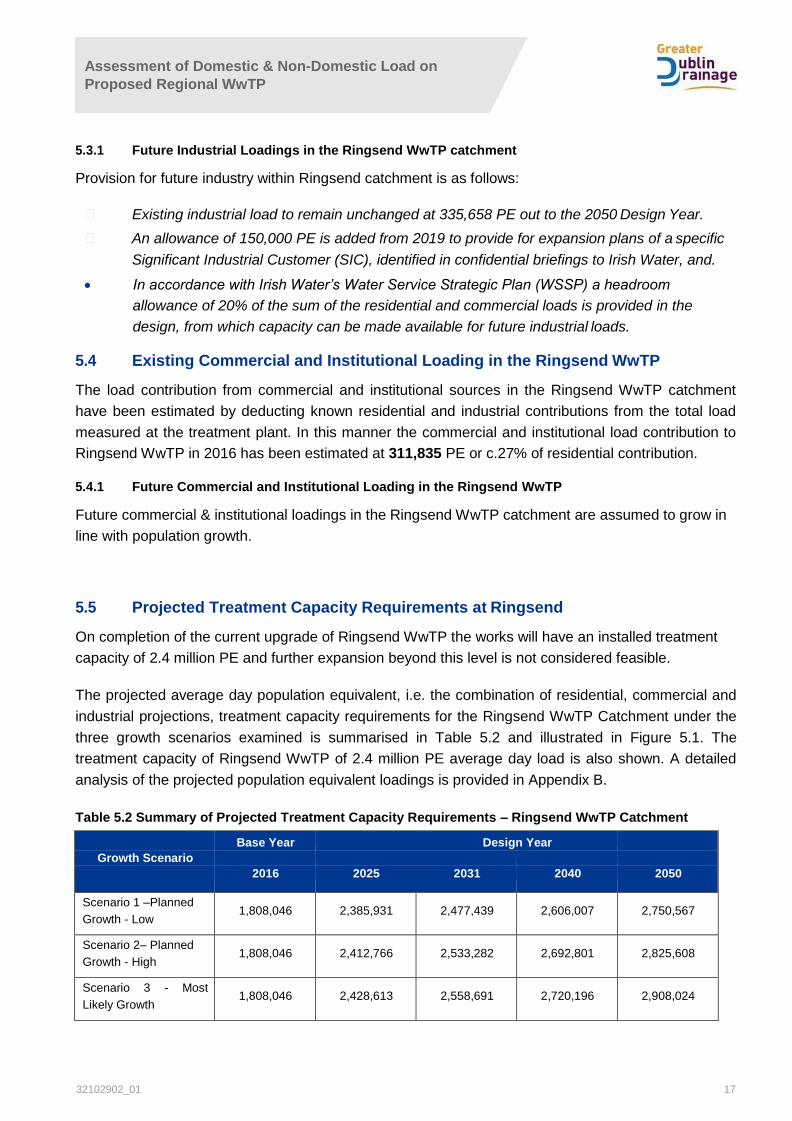
5.5 Projected Treatment Capacity Requirements at Ringsend
On completion of the current upgrade of Ringsend WwTP the works will have an installed treatment
capacity of 2.4 million PE and further expansion beyond this level is not considered feasible.
The projected average day population equivalent, i.e. the combination of residential, commercial and
industrial projections, treatment capacity requirements for the Ringsend WwTP Catchment under the
three growth scenarios examined is summarised in Table 5.2 and illustrated in Figure 5.1. The
treatment capacity of Ringsend WwTP of 2.4 million PE average day load is also shown. A detailed
analysis of the projected population equivalent loadings is provided in Appendix B.
Table 5.2 Summary of Projected Treatment Capacity Requirements – Ringsend WwTP Catchment
Base Year Design Year
Growth Scenario
2016 2025 2031 2040 2050
Scenario 1 –Planned
Growth - Low 1,808,046 2,385,931 2,477,439 2,606,007 2,750,567
Scenario 2– Planned
Growth - High 1,808,046 2,412,766 2,533,282 2,692,801 2,825,608
Scenario 3 - Most
Likely Growth 1,808,046 2,428,613 2,558,691 2,720,196 2,908,024
Assessment of Domestic & Non-Domestic Load on
Proposed Regional WwTP
32102902_01 18
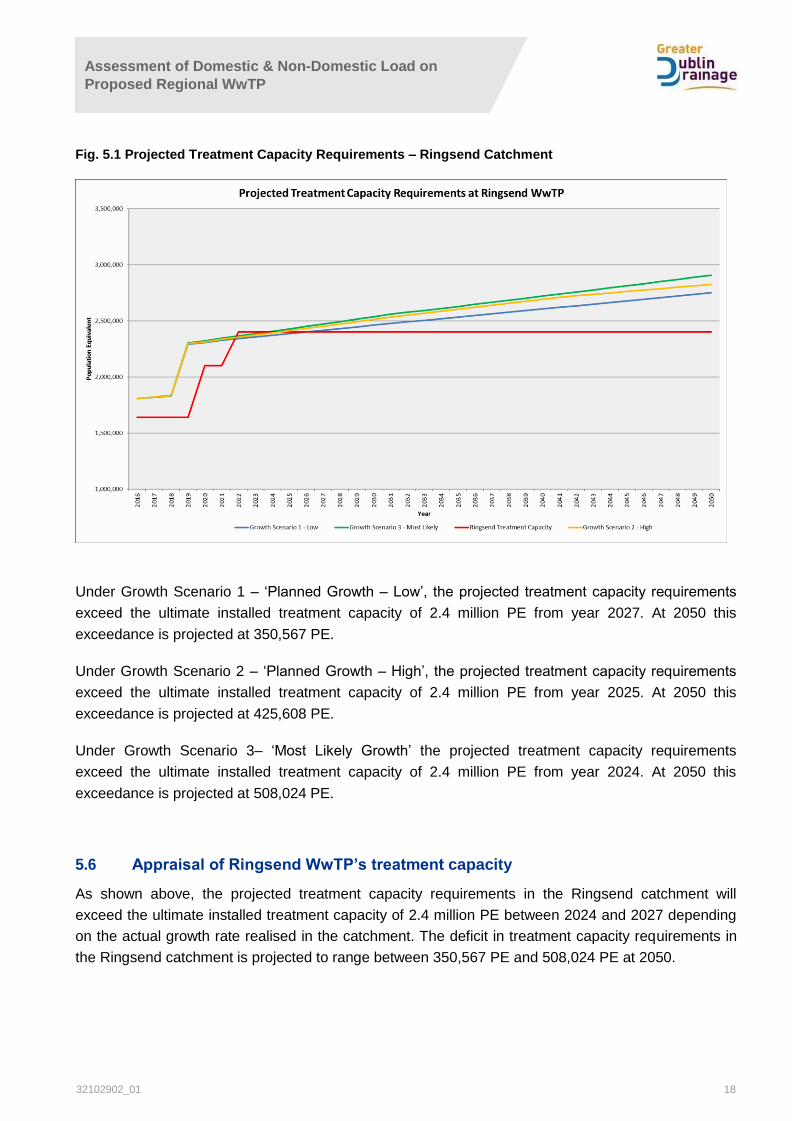
Fig. 5.1 Projected Treatment Capacity Requirements – Ringsend Catchment
Under Growth Scenario 1 – ‘Planned Growth – Low’, the projected treatment capacity requirements
exceed the ultimate installed treatment capacity of 2.4 million PE from year 2027. At 2050 this
exceedance is projected at 350,567 PE.
Under Growth Scenario 2 – ‘Planned Growth – High’, the projected treatment capacity requirements
exceed the ultimate installed treatment capacity of 2.4 million PE from year 2025. At 2050 this
exceedance is projected at 425,608 PE.
Under Growth Scenario 3– ‘Most Likely Growth’ the projected treatment capacity requirements
exceed the ultimate installed treatment capacity of 2.4 million PE from year 2024. At 2050 this
exceedance is projected at 508,024 PE.
5.6 Appraisal of Ringsend WwTP’s treatment capacity
As shown above, the projected treatment capacity requirements in the Ringsend catchment will
exceed the ultimate installed treatment capacity of 2.4 million PE between 2024 and 2027 depending
on the actual growth rate realised in the catchment. The deficit in treatment capacity requirements in
the Ringsend catchment is projected to range between 350,567 PE and 508,024 PE at 2050.
Assessment of Domestic & Non-Domestic Load on
Proposed Regional WwTP
32102902_01 19
5.7 Conclusions
The constraints on the future expansion of Ringsend WwTP beyond its ultimate capacity as originally
identified by GDSDS remain relevant. Furthermore, the capacity constraints in the sewer network
serving the Ringsend WwTP catchment, as identified by GDSDS, also remain relevant. Therefore,
future development within this catchment cannot be catered for by Ringsend WwTP alone and
additional treatment capacity is required in the catchment.
The GDD project, encompassing a new Regional WwTP, marine outfall pipe and orbital drainage
system will provide the additional wastewater treatment capacity required in the catchment. By
diverting flow and load out of the Ringsend catchment to the new Regional WwTP the GDD project
will free up capacity at Ringsend WwTP and in its contributing network. The GDD project will
therefore enable growth to continue out to 2050 in the sub-catchments that are diverted to the new
Regional WwTP and also in the other sub-catchments that remain served by Ringsend WwTP.
Assessment of Domestic & Non-Domestic Load on
Proposed Regional WwTP
32102902_01 20
6. Analysis of Existing Regional WwTPs
6.1 Introduction
This chapter assesses the projected treatment capacity requirements in four drainage catchments
served by existing Regional WwTPs that were identified by GDSDS as potentially having an influence
on the future required treatment capacity of the proposed new Regional WwTP. The four catchments
assessed are Malahide, Swords, Lower Liffey Valley (Leixlip WwTP) and the Upper Liffey Valley
(Osberstown WwTP). A summary discussion of the assessment is provided hereunder with the full
tabular analysis provided in Appendix A.
6.2 Malahide WwTP
6.2.1 Existing Organic Load
The average daily organic load on Malahide WwTP in 2016, expressed as population equivalents was
16,692 PE. The existing treatment capacity of the plant is 21,000 PE.
6.2.2 Growth in the Malahide WwTP Catchment
The projected treatment capacity requirements under the three growth scenarios examined are
summarised hereunder.
Growth Scenario 1 – Planned Growth - Low
Under this growth scenario, the 21,000 PE capacity at Malahide WwTP is exceeded in year 2048. By
year 2050 the required treatment capacity in this catchment is projected at 21,326 PE.
Growth Scenario 2– Planned Growth - High
Under this growth scenario, the 21,000 PE capacity at Malahide WwTP is exceeded in year 2042. By
year 2050 the required treatment capacity in this catchment is projected at 22,035 PE.
Growth Scenario 3 – Most Likely Growth
Under growth scenario 3, the 21,000 PE capacity at Malahide WwTP is exceeded in year 2040. By
year 2050 the required treatment capacity in this catchment is projected at 22,814 PE.
6.2.3 Impact of Future Growth
The location of Malahide WwTP precludes the possibility of physically expanding the plant to provide
the projected future treatment capacity requirements.
The WwTP currently discharges to the environmentally sensitive water of the outer Broadmeadow
Estuary, which places further constraints on the possibility of expanding the plant at its current
location.
Options to provide for future projected treatment capacity requirements in this catchment include
Assessment of Domestic & Non-Domestic Load on
Proposed Regional WwTP
32102902_01 21
Diversion of flow from part of the catchment to the Swords WwTP catchment (short term
solution);
Diversion of flow from part of the catchment to the North Fringe Sewer for treatment at
Ringsend WwTP (short term solution);
Diversion of flow from part of the catchment to the new Regional WwTP (long term solution)
Diversion of flow from the Malahide catchment to either the Swords catchment or to the North Fringe
sewer would only be temporary short term options. The recommended long term solution for the
Malahide catchment is to divert flow from part of the catchment to the proposed Regional WwTP.
6.3 Swords WwTP
6.3.1 Existing Population
The average daily organic load on Swords WwTP in 2016, expressed as population equivalents was
58,341 PE. The existing treatment capacity of the plant is 90,000 PE.
6.3.2 Growth in the Swords Catchment
The projected treatment capacity requirements under the three growth scenarios examined are
summarised hereunder.
Growth Scenario 1 – Planned Growth - Low
Under this growth scenario, the 90,000 PE capacity at Swords WwTP is not exceeded prior to 2050
Growth Scenario 2– Planned Growth - High
Under this growth scenario, the 90,000 PE capacity at Swords WwTP is exceeded in year 2048. By
year 2050 the required treatment capacity in this catchment is projected at 91,228 PE.
Growth Scenario 3 – Most Likely Growth
Under growth scenario 3, the 90,000 PE capacity at Swords WwTP is exceeded in year 2045. By
year 2050 the required treatment capacity in this catchment is projected at 94,380 PE.
6.3.3 Impact of Future Growth
Swords is one of Ireland’s fastest growing towns. It is also worth noting that Swords has been
identified as a Metropolitan Consolidation Town within the RPG Settlement Typology and Hierarchy
for the GDA. It is therefore expected that long term growth could see Swords expanding up to
100,000 in a planned and phased manner (Source RPG 2010 & Fingal County Development Plan
2017 – 2023). This implies that Swords, given its current population, is likely to be the main growth
area within the Metropolitan Area of Fingal for the foreseeable future.
The future treatment capacity requirements in this catchment are projected to exceed the installed
capacity at Swords WwTP from 2045 onwards depending on actual growth realised. The long term
solution, as recommended by GDSDS, to anticipated treatment capacity deficits in this catchment
Assessment of Domestic & Non-Domestic Load on
Proposed Regional WwTP
32102902_01 22
post 2050 is to divert flow from part of the catchment to the proposed Regional WwTP. This solution
could be developed in conjunction with flow diversions from the Malahide catchment.
6.4 Lower Liffey Valley (Leixlip WwTP) Catchment
6.4.1 Existing Population
The average daily organic load on Leixlip WwTP in 2016, expressed as population equivalents was
126,000 PE. The existing treatment capacity of the plant is 150,000 PE.
6.4.2 Growth in the Leixlip Catchment
The projected treatment capacity requirements in the Lower Liffey Valley catchment under the three
growth scenarios examined are summarised hereunder. It should be noted that the projected growth
in the Lower Liffey Valley catchment includes for the expansion plans of a specific Significant
Industrial Customer (SIC), identified in confidential briefings to Irish Water.
Growth Scenario 1 – Planned Growth - Low
Under this growth scenario the 150,000 PE upgraded capacity at Leixlip WwTP is exceeded in year
2019. By year 2050 the required treatment capacity in this catchment is projected at 195,499 PE..
Growth Scenario 2 – Planned Growth - High
Under this growth scenario the 150,000 PE upgraded capacity at Leixlip WwTP is exceeded in year
2019. By year 2050 the required treatment capacity in this catchment is projected at 264,216 PE.
Growth Scenario 3 Most Likely Growth
Under this growth scenario the 150,000 PE upgraded capacity at Leixlip WwTP is exceeded in year
2019. By year 2050 the required treatment capacity in this catchment is projected at 267,969 PE.
6.4.3 Impact of Future Growth
The expansion of this catchment beyond 150,000 PE cannot be served by the Leixlip WwTP alone
due to the limiting assimilative capacity of the receiving water (River Liffey) under low flow conditions8.
GDSDS recommended transferring flow and load in excess of the 150,000 PE capacity of Leixlip
WwTP to the proposed Regional WwTP. Irish Water advise that works to transfer the excess flow
and load from Leixlip WwTP are currently at planning stage. These works would initially transfer the
flows to the Blanchardstown catchment for onward transfer to Ringsend WwTP for treatment in the
short term. Under the GDD project these flows would be diverted to the Regional WwTP with the
flows from the Blanchardstown catchment.
8 Leixlip WwTW Environmental Impact Statement – Effluent Quality for Leixlip WwTW
Assessment of Domestic & Non-Domestic Load on
Proposed Regional WwTP
32102902_01 23
6.5 Upper Liffey Valley (Osberstown WwTP) Catchment
6.5.1 Existing Population
The average daily organic load on Osberstown WwTP in 2016, expressed as population equivalents
was 80,239 PE. The existing treatment capacity of the plant is 130,000 PE.
6.5.2 Growth in Osberstown Catchment
Under all three growth scenarios, the 1300,000 PE treatment capacity at Osberstown WwTP is not
exceeded prior to 2050
6.5.3 Impact of Future Growth
It is worth noting as part of the review of the County Development Plan Kildare County Council
conducted a survey which indicated that residential and mixed-use zoned lands in the Upper Liffey
Valley Catchment were in excess of 500ha. Significant development in this catchment could lead to
treatment capacity requirements far in excess of the installed capacity of 130,000 PE.
Development in this catchment, which would require treatment capacity to be provided beyond the
installed capacity of 130,000 PE will require further studies to determine the optimum manner in
which such development could be catered for.
6.6 Summary
The impact of projected future growth in the catchments of these regional plants indicates that there
will be significant challenges facing these catchments in the future. It may not prove to be technically
feasible or economically sustainable to overcome these challenges by further upgrade works at the
individual treatment plants and alternative solutions may have to be developed.
Potential solutions for each of the four regional WwTPs examined here are summarised below:
Projected growth in the Lower Liffey Valley catchment requires that flow and load in excess of
the installed 150,000 PE treatment capacity at Leixlip WwTP be diverted to the Regional WwTP
as soon as this plant is commissioned. Irish Water advise that works to transfer the excess flow
and load from Leixlip WwTP are currently at planning stage.
Projected growth in the Swords and Malahide catchments requires that flow and load in excess
of the installed treatment capacities be diverted to the Regional WwTP post 2050.
Whilst the 130,000 PE treatment capacity at Osberstown WwTP is not exceeded in any of the
three growth scenarios examined prior to 2050 it is possible, given the zoned lands available in
this catchment, that the actual growth realised may exceed projections. Should this be the case
further studies are recommended to ascertain the optimum solution to provide potential future
treatment capacity requirements in this catchment.
Assessment of Domestic & Non-Domestic Load on
Proposed Regional WwTP
32102902_01 24
6.7 Conclusions
Of the four existing regional WwTPs assessed in this chapter only the Lower Liffey Valley (Leixlip
WwTP) will impact on the treatment capacity to be provided at the proposed Regional WwTP prior to
2050. Works to transfer excess flow and load from Leixlip WwTP to the Blanchardstown (9C Sewer)
catchment are currently at planning stage. These excess flows from Leixlip WwTP have been
considered in the assessment of the Ringsend catchment discussed in Chapter 5. Therefore, the
additional treatment capacity required ranges between 350,567 PE and 508,024 PE to provide for
growth in the Ringsend catchment out to 2050. This additional treatment capacity cannot be provided
by further development of Ringsend WwTP beyond that which is already in planning. Therefore, a
new wastewater treatment plant is required. The GDD project will provide the required additional
treatment capacity.
In our view, the statutory requirement that Irish Water should be in a position to address in its
strategic planning, ‘existing and reasonably foreseeable deficiencies in the provision of water
services’ requires a particular and very important perspective on the use of Planning Scenarios in
infrastructural planning for assets of long working life.
Of the three growth scenarios examined the ‘most likely’ scenario (or growth scenario 3) sets out the
treatment capacity requirement profile of greatest probability given what is known at the present time.
Therefore, it is prudent for planning purposes to develop the GDD on the basis of this growth
scenario. It is therefore recommended that the GDD project be designed to provide a wastewater
treatment capacity of 500,000 PE.
Assessment of Domestic & Non-Domestic Load on
Proposed Regional WwTP
32102902_01 25
7. Analysis of Northern & Western Sub-Catchments
7.1 Introduction
As recommended in Chapter 6 the GDD project will provide an additional 500,000 PE of treatment
capacity, primarily to augment the existing treatment capacities provided at Ringsend WwTP and
Leixlip WwTP. To mobilise this capacity, it is necessary to divert flow and load out of these
catchments to the proposed Regional WwTP in order to keep the average daily organic loads on
these plants below their installed treatment capacities.
As noted previously, Irish Water currently have work at planning stage to transfer excess flows away
from Leixlip WwTP. In the short term, it is proposed to transfer these flows to the 9C sewer in
Blanchardstown for onward transfer to the Ringsend WwTP. Ultimately, under the GDD project these
flows will transfer with the flows from Blanchardstown to the proposed Regional WwTP.
The transfer of flows out of the Ringsend catchment revolve around the northern, north-western and
western sub-catchments of the current Ringsend catchment. These sub-catchments comprise of,
The Blanchardstown (9C Sewer) sub-catchment of Ringsend WwTP (includes the Meath towns
& villages of Ashbourne, Ratoath, Kilbride, Dunboyne & Clonee),
The North Dublin (North Fringe Sewer &North Dublin Drainage Scheme (NDDS) Sewer) sub-
catchment of Ringsend WwTP,
The South Dublin – Lucan/Clondalkin (9B Sewer) sub-catchment of Ringsend WwTP
This chapter examines the projected treatment capacity requirements for each of the above sub-
catchments out to the design year horizon of 2050 to establish the optimum implementation strategy
for the required flow diversions.
7.2 Analysis of Projected Treatment Capacity Requirements
7.2.1 Blanchardstown (9C Sewer) Sub-Catchment
The projected treatment capacity required, expressed as population equivalent, in the 9C Sewer Sub-
Catchment north of the M50, under the ‘most likely’ growth scenario is summarised in Table 7.1. This
includes population growth as per Table 3.5, commercial growth as per Section 4.2, provision for
industry as per Section 4.1 and the proposed load transfer from the Leixlip WwTP catchment.
Table 7.1 Summary of Projected Treatment Capacity Requirements (PE) – 9C Sewer Sub-Catchment
Design Year
2016 2025 2031 2040 2050
Scenario 3 – Most Likely Growth 166,040 363,385 376,151 392,697 411,939
Assessment of Domestic & Non-Domestic Load on
Proposed Regional WwTP
32102902_01 26
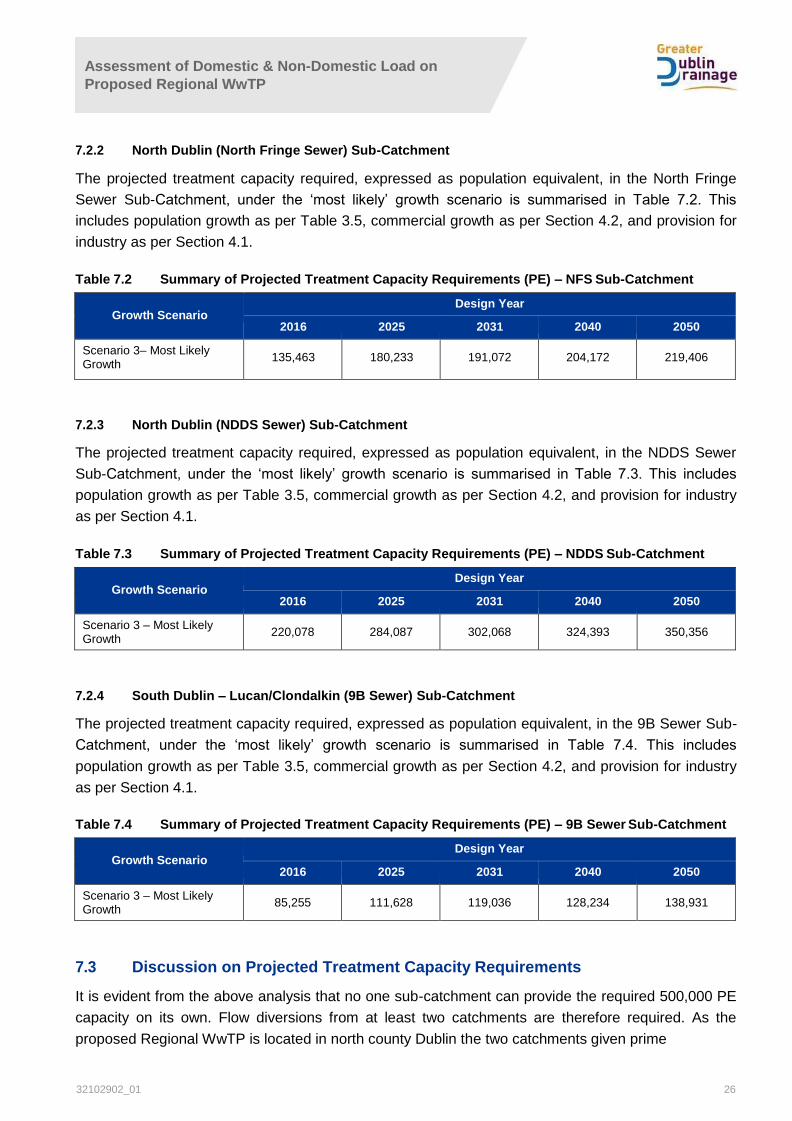
7.2.2 North Dublin (North Fringe Sewer) Sub-Catchment
The projected treatment capacity required, expressed as population equivalent, in the North Fringe
Sewer Sub-Catchment, under the ‘most likely’ growth scenario is summarised in Table 7.2. This
includes population growth as per Table 3.5, commercial growth as per Section 4.2, and provision for
industry as per Section 4.1.
Table 7.2 Summary of Projected Treatment Capacity Requirements (PE) – NFS Sub-Catchment
Growth Scenario
Design Year
2016 2025 2031 2040 2050
Scenario 3– Most Likely Growth
135,463 180,233 191,072 204,172 219,406
7.2.3 North Dublin (NDDS Sewer) Sub-Catchment
The projected treatment capacity required, expressed as population equivalent, in the NDDS Sewer
Sub-Catchment, under the ‘most likely’ growth scenario is summarised in Table 7.3. This includes
population growth as per Table 3.5, commercial growth as per Section 4.2, and provision for industry
as per Section 4.1.
Table 7.3 Summary of Projected Treatment Capacity Requirements (PE) – NDDS Sub-Catchment
Growth Scenario
Design Year
2016 2025 2031 2040 2050
Scenario 3 – Most Likely Growth
220,078 284,087 302,068 324,393 350,356
7.2.4 South Dublin – Lucan/Clondalkin (9B Sewer) Sub-Catchment
The projected treatment capacity required, expressed as population equivalent, in the 9B Sewer Sub-
Catchment, under the ‘most likely’ growth scenario is summarised in Table 7.4. This includes
population growth as per Table 3.5, commercial growth as per Section 4.2, and provision for industry
as per Section 4.1.
Table 7.4 Summary of Projected Treatment Capacity Requirements (PE) – 9B Sewer Sub-Catchment
Growth Scenario
Design Year
2016 2025 2031 2040 2050
Scenario 3 – Most Likely Growth
85,255 111,628 119,036 128,234 138,931
7.3 Discussion on Projected Treatment Capacity Requirements
It is evident from the above analysis that no one sub-catchment can provide the required 500,000 PE
capacity on its own. Flow diversions from at least two catchments are therefore required. As the
proposed Regional WwTP is located in north county Dublin the two catchments given prime
Assessment of Domestic & Non-Domestic Load on
Proposed Regional WwTP
32102902_01 27
consideration for diversion are the Blanchardstown (9C Sewer) catchment and the North Fringe
Sewer (NFS) catchment.
7.3.1 Blanchardstown (9C Sewer) Catchment
The largest flow and load diversion is available from the Blanchardstown catchment. This flow and
load is inclusive of the transferred flows from Leixlip. Constraints on the 9C sewer network
downstream of Blanchardstown, which severely limit its capacity to transfer the projected future flows
in this catchment to Ringsend WwTP include:
The 9C sewer twin syphons under the River Liffey;
The Davitt Road/Dolphin Road Sewer, which also serves the Lucan/Clondalkin 9B sewer; and
the inlet syphon from the Main Lift Pumping Station (MLPS) to Ringsend WwTP.
Diversion of this sub-catchment to the proposed Regional WwTP would therefore free up capacity in
the downstream network, in particular the Davitt Road/Dolphin Road sewer and the Grand Canal
Tunnel Sewer (GCTS), enabling growth to continue in the connected catchments. This applies in
particular to the Lucan/Clondalkin (9B sewer) catchment where there is substantial scope for
development for housing (Adamstown SDZ and Clonburris SDZ) and industrial units, and the City
Centre catchment where growth through urban regeneration, development of brownfield sites and
urban densification is occurring.
It is therefore recommended that diversion of this sub-catchment to the proposed Regional WwTP be
considered a priority. This diversion will provide a projected 411,939 PE of the required 500,000 PE
at 2050 under the ‘most likely’ growth scenario.
7.3.2 North Dublin (North Fringe Sewer) Catchment
A diversion of the entire North Fringe Sewer (NFS) catchment would provide a projected treatment
capacity requirement of 219,406 PE at 2050 under the ‘most likely’ growth scenario at the proposed
Regional WwTP. Coupled with the diversion of the Blanchardstown (9C Sewer) catchment this would
provide a projected treatment capacity requirement of 631,345 PE at 2050 at the proposed Regional
WwTP. This exceeds the required 500,000 PE load diversion therefore a full diversion of this
catchment is not required before 2050. A partial diversion of the NFS, as discussed below, is instead
proposed.
This partial diversion of the NFS catchment envisages intercepting the NFS between existing NFS
manholes MH1-50 and MH1-51, which are located approximately 500m due south of the proposed
Regional WwTP and immediately north of the R139. The diversion sewer would be routed into the
Regional WwTP along the proposed access road off the R139. In this scenario all sub-catchments of
the NFS located to the west of the Regional WwTP will be diverted, including north Finglas, Ballymun
and Dublin Airport. The projected treatment capacity requirements expressed as population
equivalent, for these sub-catchments under the ‘most likely’ growth scenario is summarised in Table
7.5
Assessment of Domestic & Non-Domestic Load on
Proposed Regional WwTP
32102902_01 28
Table 7.5 Summary of Projected Treatment Capacity Requirements (PE) – NFS Sub-Catchments
west of Regional WwTP
Design Year
2016 2025 2031 2040 2050
Scenario 3 – Most Likely Growth
53,108 75,036 79,089 84,703 89,973
This proposed partial diversion of the NFS catchment will provide a projected 89,973 PE treatment
capacity requirement at the proposed Regional WwTP. Coupled with the proposed diversion of the
Blanchardstown (9C Sewer+ Leixlip transfer) catchment the required treatment capacity at the
proposed Regional WwTP is projected as 501,912 PE at 2050. This proposed partial diversion would
also reduce the flows arriving at Sutton Pumping Station thereby relieving operational pressures at
this facility.
The required 500,000 PE diversion of projected treatment capacity requirement from the Ringsend
catchment is therefore satisfied by diverting the Blanchardstown (9C Sewer + Leixlip transfer)
catchment and the sub-catchments of the NFS located west of the proposed Regional WwTP.
7.3.3 North Dublin (NDDS Sewer) Catchment
With the proposed diversions of the Blanchardstown (9C Sewer) catchment and the NFS sub-
catchments west of the proposed Regional WwTP there is no requirement to divert the NDDS Sewer
catchment prior to 2050.
Furthermore, it should be noted that diversion of this catchment is dependent on the diversion of the
entire NFS catchment as it is not considered feasible to divert the NDDS sewer until the NFS
catchment (including Portmarnock and Baldoyle) is diverted as discussed in Chapter 8.
7.3.4 South Dublin – Lucan/Clondalkin (9B Sewer) Catchment
As discussed above the diversion of the Blanchardstown (9C Sewer) sub-catchment will free up
capacity in the downstream sewer network, which also serves the Lucan/Clondalkin (9B Sewer)
catchment. As a result, there is no requirement to divert this catchment to the proposed Regional
WwTP before 2050.

Assessment of Domestic & Non-Domestic Load on
Proposed Regional WwTP
32102902_01 29
8. Options for Diverting the Northern & Western Sub-Catchments
8.1 Introduction
This chapter examines options for diverting the main trunk sewers serving the catchments in the
northern, north- western and western area of the Ringsend catchment to the proposed Regional
WwTP.
8.2 Blanchardstown (9C Sewer) Catchment
Irish Water have recently received planning permission (FW17A/0083) for a drainage scheme to
duplicate the existing 9C sewer in the Tolka River Valley Park between the townlands of Parlickstown
and Deanstown in Mulhuddart and Blanchardstown, Dublin 15.
In considering options for diverting flows from the 9C Sewer it is assumed that the works included in
this planning permission will be completed in advance of or in parallel with the Greater Dublin
Drainage project.
The Blanchardstown – Clonshagh Orbital Sewer will transfer flows from the existing Blanchardstown
drainage catchment, which includes Blanchardstown and its environs and the Meath towns and
villages of Ashbourne, Ratoath, Kilbride, Dunboyne & Clonee, to the proposed Regional WwTP at
Clonshagh (Clonsgaugh). The orbital sewer commences in the grounds of Waterville Park,
Blanchardstown where it intercepts the 9C sewer. From this point it is routed through the grounds of
Connolly Hospital and the grounds of the National Sports Campus to the proposed Abbotstown
Pumping Station, located adjacent to the M50 see Figure 8.1. From this pumping station the Orbital
Sewer it is routed north of and generally parallel to the M50 to Clonshagh passing, en-route, south of
the Dublin Airport complex. The lands along the length of the orbital sewer are generally open fields
with agriculture the main land use pattern. The total length of this Orbital Sewer is 13,723 m.

Assessment of Domestic & Non-Domestic Load on
Proposed Regional WwTP
32102902_01 30
Figure 8.1 Diversion Options for 9C Sewer to Orbital Sewer
For the residual 9C Sewer Catchment downstream of the M50 three options for dealing with the flows
(ref. options 2, 3 & 4 on Fig 8.1) have been examined as set out hereunder. All options have been
considered in conjunction with dealing with potential future flows from the Pelletstown area, refer to
Fig. 8.2 below, which is identified as a Strategic Development and Regeneration Area (SDRA) in the
Dublin City Development Plan 2016 – 2022 (Interim Publication) and therefore one of the key areas in
the north city area for future development.

Assessment of Domestic & Non-Domestic Load on
Proposed Regional WwTP
32102902_01 31
Figure 8.2 Foul Drainage Options for the Pelletstown SDRA
Option 2 as shown on Figure 8.1 is to leave these residual flows continue to flow through one of the
Liffey Siphons to the Grand Canal Tunnel sewer. However, this residual flow is insufficient to
maintain self-cleansing velocities in the Liffey siphon. This concern may be overcome by draining the
Pellettstown area in this direction also (Option 2 on Figure 8.2).
Option 3, as shown on Figure 8.1, considered collecting these residual flows to a small pumping
station and pump them back to the main 9C Sewer interception point. Crossing of the M50 could be
achieved by using the existing pipe bridge as a pipe sleeve for the pumped main in the reverse
direction. Future flows from the Pelletstown area could also be drained to the Orbital Sewer by using
this pumping station (Option 3 on Figure 8.2).
Option 4 as shown on Figure 8.1 examined connecting the residual flows to the head of the NDDS
sewer. This option would compete for capacity in the NDDS sewer with future flows from Pelletstown
(Option 4 on Figure 8.2) and has the potential to impact unfavourably on downstream CSOs.
Modelling of the NDDS sewer would be required to confirm this option.
Option 2, allowing the flows in the 9C Sewer Catchment downstream of the M50 to continue to flow to
the GCTS, is the preferred option. Future flows from the Pelletstown SDRA should also be connected
to the 9C Sewer once the catchment upstream of the M50 is diverted. It is recommended that the
potential for diverting the Ashtown section of the NDDS sewer, south of the Railway and canal
Assessment of Domestic & Non-Domestic Load on
Proposed Regional WwTP
32102902_01 32
crossing, to the 9C Sewer in the vicinity of the Phoenix Park, to augment flows through the Liffey
Syphons following diversion of the catchment upstream of the M50 be further examined.
Ashbourne/ Ratoath
The towns of Ashbourne and Ratoath in County Meath currently drain to the 9C Sewer via a pumping
station at Kilbride. The GDSDS recommendations indicated that foul flows from both these towns
would be pumped directly to the Orbital Sewer from Kilbride. Modelling work undertaken on the 9C
Sewer as part of the BRDS Preliminary Report also assumed that Ashbourne and Ratoath would be
pumped directly to the Orbital Sewer from Kilbride and thus the future foul flows from these two towns
were not considered in model runs post 2020 in examining options for upgrading the 9C Sewer.
Additional model runs, testing revised design scenarios, on the BRDS 9C Sewer model indicate that
capacity exists in the 9C duplication to retain the flows pumped from Ashbourne, Ratoath and Kilbride
without significant detriment in the 9C Sewer Catchment. This is the preferred option for transferring
of flows and is shown as Option 1 on Figure 8.3.
Figure. 8.3 Connection Options for Ashbourne/Ratoath to Orbital Sewer
Option 1 (Figure 8.3) considers retaining the connection from Ashbourne and Ratoath to the 9C
Sewer.
Assessment of Domestic & Non-Domestic Load on
Proposed Regional WwTP
32102902_01 33
8.3 North Fringe Sewer (NFS) Catchment
Diversion options for this catchment considered diversion of the entire catchment and a partial
diversion of the NFS sub-catchments west of the proposed Regional WwTP.
Diversion of the entire NFS catchment envisages interception of the NFS at manhole MH2-8,
downstream of the Grange storm tank and immediately east of the Dublin-Belfast rail line in the
townland of Grange (refer to Figure 8.4), and diverting flows to a new Grange pumping station for
transfer to the proposed Regional WwTP. Flows from the existing Portmarnock and Baldoyle
Pumping Stations would also be diverted to the new Grange Pumping Station at this stage.
Figure. 8.4 NFS Catchment Diversion
The partial diversion of the NFS catchment envisages interception of the NFS between manholes
MH1-50 and MH1-51, which are located approximately 500m due south of the proposed Regional
WwTP (refer to Figure 8.5), and diverting flows directly to the Regional WwTP. The diversion sewer
would be routed into the Regional WwTP along the proposed access road off the R139. In this
scenario all sub-catchments of the NFS west of the Regional WwTP would be diverted, including
north Finglas, Ballymun and Dublin Airport. This option would also significantly reduce the pumping
requirements at Grange Pumping Station when the entire catchment is diverted.
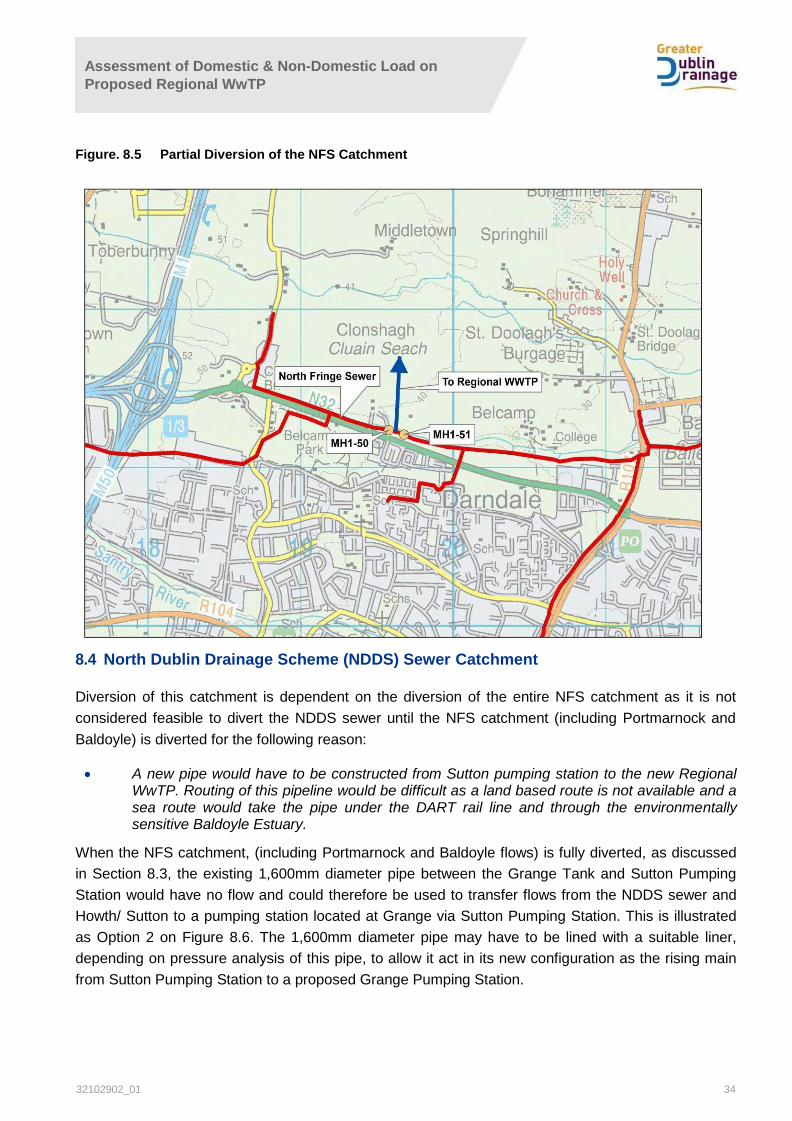
Assessment of Domestic & Non-Domestic Load on
Proposed Regional WwTP
32102902_01 34
Figure. 8.5 Partial Diversion of the NFS Catchment
8.4 North Dublin Drainage Scheme (NDDS) Sewer Catchment
Diversion of this catchment is dependent on the diversion of the entire NFS catchment as it is not
considered feasible to divert the NDDS sewer until the NFS catchment (including Portmarnock and
Baldoyle) is diverted for the following reason:
A new pipe would have to be constructed from Sutton pumping station to the new RegionalWwTP. Routing of this pipeline would be difficult as a land based route is not available and asea route would take the pipe under the DART rail line and through the environmentallysensitive Baldoyle Estuary.
When the NFS catchment, (including Portmarnock and Baldoyle flows) is fully diverted, as discussed
in Section 8.3, the existing 1,600mm diameter pipe between the Grange Tank and Sutton Pumping
Station would have no flow and could therefore be used to transfer flows from the NDDS sewer and
Howth/ Sutton to a pumping station located at Grange via Sutton Pumping Station. This is illustrated
as Option 2 on Figure 8.6. The 1,600mm diameter pipe may have to be lined with a suitable liner,
depending on pressure analysis of this pipe, to allow it act in its new configuration as the rising main
from Sutton Pumping Station to a proposed Grange Pumping Station.
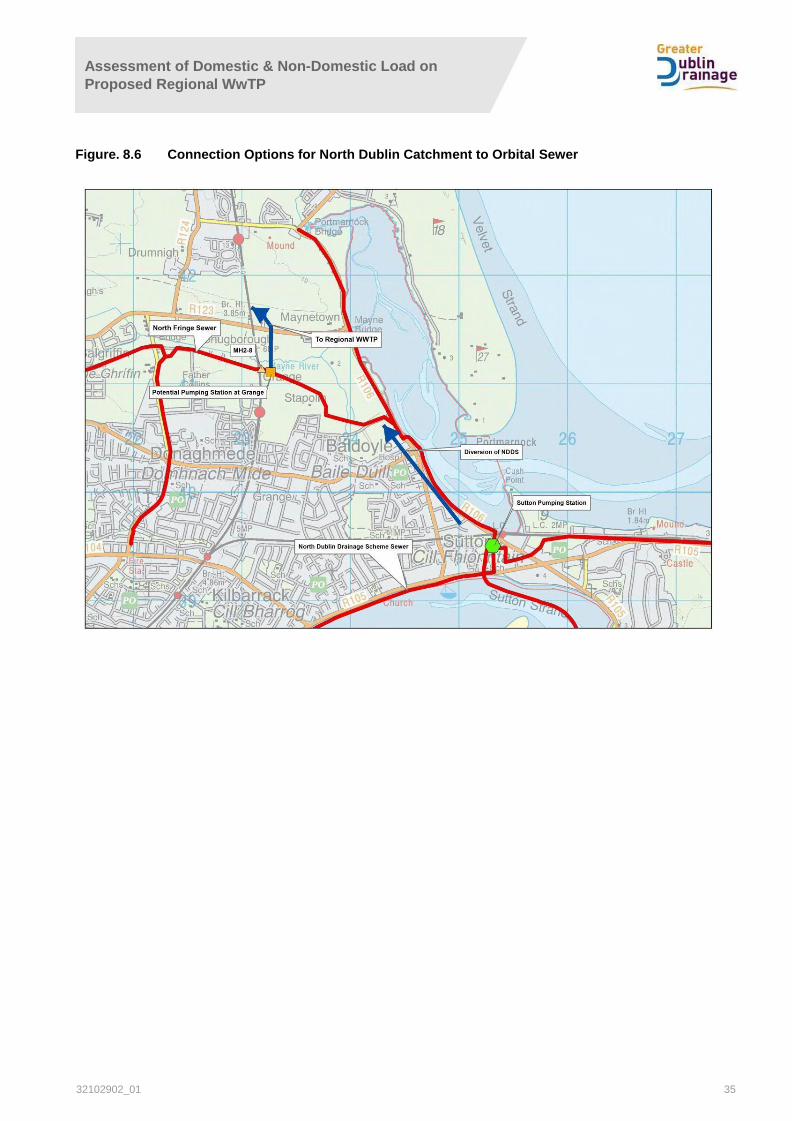
Assessment of Domestic & Non-Domestic Load on
Proposed Regional WwTP
32102902_01 35
Figure. 8.6 Connection Options for North Dublin Catchment to Orbital Sewer

Assessment of Domestic & Non-Domestic Load on
Proposed Regional WwTP
32102902_01 36
8.5 9B (Lucan/ Clondalkin) Sub-Catchment
A strict limit of 2.0 m3/sec was placed on pass forward flows from the 9B Sewer Catchment to the
Grand Canal Tunnel Sewer (GCTS) in the GDSDS final strategy recommendations. This limit on
pass forward flows was set, due to capacity constraints in the GCTS and particularly in the 9B/9C
Sewer along Davitt Road / Dolphin Road, and the requirement to accommodate pass forward flows of
2.70 m3/sec from the 9C Sewer Catchment in the Davitt Road / Dolphin Road sewer and the GCTS.
The interception and diversion of 9C Sewer (Blanchardstown) flows to the Orbital sewer, now
proposed, will free up capacity in the Grand Canal Tunnel Sewer (GCTS) and more particularly in the
9B/9C Davitt Road/Dolphin Road sewer. This should allow flows greater than the 2.0 m3/sec limit set
by GDSDS to be passed forward from the 9B Sewer Catchment to the GCTS.
Modelling work carried out by others as part of the BRDS Preliminary Report indicates that the pipe
full capacity of the sewer along Davitt Road/Dolphin Road varies from a minimum of 3.125 m3/sec in
the flattest sections of this sewer to a maximum of 6.175 m3/sec in the steeper sections.
Flow measurement records for the years 2009 and 2010 indicate that flows from the 9B Sewer
Catchment were significantly less than the GDSDS limit of 2.0 m3/sec placed on pass forward flows
from 9B Sewer Catchment to the GCTS.
Modelling work carried out on the 9B Sewer, as part of the GDSDS, projected year 2031 Dry Weather
Flow at 1.42 m3/sec, with a wet weather peak flow estimated as 12.03 m3/sec, based on the 100-year
return period rainfall of 180-minute duration. It should be noted that significant inflow of storm flows
(equivalent to runoff from 7.5% of gross future development area) to the foul sewers was allowed for
in the GDSDS models. This volume of storm inflow to the foul sewers is unsustainable as a matter of
best practice design and it is recommended that the allowance for storm run-off equivalent to 7.5% of
gross future development area to foul sewers be reconsidered, especially in light of the New
Development Policies recommended as part of the GDSDS.
These modelling scenarios need to be validated in terms of catchment, storm run-off management
and load issues. Irish Water advise that a separate strategic study will be commissioned on the 9B
catchment to examine this in detail.
Pass forward flows from the 9B Sewer Catchment to the GCTS should be maximised to make best
use of existing downstream infrastructure, before consideration of flow diversion to the Orbital sewer
is considered. Furthermore, a realistic view of stormwater management in the existing development
and effective planning control of future developments (using SUDS systems) should be taken.
Options for maximizing use of downstream infrastructure, particularly the GCTS, include duplication of
the Davitt Road sewer (Option 1 on Figure 8.7) or part diversion of the pass forward flows to the
Dolphin Road sewer (Option 2 on Figure 8.7).
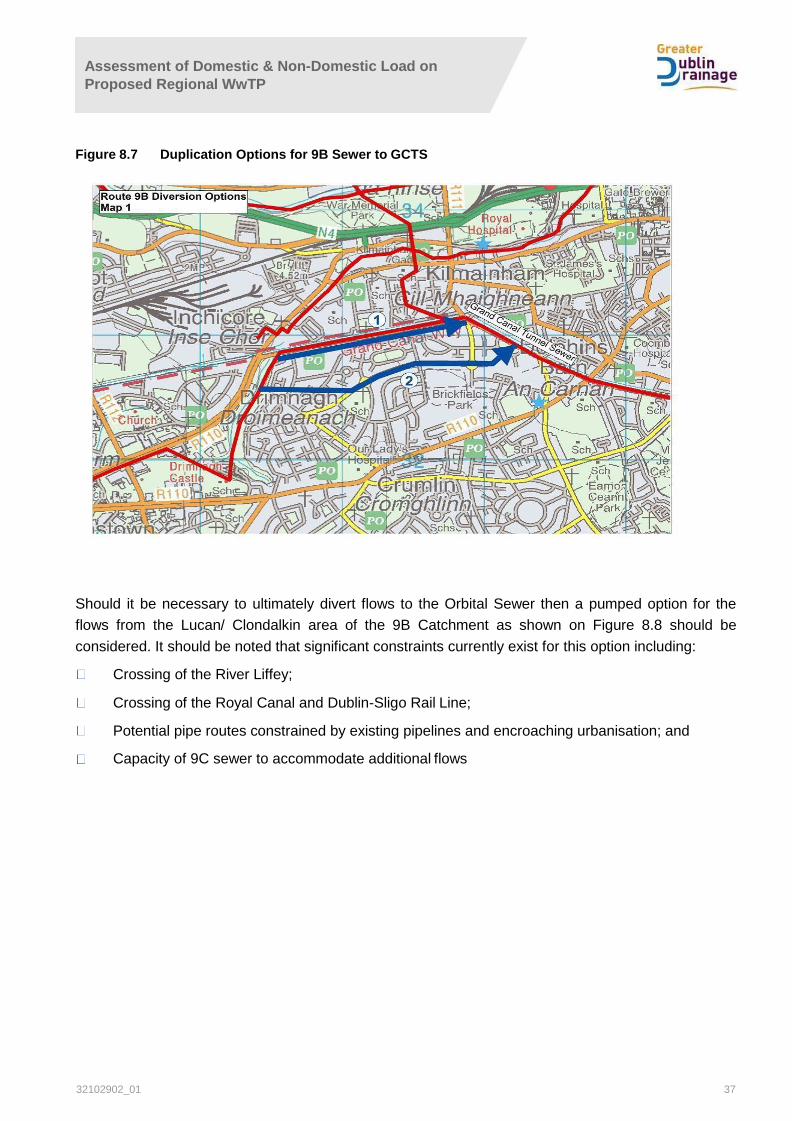
Assessment of Domestic & Non-Domestic Load on
Proposed Regional WwTP
32102902_01 37
Figure 8.7 Duplication Options for 9B Sewer to GCTS
Should it be necessary to ultimately divert flows to the Orbital Sewer then a pumped option for the
flows from the Lucan/ Clondalkin area of the 9B Catchment as shown on Figure 8.8 should be
considered. It should be noted that significant constraints currently exist for this option including:
Crossing of the River Liffey;
Crossing of the Royal Canal and Dublin-Sligo Rail Line;
Potential pipe routes constrained by existing pipelines and encroaching urbanisation; and
Capacity of 9C sewer to accommodate additional flows
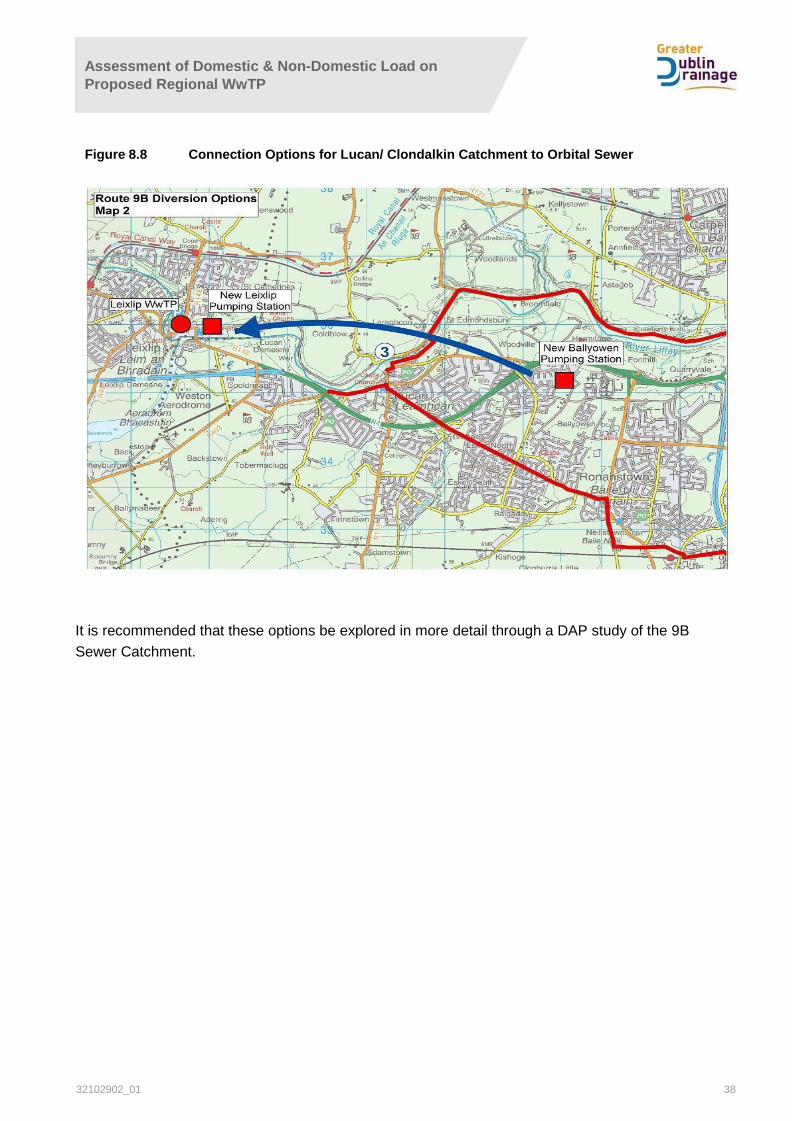
Assessment of Domestic & Non-Domestic Load on
Proposed Regional WwTP
32102902_01 38
Figure 8.8 Connection Options for Lucan/ Clondalkin Catchment to Orbital Sewer
It is recommended that these options be explored in more detail through a DAP study of the 9B
Sewer Catchment.
Assessment of Domestic & Non-Domestic Load on
Proposed Regional WwTP
32102902_01 39
9. Conclusions and Recommendations
9.1 Conclusions
Domestic and Non-Domestic load on Ringsend WwTP will continue to grow under the growth
scenarios examined.
The projected load development on Ringsend WwTP under the ‘most likely’ growth scenario indicates
that the treatment capacity of 2.4 million PE to be provided at Ringsend WwTP will be exceeded in
2024. At 2050 this exceedance is projected at 508,024 PE.
Therefore, it will be necessary to divert flow and load out of the Ringsend catchment to the proposed
Regional WwTP in order to maintain the loading on Ringsend WwTP below its treatment capacity of
2.4 million PE.
Diversion of the Blanchardstown (9C Sewer) catchment, inclusive of flows transferred to it from Leixlip
WwTP, and the NFS sub-catchments located west of the proposed Regional WwTP will provide the
necessary diversions from the Ringsend catchment to maintain the loading on Ringsend WwTP below
2.4 million PE.
It is feasible to divert wastewater from these catchments to the new Regional WwTP.
9.2 Recommendations
In developing the load transfer to the proposed Regional WwTP for planning purposes it is
recommended that the ‘most likely’ growth scenario be used.
It is therefore recommended that the GDD project be designed to provide a wastewater treatment
capacity of 500,000 PE.
Prudent planning suggests that load diversion from Ringsend WwTP commences before its treatment
capacity is exceeded. Therefore, it is recommended that flow diversions commence as set out
hereunder:
9C Sewer Catchment upstream of the M50 at 2025 (including the transferred flows from
Leixlip); and
NFS sub-catchments located west of the proposed Regional WwTP.
The required load diversions from the Ringsend Catchment would be satisfied at all stages up to
and beyond 2050 (the design year horizon) by diverting the wastewater load generated in each of
the above sub-catchments.
9.3 Projected Utilisation of Treatment Capacity provided at Regional WwTP
The projected utilisation of the treatment capacity to be provided at the Regional WwTP proposed
under the GDD project is set out in Table 9.1 out to year 2050.
Table 9.1 Development of Required Treatment Capacity at Proposed Regional WwTP
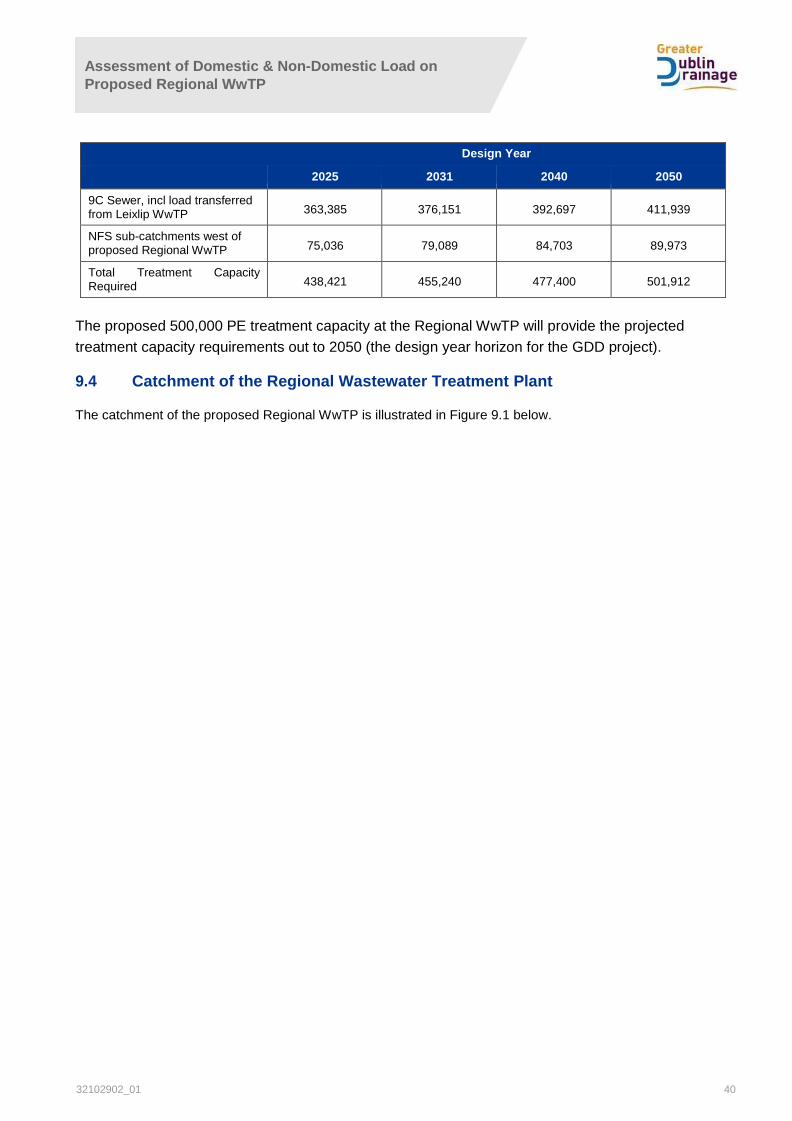
Assessment of Domestic & Non-Domestic Load on
Proposed Regional WwTP
32102902_01 40
Design Year
2025 2031 2040 2050
9C Sewer, incl load transferred from Leixlip WwTP 363,385 376,151 392,697 411,939
NFS sub-catchments west of proposed Regional WwTP 75,036 79,089 84,703 89,973
Total Treatment Capacity Required 438,421 455,240 477,400 501,912
The proposed 500,000 PE treatment capacity at the Regional WwTP will provide the projected
treatment capacity requirements out to 2050 (the design year horizon for the GDD project).
9.4 Catchment of the Regional Wastewater Treatment Plant
The catchment of the proposed Regional WwTP is illustrated in Figure 9.1 below.
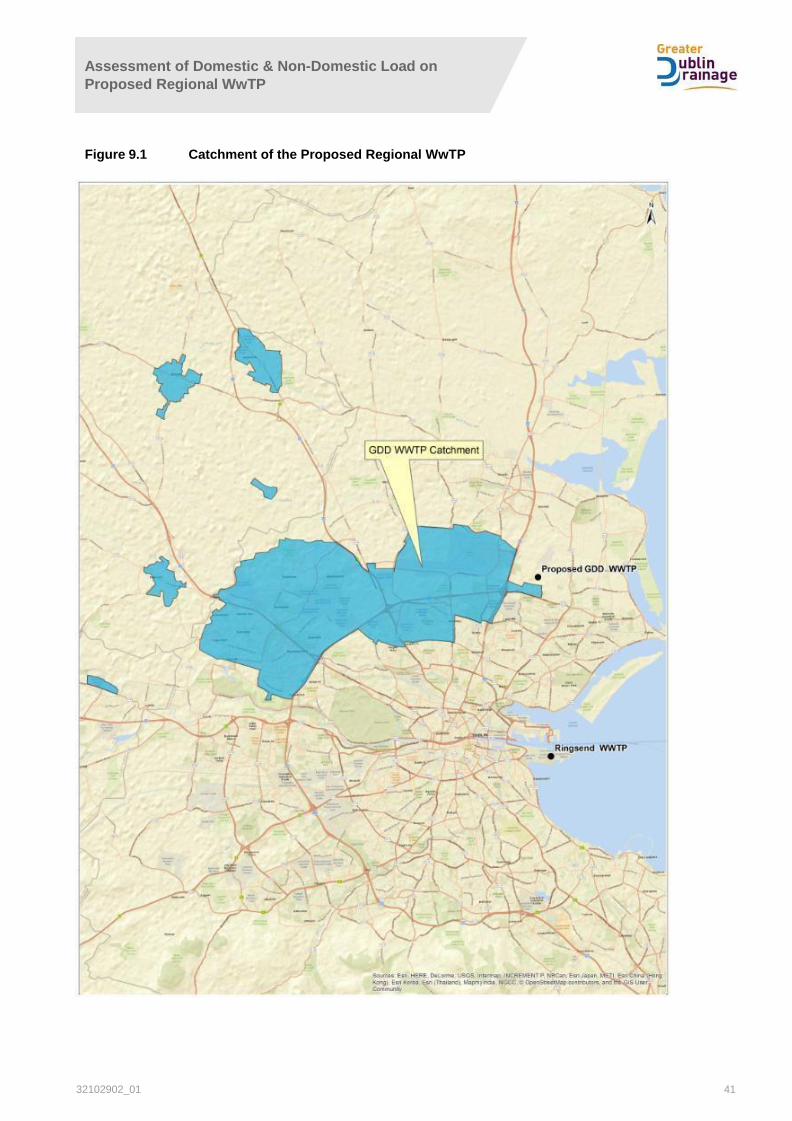
Assessment of Domestic & Non-Domestic Load on
Proposed Regional WwTP
32102902_01 41
Figure 9.1 Catchment of the Proposed Regional WwTP

32102902_01
Assessment of Domestic & Non-Domestic Load on
Proposed Regional WwTP
Appendix A. Loading Analysis on Wastewater Treatment Plants
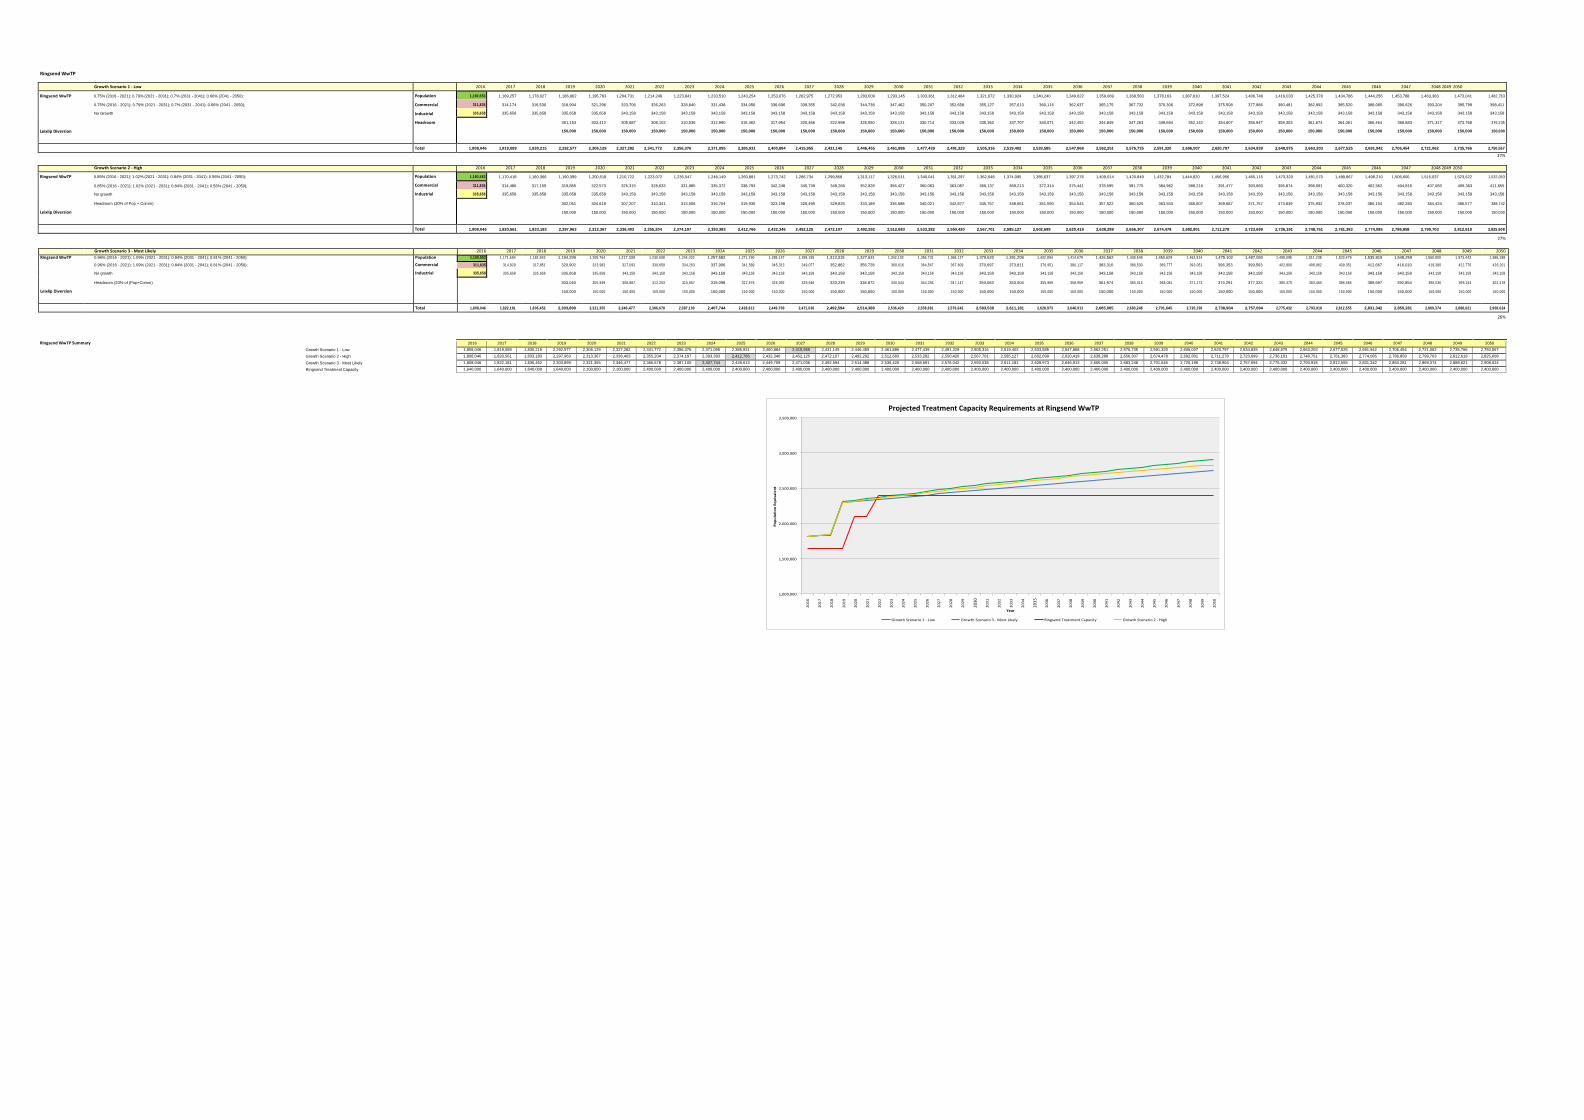
Ringsend WwTP
Growth Scenario 1 - Low 2016 2017 2018 2019 2020 2021 2022 2023 2024 2025 2026 2027 2028 2029 2030 2031 2032 2033 2034 2035 2036 2037 2038 2039 2040 2041 2042 2043 2044 2045 2046 2047 2048 2049 2050
Ringsend WwTP 0.75% (2016 - 2021); 0.79% (2021 - 2031); 0.7% (2031 - 2041); 0.66% (2041 - 2050);
0.75% (2016 - 2021); 0.79% (2021 - 2031); 0.7% (2031 - 2041); 0.66% (2041 - 2050);
No Growth
Leixlip Diversion
Population
Commercial
Industrial
Headroom
1,160,553 1,169,257 1,178,027 1,186,862 1,195,763 1,204,731 1,214,249 1,223,841 1,233,510 1,243,254 1,253,076 1,262,975 1,272,953 1,283,009 1,293,145 1,303,361 1,312,484 1,321,672 1,330,924 1,340,240 1,349,622 1,359,069 1,368,583 1,378,163 1,387,810 1,397,524 1,406,748 1,416,033 1,425,378 1,434,786 1,444,256 1,453,788 1,463,383 1,473,041 1,482,763
314,174 316,530 318,904 321,296 323,706 326,263 328,840 331,438 334,056 336,696 339,355 342,036 344,738 347,462 350,207 352,658 355,127 357,613 360,116 362,637 365,175 367,732 370,306 372,898 375,508 377,986 380,481 382,992 385,520 388,065 390,626 393,204 395,799 398,411
335,658 335,658 335,658 335,658 343,158 343,158 343,158 343,158 343,158 343,158 343,158 343,158 343,158 343,158 343,158 343,158 343,158 343,158 343,158 343,158 343,158 343,158 343,158 343,158 343,158 343,158 343,158 343,158 343,158 343,158 343,158 343,158 343,158 343,158
311,835
335,658
301,153 303,412 305,687 308,102 310,536 312,990 315,462 317,954 320,466 322,998 325,550 328,121 330,714 333,029 335,360 337,707 340,071 342,452 344,849 347,263 349,694 352,142 354,607 356,947 359,303 361,674 364,061 366,464 368,883 371,317 373,768 376,235
150,000 150,000 150,000 150,000 150,000 150,000 150,000 150,000 150,000 150,000 150,000 150,000 150,000 150,000 150,000 150,000 150,000 150,000 150,000 150,000 150,000 150,000 150,000 150,000 150,000 150,000 150,000 150,000 150,000 150,000 150,000 150,000
Total 1,808,046 1,819,089 1,830,215 2,292,577 2,306,129 2,327,282 2,341,772 2,356,376 2,371,095 2,385,931 2,400,884 2,415,955 2,431,145 2,446,455 2,461,886 2,477,439 2,491,329 2,505,316 2,519,402 2,533,585 2,547,868 2,562,251 2,576,735 2,591,320 2,606,007 2,620,797 2,634,839 2,648,975 2,663,203 2,677,525 2,691,942 2,706,454 2,721,062 2,735,766 2,750,567
27%
Growth Scenario 2 - High 2016 2017 2018 2019 2020 2021 2022 2023 2024 2025 2026 2027 2028 2029 2030 2031 2032 2033 2034 2035 2036 2037 2038 2039 2040 2041 2042 2043 2044 2045 2046 2047 2048 2049 2050
Ringsend WwTP 0.85% (2016 - 2021); 1.02% (2021 - 2031); 0.84% (2031 - 2041); 0.56% (2041 - 2050);
0.85% (2016 - 2021); 1.02% (2021 - 2031); 0.84% (2031 - 2041); 0.56% (2041 - 2050);
No growth
Headroom (20% of Pop + Comm)
Leixlip Diversion
Population
Commercial
Industrial
1,160,553 1,170,418 1,180,366 1,190,399 1,200,518 1,210,722 1,223,072 1,235,547 1,248,149 1,260,881 1,273,742 1,286,734 1,299,858 1,313,117 1,326,511 1,340,041 1,351,297 1,362,648 1,374,095 1,385,637 1,397,276 1,409,014 1,420,849 1,432,784 1,444,820 1,456,956 1,465,115 1,473,320 1,481,570 1,489,867 1,498,210 1,506,600 1,515,037 1,523,522 1,532,053
314,486 317,159 319,855 322,573 325,315 328,633 331,985 335,372 338,793 342,248 345,739 349,266 352,828 356,427 360,063 363,087 366,137 369,213 372,314 375,441 378,595 381,775 384,982 388,216 391,477 393,669 395,874 398,091 400,320 402,562 404,816 407,083 409,363 411,655
335,658 335,658 335,658 335,658 343,158 343,158 343,158 343,158 343,158 343,158 343,158 343,158 343,158 343,158 343,158 343,158 343,158 343,158 343,158 343,158 343,158 343,158 343,158 343,158 343,158 343,158 343,158 343,158 343,158 343,158 343,158 343,158 343,158 343,158
311,835
335,658
302,051 304,618 307,207 310,341 313,506 316,704 319,935 323,198 326,495 329,825 333,189 336,588 340,021 342,877 345,757 348,661 351,590 354,544 357,522 360,525 363,553 366,607 369,687 371,757 373,839 375,932 378,037 380,154 382,283 384,424 386,577 388,742
150,000 150,000 150,000 150,000 150,000 150,000 150,000 150,000 150,000 150,000 150,000 150,000 150,000 150,000 150,000 150,000 150,000 150,000 150,000 150,000 150,000 150,000 150,000 150,000 150,000 150,000 150,000 150,000 150,000 150,000 150,000 150,000
Total 1,808,046 1,820,561 1,833,183 2,297,963 2,313,367 2,336,403 2,355,204 2,374,197 2,393,383 2,412,766 2,432,346 2,452,125 2,472,107 2,492,292 2,512,683 2,533,282 2,550,420 2,567,701 2,585,127 2,602,699 2,620,419 2,638,288 2,656,307 2,674,478 2,692,801 2,711,278 2,723,699 2,736,191 2,748,751 2,761,383 2,774,085 2,786,858 2,799,703 2,812,619 2,825,608
27%
Growth Scenario 3 - Most Likely 2016 2017 2018 2019 2020 2021 2022 2023 2024 2025 2026 2027 2028 2029 2030 2031 2032 2033 2034 2035 2036 2037 2038 2039 2040 2041 2042 2043 2044 2045 2046 2047 2048 2049 2050
Ringsend WwTP 0.96% (2016 - 2021); 1.09% (2021 - 2031); 0.84% (2031 - 2041); 0.81% (2041 - 2050); Population 1,160,553 1,171,694 1,182,943 1,194,299 1,205,764 1,217,339 1,230,608 1,244,022 1,257,582 1,271,290 1,285,147 1,299,155 1,313,315 1,327,631 1,342,102 1,356,731 1,368,127 1,379,620 1,391,208 1,402,894 1,414,679 1,426,562 1,438,545 1,450,629 1,462,814 1,475,102 1,487,050 1,499,095 1,511,238 1,523,479 1,535,819 1,548,259 1,560,800 1,573,443 1,586,188
0.96% (2016 - 2021); 1.09% (2021 - 2031); 0.84% (2031 - 2041); 0.81% (2041 - 2050); Commercial 311,835 314,829 317,851 320,902 323,983 327,093 330,659 334,263 337,906 341,589 345,313 349,077 352,882 356,728 360,616 364,547 367,609 370,697 373,811 376,951 380,117 383,310 386,530 389,777 393,051 396,353 399,563 402,800 406,062 409,351 412,667 416,010 419,380 422,776 426,201
No growth Industrial 335,658 335,658 335,658 335,658 335,658 343,158 343,158 343,158 343,158 343,158 343,158 343,158 343,158 343,158 343,158 343,158 343,158 343,158 343,158 343,158 343,158 343,158 343,158 343,158 343,158 343,158 343,158 343,158 343,158 343,158 343,158 343,158 343,158 343,158 343,158
Headroom (20% of (Pop+Comm) 303,040 305,949 308,887 312,253 315,657 319,098 322,576 326,092 329,646 333,239 336,872 340,544 344,256 347,147 350,063 353,004 355,969 358,959 361,974 365,015 368,081 371,173 374,291 377,323 380,379 383,460 386,566 389,697 392,854 396,036 399,244 402,478
Leixlip Diversion 150,000 150,000 150,000 150,000 150,000 150,000 150,000 150,000 150,000 150,000 150,000 150,000 150,000 150,000 150,000 150,000 150,000 150,000 150,000 150,000 150,000 150,000 150,000 150,000 150,000 150,000 150,000 150,000 150,000 150,000 150,000 150,000
Total 1,808,046 1,822,181 1,836,452 2,303,899 2,321,355 2,346,477 2,366,678 2,387,100 2,407,744 2,428,613 2,449,709 2,471,036 2,492,594 2,514,388 2,536,420 2,558,691 2,576,042 2,593,538 2,611,181 2,628,973 2,646,913 2,665,005 2,683,248 2,701,645 2,720,196 2,738,904 2,757,094 2,775,432 2,793,918 2,812,555 2,831,342 2,850,281 2,869,374 2,888,621 2,908,024
26%
Ringsend WwTP Summary
Growth Scenario 1 - Low
Growth Scenario 2 - High
Growth Scenario 3 - Most Likely
Ringsend Treatment Capacity
Growth Scenario 2 - High Ringsend Treatment Capacity Growth Scenario 3 - Most Likely Growth Scenario 1 - Low
Year
1,000,000
1,500,000
2,000,000
2,500,000
3,000,000
3,500,000
Projected Treatment Capacity Requirements at Ringsend WwTP
Po
pu
lati
on
Eq
uiv
ale
nt
20
16
20
17
20
18
20
19
20
20
20
21
20
22
20
23
20
24
20
25
20
26
20
27
20
28
20
29
20
30
20
31
20
32
20
33
20
34
20
35
20
36
20
37
20
38
20
39
20
40
20
41
20
42
20
43
20
44
20
45
20
46
20
47
20
48
20
49
20
50
2016 2017 2018 2019 2020 2021 2022 2023 2024 2025 2026 2027 2028 2029 2030 2031 2032 2033 2034 2035 2036 2037 2038 2039 2040 2041 2042 2043 2044 2045 2046 2047 2048 2049 2050
1,808,046 1,819,089 1,830,215 2,292,577 2,306,129 2,327,282 2,341,772 2,356,376 2,371,095 2,385,931 2,400,884 2,415,955 2,431,145 2,446,455 2,461,886 2,477,439 2,491,329 2,505,316 2,519,402 2,533,585 2,547,868 2,562,251 2,576,735 2,591,320 2,606,007 2,620,797 2,634,839 2,648,975 2,663,203 2,677,525 2,691,942 2,706,454 2,721,062 2,735,766 2,750,567
1,808,046 1,820,561 1,833,183 2,297,963 2,313,367 2,336,403 2,355,204 2,374,197 2,393,383 2,412,766 2,432,346 2,452,125 2,472,107 2,492,292 2,512,683 2,533,282 2,550,420 2,567,701 2,585,127 2,602,699 2,620,419 2,638,288 2,656,307 2,674,478 2,692,801 2,711,278 2,723,699 2,736,191 2,748,751 2,761,383 2,774,085 2,786,858 2,799,703 2,812,619 2,825,608
1,808,046 1,822,181 1,836,452 2,303,899 2,321,355 2,346,477 2,366,678 2,387,100 2,407,744 2,428,613 2,449,709 2,471,036 2,492,594 2,514,388 2,536,420 2,558,691 2,576,042 2,593,538 2,611,181 2,628,973 2,646,913 2,665,005 2,683,248 2,701,645 2,720,196 2,738,904 2,757,094 2,775,432 2,793,918 2,812,555 2,831,342 2,850,281 2,869,374 2,888,621 2,908,024
1,640,000 1,640,000 1,640,000 1,640,000 2,100,000 2,100,000 2,400,000 2,400,000 2,400,000 2,400,000 2,400,000 2,400,000 2,400,000 2,400,000 2,400,000 2,400,000 2,400,000 2,400,000 2,400,000 2,400,000 2,400,000 2,400,000 2,400,000 2,400,000 2,400,000 2,400,000 2,400,000 2,400,000 2,400,000 2,400,000 2,400,000 2,400,000 2,400,000 2,400,000 2,400,000
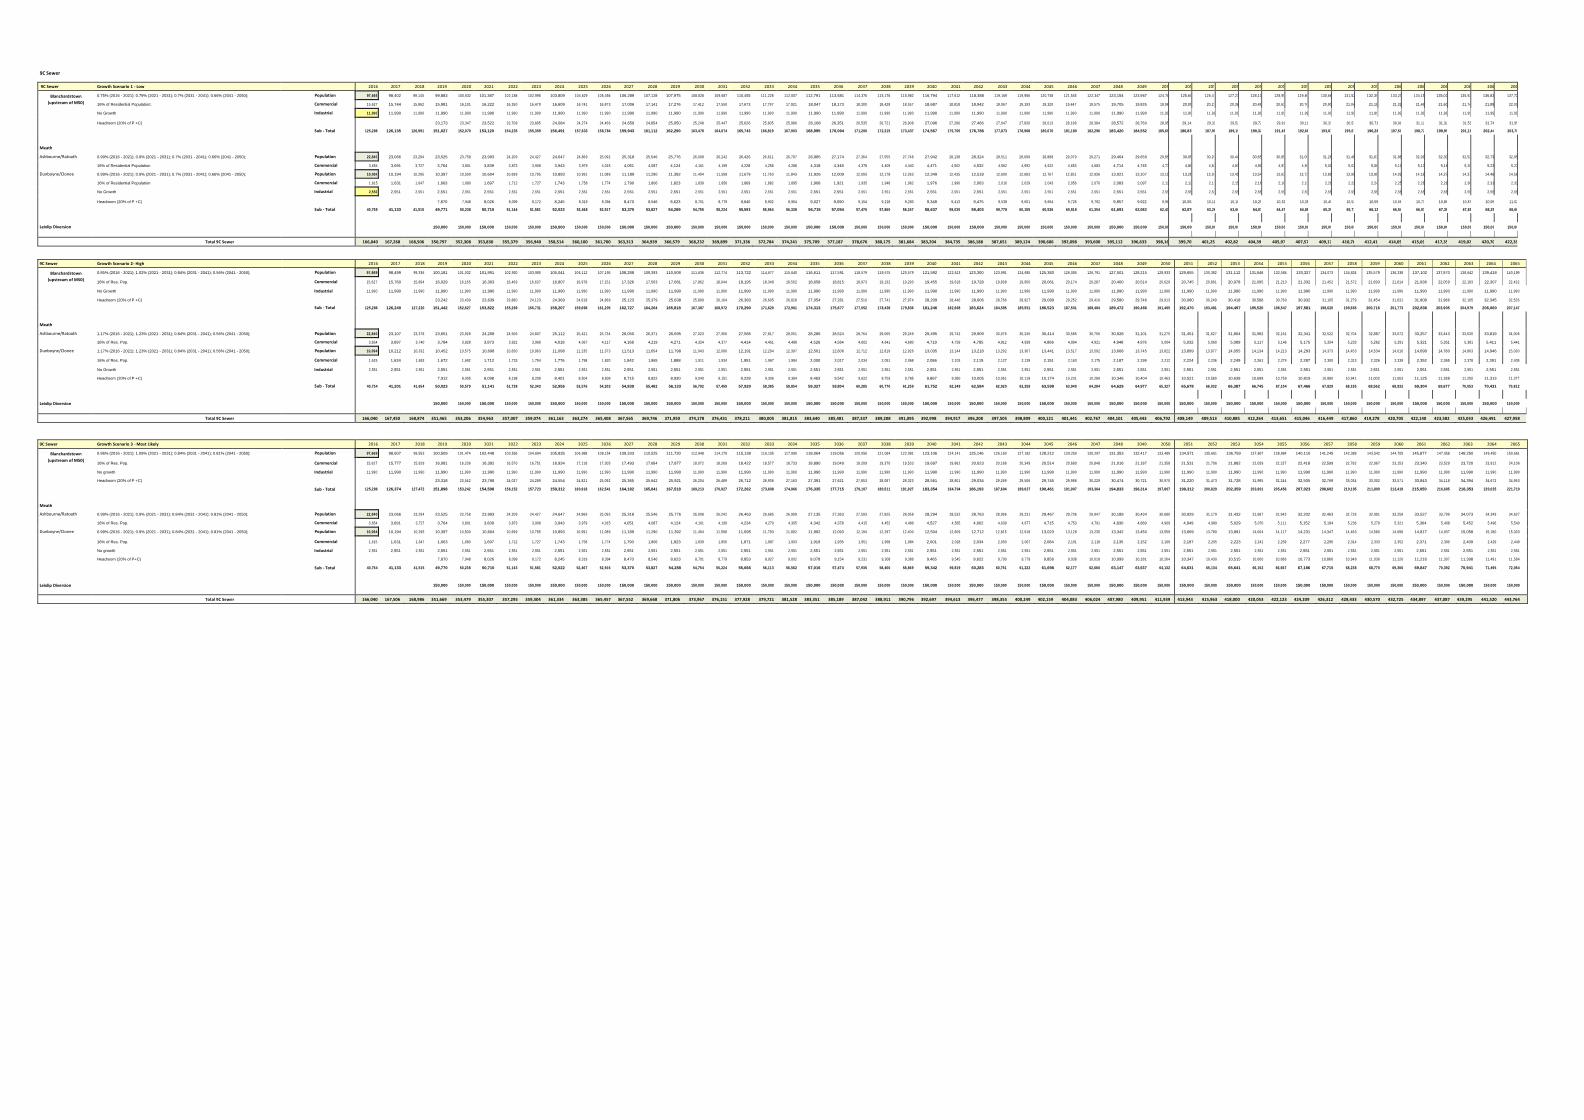
9C Sewer
9C Sewer Growth Scenario 1 - Low 2016 2017 2018 2019 2020 2021 2022 2023 2024 2025 2026 2027 2028 2029 2030 2031 2032 2033 2034 2035 2036 2037 2038 2039 2040 2041 2042 2043 2044 2045 2046 2047 2048 2049 2050 2051 2052 2053 2054 2055 2056 2057 2058 2059 2060 2061 2062 2063 2064 2065
Blanchardstown
(upstream of M50)
0.75% (2016 - 2021); 0.79% (2021 - 2031); 0.7% (2031 - 2041); 0.66% (2041 - 2050); Population 97,669 98,402 99,140 99,883 100,632 101,387 102,188 102,995 103,809 104,629 105,456 106,289 107,128 107,975 108,828 109,687 110,455 111,228 112,007 112,791 113,581 114,376 115,176 115,982 116,794 117,612 118,388 119,169 119,956 120,748 121,545 122,347 123,154 123,967 124,785 125,609 126,438 127,272 128,112 128,958 129,809 130,666 131,528 132,396 133,270 134,150 135,035 135,926 136,823 137,726
16% of Residential Population; Commercial 15,627 15,744 15,862 15,981 16,101 16,222 16,350 16,479 16,609 16,741 16,873 17,006 17,141 17,276 17,412 17,550 17,673 17,797 17,921 18,047 18,173 18,300 18,428 18,557 18,687 18,818 18,942 19,067 19,193 19,320 19,447 19,575 19,705 19,835 19,966 20,097 20,230 20,364 20,498 20,633 20,769 20,907 21,045 21,183 21,323 21,464 21,606 21,748 21,892 22,036
No Growth Industrial 11,990 11,990 11,990 11,990 11,990 11,990 11,990 11,990 11,990 11,990 11,990 11,990 11,990 11,990 11,990 11,990 11,990 11,990 11,990 11,990 11,990 11,990 11,990 11,990 11,990 11,990 11,990 11,990 11,990 11,990 11,990 11,990 11,990 11,990 11,990 11,990 11,990 11,990 11,990 11,990 11,990 11,990 11,990 11,990 11,990 11,990 11,990 11,990 11,990 11,990
Headroom (20% of P +C) 23,173 23,347 23,522 23,708 23,895 24,084 24,274 24,466 24,659 24,854 25,050 25,248 25,447 25,626 25,805 25,986 26,168 26,351 26,535 26,721 26,908 27,096 27,286 27,466 27,647 27,830 28,013 28,198 28,384 28,572 28,760 28,950 29,141 29,334 29,527 29,722 29,918 30,116 30,314 30,515 30,716 30,919 31,123 31,328 31,535 31,743 31,953
Sub - Total 125,286 126,135 126,991 151,027 152,070 153,120 154,235 155,359 156,491 157,633 158,784 159,943 161,112 162,290 163,478 164,674 165,743 166,819 167,903 168,995 170,094 171,200 172,315 173,437 174,567 175,705 176,786 177,873 178,968 180,070 181,180 182,296 183,420 184,552 185,691 186,837 187,991 189,153 190,322 191,499 192,684 193,876 195,077 196,285 197,501 198,726 199,958 201,199 202,448 203,705
Meath
Ashbourne/Ratoath 0.99% (2016 - 2021); 0.9% (2021 - 2031); 0.7% (2031 - 2041); 0.66% (2041 - 2050); Population 22,840 23,066 23,294 23,525 23,758 23,993 24,209 24,427 24,647 24,869 25,092 25,318 25,546 25,776 26,008 26,242 26,426 26,611 26,797 26,985 27,174 27,364 27,555 27,748 27,942 28,138 28,324 28,511 28,699 28,888 29,079 29,271 29,464 29,659 29,854 30,051 30,250 30,449 30,650 30,853 31,056 31,261 31,467 31,675 31,884 32,095 32,306 32,520 32,734 32,950
16% of Residential Population Commercial 3,654 3,691 3,727 3,764 3,801 3,839 3,873 3,908 3,943 3,979 4,015 4,051 4,087 4,124 4,161 4,199 4,228 4,258 4,288 4,318 4,348 4,378 4,409 4,440 4,471 4,502 4,532 4,562 4,592 4,622 4,653 4,683 4,714 4,745 4,777 4,808 4,840 4,872 4,904 4,936 4,969 5,002 5,035 5,068 5,101 5,135 5,169 5,203 5,237 5,272
Dunboyne/Clonee 0.99% (2016 - 2021); 0.9% (2021 - 2031); 0.7% (2031 - 2041); 0.66% (2041 - 2050); Population 10,094 10,194 10,295 10,397 10,500 10,604 10,699 10,795 10,893 10,991 11,089 11,189 11,290 11,392 11,494 11,598 11,679 11,760 11,843 11,926 12,009 12,093 12,178 12,263 12,349 12,435 12,518 12,600 12,683 12,767 12,851 12,936 13,021 13,107 13,194 13,281 13,369 13,457 13,546 13,635 13,725 13,816 13,907 13,999 14,091 14,184 14,278 14,372 14,467 14,562
16% of Residential Population Commercial 1,615 1,631 1,647 1,663 1,680 1,697 1,712 1,727 1,743 1,758 1,774 1,790 1,806 1,823 1,839 1,856 1,869 1,882 1,895 1,908 1,921 1,935 1,948 1,962 1,976 1,990 2,003 2,016 2,029 2,043 2,056 2,070 2,083 2,097 2,111 2,125 2,139 2,153 2,167 2,182 2,196 2,211 2,225 2,240 2,255 2,269 2,284 2,300 2,315 2,330
No Growth Industrial 2,551 2,551 2,551 2,551 2,551 2,551 2,551 2,551 2,551 2,551 2,551 2,551 2,551 2,551 2,551 2,551 2,551 2,551 2,551 2,551 2,551 2,551 2,551 2,551 2,551 2,551 2,551 2,551 2,551 2,551 2,551 2,551 2,551 2,551 2,551 2,551 2,551 2,551 2,551 2,551 2,551 2,551 2,551 2,551 2,551 2,551 2,551 2,551 2,551 2,551
Headroom (20% of P +C) 7,870 7,948 8,026 8,099 8,172 8,245 8,319 8,394 8,470 8,546 8,623 8,701 8,779 8,840 8,902 8,964 9,027 9,090 9,154 9,218 9,283 9,348 9,413 9,475 9,538 9,601 9,664 9,728 9,792 9,857 9,922 9,987 10,053 10,119 10,186 10,253 10,321 10,389 10,458 10,527 10,596 10,666 10,737 10,808 10,879 10,951 11,023
Sub - Total 40,755 41,133 41,515 49,771 50,238 50,710 51,144 51,581 52,022 52,468 52,917 53,370 53,827 54,289 54,755 55,224 55,593 55,964 56,338 56,715 57,094 57,476 57,860 58,247 58,637 59,030 59,403 59,778 60,155 60,536 60,918 61,304 61,691 62,082 62,475 62,870 63,268 63,669 64,072 64,478 64,887 65,298 65,713 66,129 66,549 66,971 67,397 67,825 68,255 68,689
Leixlip Diversion 150,000 150,000 150,000 150,000 150,000 150,000 150,000 150,000 150,000 150,000 150,000 150,000 150,000 150,000 150,000 150,000 150,000 150,000 150,000 150,000 150,000 150,000 150,000 150,000 150,000 150,000 150,000 150,000 150,000 150,000 150,000 150,000 150,000 150,000 150,000 150,000 150,000 150,000 150,000 150,000 150,000 150,000 150,000 150,000 150,000 150,000 150,000
Total 9C Sewer 166,040 167,268 168,506 350,797 352,308 353,830 355,379 356,940 358,514 360,100 361,700 363,313 364,939 366,579 368,232 369,899 371,336 372,784 374,241 375,709 377,187 378,676 380,175 381,684 383,204 384,735 386,188 387,651 389,124 390,606 392,098 393,600 395,112 396,633 398,165 399,707 401,259 402,822 404,394 405,977 407,571 409,175 410,789 412,415 414,051 415,697 417,355 419,024 420,703 422,394
9C Sewer Growth Scenario 2- High 2016 2017 2018 2019 2020 2021 2022 2023 2024 2025 2026 2027 2028 2029 2030 2031 2032 2033 2034 2035 2036 2037 2038 2039 2040 2041 2042 2043 2044 2045 2046 2047 2048 2049 2050 2051 2052 2053 2054 2055 2056 2057 2058 2059 2060 2061 2062 2063 2064 2065
Blanchardstown
(upstream of M50)
0.85% (2016 - 2021); 1.02% (2021 - 2031); 0.84% (2031 - 2041); 0.56% (2041 - 2050); Population 97,669 98,499 99,336 100,181 101,032 101,891 102,930 103,980 105,041 106,112 107,195 108,288 109,393 110,508 111,636 112,774 113,722 114,677 115,640 116,611 117,591 118,579 119,575 120,579 121,592 122,613 123,300 123,991 124,685 125,383 126,085 126,791 127,501 128,215 128,933 129,655 130,382 131,112 131,846 132,584 133,327 134,073 134,824 135,579 136,338 137,102 137,870 138,642 139,418 140,199
16% of Res. Pop. Commercial 15,627 15,760 15,894 16,029 16,165 16,303 16,469 16,637 16,807 16,978 17,151 17,326 17,503 17,681 17,862 18,044 18,195 18,348 18,502 18,658 18,815 18,973 19,132 19,293 19,455 19,618 19,728 19,838 19,950 20,061 20,174 20,287 20,400 20,514 20,629 20,745 20,861 20,978 21,095 21,213 21,332 21,452 21,572 21,693 21,814 21,936 22,059 22,183 22,307 22,432
No Growth Industrial 11,990 11,990 11,990 11,990 11,990 11,990 11,990 11,990 11,990 11,990 11,990 11,990 11,990 11,990 11,990 11,990 11,990 11,990 11,990 11,990 11,990 11,990 11,990 11,990 11,990 11,990 11,990 11,990 11,990 11,990 11,990 11,990 11,990 11,990 11,990 11,990 11,990 11,990 11,990 11,990 11,990 11,990 11,990 11,990 11,990 11,990 11,990 11,990 11,990 11,990
Headroom (20% of P +C) 23,242 23,439 23,639 23,880 24,123 24,369 24,618 24,869 25,123 25,379 25,638 25,899 26,164 26,383 26,605 26,828 27,054 27,281 27,510 27,741 27,974 28,209 28,446 28,606 28,766 28,927 29,089 29,252 29,416 29,580 29,746 29,913 30,080 30,249 30,418 30,588 30,760 30,932 31,105 31,279 31,454 31,631 31,808 31,986 32,165 32,345 32,526
Sub - Total 125,286 126,249 127,220 151,442 152,627 153,822 155,269 156,731 158,207 159,698 161,205 162,727 164,264 165,818 167,387 168,972 170,290 171,620 172,961 174,313 175,677 177,052 178,438 179,836 181,246 182,668 183,624 184,585 185,551 186,523 187,501 188,484 189,472 190,466 191,465 192,470 193,481 194,497 195,520 196,547 197,581 198,620 199,665 200,716 201,773 202,836 203,905 204,979 206,060 207,147
Meath
Ashbourne/Ratoath 1.17% (2016 - 2021); 1.23% (2021 - 2031); 0.84% (2031 - 2041); 0.56% (2041 - 2050); Population 22,840 23,107 23,378 23,651 23,928 24,208 24,506 24,807 25,112 25,421 25,734 26,050 26,371 26,695 27,023 27,356 27,585 27,817 28,051 28,286 28,524 28,764 29,005 29,249 29,495 29,742 29,909 30,076 30,245 30,414 30,585 30,756 30,928 31,101 31,275 31,451 31,627 31,804 31,982 32,161 32,341 32,522 32,704 32,887 33,072 33,257 33,443 33,630 33,819 34,008
16% of Res. Pop. Commercial 3,654 3,697 3,740 3,784 3,828 3,873 3,921 3,969 4,018 4,067 4,117 4,168 4,219 4,271 4,324 4,377 4,414 4,451 4,488 4,526 4,564 4,602 4,641 4,680 4,719 4,759 4,785 4,812 4,839 4,866 4,894 4,921 4,948 4,976 5,004 5,032 5,060 5,089 5,117 5,146 5,175 5,204 5,233 5,262 5,291 5,321 5,351 5,381 5,411 5,441
Dunboyne/Clonee 1.17% (2016 - 2021); 1.23% (2021 - 2031); 0.84% (2031 - 2041); 0.56% (2041 - 2050); Population 10,094 10,212 10,332 10,452 10,575 10,698 10,830 10,963 11,098 11,235 11,373 11,513 11,654 11,798 11,943 12,090 12,191 12,294 12,397 12,501 12,606 12,712 12,819 12,926 13,035 13,144 13,218 13,292 13,367 13,441 13,517 13,592 13,668 13,745 13,822 13,899 13,977 14,055 14,134 14,213 14,293 14,373 14,453 14,534 14,616 14,698 14,780 14,863 14,946 15,030
16% of Res. Pop. Commercial 1,615 1,634 1,653 1,672 1,692 1,712 1,733 1,754 1,776 1,798 1,820 1,842 1,865 1,888 1,911 1,934 1,951 1,967 1,984 2,000 2,017 2,034 2,051 2,068 2,086 2,103 2,115 2,127 2,139 2,151 2,163 2,175 2,187 2,199 2,212 2,224 2,236 2,249 2,261 2,274 2,287 2,300 2,313 2,326 2,339 2,352 2,365 2,378 2,391 2,405
No Growth Industrial 2,551 2,551 2,551 2,551 2,551 2,551 2,551 2,551 2,551 2,551 2,551 2,551 2,551 2,551 2,551 2,551 2,551 2,551 2,551 2,551 2,551 2,551 2,551 2,551 2,551 2,551 2,551 2,551 2,551 2,551 2,551 2,551 2,551 2,551 2,551 2,551 2,551 2,551 2,551 2,551 2,551 2,551 2,551 2,551 2,551 2,551 2,551 2,551 2,551 2,551
Headroom (20% of P +C) 7,912 8,005 8,098 8,198 8,299 8,401 8,504 8,609 8,715 8,822 8,930 9,040 9,151 9,228 9,306 9,384 9,463 9,542 9,622 9,703 9,785 9,867 9,950 10,005 10,061 10,118 10,174 10,231 10,289 10,346 10,404 10,463 10,521 10,580 10,639 10,699 10,759 10,819 10,880 10,941 11,002 11,063 11,125 11,188 11,250 11,313 11,377
Sub - Total 40,754 41,201 41,654 50,023 50,579 51,141 51,738 52,343 52,956 53,576 54,203 54,839 55,482 56,133 56,792 57,459 57,920 58,385 58,854 59,327 59,804 60,285 60,770 61,259 61,752 62,249 62,584 62,920 63,258 63,598 63,940 64,284 64,629 64,977 65,327 65,678 66,032 66,387 66,745 67,104 67,466 67,829 68,195 68,562 68,932 69,304 69,677 70,053 70,431 70,812
Leixlip Diversion 150,000 150,000 150,000 150,000 150,000 150,000 150,000 150,000 150,000 150,000 150,000 150,000 150,000 150,000 150,000 150,000 150,000 150,000 150,000 150,000 150,000 150,000 150,000 150,000 150,000 150,000 150,000 150,000 150,000 150,000 150,000 150,000 150,000 150,000 150,000 150,000 150,000 150,000 150,000 150,000 150,000 150,000 150,000 150,000 150,000 150,000 150,000
Total 9C Sewer 166,040 167,450 168,874 351,465 353,206 354,963 357,007 359,074 361,163 363,274 365,408 367,565 369,746 371,950 374,178 376,431 378,211 380,005 381,815 383,640 385,481 387,337 389,208 391,095 392,998 394,917 396,208 397,505 398,809 400,121 401,441 402,767 404,101 405,443 406,792 408,149 409,513 410,885 412,264 413,651 415,046 416,449 417,860 419,278 420,705 422,140 423,582 425,033 426,491 427,958
9C Sewer Growth Scenario 3 - Most Likely 2016 2017 2018 2019 2020 2021 2022 2023 2024 2025 2026 2027 2028 2029 2030 2031 2032 2033 2034 2035 2036 2037 2038 2039 2040 2041 2042 2043 2044 2045 2046 2047 2048 2049 2050 2051 2052 2053 2054 2055 2056 2057 2058 2059 2060 2061 2062 2063 2064 2065
Blanchardstown
(upstream of M50)
0.96% (2016 - 2021); 1.09% (2021 - 2031); 0.84% (2031 - 2041); 0.81% (2041 - 2050); Population 97,669 98,607 99,553 100,509 101,474 102,448 103,565 104,694 105,835 106,988 108,154 109,333 110,525 111,730 112,948 114,179 115,138 116,105 117,080 118,064 119,056 120,056 121,064 122,081 123,106 124,141 125,146 126,160 127,182 128,212 129,250 130,297 131,353 132,417 133,489 134,571 135,661 136,759 137,867 138,984 140,110 141,245 142,389 143,542 144,705 145,877 147,058 148,250 149,450 150,661
16% of Res. Pop. Commercial 15,627 15,777 15,929 16,081 16,236 16,392 16,570 16,751 16,934 17,118 17,305 17,493 17,684 17,877 18,072 18,269 18,422 18,577 18,733 18,890 19,049 19,209 19,370 19,533 19,697 19,862 20,023 20,186 20,349 20,514 20,680 20,848 21,016 21,187 21,358 21,531 21,706 21,882 22,059 22,237 22,418 22,599 22,782 22,967 23,153 23,340 23,529 23,720 23,912 24,106
No growth Industrial 11,990 11,990 11,990 11,990 11,990 11,990 11,990 11,990 11,990 11,990 11,990 11,990 11,990 11,990 11,990 11,990 11,990 11,990 11,990 11,990 11,990 11,990 11,990 11,990 11,990 11,990 11,990 11,990 11,990 11,990 11,990 11,990 11,990 11,990 11,990 11,990 11,990 11,990 11,990 11,990 11,990 11,990 11,990 11,990 11,990 11,990 11,990 11,990 11,990 11,990
Headroom (20% of P +C) 23,318 23,542 23,768 24,027 24,289 24,554 24,821 25,092 25,365 25,642 25,921 26,204 26,489 26,712 26,936 27,163 27,391 27,621 27,853 28,087 28,323 28,561 28,801 29,034 29,269 29,506 29,745 29,986 30,229 30,474 30,721 30,970 31,220 31,473 31,728 31,985 32,244 32,505 32,769 33,034 33,302 33,571 33,843 34,118 34,394 34,672 34,953
Sub - Total 125,286 126,374 127,472 151,898 153,242 154,598 156,152 157,723 159,312 160,918 162,541 164,182 165,841 167,518 169,213 170,927 172,262 173,608 174,966 176,335 177,715 179,107 180,511 181,927 183,354 184,794 186,193 187,604 189,027 190,461 191,907 193,364 194,833 196,314 197,807 199,312 200,829 202,359 203,901 205,456 207,023 208,602 210,195 211,800 213,419 215,050 216,695 218,353 220,025 221,710
Meath
Ashbourne/Ratoath 0.99% (2016 - 2021); 0.9% (2021 - 2031); 0.84% (2031 - 2041); 0.81% (2041 - 2050); Population 22,840 23,066 23,294 23,525 23,758 23,993 24,209 24,427 24,647 24,869 25,092 25,318 25,546 25,776 26,008 26,242 26,463 26,685 26,909 27,135 27,363 27,593 27,825 28,058 28,294 28,532 28,763 28,996 29,231 29,467 29,706 29,947 30,189 30,434 30,680 30,929 31,179 31,432 31,687 31,943 32,202 32,463 32,726 32,991 33,258 33,527 33,799 34,073 34,349 34,627
16% of Res. Pop. Commercial 3,654 3,691 3,727 3,764 3,801 3,839 3,873 3,908 3,943 3,979 4,015 4,051 4,087 4,124 4,161 4,199 4,234 4,270 4,305 4,342 4,378 4,415 4,452 4,489 4,527 4,565 4,602 4,639 4,677 4,715 4,753 4,791 4,830 4,869 4,909 4,949 4,989 5,029 5,070 5,111 5,152 5,194 5,236 5,279 5,321 5,364 5,408 5,452 5,496 5,540
Dunboyne/Clonee 0.99% (2016 - 2021); 0.9% (2021 - 2031); 0.84% (2031 - 2041); 0.81% (2041 - 2050); Population 10,094 10,194 10,295 10,397 10,500 10,604 10,699 10,795 10,893 10,991 11,089 11,189 11,290 11,392 11,494 11,598 11,695 11,793 11,892 11,992 12,093 12,194 12,297 12,400 12,504 12,609 12,712 12,815 12,918 13,023 13,128 13,235 13,342 13,450 13,559 13,669 13,780 13,891 14,004 14,117 14,231 14,347 14,463 14,580 14,698 14,817 14,937 15,058 15,180 15,303
16% of Res. Pop. Commercial 1,615 1,631 1,647 1,663 1,680 1,697 1,712 1,727 1,743 1,758 1,774 1,790 1,806 1,823 1,839 1,856 1,871 1,887 1,903 1,919 1,935 1,951 1,968 1,984 2,001 2,018 2,034 2,050 2,067 2,084 2,101 2,118 2,135 2,152 2,169 2,187 2,205 2,223 2,241 2,259 2,277 2,295 2,314 2,333 2,352 2,371 2,390 2,409 2,429 2,449
No growth Industrial 2,551 2,551 2,551 2,551 2,551 2,551 2,551 2,551 2,551 2,551 2,551 2,551 2,551 2,551 2,551 2,551 2,551 2,551 2,551 2,551 2,551 2,551 2,551 2,551 2,551 2,551 2,551 2,551 2,551 2,551 2,551 2,551 2,551 2,551 2,551 2,551 2,551 2,551 2,551 2,551 2,551 2,551 2,551 2,551 2,551 2,551 2,551 2,551 2,551 2,551
Headroom (20% of P+C) 7,870 7,948 8,026 8,099 8,172 8,245 8,319 8,394 8,470 8,546 8,623 8,701 8,779 8,853 8,927 9,002 9,078 9,154 9,231 9,308 9,386 9,465 9,545 9,622 9,700 9,779 9,858 9,938 10,018 10,099 10,181 10,264 10,347 10,430 10,515 10,600 10,686 10,773 10,860 10,948 11,036 11,126 11,216 11,307 11,398 11,491 11,584
Sub - Total 40,754 41,133 41,515 49,770 50,238 50,710 51,143 51,581 52,022 52,467 52,916 53,370 53,827 54,288 54,754 55,224 55,666 56,113 56,562 57,016 57,474 57,935 58,400 58,869 59,342 59,819 60,283 60,751 61,222 61,698 62,177 62,660 63,147 63,637 64,132 64,631 65,134 65,641 66,152 66,667 67,186 67,710 68,238 68,770 69,306 69,847 70,392 70,941 71,495 72,054
Leixlip Diversion 150,000 150,000 150,000 150,000 150,000 150,000 150,000 150,000 150,000 150,000 150,000 150,000 150,000 150,000 150,000 150,000 150,000 150,000 150,000 150,000 150,000 150,000 150,000 150,000 150,000 150,000 150,000 150,000 150,000 150,000 150,000 150,000 150,000 150,000 150,000 150,000 150,000 150,000 150,000 150,000 150,000 150,000 150,000 150,000 150,000 150,000 150,000
Total 9C Sewer 166,040 167,506 168,986 351,669 353,479 355,307 357,295 359,304 361,334 363,385 365,457 367,552 369,668 371,806 373,967 376,151 377,928 379,721 381,528 383,351 385,189 387,042 388,911 390,796 392,697 394,613 396,477 398,355 400,249 402,159 404,083 406,024 407,980 409,951 411,939 413,943 415,963 418,000 420,053 422,123 424,209 426,312 428,433 430,570 432,725 434,897 437,087 439,295 441,520 443,764
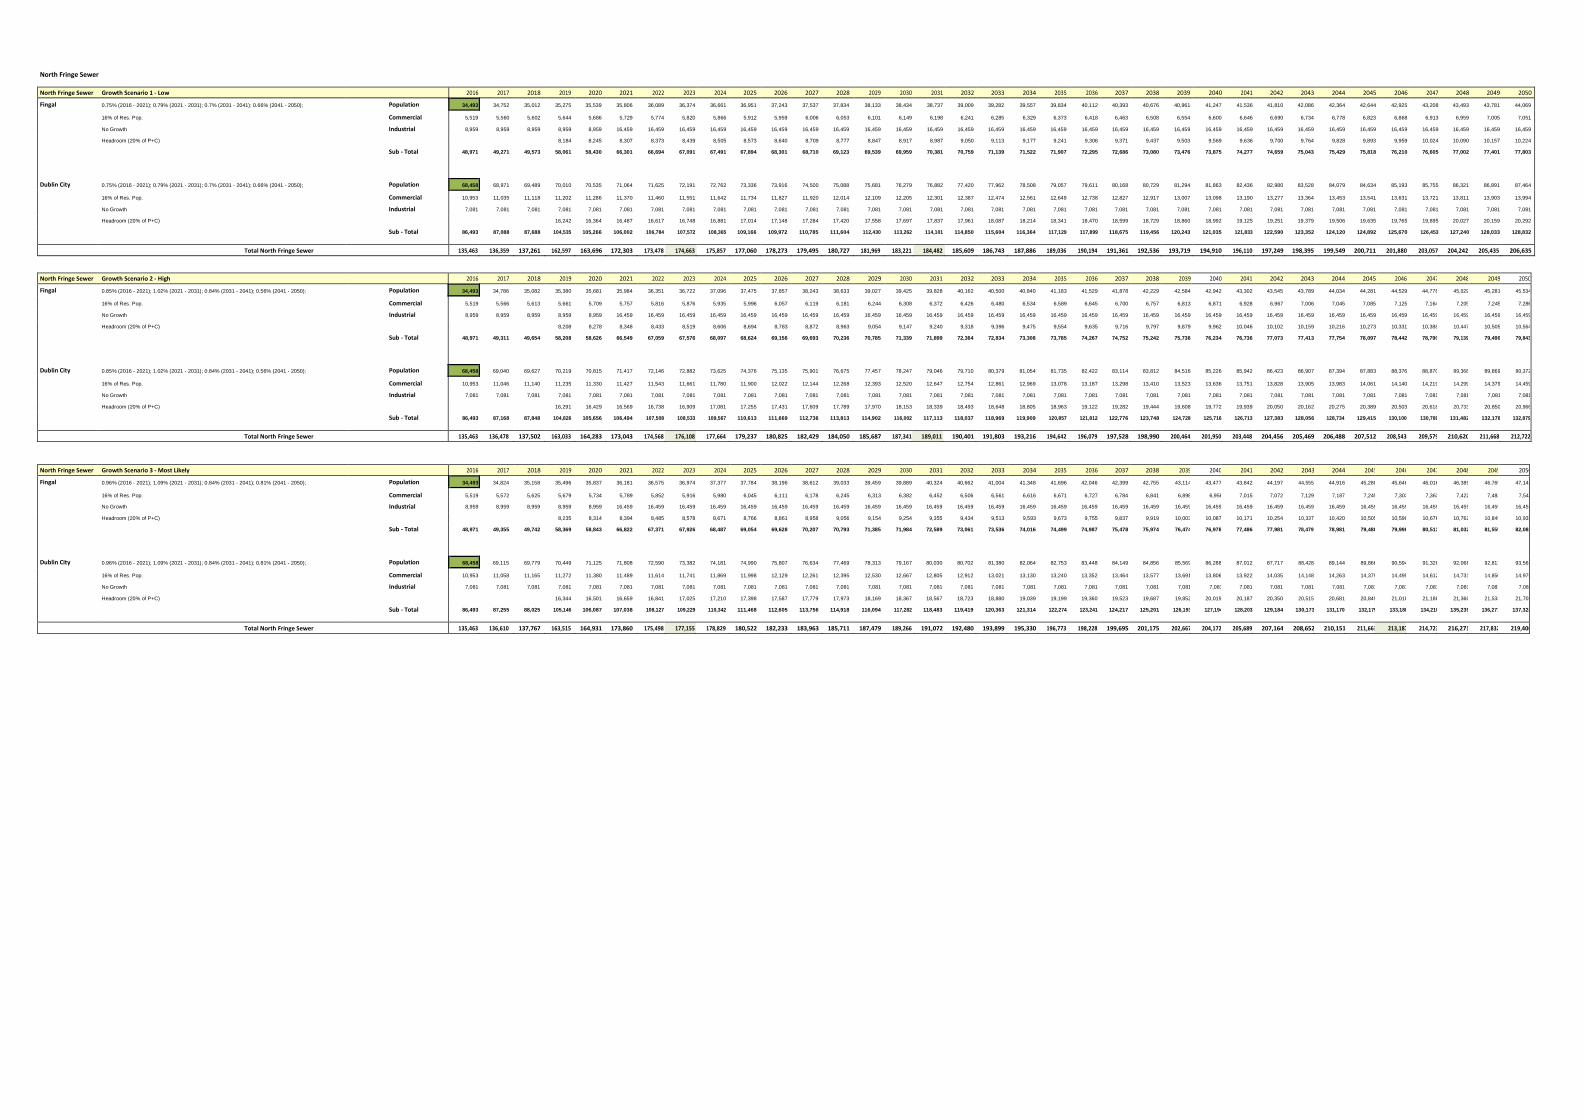
North Fringe Sewer
North Fringe Sewer Growth Scenario 1 - Low 2016 2017 2018 2019 2020 2021 2022 2023 2024 2025 2026 2027 2028 2029 2030 2031 2032 2033 2034 2035 2036 2037 2038 2039 2040 2041 2042 2043 2044 2045 2046 2047 2048 2049 2050
Fingal 0.75% (2016 - 2021); 0.79% (2021 - 2031); 0.7% (2031 - 2041); 0.66% (2041 - 2050); Population 34,493 34,752 35,012 35,275 35,539 35,806 36,089 36,374 36,661 36,951 37,243 37,537 37,834 38,133 38,434 38,737 39,009 39,282 39,557 39,834 40,112 40,393 40,676 40,961 41,247 41,536 41,810 42,086 42,364 42,644 42,925 43,208 43,493 43,781 44,069
16% of Res. Pop. Commercial 5,519 5,560 5,602 5,644 5,686 5,729 5,774 5,820 5,866 5,912 5,959 6,006 6,053 6,101 6,149 6,198 6,241 6,285 6,329 6,373 6,418 6,463 6,508 6,554 6,600 6,646 6,690 6,734 6,778 6,823 6,868 6,913 6,959 7,005 7,051
No Growth Industrial 8,959 8,959 8,959 8,959 8,959 16,459 16,459 16,459 16,459 16,459 16,459 16,459 16,459 16,459 16,459 16,459 16,459 16,459 16,459 16,459 16,459 16,459 16,459 16,459 16,459 16,459 16,459 16,459 16,459 16,459 16,459 16,459 16,459 16,459 16,459
Headroom (20% of P+C) 8,184 8,245 8,307 8,373 8,439 8,505 8,573 8,640 8,709 8,777 8,847 8,917 8,987 9,050 9,113 9,177 9,241 9,306 9,371 9,437 9,503 9,569 9,636 9,700 9,764 9,828 9,893 9,959 10,024 10,090 10,157 10,224
Sub - Total 48,971 49,271 49,573 58,061 58,430 66,301 66,694 67,091 67,491 67,894 68,301 68,710 69,123 69,539 69,959 70,381 70,759 71,139 71,522 71,907 72,295 72,686 73,080 73,476 73,875 74,277 74,659 75,043 75,429 75,818 76,210 76,605 77,002 77,401 77,803
Dublin City 0.75% (2016 - 2021); 0.79% (2021 - 2031); 0.7% (2031 - 2041); 0.66% (2041 - 2050); Population 68,458 68,971 69,489 70,010 70,535 71,064 71,625 72,191 72,762 73,336 73,916 74,500 75,088 75,681 76,279 76,882 77,420 77,962 78,508 79,057 79,611 80,168 80,729 81,294 81,863 82,436 82,980 83,528 84,079 84,634 85,193 85,755 86,321 86,891 87,464
16% of Res. Pop. Commercial 10,953 11,035 11,118 11,202 11,286 11,370 11,460 11,551 11,642 11,734 11,827 11,920 12,014 12,109 12,205 12,301 12,387 12,474 12,561 12,649 12,738 12,827 12,917 13,007 13,098 13,190 13,277 13,364 13,453 13,541 13,631 13,721 13,811 13,903 13,994
No Growth Industrial 7,081 7,081 7,081 7,081 7,081 7,081 7,081 7,081 7,081 7,081 7,081 7,081 7,081 7,081 7,081 7,081 7,081 7,081 7,081 7,081 7,081 7,081 7,081 7,081 7,081 7,081 7,081 7,081 7,081 7,081 7,081 7,081 7,081 7,081 7,081
Headroom (20% of P+C) 16,242 16,364 16,487 16,617 16,748 16,881 17,014 17,148 17,284 17,420 17,558 17,697 17,837 17,961 18,087 18,214 18,341 18,470 18,599 18,729 18,860 18,992 19,125 19,251 19,379 19,506 19,635 19,765 19,895 20,027 20,159 20,292
Sub - Total 86,493 87,088 87,688 104,535 105,266 106,002 106,784 107,572 108,365 109,166 109,972 110,785 111,604 112,430 113,262 114,101 114,850 115,604 116,364 117,129 117,899 118,675 119,456 120,243 121,035 121,833 122,590 123,352 124,120 124,892 125,670 126,453 127,240 128,033 128,832
Total North Fringe Sewer 135,463 136,359 137,261 162,597 163,696 172,303 173,478 174,663 175,857 177,060 178,273 179,495 180,727 181,969 183,221 184,482 185,609 186,743 187,886 189,036 190,194 191,361 192,536 193,719 194,910 196,110 197,249 198,395 199,549 200,711 201,880 203,057 204,242 205,435 206,635
North Fringe Sewer Growth Scenario 2 - High 2016 2017 2018 2019 2020 2021 2022 2023 2024 2025 2026 2027 2028 2029 2030 2031 2032 2033 2034 2035 2036 2037 2038 2039 2040 2041 2042 2043 2044 2045 2046 2047 2048 2049 2050
Fingal 0.85% (2016 - 2021); 1.02% (2021 - 2031); 0.84% (2031 - 2041); 0.56% (2041 - 2050); Population 34,493 34,786 35,082 35,380 35,681 35,984 36,351 36,722 37,096 37,475 37,857 38,243 38,633 39,027 39,425 39,828 40,162 40,500 40,840 41,183 41,529 41,878 42,229 42,584 42,942 43,302 43,545 43,789 44,034 44,281 44,529 44,778 45,029 45,281 45,534
16% of Res. Pop. Commercial 5,519 5,566 5,613 5,661 5,709 5,757 5,816 5,876 5,935 5,996 6,057 6,119 6,181 6,244 6,308 6,372 6,426 6,480 6,534 6,589 6,645 6,700 6,757 6,813 6,871 6,928 6,967 7,006 7,045 7,085 7,125 7,164 7,205 7,245 7,286
No Growth Industrial 8,959 8,959 8,959 8,959 8,959 16,459 16,459 16,459 16,459 16,459 16,459 16,459 16,459 16,459 16,459 16,459 16,459 16,459 16,459 16,459 16,459 16,459 16,459 16,459 16,459 16,459 16,459 16,459 16,459 16,459 16,459 16,459 16,459 16,459 16,459
Headroom (20% of P+C) 8,208 8,278 8,348 8,433 8,519 8,606 8,694 8,783 8,872 8,963 9,054 9,147 9,240 9,318 9,396 9,475 9,554 9,635 9,716 9,797 9,879 9,962 10,046 10,102 10,159 10,216 10,273 10,331 10,388 10,447 10,505 10,564
Sub - Total 48,971 49,311 49,654 58,208 58,626 66,549 67,059 67,576 68,097 68,624 69,156 69,693 70,236 70,785 71,339 71,899 72,364 72,834 73,308 73,785 74,267 74,752 75,242 75,736 76,234 76,736 77,073 77,413 77,754 78,097 78,442 78,790 79,139 79,490 79,843
Dublin City 0.85% (2016 - 2021); 1.02% (2021 - 2031); 0.84% (2031 - 2041); 0.56% (2041 - 2050); Population 68,458 69,040 69,627 70,219 70,815 71,417 72,146 72,882 73,625 74,376 75,135 75,901 76,675 77,457 78,247 79,046 79,710 80,379 81,054 81,735 82,422 83,114 83,812 84,516 85,226 85,942 86,423 86,907 87,394 87,883 88,376 88,870 89,368 89,869 90,372
16% of Res. Pop. Commercial 10,953 11,046 11,140 11,235 11,330 11,427 11,543 11,661 11,780 11,900 12,022 12,144 12,268 12,393 12,520 12,647 12,754 12,861 12,969 13,078 13,187 13,298 13,410 13,523 13,636 13,751 13,828 13,905 13,983 14,061 14,140 14,219 14,299 14,379 14,459
No Growth Industrial 7,081 7,081 7,081 7,081 7,081 7,081 7,081 7,081 7,081 7,081 7,081 7,081 7,081 7,081 7,081 7,081 7,081 7,081 7,081 7,081 7,081 7,081 7,081 7,081 7,081 7,081 7,081 7,081 7,081 7,081 7,081 7,081 7,081 7,081 7,081
Headroom (20% of P+C) 16,291 16,429 16,569 16,738 16,909 17,081 17,255 17,431 17,609 17,789 17,970 18,153 18,339 18,493 18,648 18,805 18,963 19,122 19,282 19,444 19,608 19,772 19,939 20,050 20,162 20,275 20,389 20,503 20,618 20,733 20,850 20,966
Sub - Total 86,493 87,168 87,848 104,826 105,656 106,494 107,508 108,533 109,567 110,613 111,669 112,736 113,813 114,902 116,002 117,113 118,037 118,969 119,909 120,857 121,812 122,776 123,748 124,728 125,716 126,713 127,383 128,056 128,734 129,415 130,100 130,789 131,482 132,178 132,879
Total North Fringe Sewer 135,463 136,478 137,502 163,033 164,283 173,043 174,568 176,108 177,664 179,237 180,825 182,429 184,050 185,687 187,341 189,011 190,401 191,803 193,216 194,642 196,079 197,528 198,990 200,464 201,950 203,448 204,456 205,469 206,488 207,512 208,543 209,579 210,620 211,668 212,722
North Fringe Sewer Growth Scenario 3 - Most Likely 2016 2017 2018 2019 2020 2021 2022 2023 2024 2025 2026 2027 2028 2029 2030 2031 2032 2033 2034 2035 2036 2037 2038 2039 2040 2041 2042 2043 2044 2045 2046 2047 2048 2049 2050
Fingal 0.96% (2016 - 2021); 1.09% (2021 - 2031); 0.84% (2031 - 2041); 0.81% (2041 - 2050); Population 34,493 34,824 35,158 35,496 35,837 36,181 36,575 36,974 37,377 37,784 38,196 38,612 39,033 39,459 39,889 40,324 40,662 41,004 41,348 41,696 42,046 42,399 42,755 43,114 43,477 43,842 44,197 44,555 44,916 45,280 45,646 46,016 46,389 46,765 47,143
16% of Res. Pop. Commercial 5,519 5,572 5,625 5,679 5,734 5,789 5,852 5,916 5,980 6,045 6,111 6,178 6,245 6,313 6,382 6,452 6,506 6,561 6,616 6,671 6,727 6,784 6,841 6,898 6,956 7,015 7,072 7,129 7,187 7,245 7,303 7,363 7,422 7,482 7,543
No Growth Industrial 8,959 8,959 8,959 8,959 8,959 16,459 16,459 16,459 16,459 16,459 16,459 16,459 16,459 16,459 16,459 16,459 16,459 16,459 16,459 16,459 16,459 16,459 16,459 16,459 16,459 16,459 16,459 16,459 16,459 16,459 16,459 16,459 16,459 16,459 16,459
Headroom (20% of P+C) 8,235 8,314 8,394 8,485 8,578 8,671 8,766 8,861 8,958 9,056 9,154 9,254 9,355 9,434 9,513 9,593 9,673 9,755 9,837 9,919 10,003 10,087 10,171 10,254 10,337 10,420 10,505 10,590 10,676 10,762 10,849 10,937
Sub - Total 48,971 49,355 49,742 58,369 58,843 66,822 67,371 67,926 68,487 69,054 69,628 70,207 70,793 71,385 71,984 72,589 73,061 73,536 74,016 74,499 74,987 75,478 75,974 76,474 76,978 77,486 77,981 78,479 78,981 79,488 79,998 80,513 81,032 81,555 82,082
Dublin City 0.96% (2016 - 2021); 1.09% (2021 - 2031); 0.84% (2031 - 2041); 0.81% (2041 - 2050); Population 68,458 69,115 69,779 70,449 71,125 71,808 72,590 73,382 74,181 74,990 75,807 76,634 77,469 78,313 79,167 80,030 80,702 81,380 82,064 82,753 83,448 84,149 84,856 85,569 86,288 87,012 87,717 88,428 89,144 89,866 90,594 91,328 92,068 92,813 93,565
16% of Res. Pop. Commercial 10,953 11,058 11,165 11,272 11,380 11,489 11,614 11,741 11,869 11,998 12,129 12,261 12,395 12,530 12,667 12,805 12,912 13,021 13,130 13,240 13,352 13,464 13,577 13,691 13,806 13,922 14,035 14,148 14,263 14,379 14,495 14,612 14,731 14,850 14,970
No Growth Industrial 7,081 7,081 7,081 7,081 7,081 7,081 7,081 7,081 7,081 7,081 7,081 7,081 7,081 7,081 7,081 7,081 7,081 7,081 7,081 7,081 7,081 7,081 7,081 7,081 7,081 7,081 7,081 7,081 7,081 7,081 7,081 7,081 7,081 7,081 7,081
Headroom (20% of P+C) 16,344 16,501 16,659 16,841 17,025 17,210 17,398 17,587 17,779 17,973 18,169 18,367 18,567 18,723 18,880 19,039 19,199 19,360 19,523 19,687 19,852 20,019 20,187 20,350 20,515 20,681 20,849 21,018 21,188 21,360 21,533 21,707
Sub - Total 86,493 87,255 88,025 105,146 106,087 107,038 108,127 109,229 110,342 111,468 112,605 113,756 114,918 116,094 117,282 118,483 119,419 120,363 121,314 122,274 123,241 124,217 125,201 126,193 127,194 128,203 129,184 130,173 131,170 132,175 133,188 134,210 135,239 136,277 137,324
Total North Fringe Sewer 135,463 136,610 137,767 163,515 164,931 173,860 175,498 177,155 178,829 180,522 182,233 183,963 185,711 187,479 189,266 191,072 192,480 193,899 195,330 196,773 198,228 199,695 201,175 202,667 204,172 205,689 207,164 208,652 210,151 211,663 213,187 214,723 216,271 217,832 219,406
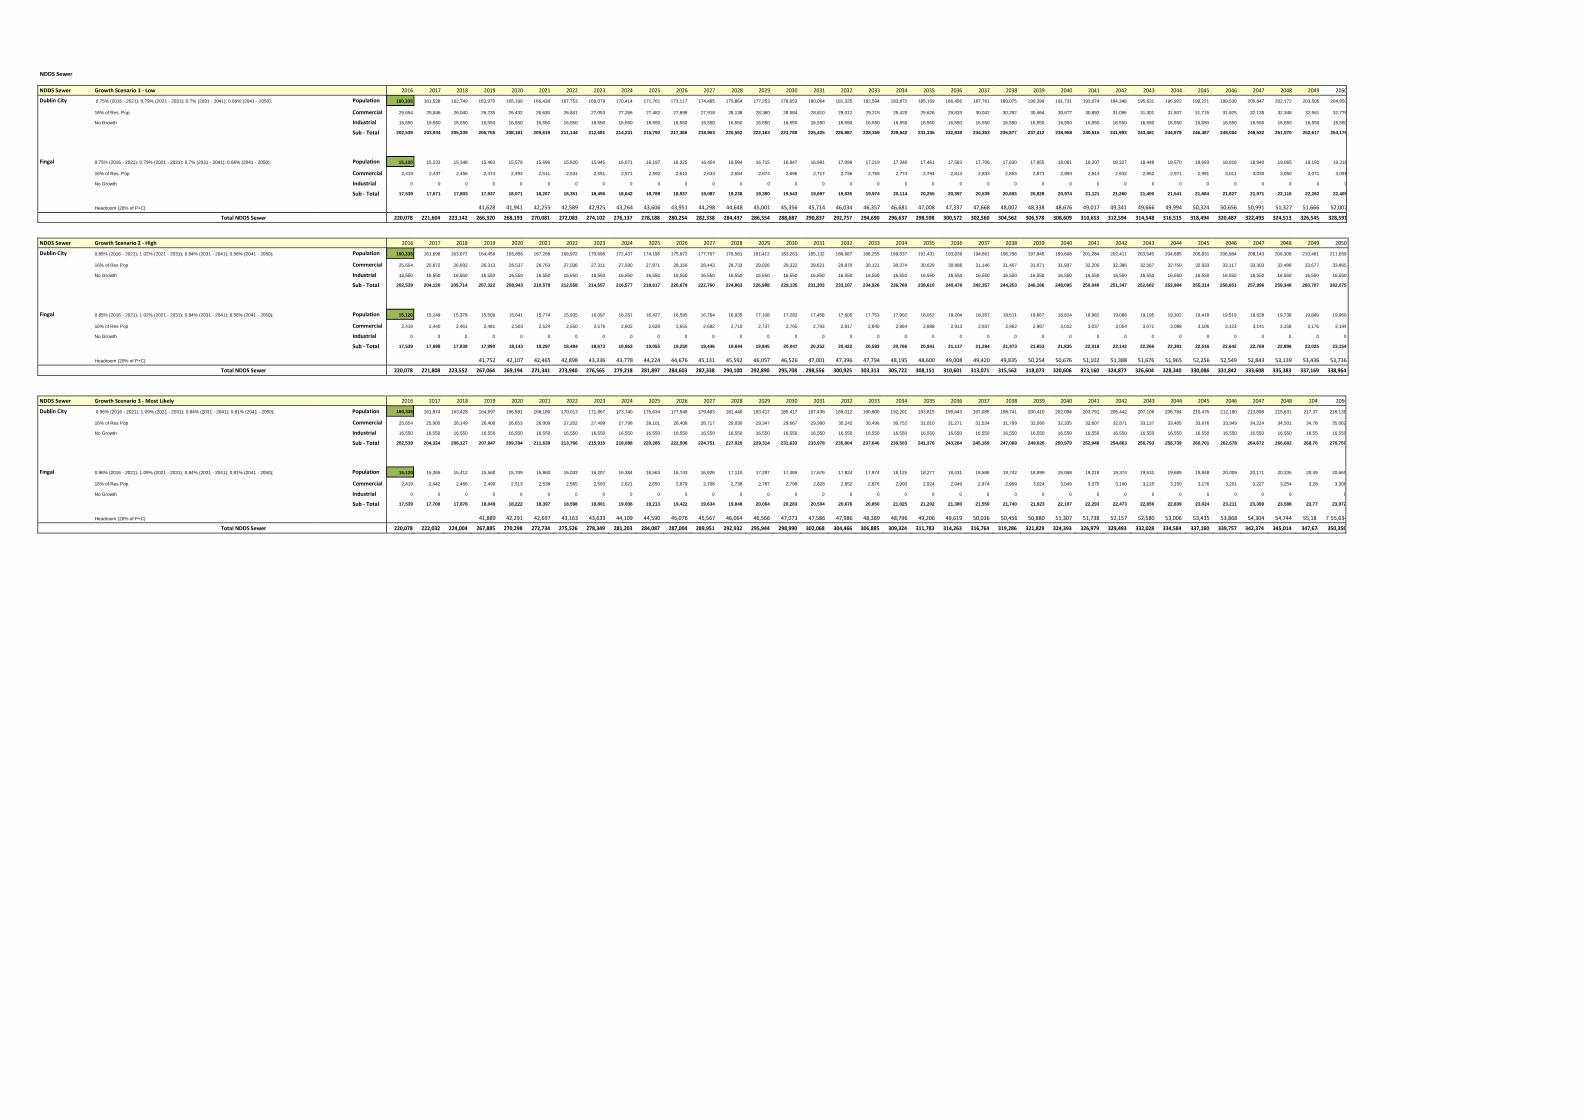
NDDS Sewer
NDDS Sewer Growth Scenario 1 - Low 2016 2017 2018 2019 2020 2021 2022 2023 2024 2025 2026 2027 2028 2029 2030 2031 2032 2033 2034 2035 2036 2037 2038 2039 2040 2041 2042 2043 2044 2045 2046 2047 2048 2049 2050
Dublin City 0.75% (2016 - 2021); 0.79% (2021 - 2031); 0.7% (2031 - 2041); 0.66% (2041 - 2050); Population 160,335 161,538 162,749 163,970 165,199 166,438 167,753 169,079 170,414 171,761 173,117 174,485 175,864 177,253 178,653 180,064 181,325 182,594 183,872 185,159 186,456 187,761 189,075 190,399 191,731 193,074 194,348 195,631 196,922 198,221 199,530 200,847 202,172 203,506 204,850
16% of Res. Pop. Commercial 25,654 25,846 26,040 26,235 26,432 26,630 26,841 27,053 27,266 27,482 27,699 27,918 28,138 28,360 28,584 28,810 29,012 29,215 29,420 29,626 29,833 30,042 30,252 30,464 30,677 30,892 31,096 31,301 31,507 31,715 31,925 32,135 32,348 32,561 32,776
No Growth Industrial 16,550 16,550 16,550 16,550 16,550 16,550 16,550 16,550 16,550 16,550 16,550 16,550 16,550 16,550 16,550 16,550 16,550 16,550 16,550 16,550 16,550 16,550 16,550 16,550 16,550 16,550 16,550 16,550 16,550 16,550 16,550 16,550 16,550 16,550 16,550
Sub - Total 202,539 203,934 205,339 206,755 208,181 209,619 211,144 212,681 214,231 215,792 217,366 218,953 220,552 222,163 223,788 225,425 226,887 228,359 229,842 231,335 232,838 234,353 235,877 237,412 238,958 240,515 241,993 243,481 244,979 246,487 248,004 249,532 251,070 252,617 254,176
Fingal 0.75% (2016 - 2021); 0.79% (2021 - 2031); 0.7% (2031 - 2041); 0.66% (2041 - 2050); Population 15,120 15,233 15,348 15,463 15,579 15,696 15,820 15,945 16,071 16,197 16,325 16,454 16,584 16,715 16,847 16,981 17,099 17,219 17,340 17,461 17,583 17,706 17,830 17,955 18,081 18,207 18,327 18,448 18,570 18,693 18,816 18,940 19,065 19,191 19,318
16% of Res. Pop. Commercial 2,419 2,437 2,456 2,474 2,493 2,511 2,531 2,551 2,571 2,592 2,612 2,633 2,654 2,674 2,696 2,717 2,736 2,755 2,774 2,794 2,813 2,833 2,853 2,873 2,893 2,913 2,932 2,952 2,971 2,991 3,011 3,030 3,050 3,071 3,091
No Growth Industrial 0 0 0 0 0 0 0 0 0 0 0 0 0 0 0 0 0 0 0 0 0 0 0 0 0 0 0 0 0 0 0 0 0 0 0
Sub - Total 17,539 17,671 17,803 17,937 18,071 18,207 18,351 18,496 18,642 18,789 18,937 19,087 19,238 19,390 19,543 19,697 19,835 19,974 20,114 20,255 20,397 20,539 20,683 20,828 20,974 21,121 21,260 21,400 21,541 21,684 21,827 21,971 22,116 22,262 22,409
Headroom (20% of P+C) 41,628 41,941 42,255 42,589 42,925 43,264 43,606 43,951 44,298 44,648 45,001 45,356 45,714 46,034 46,357 46,681 47,008 47,337 47,668 48,002 48,338 48,676 49,017 49,341 49,666 49,994 50,324 50,656 50,991 51,327 51,666 52,007
Total NDDS Sewer 220,078 221,604 223,142 266,320 268,193 270,081 272,083 274,102 276,137 278,188 280,254 282,338 284,437 286,554 288,687 290,837 292,757 294,690 296,637 298,598 300,572 302,560 304,562 306,578 308,609 310,653 312,594 314,548 316,515 318,494 320,487 322,493 324,513 326,545 328,591
NDDS Sewer Growth Scenario 2 - High 2016 2017 2018 2019 2020 2021 2022 2023 2024 2025 2026 2027 2028 2029 2030 2031 2032 2033 2034 2035 2036 2037 2038 2039 2040 2041 2042 2043 2044 2045 2046 2047 2048 2049 2050
Dublin City 0.85% (2016 - 2021); 1.02% (2021 - 2031); 0.84% (2031 - 2041); 0.56% (2041 - 2050); Population 160,335 161,698 163,072 164,458 165,856 167,266 168,972 170,696 172,437 174,196 175,972 177,767 179,581 181,412 183,263 185,132 186,687 188,255 189,837 191,431 193,039 194,661 196,296 197,945 199,608 201,284 202,411 203,545 204,685 205,831 206,984 208,143 209,308 210,481 211,659
16% of Res Pop Commercial 25,654 25,872 26,092 26,313 26,537 26,763 27,036 27,311 27,590 27,871 28,156 28,443 28,733 29,026 29,322 29,621 29,870 30,121 30,374 30,629 30,886 31,146 31,407 31,671 31,937 32,205 32,386 32,567 32,750 32,933 33,117 33,303 33,489 33,677 33,865
No Growth Industrial 16,550 16,550 16,550 16,550 16,550 16,550 16,550 16,550 16,550 16,550 16,550 16,550 16,550 16,550 16,550 16,550 16,550 16,550 16,550 16,550 16,550 16,550 16,550 16,550 16,550 16,550 16,550 16,550 16,550 16,550 16,550 16,550 16,550 16,550 16,550
Sub - Total 202,539 204,120 205,714 207,322 208,943 210,579 212,558 214,557 216,577 218,617 220,678 222,760 224,863 226,988 229,135 231,303 233,107 234,926 236,760 238,610 240,476 242,357 244,253 246,166 248,095 250,040 251,347 252,662 253,984 255,314 256,651 257,996 259,348 260,707 262,075
Fingal 0.85% (2016 - 2021); 1.02% (2021 - 2031); 0.84% (2031 - 2041); 0.56% (2041 - 2050); Population 15,120 15,249 15,378 15,509 15,641 15,774 15,935 16,097 16,261 16,427 16,595 16,764 16,935 17,108 17,282 17,458 17,605 17,753 17,902 18,052 18,204 18,357 18,511 18,667 18,824 18,982 19,088 19,195 19,302 19,410 19,519 19,628 19,738 19,849 19,960
16% of Res Pop Commercial 2,419 2,440 2,461 2,481 2,503 2,524 2,550 2,576 2,602 2,628 2,655 2,682 2,710 2,737 2,765 2,793 2,817 2,840 2,864 2,888 2,913 2,937 2,962 2,987 3,012 3,037 3,054 3,071 3,088 3,106 3,123 3,141 3,158 3,176 3,194
No Growth Industrial 0 0 0 0 0 0 0 0 0 0 0 0 0 0 0 0 0 0 0 0 0 0 0 0 0 0 0 0 0 0 0 0 0 0 0
Sub - Total 17,539 17,688 17,839 17,990 18,143 18,297 18,484 18,673 18,863 19,055 19,250 19,446 19,644 19,845 20,047 20,252 20,422 20,593 20,766 20,941 21,117 21,294 21,473 21,653 21,835 22,019 22,142 22,266 22,391 22,516 22,642 22,769 22,896 23,025 23,154
Headroom (20% of P+C) 41,752 42,107 42,465 42,898 43,336 43,778 44,224 44,676 45,131 45,592 46,057 46,526 47,001 47,396 47,794 48,195 48,600 49,008 49,420 49,835 50,254 50,676 51,102 51,388 51,676 51,965 52,256 52,549 52,843 53,139 53,436 53,736
Total NDDS Sewer 220,078 221,808 223,552 267,064 269,194 271,341 273,940 276,565 279,218 281,897 284,603 287,338 290,100 292,890 295,708 298,556 300,925 303,313 305,722 308,151 310,601 313,071 315,562 318,073 320,606 323,160 324,877 326,604 328,340 330,086 331,842 333,608 335,383 337,169 338,964
NDDS Sewer Growth Scenario 3 - Most Likely 2016 2017 2018 2019 2020 2021 2022 2023 2024 2025 2026 2027 2028 2029 2030 2031 2032 2033 2034 2035 2036 2037 2038 2039 2040 2041 2042 2043 2044 2045 2046 2047 2048 2049 2050
Dublin City 0.96% (2016 - 2021); 1.09% (2021 - 2031); 0.84% (2031 - 2041); 0.81% (2041 - 2050); Population 160,335 161,874 163,428 164,997 166,581 168,180 170,013 171,867 173,740 175,634 177,548 179,483 181,440 183,417 185,417 187,438 189,012 190,600 192,201 193,815 195,443 197,085 198,741 200,410 202,094 203,791 205,442 207,106 208,784 210,475 212,180 213,898 215,631 217,377 219,138
16% of Res Pop Commercial 25,654 25,900 26,149 26,400 26,653 26,909 27,202 27,499 27,798 28,101 28,408 28,717 29,030 29,347 29,667 29,990 30,242 30,496 30,752 31,010 31,271 31,534 31,799 32,066 32,335 32,607 32,871 33,137 33,405 33,676 33,949 34,224 34,501 34,780 35,062
No Growth Industrial 16,550 16,550 16,550 16,550 16,550 16,550 16,550 16,550 16,550 16,550 16,550 16,550 16,550 16,550 16,550 16,550 16,550 16,550 16,550 16,550 16,550 16,550 16,550 16,550 16,550 16,550 16,550 16,550 16,550 16,550 16,550 16,550 16,550 16,550 16,550
Sub - Total 202,539 204,324 206,127 207,947 209,784 211,639 213,766 215,915 218,088 220,285 222,506 224,751 227,020 229,314 231,633 233,978 235,804 237,646 239,503 241,376 243,264 245,169 247,089 249,026 250,979 252,948 254,863 256,793 258,739 260,701 262,678 264,672 266,682 268,708 270,750
Fingal 0.96% (2016 - 2021); 1.09% (2021 - 2031); 0.84% (2031 - 2041); 0.81% (2041 - 2050); Population 15,120 15,265 15,412 15,560 15,709 15,860 16,033 16,207 16,384 16,563 16,743 16,926 17,110 17,297 17,485 17,676 17,824 17,974 18,125 18,277 18,431 18,586 18,742 18,899 19,058 19,218 19,374 19,531 19,689 19,848 20,009 20,171 20,335 20,499 20,665
16% of Res Pop. Commercial 2,419 2,442 2,466 2,490 2,513 2,538 2,565 2,593 2,621 2,650 2,679 2,708 2,738 2,767 2,798 2,828 2,852 2,876 2,900 2,924 2,949 2,974 2,999 3,024 3,049 3,075 3,100 3,125 3,150 3,176 3,201 3,227 3,254 3,280 3,306
No Growth Industrial 0 0 0 0 0 0 0 0 0 0 0 0 0 0 0 0 0 0 0 0 0 0 0 0 0 0 0 0 0 0 0 0 0 0 0
Sub - Total 17,539 17,708 17,878 18,049 18,222 18,397 18,598 18,801 19,006 19,213 19,422 19,634 19,848 20,064 20,283 20,504 20,676 20,850 21,025 21,202 21,380 21,559 21,740 21,923 22,107 22,293 22,473 22,656 22,839 23,024 23,211 23,399 23,588 23,779 23,972
Headroom (20% of P+C) 41,889 42,291 42,697 43,163 43,633 44,109 44,590 45,076 45,567 46,064 46,566 47,073 47,586 47,986 48,389 48,796 49,206 49,619 50,036 50,456 50,880 51,307 51,738 52,157 52,580 53,006 53,435 53,868 54,304 54,744 55,18 7 55,634
Total NDDS Sewer 220,078 222,032 224,004 267,885 270,298 272,734 275,526 278,349 281,203 284,087 287,004 289,951 292,932 295,944 298,990 302,068 304,466 306,885 309,324 311,783 314,263 316,764 319,286 321,829 324,393 326,979 329,493 332,028 334,584 337,160 339,757 342,374 345,014 347,674 350,356
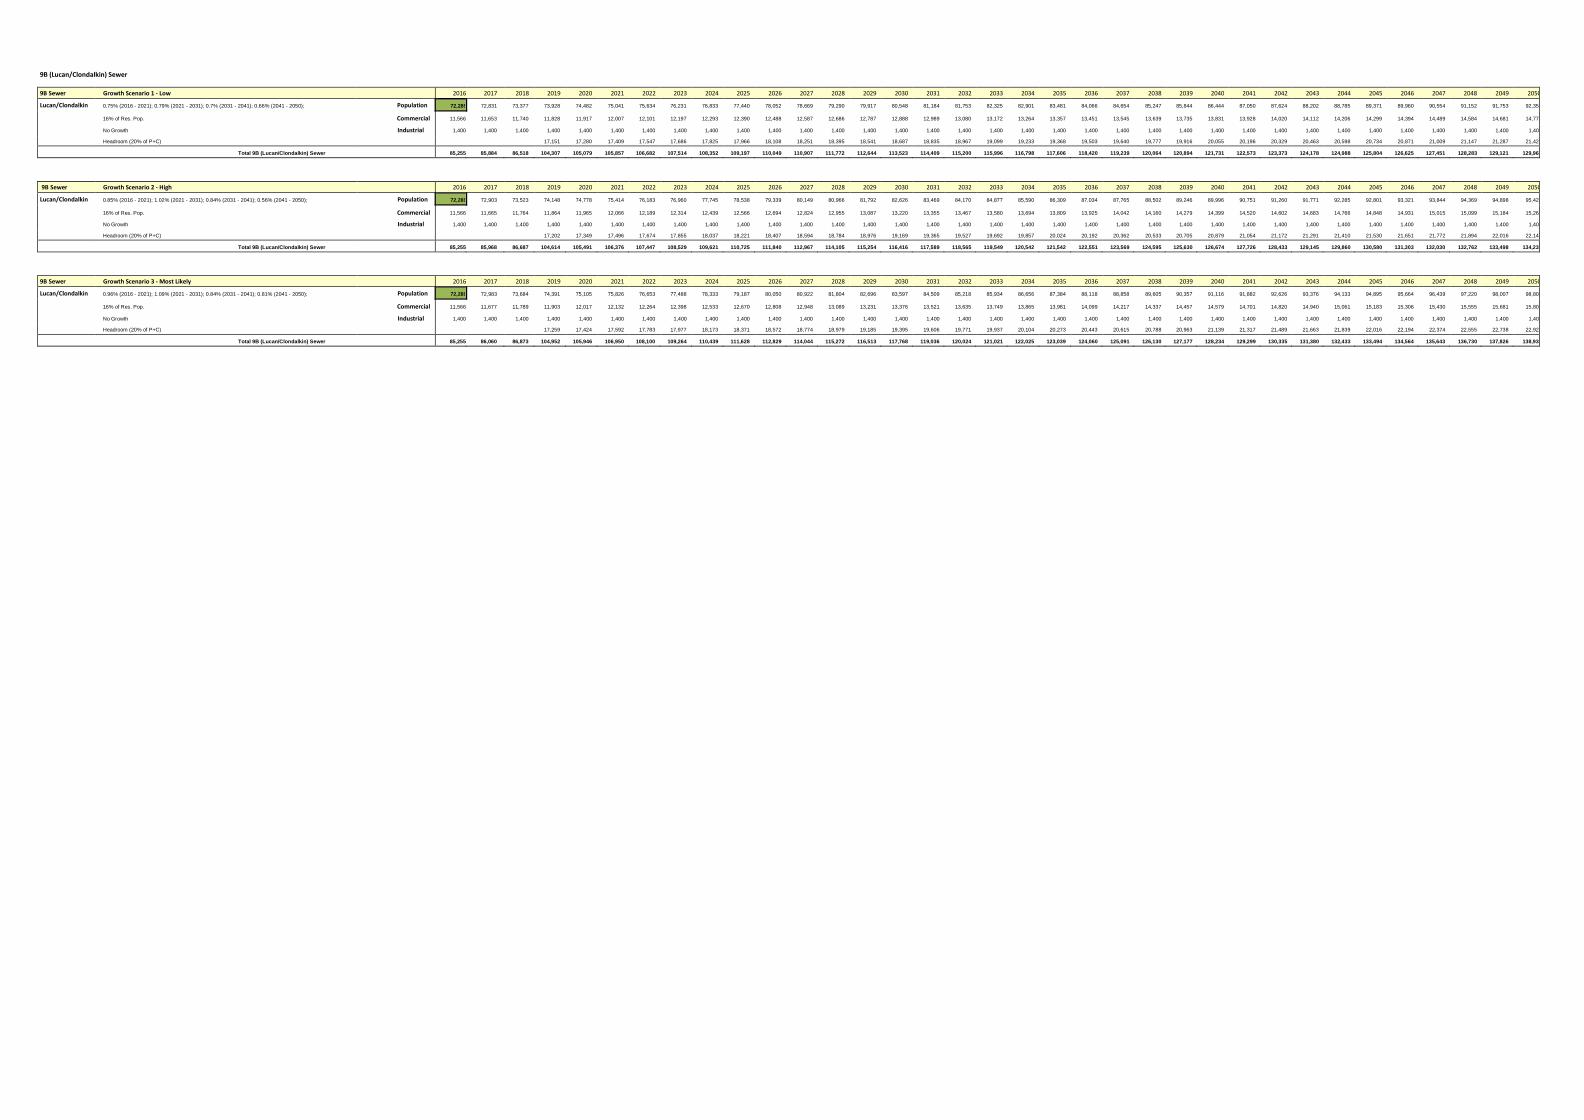
9B (Lucan/Clondalkin) Sewer
9B Sewer Growth Scenario 1 - Low 2016 2017 2018 2019 2020 2021 2022 2023 2024 2025 2026 2027 2028 2029 2030 2031 2032 2033 2034 2035 2036 2037 2038 2039 2040 2041 2042 2043 2044 2045 2046 2047 2048 2049 2050
Lucan/Clondalkin 0.75% (2016 - 2021); 0.79% (2021 - 2031); 0.7% (2031 - 2041); 0.66% (2041 - 2050); Population 72,289 72,831 73,377 73,928 74,482 75,041 75,634 76,231 76,833 77,440 78,052 78,669 79,290 79,917 80,548 81,184 81,753 82,325 82,901 83,481 84,066 84,654 85,247 85,844 86,444 87,050 87,624 88,202 88,785 89,371 89,960 90,554 91,152 91,753 92,359
16% of Res. Pop. Commercial 11,566 11,653 11,740 11,828 11,917 12,007 12,101 12,197 12,293 12,390 12,488 12,587 12,686 12,787 12,888 12,989 13,080 13,172 13,264 13,357 13,451 13,545 13,639 13,735 13,831 13,928 14,020 14,112 14,206 14,299 14,394 14,489 14,584 14,681 14,777
No Growth Industrial 1,400 1,400 1,400 1,400 1,400 1,400 1,400 1,400 1,400 1,400 1,400 1,400 1,400 1,400 1,400 1,400 1,400 1,400 1,400 1,400 1,400 1,400 1,400 1,400 1,400 1,400 1,400 1,400 1,400 1,400 1,400 1,400 1,400 1,400 1,400
Headroom (20% of P+C) 17,151 17,280 17,409 17,547 17,686 17,825 17,966 18,108 18,251 18,395 18,541 18,687 18,835 18,967 19,099 19,233 19,368 19,503 19,640 19,777 19,916 20,055 20,196 20,329 20,463 20,598 20,734 20,871 21,009 21,147 21,287 21,427
Total 9B (Lucan/Clondalkin) Sewer 85,255 85,884 86,518 104,307 105,079 105,857 106,682 107,514 108,352 109,197 110,049 110,907 111,772 112,644 113,523 114,409 115,200 115,996 116,798 117,606 118,420 119,239 120,064 120,894 121,731 122,573 123,373 124,178 124,988 125,804 126,625 127,451 128,283 129,121 129,964
9B Sewer Growth Scenario 2 - High 2016 2017 2018 2019 2020 2021 2022 2023 2024 2025 2026 2027 2028 2029 2030 2031 2032 2033 2034 2035 2036 2037 2038 2039 2040 2041 2042 2043 2044 2045 2046 2047 2048 2049 2050
Lucan/Clondalkin 0.85% (2016 - 2021); 1.02% (2021 - 2031); 0.84% (2031 - 2041); 0.56% (2041 - 2050); Population 72,289 72,903 73,523 74,148 74,778 75,414 76,183 76,960 77,745 78,538 79,339 80,149 80,966 81,792 82,626 83,469 84,170 84,877 85,590 86,309 87,034 87,765 88,502 89,246 89,996 90,751 91,260 91,771 92,285 92,801 93,321 93,844 94,369 94,898 95,429
16% of Res. Pop. Commercial 11,566 11,665 11,764 11,864 11,965 12,066 12,189 12,314 12,439 12,566 12,694 12,824 12,955 13,087 13,220 13,355 13,467 13,580 13,694 13,809 13,925 14,042 14,160 14,279 14,399 14,520 14,602 14,683 14,766 14,848 14,931 15,015 15,099 15,184 15,269
No Growth Industrial 1,400 1,400 1,400 1,400 1,400 1,400 1,400 1,400 1,400 1,400 1,400 1,400 1,400 1,400 1,400 1,400 1,400 1,400 1,400 1,400 1,400 1,400 1,400 1,400 1,400 1,400 1,400 1,400 1,400 1,400 1,400 1,400 1,400 1,400 1,400
Headroom (20% of P+C) 17,202 17,349 17,496 17,674 17,855 18,037 18,221 18,407 18,594 18,784 18,976 19,169 19,365 19,527 19,692 19,857 20,024 20,192 20,362 20,533 20,705 20,879 21,054 21,172 21,291 21,410 21,530 21,651 21,772 21,894 22,016 22,140
Total 9B (Lucan/Clondalkin) Sewer 85,255 85,968 86,687 104,614 105,491 106,376 107,447 108,529 109,621 110,725 111,840 112,967 114,105 115,254 116,416 117,589 118,565 119,549 120,542 121,542 122,551 123,569 124,595 125,630 126,674 127,726 128,433 129,145 129,860 130,580 131,303 132,030 132,762 133,498 134,237
9B Sewer Growth Scenario 3 - Most Likely 2016 2017 2018 2019 2020 2021 2022 2023 2024 2025 2026 2027 2028 2029 2030 2031 2032 2033 2034 2035 2036 2037 2038 2039 2040 2041 2042 2043 2044 2045 2046 2047 2048 2049 2050
Lucan/Clondalkin 0.96% (2016 - 2021); 1.09% (2021 - 2031); 0.84% (2031 - 2041); 0.81% (2041 - 2050); Population 72,289 72,983 73,684 74,391 75,105 75,826 76,653 77,488 78,333 79,187 80,050 80,922 81,804 82,696 83,597 84,509 85,218 85,934 86,656 87,384 88,118 88,858 89,605 90,357 91,116 91,882 92,626 93,376 94,133 94,895 95,664 96,439 97,220 98,007 98,801
16% of Res. Pop. Commercial 11,566 11,677 11,789 11,903 12,017 12,132 12,264 12,398 12,533 12,670 12,808 12,948 13,089 13,231 13,376 13,521 13,635 13,749 13,865 13,981 14,099 14,217 14,337 14,457 14,579 14,701 14,820 14,940 15,061 15,183 15,306 15,430 15,555 15,681 15,808
No Growth Industrial 1,400 1,400 1,400 1,400 1,400 1,400 1,400 1,400 1,400 1,400 1,400 1,400 1,400 1,400 1,400 1,400 1,400 1,400 1,400 1,400 1,400 1,400 1,400 1,400 1,400 1,400 1,400 1,400 1,400 1,400 1,400 1,400 1,400 1,400 1,400
Headroom (20% of P+C) 17,259 17,424 17,592 17,783 17,977 18,173 18,371 18,572 18,774 18,979 19,185 19,395 19,606 19,771 19,937 20,104 20,273 20,443 20,615 20,788 20,963 21,139 21,317 21,489 21,663 21,839 22,016 22,194 22,374 22,555 22,738 22,922
Total 9B (Lucan/Clondalkin) Sewer 85,255 86,060 86,873 104,952 105,946 106,950 108,100 109,264 110,439 111,628 112,829 114,044 115,272 116,513 117,768 119,036 120,024 121,021 122,025 123,039 124,060 125,091 126,130 127,177 128,234 129,299 130,335 131,380 132,433 133,494 134,564 135,643 136,730 137,826 138,931
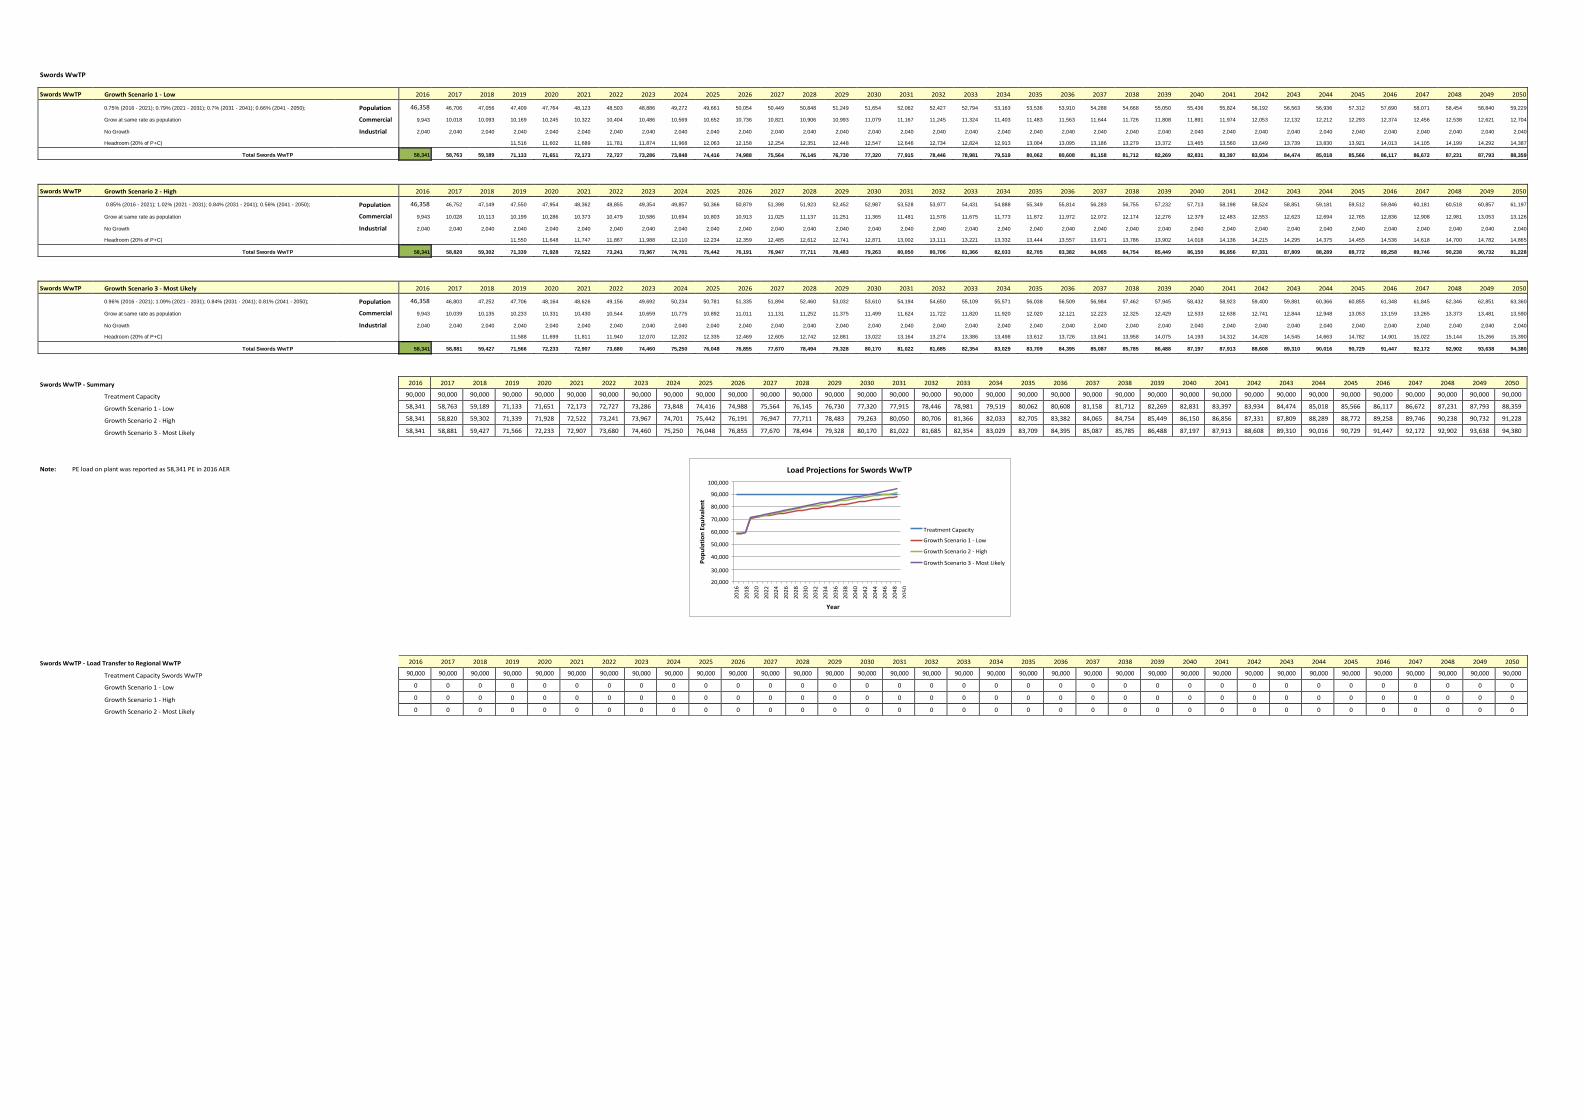
Swords WwTP
Swords WwTP Growth Scenario 1 - Low 2016 2017 2018 2019 2020 2021 2022 2023 2024 2025 2026 2027 2028 2029 2030 2031 2032 2033 2034 2035 2036 2037 2038 2039 2040 2041 2042 2043 2044 2045 2046 2047 2048 2049 2050
0.75% (2016 - 2021); 0.79% (2021 - 2031); 0.7% (2031 - 2041); 0.66% (2041 - 2050); Population 46,358 46,706 47,056 47,409 47,764 48,123 48,503 48,886 49,272 49,661 50,054 50,449 50,848 51,249 51,654 52,062 52,427 52,794 53,163 53,536 53,910 54,288 54,668 55,050 55,436 55,824 56,192 56,563 56,936 57,312 57,690 58,071 58,454 58,840 59,229
Grow at same rate as population Commercial 9,943 10,018 10,093 10,169 10,245 10,322 10,404 10,486 10,569 10,652 10,736 10,821 10,906 10,993 11,079 11,167 11,245 11,324 11,403 11,483 11,563 11,644 11,726 11,808 11,891 11,974 12,053 12,132 12,212 12,293 12,374 12,456 12,538 12,621 12,704
No Growth Industrial 2,040 2,040 2,040 2,040 2,040 2,040 2,040 2,040 2,040 2,040 2,040 2,040 2,040 2,040 2,040 2,040 2,040 2,040 2,040 2,040 2,040 2,040 2,040 2,040 2,040 2,040 2,040 2,040 2,040 2,040 2,040 2,040 2,040 2,040 2,040
Headroom (20% of P+C) 11,516 11,602 11,689 11,781 11,874 11,968 12,063 12,158 12,254 12,351 12,448 12,547 12,646 12,734 12,824 12,913 13,004 13,095 13,186 13,279 13,372 13,465 13,560 13,649 13,739 13,830 13,921 14,013 14,105 14,199 14,292 14,387
Total Swords WwTP 58,341 58,763 59,189 71,133 71,651 72,173 72,727 73,286 73,848 74,416 74,988 75,564 76,145 76,730 77,320 77,915 78,446 78,981 79,519 80,062 80,608 81,158 81,712 82,269 82,831 83,397 83,934 84,474 85,018 85,566 86,117 86,672 87,231 87,793 88,359
Swords WwTP Growth Scenario 2 - High 2016 2017 2018 2019 2020 2021 2022 2023 2024 2025 2026 2027 2028 2029 2030 2031 2032 2033 2034 2035 2036 2037 2038 2039 2040 2041 2042 2043 2044 2045 2046 2047 2048 2049 2050
0.85% (2016 - 2021); 1.02% (2021 - 2031); 0.84% (2031 - 2041); 0.56% (2041 - 2050); Population 46,358 46,752 47,149 47,550 47,954 48,362 48,855 49,354 49,857 50,366 50,879 51,398 51,923 52,452 52,987 53,528 53,977 54,431 54,888 55,349 55,814 56,283 56,755 57,232 57,713 58,198 58,524 58,851 59,181 59,512 59,846 60,181 60,518 60,857 61,197
Grow at same rate as population Commercial 9,943 10,028 10,113 10,199 10,286 10,373 10,479 10,586 10,694 10,803 10,913 11,025 11,137 11,251 11,365 11,481 11,578 11,675 11,773 11,872 11,972 12,072 12,174 12,276 12,379 12,483 12,553 12,623 12,694 12,765 12,836 12,908 12,981 13,053 13,126
No Growth Industrial 2,040 2,040 2,040 2,040 2,040 2,040 2,040 2,040 2,040 2,040 2,040 2,040 2,040 2,040 2,040 2,040 2,040 2,040 2,040 2,040 2,040 2,040 2,040 2,040 2,040 2,040 2,040 2,040 2,040 2,040 2,040 2,040 2,040 2,040 2,040
Headroom (20% of P+C) 11,550 11,648 11,747 11,867 11,988 12,110 12,234 12,359 12,485 12,612 12,741 12,871 13,002 13,111 13,221 13,332 13,444 13,557 13,671 13,786 13,902 14,018 14,136 14,215 14,295 14,375 14,455 14,536 14,618 14,700 14,782 14,865
Total Swords WwTP 58,341 58,820 59,302 71,339 71,928 72,522 73,241 73,967 74,701 75,442 76,191 76,947 77,711 78,483 79,263 80,050 80,706 81,366 82,033 82,705 83,382 84,065 84,754 85,449 86,150 86,856 87,331 87,809 88,289 88,772 89,258 89,746 90,238 90,732 91,228
Swords WwTP Growth Scenario 3 - Most Likely 2016 2017 2018 2019 2020 2021 2022 2023 2024 2025 2026 2027 2028 2029 2030 2031 2032 2033 2034 2035 2036 2037 2038 2039 2040 2041 2042 2043 2044 2045 2046 2047 2048 2049 2050
0.96% (2016 - 2021); 1.09% (2021 - 2031); 0.84% (2031 - 2041); 0.81% (2041 - 2050); Population 46,358 46,803 47,252 47,706 48,164 48,626 49,156 49,692 50,234 50,781 51,335 51,894 52,460 53,032 53,610 54,194 54,650 55,109 55,571 56,038 56,509 56,984 57,462 57,945 58,432 58,923 59,400 59,881 60,366 60,855 61,348 61,845 62,346 62,851 63,360
Grow at same rate as population Commercial 9,943 10,039 10,135 10,233 10,331 10,430 10,544 10,659 10,775 10,892 11,011 11,131 11,252 11,375 11,499 11,624 11,722 11,820 11,920 12,020 12,121 12,223 12,325 12,429 12,533 12,638 12,741 12,844 12,948 13,053 13,159 13,265 13,373 13,481 13,590
No Growth Industrial 2,040 2,040 2,040 2,040 2,040 2,040 2,040 2,040 2,040 2,040 2,040 2,040 2,040 2,040 2,040 2,040 2,040 2,040 2,040 2,040 2,040 2,040 2,040 2,040 2,040 2,040 2,040 2,040 2,040 2,040 2,040 2,040 2,040 2,040 2,040
Headroom (20% of P+C) 11,588 11,699 11,811 11,940 12,070 12,202 12,335 12,469 12,605 12,742 12,881 13,022 13,164 13,274 13,386 13,498 13,612 13,726 13,841 13,958 14,075 14,193 14,312 14,428 14,545 14,663 14,782 14,901 15,022 15,144 15,266 15,390
Total Swords WwTP 58,341 58,881 59,427 71,566 72,233 72,907 73,680 74,460 75,250 76,048 76,855 77,670 78,494 79,328 80,170 81,022 81,685 82,354 83,029 83,709 84,395 85,087 85,785 86,488 87,197 87,913 88,608 89,310 90,016 90,729 91,447 92,172 92,902 93,638 94,380
Swords WwTP - Summary
Treatment Capacity
Growth Scenario 1 - Low
Growth Scenario 2 - High
Growth Scenario 3 - Most Likely
Note: PE load on plant was reported as 58,341 PE in 2016 AER
Swords WwTP - Load Transfer to Regional WwTP
Treatment Capacity Swords WwTP
Growth Scenario 1 - Low
Growth Scenario 1 - High
Growth Scenario 2 - Most Likely
Year
30,000
20,000
Treatment Capacity
Growth Scenario 1 - Low
Growth Scenario 2 - High
Growth Scenario 3 - Most Likely
100,000
90,000
80,000
70,000
60,000
50,000
40,000
Load Projections for Swords WwTP
Po
pu
lati
on
Eq
uiv
ale
nt
20
16
20
18
20
20
20
22
20
24
20
26
20
28
20
30
20
32
20
34
20
36
20
38
20
40
20
42
20
44
20
46
20
48
20
50
2016 2017 2018 2019 2020 2021 2022 2023 2024 2025 2026 2027 2028 2029 2030 2031 2032 2033 2034 2035 2036 2037 2038 2039 2040 2041 2042 2043 2044 2045 2046 2047 2048 2049 2050
90,000 90,000 90,000 90,000 90,000 90,000 90,000 90,000 90,000 90,000 90,000 90,000 90,000 90,000 90,000 90,000 90,000 90,000 90,000 90,000 90,000 90,000 90,000 90,000 90,000 90,000 90,000 90,000 90,000 90,000 90,000 90,000 90,000 90,000 90,000
58,341 58,763 59,189 71,133 71,651 72,173 72,727 73,286 73,848 74,416 74,988 75,564 76,145 76,730 77,320 77,915 78,446 78,981 79,519 80,062 80,608 81,158 81,712 82,269 82,831 83,397 83,934 84,474 85,018 85,566 86,117 86,672 87,231 87,793 88,359
58,341 58,820 59,302 71,339 71,928 72,522 73,241 73,967 74,701 75,442 76,191 76,947 77,711 78,483 79,263 80,050 80,706 81,366 82,033 82,705 83,382 84,065 84,754 85,449 86,150 86,856 87,331 87,809 88,289 88,772 89,258 89,746 90,238 90,732 91,228
58,341 58,881 59,427 71,566 72,233 72,907 73,680 74,460 75,250 76,048 76,855 77,670 78,494 79,328 80,170 81,022 81,685 82,354 83,029 83,709 84,395 85,087 85,785 86,488 87,197 87,913 88,608 89,310 90,016 90,729 91,447 92,172 92,902 93,638 94,380
2016 2017 2018 2019 2020 2021 2022 2023 2024 2025 2026 2027 2028 2029 2030 2031 2032 2033 2034 2035 2036 2037 2038 2039 2040 2041 2042 2043 2044 2045 2046 2047 2048 2049 2050
90,000 90,000 90,000 90,000 90,000 90,000 90,000 90,000 90,000 90,000 90,000 90,000 90,000 90,000 90,000 90,000 90,000 90,000 90,000 90,000 90,000 90,000 90,000 90,000 90,000 90,000 90,000 90,000 90,000 90,000 90,000 90,000 90,000 90,000 90,000
0 0 0 0 0 0 0 0 0 0 0 0 0 0 0 0 0 0 0 0 0 0 0 0 0 0 0 0 0 0 0 0 0 0 0
0 0 0 0 0 0 0 0 0 0 0 0 0 0 0 0 0 0 0 0 0 0 0 0 0 0 0 0 0 0 0 0 0 0 0
0 0 0 0 0 0 0 0 0 0 0 0 0 0 0 0 0 0 0 0 0 0 0 0 0 0 0 0 0 0 0 0 0 0 0
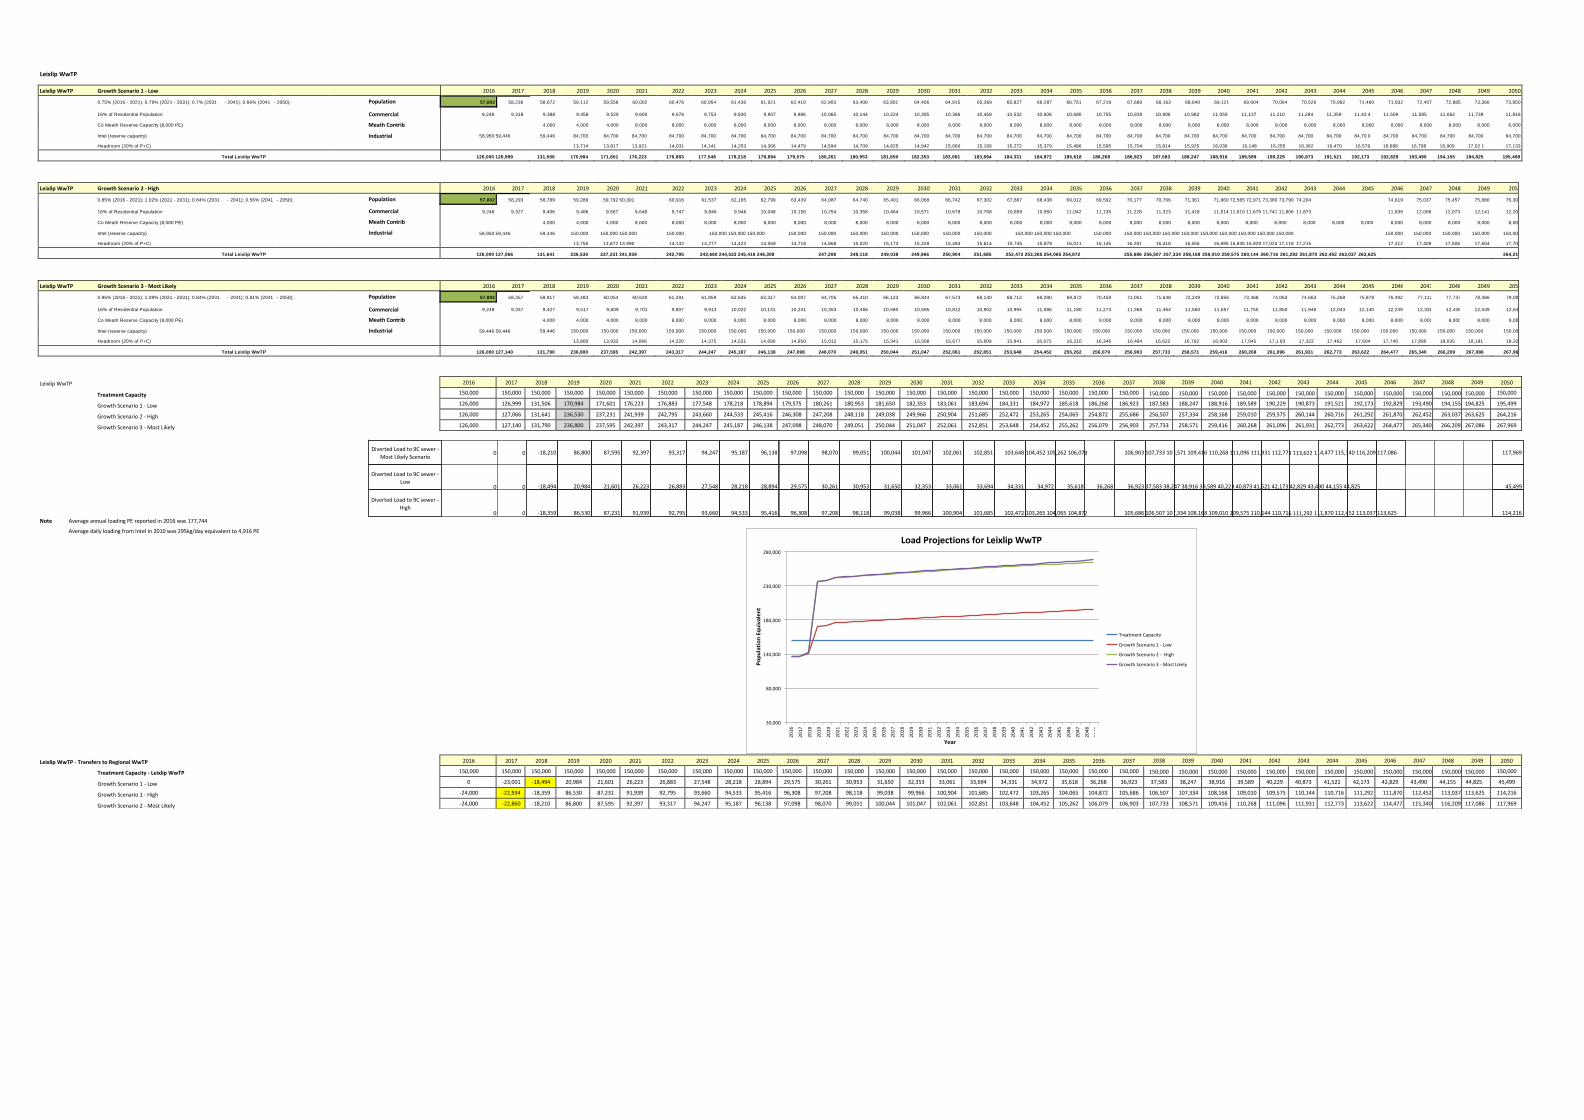
Leixlip WwTP
Leixlip WwTP Growth Scenario 1 - Low 2016 2017 2018 2019 2020 2021 2022 2023 2024 2025 2026 2027 2028 2029 2030 2031 2032 2033 2034 2035 2036 2037 2038 2039 2040 2041 2042 2043 2044 2045 2046 2047 2048 2049 2050
0.75% (2016 - 2021); 0.79% (2021 - 2031); 0.7% (2031 - 2041); 0.66% (2041 - 2050); Population 57,802 58,236 58,672 59,112 59,556 60,002 60,476 60,954 61,436 61,921 62,410 62,903 63,400 63,901 64,406 64,915 65,369 65,827 66,287 66,751 67,219 67,689 68,163 68,640 69,121 69,604 70,064 70,526 70,992 71,460 71,932 72,407 72,885 73,366 73,850
16% of Residential Population Commercial 9,248 9,318 9,388 9,458 9,529 9,600 9,676 9,753 9,830 9,907 9,986 10,065 10,144 10,224 10,305 10,386 10,459 10,532 10,606 10,680 10,755 10,830 10,906 10,982 11,059 11,137 11,210 11,284 11,359 11,43 4 11,509 11,585 11,662 11,739 11,816
Co Meath Reserve Capacity (8,000 PE) Meath Contrib 4,000 4,000 4,000 8,000 8,000 8,000 8,000 8,000 8,000 8,000 8,000 8,000 8,000 8,000 8,000 8,000 8,000 8,000 8,000 8,000 8,000 8,000 8,000 8,000 8,000 8,000 8,000 8,000 8,000 8,000 8,000 8,000 8,000
Intel (reserve capacity) Industrial 58,950 59,446 59,446 84,700 84,700 84,700 84,700 84,700 84,700 84,700 84,700 84,700 84,700 84,700 84,700 84,700 84,700 84,700 84,700 84,700 84,700 84,700 84,700 84,700 84,700 84,700 84,700 84,700 84,700 84,70 0 84,700 84,700 84,700 84,700 84,700
Headroom (20% of P+C) 13,714 13,817 13,921 14,031 14,141 14,253 14,366 14,479 14,594 14,709 14,825 14,942 15,060 15,166 15,272 15,379 15,486 15,595 15,704 15,814 15,925 16,036 16,148 16,255 16,362 16,470 16,579 16,688 16,798 16,909 17,02 1 17,133
Total Leixlip WwTP 126,000 126,999 131,506 170,984 171,601 176,223 176,883 177,548 178,218 178,894 179,575 180,261 180,953 181,650 182,353 183,061 183,694 184,331 184,972 185,618 186,268 186,923 187,583 188,247 188,916 189,589 190,229 190,873 191,521 192,173 192,829 193,490 194,155 194,825 195,499
Leixlip WwTP Growth Scenario 2 - High 2016 2017 2018 2019 2020 2021 2022 2023 2024 2025 2026 2027 2028 2029 2030 2031 2032 2033 2034 2035 2036 2037 2038 2039 2040 2041 2042 2043 2044 2045 2046 2047 2048 2049 2050
0.85% (2016 - 2021); 1.02% (2021 - 2031); 0.84% (2031 - 2041); 0.56% (2041 - 2050); Population 57,802 58,293 58,789 59,289 59,792 60,301 60,916 61,537 62,165 62,799 63,439 64,087 64,740 65,401 66,068 66,742 67,302 67,867 68,438 69,012 69,592 70,177 70,766 71,361 71,960 72,565 72,971 73,380 73,790 74,204 74,619 75,037 75,457 75,880 76,305
16% of Residential Population Commercial 9,248 9,327 9,406 9,486 9,567 9,648 9,747 9,846 9,946 10,048 10,150 10,254 10,358 10,464 10,571 10,679 10,768 10,859 10,950 11,042 11,135 11,228 11,323 11,418 11,514 11,610 11,675 11,741 11,806 11,873 11,939 12,006 12,073 12,141 12,209
Co Meath Reserve Capacity (8,000 PE) Meath Contrib 4,000 4,000 4,000 8,000 8,000 8,000 8,000 8,000 8,000 8,000 8,000 8,000 8,000 8,000 8,000 8,000 8,000 8,000 8,000 8,000 8,000 8,000 8,000 8,000 8,000 8,000 8,000 8,000 8,000 8,000 8,000 8,000 8,000
Intel (reserve capacity) Industrial 58,950 59,446 59,446 150,000 150,000 150,000 150,000 150,000 150,000 150,000 150,000 150,000 150,000 150,000 150,000 150,000 150,000 150,000 150,000 150,000 150,000 150,000 150,000 150,000 150,000 150,000 150,000 150,000 150,000 150,000 150,000 150,000 150,000 150,000 150,000
Headroom (20% of P+C) 13,755 13,872 13,990 14,132 14,277 14,422 14,569 14,718 14,868 15,020 15,173 15,328 15,484 15,614 15,745 15,878 16,011 16,145 16,281 16,418 16,556 16,695 16,835 16,929 17,024 17,119 17,215 17,312 17,409 17,506 17,604 17,703
Total Leixlip WwTP 126,000 127,066 131,641 236,530 237,231 241,939 242,795 243,660 244,533 245,416 246,308 247,208 248,118 249,038 249,966 250,904 251,685 252,472 253,265 254,065 254,872 255,686 256,507 257,334 258,168 259,010 259,575 260,144 260,716 261,292 261,870 262,452 263,037 263,625 264,216
Leixlip WwTP Growth Scenario 3 - Most Likely 2016 2017 2018 2019 2020 2021 2022 2023 2024 2025 2026 2027 2028 2029 2030 2031 2032 2033 2034 2035 2036 2037 2038 2039 2040 2041 2042 2043 2044 2045 2046 2047 2048 2049 2050
0.96% (2016 - 2021); 1.09% (2021 - 2031); 0.84% (2031 - 2041); 0.81% (2041 - 2050); Population 57,802 58,357 58,917 59,483 60,054 60,630 61,291 61,959 62,635 63,317 64,007 64,705 65,410 66,123 66,844 67,573 68,140 68,713 69,290 69,872 70,459 71,051 71,648 72,249 72,856 73,468 74,063 74,663 75,268 75,878 76,492 77,112 77,737 78,366 79,001
16% of Residential Population Commercial 9,248 9,337 9,427 9,517 9,609 9,701 9,807 9,913 10,022 10,131 10,241 10,353 10,466 10,580 10,695 10,812 10,902 10,994 11,086 11,180 11,273 11,368 11,464 11,560 11,657 11,755 11,850 11,946 12,043 12,140 12,239 12,338 12,438 12,539 12,640
Co Meath Reserve Capacity (8,000 PE) Meath Contrib 4,000 4,000 4,000 8,000 8,000 8,000 8,000 8,000 8,000 8,000 8,000 8,000 8,000 8,000 8,000 8,000 8,000 8,000 8,000 8,000 8,000 8,000 8,000 8,000 8,000 8,000 8,000 8,000 8,000 8,000 8,000 8,000 8,000
Intel (reserve capacity) Industrial 59,446 59,446 59,446 150,000 150,000 150,000 150,000 150,000 150,000 150,000 150,000 150,000 150,000 150,000 150,000 150,000 150,000 150,000 150,000 150,000 150,000 150,000 150,000 150,000 150,000 150,000 150,000 150,000 150,000 150,000 150,000 150,000 150,000 150,000 150,000
Headroom (20% of P+C) 13,800 13,932 14,066 14,220 14,375 14,531 14,690 14,850 15,012 15,175 15,341 15,508 15,677 15,809 15,941 16,075 16,210 16,346 16,484 16,622 16,762 16,903 17,045 17,1 83 17,322 17,462 17,604 17,746 17,890 18,035 18,181 18,328
Total Leixlip WwTP 126,000 127,140 131,790 236,800 237,595 242,397 243,317 244,247 245,187 246,138 247,098 248,070 249,051 250,044 251,047 252,061 252,851 253,648 254,452 255,262 256,079 256,903 257,733 258,571 259,416 260,268 261,096 261,931 262,773 263,622 264,477 265,340 266,209 267,086 267,969
Leixlip WwTP
Treatment Capacity
Growth Scenario 1 - Low
Growth Scenario 2 - High
Growth Scenario 3 - Most Likely
Note Average annual loading PE reported in 2016 was 177,744
Average daily loading from Intel in 2010 was 295kg/day equivalent to 4,916 PE
Leixlip WwTP - Transfers to Regional WwTP
Treatment Capacity - Leixlip WwTP
Growth Scenario 1 - Low
Growth Scenario 1 - High
Growth Scenario 2 - Most Likely
3 113,622 1
6 111,292 1 114,216 113,625 52 113,037 11,870 112,4 144 110,71 09,575 110, 8 109,010 1 7,334 108,16 106,507 10 105,686 2 ,065 104,87 103,265 104 102,472 101,685 100,904 99,966 99,038 98,118 97,208 96,308 95,416 94,533 93,660 92,795 91,939 87,231 86,530 -18,359 0 0
Diverted Load to 9C sewer -
High
45,499 4,825 90 44,155 4 42,829 43,4 521 42,173 9 40,873 41, 9,589 40,22 47 38,916 3 37,583 38,2 36,923 36,268 35,618 34,972 34,331 33,694 33,061 32,353 31,650 30,953 30,261 29,575 28,894 28,218 27,548 26,883 26,223 21,601 20,984 -18,494 0 0
Diverted Load to 9C sewer -
Low
117,969 117,086 40 116,209 14,477 115,3 931 112,77 11,096 111, 6 110,268 1 8,571 109,41 107,733 10 106,903 9 ,262 106,07 104,452 105 103,648 102,851 102,061 101,047 100,044 99,051 98,070 97,098 96,138 95,187 94,247 93,317 92,397 87,595 86,800 -18,210 0 0 Diverted Load to 9C sewer -
Most Likely Scenario
Year
30,000
80,000
Growth Scenario 1 - Low
Growth Scenario 2 - High
Growth Scenario 3 - Most Likely
130,000
Treatment Capacity
180,000
230,000
280,000
Load Projections for Leixlip WwTP
Po
pu
lati
on
Eq
uiv
ale
nt
20
16
20
17
20
18
20
19
20
20
20
21
20
22
20
23
20
24
20
25
20
26
20
27
20
28
20
29
20
30
20
31
20
32
20
33
20
34
20
35
20
36
20
37
20
38
20
39
20
40
20
41
20
42
20
43
20
44
20
45
20
46
20
47
20
48
20
49
2016 2017 2018 2019 2020 2021 2022 2023 2024 2025 2026 2027 2028 2029 2030 2031 2032 2033 2034 2035 2036 2037 2038 2039 2040 2041 2042 2043 2044 2045 2046 2047 2048 2049 2050
150,000 150,000 150,000 150,000 150,000 150,000 150,000 150,000 150,000 150,000 150,000 150,000 150,000 150,000 150,000 150,000 150,000 150,000 150,000 150,000 150,000 150,000 150,000 150,000 150,000 150,000 150,000 150,000 150,000 150,000 150,000 150,000 150,000 150,000 150,000
126,000 126,999 131,506 170,984 171,601 176,223 176,883 177,548 178,218 178,894 179,575 180,261 180,953 181,650 182,353 183,061 183,694 184,331 184,972 185,618 186,268 186,923 187,583 188,247 188,916 189,589 190,229 190,873 191,521 192,173 192,829 193,490 194,155 194,825 195,499
126,000 127,066 131,641 236,530 237,231 241,939 242,795 243,660 244,533 245,416 246,308 247,208 248,118 249,038 249,966 250,904 251,685 252,472 253,265 254,065 254,872 255,686 256,507 257,334 258,168 259,010 259,575 260,144 260,716 261,292 261,870 262,452 263,037 263,625 264,216
126,000 127,140 131,790 236,800 237,595 242,397 243,317 244,247 245,187 246,138 247,098 248,070 249,051 250,044 251,047 252,061 252,851 253,648 254,452 255,262 256,079 256,903 257,733 258,571 259,416 260,268 261,096 261,931 262,773 263,622 264,477 265,340 266,209 267,086 267,969
2016 2017 2018 2019 2020 2021 2022 2023 2024 2025 2026 2027 2028 2029 2030 2031 2032 2033 2034 2035 2036 2037 2038 2039 2040 2041 2042 2043 2044 2045 2046 2047 2048 2049 2050
150,000 150,000 150,000 150,000 150,000 150,000 150,000 150,000 150,000 150,000 150,000 150,000 150,000 150,000 150,000 150,000 150,000 150,000 150,000 150,000 150,000 150,000 150,000 150,000 150,000 150,000 150,000 150,000 150,000 150,000 150,000 150,000 150,000 150,000 150,000
0 -23,001 -18,494 20,984 21,601 26,223 26,883 27,548 28,218 28,894 29,575 30,261 30,953 31,650 32,353 33,061 33,694 34,331 34,972 35,618 36,268 36,923 37,583 38,247 38,916 39,589 40,229 40,873 41,521 42,173 42,829 43,490 44,155 44,825 45,499
-24,000 -22,934 -18,359 86,530 87,231 91,939 92,795 93,660 94,533 95,416 96,308 97,208 98,118 99,038 99,966 100,904 101,685 102,472 103,265 104,065 104,872 105,686 106,507 107,334 108,168 109,010 109,575 110,144 110,716 111,292 111,870 112,452 113,037 113,625 114,216
-24,000 -22,860 -18,210 86,800 87,595 92,397 93,317 94,247 95,187 96,138 97,098 98,070 99,051 100,044 101,047 102,061 102,851 103,648 104,452 105,262 106,079 106,903 107,733 108,571 109,416 110,268 111,096 111,931 112,773 113,622 114,477 115,340 116,209 117,086 117,969
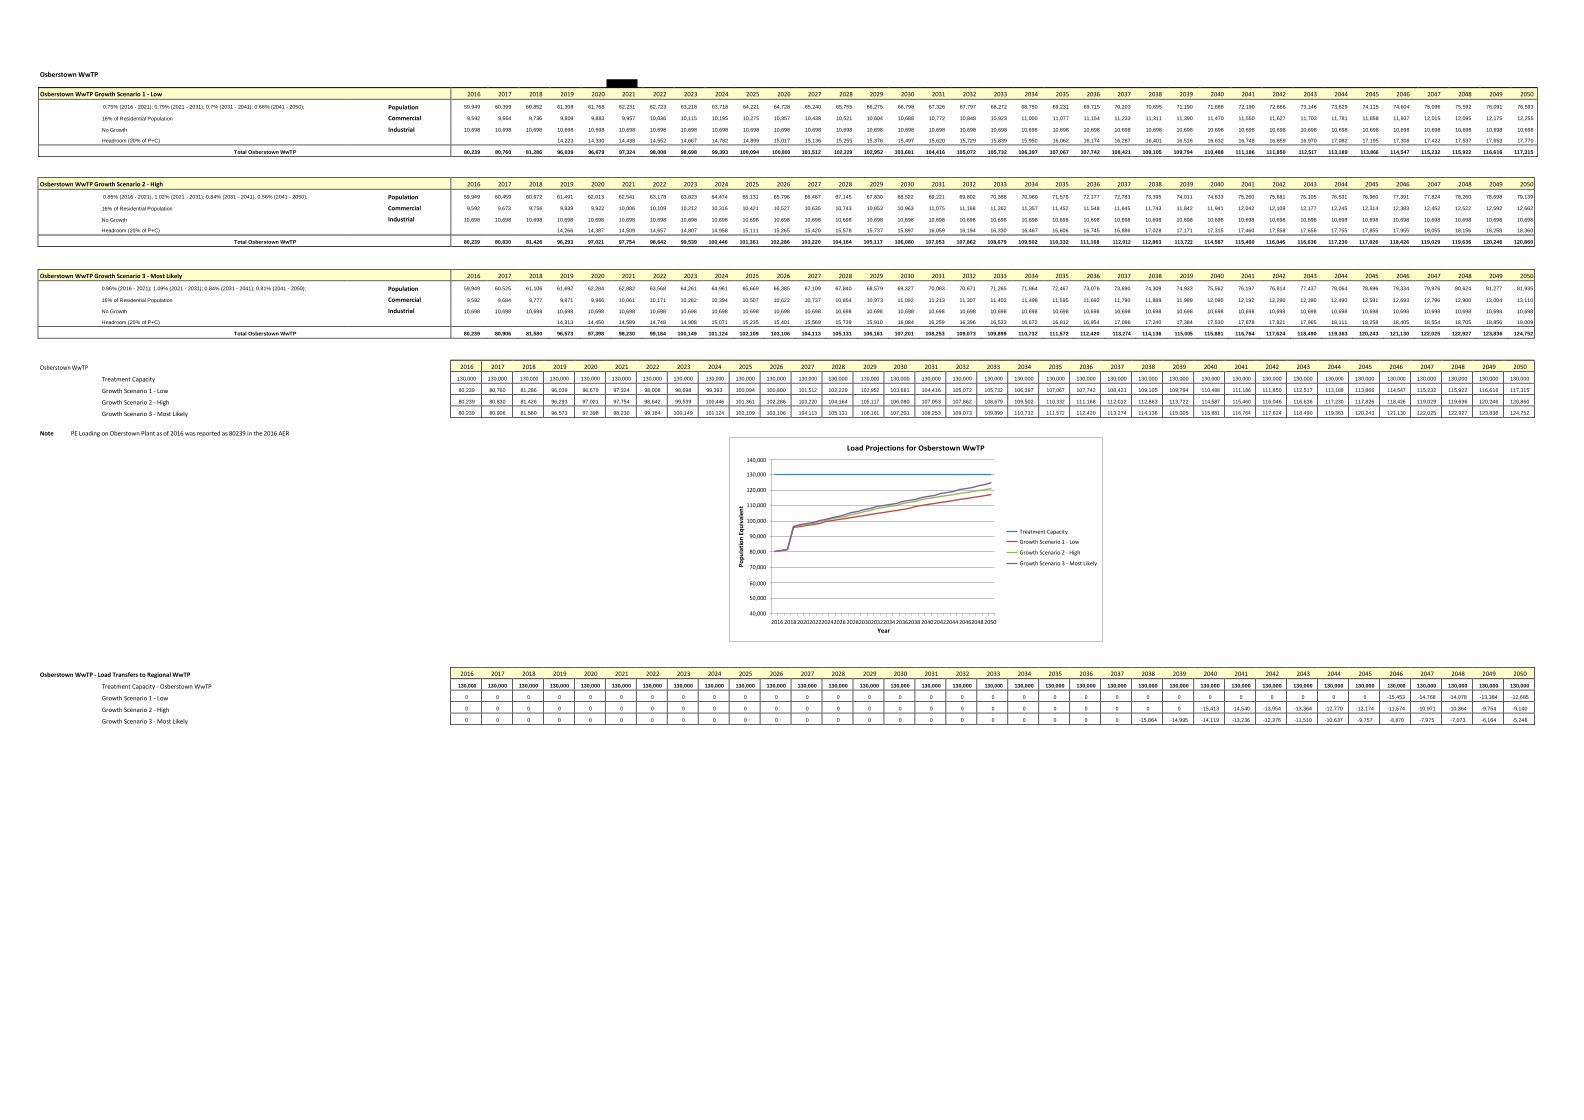
Osberstown WwTP
Osberstown WwTP Growth Scenario 1 - Low 2016 2017 2018 2019 2020 2021 2022 2023 2024 2025 2026 2027 2028 2029 2030 2031 2032 2033 2034 2035 2036 2037 2038 2039 2040 2041 2042 2043 2044 2045 2046 2047 2048 2049 2050
0.75% (2016 - 2021); 0.79% (2021 - 2031); 0.7% (2031 - 2041); 0.66% (2041 - 2050); Population 59,949 60,399 60,852 61,308 61,768 62,231 62,723 63,218 63,718 64,221 64,728 65,240 65,755 66,275 66,798 67,326 67,797 68,272 68,750 69,231 69,715 70,203 70,695 71,190 71,688 72,190 72,666 73,146 73,629 74,115 74,604 75,096 75,592 76,091 76,593
16% of Residential Population Commercial 9,592 9,664 9,736 9,809 9,883 9,957 10,036 10,115 10,195 10,275 10,357 10,438 10,521 10,604 10,688 10,772 10,848 10,923 11,000 11,077 11,154 11,233 11,311 11,390 11,470 11,550 11,627 11,703 11,781 11,858 11,937 12,015 12,095 12,175 12,255
No Growth Industrial 10,698 10,698 10,698 10,698 10,698 10,698 10,698 10,698 10,698 10,698 10,698 10,698 10,698 10,698 10,698 10,698 10,698 10,698 10,698 10,698 10,698 10,698 10,698 10,698 10,698 10,698 10,698 10,698 10,698 10,698 10,698 10,698 10,698 10,698 10,698
Headroom (20% of P+C) 14,223 14,330 14,438 14,552 14,667 14,782 14,899 15,017 15,136 15,255 15,376 15,497 15,620 15,729 15,839 15,950 16,062 16,174 16,287 16,401 16,516 16,632 16,748 16,859 16,970 17,082 17,195 17,308 17,422 17,537 17,653 17,770
Total Osberstown WwTP 80,239 80,760 81,286 96,039 96,679 97,324 98,008 98,698 99,393 100,094 100,800 101,512 102,229 102,952 103,681 104,416 105,072 105,732 106,397 107,067 107,742 108,421 109,105 109,794 110,488 111,186 111,850 112,517 113,189 113,866 114,547 115,232 115,922 116,616 117,315
Osberstown WwTP Growth Scenario 2 - High 2016 2017 2018 2019 2020 2021 2022 2023 2024 2025 2026 2027 2028 2029 2030 2031 2032 2033 2034 2035 2036 2037 2038 2039 2040 2041 2042 2043 2044 2045 2046 2047 2048 2049 2050
0.85% (2016 - 2021); 1.02% (2021 - 2031); 0.84% (2031 - 2041); 0.56% (2041 - 2050); Population 59,949 60,459 60,972 61,491 62,013 62,541 63,178 63,823 64,474 65,131 65,796 66,467 67,145 67,830 68,522 69,221 69,802 70,388 70,980 71,576 72,177 72,783 73,395 74,011 74,633 75,260 75,681 76,105 76,531 76,960 77,391 77,824 78,260 78,698 79,139
16% of Residential Population Commercial 9,592 9,673 9,756 9,839 9,922 10,006 10,109 10,212 10,316 10,421 10,527 10,635 10,743 10,853 10,963 11,075 11,168 11,262 11,357 11,452 11,548 11,645 11,743 11,842 11,941 12,042 12,109 12,177 12,245 12,314 12,383 12,452 12,522 12,592 12,662
No Growth Industrial 10,698 10,698 10,698 10,698 10,698 10,698 10,698 10,698 10,698 10,698 10,698 10,698 10,698 10,698 10,698 10,698 10,698 10,698 10,698 10,698 10,698 10,698 10,698 10,698 10,698 10,698 10,698 10,698 10,698 10,698 10,698 10,698 10,698 10,698 10,698
Headroom (20% of P+C) 14,266 14,387 14,509 14,657 14,807 14,958 15,111 15,265 15,420 15,578 15,737 15,897 16,059 16,194 16,330 16,467 16,606 16,745 16,886 17,028 17,171 17,315 17,460 17,558 17,656 17,755 17,855 17,955 18,055 18,156 18,258 18,360
Total Osberstown WwTP 80,239 80,830 81,426 96,293 97,021 97,754 98,642 99,539 100,446 101,361 102,286 103,220 104,164 105,117 106,080 107,053 107,862 108,679 109,502 110,332 111,168 112,012 112,863 113,722 114,587 115,460 116,046 116,636 117,230 117,826 118,426 119,029 119,636 120,246 120,860
Osberstown WwTP Growth Scenario 3 - Most Likely 2016 2017 2018 2019 2020 2021 2022 2023 2024 2025 2026 2027 2028 2029 2030 2031 2032 2033 2034 2035 2036 2037 2038 2039 2040 2041 2042 2043 2044 2045 2046 2047 2048 2049 2050
0.96% (2016 - 2021); 1.09% (2021 - 2031); 0.84% (2031 - 2041); 0.81% (2041 - 2050); Population 59,949 60,525 61,106 61,692 62,284 62,882 63,568 64,261 64,961 65,669 66,385 67,109 67,840 68,579 69,327 70,083 70,671 71,265 71,864 72,467 73,076 73,690 74,309 74,933 75,562 76,197 76,814 77,437 78,064 78,696 79,334 79,976 80,624 81,277 81,935
16% of Residential Population Commercial 9,592 9,684 9,777 9,871 9,966 10,061 10,171 10,282 10,394 10,507 10,622 10,737 10,854 10,973 11,092 11,213 11,307 11,402 11,498 11,595 11,692 11,790 11,889 11,989 12,090 12,192 12,290 12,390 12,490 12,591 12,693 12,796 12,900 13,004 13,110
No Growth Industrial 10,698 10,698 10,698 10,698 10,698 10,698 10,698 10,698 10,698 10,698 10,698 10,698 10,698 10,698 10,698 10,698 10,698 10,698 10,698 10,698 10,698 10,698 10,698 10,698 10,698 10,698 10,698 10,698 10,698 10,698 10,698 10,698 10,698 10,698 10,698
Headroom (20% of P+C) 14,313 14,450 14,589 14,748 14,908 15,071 15,235 15,401 15,569 15,739 15,910 16,084 16,259 16,396 16,533 16,672 16,812 16,954 17,096 17,240 17,384 17,530 17,678 17,821 17,965 18,111 18,258 18,405 18,554 18,705 18,856 19,009
Total Osberstown WwTP 80,239 80,906 81,580 96,573 97,398 98,230 99,184 100,149 101,124 102,109 103,106 104,113 105,131 106,161 107,201 108,253 109,073 109,899 110,732 111,572 112,420 113,274 114,136 115,005 115,881 116,764 117,624 118,490 119,363 120,243 121,130 122,025 122,927 123,836 124,752
Osberstown WwTP
Treatment Capacity
Growth Scenario 1 - Low
Growth Scenario 2 - High
Growth Scenario 3 - Most Likely
Note PE Loading on Oberstown Plant as of 2016 was reported as 80239 in the 2016 AER
Osberstown WwTP - Load Transfers to Regional WwTP
Treatment Capacity - Osberstown WwTP
Growth Scenario 1 - Low
Growth Scenario 2 - High
Growth Scenario 3 - Most Likely
2016 2018 2020202220242026 2028203020322034 20362038 2040 20422044 20462048 2050
Year
60,000
50,000
40,000
Treatment Capacity
Growth Scenario 1 - Low
Growth Scenario 2 - High
Growth Scenario 3 - Most Likely
140,000
130,000
120,000
110,000
100,000
90,000
80,000
70,000
Load Projections for Osberstown WwTP
Po
pu
lati
on
Eq
uiv
alen
t
2016 2017 2018 2019 2020 2021 2022 2023 2024 2025 2026 2027 2028 2029 2030 2031 2032 2033 2034 2035 2036 2037 2038 2039 2040 2041 2042 2043 2044 2045 2046 2047 2048 2049 2050
130,000 130,000 130,000 130,000 130,000 130,000 130,000 130,000 130,000 130,000 130,000 130,000 130,000 130,000 130,000 130,000 130,000 130,000 130,000 130,000 130,000 130,000 130,000 130,000 130,000 130,000 130,000 130,000 130,000 130,000 130,000 130,000 130,000 130,000 130,000
80,239 80,760 81,286 96,039 96,679 97,324 98,008 98,698 99,393 100,094 100,800 101,512 102,229 102,952 103,681 104,416 105,072 105,732 106,397 107,067 107,742 108,421 109,105 109,794 110,488 111,186 111,850 112,517 113,189 113,866 114,547 115,232 115,922 116,616 117,315
80,239 80,830 81,426 96,293 97,021 97,754 98,642 99,539 100,446 101,361 102,286 103,220 104,164 105,117 106,080 107,053 107,862 108,679 109,502 110,332 111,168 112,012 112,863 113,722 114,587 115,460 116,046 116,636 117,230 117,826 118,426 119,029 119,636 120,246 120,860
80,239 80,906 81,580 96,573 97,398 98,230 99,184 100,149 101,124 102,109 103,106 104,113 105,131 106,161 107,201 108,253 109,073 109,899 110,732 111,572 112,420 113,274 114,136 115,005 115,881 116,764 117,624 118,490 119,363 120,243 121,130 122,025 122,927 123,836 124,752
2016 2017 2018 2019 2020 2021 2022 2023 2024 2025 2026 2027 2028 2029 2030 2031 2032 2033 2034 2035 2036 2037 2038 2039 2040 2041 2042 2043 2044 2045 2046 2047 2048 2049 2050
130,000 130,000 130,000 130,000 130,000 130,000 130,000 130,000 130,000 130,000 130,000 130,000 130,000 130,000 130,000 130,000 130,000 130,000 130,000 130,000 130,000 130,000 130,000 130,000 130,000 130,000 130,000 130,000 130,000 130,000 130,000 130,000 130,000 130,000 130,000
0 0 0 0 0 0 0 0 0 0 0 0 0 0 0 0 0 0 0 0 0 0 0 0 0 0 0 0 0 0 -15,453 -14,768 -14,078 -13,384 -12,685
0 0 0 0 0 0 0 0 0 0 0 0 0 0 0 0 0 0 0 0 0 0 0 0 -15,413 -14,540 -13,954 -13,364 -12,770 -12,174 -11,574 -10,971 -10,364 -9,754 -9,140
0 0 0 0 0 0 0 0 0 0 0 0 0 0 0 0 0 0 0 0 0 0 -15,864 -14,995 -14,119 -13,236 -12,376 -11,510 -10,637 -9,757 -8,870 -7,975 -7,073 -6,164 -5,248
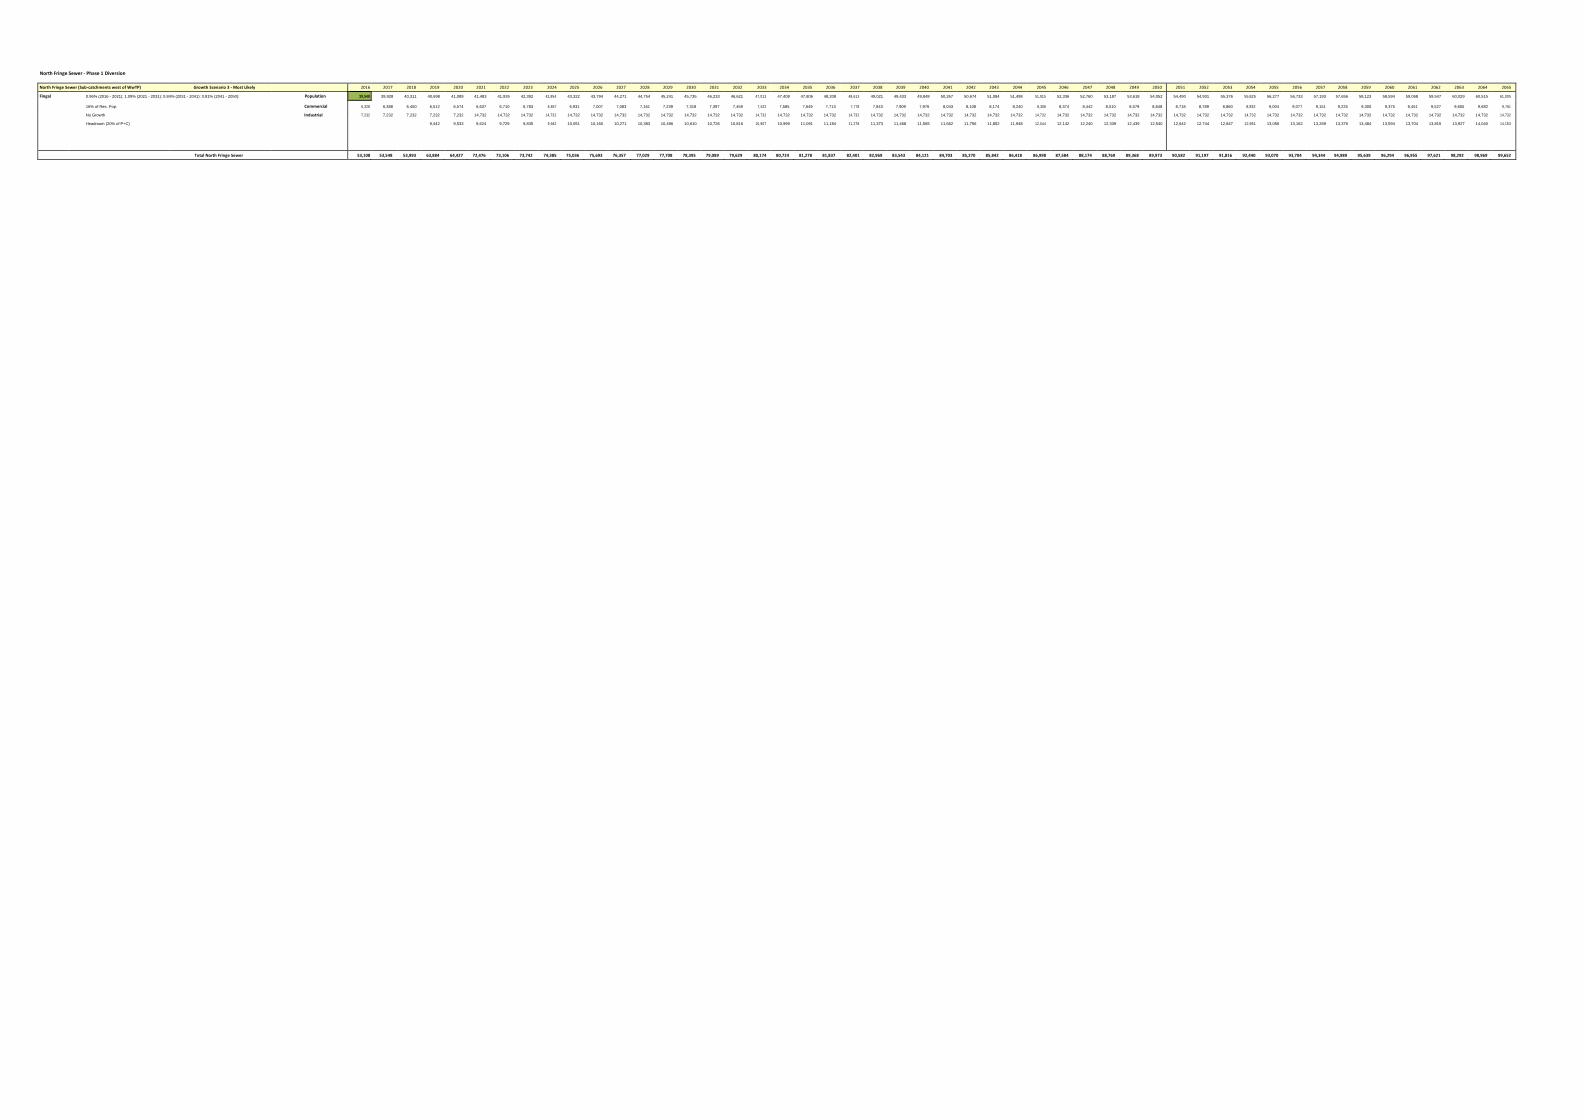
North Fringe Sewer - Phase 1 Diversion
North Fringe Sewer (Sub-catchments west of WwTP) Growth Scenario 3 - Most Likely 2016 2017 2018 2019 2020 2021 2022 2023 2024 2025 2026 2027 2028 2029 2030 2031 2032 2033 2034 2035 2036 2037 2038 2039 2040 2041 2042 2043 2044 2045 2046 2047 2048 2049 2050 2051 2052 2053 2054 2055 2056 2057 2058 2059 2060 2061 2062 2063 2064 2065
Fingal 0.96% (2016 - 2021); 1.09% (2021 - 2031); 0.84% (2031 - 2041); 0.81% (2041 - 2050); Population 39,548 39,928 40,311 40,698 41,089 41,483 41,935 42,392 42,854 43,322 43,794 44,271 44,754 45,241 45,735 46,233 46,621 47,013 47,408 47,806 48,208 48,613 49,021 49,433 49,848 50,267 50,674 51,084 51,498 51,915 52,336 52,760 53,187 53,618 54,052 54,490 54,931 55,376 55,825 56,277 56,733 57,193 57,656 58,123 58,594 59,068 59,547 60,029 60,515 61,005
16% of Res. Pop. Commercial 6,328 6,388 6,450 6,512 6,574 6,637 6,710 6,783 6,857 6,931 7,007 7,083 7,161 7,239 7,318 7,397 7,459 7,522 7,585 7,649 7,713 7,778 7,843 7,909 7,976 8,043 8,108 8,174 8,240 8,306 8,374 8,442 8,510 8,579 8,648 8,718 8,789 8,860 8,932 9,004 9,077 9,151 9,225 9,300 9,375 9,451 9,527 9,605 9,682 9,761
No Growth Industrial 7,232 7,232 7,232 7,232 7,232 14,732 14,732 14,732 14,732 14,732 14,732 14,732 14,732 14,732 14,732 14,732 14,732 14,732 14,732 14,732 14,732 14,732 14,732 14,732 14,732 14,732 14,732 14,732 14,732 14,732 14,732 14,732 14,732 14,732 14,732 14,732 14,732 14,732 14,732 14,732 14,732 14,732 14,732 14,732 14,732 14,732 14,732 14,732 14,732 14,732
Headroom (20% of P+C) 9,442 9,533 9,624 9,729 9,835 9,942 10,051 10,160 10,271 10,383 10,496 10,610 10,726 10,816 10,907 10,999 11,091 11,184 11,278 11,373 11,468 11,565 11,662 11,756 11,852 11,948 12,044 12,142 12,240 12,339 12,439 12,540 12,642 12,744 12,847 12,951 13,056 13,162 13,269 13,376 13,484 13,594 13,704 13,815 13,927 14,040 14,153
Total North Fringe Sewer 53,108 53,548 53,993 63,884 64,427 72,476 73,106 73,742 74,385 75,036 75,693 76,357 77,029 77,708 78,395 79,089 79,629 80,174 80,724 81,278 81,837 82,401 82,969 83,543 84,121 84,703 85,270 85,842 86,418 86,998 87,584 88,174 88,769 89,368 89,973 90,582 91,197 91,816 92,440 93,070 93,704 94,344 94,989 95,639 96,294 96,955 97,621 98,292 98,969 99,652
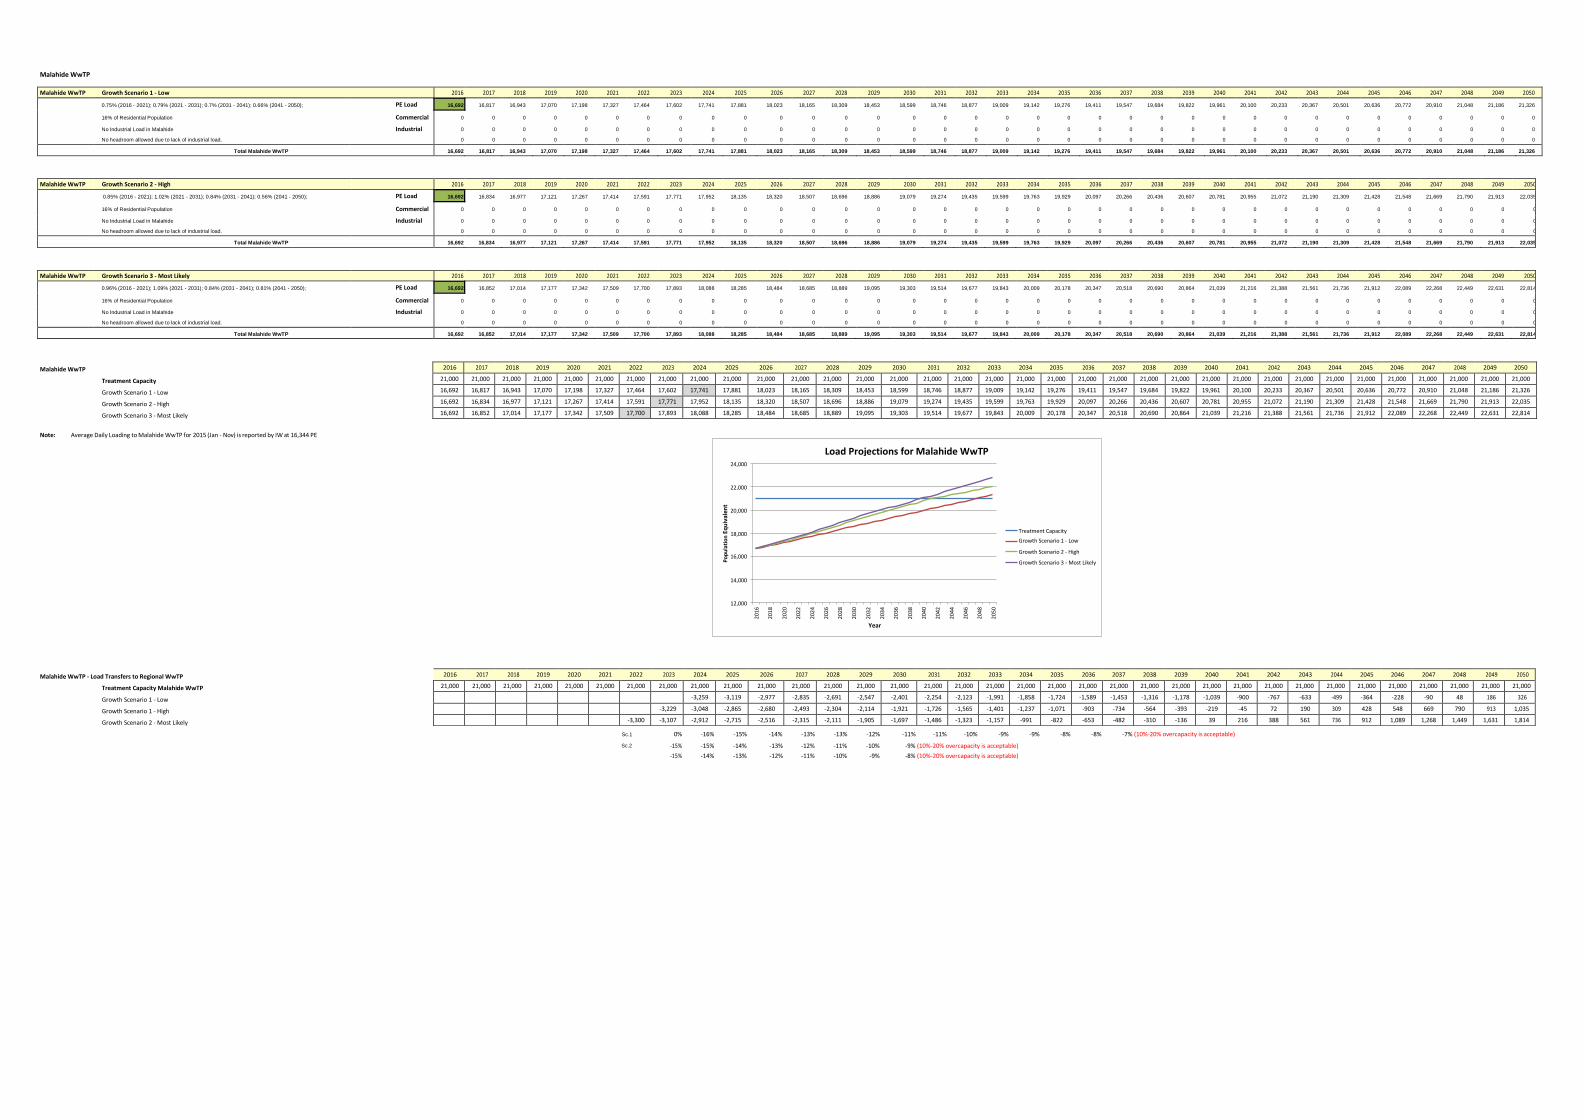
Malahide WwTP
Malahide WwTP Growth Scenario 1 - Low 2016 2017 2018 2019 2020 2021 2022 2023 2024 2025 2026 2027 2028 2029 2030 2031 2032 2033 2034 2035 2036 2037 2038 2039 2040 2041 2042 2043 2044 2045 2046 2047 2048 2049 2050
0.75% (2016 - 2021); 0.79% (2021 - 2031); 0.7% (2031 - 2041); 0.66% (2041 - 2050); PE Load 16,692 16,817 16,943 17,070 17,198 17,327 17,464 17,602 17,741 17,881 18,023 18,165 18,309 18,453 18,599 18,746 18,877 19,009 19,142 19,276 19,411 19,547 19,684 19,822 19,961 20,100 20,233 20,367 20,501 20,636 20,772 20,910 21,048 21,186 21,326
16% of Residential Population Commercial 0 0 0 0 0 0 0 0 0 0 0 0 0 0 0 0 0 0 0 0 0 0 0 0 0 0 0 0 0 0 0 0 0 0 0
No Industrial Load in Malahide Industrial 0 0 0 0 0 0 0 0 0 0 0 0 0 0 0 0 0 0 0 0 0 0 0 0 0 0 0 0 0 0 0 0 0 0 0
No headroom allowed due to lack of industrial load. 0 0 0 0 0 0 0 0 0 0 0 0 0 0 0 0 0 0 0 0 0 0 0 0 0 0 0 0 0 0 0 0 0 0 0
Total Malahide WwTP 16,692 16,817 16,943 17,070 17,198 17,327 17,464 17,602 17,741 17,881 18,023 18,165 18,309 18,453 18,599 18,746 18,877 19,009 19,142 19,276 19,411 19,547 19,684 19,822 19,961 20,100 20,233 20,367 20,501 20,636 20,772 20,910 21,048 21,186 21,326
Malahide WwTP Growth Scenario 2 - High 2016 2017 2018 2019 2020 2021 2022 2023 2024 2025 2026 2027 2028 2029 2030 2031 2032 2033 2034 2035 2036 2037 2038 2039 2040 2041 2042 2043 2044 2045 2046 2047 2048 2049 2050
0.85% (2016 - 2021); 1.02% (2021 - 2031); 0.84% (2031 - 2041); 0.56% (2041 - 2050); PE Load 16,692 16,834 16,977 17,121 17,267 17,414 17,591 17,771 17,952 18,135 18,320 18,507 18,696 18,886 19,079 19,274 19,435 19,599 19,763 19,929 20,097 20,266 20,436 20,607 20,781 20,955 21,072 21,190 21,309 21,428 21,548 21,669 21,790 21,913 22,035
16% of Residential Population Commercial 0 0 0 0 0 0 0 0 0 0 0 0 0 0 0 0 0 0 0 0 0 0 0 0 0 0 0 0 0 0 0 0 0 0 0
No Industrial Load in Malahide Industrial 0 0 0 0 0 0 0 0 0 0 0 0 0 0 0 0 0 0 0 0 0 0 0 0 0 0 0 0 0 0 0 0 0 0 0
No headroom allowed due to lack of industrial load. 0 0 0 0 0 0 0 0 0 0 0 0 0 0 0 0 0 0 0 0 0 0 0 0 0 0 0 0 0 0 0 0 0 0 0
Total Malahide WwTP 16,692 16,834 16,977 17,121 17,267 17,414 17,591 17,771 17,952 18,135 18,320 18,507 18,696 18,886 19,079 19,274 19,435 19,599 19,763 19,929 20,097 20,266 20,436 20,607 20,781 20,955 21,072 21,190 21,309 21,428 21,548 21,669 21,790 21,913 22,035
Malahide WwTP Growth Scenario 3 - Most Likely 2016 2017 2018 2019 2020 2021 2022 2023 2024 2025 2026 2027 2028 2029 2030 2031 2032 2033 2034 2035 2036 2037 2038 2039 2040 2041 2042 2043 2044 2045 2046 2047 2048 2049 2050
0.96% (2016 - 2021); 1.09% (2021 - 2031); 0.84% (2031 - 2041); 0.81% (2041 - 2050); PE Load 16,692 16,852 17,014 17,177 17,342 17,509 17,700 17,893 18,088 18,285 18,484 18,685 18,889 19,095 19,303 19,514 19,677 19,843 20,009 20,178 20,347 20,518 20,690 20,864 21,039 21,216 21,388 21,561 21,736 21,912 22,089 22,268 22,449 22,631 22,814
16% of Residential Population Commercial 0 0 0 0 0 0 0 0 0 0 0 0 0 0 0 0 0 0 0 0 0 0 0 0 0 0 0 0 0 0 0 0 0 0 0
No Industrial Load in Malahide Industrial 0 0 0 0 0 0 0 0 0 0 0 0 0 0 0 0 0 0 0 0 0 0 0 0 0 0 0 0 0 0 0 0 0 0 0
No headroom allowed due to lack of industrial load. 0 0 0 0 0 0 0 0 0 0 0 0 0 0 0 0 0 0 0 0 0 0 0 0 0 0 0 0 0 0 0 0 0 0 0
Total Malahide WwTP 16,692 16,852 17,014 17,177 17,342 17,509 17,700 17,893 18,088 18,285 18,484 18,685 18,889 19,095 19,303 19,514 19,677 19,843 20,009 20,178 20,347 20,518 20,690 20,864 21,039 21,216 21,388 21,561 21,736 21,912 22,089 22,268 22,449 22,631 22,814
Malahide WwTP
Treatment Capacity
Growth Scenario 1 - Low
Growth Scenario 2 - High
Growth Scenario 3 - Most Likely
Note: Average Daily Loading to Malahide WwTP for 2015 (Jan - Nov) is reported by IW at 16,344 PE
Malahide WwTP - Load Transfers to Regional WwTP
Treatment Capacity Malahide WwTP
Growth Scenario 1 - Low
Growth Scenario 1 - High
Growth Scenario 2 - Most Likely
Sc.1 0% -16% -15% -14% -13% -13% -12% -11% -11% -10% -9% -9% -8% -8% -7% (10%-20% overcapacity is acceptable)
Sc.2 -15% -15% -14% -13% -12% -11% -10% -9% (10%-20% overcapacity is acceptable)
-15% -14% -13% -12% -11% -10% -9% -8% (10%-20% overcapacity is acceptable)
Year
12,000
14,000
Treatment Capacity
Growth Scenario 1 - Low
Growth Scenario 2 - High
Growth Scenario 3 - Most Likely
18,000
16,000
20,000
22,000
24,000
Load Projections for Malahide WwTP
Po
pu
lati
on
Eq
uiv
alen
t
20
16
20
18
20
20
20
22
20
24
20
26
20
28
20
30
20
32
20
34
20
36
20
38
20
40
20
42
20
44
20
46
20
48
20
50
2016 2017 2018 2019 2020 2021 2022 2023 2024 2025 2026 2027 2028 2029 2030 2031 2032 2033 2034 2035 2036 2037 2038 2039 2040 2041 2042 2043 2044 2045 2046 2047 2048 2049 2050
21,000 21,000 21,000 21,000 21,000 21,000 21,000 21,000 21,000 21,000 21,000 21,000 21,000 21,000 21,000 21,000 21,000 21,000 21,000 21,000 21,000 21,000 21,000 21,000 21,000 21,000 21,000 21,000 21,000 21,000 21,000 21,000 21,000 21,000 21,000
16,692 16,817 16,943 17,070 17,198 17,327 17,464 17,602 17,741 17,881 18,023 18,165 18,309 18,453 18,599 18,746 18,877 19,009 19,142 19,276 19,411 19,547 19,684 19,822 19,961 20,100 20,233 20,367 20,501 20,636 20,772 20,910 21,048 21,186 21,326
16,692 16,834 16,977 17,121 17,267 17,414 17,591 17,771 17,952 18,135 18,320 18,507 18,696 18,886 19,079 19,274 19,435 19,599 19,763 19,929 20,097 20,266 20,436 20,607 20,781 20,955 21,072 21,190 21,309 21,428 21,548 21,669 21,790 21,913 22,035
16,692 16,852 17,014 17,177 17,342 17,509 17,700 17,893 18,088 18,285 18,484 18,685 18,889 19,095 19,303 19,514 19,677 19,843 20,009 20,178 20,347 20,518 20,690 20,864 21,039 21,216 21,388 21,561 21,736 21,912 22,089 22,268 22,449 22,631 22,814
2016 2017 2018 2019 2020 2021 2022 2023 2024 2025 2026 2027 2028 2029 2030 2031 2032 2033 2034 2035 2036 2037 2038 2039 2040 2041 2042 2043 2044 2045 2046 2047 2048 2049 2050
21,000 21,000 21,000 21,000 21,000 21,000 21,000 21,000 21,000 21,000 21,000 21,000 21,000 21,000 21,000 21,000 21,000 21,000 21,000 21,000 21,000 21,000 21,000 21,000 21,000 21,000 21,000 21,000 21,000 21,000 21,000 21,000 21,000 21,000 21,000
-3,259 -3,119 -2,977 -2,835 -2,691 -2,547 -2,401 -2,254 -2,123 -1,991 -1,858 -1,724 -1,589 -1,453 -1,316 -1,178 -1,039 -900 -767 -633 -499 -364 -228 -90 48 186 326
-3,229 -3,048 -2,865 -2,680 -2,493 -2,304 -2,114 -1,921 -1,726 -1,565 -1,401 -1,237 -1,071 -903 -734 -564 -393 -219 -45 72 190 309 428 548 669 790 913 1,035
-3,300 -3,107 -2,912 -2,715 -2,516 -2,315 -2,111 -1,905 -1,697 -1,486 -1,323 -1,157 -991 -822 -653 -482 -310 -136 39 216 388 561 736 912 1,089 1,268 1,449 1,631 1,814

Appendix B. Drawings
32102902_01
Assessment of Domestic & Non-Domestic Load on
Proposed Regional WwTP
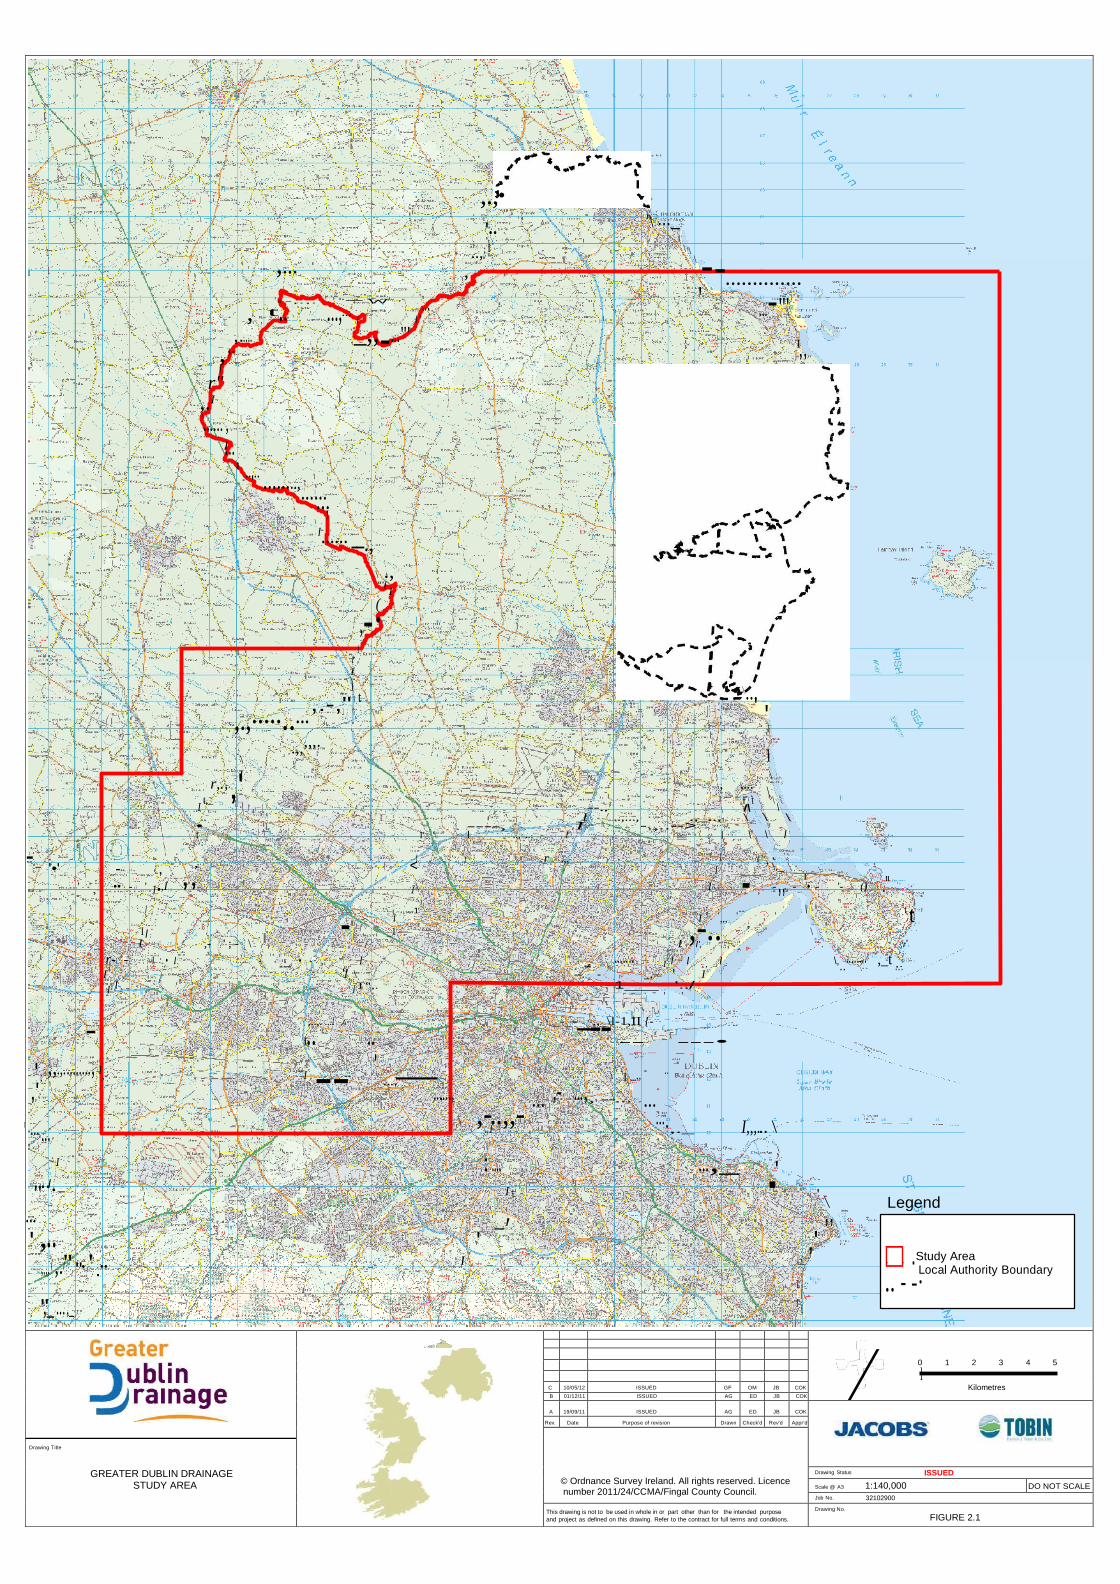
t
,.,•
'.. '\ ..._ '\ \ I \
,... ..,; '\
\ -- , ..............
, #
..-,.,.
...,-w ' , -
, t ...
I I,"' ... "'\
,.,..... _,,-..."' \
,,, I
I
r" ,.I
\...... ,
I... ' ..
'.. ........,.........
I
I...... _.,\
\ ., "'l
I
,-·(
j
r I \ J \ ...
,.,.......... ,.-," t
' '1
.,,,,,. I\ I
r,.,,'I
, ,... \
\I
I t,_
--.. II\
t \ \
.. I ..,..., .,_.., \ \ \ • ----, I -.,..--> t I' '\ I .., .., / I \ \ I
-..._ '•' - , ,,
, I ., .., .., ,1 .._r .,, I
I
- \\ •-
< ' \._
' ' , •• - ' 1•,I I \ I '' , , -- ,,- - '• - '-- () ." I
- .,...1
,-I
;
..;,,,
,-- ;
, \I t ,t.I I I _1 ' \ I ,- ' ; - \ / I I', ; ' ' . ,;r
rf- - I
' .,• I ----
• - ,,,
I _,.-- ._ "'"" I I, I , I \,
..""'-"' ,_t .,...
I - 1 \ --. - _, ' I
I I IT",. _ _ 1 .. , '.,./
- \ ,..,. ...I. ,A I. _-_- -.,_-\l-1,II {-
/ I.. .. \-- ---•
' ,,.,........., I,- --I ---- ' \ ' _., - .. ; ....
\I\
,' ...,....., ,- ... ,-, --\... \ ... ...
... ... \
'-' ,-
., .I .,,- ...
',._ I,,,... \
.. I : .... ...,_ .'
" I. I t '
\ Legend ... _, ,, ' ,.. ' ,' □" ".'...
I i Study Area ,,,, I ,.I I I I• • ■
Local Authority Boundary
\ I .. - -· ",_ ... ,_ \ I
I
/0 1 2 3 4 5
l Kilometres C 10/05/12 ISSUED GF OM JB COK
B 01/12/11 ISSUED AG ED JB COK
A 19/09/11 ISSUED AG ED JB COK
Rev. Date Purpose of revision Drawn Check'd Rev'd Appr'd
© Ordnance Survey Ireland. All rights reserved. Licence number 2011/24/CCMA/Fingal County Council.
Drawing Title
GREATER DUBLIN DRAINAGE STUDY AREA
Drawing Status ISSUED
Scale @ A3 1:140,000 DO NOT SCALE
Job No. 32102900
This drawing is not to be used in whole in or part other than for the intended purpose
and project as defined on this drawing. Refer to the contract for full terms and conditions.
Drawing No.
FIGURE 2.1
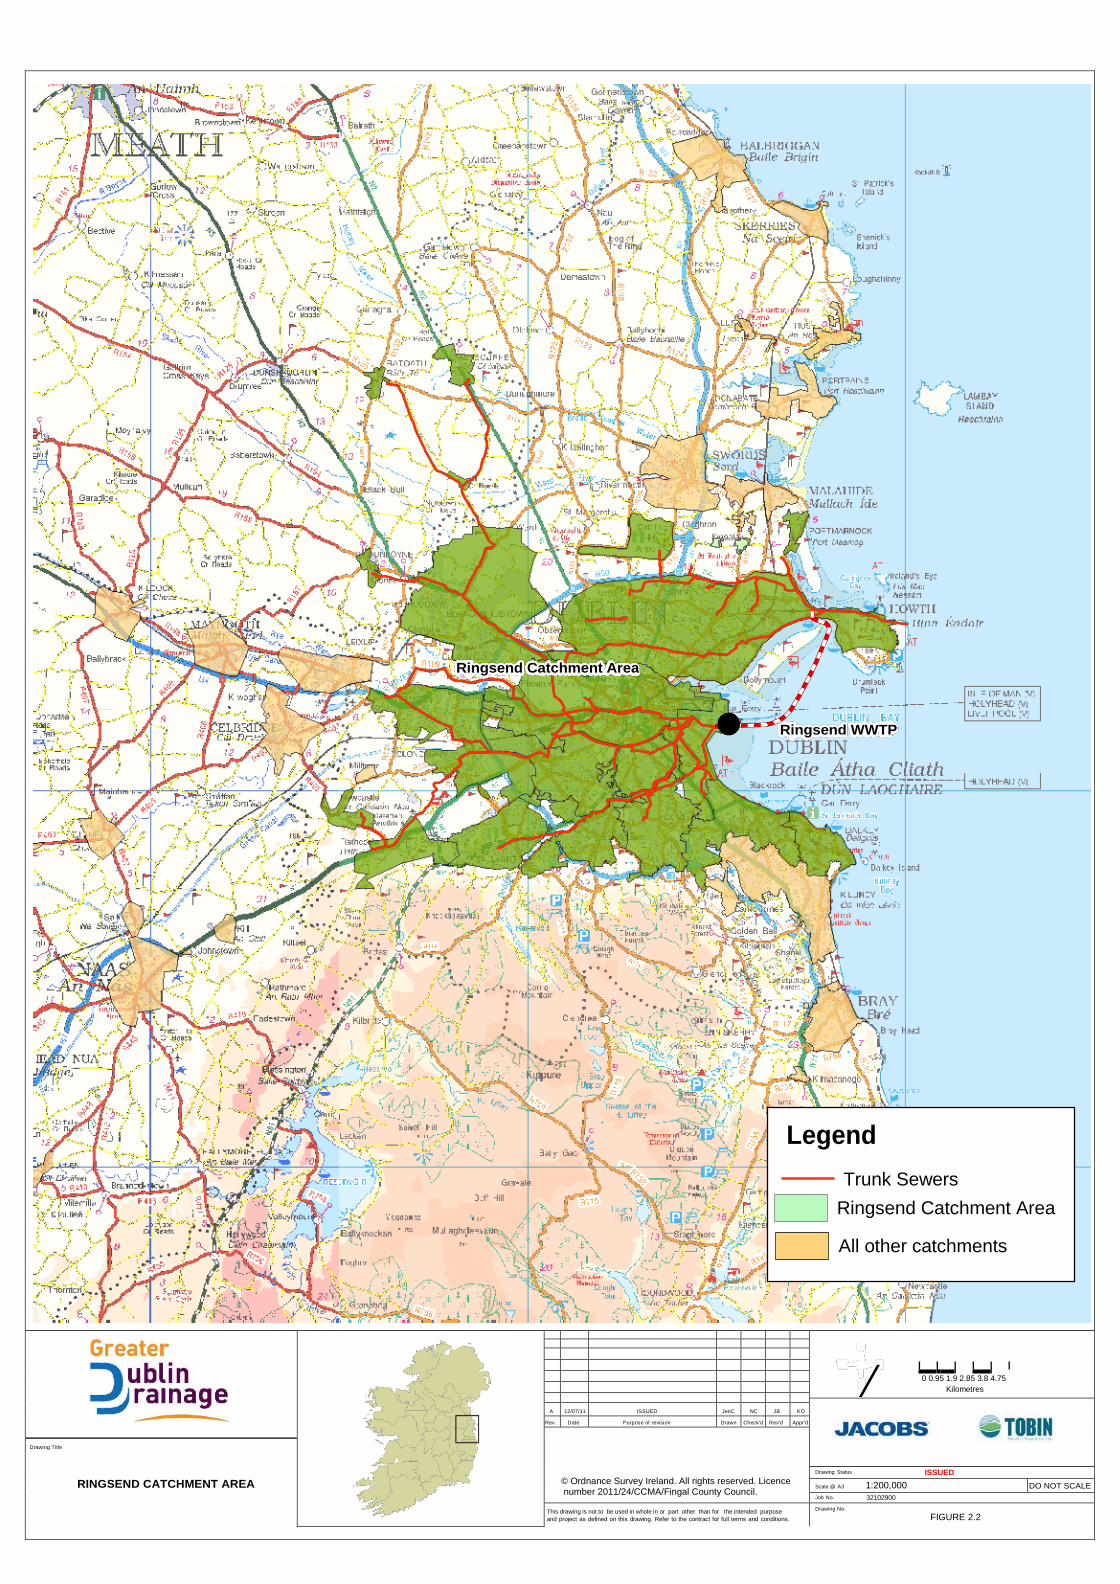
Ringsend Catchment Area
Ringsend WWTP
Legend
Trunk Sewers
Ringsend Catchment Area
All other catchments
/0 0.95 1.9 2.85 3.8 4.75
Kilometres
A 12/07/11 ISSUED JenC NC JB KO
Rev. Date Purpose of revision Drawn Check'd Rev'd Appr'd
© Ordnance Survey Ireland. All rights reserved. Licence number 2011/24/CCMA/Fingal County Council.
Drawing Title
RINGSEND CATCHMENT AREA
Drawing Status ISSUED
Scale @ A3 1:200,000 DO NOT SCALE
Job No. 32102900
This drawing is not to be used in whole in or part other than for the intended purpose
and project as defined on this drawing. Refer to the contract for full terms and conditions.
Drawing No.
FIGURE 2.2
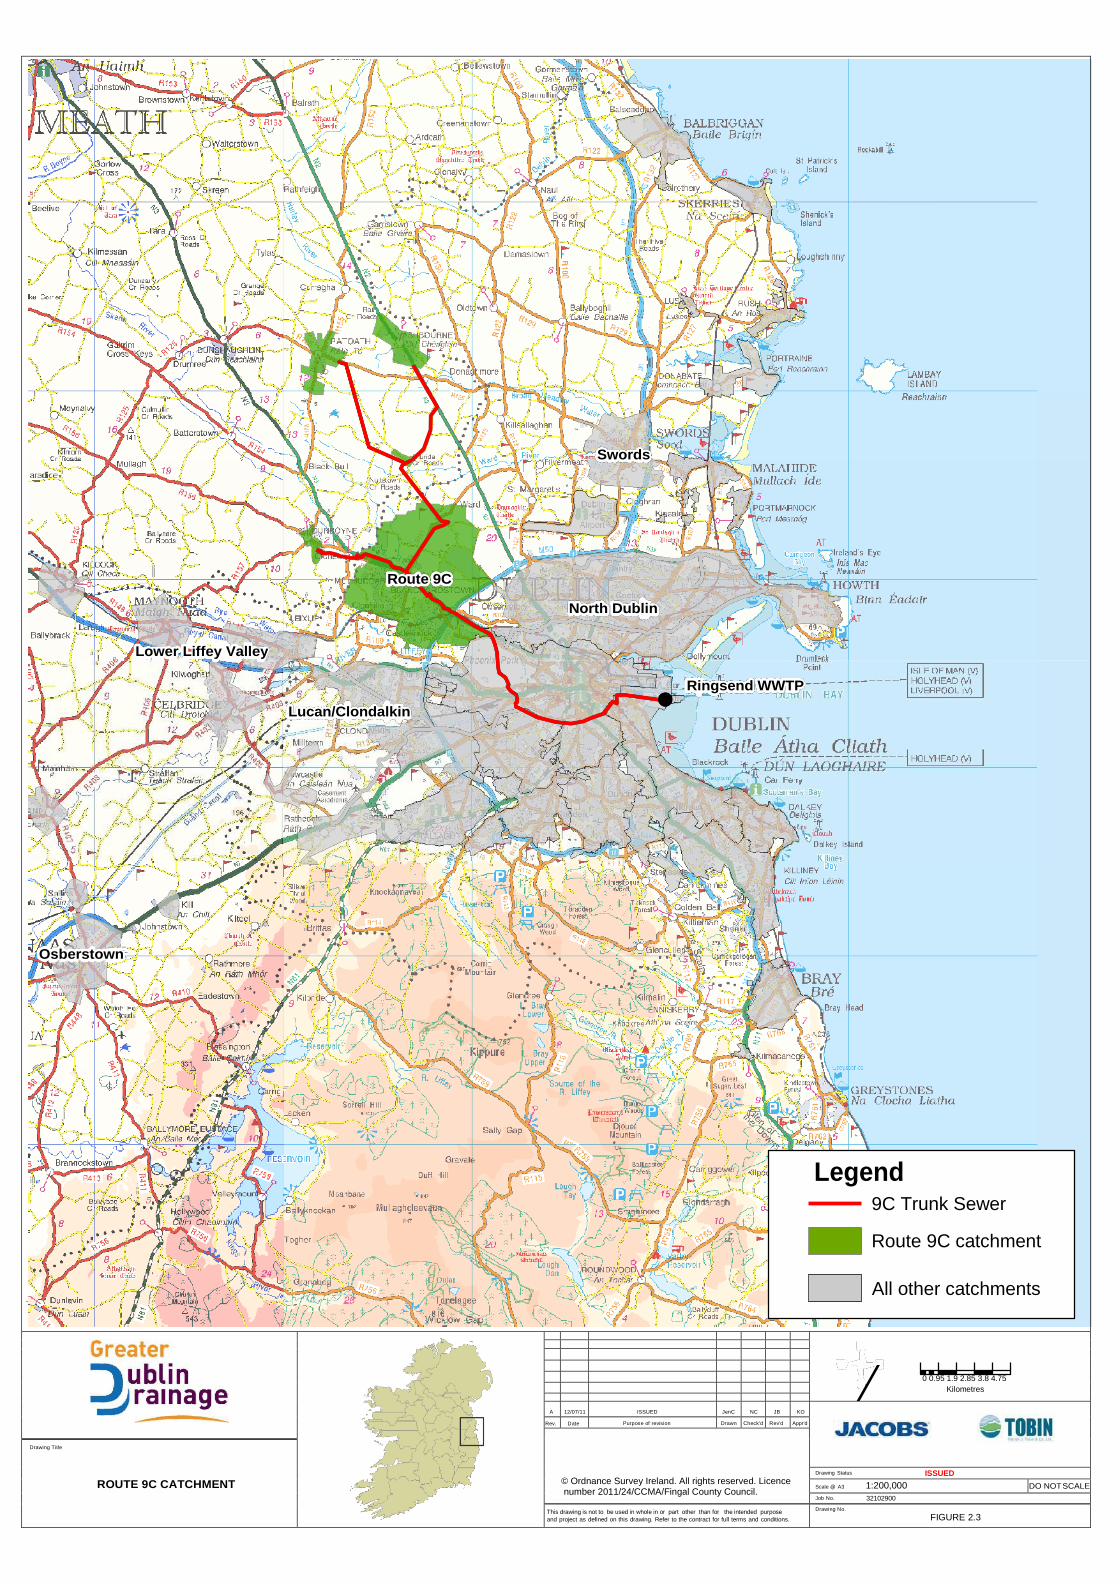
Swords
Route 9C
North Dublin
Lower Liffey Valley
Ringsend WWTP
Lucan/Clondalkin
Osberstown
Legend 9C Trunk Sewer
Route 9C catchment
All other catchments
/0 0.95 1.9 2.85 3.8 4.75
Kilometres
A 12/07/11 ISSUED JenC NC JB KO
Rev. Date Purpose of revision Drawn Check'd Rev'd Appr'd
© Ordnance Survey Ireland. All rights reserved. Licence number 2011/24/CCMA/Fingal County Council.
Drawing Title
ROUTE 9C CATCHMENT
Drawing Status ISSUED
Scale @ A3 1:200,000 DO NOT SCALE
Job No. 32102900
This drawing is not to be used in whole in or part other than for the intended purpose
and project as defined on this drawing. Refer to the contract for full terms and conditions.
Drawing No.
FIGURE 2.3
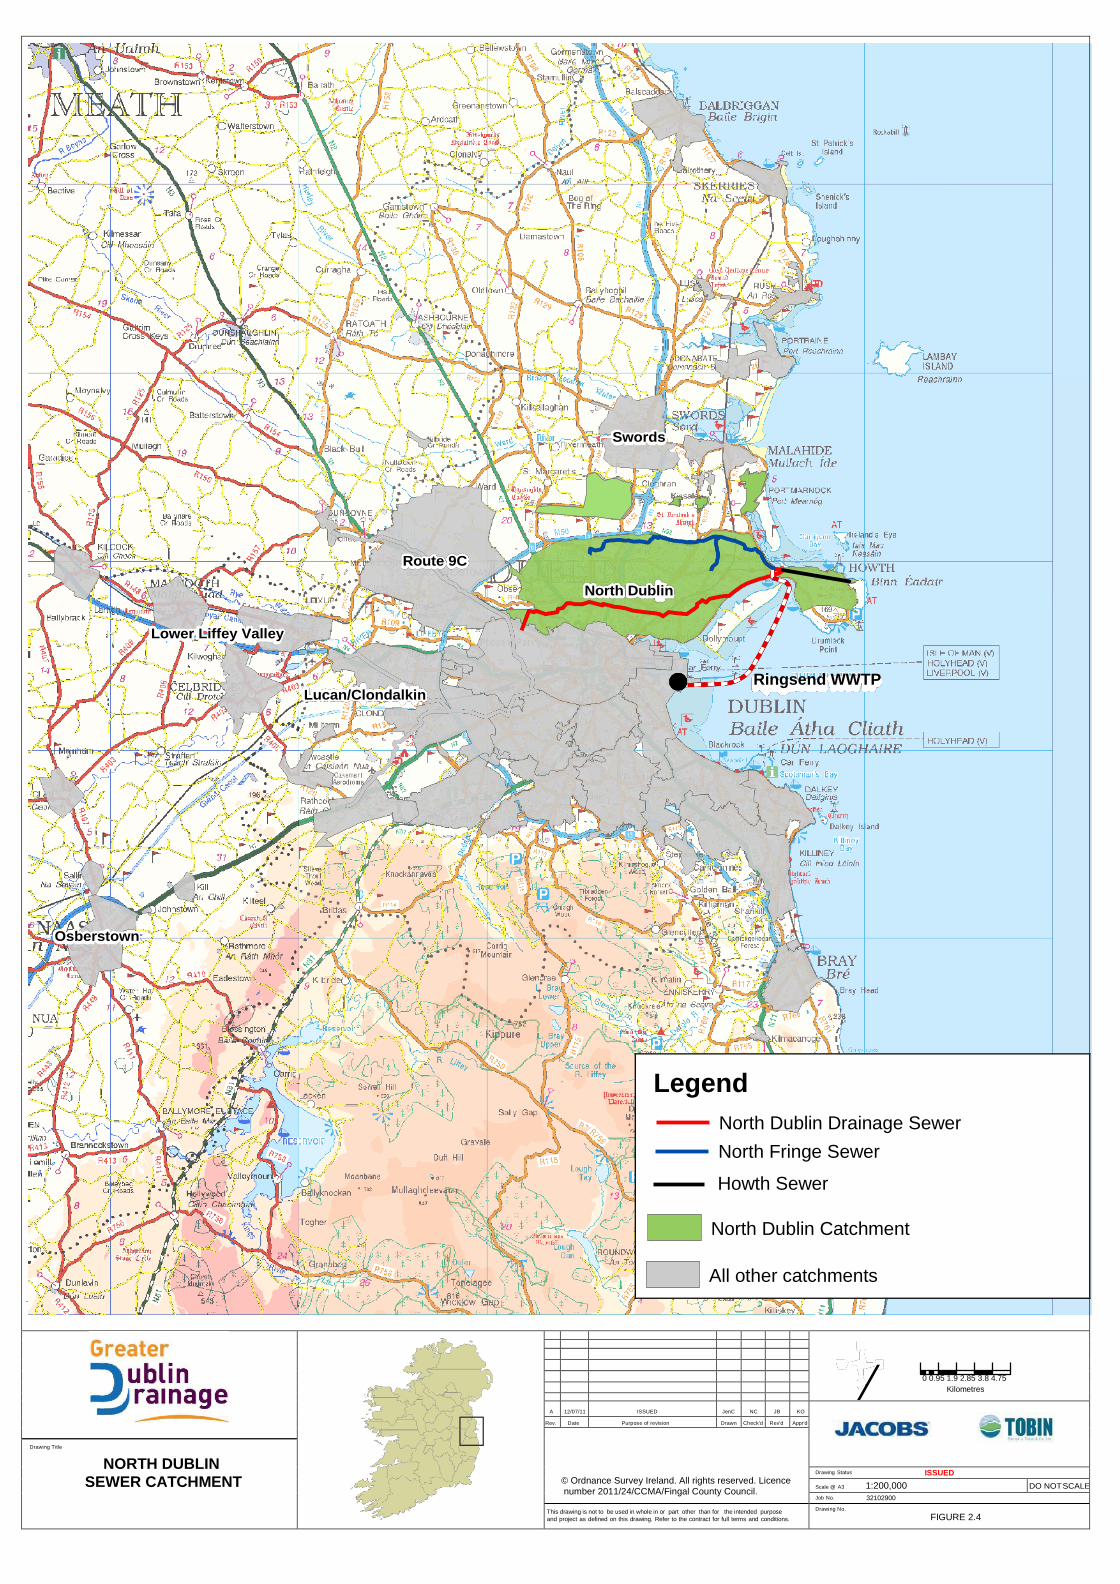
Swords
Route 9C
North Dublin
Lower Liffey Valley
Ringsend WWTP Lucan/Clondalkin
Osberstown
Legend
North Dublin Drainage Sewer
North Fringe Sewer
Howth Sewer
North Dublin Catchment
All other catchments
/ 0 0.95 1.9 2.85 3.8 4.75
Kilometres
A
12/07/11
ISSUED
JenC
NC
JB
KO
Rev. Date Purpose of revision Drawn Check'd Rev'd Appr'd
© Ordnance Survey Ireland. All rights reserved. Licence number 2011/24/CCMA/Fingal County Council.
Drawing Title
NORTH DUBLIN
SEWER CATCHMENT Drawing Status ISSUED
Scale @ A3 1:200,000 DO NOT SCALE
Job No. 32102900
This drawing is not to be used in whole in or part other than for the intended purpose
and project as defined on this drawing. Refer to the contract for full terms and conditions.
Drawing No.
FIGURE 2.4
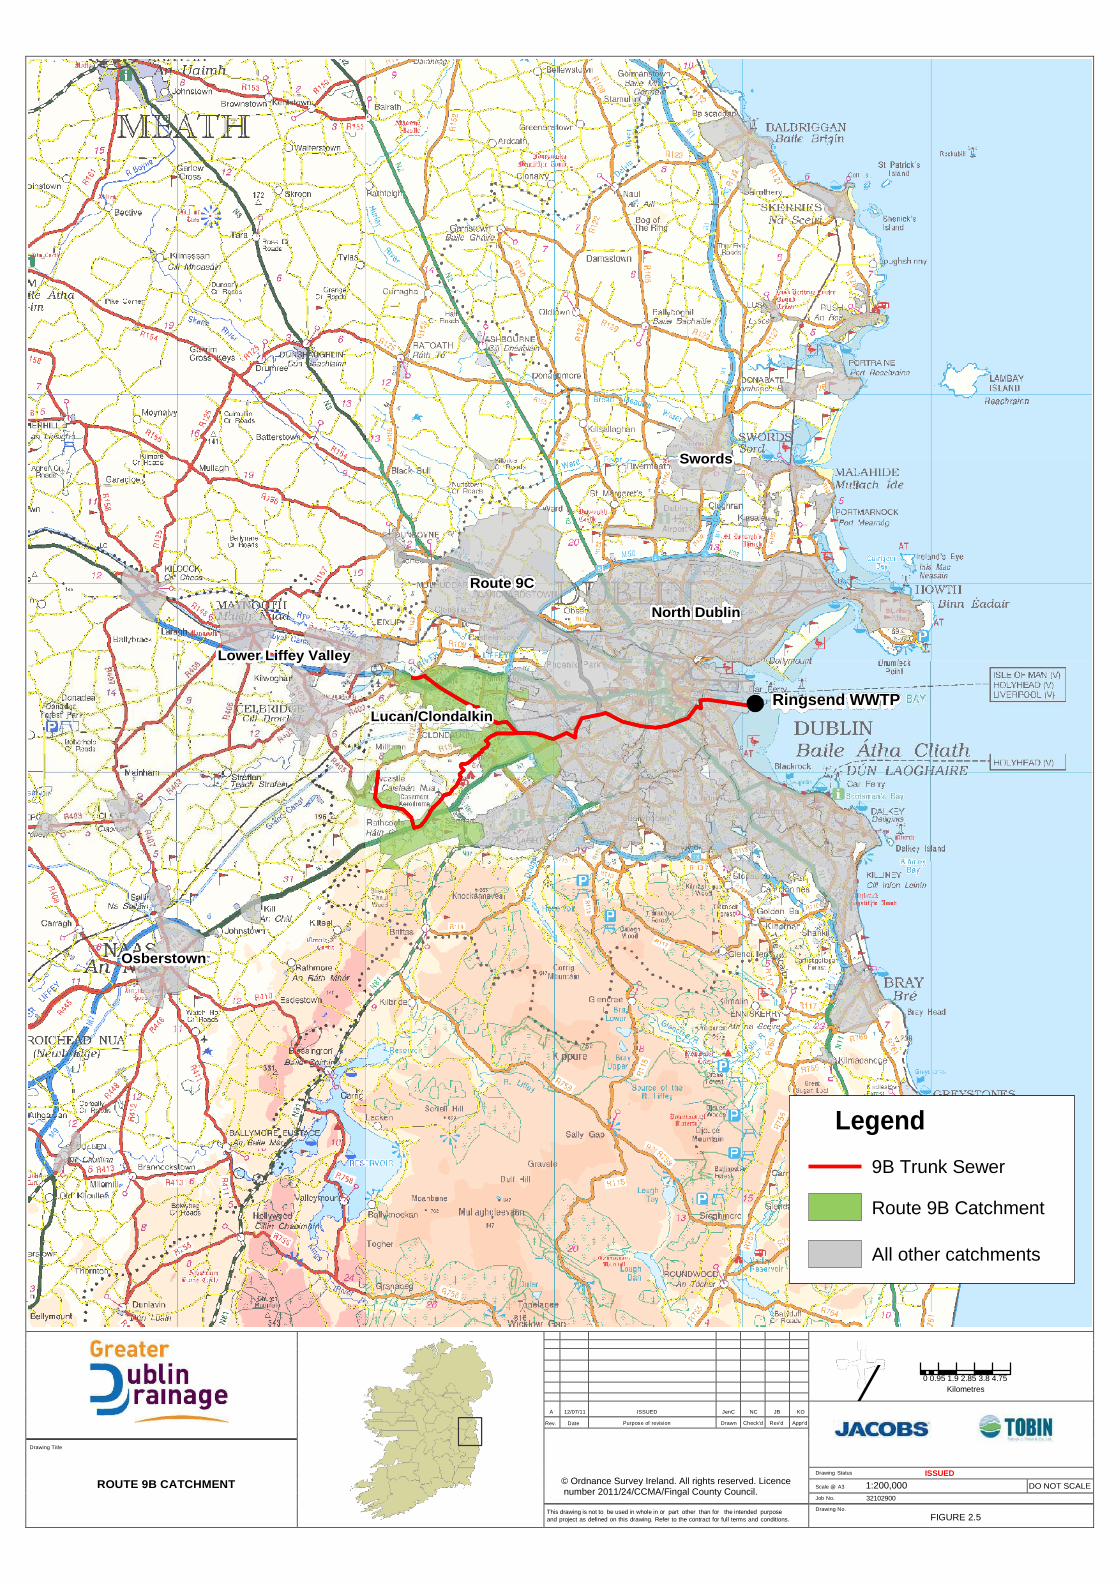
Swords
Route 9C
North Dublin
Lower Liffey Valley
Ringsend WWTP
Lucan/Clondalkin
Osberstown
Legend
9B Trunk Sewer
Route 9B Catchment
All other catchments
/ 0 0.95 1.9 2.85 3.8 4.75
Kilometres
A
12/07/11
ISSUED
JenC
NC
JB
KO
Rev. Date Purpose of revision Drawn Check'd Rev'd Appr'd
© Ordnance Survey Ireland. All rights reserved. Licence number 2011/24/CCMA/Fingal County Council.
Drawing Title
ROUTE 9B CATCHMENT
Drawing Status ISSUED
Scale @ A3 1:200,000 DO NOT SCALE
Job No. 32102900
This drawing is not to be used in whole in or part other than for the intended purpose
and project as defined on this drawing. Refer to the contract for full terms and conditions.
Drawing No.
FIGURE 2.5
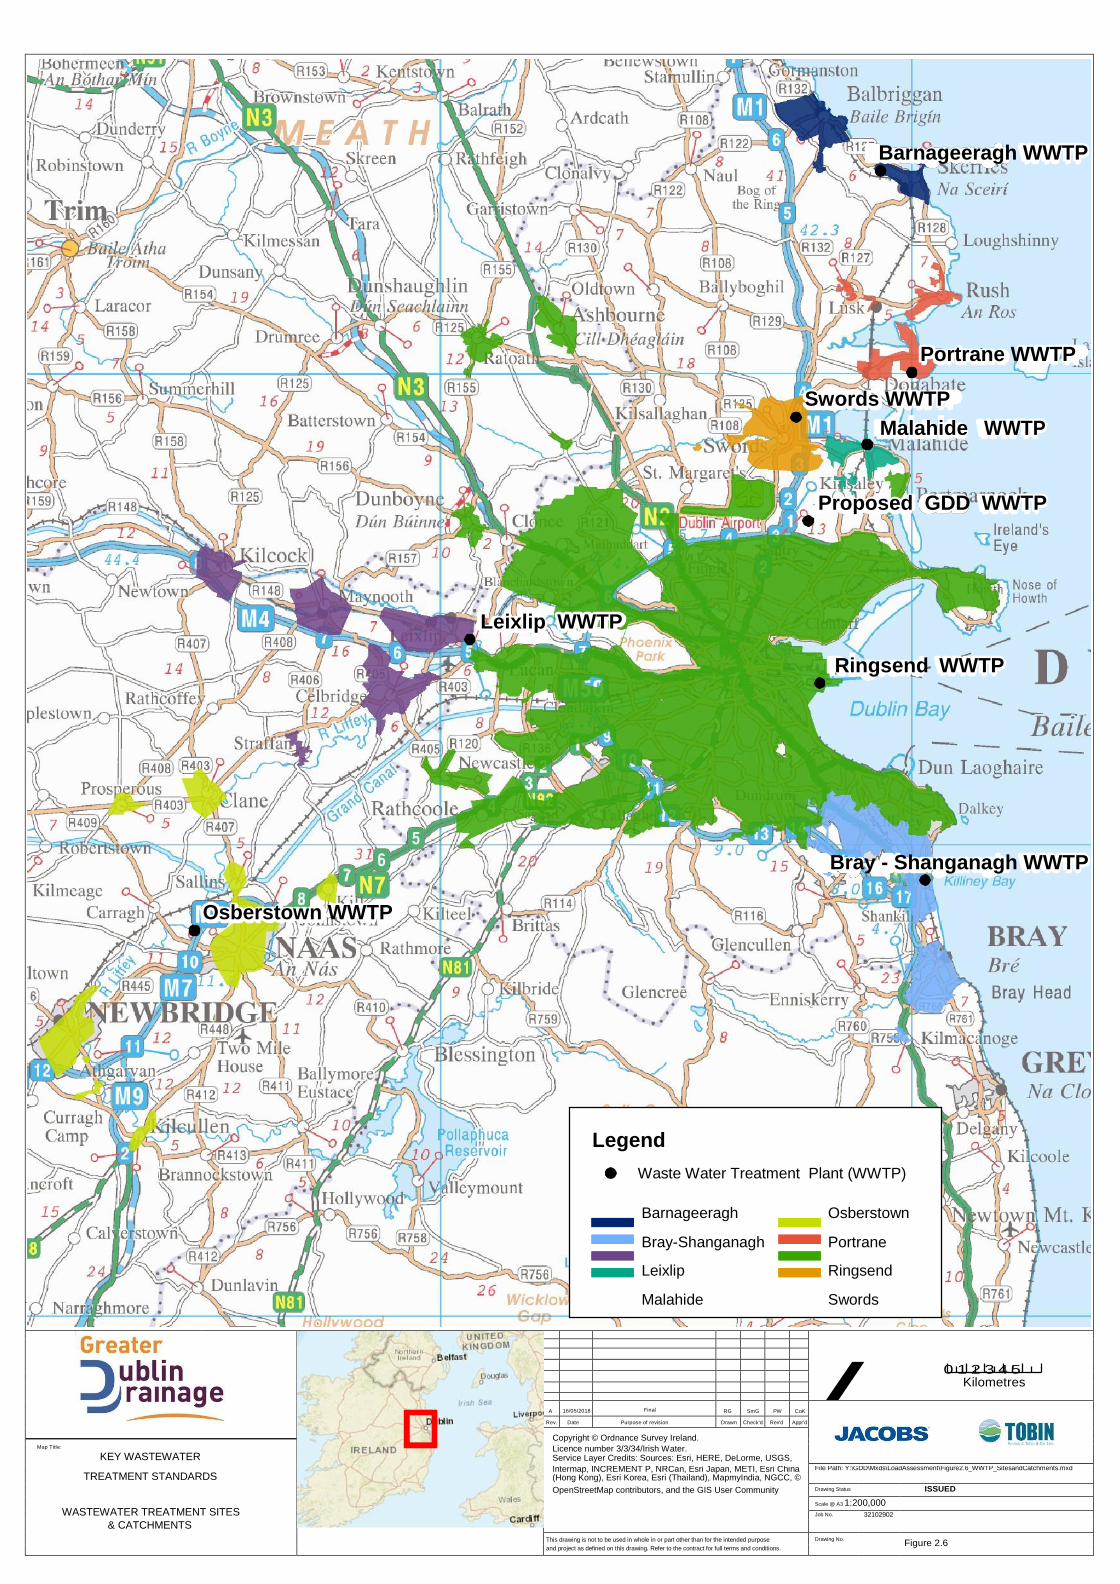
Osberstown WWTP
Barnageeragh WWTP
Portrane WWTP
Swords WWTP
Malahide WWTP
Proposed GDD WWTP
Leixlip WWTP
Ringsend WWTP
Bray - Shanganagh WWTP
Legend
Waste Water Treatment Plant (WWTP)
Barnageeragh Osberstown
Bray-Shanganagh Portrane
Leixlip Ringsend
Malahide Swords
/ 0 1 2 3 4 5
Kilometres
A
16/05/2018
Final
RG
SmG
PW
CoK
Rev. Date Purpose of revision Drawn Check'd Rev'd Appr'd
Copyright © Ordnance Survey Ireland.
Map Title:
KEY WASTEWATER Licence number 3/3/34/Irish Water.
Service Layer Credits: Sources: Esri, HERE, DeLorme, USGS,
TREATMENT STANDARDS Intermap, INCREMENT P, NRCan, Esri Japan, METI, Esri China (Hong Kong), Esri Korea, Esri (Thailand), MapmyIndia, NGCC, ©
File Path: Y:\GDD\Mxds\LoadAssessment\Figure2.6_WWTP_SitesandCatchments.mxd
Drawing Status ISSUED OpenStreetMap contributors, and the GIS User Community
WASTEWATER TREATMENT SITES Scale @ A3 1:200,000
Job No. 32102902
& CATCHMENTS
This drawing is not to be used in whole in or part other than for the intended purpose Drawing No.
Figure 2.6 and project as defined on this drawing. Refer to the contract for full terms and conditions.