Embed Size (px)
Citation preview

APPENDIX C
ENVIRONMENTAL JUSTICE AND COMMUNITY IMPACT REPORT


Leitchfield Small Urban Area Study Grayson County, Kentucky
Environmental Justice and
Community Impact Report
March 2009
Prepared By:
Lincoln Trail Area Development District
613 College Street Rd.
P.O. Box 604
Elizabethtown, KY 42702
(270) 769-2393

2
Table of Contents
1.0 Introduction.................................................................................................................. 3
2.0 What is Environmental Justice?................................................................................... 3
2.1 Definitions................................................................................................................ 4
3.0 Methodology ................................................................................................................ 4
4.0 Census Data Analysis .................................................................................................. 5
5.0 Study Findings ............................................................................................................. 5
6.0 Study Findings / Population by Persons of Minority Origin ....................................... 6
7.0 Study Findings / Population by Hispanic or Latino Origin ......................................... 6
8.0 Study Findings / Population by Persons 65 and Over ................................................. 7
9.0 Study Findings / Population by Persons Below the Poverty Level ............................. 8
10.0 Conclusion ................................................................................................................. 8
11.0 Study Area Maps........................................................................................................ 9
10.1 2000 Census Tracts and Block Groups ................................................................. 9
10.2 Population by Black or African American .......................................................... 10
10.3 Population by Hispanic or Latino Origin ............................................................ 11
10.4 Population by Persons 65 and Over .................................................................... 12
10.5 Population by Persons Below the Poverty Level ................................................ 13
Appendix A: Planning Study Contact List..................................................................... A-1
Appendix B: Methodology for Assessing Potential Environmental Justice Concerns for
KYTC Planning Studies.................................................................................................. B-1
Appendix C: Census Data Tables .................................................................................. C-1

3
1.0 Introduction
The following document is an assessment of the community demographics and economic
characteristics related to the defined project study area of the Leitchfield Small Urban
Area Study. This area is depicted in Map 10.1
The resources used to compile the data contained herein are the U.S. Census Bureau,
Kentucky State Data Center, local elected officials, community leaders, and field
observations of the study area. The information and results are intended to assist the
Kentucky Transportation Cabinet in making informed and prudent decisions in the study
area, particularly as it pertains to the requirements of Executive Order 128981, to ensure
equal environmental protection to all groups potentially impacted by both short and long-
term improvement strategies for the defined study area.
This report includes data tables comparing the populations of the census divisions
directly in and around the study area at the county, state, and national levels. Statistics
are provided for minority, elderly, and low-income populations for census tracts and
block groups. For ease of analysis, maps are included that highlight areas of interest at
the block group level.
2.0 What is Environmental Justice?
The U.S. EPA Office of Environmental Justice (EJ) defines EJ as:
“The fair treatment and meaningful involvement of all people regardless of race,
color, national origin, or income with respect to the development, implementation
and enforcement of environmental laws, regulations and policies. Fair treatment
means that no group of people, including racial, ethnic, or socio-economic group
should bear a disproportionate share of the negative environmental consequences
resulting from industrial, municipal, and commercial operations or the execution
of federal, state, local and tribal programs and policies.”
A disproportionately high and adverse effect on a minority or low-income population
means an adverse effect that:
1. is predominately borne by a minority population and/or low-income
population, or
2. will be suffered by the minority population and/or low-income population and
is appreciably more severe or greater in magnitude than the adverse effect that
1 Executive Order 12898 signed on February 11, 1994 states “…each Federal agency shall make achieving
environmental justice part of its mission by identifying and addressing, as appropriate, disproportionately high and
adverse human health or environmental effects of its programs, policies, and activities on minority populations and
low-income populations…”

4
will be suffered by the non-minority population and/or non-low-income
population.
2.1 Definitions
USDOT Order 5610.2 on EJ, issued in the April 15, 1997 Federal Register defines what
constitutes low-income and minority population.
• Low-Income is defined as a person whose median household income is at or
below the U.S. Department of Health and Human Services poverty guidelines.
• Minority is defined as a person who is: (1) Black (a person having origins in any
black racial groups of Africa); (2) Hispanic (a person of Mexican, Puerto Rican,
Cuban, Central or South American, or other Spanish culture or origin, regardless
of race); (3) Asian American (a person having origins in any of the original
peoples of the Far East, Southeast Asia, the Indian subcontinent, or the Pacific
Islands); or (4) American Indian and Alaskan Native (a person having origins in
any of the original people of North America and who maintains cultural
identification through tribal affiliation or community recognition).
• Low-Income Population is defined as any readily identifiable group of low-
income persons who live in geographic proximity, and if circumstances warrant
geographically dispersed/transient persons who will be similarly affected by a
proposed DOT program, policy or activity.
• Minority Population is defined as any readily identifiable group of minority
persons who live in geographic proximity, and if circumstances warrant,
geographically dispersed/transient persons who will be similarly affected by a
proposed DOT program, policy or activity.
EO12898 and USDOT Order 5610.2 do not address consideration of the elderly
population. However, the U.S. DOT encourages the study of these populations in EJ
discussions and in accordance with EJ, Title VI of the Civil Rights Act of 1964 and the
Kentucky Transportation Cabinet’s advocacy of inclusive public involvement and equal
treatment of all persons this study includes statistics for persons age 65 and over that are
within the study and comparison areas.
3.0 Methodology
For this study, data was collected by using the method outlined by the Kentucky
Transportation Cabinet document, “ Methodology for Assessing Potential Environmental
Justice Concerns for KYTC Planning Studies.” (See Appendix B.)
The primary sources of data used in the compilation of this report were the U.S. Census
Bureau’s 2000 Census, Kentucky State Data Center, local elected officials, community
leaders, and field observations. Statistics were compiled to present a detailed analysis of
the community conditions for the project study area.

5
4.0 Census Data Analysis
The U.S. Census Bureau defines geographical units as:
• Census Tract (CT) – A small, relatively, permanent statistical subdivision of a
county or statistically equivalent entity delineated for data presentation purposes
by a local group of census data users or the geographic staff of a regional census
center in accordance with Census Bureau guidelines. CTs generally contain
between 1,000 and 8,000 people. CT boundaries are delineated with the intention
of being stable over many decades, so they generally follow relatively permanent
visible features. They may also follow governmental unit boundaries and other
invisible features in some instances; the boundary of a state or county is always a
census tract boundary.
• Block Group (BG) – A statistical subdivision of a CT. A BG consists of all
tabulation blocks whose numbers begin with the same digit in a CT. BGs
generally contain between 300 and 3,000 people, with an optimum size of 1,500
people.
• Census Block (CB) – An area bounded on all sides by visible and/or invisible
features shown on a map prepared by the Census Bureau. A CB is the smallest
geographic entity for which the Census Bureau tabulates decennial census data.
The census data tables include percentages for minority, Hispanic, elderly, and low-
income populations in the United States, Kentucky, Grayson County, Census Tracts, and
Block Groups Blocks located in and around the study area.
5.0 Study Findings
This Environmental Justice and Community Impact Report is to be used as a component
of a programming study currently being conducted by the Kentucky Transportation
Cabinet Division of Planning for the identification of short and long-term improvement
strategies for the defined small urban area of Leitchfield. This study is intended to help
define the location and purpose of these projects and meet federal requirements regarding
consideration of environmental issues as defined in the National Environmental Policy
Act (NEPA).
According to the 2000 Census, there are four (4) Census Tracts and eleven (11) Block
Groups included in the defined study area. These are listed below. If all of the Block
Groups within the Census Tract were not included in the study area, the total Census
Tract population was not given. See Map 10.1 for geographic location.
Grayson County Total Population 24,053
Study Area Total Populations 12,784
Census Tract 9502

6
Block Group 1 1,346
Block Group 2 853
Census Tract 9503 3,744
Block Group 1 1,274
Block Group 2 921
Block Group 3 1,549
Census Tract 9504 6,081
Block Group 1 1,316
Block Group 2 1,486
Block Group 3 1,377
Block Group 4 1,239
Block Group 5 663
Census Tract 9505
Block Group 1 760
6.0 Study Findings / Population by Persons of Minority Origin
As described in the Census Data Table, the White Alone population percentage for the
United States was 75.10%. The population percentage for the state of Kentucky was
90.04%. The population percentage for Grayson County was 98.48%.
There are only two census tracts with a White Alone population percentage below the
County percentage. These are CT 9503 with 96.26% and CT 9504 with 98.04%.
However, within these two Census Tracts there are several block groups with a minority
population percentage above 1.00%.
Within CT 9503 Block Group 2, the percentage of the Some Other Race Alone
population was 2.17% and the Two or More Races population percentage was 2.61%.
Within CT 9503 Block Group 3, the percentage of Black or African American Alone
population was 5.81%.
Within CT 9504 Block Group 1, the percentage of Black or African American Alone
population was 1.29%. Within CT 9504 Block Group 5, the percentage of the same
population was 11.76%.
Map 10.2 displays the Black and African American Alone populations geographically.
7.0 Study Findings / Population by Persons of Hispanic or
Latino Origin
Persons of Hispanic or Latino Origin may be of any race. As described in the Census
Data Table, the Hispanic or Latino Origin population percentage for the United States

7
was 12.52%. The population percentage for the state of Kentucky was 1.40%. The
population percentage for Grayson County was 0.84%.
There are only two census tracts with a Hispanic or Latino Origin population percentage
above the County percentage. These are CT 9502 with 1.08% and CT 9505 with 1.12%.
However, within the study are there are several block groups with a Hispanic or Latino
Origin population percentage above the County level.
Within CT 9502 Block Group 1, the percentage of Hispanic or Latino Origin population
was 1.34%. Within Block Group 2, the percentage was 1.76%.
Within CT 9503 Block Group 2, percentage of Hispanic or Latino Origin population was
1.52%.
Within CT 9504 Block Group 2, the percentage of Hispanic or Latino Origin population
was 1.62%. Within Block Group 3, the percentage was 1.89%.
Within CT 9505 Block Group 2, the percentage of Hispanic or Latino Origin population
was 1.58%.
Map 10.3 displays the Hispanic or Latino Origin populations geographically.
8.0 Study Findings / Population by Persons 65 and Over
As described in the Census Data Table, the Persons 65 and Over population percentage
for the United States was 12.43%. The population percentage for the state of Kentucky
was 12.46%. The population percentage for Grayson County was 13.97%.
There is only one census tract with a Persons 65 and Over population percentage above
the County percentage. This was CT 9503 with 14.96%. However, there are several
block groups within the study area with population percentages above the County level.
Within CT 9502 Block Group 2, the population percentage of Persons 65 and Over was
16.30%. Within Block Group 3, the population percentage was 14.72%.
Within CT 9503 Block Group 3, the population percentage of Persons 65 and Over was
19.75%.
Within CT 9504 Block Group 2, the population percentage of Persons 65 and Over was
23.82%. Within Block Group 5, the population percentage was 17.65%.
Map 10.4 displays the Persons 65 and Over populations geographically.

8
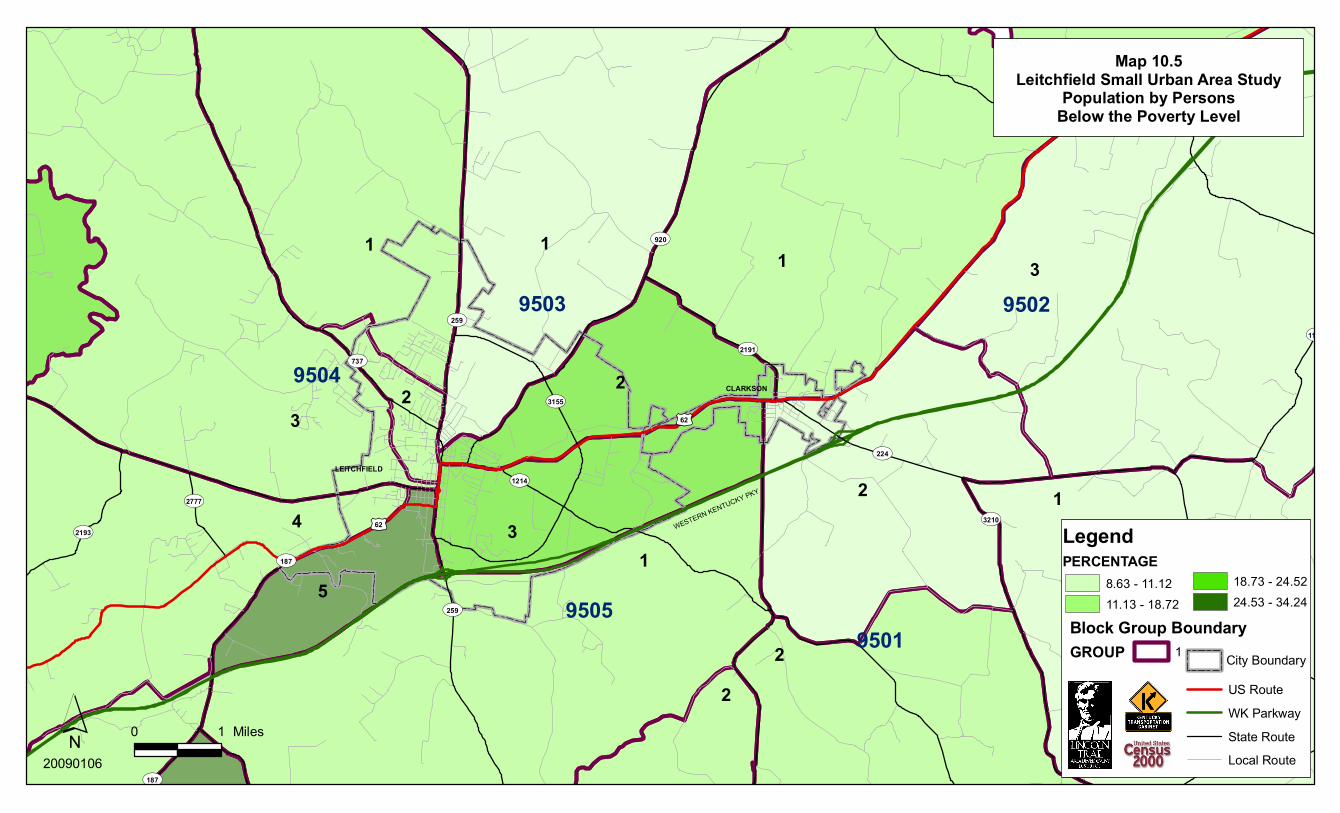
9.0 Study Findings / Population by Persons Below the Poverty
Level
As described in the Census Data Table, the Persons Below the Poverty Level for the
United States was 12.05%. The population percentage for the state of Kentucky was
15.37%. The population percentage for Grayson County was 17.74%.
There are only two census tracts with a Persons Below the Poverty Level population
percentage above the County percentage. This was CT 9504 with 18.50% and CT 9505
with 18.21%. However, there are several block groups within the study area with
population percentages above the County level.
Within CT 9503 Block Group 2, the population percentage of Persons Below the Poverty
Level was 20.09%. Within Block Group 3, the population percentage was 19.50%.
Within CT 9504 Block Group 5, the population percentage of Persons Below the Poverty
Level was 34.24%.
Within CT 9505 Block Group 2, the population percentage of Persons Below the Poverty
Level was 18.72%.
Map 10.5 displays the Persons Below the Poverty Level populations geographically.
10.0 Conclusion
After an analysis of the Leitchfield SUA study area, there are several block groups that
will require further evaluation in the development of a transportation improvement
project with regard to race, age, and income level. The block groups with relatively high
percentages have been described below and in detail in the Study Findings sections of this
report.
The total population of Persons of Minority Origin in Grayson County was calculated as
365 or 1.52%. The Black or African American Alone population made up 56.7% of the
minority population. There were two concentrations of Black or African American
Alone population in the study area. This was CT 9503 Block Group 3 (5.81%) and CT
9504 Block Group 5 (11.76%). These populations would need to be taken into
consideration when developing a project.
The total population percentage of Persons of Hispanic or Latino Origin was 0.84%.
There were several concentrations of this population in the study area. The highest
percentages were found in CT 9502 Block Group 2 (1.76%); CT 9504 Block Group 2
(1.62%) and CT 9504 Block Group 3 (1.89%). These populations would need to be taken
into consideration when developing a project.

9
The population percentage of Persons 65 and Over in Grayson County was 13.97%. This
population seems to be dispersed throughout the study area. However, as shown in Map
10.4, there are three block groups that may require further evaluation in the development
of a project. These are CT 9503 Block Group 3 (19.75%); CT 9504 Block Group 2
(23.82%) and CT 9504 Block Group 5 (17.65%)
The population percentage of Persons Below the Poverty Level in Grayson County was
17.74%. The population seems to be well dispersed throughout the study area. However,
as shown in Map 10.5, there are three block groups that may require further evaluation in
the development of a project. These are CT 9503 Block Group 2 (20.09%); CT 9503
Block Group 3 (19.50%) and CT 9504 Block Group5 (34.24%).
The LTADD staff will work with the KYTC to continue to monitor the locations
indicated above as well as the surrounding study area for demographic and/or
socioeconomic changes that may occur throughout the development of the project.

A-1
Appendix A: Planning
Study Contact List
Planning Study Contact List
Honorable Gary Logsdon
Grayson Co. Judge/Executive
10 Court Square
Leitchfield, KY 42754
270-259-3159
Mr. Roger Tomes
Grayson Co. PVA
10 Court Square
Leitchfield, KY 42754
270-259-4838
Mr. Steve Mahurin
Grayson Co. Road Supervisor
655 W. White Oak Street
Leitchfield, KY 42755
270-259-3093
Mr. Randall Smith, Director
Grayson Co. Emergency Management
104 W Main Street
Leitchfield, KY 42754
270-259-0096
Sheriff Rick Clemons
Grayson Co. Sheriff Department
44 Public Square
Leitchfield, KY 42754
270-259-3024
Mr. Barry Anderson, Superintendent
Grayson County Schools
909 Brandenburg Rd
P.O. Box 4009
Leitchfield, KY 42754
270-259-4011
Honorable William H. Thomason
Mayor of Leitchfield
314 W. White Oak Street
P.O. Box 398
Leitchfield, KY 42755-0398
270-259-4034
Chief Bart Glenn
Leitchfield Police Department
314 W. White Oak Street
P.O. Box 398
Leitchfield, KY 42755
270-259-3850
Chief Carl Smith
Leitchfield Fire Department
314 W. White Oak Street
P.O. Box 398
Leitchfield, KY 42755
270-259-4871
Ms. Sue Vincent
Lincoln Trail Health Department
124 E. White Oak Street
Leitchfield, KY 42754
270-259-6026
Mr. Darrell Harrell, Director
Public Works
314 W. White Oak Street
P.O. Box 398
Leitchfield, KY 42755
270-259-4034
Mr. Keith Jones
Leitchfield Planning and Zoning
314 W. White Oak Street
P.O. Box 398
Leitchfield, KY 42755
270-259-4034
Honorable Bonnie Henderson
106 Spring Street
P.O. Box 10
Clarkson, KY 42726
270-242-6997
Chief Andy Cain
Clarkson Fire Department

A-2
P.O. Box 15
Clarkson, KY 42726
270-230-3245
Chief Dan Petterson
Clarkson Police Department
106 Spring Street
Clarkson, KY 42726
270-242-6997

B-1
Methodology for Assessing Potential Environmental Justice Concerns for
KYTC Planning Studies
Updated: February 1, 2002
The demographics of the affected area should be defined using U.S. Census data (Census
tracts and block groups) and the percentages for minorities, low-income, elderly, or disabled
populations should be compared to those for the following:
• Other nearby Census tracts and block groups,
• The county as a whole,
• The entire state, and
• The United States.
Information from PVA offices, social service agencies, local health organizations, local
public agencies, and community action agencies can be used to supplement the Census data.
Specifically, we are interested in obtaining the following information:
• Identification of community leaders or other contacts who may be able to represent
these population groups and through which coordination efforts can be made.
• Comparison of the Census tracts and block groups encompassing the project area to
other nearby Census tracts and block groups, county, state, and United States
percentages.
• Locations of specific or identified minority, low-income, elderly, or disabled
population groups within or near the project area. This may require some field
reviews and/or discussions with knowledgeable persons to identify locations of public
housing, minority communities, ethnic communities, etc., to verify Census data or
identify changes that may have occurred since the last Census. Examples would be
changes due to new residential developments in the area or increases in Asian and/or
Hispanic populations.
• Concentrations or communities that share a common religious, cultural, ethnic, or
other background, e.g., Amish communities.
• Communities or neighborhoods that exhibit a high degree of community cohesion or
interaction and the ability to mobilize community actions at the start of community
involvement.
• Concentrations of common employment, religious centers, and/or educational
institutions with members within walking distance of facilities.
• Potential effects, both positive and negative, of the project on the affected groups as
compared to the non-target groups. This may include, but are not limited to:
1. Access to services, employment or transportation.
2. Displacement of persons, businesses, farms, or non-profit organizations.
3. Disruption of community cohesion or vitality.
4. Effects to human health and/or safety.
• Possible methods to minimize or avoid impacts on the target population groups.

B-2
Methodology for Assessing Potential Environmental Justice Concerns
for KYTC Planning Studies
Page 2
If percentages of these populations are elevated within the project area, it should be
brought to the attention of the Division of Planning immediately so that coordination with
affected populations may be conducted to determine the affected population’s concerns and
comments on the project. Also, with this effort, representatives of minority, elderly, low-
income, or disabled populations should be identified so that, together, we can build a partnership
for the region that may be incorporated into other projects. Also, we hope to build a
Commonwealth-wide database of contacts. We are available to participate in any meetings with
these affected populations or with their community leaders or representatives.
In identifying communities, agencies may consider as a community either a group of
individuals living in geographic proximity to one another, or a geographically dispersed/transient
set of individuals (such as migrant workers or Native Americans), where either type of group
experiences common conditions of environmental exposure or effect. The selection of the
appropriate unit of analysis may be a governing body’s jurisdiction, a neighborhood, census
tract, or other similar unit that is to be chosen so as not to artificially dilute or inflate the affected
population. A target population also exists if there is (1) more than one minority or other group
present and (2) the percentages, as calculated by aggregating all minority persons, exceed that of
the general population or other appropriate unit of geographic analysis.
Maps should be included that show the Census tracts and block groups included in the
analysis as well as the relation of the project area to those Census tracts and block groups.

C-1
Total White AloneWhite Alone
(%)
Black or
African
American
alone
Black or
African
American
alone (%)
American
Indian and
Alaska Native
alone
American
Indian and
Alaska Native
alone (%)
Asian alone
Asian
alone
(%)
Native
Hawaiian
and other
Pacific
Islander
alone
Native
Hawaiian
and other
Pacific
Islander
alone (%)
United States 281,421,906 211,353,725 75.10% 34,361,740 12.21% 2,447,989 0.87% 10,171,820 3.61% 378,782 0.13%
Kentucky 4,041,769 3,639,168 90.04% 293,915 7.27% 9,080 0.22% 28,994 0.72% 1,155 0.03%
Grayson Co. 24,053 23,688 98.48% 207 0.86% 15 0.06% 9 0.04% - 0.00%
Tract 9501 2,593 2593 100.00% 0 0.00% 0 0.00% 0 0.00% 0 0.00%
Block Group 1 934 934 100.00% 0 0.00% 0 0.00% 0 0.00% 0 0.00%
Block Group 2 778 778 100.00% 0 0.00% 0 0.00% 0 0.00% 0 0.00%
Block Group 3 881 881 100.00% 0 0.00% 0 0.00% 0 0.00% 0 0.00%
Tract 9502 3,055 3030 99.18% 0 0.00% 0 0.00% 5 0.16% 0 0.00%
Block Group 1 1,346 1327 98.59% 0 0.00% 0 0.00% 5 0.37% 0 0.00%
Block Group 2 853 851 99.77% 0 0.00% 0 0.00% 0 0.00% 0 0.00%
Block Group 3 856 852 99.53% 0 0.00% 0 0.00% 0 0.00% 0 0.00%
Tract 9503 3,744 3604 96.26% 90 2.40% 6 0.16% 0 0.00% 0 0.00%
Block Group 1 1,274 1274 100.00% 0 0.00% 0 0.00% 0 0.00% 0 0.00%
Block Group 2 921 871 94.57% 0 0.00% 6 0.65% 0 0.00% 0 0.00%
Block Group 3 1,549 1459 94.19% 90 5.81% 0 0.00% 0 0.00% 0 0.00%
Tract 9504 6,081 5962 98.04% 113 1.86% 0 0.00% 0 0.00% 0 0.00%
Block Group 1 1,316 1299 98.71% 17 1.29% 0 0.00% 0 0.00% 0 0.00%
Block Group 2 1,486 1478 99.46% 8 0.54% 0 0.00% 0 0.00% 0 0.00%
Block Group 3 1,377 1367 99.27% 10 0.73% 0 0.00% 0 0.00% 0 0.00%
Block Group 4 1,239 1233 99.52% 0 0.00% 0 0.00% 0 0.00% 0 0.00%
Block Group 5 663 585 88.24% 78 11.76% 0 0.00% 0 0.00% 0 0.00%
Tract 9505 2,592 2571 99.19% 0 0.00% 0 0.00% 4 0.15% 0 0.00%
Block Group 1 760 760 100.00% 0 0.00% 0 0.00% 0 0.00% 0 0.00%
Block Group 2 1,832 1811 98.85% 0 0.00% 0 0.00% 4 0.22% 0 0.00%
Source: US Census Bureau, 2000 Census
Summary File 3 (SF3)
Detailed Tables: P.6-Race, P.7-Hispanic or Latino by Race, P.8-Sex by Age, P.87-Poverty Status in 1999 by Age

C-2
Some other
race alone
Some other
race alone
(%)
Two or more
races
Two or more
races (%)
Hispanic or
Latino Origin
Hispanic or
Latino Origin
(%)
Persons 65
and Over
Persons 65
and Over
(%)
Persons
Below
Poverty
Level
Persons Below
Poverty Level
(%)
United States 15,436,924 5.49% 7,270,926 2.58% 35,238,481 12.52% 34,978,972 12.43% 33,899,812 12.05%
Kentucky 22,116 0.55% 47,341 1.17% 56,414 1.40% 503,668 12.46% 621,096 15.37%
Grayson Co. 37 0.15% 97 0.40% 202 0.84% 3,360 13.97% 4,267 17.74%
Tract 9501 0 0.00% 0 0.00% 46 1.77% 447 17.24% 332 12.80%
Block Group 1 0 0.00% 0 0.00% 16 1.71% 172 18.42% 93 9.96%
Block Group 2 0 0.00% 0 0.00% 9 0.96% 92 11.83% 141 15.10%
Block Group 3 0 0.00% 0 0.00% 21 2.38% 183 20.77% 98 11.12%
Tract 9502 6 0.20% 14 0.46% 33 1.08% 419 13.72% 390 12.77%
Block Group 1 6 0.45% 8 0.59% 18 1.34% 154 11.44% 222 16.49%
Block Group 2 0 0.00% 2 0.23% 15 1.76% 139 16.30% 78 9.14%
Block Group 3 0 0.00% 4 0.47% 0 0.00% 126 14.72% 90 10.51%
Tract 9503 20 0.53% 24 0.64% 14 0.37% 560 14.96% 597 15.95%
Block Group 1 0 0.00% 0 0.00% 0 0.00% 164 12.87% 110 8.63%
Block Group 2 20 2.17% 24 2.61% 14 1.52% 90 9.77% 185 20.09%
Block Group 3 0 0.00% 0 0.00% 0 0.00% 306 19.75% 302 19.50%
Tract 9504 0 0.00% 6 0.10% 50 0.82% 834 13.71% 1125 18.50%
Block Group 1 0 0.00% 0 0.00% 0 0.00% 118 8.97% 226 17.17%
Block Group 2 0 0.00% 0 0.00% 24 1.62% 354 23.82% 241 16.22%
Block Group 3 0 0.00% 0 0.00% 26 1.89% 101 7.33% 215 15.61%
Block Group 4 0 0.00% 6 0.48% 0 0.00% 144 11.62% 216 17.43%
Block Group 5 0 0.00% 0 0.00% 0 0.00% 117 17.65% 227 34.24%
Tract 9505 0 0.00% 17 0.66% 29 1.12% 307 11.84% 472 18.21%
Block Group 1 0 0.00% 0 0.00% 0 0.00% 58 7.63% 129 16.97%
Block Group 2 0 0.00% 17 0.93% 29 1.58% 249 13.59% 343 18.72%

WESTERN KENTUCKY PKY
tu62
tu62
!"9001
!"2193
!"3210
!"1168
!"920
!"259
!"187
!"224
!"2191
!"737
!"2777
!"3155
!"187
!"720
!"259
!"1214
2
1
3
2
11
4
1
3
1
2
3
2
5
2
9505
9501
95029503
9504
LEITCHFIELD
CLARKSON
´ 0 1 Miles
Map 10.1Leitchfield Small Urban Area Study
2000 Census Tracts and Block Groups
Legend
US Route
WK Parkway
State Route
Local Route
City Boundary
20090106
9501
1
Study Area Boundary
Census Tract Boundary
TRACT
Block Group Boundary
GROUP

WESTERN KENTUCKY PKY
tu62
tu62
!"9001
!"2193
!"3210
!"1168
!"920
!"259
!"187
!"224
!"2191
!"737
!"2777
!"3155
!"187
!"720
!"259
!"1214
2
1
3
2
11
4
1
3
1
2
3
2
5
2
9505
9501
95029503
9504
LEITCHFIELD
CLARKSON
´ 0 1 Miles
Map 10.2Leitchfield Small Urban Area Study
Population by Black orAfrican American
Legend
US Route
WK Parkway
State Route
Local Route
City Boundary
20090106
Block Group Boundary
GROUP 1
PERCENTAGE
0.01 - 1.29
0.00 1.30 - 5.81
5.82 - 11.76

WESTERN KENTUCKY PKY
tu62
tu62
!"9001
!"2193
!"3210
!"1168
!"920
!"259
!"187
!"224
!"2191
!"737
!"2777
!"3155
!"187
!"720
!"259
!"1214
2
1
3
2
11
4
1
3
1
2
3
2
5
2
9505
9501
95029503
9504
LEITCHFIELD
CLARKSON
´ 0 1 Miles
Map 10.3Leitchfield Small Urban Area Study
Population by Hispanic orLatino Origin
Legend
US Route
WK Parkway
State Route
Local Route
City Boundary
20090106
Block Group Boundary
GROUP 1
PERCENTAGE
0.01 - 1.15
0.00 1.16 - 1.87
1.88 - 2.38

WESTERN KENTUCKY PKY
tu62
tu62
!"9001
!"2193
!"3210
!"1168
!"920
!"259
!"187
!"224
!"2191
!"737
!"2777
!"3155
!"187
!"720
!"259
!"1214
9505
9501
95029503
9504
LEITCHFIELD
CLARKSON
3
1
3
1
1
11
4
2
2
3
2
5
1 2
1
2
4
´ 0 1 Miles
Map 10.4Leitchfield Small Urban Area Study
Population by Persons65 and Over
Legend
US Route
WK Parkway
State Route
Local Route
City Boundary
20090106
Block Group Boundary
GROUP 1
PERCENTAGE
9.78 - 12.87
7.33 - 9.77 12.88 - 16.29
16.30 - 23.82
WESTERN KENTUCKY PKY
tu62
tu62
!"9001
!"2193
!"3210
!"1168
!"920
!"259
!"187
!"224
!"2191
!"737
!"2777
!"3155
!"187
!"720
!"259
!"1214
2
1
3
2
11
4
1
3
1
2
3
2
5
2
9505
9501
95029503
9504
LEITCHFIELD
CLARKSON
´ 0 1 Miles
Map 10.5Leitchfield Small Urban Area Study
Population by PersonsBelow the Poverty Level
Legend
US Route
WK Parkway
State Route
Local Route
City Boundary
20090106
Block Group Boundary
GROUP 1
PERCENTAGE
11.13 - 18.72
8.63 - 11.12 18.73 - 24.52
24.53 - 34.24


![Untitled Document 1 [transportation.ky.gov]transportation.ky.gov/Construction-Procurement/Project Related... · Title: Untitled Document 1 Author: h2519 Created Date: 6/10/2011 10:43:24](https://img.pdfslide.net/doc/110x75/5c8f435009d3f2ec738c56c5/untitled-document-1-related-title-untitled-document-1-author-h2519.jpg)