Embed Size (px)
Citation preview

1
Draft (21 Feb 2016) REEVALUATION of The Lower Snake River Juvenile Salmon Migration Feasibility Report
And SUPPLEMENTAL Environmental Impact Statement
Appendix D
Natural River Drawdown Engineering
Prepared by Jim Waddell, PE/CE, USACE retired, Lead Author John Twa, ME, Technical Support/Editing/Graphics
Anon Fisheries Biologists & Planners, USACE

2
Foreward
Due to the high mortality rate of lower Snake River wild juvenile salmon and steelhead (“salmon”) in their downriver migration, the U.S. Army Corps of Engineers (“Corps”) Walla Walla District spent seven years studying Snake River dam removal at a cost of approximately $33 million. In 2002 the Corps released the study, the Lower Snake River Juvenile Salmon Migration Feasibility Report/Environment Impact Statement (FR/EIS or LSRFR). Federal agencies had decided by 2002 that dam breaching by itself would likely recover steelhead and fall Chinook, and that breaching presented the greatest biological potential for recovering the endangered and threatened wild runs. Yet the agencies decided to put off dam breaching for ten years to determine if expensive technical fixes to the dams would permit wild salmon to recover. The FR/EIS conformed to this conclusion. To date wild salmon runs are not meeting survival goals, much less recovering. Technical fixes have not worked. Fifteen years have been wasted and the Corps still is not considering dam removal.
This report reevaluates and supplements Appendix D to the Environmental Impact Statement, entitled Natural River Drawdown Engineering. Appendix D is one of twenty-one appendices to the FR/EIS that, along with the main body of the report, contains over 4,000 pages. The studies and analysis contained in the FR/EIS began initially with the 1991 Systems Configuration Study but evolved into the FR/EIS in response to requirements contained in the National Marine Fisheries Service (“NMFS”) 1995 Biological Opinion regarding Snake River wild salmon. The final environmental impact statement (“EIS”) evaluated four alternatives to helping lower Snake River wild salmon migrate past the dams: 1) the then existing condition; 2) maximum transport of juvenile salmon around the dams; 3) system improvements that could be accomplished without breaching; and 4) dam breaching. For economic and political reasons, Alternative 3 was chosen. When that alternative failed to improve wild salmon runs sufficiently to meet survival and recovery goals, various measures of Alternative 2, Maximum Transport, were implemented. Even in combination these measures have failed to improve wild salmon runs sufficiently to meet survival and recovery goals.
The 2002 EIS is still the National Environmental Policy (NEPA) document covering the operations of the lower Snake hydro system. Approximately one billion dollars has been spent on system improvements and juvenile transportation over the last 15 years. Preventing extinction and recovering wild salmon, not hatchery salmon, is the point of the investment. Government documentation establishes that the state of wild salmon is not improving. This means that the non-breach alternatives of the EIS are unreasonable and imprudent at this date, fourteen years later. Today the only Reasonable and Prudent Alternative in the EIS left to be implemented to recover the Snake River wild salmon is Alternative 4, dam breaching via river drawdown and channel bypass.
The Purpose of this non-governmental independent effort is to update, reevaluate and supplement the 2002 Environmental Impact Statement. The reason this is being done outside of the normal Corps processes is that recent finding from NMFS and the Fish Passage Center show that another study effort taking more than a few months and delaying a drawdown start of 1 November 2016 of Lower Granite Dam, will likely jeopardize the few remaining wild salmon and the species that depend on them, including the critically endangered Southern Resident Killer Whales. Thus speed is of the essence. Secondly, because the Northwest Division of the Corps (NWD), Bonneville Power Administration (BPA) the NMFS continue to hold to the belief/assumption that for economic and policy reasons (Congress gives us no choice but to operate the dams), they have no interest in taking any action leading to the only remaining RPA. They are interested in additional, often Court directed, studies to improve passage,

3
habitat and hatcheries. While their assumptions along with their stories of record runs, are wrong they hold tightly to these beliefs. Thus if the reevaluation and supplementation work is not done by outside parties, it will not be done. Finally, in consideration of the solid evidence that the breaching alternative does not require an overt act or appropriations by Congress and that it can be implemented by the Executive Branch, it is incumbent upon any group asking the President to do this, to have their facts straight and fully developed, thus allowing for an informed and timely decision. It is also incumbent upon such a group to educate other elected officials and agency leads, especially in Washington DC, as to the misleading portal of information that helped create the “politics” of dam breaching.
This reevaluation and supplemental EIS was prepared and reviewed by numerous professional engineers, biologists, economists, legal experts, and planners, most of whom have experience as public servants from the Corps of Engineers, NMFS, EPA, USFWS and state fish and wildlife agencies. Indeed, many of the individuals are uniquely and exceptionally qualified to be doing this work because of their familiarity with the four lower Snake River dams. Some of them participated in the 2002 FR/EIS.
The lead author of this report, Jim Waddell, is a professional civil engineer who retired from a successful 35 year career with the Corps. When he retired, the Corps reappointed him three times to work on Corps’ projects, due to his special expertise. His career spanned many functions of the Corps, including a stint as the Deputy District Engineer for Programs at Walla Walla District for three years starting in 1999. This was the time period during which the decision not to breach the dams was being made. Mr. Waddell, in this senior civilian position, after reviewing all of the facts and assumptions, recommended continuing with breach planning and design to recover wild salmon. His recommendation was not followed. Mr. Waddell became involved again in the Snake River dam issues three years ago when it came to his attention how harmful to wild salmon the dams had continued to be. In retirement he had time to study the FR/EIS in more detail, time that he had not previously had when he had been assigned to the Corps’ Walla Wall District. His three-year study led to this reevaluation when he realized that his original perception of problems in the FR/EIS were correct, and that the errors in the FR/EIS were often much greater than he had perceived previously.
Mr. Waddell is extremely grateful to the many professionals who answered questions, pointed to guidance, reviewed findings and papers and most surprisingly, encouraged him to get this work done and in front of decision makers who have been misled for so long. These professionals were critical in checking the changed assumptions on which this revised approach and cost estimate depends. They were critical in checking the changed assumptions that this revised approach and cost estimate depends on. They know who they are and in time, will be recognized for their contributions. The author is also very grateful for the contributions of John Twa, a mechanical engineer who checked all the assumptions and then found modeling tools and techniques to verify many of them. Finally the author is also grateful for the work of Chandra Johnson who was able to get the first draft of the revised breach concepts out of his head and onto paper. Without her help, this document may not have come to fruition at all.
Ninety-nine percent of his effort was accomplished by individuals who volunteered their personal time.
Today the Snake River dams are not needed. The costs of keeping the dams far exceed the benefits. The hydropower produced by the dams is surplus and has been replaced three times over by greener solar and wind energy. The highly subsidized Snake River barge traffic is being replaced by rail transport at a lower overall cost and a similar carbon footprint. And with a free flowing Snake River, recreation benefits will skyrocket in many Washington counties. Recovering the wild salmon runs will strengthen the Pacific Northwest economy and save tax/rate payers money. Finally, the breaching alternative does not require an overt act or new appropriations by Congress. The President can take executive action to breach the four lower Snake River dams.
4
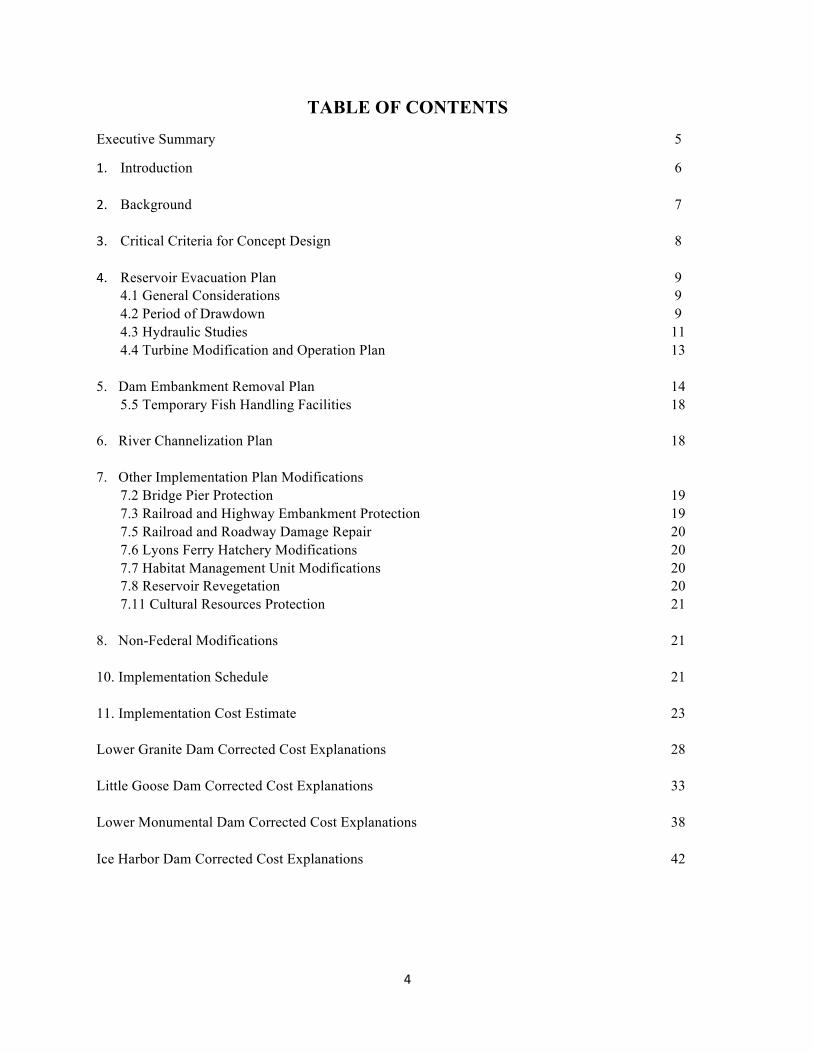
TABLE OF CONTENTS Executive Summary 5
1. Introduction 6
2. Background 7
3. Critical Criteria for Concept Design 8 4. Reservoir Evacuation Plan 9
4.1 General Considerations 9 4.2 Period of Drawdown 9 4.3 Hydraulic Studies 11 4.4 Turbine Modification and Operation Plan 13
5. Dam Embankment Removal Plan 14 5.5 Temporary Fish Handling Facilities 18
6. River Channelization Plan 18 7. Other Implementation Plan Modifications
7.2 Bridge Pier Protection 19 7.3 Railroad and Highway Embankment Protection 19 7.5 Railroad and Roadway Damage Repair 20 7.6 Lyons Ferry Hatchery Modifications 20 7.7 Habitat Management Unit Modifications 20 7.8 Reservoir Revegetation 20 7.11 Cultural Resources Protection 21
8. Non-Federal Modifications 21 10. Implementation Schedule 21 11. Implementation Cost Estimate 23 Lower Granite Dam Corrected Cost Explanations 28 Little Goose Dam Corrected Cost Explanations 33 Lower Monumental Dam Corrected Cost Explanations 38 Ice Harbor Dam Corrected Cost Explanations 42
5
Executive Summary- Breach Plan and Costs When the Army Corps of Engineers Walla Walla District (NWW) drafted the FR/EIS to explore four alternatives for improving juvenile salmon migration through the lower Snake dams, it used the opportunity to paint a picture of dam breaching, even when correctly selecting channel bypass over full removal, as an elaborate, prohibitively expensive, time consuming, and overall unattractive option. Their bloated plan/cost only served to further reinforce their assertion that the dams must continue to operate.
Through a careful reevaluation of the NWW FR/EIS, a revised channel bypass plan for breaching has been designed that costs significantly less (a 70% reduction) than the NWW near-billion dollar proposal and it can be accomplished in half the time.
The keys to accomplishing a cost and time efficient breaching of each dam are as follows:
• Very little modification to the power house is needed. The NWW proposal involved significant alterations to the six turbines that even their own data showed was unnecessary to safely draw down the reservoir.
• Allow the river to do the majority of the embankment removal. The NWW proposal was to mechanically excavate the entire earthen embankment and only allow the river to breach the cofferdams, although it appears that more hydraulic removal of material is required than assumed. Hydraulic breaching has been used numerous times in the Pacific Northwest in the years since the FR/EIS was written and new technology exists to model hydraulic breaching in a safe and predictable manner as was done in this updated plan.
• River channelization can be accomplished using materials already in place at the dam. During dam construction, the natural river channel was successfully routed around the concrete structure without the levees proposed in the FR/EIS.
• Fish handling is unnecessary. Dam breaching will take place at a time when few anadromous fish are present in the river and only one dam will be breached per year. Hydraulic conditions through the breached embankments will be favorable to fish passage, just as they were during dam construction.
• Minimal reservoir embankment actions are necessary for road/railroad protection and repairs. The NWW proved this during the 1992 drawdown test. In the FR/EIS, NWW planned to spend one hundred times more money on repairing damages to roads and railroads than drawdown actually caused. Drawing the reservoir down at a slower initial rate, as this reevaluation recommends, will further reduce the minimal damage that occurred in the 1992 test.
• Lyons Ferry Hatchery should not be modified as the NWW’s plan proposes. • Since Channel Bypass was selected and this plan simply improves on it at lower cost, this plan is
consistent with the existing Environmental Impact Statement for the overall project.
While the NWW’s breaching proposal certainly appears to have been created with a pre-determined conclusion that breaching is an unjustifiably expensive and lengthy process, this revised breaching plan was designed with efficiency and safety in mind, using innovative means. Implementation of the breaching plan as outlined in this document could be started in fall 2016 with the hydraulic breaching

6
of Lower Granite Dam commencing on January 2, 2017. With the breaching of each successive dam, year by year, money will be saved and salmon will take another step towards recovery.
Introduction This document describes the results and process used to reevaluate and update the assumptions, methodology, and cost estimates of restoring a natural river through the Lower Snake River dams. The process approach is essentially the same used in a Corps of Engineers Value Engineering (VE) Study for Civil Works Projects. As in most VE studies, the emphasis was on challenging the assumptions that led to an exceptionally high cost estimate for breaching the earthen embankments in order to achieve near natural river flows, conducive to safe salmon and lamprey passage via channel bypass around the concrete structures. While a corrected cost estimate has been developed, it should be considered a planning level estimate. This document is based on information found in Part I and Appendix D: Natural River Drawdown Engineering of Lower Snake River Juvenile Salmon Migration Feasibility Report/Environmental Impact Statement (LSFR) published by the US Army Corps of Engineers Walla Walla District (NWW) in 2002. Appendix D establishes an engineering plan for breaching the four dams on the Lower Snake River, and also includes plans for other necessary considerations such as mitigation for infrastructure damage resulting from dam breaching. Although as part of the LSFR, full dam removal was explored and a cost estimate prepared, full dam removal is not discussed in Appendix D. This decision on the part of Walla Walla District to establish near natural river flows by channel bypass around the concrete structures, rather than full dam removal, was and is still accurate. Not only is the cost twice as much for complete dam removal (seven times as much based on the corrected costs in this document), but juvenile and adult fish passage can be achieved via channel bypass alone. For these reasons full dam removal was not considered a plausible option and hence not discussed in Appendix D or this document. This document follows the format of LSFR Appendix D of the original document and includes analysis and changed assumptions based on new information. The main function of this document is to show dam breaching can be achieved using a salmon friendly engineering plan that costs significantly less than the plan proposed in LSFR. For the sake of expediency and economy, this document supplements and describes only changes to the original plan shown in Appendix D. Therefore, the reader will need to refer to the original plan for a complete understanding of the breach process. Link to Corps Walla Walla District web location: http://www.nww.usace.army.mil/portals/28/docs/environmental/lsrstudy/Appendix_D.pdf Note that Annex X: Comprehensive Baseline Cost Estimate has been extensively expanded in terms of explaining the differences in the original cost estimate on page DX-3 and the modified cost estimate at the end of this document. Details that influence cost, which are most of them, can be found in the spreadsheets with comments for each dam. The summation of the cost in these spreadsheets for the four dams is $255 million versus $859 million in 1999 dollars as proposed by Walla Walla District. In 2015 dollars with a midpoint of 2019, the corrected cost for breaching and channel bypass is $339 Million. It should also be noted that as a result of this study the construction process has been significantly simplified. This means that the key, i.e., the critical path for a quick start and rapid execution, is the breaching of the earthen embankment. Since the revised approach requires only the need to use two large tracked dozers, e.g. D8, and one tracked excavator for mechanical excavation, and then the use of controlled hydraulic excavation, it is largely an equipment rental contract. Detailed plans and

7
specifications are not required, nor is a lengthy procurement process. Two to three months to advertise, award and mobilize to the site is a generous schedule and well within the Corps’ contracting capabilities. Corps personnel will be operating the dams through the breach process to control flows to achieve required discharge and drawdown rates. This further reduces the need for complicated procurement documents. At this point it is important to state that the issues noted in this review and elsewhere are not generally due to a lack of sound policy of the Corps or others, but the failure brought on by Walla Walla District and Northwest Division by trying to manipulate the policy or scientific/engineering process to serve a predetermined end state. Perhaps one notable policy lapse is that all Headquarters review was eliminated in the late 1990’s and before new policies were developed for true independent review, the LSFR was finalized. An attempt at the time was made to have the National Academy of Sciences conduct a review. This was quickly taken off the table by the District Commander and the NWD senior staff when informal inquiries to the Academy showed an interest on their part. Background (Chapter 2, page D2-1) The genesis for this study and document stems from the fact that the lead author was engaged as the Deputy District Engineer for Programs at Walla Walla District from 1999 to 2002. During this period, the final drafts of the LSFR were under review by district staff and the leadership. At that time, the author noted and sought explanation of various assumptions, cost and conclusions stated in the Report but often received vague answers or was told, ultimately by higher authority, that challenging, or more importantly, changing assumptions after 5 years of study effort was not feasible. Hence the author was left to check the math of cost estimates or wording, which had little impact on the final report and decision. However, the full LSFR, and Appendix D, certainly contained much that would cause doubt in the diligent reader as to the conclusion drawn: that breaching was too expensive as compared to improving the dams (see the Cost Report for Operating the Dams); economically devastating (see the economic reports); and not necessary to prevent extinction and restore the salmon runs (see the Salmon Update/White Paper). These recent reports and papers are largely based on the 2002 LSFR, with updated material from government reports and employees. Unfortunately, a concentrated effort to study and bring out a comprehensive report of these failings was never undertaken, especially in a manner consistent with Corps of Engineers’ policies and processes. This failing was recognized by the author in 2012 at the Elwha River Restoration Science Symposium when Lower Snake River dam breaching was discussed and presented as too difficult to accomplish, for economic reasons. Since then, and with the benefit of retirement that allows one to focus time and energy, the author began a review of the LSFR. Cursory reviews in 2013 and 2014 led the author to believe that the errors omissions and faulty assumptions noted in 2000 may not have been minor. They could change the whole equation and conclusion if properly reviewed, updated and kept in the same context as the original LSFR and in effect become a Supplemental Environmental Impact Statement. This document reflects the review and modifications conducted in 2014 and 2015 to Appendix D, Natural River Drawdown Engineering. Section 2.4 of the Appendix, Study Team Composition, notes that three contractors were used to provide independent technical review of this document. This is another failing of the process used by Walla Walla District and Northwest Division (NWW). Hiring contractors that are normally employed by these organizations does not constitute independence. It was also evident at the time that any recommendations the contractors had to change assumptions were written off for the same reasons as above and/or due to a review of one appendix without regard to a number or assumption made in another appendix. Their

8
efforts essentially did little more than dress up with qualitative and quantitative prose a weak set of underlying assumptions. Also the contractors often took assumptions from one appendix/chapter and applied them to another, without regard to accuracy or efficacy. For example, an apparently good sounding assumption, such as maintaining navigation benefits as long as possible, is a bad one given the marginal return on investment and the impacts that led to a rapid drawdown rate; that then leads to another assumption that this will cause “significant” slope failure and damage to roads and rail roads; and then leads to cost assumptions and estimates for repairing all potential sites for $110,000,000 on Lower Granite reservoir. But, when these damages occurred during the 1992 drawdown test, it cost only $520,000 to repair them (1992 Reservoir Drawdown Test, USACE Walla Walla District, page 133). This is a decrease of approximately $109,480,000 in estimated cost, not insignificant. The Corps had overestimated this cost by more than 200%. Further, this is just one of many examples that can be found in the study documents that should have been corrected at the time and should have been spotted over the ensuing years by those concerned with salmon survival, and only now comes to light through the efforts of this review. Critical Criteria for Concept Design (Chapter 3, D3-1) The design for the proposed natural river restoration project (NRR) is based on the same critical criteria stated in the LSFR: continuous fish passage, no catastrophic drawdown, minimal cost, mitigation measures, and safety measures.1 This new plan follows all of these criteria and their descriptions. In two cases, it actually goes further towards meeting the critical criteria than the plan proposed in LSFR. First, the natural river restoration plan eliminates the possibility of “catastrophic drawdown.” The LSFR stated two concerns created by drawdown: slope failure and subsequent damage to roads and railroads, and catastrophic flooding by using erosion based breaching. The LSFR proposed that reservoir drawdown occurs at a rate no faster than 2 feet per day in order to avoid slope failures and road damage, and that an erosion based breaching method would be too dangerous2. The new plan will be safer because it will lower the reservoir only 6 inches a day for the first 5 feet, and then 1 to 1.5 feet per day until the water level reaches the dam’s spillway crest. This will further minimize the risk of slope failure. Erosion based breaching will work safely for this plan because navigation and power production will not be active during construction. Power can be produced but is entirely a function of needed discharges for drawdown from spillway crest to 30 feet of head. Also, it is anticipated that one turbine will be operated from Minimum Operating Pool (MOP) until no longer needed to control discharges as a matter of testing its performance through the full head range. Since The Lower Snake River Juvenile Salmon Migration Feasibility Report was published in 2002, software has been developed for the analysis of overtopping the earthen embankments. The Windows Dam Analysis Modules (WinDAM) were created by the USDA Agricultural Research Service, USDA Natural Resources Conservation Service, and Kansas State University. Version B, used in the analysis of hydraulic breaching for this document, was released in 2011. The primary functions of WinDAM B are to hydraulically route river flow through, around, and over a single earthen dam, estimate spillway erosion, and estimate erosion of the earthen embankment caused by overtopping the dam embankment. For this re-evaluation report, an estimation of the embankment soil properties was used in the model, along with embankment geometry gleaned from Corps documentation. Once approval to breach is given, sampling of the embankment material should be done and entered into the WinDAM model. This will increase the accuracy of the model and provide better estimates of the flows that will be encountered during breaching, as well as the flows required to finish channelization.

9
Hydraulic breaching would not be used until the head difference is 30 feet. At that point, erosion rates can be controlled by opening and closing the wicket gates on the turbines. This reduces an “uncontrolled” breach. However, modeling shows that given this head, remaining reservoir volume, embankment erosion rates, and anticipated discharges, full release is practical and likely desirable. Also, dams would be removed one at a time, starting from the dam furthest upriver, Lower Granite Dam. If hydraulic breaching were to become uncontrollable, the downstream dam could contain the remaining reservoir volume when at Minimum Operating Pool. This method would work at every dam, even Ice Harbor Dam where any excess water would be captured and held safely immediately downstream in McNary Pool on the Columbia River. This approach in fact is the same concept used in the original plan and EIS, that is to hydraulically remove material below 22 feet of head, but the NWW report did not refer to this as a catastrophic breach. This modified plan begins hydraulic breaching about 8-13 feet higher. All of this leads to the conclusion that controlled hydraulic breaching outlined here is safe and far less costly than the original plan, and is not of a catastrophic nature. It is also important to note that the maximum flows during the breach are no more than typical spring flows across the spillways or were observed during the 1992 Drawdown Test with no ill effects. The natural river restoration plan also costs significantly less than the LSFR plan. For example, the breaching plan described in Appendix D states that “construction operations would be phased so that power production, navigation, and fish migration could continue until the last possible period.”3 Reevaluation of the economics of the Lower Snake dams shows that power production and navigation actually create a net economic loss4, meaning it would actually save money to ignore power production and navigation while the dams are being breached. Therefore, erosion based breaching can be used as a
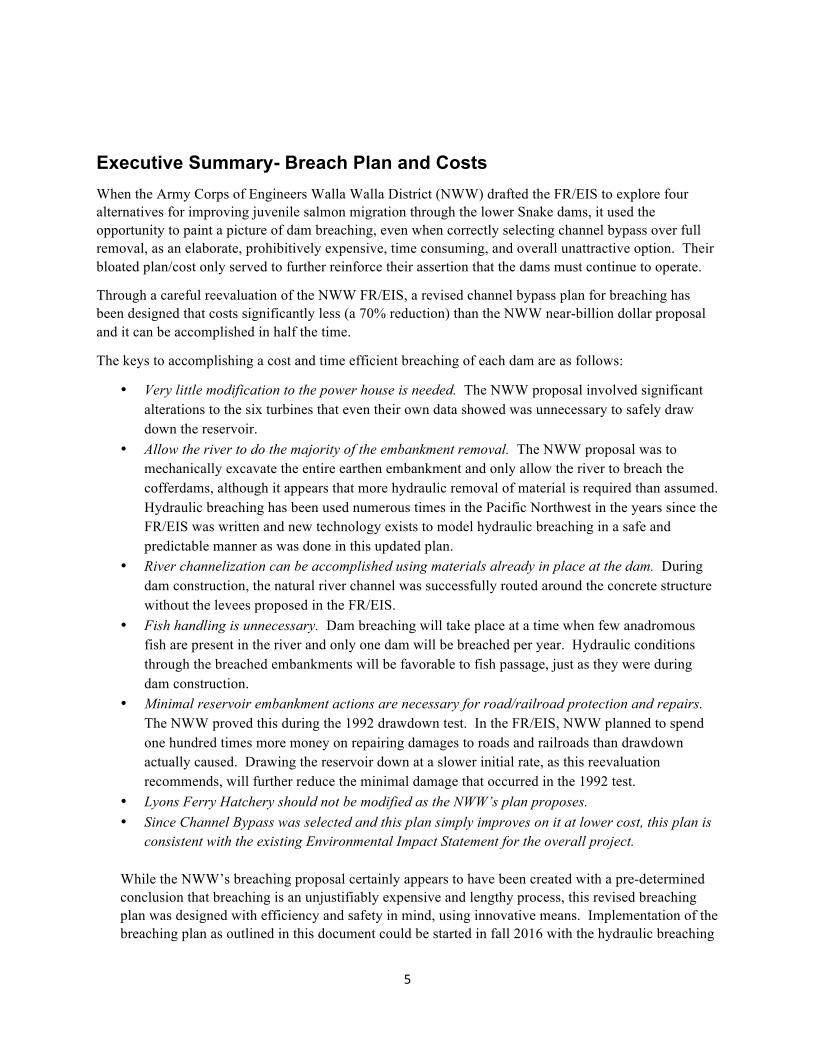
safe, cost effective method. This plan will further decrease costs because the initial water release rate of only 6 inches a day from reservoirs will mean less damage to highways and railroads. In addition, the NRR design eliminates the costly need for bulkheads by using the tailwater from the pool beneath a dam to cover draft tubes while each reservoir is lowered. Reservoir Evacuation Plan (Chapter 4, page D4-1) General Considerations (4.1, page D4-1) The general concept and plan for reservoir evacuation for the natural river restoration project is based on Lower Granite Dam. The remaining three may be modified as needed based on experiences at Lower Granite. Drawdown will begin when the reservoir has been at Minimal Operating Pool for two or more months. This allows for optimal soil conditions to minimize slope failure as the reservoir is being lowered. To further prevent slope failure, the reservoir will be drawn down at 6 to 18 inches per day instead of the 2 feet a day that was originally taken from the Corps Reservoir Control Manual, as recommended in the LSRF and the more recently released Programmatic Sediment Management Plan (PSMP5), and implemented in the 1992 Reservoir Drawdown Test of Lower Granite and Little Goose Projects. Period of Drawdown (4.2, page D4-2) The pool of each dam will be held at MOP for two months prior to further drawdown, beginning on 1 November, 2016 for Lower Granite, followed by Little Goose on 1 November, 2017, Lower Monumental 1 November, 2018 and Ice Harbor 1 November, 2019. These drawdown dates are chosen as having the least impact on fish passage, as very few fish are migrating during this time of the year. On these dates drawdown will proceed at 6 inches per day for 10 days, then at 1 foot per day for 20 days, then 1.5 feet per day for 18 days, then 2 feet per day for 14 days. (See Figure 1.) At this point, Lower Granite’s
10
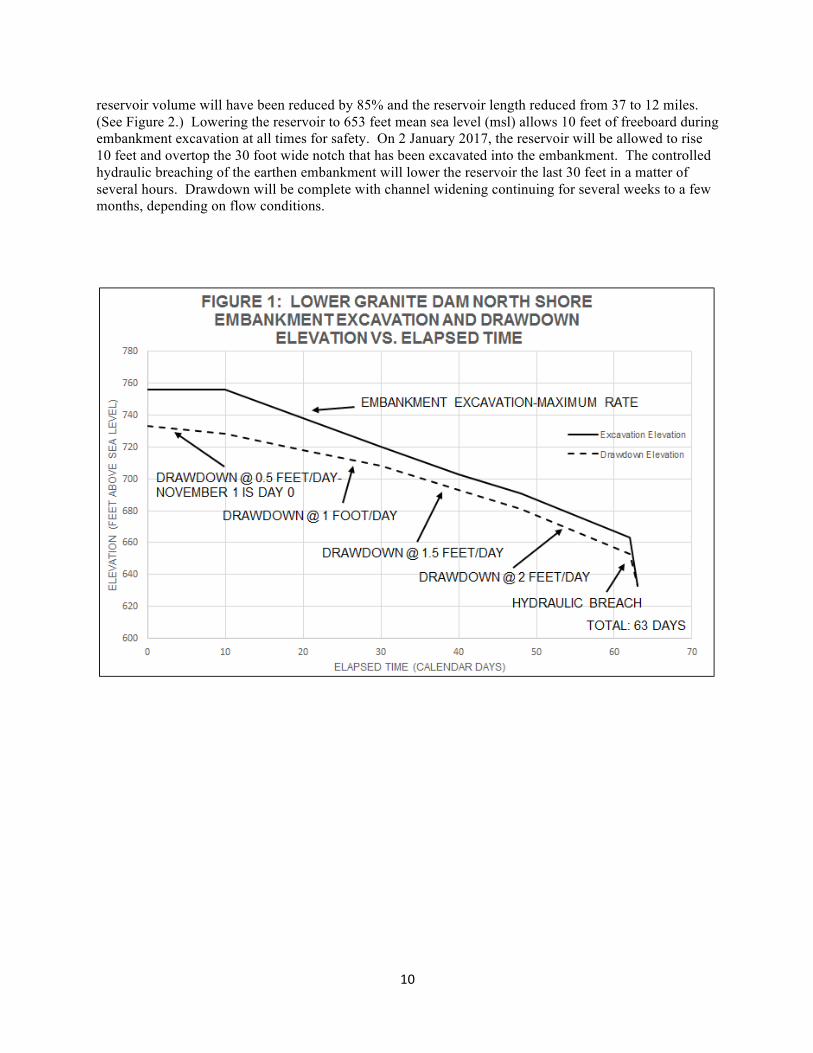
reservoir volume will have been reduced by 85% and the reservoir length reduced from 37 to 12 miles. (See Figure 2.) Lowering the reservoir to 653 feet mean sea level (msl) allows 10 feet of freeboard during embankment excavation at all times for safety. On 2 January 2017, the reservoir will be allowed to rise 10 feet and overtop the 30 foot wide notch that has been excavated into the embankment. The controlled hydraulic breaching of the earthen embankment will lower the reservoir the last 30 feet in a matter of several hours. Drawdown will be complete with channel widening continuing for several weeks to a few months, depending on flow conditions.
11
It should be noted that drawdown will have an immediate effect on deepening and widening a new channel at the confluence of the Snake and Clearwater rivers.WhilenotcoveredintheoriginalLSFR(itwouldhavebeenanadmissionthatLowerGranitecreatesamuchhigherfloodriskonLewiston)thiserosionactionmovessedimentdownstream,awayfromtheconfluencearea,thuseliminatingtheovertoppingofthebackwaterleveeswithanystormeventgreaterthan50yearsfrequency.Thisfrequencyisderivedfromthe2014ProgrammaticSedimentManagementPlanpreparedbyWallaWallaDistrict,CorpsofEngineers. Hydraulic Studies (4.3, page D4.2) The original Appendix D drawdown depends on the significant use of turbines to minimize spill due to highly saturated gas concerns. These concerns have largely been shown to be overstated with the various “spill” programs over the last 15 years. As such the spillway and one turbine (to record performance and condition through the full head range) will be used to drawdown to the spillway crest and the next 18 feet will utilize 3-4 turbines depending upon river flows at the time. Three to four turbines also may be used to control the flows during hydraulic breaching, but this is not anticipated. Hydraulic and turbine model studies shown in the LSFR indicate that this is safely possible. While these studies indicate points of low efficiencies and try to avoid even minor damage to the turbines through the low head ranges, this is not considered relevant given the fact that any power produced is of limited value and the turbines will no longer have any purpose after breaching. They have scrap metal value only.
12
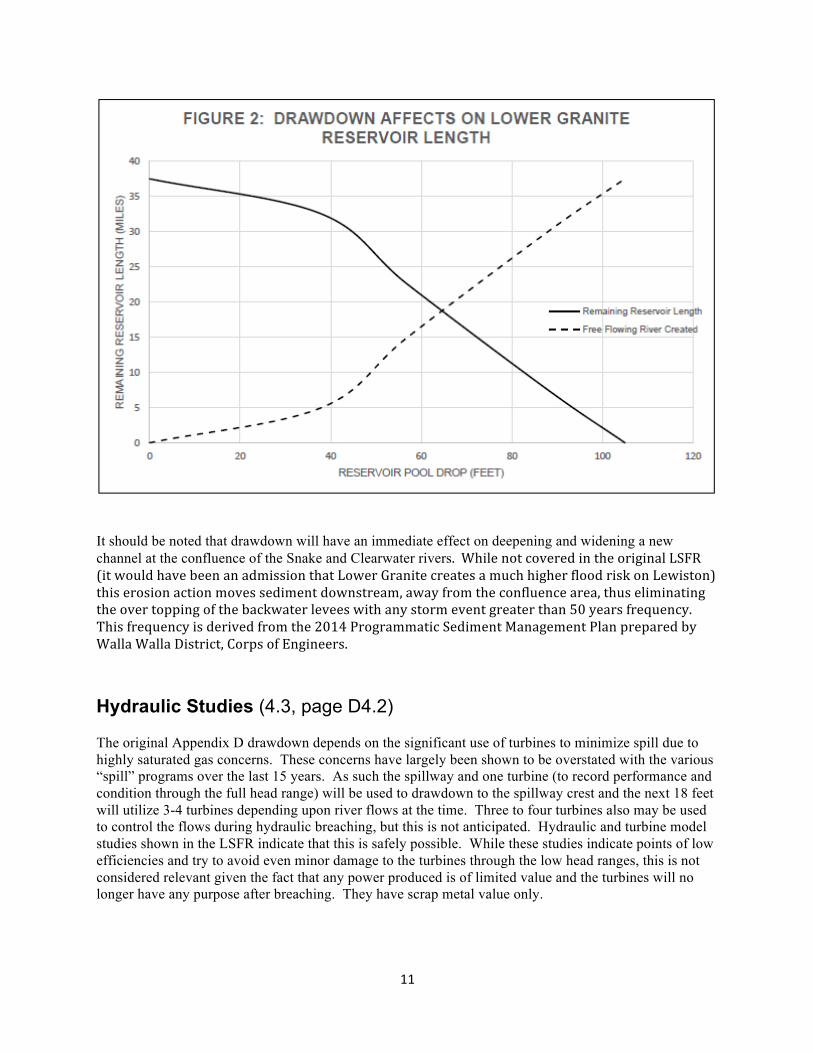
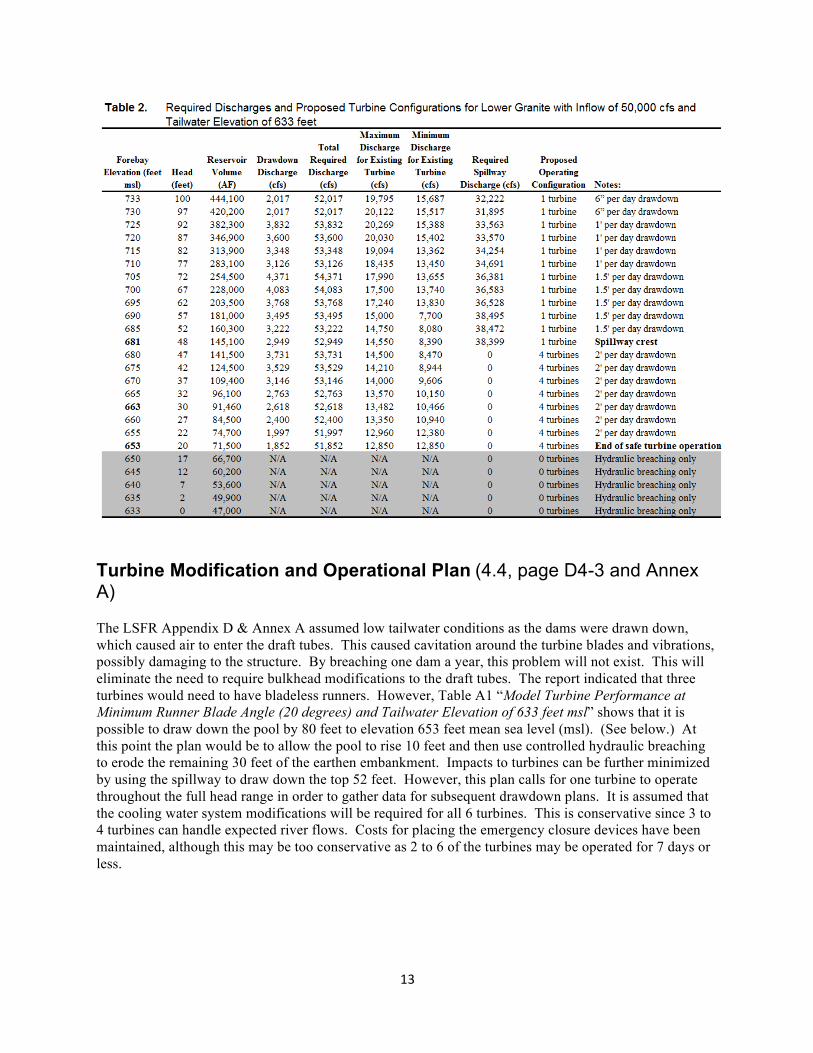
Tables 1 and 2 show the required discharge for various heads at Lower Granite Dam as the reservoir is drafted for inflows of 30,000 cubic feet per second (cfs) and 50,000 cfs. These tables are derived from Tables A5 and A6, pages D-A-9 and 10, in Appendix D - Annex A Turbine Passage Modification Plan.
13
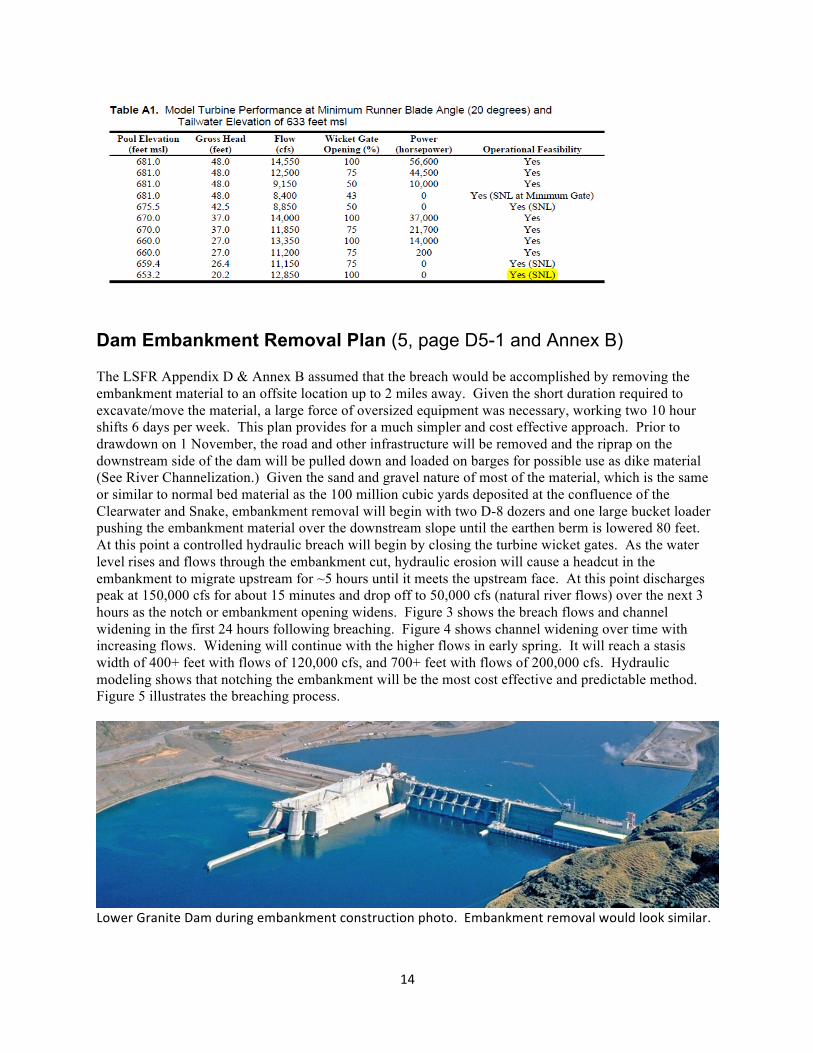
Turbine Modification and Operational Plan (4.4, page D4-3 and Annex A) The LSFR Appendix D & Annex A assumed low tailwater conditions as the dams were drawn down, which caused air to enter the draft tubes. This caused cavitation around the turbine blades and vibrations, possibly damaging to the structure. By breaching one dam a year, this problem will not exist. This will eliminate the need to require bulkhead modifications to the draft tubes. The report indicated that three turbines would need to have bladeless runners. However, Table A1 “Model Turbine Performance at Minimum Runner Blade Angle (20 degrees) and Tailwater Elevation of 633 feet msl” shows that it is possible to draw down the pool by 80 feet to elevation 653 feet mean sea level (msl). (See below.) At this point the plan would be to allow the pool to rise 10 feet and then use controlled hydraulic breaching to erode the remaining 30 feet of the earthen embankment. Impacts to turbines can be further minimized by using the spillway to draw down the top 52 feet. However, this plan calls for one turbine to operate throughout the full head range in order to gather data for subsequent drawdown plans. It is assumed that the cooling water system modifications will be required for all 6 turbines. This is conservative since 3 to 4 turbines can handle expected river flows. Costs for placing the emergency closure devices have been maintained, although this may be too conservative as 2 to 6 of the turbines may be operated for 7 days or less.
14
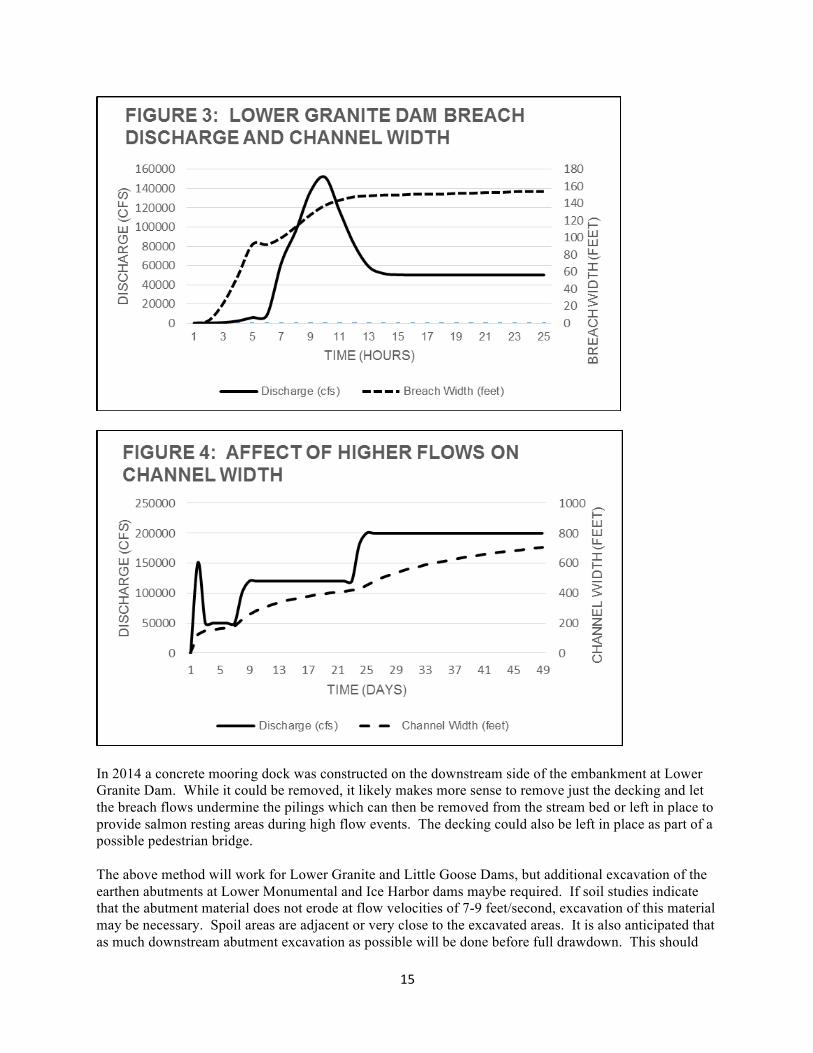
Dam Embankment Removal Plan (5, page D5-1 and Annex B) The LSFR Appendix D & Annex B assumed that the breach would be accomplished by removing the embankment material to an offsite location up to 2 miles away. Given the short duration required to excavate/move the material, a large force of oversized equipment was necessary, working two 10 hour shifts 6 days per week. This plan provides for a much simpler and cost effective approach. Prior to drawdown on 1 November, the road and other infrastructure will be removed and the riprap on the downstream side of the dam will be pulled down and loaded on barges for possible use as dike material (See River Channelization.) Given the sand and gravel nature of most of the material, which is the same or similar to normal bed material as the 100 million cubic yards deposited at the confluence of the Clearwater and Snake, embankment removal will begin with two D-8 dozers and one large bucket loader pushing the embankment material over the downstream slope until the earthen berm is lowered 80 feet. At this point a controlled hydraulic breach will begin by closing the turbine wicket gates. As the water levelrises and flows through the embankment cut, hydraulic erosion will cause a headcut in the embankment to migrate upstream for ~5 hours until it meets the upstream face. At this point discharges peak at 150,000 cfs for about 15 minutes and drop off to 50,000 cfs (natural river flows) over the next 3 hours as the notch or embankment opening widens. Figure 3 shows the breach flows and channel widening in the first 24 hours following breaching. Figure 4 shows channel widening over time with increasing flows. Widening will continue with the higher flows in early spring. It will reach a stasis width of 400+ feet with flows of 120,000 cfs, and 700+ feet with flows of 200,000 cfs. Hydraulic modeling shows that notching the embankment will be the most cost effective and predictable method. Figure 5 illustrates the breaching process.
LowerGraniteDamduringembankmentconstructionphoto.Embankmentremovalwouldlooksimilar.
15
In 2014 a concrete mooring dock was constructed on the downstream side of the embankment at Lower Granite Dam. While it could be removed, it likely makes more sense to remove just the decking and let the breach flows undermine the pilings which can then be removed from the stream bed or left in place to provide salmon resting areas during high flow events. The decking could also be left in place as part of a possible pedestrian bridge. The above method will work for Lower Granite and Little Goose Dams, but additional excavation of the earthen abutments at Lower Monumental and Ice Harbor dams maybe required. If soil studies indicate that the abutment material does not erode at flow velocities of 7-9 feet/second, excavation of this material may be necessary. Spoil areas are adjacent or very close to the excavated areas. It is also anticipated that as much downstream abutment excavation as possible will be done before full drawdown. This should
16
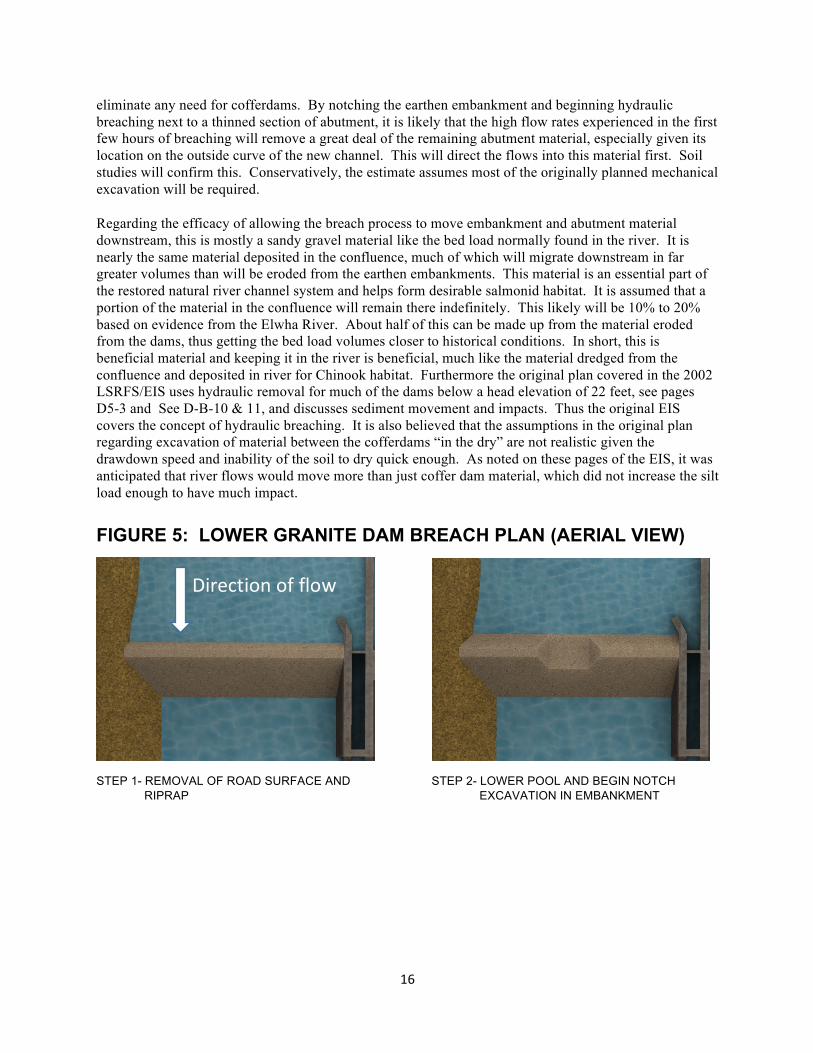
eliminate any need for cofferdams. By notching the earthen embankment and beginning hydraulic breaching next to a thinned section of abutment, it is likely that the high flow rates experienced in the first few hours of breaching will remove a great deal of the remaining abutment material, especially given its location on the outside curve of the new channel. This will direct the flows into this material first. Soil studies will confirm this. Conservatively, the estimate assumes most of the originally planned mechanical excavation will be required. Regarding the efficacy of allowing the breach process to move embankment and abutment material downstream, this is mostly a sandy gravel material like the bed load normally found in the river. It is nearly the same material deposited in the confluence, much of which will migrate downstream in far greater volumes than will be eroded from the earthen embankments. This material is an essential part of the restored natural river channel system and helps form desirable salmonid habitat. It is assumed that a portion of the material in the confluence will remain there indefinitely. This likely will be 10% to 20% based on evidence from the Elwha River. About half of this can be made up from the material eroded from the dams, thus getting the bed load volumes closer to historical conditions. In short, this is beneficial material and keeping it in the river is beneficial, much like the material dredged from the confluence and deposited in river for Chinook habitat. Furthermore the original plan covered in the 2002 LSRFS/EIS uses hydraulic removal for much of the dams below a head elevation of 22 feet, see pages D5-3 and See D-B-10 & 11, and discusses sediment movement and impacts. Thus the original EIS covers the concept of hydraulic breaching. It is also believed that the assumptions in the original plan regarding excavation of material between the cofferdams “in the dry” are not realistic given the drawdown speed and inability of the soil to dry quick enough. As noted on these pages of the EIS, it was anticipated that river flows would move more than just coffer dam material, which did not increase the silt load enough to have much impact. FIGURE 5: LOWER GRANITE DAM BREACH PLAN (AERIAL VIEW)
STEP 1- REMOVAL OF ROAD SURFACE AND STEP 2- LOWER POOL AND BEGIN NOTCHRIPRAP EXCAVATION IN EMBANKMENT
Directionofflow

17
STEP 3- COMPLETE NOTCH EXCAVATION TO 663’ STEP 4- ALLOW POOL TO OVERTOP
AND LOWERING POOL TO 653’ MSL EMBANKMENT NOTCH AND PERFORM HEADCUT THROUGH EMBANKMENT
STEP 5- HYDRAULIC BREACHING WIDENS STEP 6- CHANNEL WIDENS TO 400+’ WITH
CHANNEL TO 175’ WITH FLOWS OF FLOWS OF 120,000 CFS50,000 CFS
STEP 7- CHANNEL WIDENS TO 700+’ WITH STEP 8- EMBANKMENT REMOVAL BY
FLOWS OF 200,000 CFS HYDRAULIC BREACHING COMPLETE
18
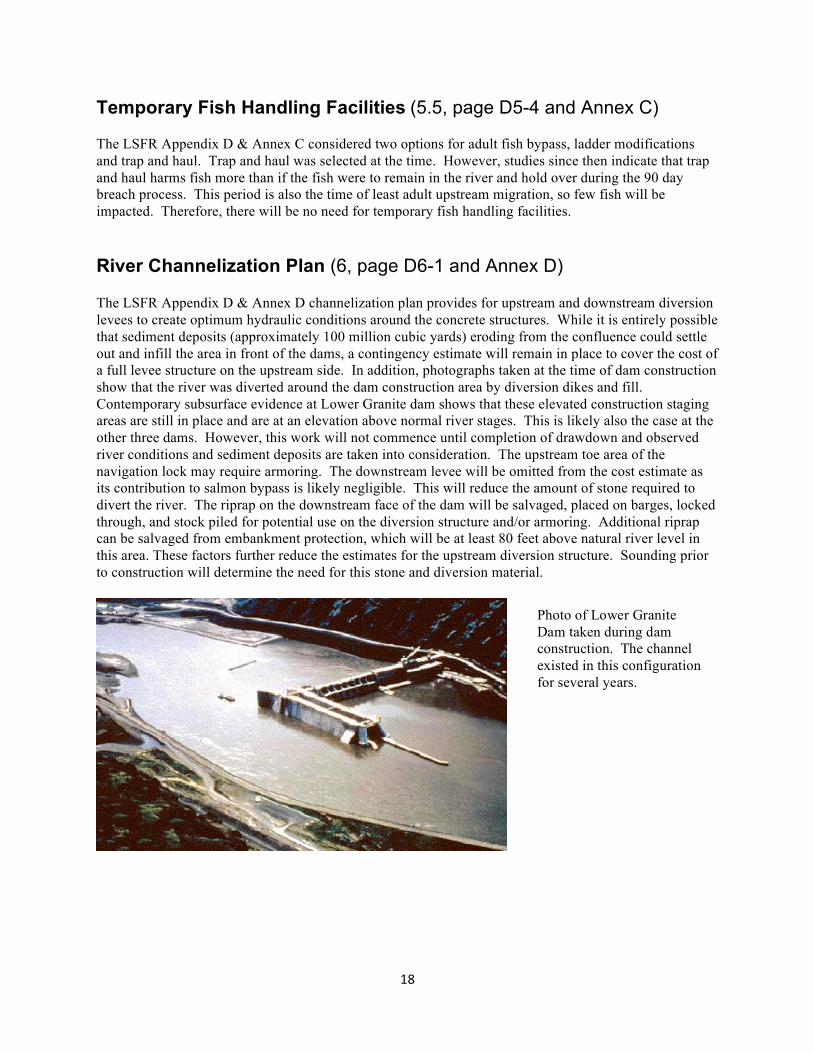
Temporary Fish Handling Facilities (5.5, page D5-4 and Annex C) The LSFR Appendix D & Annex C considered two options for adult fish bypass, ladder modifications and trap and haul. Trap and haul was selected at the time. However, studies since then indicate that trap and haul harms fish more than if the fish were to remain in the river and hold over during the 90 day breach process. This period is also the time of least adult upstream migration, so few fish will be impacted. Therefore, there will be no need for temporary fish handling facilities. River Channelization Plan (6, page D6-1 and Annex D) The LSFR Appendix D & Annex D channelization plan provides for upstream and downstream diversion levees to create optimum hydraulic conditions around the concrete structures. While it is entirely possible that sediment deposits (approximately 100 million cubic yards) eroding from the confluence could settle out and infill the area in front of the dams, a contingency estimate will remain in place to cover the cost of a full levee structure on the upstream side. In addition, photographs taken at the time of dam construction show that the river was diverted around the dam construction area by diversion dikes and fill. Contemporary subsurface evidence at Lower Granite dam shows that these elevated construction staging areas are still in place and are at an elevation above normal river stages. This is likely also the case at the other three dams. However, this work will not commence until completion of drawdown and observed river conditions and sediment deposits are taken into consideration. The upstream toe area of the navigation lock may require armoring. The downstream levee will be omitted from the cost estimate as its contribution to salmon bypass is likely negligible. This will reduce the amount of stone required to divert the river. The riprap on the downstream face of the dam will be salvaged, placed on barges, locked through, and stock piled for potential use on the diversion structure and/or armoring. Additional riprap can be salvaged from embankment protection, which will be at least 80 feet above natural river level in this area. These factors further reduce the estimates for the upstream diversion structure. Sounding prior to construction will determine the need for this stone and diversion material.
Photo of Lower Granite Dam taken during dam construction. The channel existed in this configuration for several years.

19
Bridge Pier Protection (7.2, page D7-1 and Annex E) The LSFR Appendix D & Annex E appears to assume that the bridge piers are not adequately protected for a 500 year storm event (Standard Project Flood or SPF) and are currently protected from such events by the pool elevation. However, virtually all of these structures were built prior to reservoir impoundment. Several were new structures to accommodate the reservoir surface elevations. So, just as likely an assumption is that they were properly protected, since the piers would have been exposed to flooding for several years after their erection and prior to filling the reservoir. Lower Granite remained in this condition for almost five years due to a construction moratorium. It should also be noted that while an SPF of 500 years is used for estimating pier improvements, the NWW 2014 Programmatic Sediment Management Plan (PSMP) notes that authorities reviewing the Lewiston levees would consider the risk of them being overtopped in the next 50 years as marginally acceptable. So 500 years is exceptionally conservative. Furthermore, in the event of an SPF, river stages in Lower Granite Reservoir would be drawn down rapidly by at least 10 feet. This possibly would expose some of the piers to significant flow velocities. Pier reinforcement would be required, even if the Lower Granite dam were kept in place. Furthermore, bridges in the Lewiston area, as well as some bridges downstream on the lower Snake River constructed before 1970, previously would have been exposed to significant flow events and thus protected. Hence, they are likely to be in acceptable condition. Therefore, much of the LSFR estimate is a worst case contingency cost or should be a cost born by the current project. These bridge piers are very likely accessible after drawdown and any needed protection can be added at that time. Railroad and Highway Embankment Protection, (7.3, page D7-1 and Annex F, aka Reservoir Embankment Protection on pages DX-3 and modified cost estimates below) The LSFR Appendix D & Annex F assumes significant embankment protection would be required. However, the 1934 survey maps show that the Camas Prairie railroad grade was elevation 650 feet. This is about 25 feet above the normal river stage. This old railroad grade illustrates that it was maintained for over 50 years at this elevation, in spite of significant high flow events. The railroad embankment can serve as toe protection for much of the current railroad grade, which is approximately 100 feet above this. Located on either solid rock or substantially set back (500 feet or greater) on gentler slopes, there are few, if any, areas where additional bank protection is needed. In many cases it appears the plans call for protecting an engineered slope, when existing ground slopes and conditions would appear to be the better solution. Also, field inspections on 22 March, 2015 showed that nearly all of the areas to be armored have armor and riprap stone. After drawdown much of this stone can be pulled down slope, as it will not be needed (except in drainage swales) at the higher elevations, i.e., above SPF stage. Since no true calculation can be done ahead of time, it will be assumed that 95% of this cost can be saved and the remaining 5% is a contingency to move existing riprap down slope or to other areas. More detailed review of the topographic maps and flood stages in the natural river should be done to verify this. It also should be noted that the LSFR uses a 100 year SPF to estimate flood stage elevations, while the protection offered in the NWW Programmatic Sediment Management Plan appears to be 50 years under current sediment conditions. Given this and the 6 inches per HOUR drawdown rate used during a flood fight, significant damage would occur with the dams in place, and brings in the question of charging this cost to a breach plan, rather than to the current condition. Until this is resolved, the corrections noted will be used in the breach estimate.

20
Railroad and Roadway Damage Repair (7.5, page D7-2 and Annex H) The LSFR Appendix D & Annex H assumed a drawdown rate of 2 feet per day, and called this a rapid drawdown. The reasoning for this, while not clearly stated, appears to be an attempt to maintain navigation and hydro generation for as long as possible for economic reasons. Its source could be the 1992 drawdown test in which 2 feet per day was used as a compromise between causing damage to the embankments and having an unacceptably long test period. However, corrected economic analysis shows a loss in benefits by keeping the dams in place. The 2 feet per day rate used in the 1992 drawdown test resulted in some cracked roads and minor misalignment of the railroad grade. The actual repair cost of this damage was $639,000 in 1999 dollars. The report also implies that the drawdown occur during the fish window. The corrected drawdown plan will use 6 inches per day rate to minimize any damage for the first 5 feet, then 1 to 1.5 feet per day until spillway crest elevation, and then 2 feet per day until the hydraulic breach begins 65 feet below normal pool. This should reduce significantly slope failure caused by excessive hydrostatic pressure which occurs during a rapid drawdown. It should also be noted that during an SPF, Lower Granite will be drawn down at 6 inches per HOUR. At this rate significant failures will occur. Thus, these cost are applicable to the current condition as well. The basis of the NWW estimate was to cover all potential failure areas, leading to a cost estimate of $110,000,000 for Lower Granite. Actual repair costs were around $520,000, or less than .5% of the estimated cost. Lyons Ferry Hatchery Modifications (7.6, page D7-2 and Annex I) Recent biological findings concerning the impacts to wild stocks from hatchery stocks, indicate that Lyons Ferry Hatchery and Irrigon should cease operations immediately upon a breach decision.1 Instead of modifications, decommissioning of these hatcheries will take place. Any juveniles in the hatcheries at the time of a breach decision should not be released, as they will be competing for spawning areas in the newly restored river channel. This is especially important since mini and micro jacks are returning in ever larger numbers and within just a few months after entering the ocean. Habitat Management Unit (HMU) Modifications (7.7, page D7-3 and Annex J) The LSFR assumes that the HMU would remain until the newly exposed riparian habitat areas return. The original riparian areas were and will be of greater quality than the HMU's that will be left well above the river/riparian corridor. As a result, it makes more since to invest funds into plantings and other modifications in the river/riparian corridor. It is hard to imagine that wildlife will want to use the higher elevation areas when the low level river/riparian area is available. Costs shown will remain until a better takeoff estimate can be prepared, along with Reservoir Revegetation below, at which time this item will be reduced to cover only the costs to close down activities that will require ongoing Operations/Maintenance expenditures. In other words, active Corps management of these HMU's should cease.
Reservoir Revegetation (7.8, page D7-3 and Annex K) Because the LSFR Appendix D & Annex K report assumed a drawdown rate of 2 feet per day and two dams breached per year, massive exposed areas would need to be revegetated at a high rate. To do this, helicopters were to be utilized. Helicopters are expensive compared to truck mounted rigs on roads, or
21
even rigs loaded on a shallow draft watercraft. By reducing the initial drawdown rate to 6 inches per day, these more conventional and cheaper means will be employed. Cultural Resource Protection (7.11, page D7-4 and Annex N) The original scope of work seems reasonable and although takeoffs have not been done, the overall cost appears reasonable even with the 100% contingency applied to this work item. However, savings are possible with the much slower drawdown rate (6 inches versus 2 feet per day) and the fact that only one reservoir will be drawn down per year. This will reduce the amount of labor required to do the initial site screening. This critical first look at the 136 known sites must be done quickly. Given the far lower rate of surface area to be exposed each day, the level of effort will be much less and potentially within the scope of existing in-house tribal personnel, who would be reimbursed accordingly. This is likely a preferred approach as opposed to the LSFR Appendix D & Annex N approach of hiring contractors who would need to bring in a substantial number of outside non-tribal personnel. Non-Federal Modifications (8, page D8-1 and Annex G through T) Appendix D shows several cost features such as irrigation impacts, water diffusers and gas line crossings. These were not considered part of the implementation cost estimate and are not shown in the total breach costs. They could however be added to the costs, if they are determined to be appropriate federal expenditures, most likely by Bonneville Power Administration (BPA). They are considered “economic costs.” Hence, they are included in this appendix. This reevaluation will be modified in the future to include an analysis of assumptions and cost to the non-federal entities involved in each case. An example is the cost shown for modifying irrigation systems. The cost shown is for constructing costly storage, pumping and piping systems to continue using the water from Ice Harbor pool. This estimate was noted by reviewers to be high. However, the Economics Appendix of the 2002 LSFR, states that it is cheaper to mitigate farmers for change in land values. The analysis at the time was admittedly cursory. It did not consider use of high value, low water usage crops such as vineyards. It also did not consider the benefit of farmland reclaimed after drawdown, which could also be used for high value crops such as vineyards. Vineyards in the “new” valley are likely to have significant direct and indirect benefits that need to be included after further analysis. Historical evidence indicates that the lower Snake River Valley had vineyards until Prohibition, at which time they were converted to orchards until they were flooded by the reservoirs. As such, this information will be included in a separate report since the benefits to the nation and agricultural interests may be derived without the need for direct federal or BPA expenditures. Implementation Schedule (10, page D10-1 and Annex W) The original implementation schedule was based on several assumptions that have been modified in this plan. The details of these modifications have been noted above and in the comments to the implementation cost estimates which give durations for critical path activities, see below. Of particular importance to cost and schedule is realizing that the breach process can be accomplished far more simply, thus at a much lower cost and shorter duration, even though this modified plan breaches one dam per year, as opposed to two per year in the original plan. The original plan assumes that extensive additional modeling, engineering and designing must be accomplished in order to prepare a large set of
22
fixed price contracts. The much simpler approach and the elimination or reduction of some of the costlier assumptions negates the need for much of this analysis and design. (At the time of the original LSFR, the lead author was told by the engineering staff that “preliminary” Engineering and Design (PED) would cost $55 million). The originally proposed expensive engineering effort also led to a seven year schedule, not counting post construction activities such as revegetation. This modified plan reduces the schedule by two years. Further, breaching one dam per year is simpler, with lower risk. It should be noted that the “breach cost” shown in Appendix D was for construction and acquisition only. It did not include any modeling, engineering, design, contract preparation and project management costs. Based on the original construction plan, these costs could well have exceeded another $200 million. Most of this money can be saved under the modified plan. For example, the embankment removal needs very little “design” or contract documentation, since it is basically an equipment rental or purchase contract for 4-5 pieces of equipment and maybe a barge on which to load riprap. By breaching one dam per year this modified plan also provides the opportunity to adjust the breach process as needed based on the first, and likely the easiest, dam to breach, Lower Granite. It also assumes that if soil conditions in the earthen abutments at Lower Monumental and Ice Harbor require mechanical removal, much of the work can be accomplished 1 to 2 years prior to drawdown. The modified plan also affords additional time for non-federal users, such as irrigators and grain shippers, to adapt to the drawdown and breach conditions; time for the Corps to conduct disposal studies for the project land and thus accelerate the economic opportunities for agriculture, recreation and supporting businesses; time to adjust grid loads between wind and other replacement sources of power (much more difficult with a two year plan) and most importantly, creates improved passage and habitat for affected species quickly. The greatest challenge in this plan is timing. Drawdown must begin by 1 November of any given year. In the planned case this is November 1, 2016. It will take a few months for grain shippers and pleasure boat owners on the Lower Granite Pool to switch to rail or relocate water craft. Therefore, a breach decision should be made as early as possible before the drawdown date. The modified plan can be implemented within 9 months of a breach decision, even if there were a need to develop a Supplemental Environmental Impact Statement. This assumes that much of the EIS work has been done before a breach decision is reached, since the EIS would contain many of the findings germane to making a breach decision. The modified plan/document is in fact one of the parts of a Supplemental EIS. Those with NEPA experience from the Corps and EPA believe that converting this draft material and meeting the NEPA requirements for public notification/involvement can be done within 4-5 months. This is possible because the original LSFR was an extensive NEPA document that underwent significant public review and comment (over 240,000 comments and 15 public meetings, after publication of the final draft). Because the original EIS contained a Breach Alternative, supplementing it is a matter of updating the information, e.g., the Salmon Update/White Paper and incorporating references to other breach projects such as the Elwha and Condit. In addition, the original 2002 EIS is still in effect, as it is the NEPA document supporting the current operations. These operations have failed to achieve the intended recovery goals for the selected alternative. As such, another alternative available in this EIS, breaching, should now be recognized as the correct alternative. It should also be noted that non-petition type written comments and oral statements at public meetings for the LSFR were substantial, more than 75%, supportive of the breach alternative, despite its overstated construction costs and overstated negative economic effects. These included a $267 million average annual cost to breach, versus $13 million to keep the dams and add fish passage improvements. The fish passage improvements, along with the operations, maintenance and repair costs were underestimated by about $161 million average annual cost.

23
The premise of the original plan was that dam breaching could not occur without congressional authorization. The PED noted above could have begun, but NWW leadership refused to provide any funding for the PED, NWW looked at the PED as another attempt by NWW to continue funding the LSFR as a long-term program, which had grown to $33 million. While congressional authorization could assist the effort, it is not necessary. It is currently within the Corps’ responsibility to review and address projects that do not meet their authorized purpose because of economic, environmental, or technical conditions that have changed negatively. This is, and likely was the case from the beginning, in terms of economic and environmental benefits. It is also now the case for the technical aspects. Fixes have failed to meet the recovery goals hoped for with their expenditures, roughly $700 million versus the originally estimated $280 million. Given this situation, the Corps has the authority to stop operating a project, as the Corps did on the original navigation channel on the Lower Snake River and has recently done on the Willamette Lock and Dam in Portland, Oregon. The Corps also may be directed by the President through executive action. See the EO Considerations document for further discussion on why congressional authorization and, to a significant level, appropriations are not required. All of this would save many years, if not decades. The essential schedule benefit of the modified plan is that it can be implemented within 7 months and thus provides a rapid response to degrading environmental conditions for species of concern such as salmon and orca. It is also a valid execution approach found in the President’s Adaptive Management Plan, in that it immediately overcomes the failings of the current recovery strategies, without the need for more studies and extensive planning and design efforts. Implementation Cost Estimate (11, page D11-1 and Annex X) The original cost estimate in the 2002 LSFR contained a level two estimate only. Therefore, as with the original review, in most cases this review does not attempt to break down the estimate into further detail and look for errors, as not enough information is presented in the report to do so. Furthermore, as noted earlier, it is more prudent to first check the underlying assumptions that led to these estimates. This is a key principal of a Corps Value Engineering Study. The review and correction process involved looking at each cost element (most are noted above) for each dam, checking the underlying assumptions, applying a correction factor, and then deriving a new estimate based on known quantities or similar activities with known costs. As the first, simplest, and most important dam to breach, Lower Granite Dam was used as the starting point. Similar cost features at the other dams were modified as appropriate. Little Goose, the second dam to be breached, is similar in arrangement to Lower Granite. As a result it has similar revised costs. Lower Monumental and Ice Harbor are somewhat different in that their earthen embankments are shorter, thus requiring excavation (mechanical, hydraulic or both depending on soil type and condition) of the adjoining earthen embankments. Because of this, their respective excavation costs have not been substantially reduced. Further investigation may show that this abutment material can be eroded quickly enough with hydraulic breaching to allow channel widening and less stressful fish passage. This would reduce significantly the costs. Not only will further cost analysis refine this planning level estimate but the breaching of Lower Granite will provide valuable insight into the process that might lead to the lowering of noted contingency costs for the next three dams. It should be noted that as of this writing not all costs have been fully explored for lack of information in the report and their low dollar value as compared to the cost elements that were reviewed. For instance, a “costs for other,” fish hatcheries are shown. This is a questionable cost to include in the breaching costs, as they were and are a part of the non-breach alternative selected in 2002. These costs, now running over
24
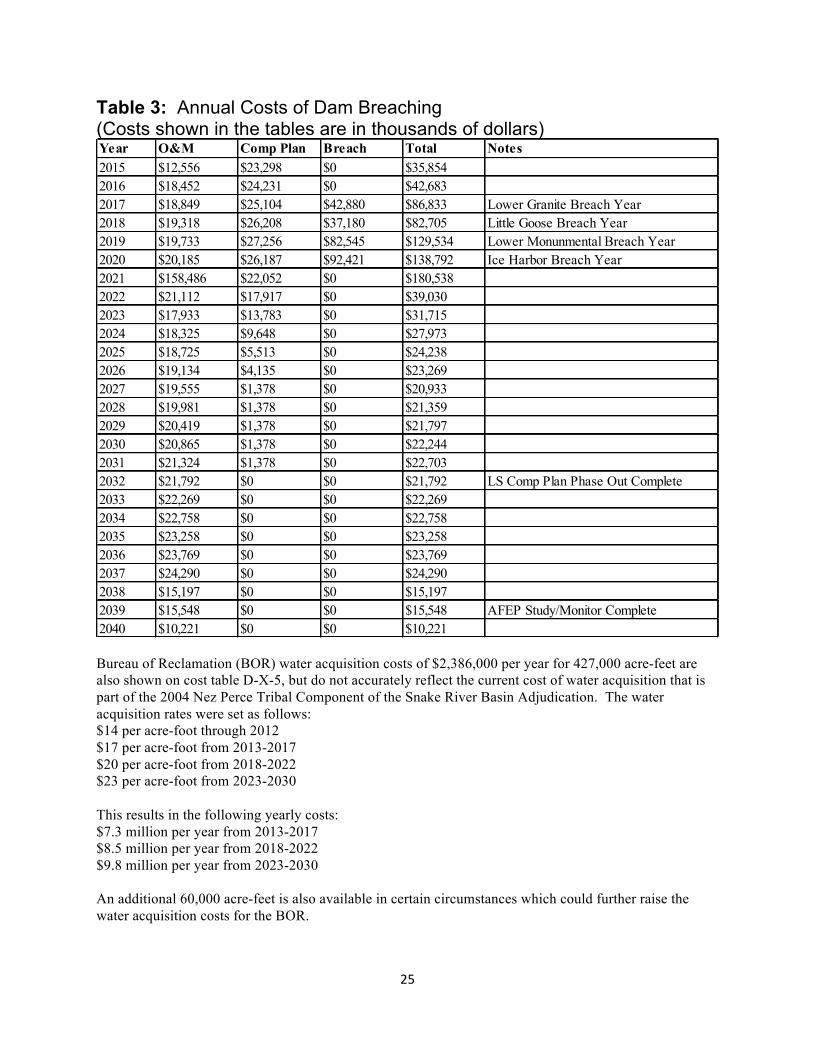
$25 million per year for the “Comp Plan” hatcheries, instead of the $11.5 million shown in the Annex X spreadsheet, would be phased out. Lyons Ferry hatchery would be closed immediately with breaching, as noted elsewhere. This further lowers the overall cost of breaching. In addition to the Operations, & Maintenance, Repair and Replacement (O&M, R&R) costs for hatcheries, recreation areas were not discussed in Appendix D but are shown in the Annex X spread sheet. However, several adjustments to these cost needed to be made. The Appendix D costs had to be escalated in order to be consistent with the escalation corrections made in the Cost Report of O&M, R&R for keeping the dams. Escalation factors needed to be applied to both sets of numbers in order to fairly compare the costs of Breaching (Alternative 4 in the LSFR) with System Improvements (Alternative 3). Appendix E, Existing Systems Improvements, page E-E-1 states that the O&M, R&R costs are for comparison type cost for “option selecting”. While this is generally acceptable within the context of comparing the nine options for keeping the dams in Appendix E, it is not acceptable when comparing breach and non-breach Alternatives in the Economics Appendix since they have dramatically different out year costs, i.e., very little for breaching compared to keeping the dams. For example, $10 versus $273 million respectively, 15 years after dam breaching. Secondly, downward adjustments were made in some of the monitoring costs as they appeared to be redundant with study costs that include monitoring. Table 3 below shows the annual costs until 2040 which is the point at which only recreational site O&M is ongoing. It must be noted that these cost are displayed separately from the breaching cost tables as they are currently funded from different sources than those that would be applied to breaching. They need to be accounted and discussed as they are fed into the economic analysis. Depending on final disposition of the project lands the funding sources for recreational sites may shift to others, e.g., Washington Department of Natural Resources.
25
Table 3: Annual Costs of Dam Breaching (Costs shown in the tables are in thousands of dollars)
Bureau of Reclamation (BOR) water acquisition costs of $2,386,000 per year for 427,000 acre-feet are also shown on cost table D-X-5, but do not accurately reflect the current cost of water acquisition that is part of the 2004 Nez Perce Tribal Component of the Snake River Basin Adjudication. The water acquisition rates were set as follows: $14 per acre-foot through 2012 $17 per acre-foot from 2013-2017 $20 per acre-foot from 2018-2022 $23 per acre-foot from 2023-2030 This results in the following yearly costs: $7.3 million per year from 2013-2017 $8.5 million per year from 2018-2022 $9.8 million per year from 2023-2030 An additional 60,000 acre-feet is also available in certain circumstances which could further raise the water acquisition costs for the BOR.
Year O&M Comp Plan Breach Total Notes2015 $12,556 $23,298 $0 $35,8542016 $18,452 $24,231 $0 $42,6832017 $18,849 $25,104 $42,880 $86,833 Lower Granite Breach Year2018 $19,318 $26,208 $37,180 $82,705 Little Goose Breach Year2019 $19,733 $27,256 $82,545 $129,534 Lower Monunmental Breach Year2020 $20,185 $26,187 $92,421 $138,792 Ice Harbor Breach Year2021 $158,486 $22,052 $0 $180,5382022 $21,112 $17,917 $0 $39,0302023 $17,933 $13,783 $0 $31,7152024 $18,325 $9,648 $0 $27,9732025 $18,725 $5,513 $0 $24,2382026 $19,134 $4,135 $0 $23,2692027 $19,555 $1,378 $0 $20,9332028 $19,981 $1,378 $0 $21,3592029 $20,419 $1,378 $0 $21,7972030 $20,865 $1,378 $0 $22,2442031 $21,324 $1,378 $0 $22,7032032 $21,792 $0 $0 $21,792 LS Comp Plan Phase Out Complete2033 $22,269 $0 $0 $22,2692034 $22,758 $0 $0 $22,7582035 $23,258 $0 $0 $23,2582036 $23,769 $0 $0 $23,7692037 $24,290 $0 $0 $24,2902038 $15,197 $0 $0 $15,1972039 $15,548 $0 $0 $15,548 AFEP Study/Monitor Complete2040 $10,221 $0 $0 $10,221
26
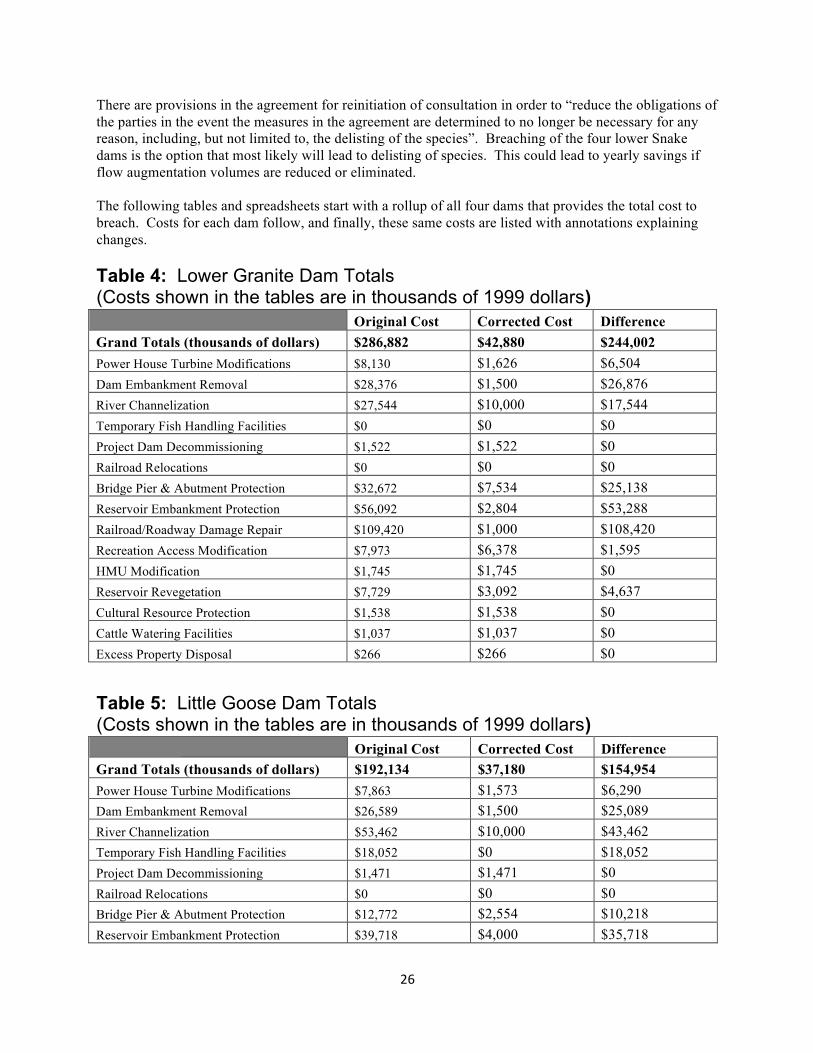
There are provisions in the agreement for reinitiation of consultation in order to “reduce the obligations of the parties in the event the measures in the agreement are determined to no longer be necessary for any reason, including, but not limited to, the delisting of the species”. Breaching of the four lower Snake dams is the option that most likely will lead to delisting of species. This could lead to yearly savings if flow augmentation volumes are reduced or eliminated. The following tables and spreadsheets start with a rollup of all four dams that provides the total cost to breach. Costs for each dam follow, and finally, these same costs are listed with annotations explaining changes. Table 4: Lower Granite Dam Totals (Costs shown in the tables are in thousands of 1999 dollars) Original Cost Corrected Cost Difference Grand Totals (thousands of dollars) $286,882 $42,880 $244,002 Power House Turbine Modifications $8,130 $1,626 $6,504 Dam Embankment Removal $28,376 $1,500 $26,876 River Channelization $27,544 $10,000 $17,544 Temporary Fish Handling Facilities $0 $0 $0 Project Dam Decommissioning $1,522 $1,522 $0 Railroad Relocations $0 $0 $0 Bridge Pier & Abutment Protection $32,672 $7,534 $25,138 Reservoir Embankment Protection $56,092 $2,804 $53,288 Railroad/Roadway Damage Repair $109,420 $1,000 $108,420 Recreation Access Modification $7,973 $6,378 $1,595 HMU Modification $1,745 $1,745 $0 Reservoir Revegetation $7,729 $3,092 $4,637 Cultural Resource Protection $1,538 $1,538 $0 Cattle Watering Facilities $1,037 $1,037 $0 Excess Property Disposal $266 $266 $0
Table 5: Little Goose Dam Totals (Costs shown in the tables are in thousands of 1999 dollars) Original Cost Corrected Cost Difference Grand Totals (thousands of dollars) $192,134 $37,180 $154,954 Power House Turbine Modifications $7,863 $1,573 $6,290 Dam Embankment Removal $26,589 $1,500 $25,089 River Channelization $53,462 $10,000 $43,462 Temporary Fish Handling Facilities $18,052 $0 $18,052 Project Dam Decommissioning $1,471 $1,471 $0 Railroad Relocations $0 $0 $0 Bridge Pier & Abutment Protection $12,772 $2,554 $10,218 Reservoir Embankment Protection $39,718 $4,000 $35,718

27
Drainage Structure Protection $1,789 $1,789 $0 Railroad/Roadway Damage Repair $9,814 $1,000 $8,814 Recreation Access Modification $3,257 $2,606 $651 HMU Modification $2,643 $2,643 $0 Reservoir Revegetation $11,100 $4,440 $6,660 Cultural Resource Protection $1,435 $1,435 $0 Cattle Watering Facilities $1,973 $1,973 $0 Excess Property Disposal $196 $196 $0
Table 6: Lower Monumental Dam Totals (Costs shown in the tables are in thousands of 1999 dollars) Original Cost Corrected Cost Difference Grand Totals (thousands of dollars) $173,021 $82,545 $90,476 Power House Turbine Modifications $7,857 $1,571 $6,286 Dam Embankment Removal $41,441 $30,000 $11,441 River Channelization $31,847 $16,000 $15,847 Temporary Fish Handling Facilities $0 $0 $0 Project Dam Decommissioning $1,539 $1,539 $0 Railroad Relocations $13,921 $16,705 -$2,784 Bridge Pier & Abutment Protection $6,414 $1,283 $5,131 Reservoir Embankment Protection $38,113 $3,811 $34,302 Drainage Structure Protection $2,062 $2,062 $0 Railroad/Roadway Damage Repair $4,753 $500 $4,253 Recreation Access Modification $2,043 $1,634 $409 HMU Modification $2,434 $0 $2,434 Reservoir Revegetation $6,578 $2,631 $3,947 Cultural Resource Protection $1,578 $1,578 $0 Cattle Watering Facilities $2,459 $2,459 $0 Excess Property Disposal $272 $272 $0 Lyons Ferry Hatchery Modifications $9,710 $500 $9,210
Table 7: Ice Harbor Dam Totals (Costs shown in the tables are in thousands of 1999 dollars) Original Cost Corrected Cost Difference Grand Totals (thousands of dollars) $206,902 $92,421 $114,481 Power House Turbine Modifications $7,857 $1,571 $6,286 Dam Embankment Removal $65,524 $50,000 $15,524 River Channelization $35,349 $18,000 $17,349 Temporary Fish Handling Facilities $19,702 $0 $19,702 Project Dam Decommissioning $1,477 $1,477 $0

28
Railroad Relocations $6,261 $2,000 $4,261 Bridge Pier & Abutment Protection $0 $0 $0 Reservoir Embankment Protection $44,892 $4,489 $40,403 Drainage Structure Protection $1,867 $1,867 $0 Railroad/Roadway Damage Repair $6,020 $500 $5,520 Recreation Access Modification $2,470 $1,976 $494 HMU Modification $3,238 $3,238 $0 Reservoir Revegetation $8,237 $3,295 $4,942 Cultural Resource Protection $2,275 $2,275 $0 Cattle Watering Facilities $1,392 $1,392 $0 Excess Property Disposal $341 $341 $0
Table 8:Four Dam Totals (Costs shown in the tables are in thousands of 1999 dollars) Original Cost Corrected Cost Difference Grand Totals (thousands of dollars) $858,939 $255,026 $603,913 Power House Turbine Modifications $31,707 $6,341 $25,366 Dam Embankment Removal $161,930 $83,000 $78,930 River Channelization $148,202 $54,000 $94,202 Temporary Fish Handling Facilities $37,754 $0 $37,754 Project Dam Decommissioning $6,009 $6,009 $0 Railroad Relocations $20,182 $18,705 $1,477 Bridge Pier & Abutment Protection $51,858 $11,371 $40,487 Reservoir Embankment Protection $178,815 $15,104 $163,711 Drainage Structure Protection $8,556 $8,556 $0 Railroad/Roadway Damage Repair $130,007 $3,000 $127,007 Recreation Access Modification $15,743 $12,594 $3,149 HMU Modification $10,060 $7,626 $2,434 Reservoir Revegetation $33,644 $13,458 $20,186 Cultural Resource Protection $6,826 $6,826 $0 Cattle Watering Facilities $6,861 $6,861 $0 Excess Property Disposal $1,075 $1,075 $0 Lyons Ferry Hatchery Modifications $9,710 $500 $9,210 Lower Granite Dam Corrected Cost Explanations (Costs shown in the tables are in thousands of 1999 dollars) Power House Turbine Modifications Original Cost: $ 8,130

29
Corrected Cost: $ 1,626 Difference: $ 6,504 The LSFR Appendix D & Annex A assumed low tailwater conditions as the dams were drawn down. This caused air to enter the draft tubes, which in turn caused cavitation around the turbine blades and vibrations, possibly damaging to the structure. By breaching one dam per year, this problem will not exist. Thus, bulkhead modifications to the draft tubes will not be required. The report indicated that three turbines would need to have bladeless runners. Table A1 shows that it is possible to draw down the pool by 80 feet to elevation 653 feet, at which point the plan would be to allow the pool to rise 10 feet. Then the plan would use controlled hydraulic breaching to erode the remaining 30 feet of the earthen embankment. Impacts to turbines could be further minimized by using the spillway to draw down the top 52 feet. However, this plan calls for one turbine to operate throughout the full head range in order to gather data for subsequent drawdown plans. It is assumed that the cooling water system modifications will be required for all 6 turbines. This is conservative since 3 to 4 turbines can handle expected river flows. Costs for placing the emergency closure devices have been maintained, although this may be too conservative, since 2 to 6 turbines may be operated for 14 days or less. At this time no cost breakdowns are available for each work item. However, it is assumed that draft tube modifications and removing turbine blades are 80% of the estimated costs. The LSFR also tried to avoid any damage to the turbines, which is pointless as they have no further use. Dam Embankment Removal Original Cost: $28,376 Corrected Cost: $ 1,500 Difference: $26,876 The LSFR App D & Annex B assumed that the breach would be accomplished by removing the embankment material to an offsite location up to 2 miles away. Given the short duration required to excavate/move the material, a large force of oversized equipment was necessary, working two 10 hour shifts, 6 days a week. This plan provides for a much simpler and cost effective approach. Prior to drawdown on 1 November, the road and other infrastructure will be removed and the riprap on the downstream side of the dam will be pulled down and loaded on barges for possible use as dike material (See River Channelization.) The sand and gravel nature of most of the material is the same or similar to (normal bed material) the 100 million cubic yards deposited at the confluence of the Clearwater and Snake. Embankment removal will begin with two D-8 dozers and one large bucket loader pushing the embankment material over the downstream slope until the earthen berm is lowered to elevation 653', approximately 80'. At this point a controlled hydraulic breach will begin by closing the turbine wicket gates. As the water level rises and flows through the embankment cut, hydraulic erosion will cause a headcut in the embankment to migrate upstream for ~5 hours until it meets the upstream face. Discharges peak at 150,000 cfs for about 15 minutes and drop off to 50,000 cfs (natural river flows) over the next 3 hours as the notch or embankment opening widens. Widening will continue with the higher flows in early spring and will reach a stasis width of 400+ feet with flows of 120,000 cfs, and 700+ feet with flows of 200,000 cfs. Hydraulic modeling shows that notching the embankment will be the most cost effective and predictable method. Dozer costs were derived from COE EP1110 dated 2007. In 2014 a concrete mooring dock was constructed on the downstream side of the embankment. While it could be removed, it likely makes more sense to remove just the decking and let the breach flows undermine the pilings, which can then be removed from the stream bed or left in place to provide salmon resting areas during high flow events. River Channelization Original Cost: $27,544 Corrected Cost: $10,000 Difference: $17,544
30
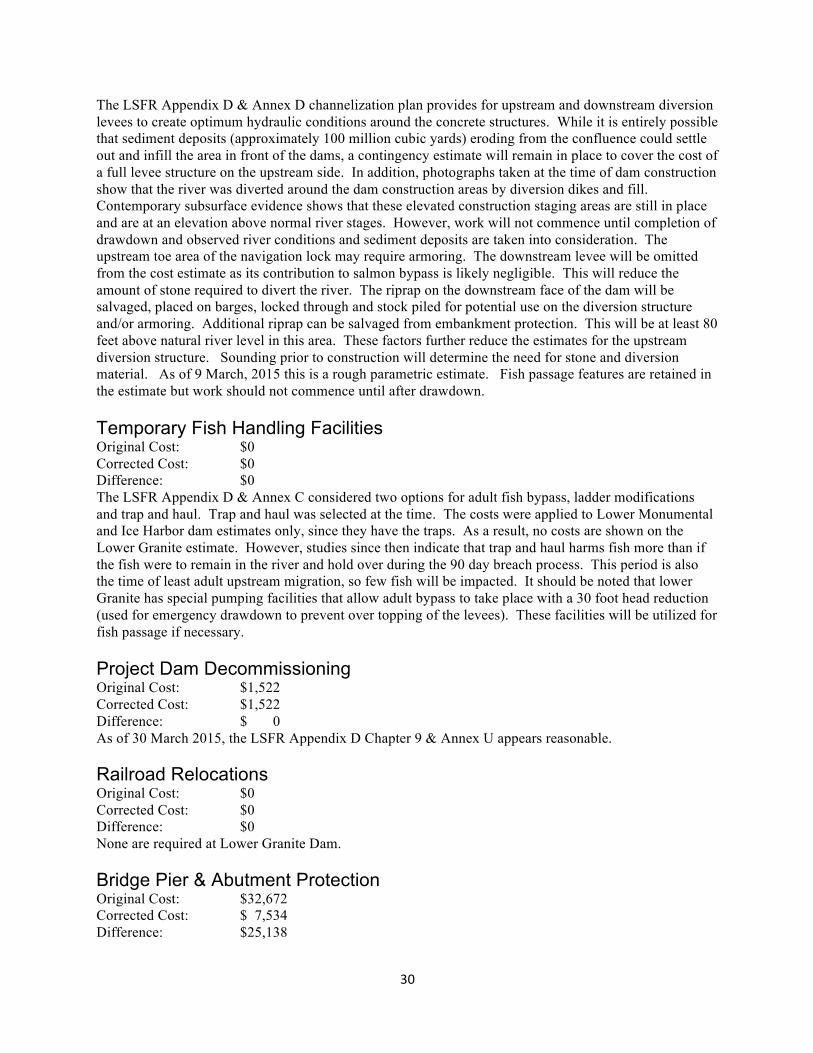
The LSFR Appendix D & Annex D channelization plan provides for upstream and downstream diversion levees to create optimum hydraulic conditions around the concrete structures. While it is entirely possible that sediment deposits (approximately 100 million cubic yards) eroding from the confluence could settle out and infill the area in front of the dams, a contingency estimate will remain in place to cover the cost of a full levee structure on the upstream side. In addition, photographs taken at the time of dam construction show that the river was diverted around the dam construction areas by diversion dikes and fill. Contemporary subsurface evidence shows that these elevated construction staging areas are still in place and are at an elevation above normal river stages. However, work will not commence until completion of drawdown and observed river conditions and sediment deposits are taken into consideration. The upstream toe area of the navigation lock may require armoring. The downstream levee will be omitted from the cost estimate as its contribution to salmon bypass is likely negligible. This will reduce the amount of stone required to divert the river. The riprap on the downstream face of the dam will be salvaged, placed on barges, locked through and stock piled for potential use on the diversion structure and/or armoring. Additional riprap can be salvaged from embankment protection. This will be at least 80 feet above natural river level in this area. These factors further reduce the estimates for the upstream diversion structure. Sounding prior to construction will determine the need for stone and diversion material. As of 9 March, 2015 this is a rough parametric estimate. Fish passage features are retained in the estimate but work should not commence until after drawdown. Temporary Fish Handling Facilities Original Cost: $0 Corrected Cost: $0 Difference: $0 The LSFR Appendix D & Annex C considered two options for adult fish bypass, ladder modifications and trap and haul. Trap and haul was selected at the time. The costs were applied to Lower Monumental and Ice Harbor dam estimates only, since they have the traps. As a result, no costs are shown on the Lower Granite estimate. However, studies since then indicate that trap and haul harms fish more than if the fish were to remain in the river and hold over during the 90 day breach process. This period is also the time of least adult upstream migration, so few fish will be impacted. It should be noted that lower Granite has special pumping facilities that allow adult bypass to take place with a 30 foot head reduction (used for emergency drawdown to prevent over topping of the levees). These facilities will be utilized for fish passage if necessary. Project Dam Decommissioning Original Cost: $1,522 Corrected Cost: $1,522 Difference: $ 0 As of 30 March 2015, the LSFR Appendix D Chapter 9 & Annex U appears reasonable. Railroad Relocations Original Cost: $0 Corrected Cost: $0 Difference: $0 None are required at Lower Granite Dam. Bridge Pier & Abutment Protection Original Cost: $32,672 Corrected Cost: $ 7,534 Difference: $25,138

31
The LSFR Appendix D & Annex E appears to assume that the bridge piers are not adequately protected for a 500 year storm event (SPF) and are currently protected from such events by the pool elevation. However, virtually all of these structures were built prior to reservoir impoundment. Several were new structures to accommodate the reservoir surface elevations. So, just as likely an assumption is that they were properly protected, since the piers would have been exposed to flooding for several years after their erection and prior to filling of the reservoir. It should also be noted that while an SPF of 500 years is used for estimating pier improvements, the NWW PSMP notes that the risk of overtopping the Lewiston levees in the next 50 years would likely be seen by reviewing authorities as marginally acceptable. So, 500 years is exceptionally conservative. Furthermore, in the event of an SPF, river stages would be drawn down rapidly by at least 10 feet, thus possibly exposing some of these piers to significant flow velocities. Pier reinforcement would be required even if the Lower Granite dam were kept in place. Moreover, bridges in the Lewiston areas constructed before 1970 were exposed to significant flow events, and thus are likely to be in acceptable condition. Therefore, much of the LSFR estimate is a worst case contingency cost, or should be a cost born by the current project and will be reduced by 80%. Reservoir Embankment Protection Original Cost: $56,092 Corrected Cost: $ 2,804 Difference: $53,288 The LSFR Appendix D & Annex F assumes significant embankment protection would be required. However, the 1934 survey maps show that the Camas Prairie railroad grade was at elevation 650 feet. This is about 25 feet above the normal river stage. This old railroad grade illustrates that it was maintained for over 50 years at this elevation, in spite of significant high flow events. The railroad embankment can serve as toe protection for much of the current railroad grade that is approximately 100 feet above this. Located on either solid rock or substantially set back (500 feet or greater) on gentler slopes, there are few, if any areas where additional bank protection is needed. In many cases it appears the plans call for protecting an engineered slope, when existing ground slopes and conditions would appear to be the better solution. Also, field inspections on 22 March 2015 showed that nearly all of the areas to be riprapped have riprap (within the ability to use the Appendix D riprap placement plan page D2-17). After drawdown, this riprap can be pulled down slope, since it will not be needed at the higher elevations, i.e., above Standard Project Flood (SPF) stage. Since no true calculation can be done ahead of time, it will be assumed that 95% of this cost can be saved and the remaining 5% is really a contingency to move existing riprap down slope or to other areas. More detailed review of the topographic maps and flood stages in the natural river should be done to verify this. It should also be noted that the LSFR uses a 100 year SPF to estimate flood stage elevations but the protection offered in the NWW PSMP appears to be 50 years under current sediment conditions. Given this and the 6 inches per HOUR drawdown rate used during a flood fight, significant damage would occur with the existing dams. This brings in the question of charging this cost to a breach plan, instead of the costs of keeping the dams. Until this issue is resolved, the corrections noted will be used in the breach estimate. The cost element is assumed to be the same as Railroad & Highway Embankment protection terminology used in the main body of Appendix D. Drainage Structure Protection Original Cost: $2,838 Corrected Cost: $2,838 Difference: $ 0 As of 30 March 2015, the cost appears reasonable although. Without the work breakdown (wbs), better review is difficult. Railroad/Roadway Damage Repair Original Cost: $109,420

32
Corrected Cost: $ 1,000 Difference: $108,420 The LSFR Appendix D & Annex H assumed a drawdown rate of 2 feet per day, and called this a rapid drawdown. The reasoning for this, while not clearly stated, appears to be an attempt to maintain navigation and hydro generation for as long as possible for economic reasons. Its source could be the 1992 Drawdown Test in which 2 feet per day was used as a compromise between causing damage to the embankments and having an unacceptably long test period. However, corrected economic analysis shows a loss in benefits by keeping the dams in place. The 2 feet per day rate used in the 1992 Drawdown Test resulted in some cracked roads and minor misalignment of the railroad grade. The actual repair cost of this damage is $639,000 in 1999 dollars. The report also implies that the drawdown occur during the “fish window”. The corrected drawdown plan will use 6 inches per day rate to minimize any damage for the first 5 feet, then 1 to 1.5 feet per day until spillway crest elevation, and then 2 feet per day until the hydraulic breach begins 65 feet below normal pool. This should significantly reduce slope failure caused by excessive hydrostatic pressure that occurs during a rapid drawdown. It should also be noted that during the SPF, the Lower Granite Operations Manual shows emergency drawn down at 6 inches per HOUR. At this rate significant failures will occur and thus these costs are applicable to the current condition as well. The basis for such a high NWW estimate is unclear, except that it assumes all areas could possibly fail. This however is an extreme case and does not reflect what actually happened in the drawdown test. The actual repair costs in 1992, escalated to 2015, plus some contingency will be used to round this cost up to $1,000,000. Recreation Access Modification Original Cost: $7,973 Corrected Cost: $6,378 Difference: $1,595 While the assumptions made in the LSFR App D Annex M about the scope and type of modifications appear to be reasonable, a revised estimate is not possible since the units given in Table M-1 are unknown as of 30 March, 2015. This is another example of missing or poorly displayed information in the LSFR that makes it difficult to understand the basis of the cost and thus come to conclusions about the validity of the costs. Until the work breakdown structure can be obtained, takeoffs would be speculative. However, given overestimates of costs in other categories, a 20% reduction will be applied. HMU Modification Original Cost: $1,745 Corrected Cost: $1,745 Difference: $ 0 The LSFR assumes that the HMU would remain until the newly exposed riparian habitat areas return. Given the fact that the original riparian areas were and will be of greater quality than the HMU's that will be left well above the river/riparian corridor, it makes more sense to invest funds into plantings and other modifications. It is hard to image that wildlife will want to use the higher elevation areas when the historically used low level river/riparian area is available. Costs shown will remain until a better takeoff estimate can be prepared along with Reservoir Revegetation below, at which time this item will be reduced to cover only the costs to close down activities that will require ongoing Operations/Maintenance expenditures. In summary, active Corps management of these HMU's should cease and effort/funds applied to riparian restoration. Reservoir Revegetation Original Cost: $7,729 Corrected Cost: $3,092 Difference: $4,637

33
Because the LSFR Appendix D & Annex K report assumed a drawdown rate of 2 feet per day and two dams breached per year, massive exposed areas would need to be revegetated at a high rate. To do this, helicopters were to be utilized. Helicopters are expensive compared to truck mounted rigs on roads, or even rigs loaded on a shallow draft water craft. Reducing the initial drawdown rate to 12 inches per day allows for these more conventional and cheaper means to be employed. As of 9 March, 2015 a reduction of 60% will be applied until a takeoff estimate can be prepared. Cultural Resource Protection Original Cost: $1,538 Corrected Cost: $1,538 Difference: $ 0 As of 30 March, 2015 the scope of work seems reasonable and, although takeoffs have not been done, the overall cost appears reasonable even with the 100% contingency applied to this work item. However, savings are possible with the much slower drawdown rate (6 to 12 inches versus 2 feet per day) and the fact that only one reservoir will be drawn down per year. This should reduce the amount of labor required to do the initial site screening. This critical first look at the 136 known sites must be done quickly. Given the far lower rate of surface area exposed each day, the level of effort will be much less and potentially within the scope of existing in-house tribal personnel, who would be reimbursed accordingly. This is likely a preferred approach, as opposed to the LSFR App D & Annex N approach of hiring a contractor who would need to bring in a substantial number of outside personnel. Cattle Watering Facilities Original Cost: $1,037 Corrected Cost: $1,037 Difference: $ 0 As of 30 March, 2015 the Annex L estimates are assumed to be reasonable. However, savings are likely as the solar powered well pumps were priced when this technology was far more expensive than it is today. Excess Property Disposal Original Cost: $266 Corrected Cost: $266 Difference: $ 0 As of 30 March, 2015 costs appear reasonable but, given their low dollar impact, have not been carefully reviewed. Little Goose Dam Corrected Cost Explanations (Costs shown in the tables are in thousands of 1999 dollars) Power House Turbine Modifications Original Cost: $7,863 Corrected Cost: $1,573 Difference: $6,290 The LSFR Appendix D & Annex A assumed low tailwater conditions as the dams were drawn down. This caused air to enter the draft tubes, which in turn caused cavitation around the turbine blades and vibrations, possibly damaging to the structure. By breaching one dam a year this problem will not exist. As a result, bulkhead modifications to the draft tubes will not be required. The report indicated that three turbines would need to have bladeless runners. Table A1 shows that it is possible to draw down the pool
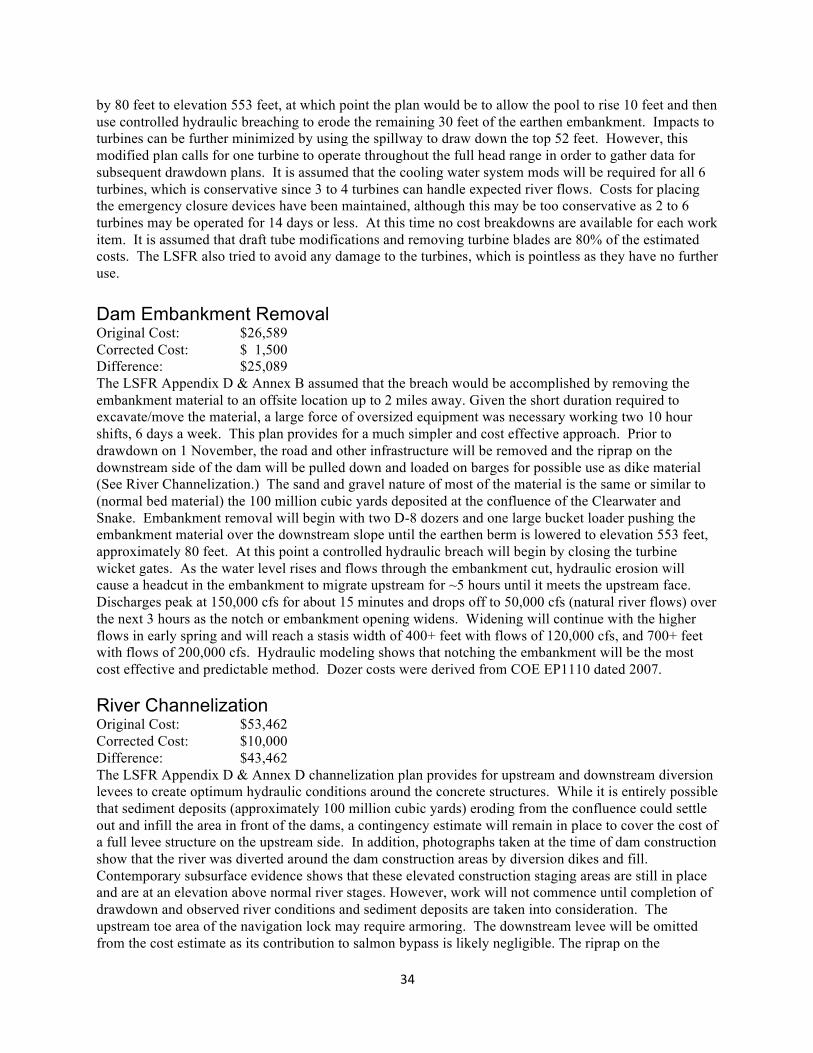
34
by 80 feet to elevation 553 feet, at which point the plan would be to allow the pool to rise 10 feet and then use controlled hydraulic breaching to erode the remaining 30 feet of the earthen embankment. Impacts to turbines can be further minimized by using the spillway to draw down the top 52 feet. However, this modified plan calls for one turbine to operate throughout the full head range in order to gather data for subsequent drawdown plans. It is assumed that the cooling water system mods will be required for all 6 turbines, which is conservative since 3 to 4 turbines can handle expected river flows. Costs for placing the emergency closure devices have been maintained, although this may be too conservative as 2 to 6 turbines may be operated for 14 days or less. At this time no cost breakdowns are available for each work item. It is assumed that draft tube modifications and removing turbine blades are 80% of the estimated costs. The LSFR also tried to avoid any damage to the turbines, which is pointless as they have no further use. Dam Embankment Removal Original Cost: $26,589 Corrected Cost: $ 1,500 Difference: $25,089 The LSFR Appendix D & Annex B assumed that the breach would be accomplished by removing the embankment material to an offsite location up to 2 miles away. Given the short duration required to excavate/move the material, a large force of oversized equipment was necessary working two 10 hour shifts, 6 days a week. This plan provides for a much simpler and cost effective approach. Prior to drawdown on 1 November, the road and other infrastructure will be removed and the riprap on the downstream side of the dam will be pulled down and loaded on barges for possible use as dike material (See River Channelization.) The sand and gravel nature of most of the material is the same or similar to (normal bed material) the 100 million cubic yards deposited at the confluence of the Clearwater and Snake. Embankment removal will begin with two D-8 dozers and one large bucket loader pushing the embankment material over the downstream slope until the earthen berm is lowered to elevation 553 feet, approximately 80 feet. At this point a controlled hydraulic breach will begin by closing the turbine wicket gates. As the water level rises and flows through the embankment cut, hydraulic erosion will cause a headcut in the embankment to migrate upstream for ~5 hours until it meets the upstream face. Discharges peak at 150,000 cfs for about 15 minutes and drops off to 50,000 cfs (natural river flows) over the next 3 hours as the notch or embankment opening widens. Widening will continue with the higher flows in early spring and will reach a stasis width of 400+ feet with flows of 120,000 cfs, and 700+ feet with flows of 200,000 cfs. Hydraulic modeling shows that notching the embankment will be the most cost effective and predictable method. Dozer costs were derived from COE EP1110 dated 2007. River Channelization Original Cost: $53,462 Corrected Cost: $10,000 Difference: $43,462 The LSFR Appendix D & Annex D channelization plan provides for upstream and downstream diversion levees to create optimum hydraulic conditions around the concrete structures. While it is entirely possible that sediment deposits (approximately 100 million cubic yards) eroding from the confluence could settle out and infill the area in front of the dams, a contingency estimate will remain in place to cover the cost of a full levee structure on the upstream side. In addition, photographs taken at the time of dam construction show that the river was diverted around the dam construction areas by diversion dikes and fill. Contemporary subsurface evidence shows that these elevated construction staging areas are still in place and are at an elevation above normal river stages. However, work will not commence until completion of drawdown and observed river conditions and sediment deposits are taken into consideration. The upstream toe area of the navigation lock may require armoring. The downstream levee will be omitted from the cost estimate as its contribution to salmon bypass is likely negligible. The riprap on the

35
downstream face of the dam will be salvaged, placed on barges, locked through and stock piled for potential use on the diversion structure and/or armoring. These factors further reduce the estimates for the upstream diversion structure. Sounding prior to construction will determine the need for stone and diversion material. Fish passage features are retained in the estimate, but work should not commence until after drawdown. As of 9 March, 2015 this is a rough parametric estimate. Temporary Fish Handling Facilities Original Cost: $18,052 Corrected Cost: $ 0 Difference $18,052 The LSFR Appendix D & Annex C considered two options for adult fish bypass, ladder modifications and trap and haul. Trap and haul was selected at the time. However, studies since then indicate that trap and haul harms fish more than if the fish were to remain in the river and hold over during the 90 day breach process. This period is also the time of least adult upstream migration, so few fish will be impacted. Project Dam Decommissioning Original Cost: $1,471 Corrected Cost: $1,471 Difference: $ 0 As of 30 March, 2015, the LSFR Appendix D Chapter 9 & Annex U appear reasonable. Railroad Relocations Original Cost: $0 Corrected Cost: $0 Difference: $0 None are required at Little Goose Dam. Bridge Pier & Abutment Protection Original Cost: $12,772 Corrected Cost: $ 2,554 Difference: $10,218 The LSFR Appendix D & Annex E appears to assume that the bridge piers are not adequately protected for a 500 year storm event (SPF) and are currently protected from such events by the pool elevation. However, virtually all of these structures were built prior to reservoir impoundment. Several were new structures to accommodate the reservoir surface elevations. So, just as likely an assumption is that they were properly protected, since the piers would have been exposed to flooding for several years after their erection and prior to filling the reservoir. It should also be noted that while an SPF of 500 years is used for estimating pier improvements, the NWW PSMP notes that the risk of overtopping the Lewiston levees in the next 50 years would likely be seen by reviewing authorities as marginally acceptable. So 500 years is exceptionally conservative. Therefore, much of the LSFR estimate is a worst case contingency cost, or should be a cost born by the current project and will be reduced by 80%. Reservoir Embankment Protection Original Cost: $39,718 Corrected Cost: $ 4,000 Difference: $35,718

36
Based on overestimates on Lower Granite Dam by about 90%, a similar figure to Lower Granite Dam will be used here, until a more detailed review of the 1934 survey can be made to determine areas that may need further protection. Drainage Structure Protection Original Cost: $1,789 Corrected Cost: $1,789 Difference: $ 0 As of 30 March, 2015, the cost appears reasonable although without WBS, better review is difficult. Railroad/Roadway Damage Repair Original Cost: $9,814 Corrected Cost: $1,000 Difference: $8,814 The LSFR Appendix D & Annex H assumed a drawdown rate of 2 feet per day, and called this a rapid drawdown. The reasoning for this, while not clearly stated, appears to be an attempt to maintain navigation and hydro generation for as long as possible for economic reasons. Its source could be the 1992 drawdown test in which 2 feet per day was used as a compromise between causing damage to the embankments and having an unacceptably long test period. However, corrected economic analysis shows a loss in benefits by keeping the dams in place. The 2 feet per day rate used in the 1992 drawdown test resulted in some cracked roads and minor misalignment of the railroad grade. The actual repair cost of this damage was $639,000 in 1999 dollars. The report also implies that the drawdown occur during the fish window. The corrected drawdown plan will use a 6 inches per day rate to minimize any damage for the first 5 feet, then 1 to 1.5 feet per day until spillway crest elevation, and then 2 feet per day until the hydraulic breach begins 65 feet below normal pool. This should significantly reduce slope failure caused by excessive hydrostatic pressure that occurs during a rapid drawdown. The basis for such a high NWW estimate is unclear, except that it assumes all areas that could possibly fail will fail. This however is an extreme case and does not reflect what actually happened in the drawdown test. Given the actual repair costs in 1992 at Lower Granite versus the vast overestimate in the report, a contingency estimate of $1,000,000 will be used until further road surveys are conducted. (See Lower Granite Dam comments.) Recreation Access Modification Original Cost: $3,257 Corrected Cost: $2,606 Difference: $ 651 While the assumptions made in the LSFR Appendix D Annex M about the scope and type of modifications appear to be reasonable, a revised estimate is not possible, since the units given in Table M-1 are unknown as of 30 March, 2015. This is another example of missing or poorly displayed information in the LSFR that makes it difficult to understand the basis of the cost, and thus, come to conclusions about the validity of the costs. Until the work break down structure can be obtained, takeoffs would be speculative. However, given overestimates of costs in other categories, a 20% reduction will be applied. HMU Modification Original Cost: $2,643 Corrected Cost: $2,643 Difference: $ 0 The LSFR assumes that the HMU would remain until the newly exposed riparian habitat areas return. Given the fact that the original riparian areas were and will be of greater quality than the HMU's that will be left well above the river/riparian corridor, it makes more since to invest funds into plantings and other
37
modifications. It is hard to image that wildlife will want to use the higher elevation areas when the low level river/riparian area is available. Costs shown will remain until a better takeoff estimate can be prepared along with Reservoir Revegetation below, at which time this item will be reduced to cover only the costs to close down activities that will require ongoing Operations/Maintenance expenditures. In other words, active Corps management of these HMU's should cease. Reservoir Revegetation Original Cost: $11,100 Corrected Cost: $ 4,440 Difference: $ 6,660 Because the LSFR Appendix D & Annex K report assumed a drawdown rate of 2 feet per day and two dams breached per year, massive exposed areas would need to be revegetated at a high rate. To do this, helicopters were to be utilized. Helicopters are expensive compared to truck mounted rigs on roads or even rigs loaded on a shallow draft water craft. Reducing the initial drawdown rate to no more than 12 inches per day allows for more conventional and cheaper means to be employed. As of 9 March, 2015 a reduction of 60% will be applied, until a takeoff estimate can be prepared. Cultural Resource Protection Original Cost: $1,435 Corrected Cost: $1,435 Difference: $ 0 As of 30 March, 2015 the scope of work seems reasonable and, although takeoffs have not been done, the overall cost appears reasonable even with the 100% contingency applied to this work item. However, savings are possible with the much slower drawdown rate (6 to 12 inches versus 2 feet per day) and the fact that only one reservoir will be drawn down per year. This should reduce the amount of labor required to do the initial site screening. This critical first look at the 76 known sites must be done quickly. Given the far lower rate of surface area exposed each day, the level of effort will be much less and potentially within the scope of existing in-house tribal personnel, who would be reimbursed accordingly. This is likely a preferred approach as opposed to the LSFR Appendix D & Annex N approach of hiring a contractor who would need to bring in a substantial number of outside personnel. Cattle Watering Facilities Original Cost: $1,973 Corrected Cost: $1,973 Difference: $ 0 As of 30 March, 2015 the Annex L estimates are assumed to be reasonable. However, savings are likely as the solar powered well pumps were priced when this technology was far more expensive than it is today. Excess Property Disposal Original Cost: $196 Corrected Cost: $196 Difference: $ 0 As of 30 March, 2015 costs appear reasonable but, given their low dollar impact, have not been carefully reviewed.

38
Lower Monumental Dam Corrected Cost Explanations (Costs shown in the tables are in thousands of 1999 dollars) Power House Turbine Modifications Original Cost: $7,857 Corrected Cost: $1,571 Difference: $6,286 The LSFR Appendix D & Annex A assumed low tailwater conditions as the dams were drawn down, which caused air to enter the draft tubes. This caused cavitation around the turbine blades and vibrations, possibly damaging to the structure. By breaching one dam a year this problem will not exist. Thus, bulkhead modifications to the draft tubes will not be required. The report indicated that three turbines would need to have bladeless runners. Table A1 shows that it is possible to draw down the pool by 80 feet to elevation 459 feet, at which point the plan would be to allow the pool to rise 10 feet and then use controlled hydraulic breaching to erode the remaining 30 feet of the earthen embankment. Impacts to turbines can be minimized further by using the spillway to draw down the top 52 feet. However, this modified plan calls for one turbine to operate throughout the full head range in order to gather data for subsequent drawdown plans. It is assumed that the cooling water system modifications will be required for all 6 turbines. This is conservative since 3 to 4 turbines can handle expected river flows. Costs for placing the emergency closure devices have been maintained, although this may be too conservative as 2 to 6 of the turbines may be operated for 14 days or less. At this time no cost breakdowns are available for each work item. It is assumed that draft tube modifications and removing turbine blades are 80% of the estimated costs. The LSFR also tried to avoid any damage to the turbines, which is pointless as they have no further use. Dam Embankment Removal Original Cost: $41,441 Corrected Cost: $30,000 Difference: $11,441 The LSFR App D & Annex B assumed that the breach would be accomplished by removing the embankment material to an off site location up to 2 miles away. Given the short duration required to excavate/move the material, a large force of oversized equipment was necessary, working two 10 hour shifts, 6 days a week. This modified plan provides for a much simpler and cost effective approach. Prior to drawdown on 1 November, the road and other infrastructure will be removed and the riprap on the downstream side of the dam will be pulled down and loaded on barges for possible use as dike material (See River Channelization.) Abutment material downstream of the embankment will be removed to near natural river elevations to facilitate quicker channel widening. Material will be placed in a stockpile area. The sand and gravel nature of most of the material is the same or similar to (normal bed material) the 100 million cubic yards deposited at the confluence of the Clearwater and Snake. Embankment removal will begin with two D-8 dozers and one large bucket loader pushing the embankment material over the down stream slope until the earthen berm is lowered to elevation 459 feet, approximately 80 feet. At this point a controlled hydraulic breach will begin by closing the turbine wicket gates. As the water level rises and flows through the embankment cut, hydraulic erosion will cause a headcut in the embankment to migrate upstream for ~5 hours until it meets the upstream face. Discharges peak at 150,000 cfs for about 15 minutes and drop off to 50,000 cfs (natural river flows) over the next 3 hours as the notch or embankment opening widens and cuts into the earthen abutment. Widening will continue with the higher flows in early spring and will reach a stasis width of 400+ feet with flows of 120,000 cfs, and 700+ feet with flows of 200,000 cfs. Hydraulic modeling shows that notching the embankment will be the most cost effective and predictable method. Dozer costs were derived from COE EP1110 dated 2007. Ten million dollars of
39
this is considered a contingency, in case the abutment material on the upstream side of the embankment is determined to be unerodible. River Channelization Original Cost: $31,847 Corrected Cost: $16,000 Difference: $15,847 The LSFR Appendix D & Annex D channelization plan provides for upstream and downstream diversion levees to create optimum hydraulic conditions around the concrete structures. While it is entirely possible that sediment deposits (approx 100 million cubic yards) eroding from the confluence could settle out and infill the area in front of the dams, a contingency estimate will remain in place to cover the cost of a full levee structure on the upstream side. However, this work will not commence until completion of drawdown and observed river conditions and sediment deposits are taken into consideration. The upstream toe area of the navigation lock may require armoring. The downstream levee will be omitted from the cost estimate as its contribution to salmon bypass is likely negligible. Fish passage features are retained in the estimate, but work should not commence until after drawdown. As of 9 March, 2015 this is a rough parametric estimate. A takeoff estimate using known yardages and production rates needs to be done. Temporary Fish Handling Facilities Original Cost: $0 Corrected Cost: $0 Difference: $0 The LSFR Appendix D & Annex C considered two options for adult fish bypass, ladder modifications and trap and haul. Trap and haul was selected at the time. However, studies since then indicate that trap and haul harms fish more than if the fish were to remain in the river and hold over during the 90 day breach process. This period is also the time of least adult upstream migration, so few fish will be impacted. Project Dam Decommissioning Original Cost: $1,539 Corrected Cost: $1,539 Difference: $ 0 As of 30 March, 2015 the LSFR Appendix D Chapter 9 & Annex U appear reasonable. Railroad Relocations Original Cost: $13,921 Corrected Cost: $16,705 Difference: $-2,784 The LSFR Appendix D Chapter 9 & Annex U appears to be 20% low given the rock embankment into which the relocation must push. Bridge Pier & Abutment Protection Original Cost: $6,414 Corrected Cost: $1,283 Difference: $5,131 The LSFR Appendix D & Annex E appears to assume that the bridge piers are not adequately protected for a 500 year storm event (SPF) and are currently protected from such events by the pool elevation. However, virtually all of these structures were built prior to reservoir impoundment. Several were new

40
structures to accommodate the reservoir surface elevations. So, just as likely an assumption is that they were properly protected as the piers would have been exposed to flooding for several years after their erection and prior to filling of the reservoir. It should also be noted that while an SPF of 500 years is used for estimating pier improvements, the NWW PSMP notes that the risk of overtopping the Lewiston levees in the next 50 years would likely be seen by reviewing authorities as marginally acceptable. So 500 years is exceptionally conservative. Therefore, much of the LSFR estimate is a worst case contingency cost or should be a cost born by the current project and will be reduced by 80%. Reservoir Embankment Protection Original Cost: $38,113 Corrected Cost: $ 3,811 Difference: $34,302 Based on overestimates on Lower Granite Dam by about 90%, a similar figure will be used here until a more detailed review of the 1934 survey can be made to determine areas that may need further protection. Drainage Structure Protection Original Cost: $2,062 Corrected Cost: $2,062 Difference: $ 0 As of 30 March, 2015 this cost appears reasonable, although without WBS better review is difficult. Railroad/Roadway Damage Repair Original Cost: $4,753 Corrected Cost: $ 500 Difference: $4,253 The LSFR Appendix D & Annex H assumed a drawdown rate of 2 feet per day, and called this a rapid drawdown. The reasoning for this, while not clearly stated, appears to be an attempt to maintain navigation and hydro generation for as long as possible for economic reasons. Its source could be the 1992 drawdown test in which 2 feet per day was used as a compromise between causing damage to the embankments and having an unacceptably long test period. However, corrected economic analysis shows a loss in benefits by keeping the dams in place. The 2 feet per day rate used in the 1992 drawdown test resulted in some cracked roads and minor misalignment of the railroad grade. The actual repair costs of this damage was $639,000 in 1999 dollars. The report also implies that the drawdown occur during the fish window. The corrected drawdown plan will use 6 inches per day rate to minimize any damage for the first 5 feet, then 1 to 1.5 feet per day until spillway crest elevation, and then 2 feet per day until the hydraulic breach begins 65 feet below normal pool. This should significantly reduce slope failure caused by excessive hydrostatic pressure that occurs during a rapid drawdown. The basis for a high NWW estimate is unclear except that it assumes all areas that possibly could fail will fail. This however is an extreme case and does not reflect what actually happened in the drawdown test. Given the actual repair costs in 1992 at Lower Granite versus the vast overestimate in the report, a contingency estimate of $500,000 will be used until further road surveys are conducted. (See Lower Granite Dam comments.) Recreation Access Modification Original Cost: $2,043 Corrected Cost: $1,634 Difference: $ 409 While the assumptions made in the LSFR Appendix D Annex M about the scope and type of modifications appear to be reasonable, a revised estimate is not possible, since the units given in Table M-1 are unknown as of 30 March 2015. This is another example of missing or poorly displayed information in the LSFR that makes it difficult to understand the basis of the cost and thus come to conclusions about

41
the validity of the costs. Until the work breakdown structure can be obtained, takeoffs would be speculative. However, given overestimates of costs in other categories, a 20% reduction will be applied. HMU Modification Original Cost: $2,434 Corrected Cost: $ 0 Difference: $2,434 The LSFR assumes that the HMU would remain until the newly exposed riparian habitat areas return. Given the fact that the original riparian areas were and will be of greater quality than the HMU's that will be left well above the river/riparian corridor, it makes more sense to invest the funds into plantings and other modifications. It is hard to image that wildlife will want to use the higher elevation areas when the low level river/riparian area is available. Costs shown will remain until a better takeoff estimate can be prepared along with Reservoir Revegetation below, at which time this item will be reduced to cover only the costs to close down activities that will require ongoing Operations/Maintenance expenditures. In summary, active Corps management of these HMU's should cease. Reservoir Revegetation Original Cost: $6,578 Corrected Cost: $2,631 Difference: $3,947 Because the LSFR Appendix D & Annex K report assumed a drawdown rate of 2 feet per day and two dams breached per year, massive exposed areas would need to be revegetated at a high rate. To do this, helicopters were to be utilized. Helicopters are expensive compared to truck mounted rigs on roads or even rigs loaded on a shallow draft water craft. Reducing the initial drawdown rate to no more than 12 inches per day allows for these more conventional and cheaper means to be employed. As of 9 March, 2015 a reduction of 60% will be applied until a takeoff estimate can be prepared. Cultural Resource Protection Original Cost: $1,578 Corrected Cost: $1,578 Difference: $ 0 As of 30 March, 2015 the scope of work seems reasonable, and although takeoffs have not been done, the overall cost appears reasonable even with the 100% contingency applied to this work item. However, savings are possible with the much slower drawdown rate (6 to 12 inches versus 2 feet per day), and the fact that only one reservoir will be drawn down per year. This should reduce the amount of labor required to do the initial site screening. This critical first look at the 103 known sites must be done quickly. Given the far lower rate of surface area exposed each day, the level of effort will be much less and potentially within the scope of existing in-house tribal personnel, who would be reimbursed accordingly. This is likely a preferred approach as opposed to the LSFR Appendix D & Annex N approach of hiring a contractor who would need to bring in a substantial number of outside personnel. Cattle Watering Facilities Original Cost: $2,459 Corrected Cost: $2,459 Difference: $ 0 As of 30 March, 2015 the Annex L estimates are assumed to be reasonable. However, savings are likely as the solar powered well pumps were priced when this technology was far more expensive than it is today.

42
Excess Property Disposal Original Cost: $272 Corrected Cost: $272 Difference: $ 0 As of 30 March, 2015 costs appear reasonable but, given their low dollar impact, have not been carefully reviewed. Lyons Ferry Hatchery Modifications Original Cost: $9,710 Corrected Cost: $ 500 Difference: $9,210 Recent biological findings concerning the impacts to wild stocks from hatchery stocks indicate that the Lyons Ferry Hatchery and Irrigon should cease operations immediately upon a breach decision.2 A decommissioning charge of $500,000 is included. Ice Harbor Dam Corrected Cost Explanations (Costs shown in the tables are in thousands of 1999 dollars) Power House Turbine Modifications Original Cost: $7,857 Corrected Cost: $1,571 Difference: $6,286 The LSFR Appendix D & Annex A assumed low tailwater conditions as the dams were drawn down. This causes air to enter the draft tubes, which in turn causes cavitation around the turbine blades and vibrations, possibly damaging to the structure. By breaching one dam a year, this problem will not exist. Thus, bulkhead modifications to the draft tubes will not be required. The report indicated that three turbines would need to have bladeless runners. Table A1 shows that it is possible to draw down the pool by 80 feet to elevation 459 feet at which point the plan would be to allow the pool to rise 10 feet and then use controlled hydraulic breaching to erode the remaining 30 feet of the earthen embankment. Impacts to turbines can be further minimized by using the spillway to draw down the top 52 feet. However, this modified plan calls for one turbine to operate throughout the full head range in order to gather data for subsequent drawdown plans. It is assumed that the cooling water system modifications will be required for all 6 turbines, which is conservative since 3 to 4 turbines can handle expected river flows. Costs for placing the emergency closure devices have been maintained, although this may be too conservative as 2 to 6 of the turbines may be operated for 14 days or less. At this time no cost breakdowns are available for each work item. It is assumed that draft tube modifications and removing turbine blades are 80% of the estimated costs. The LSFR also tried to avoid any damage to the turbines, which is pointless as they have no further use.
2. Carl Christianson, Sharon Grace and Jim Waddell, The Case for Breaching the Four Lower Snake River Dams to Recover Wild Snake River Salmon (2015): http://www.damsense.org/wp-content/uploads/2014/12/Report_Snake-Salmon-White-Paper.pdf
43
Dam Embankment Removal Original Cost: $65,524 Corrected Cost: $50,000 Difference: $15,524 Comment: The LSFR Appendix D & Annex B assumed that the breach would be accomplished by removing the embankment material to an off site location up to 2 miles away. Given the short duration required to excavate/move the material, a large force of oversized equipment was necessary, working two 10 hour shifts, 6 days a week. This modified plan provides for a much simpler and cost effective approach. Prior to drawdown on 1 November, the road and other infrastructure will be removed and the riprap on the downstream side of the dam will be pulled down and loaded on barges for possible use as dike material. (See River Channelization.) Abutment material downstream of the embankment will be removed to near natural river elevations to facilitate quicker channel widening. Material will be placed in a stockpile area. The sand and gravel nature of most of the material is the same or similar to (normal bed material) the 100 million cubic yards deposited at the confluence of the Clearwater and Snake. Embankment removal will begin with two D-8 dozers and one large bucket loader pushing the embankment material over the down stream slope until the earthen berm is lowered to elevation 352 feet, approximately 80 feet. At this point a controlled hydraulic breach will begin by closing the turbine wicket gates. As the water level rises and flows through the embankment cut, hydraulic erosion will cause a headcut in the embankment to migrate upstream for ~5 hours until it meets the upstream face. Discharges peak at 150,000 cfs for about 15 minutes and drop off to 50,000 cfs (natural river flows) over the next 3 hours as the notch or embankment opening widens and cuts into the earthen abutment. Widening will continue with the higher flows in early spring and will reach a stasis width of 400+ feet with flows of 120,000 cfs, and 700+ feet with flows of 200,000 cfs. Hydraulic modeling shows that notching the embankment will be the most cost effective and predictable method. Dozer costs were derived from COE EP1110 dated 2007. Ten million dollars of this is considered a contingency, in case the abutment material on the upstream side of the embankment is determined to be unerodible. River Channelization Original Cost: $65,524 Corrected Cost: $50,000 Difference: $15,524 The LSFR Appendix D & Annex D channelization plan provides for upstream and downstream diversion levees to create optimum hydraulic conditions around the concrete structures. While it is entirely possible that sediment deposits (approx 100 million cubic yards) eroding from the confluence could settle out and infill the area in front of the dams, a contingency estimate will remain in place to cover the cost of a full levee structure on the upstream side. However, work will not commence until completion of drawdown and observed river conditions and sediment deposits are taken into consideration. The upstream toe area of the navigation lock may require armoring. The downstream levee will be omitted from the cost estimate as its contribution to salmon bypass is likely negligible. Fish passage features are retained in the estimate, but work should not commence until after drawdown. As of 9 March, 2015 this is a rough parametric estimate. A takeoff estimate using known yardages and production rates needs to be done. Temporary Fish Handling Facilities Original Cost: $19,702 Corrected Cost: $ 0 Difference: $19,702 The LSFR App D & Annex C considered two options for adult fish bypass, ladder modifications and trap and haul. Trap and haul was selected at the time. However, studies since then indicate that trap and haul

44
harms fish more than if the fish were to remain in the river and hold over during the 90 day breach process. This period is also the time of least adult upstream migration, so few fish will be impacted. Project Dam Decommissioning Original Cost: $1,477 Corrected Cost: $1,477 Difference: $ 0 As of 30 March, 2015 the LSFR Appendix D Chapter 9 & Annex U appears reasonable. Railroad Relocations Original Cost: $6,261 Corrected Cost: $2,000 Difference: $4,261 This track has been abandoned and is now a trail. The trail will be less expensive to relocate. Bridge Pier & Abutment Protection Original Cost: $0 Corrected Cost: $0 Difference: $0 Original assumptions appear correct. Reservoir Embankment Protection Original Cost: $44,892 Corrected Cost: $ 4,489 Difference: $40,403 Based on overestimates on Lower Granite Dam by about 90%, a similar figure will be used here until a more detailed review of the 1934 survey can be made to determine areas that may need further protection. Drainage Structure Protection Original Cost: $1,867 Corrected Cost: $1,867 Difference: $ 0 As of 30 March, 2015 the cost appears reasonable, although without WBS, better review is difficult. Railroad/Roadway Damage Repair Original Cost: $6,020 Corrected Cost: $ 500 Difference: $5,520 The LSFR Appendix D & Annex H assumed a drawdown rate of 2 feet per day, and called this a rapid drawdown. The reasoning for this, while not clearly stated, appears to be an attempt to maintain navigation and hydro generation for as long as possible for economic reasons. Its source could be the 1992 drawdown test in which 2 feet per day was used as a compromise between causing damage to the embankments and having an unacceptably long test period. However, corrected economic analysis shows a loss in benefits by keeping the dams in place. The 2 feet per day rate used in the 1992 drawdown test resulted in some cracked roads and minor misalignment of the railroad grade. The actual repair costs of this damage was $639,000 in 1999 dollars. The report also implies that the drawdown occur during the fish window. The corrected drawdown plan will use 6 inches per day rate to minimize any damage for the first 5 feet, then 1 to 1.5 feet per day until spillway crest elevation, and then 2 feet per day until the hydraulic breach begins 65 feet below normal pool. This should significantly reduce slope failure caused

45
by excessive hydrostatic pressure that occurs during a rapid drawdown. The basis for a high NWW estimate is unclear, except that it assumes all areas that possibly could fail will fail. This however is an extreme case and does not reflect what actually happened in the Drawdown test. Given the actual repair costs in 1992 at Lower Granite versus the vast overestimate in the report, a contingency estimate of $500,000 will be used until further road surveys are conducted. (See Lower Granite Dam comments.) Recreation Access Modification Original Cost: $2,470 Corrected Cost: $1,976 Difference: $ 494 While the assumptions made in the LSFR Appendix D Annex M about the scope and type of modifications appear to be reasonable, a revised estimate is not possible since the units given in Table M-1 are unknown as of 30 March, 2015. This is another example of missing or poorly displayed information in the LSFR that makes it difficult to understand the basis of the cost and thus come to conclusions about the validity of the costs. Until the work breakdown structure can be obtained, takeoffs would be speculative. However, given overestimates of costs in other categories, a 20% reduction will be applied. HMU Modification Original Cost: $3,238 Corrected Cost: $3,238 Difference: $ 0 The LSFR assumes that the HMU would remain until the newly exposed riparian habitat areas return. Given the fact that the original riparian areas were and will be of greater quality than the HMU's that will be left well above the river/riparian corridor, it makes more sense to invest the funds into plantings and other modifications. It is hard to image that wildlife will want to use the higher elevation areas when the low level river/riparian area is available. Costs shown will remain until a better takeoff estimate can be prepared along with Reservoir Revegetation below, at which time this item will be reduced to cover only the costs to close down activities that will require ongoing Operations/Maintenance expenditures. In summary, active Corps management of these HMU's should cease. Reservoir Revegetation Original Cost: $8,237 Corrected Cost: $3,295 Difference: $4,942 Because the LSFR Appendix D & Annex K report assumed a drawdown rate of 2 feet per day and two dams breached per year, massive exposed areas would need to be revegetated at a high rate. To do this, helicopters were to be utilized. Helicopters are expensive compared to truck mounted rigs on roads or even rigs loaded on a shallow draft water craft. Reducing the drawdown rate to no more than 12 inches per day allows more conventional and cheaper means to be employed. As of 9 March, 2015 a reduction of 60% will be applied until a takeoff estimate can be prepared. Cultural Resource Protection Original Cost: $2,275 Corrected Cost: $2,275 Difference: $ 0 As of 30 March, 2015 the scope of work seems reasonable and, although takeoffs have not been done, the overall cost appears reasonable even with the 100% contingency applied to this work item. However, savings are possible with the much slower drawdown rate (6 to 12 inches versus 2 feet per day) and the fact that only one reservoir will be drawn down per year. This should reduce the amount of labor required
46
to do the initial site screening. This critical first look at the 57 known sites must be done quickly. Given the far lower rate of surface area exposed each day, the level of effort will be much less and potentially within the scope of existing in-house tribal personnel, who would be reimbursed accordingly. This is likely a preferred approach as opposed to the LSFR Appendix D & Annex N approach of hiring a contractor who would need to bring in a substantial number of outside personnel. Cattle Watering Facilities Original Cost: $1,392 Corrected Cost: $1,392 Difference: $ 0 As of 30 March, 2015 the Annex L estimates are assumed to be reasonable. However savings are likely as the solar powered well pumps were priced when this technology was far more expensive than it is today. Excess Property Disposal As of 30 March, 2015 the costs appear reasonable but, given their low dollar impact, have not been carefully reviewed.