Embed Size (px)
Citation preview
Appendix E
ECONOMICS


US Army Corps
Of Engineers New Orleans District
ECONOMIC REPORT CALCASIEU RIVER AND PASS, LOUISIANA DREDGED MATERIAL MANAGEMENT PLAN PHASE II
September 2010


September 2010
ECONOMIC REPORT
CALCASIEU RIVER AND PASS, LOUISIANA DREDGED MATERIAL MANAGEMENT PLAN
PHASE II
GEC Project No. 27585101
Prepared for
U.S. Army Corps of Engineers New Orleans District
New Orleans, Louisiana
Prepared by
Environmental Resources 9357 Interline Avenue
Baton Rouge, Louisiana 225/612-3000


TABLE OF CONTENTS


TABLE OF CONTENTS Section Page 1.0 INTRODUCTION .......................................................................................................... 1 2.0 DETERMINE ECONOMIC STUDY AREA .................................................................... 1 3.0 DATA COLLECTION .................................................................................................... 1 4.0 IDENTIFY COMMODITY TYPES AND FLOWS ........................................................... 3 4.1 Waterborne Commerce Data ............................................................................ 3 4.2 Port of Lake Charles Data ................................................................................. 5 5.0 DETERMINE EXISTING AND FORECAST FUTURE WATERBORNE COMMERCE ... 6 5.1 Existing Major Commodity Flows (Deep-Draft Vessels) .................................... 6 5.2 Forecasted Major Commodity Flows (Deep-Draft Vessels) ............................... 7 5.2.1 Crude Oil Imports .................................................................................. 7 5.2.2 LNG Imports .......................................................................................... 7 5.2.3 Summary of Commodity Movements ................................................... 13 6.0 DETERMINE EXISTING AND FORECAST FUTURE VESSEL FLEET COMPOSITION .................................................................... 14 7.0 CURRENT AND FUTURE COMMODITY MOVEMENT COSTS ................................. 22 7.1 Current Commodity Movement Costs ............................................................. 22 7.2 Future Commodity Movement Costs ............................................................... 25 8.0 DETERMINE HARBOR USE WITH AND WITHOUT PROJECT ................................. 27 9.0 COMPUTE BENEFITS ............................................................................................... 29 9.1 Major Assumptions Used in Computing Benefits ............................................. 29 9.2 Navigation Benefits ......................................................................................... 30 9.3 Average Annual Benefits ................................................................................. 32 10.0 COMPARE BENEFITS AND COSTS ......................................................................... 35 11.0 SUMMARY ............................................................................................................ 36 Attachment 1: CURRENT INFORMATION FOR THE PORT OF LAKE CHARLES Attachment 2: CALCASIEU RIVER AND PASS, LA (LAKE CHARLES, LA) WATERBORNE COMMERCE STATISTICS CENTER
LIST OF TABLES Number Page 1 Summary of WCSC Commodity Tons Handled at Port of Lake Charles, 1995-2004 (1,000s of Tons) ............................................ 3 2 Petroleum and LNG Imports at Calcasieu River, 1995-2004 (1,000s of tons) ............... 4 3 Waterborne Commerce at Calcasieu River: Metric Tonnes by Vessel Type, March, April, May, and June 2006 ..................................................................... 5 4 U.S. LNG Terminals, September 13, 2006 ................................................................... 8 5 Estimated Annual LNG Imports for Calcasieu River Plants ......................................... 12 6 Current and Future Commodity Movements Under Various Utilization Scenarios
(1,000,000s of tonnes) .................................................................................... 13 7 Waterborne Commerce at Calcasieu River: Vessel Calls, March, April, May, and June 2006 ................................................................... 15 8 Waterborne Commerce at Calcasieu River: Average Shipment Size in Metric Tonnes, March, April, May, and June 2006 ..................................................... 16 9 Calcasieu River Vessel Trips, by Vessel Type, 1995-2004 ......................................... 17 10 Upbound Trips and Drafts for Calcasieu River for Total and Tanker Foreign Vessels, 1995-2004 ........................................................................... 18 11 Upbound Percentage Trips and Drafts for Calcasieu River for Total and Tanker Foreign Vessels, 1995-2004 ........................................................ 18 12 Current and Future Vessel Movements Under Various Utilization Scenarios (Number of Trips) ............................................................................................ 21 13 Effects of Decreased Sailing Drafts on Annual Vessel Voyage Costs for Existing Deep-Draft Cargo Imports via Calcasieu River for Crude Oil and LNG ......................................................................................... 23 14 Effects of Decreased Sailing Draft on Annual Vessel Voyage Costs for Existing and Expanded Cargo Imports by Calcasieu River .............................. 24 15 Effects of Decreased Sailing Draft on Annual Vessel Voyage Costs for Expanded Deep Draft ..................................................................................... 26 16 Effects of Decreased Sailing Drafts on Annual Vessel Voyage Costs for Expanded Cargo Import Scenarios by Calcasieu River ................................... 29 17 Examples of Estimated Benefits from Maintenance Dredging of Calcasieu River ............................................................................................... 32

LIST OF TABLES Number Page 18 Transportation Savings and Present Value of Benefits, for Scenarios 1-3 for Calcasieu River DMMP ($1,000) .................................... 34 19 Costs, Benefits, and Benefit/Cost Ratios, for Scenarios 1-3 for Calcasieu River DMMP ($1,000) .................................... 36
20 Calcasieu River Annual Maintenance Dredging Expenditures, 1998-2007 ................. 37
LIST OF FIGURES Number Page 1 Comparison of Foreign Imports for Petroleum and Petroleum Products Traveling on the Calcasieu River ...................................................................... 4 2 Projected U.S. LNG Imports to 2030 .......................................................................... 10 3 Upbound Percentage Trips and Drafts for Calcasieu River for Total and Tanker Foreign Vessels, 1999-2004 (36 to 40 Feet Draft) ............................... 19


CALCASIEU DMMP ECONOMICS REPORT


1
CALCASIEU DMMP ECONOMICS REPORT 1.0 INTRODUCTION The Calcasieu River commercial navigation supports several large industries that rely on deep-draft and shallow-draft navigation with respect to self-propelled vessels and barges.1 The economics section describes the primary attributes of the deep-draft navigation system that is the greatest beneficiary of continued maintenance to existing channel depths. 2.0 DETERMINE ECONOMIC STUDY AREA The economic study area was determined to be the major industries immediately adjacent to the Calcasieu River deep-draft navigation channel. For the purpose of analysis of the vessel fleet, the focus was on commodities that used the deepest draft commercial vessels, often up to the 40-foot sailing draft that is the authorized main channel depth (MLG). The Calcasieu River serves a number of large industries that also use barges and smaller self-propelled deep-draft vessels, particularly the Lake Charles Harbor & Terminal District (Port of Lake Charles). Although all of these vessels provide important services, the criterion for the economic study was the industry serving vessels with the largest reported vessel drafts and associated number of vessel calls. 3.0 DATA COLLECTION On Tuesday July 25, 2006, a meeting was held at the Port of Lake Charles with the Port Director, Adam McBride, to discuss data collection (see Attachment 2) with respect to the past, present, and future movement of vessels along the Calcasieu River from the Gulf of Mexico to the Port of Lake Charles. Subsequently, port staff provided sample vessel/commodity movements for shippers/receivers generally representing four months (March – June 2006) of commercial navigation vessel traffic from shipper reports to the Port of Lake Charles. The shipper reports, including the Port of Lake Charles, generally recorded the name of the vessel, date of arrival or departure with respect to cargo shipments, shipment origin (imports, including domestic) and/or destination (exports, including domestic), commodity, and the commodity weight (usually in pounds). In some instances, the data omitted the vessel name or summarized the origin-destination data with respect to country, but no port was identified. The data were electronically compiled and are summarized in the next section. As of 1990, the Corps of Engineers had records for 174 commercial piers, wharves, and docks in the Port of Lake Charles. Of these, 13 generate deep-draft and shallow-draft ship traffic. The type of cargo varies, including general cargo, crude petroleum, refined petroleum and petrochemical products, bulk petroleum products, bulk ore, bulk grain, and liquefied natural gas (LNG).2
1 The depth criterion for deep-draft navigation is usually referred to as 18 feet. Although river barges are commonly
up to 12 feet, some will draw up to 15 feet. Ocean barges are considered a separate category because they can resemble smaller self-propelled vessels with respect to size and draft. 2 Vessel Traffic Congestion Study for the Calcasieu River Waterway Corridor (May 2005).

2
The following is a list of the facilities that generate deep-draft and shallow-draft vessel traffic, in the order of their 2004 share of total volume as reported in the Port data.3
1. CITGO Refinery: Liquid Petroleum Docks No. A, B, C, and D 21 percent Volume Share
• Location: Calcasieu River, Mile Point 29.2 • Function: Receipt of crude oil and shipment of refined products
2. CITGO – Clifton Ridge Terminal: Liquid Petroleum Dock 14 percent Volume Share
• Location: Calcasieu River, Mile Point 27.5 • Function: Receipt of crude oil
3. Conoco Phillips – Clifton Ridge Terminal: Liquid Petroleum Dock 13 percent Volume Share
• Location: Calcasieu River, Mile Point 26.9 • Function: Receipt of crude oil
4. Port of Lake Charles: General Cargo Docks No. 1 through 10 and 15 11 percent Volume Share
• Location: Calcasieu River, just below Lake Charles • Function: Receipt and shipment of general cargo and bulk grain
5. PPG: Liquid Petroleum Docks A and C 9 percent Volume Share
• Location: Westlake, Old River Channel of the Calcasieu • Function: Receipt and shipment of caustics, solvents, and chemicals
6. NL Baroid: Port of Lake Charles Bulk Terminal No. 1 (BT-1)
8 percent Volume Share • Location: South coast of Lake Charles • Function: Receipt and shipment of petroleum coke, wood chips, and barite
ore 7. Calcasieu Refining: Liquefied Petroleum Dock 6 percent Volume Share
• Location: Calcasieu Ship Channel, five miles south of Lake Charles • Function: Receipt of crude oil and shipment of refined products
8. Trunkline: Liquefied Natural Gas (LNG) Dock 6 percent Volume Share
• Location: North side of Industrial Canal, Devil’s Elbow, near GIWW • Function: LNG
9. ConocoPhillips – Westlake: Liquid Petroleum Docks No. 1, 2, and 3 4 percent Volume Share
• Location: Westlake, the Loop Channel of the Calcasieu, near I-10
3 Ibid., pp. 7-8.

3
• Function: Receipt of crude oil, shipment of petrochemicals and petroleum products
10. Lake Charles Carbon (ALCOA): Petroleum Coke Dock
2 percent Volume Share • Location: North side of Industrial Canal, Devil’s Elbow, near GIWW • Function: Receipt of green coke, shipment of calcined coke and molded anodes
11. Venco (CII CARBON): Petroleum Coke and Petrochemical Dock
2 percent Volume Share • Location: Calcasieu River, Mile Point 26.6 • Function: Shipment of calcined coke
12. Port Aggregate: Port of Lake Charles Bulk Terminal No. 4 (BT-4) 2 percent Volume Share
• Location: West coast of Lake Charles just south of I-10 • Function: Receipt of barite ore and iron ore concentrates by vessel
13. Westlake Styrene: Liquid Petroleum Dock
2 percent Volume Share • Location: Calcasieu River, Mile Point 26.2 • Function: Receipt of styrene
4.0 IDENTIFY COMMODITY TYPES AND FLOWS 4.1 Waterborne Commerce Data
Table 1 summarizes a 10-year time series of Waterborne Commerce Statistics Center (WCSC) data for the annual tonnages of major commodity groups reported to be handled at Calcasieu River docks. The full data are contained in an attachment. The typical year records a total of about 50 million tons of cargo handled at the Calcasieu River (Table 1). The major cargo flows are foreign, typically comprising over 50 percent of total annual tons, with domestic receipts and internal shipments each comprising nearly 15 percent (refer to Attachment 1).
Table 1. Summary of WCSC Commodity Tons Handled at
Port of Lake Charles, 1995 – 2004 (1,000s of Tons)
1995 1996 1997 1998 1999 2000 2001 2002 2003 2004Commodity 1,000s of Tons
Total Coal 63 131 144 85 118 163 149 169 190 239Total petroleum and petroleum products 37,787 39,707 40,789 42,413 40,785 77,926 44,056 39,017 44,865 45,503
Total chemicals and related products 3,168 3,354 3,433 3,405 3,303 3,473 3,035 3,027 3,029 3,691
Total crude materials, inedible except fuels 2,598 2,940 3,236 3,577 2,800 2,147 2,021 2,553 2,651 2,574
Total primary manufactured goods 442 520 492 543 621 387 432 389 270 275Total food and farm products 1,870 1,220 1,124 1,273 1,074 933 792 1,011 781 641
Total all manufactured equipment, machinery, and products 552 1,147 1,915 2,156 1,740 2,427 2,278 1,247 1,485 1,668
Total waste and scrap nec 0 81 147 115 91 72 75 74 82 62Total unknown or not elsewhere classified 3 1 1 0 12 1 2 35 7 114
Total 46,483 49,101 51,281 53,567 50,544 87,529 52,840 47,522 53,360 54,767
Source: Waterborne Commerce Statistics Center. The major cargo by volume handled at the port is petroleum products, which constitutes nearly 80 percent of total annual tons. Foreign imports are typically over one-half of the total volume of

4
petroleum product tonnages. Most of the foreign imports are crude petroleum imports for local refineries, with lesser volumes of LNG.
Table 2 presents the total annual tonnages of crude petroleum and LNG imported through the Calcasieu River for the period 1995-2004. Crude petroleum foreign imports have typically been about 20 million tons per year. Other foreign petroleum product imports have recently been about eight million tons per year, of which LNG has been nearly half. From the perspective of tonnages and deep-draft vessels (refer to Part 7), the major imports have been crude oil and LNG. Figure 1 is a comparison of the trends in foreign imports of all petroleum with crude imports and petroleum products with LNG.
Table 2. Petroleum and LNG Imports at Calcasieu River, 1995-2004 (1,000s of tons) Year Total Petroleum Products Subtotal Crude Petroleum Subtotal Petroleum Products Liquid Natural Gas
2004 28,041 20,468 7,574 3,960
2003 28,561 20,181 8,390 5,3672002 24,155 18,659 5,496 2,178
2001 29,189 22,545 6,643 3,173
2000 29,501 22,122 7,380 3,094
1999 26,920 22,553 4,367 1,456
1998 28,109 23,320 4,789 360
1997 26,120 21,217 4,903 178
1996 25,892 22,010 3,882 49
1995 23,736 19,668 4,069 236
Source: Waterborne Commerce Statistics Center.
0
5,000
10,000
15,000
20,000
25,000
30,000
35,000
2004 2003 2002 2001 2000 1999 1998 1997 1996 1995
Th
ou
sa
nd
Sh
ort
To
ns
Total Petroleum Products Subtotal Crude Petroleum
Subtotal Petroleum Products Liquid Natural Gas
Source: G.E.C., Inc., from Waterborne Commerce Statistics Center.
Figure 1. Comparison of Foreign Imports for Petroleum and Petroleum Products Traveling on the Calcasieu River

5
4.2 Port of Lake Charles Data
The Port supplied data for the 10 major users of the harbor in the form of shipper/receiver monthly reports, generally for the period March through June 2006.4 The data are contained in an attachment and summarized in Table 3 for the shippers/receivers and type of navigation with respect to self-propelled vessels or barges.5 The data for June are likely to be distorted by closure of the Calcasieu River to commercial navigation between June 21 and July 1, 2006, because of a June 20 oil spill that leaked into the Calcasieu and Prien Lake.6
Table 3. Waterborne Commerce at Calcasieu River: Metric Tonnes by Vessel Type, March, April, May, and June 2006
Shipper/Receiver March April May Junea
Public Port Vessels 98,537 53,857 48,445 94,344
Barges 619 11,791 3,130 2,013Total 103,537 68,857 63,445 104,344
Port Aggregates Vessels 92,594 46,594 92,083 46,566Barges
Total 92,594 46,594 92,083 46,566
Halliburtonb
Vessels 59,449 58,560 56,899BargesTotal 0 59,449 58,560 56,899
Citgo Vessels 1,256,306 1,155,544 1,024,093 627,200Barges
Total 1,256,306 1,155,544 1,024,093 627,200PPG Vessels 71,407 38,126 50,156 19,347
Barges 16,808 5,712 16,799Total 71,407 38,126 50,156 19,347
Conoco Vessels 216,776 519,199 900,700 113,020
Barges 498,911 432,454 398,454 373,137Total 715,687 951,653 1,299,154 486,157
Westlake Styrenec
Vessels 5,278 13,692
Barges 16,582 10,898 7,134 16,597Total 21,860 24,590 7,134 16,597
Trunklineb
Vessels 340,334 519,590 415,076
BargesTotal 0 340,334 519,590 415,076
CII Carbond
Vessels 9,921 16,551 15,652 11,023
Barges 14,948 35,331 37,841 37,287Total 24,869 51,882 53,493 99,309
Alcoa Vessels 12,397 33,468 30,328
Barges 3,340 27,404 22,910 22,941Total 15,737 27,404 56,378 53,269
Total Vessels 1,763,216 2,243,346 2,742,747 1,413,803Barges 534,400 534,686 475,181 468,774Total 2,297,616 2,778,032 3,217,928 1,882,577
Notes: aJune tonnages are lower in part because of closure of the
Calcasieu River for an oil spill cleanup.bMarch statistics not reported for Halliburton and Trunkline.
cMonths of October 2005 through January 2006 were received for Westlake Styrene.
dCII Carbon metric tonnes have been estimated.
Source: G.E.C., Inc., based on data furnished by the Port of Lake Charles.
4 The disparity between the number of facilities and the number of major uses results from the operation of more than
one facility by the same user. 5 The shipper/receiver data were reported in pounds and converted to metric tonnes.
6 Conversation with William Race, Director of Operations, Port of Lake Charles.

6
With respect to total tonnages, the major shippers are Citgo and Conoco, with approximate monthly volumes of 1.1 million and 0.9 million tonnes, respectively, for the period March through May. The Trunkline LNG plant received an average of about 400,000 tonnes per month during the period April through June.7 The next largest shippers/receivers appear to have monthly tonnages at or near 100,000 tonnes, including the Public Port and Port Aggregates (exports of limestone). Most of the cargo is being handled by self-propelled vessels, accounting for between 75 to 85 percent of the total tonnages during March through May. Most of the self-propelled vessel monthly reported total tonnage is accounted for by Citgo (about 1.1 million tonnes), Conoco (about 0.5 million tonnes), and Trunkline (about 0.4 million tonnes). Total port-reported vessel tonnages for the three-month period March through May is 6.749 million tonnes. Annualized by a factor of four, the estimated total for 2006 would be 26.996 million tonnes.8 This can be compared to the 31.5 million short tons of WCSC foreign cargo in 2004, which is convertible to 28.6 million metric tonnes. It appears that the total volume of annualized tonnage in 2006 (26.996 million tonnes) is fairly consistent with the total WCSC 2004 total volume of 28.6 million tonnes. The major cargoes handled by Citgo and Conoco are crude oil imports, although Conoco handles refined products in smaller lot sizes and vessels. During the three-month period March through May, Citgo imported 3.436 million tonnes of petroleum (nearly all crude), and Conoco imported 1.6 million tonnes of crude. On an annual basis using a factor of four, this would compute to 13.7 million tonnes and 6.5 million tonnes for Citgo and Conoco, respectively. Consequently, total annual crude vessel tonnage imported from foreign sources can be estimated to be 20.29 metric tonnes. The WCSC crude tonnage imports (Table 2) in 2003 and 2004 were 20.2 million and 20.5 million tons, respectively, which expressed in metric tonnes would be 18.33 million and 18.60 million metric tonnes. The 2006 three-month data (March through May) supplied by the Port do not appear to be inconsistent with the annual tonnages reported by WCSC for the most recent years (2003 and 2004) that have been compiled and reported. 5.0 DETERMINE EXISTING AND FORECAST FUTURE WATERBORNE COMMERCE 5.1 Existing Major Commodity Flows (Deep-Draft Vessels) The major existing commodity flows for the Calcasieu River are crude oil and LNG imports. The shipper/receiver records that identified the vessel origins indicated that the major sources of crude were South America (Venezuela and Colombia), The Bahamas, and Mexico. The major sources of LNG were indicated to be Egypt and Trinidad. The approximate current annual volumes of the major import commodities were nearly 20 million metric tonnes of crude, constituted by 12.25 million tonnes from South America (primarily Venezuela), 4.2 million tonnes from The Bahamas, and 3.5 million tonnes from Mexico. The approximate current annual volumes of LNG were nearly 4.8 million tonnes, constituted by 4.2 million tonnes from Egypt and 0.56 million tonnes from Trinidad.
7 Trunkline receipts for March were not provided.
8 Although four months of data were generally supplied, June was only partial because of closure of the Calcasieu to
commercial navigation from June 21 to July 1. Consequently, the three months of March, April, and May 2006 were assumed to be the best period to project an annual volume.
7
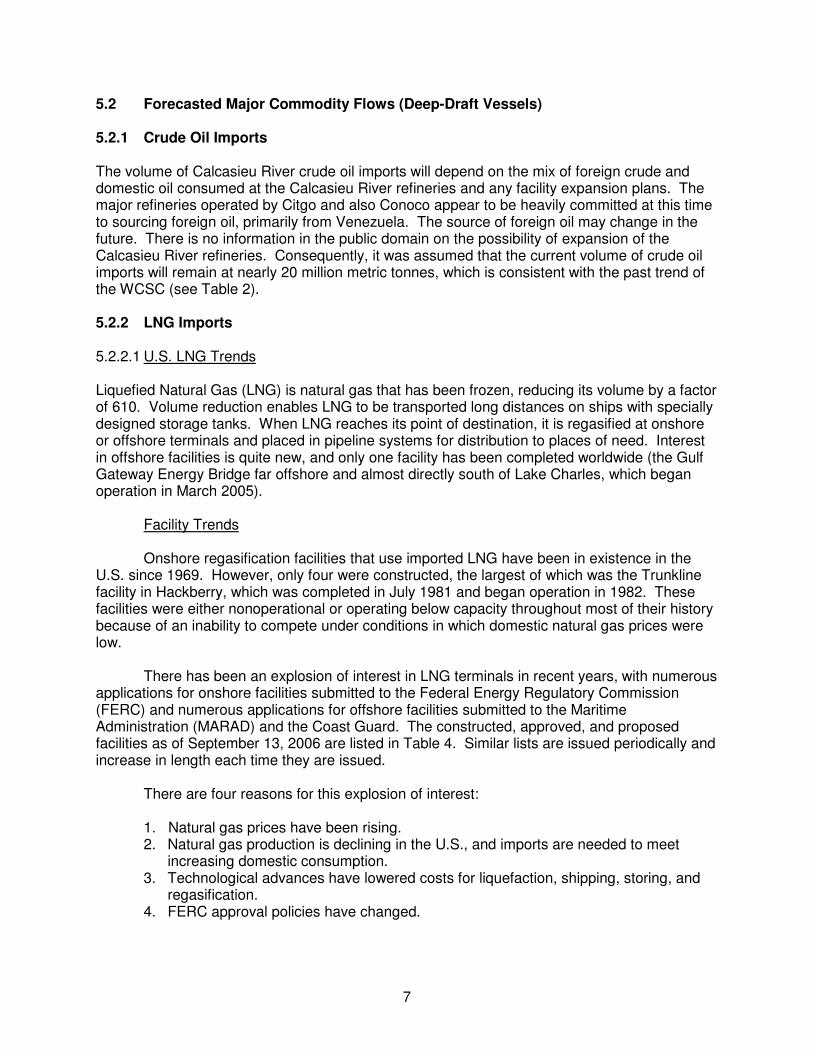
5.2 Forecasted Major Commodity Flows (Deep-Draft Vessels) 5.2.1 Crude Oil Imports The volume of Calcasieu River crude oil imports will depend on the mix of foreign crude and domestic oil consumed at the Calcasieu River refineries and any facility expansion plans. The major refineries operated by Citgo and also Conoco appear to be heavily committed at this time to sourcing foreign oil, primarily from Venezuela. The source of foreign oil may change in the future. There is no information in the public domain on the possibility of expansion of the Calcasieu River refineries. Consequently, it was assumed that the current volume of crude oil imports will remain at nearly 20 million metric tonnes, which is consistent with the past trend of the WCSC (see Table 2). 5.2.2 LNG Imports 5.2.2.1 U.S. LNG Trends Liquefied Natural Gas (LNG) is natural gas that has been frozen, reducing its volume by a factor of 610. Volume reduction enables LNG to be transported long distances on ships with specially designed storage tanks. When LNG reaches its point of destination, it is regasified at onshore or offshore terminals and placed in pipeline systems for distribution to places of need. Interest in offshore facilities is quite new, and only one facility has been completed worldwide (the Gulf Gateway Energy Bridge far offshore and almost directly south of Lake Charles, which began operation in March 2005).
Facility Trends
Onshore regasification facilities that use imported LNG have been in existence in the U.S. since 1969. However, only four were constructed, the largest of which was the Trunkline facility in Hackberry, which was completed in July 1981 and began operation in 1982. These facilities were either nonoperational or operating below capacity throughout most of their history because of an inability to compete under conditions in which domestic natural gas prices were low.
There has been an explosion of interest in LNG terminals in recent years, with numerous applications for onshore facilities submitted to the Federal Energy Regulatory Commission (FERC) and numerous applications for offshore facilities submitted to the Maritime Administration (MARAD) and the Coast Guard. The constructed, approved, and proposed facilities as of September 13, 2006 are listed in Table 4. Similar lists are issued periodically and increase in length each time they are issued. There are four reasons for this explosion of interest: 1. Natural gas prices have been rising.
2. Natural gas production is declining in the U.S., and imports are needed to meet increasing domestic consumption.
3. Technological advances have lowered costs for liquefaction, shipping, storing, and regasification. 4. FERC approval policies have changed.

8
Table 4. U.S. LNG Terminals September 13, 2006
Constructed
A. Everett, MA 1.035 Bcfd (SUEZ/Tractebel – DOMAC) B. Cove Point, MD 1.0 Bcfd (Dominion – Cove Point LNG) C. Elba Island, GA 1.2 Bcfd (El Paso – Southern LNG) D. Lake Charles, LA 2.1 Bcfd (Southern Union – Trunkline LNG) E. Gulf of Mexico 0.5 Bcfd (Gulf Gateway Energy Bridge – Excelerate Energy)
Approved by FERC 1. Hackberry, LA 1.5 Bcfd (Cameron LNG – Sempra Energy) 2. Bahamas 0.84 Bcfd (AES Ocean Express)* 3. Bahamas 0.83 Bcfd (Calypso Tractebel)* 4. Freeport, TX 1.5 Bcfd (Cheniere/Freeport LNG Dev.) 5. Sabine, LA 2.6 Bcfd (Sabine Pass Cheniere LNG) 6. Corpus Christi, TX 2.6 Bcfd (Cheniere LNG) 7. Corpus Christi, TX 1.1 Bcfd (Vista Del Sol – ExxonMobil) 8. Fall River, MA 0.8 Bcfd (Weaver's Cove Energy/Hess LNG) 9. Sabine, TX 2.0 Bcfd (Golden Pass – ExxonMobil) 10. Corpus Christi, TX 1.0 Bcfd (Ingleside Energy – Occidental Energy Ventures) 11. Logan Township, NJ 1.2 Bcfd (Crown Landing LNG – BP) 12. Port Arthur, TX 3.0 Bcfd (Sempra) 13. Cove Point, MD 0.8 Bcfd (Dominion) 14. Cameron, LA 3.3 Bcfd (Creole Trail LNG – Cheniere LNG) 15. Sabine, LA 1.4 Bcfd (Sabine Pass Cheniere LNG - Expansion)
Approved by MARAD/Coast Guard
16. Port Pelican 1.6 Bcfd (Chevron Texaco) 17. Louisiana Offshore 1.0 Bcfd (Gulf Landing – Shell)
Proposed to FERC 18. Long Beach, CA 0.7 Bcfd (Mitsubishi/ConocoPhillips – Sound Energy Solutions) 19. Bahamas 1.0 Bcfd (Seafarer – El Paso/FPL) 20. LI Sound, NY 1.0 Bcfd (Broadwater Energy – TransCanada/Shell) 21. Pascagoula, MS 1.5 Bcfd (Gulf LNG Energy LLC) 22. Bradwood, OR 1.0 Bcfd (Northern Star LNG – Northern Star Natural Gas LLC) 23. Pascagoula, MS 1.3 Bcfd (Casotte Landing – ChevronTexaco) 24. Port Lavaca, TX 1.0 Bcfd (Calhoun LNG – Gulf Coast LNG Partners) 25. Freeport, TX 2.5 Bcfd (Cheniere/Freeport LNG Dev. – Expansion) 26. Hackberry, LA 1.15 Bcfd (Cameron LNG – Sempra Energy – Expansion) 27. Pleasant Point, ME 2.0 Bcfd (Quoddy Bay, LLC) 28. Robbinston, ME 0.5 Bcfd (Downeast LNG – Kestrel Energy) 29. Elba Island, GA 0.9 Bcfd (El Paso – Southern LNG) 30. Baltimore, MD 1.5 Bcfd (AES Sparrows Point – AES Corp.) 31. Coos Bay, OR 1.0 Bcfd (Jordan Cove Energy Project)
Proposed to MARAD/Coast Guard 32. Offshore California 1.5 Bcfd (Cabrillo Port – BHP Billiton) 33. Offshore California 0.5 Bcfd (Clearwater Port LLC – NorthernStar NG LLC) 34. Offshore Louisiana 1.0 Bcfd (Main Pass McMoRan Exp.) 35. Gulf of Mexico 1.5 Bcfd (Beacon Port Clean Energy Terminal – ConocoPhillips) 36. Offshore Boston 0.4 Bcfd (Neptune LNG – SUEZ LNG) 37. Offshore Boston 0.8 Bcfd (Northeast Gateway – Excelerate Energy) 38. Gulf of Mexico 1.4 Bcfd (Bienville Offshore energy Terminal – TORP) 39. Offshore Florida ? Bcfd (SUEZ Calypso – SUEZ LNG) 40. Offshore California 1.2 Bcfd (Oceanway – Woodside Natural Gas)
*U.S. pipeline approved, LNG terminal pending in Bahamas. Source: FERC Office of Energy Projects.

9
With respect to the fourth factor, FERC had traditionally considered LNG terminals to be facilities in interstate commerce subject to cost-based rates and open access bidding requirements with respect to facility capacity utilization. This changed in September 2003 with the approval of Sempra Energy’s Cameron LNG terminal in Hackberry, which was the first to be approved in 25 years. The approval was based on a policy change that recognized LNG terminals as gas supply facilities. Under the new policy, developers are able to import supplies for their own use, and marketers can contract privately for terminal services at market-based rates.
LNG Projections
In the Annual Energy Outlook 2006, the Energy Information Administration’s (EIA) reference case scenario projects natural gas consumption increases in the U.S. from 22.4 trillion cubic feet in 2004 to 26.9 trillion cubic feet in 2030.9 Imports are expected to play an increasingly important role in meeting this demand, and most of the projected growth in imports will be in the form of LNG.
LNG imports are projected in EIA’s reference case to grow from 650 billion cubic feet in 2004 to 4.4 trillion cubic feet in 2030, with net LNG imports rising from 19 percent of net gas imports in 2004 to 78 percent in 2030. The greatest increase is expected through 2014, with more modest increases thereafter.
It should be noted that these are dry natural gas equivalent numbers, which need to be divided by 48.7 to produce millions of metric tonnes of LNG. This is done in Figure 2 using the data set supplied by EIA. As can be seen from the figure, imports of LNG into the U.S. are expected to increase from 13.35 million metric tonnes in 2004 to 89.53 million metric tonnes in 2030, an average annual growth rate of 7.6 percent.
According to EIA, peak annual import capacity through terminals is expected to rise rapidly from 1.4 trillion cubic feet in 2004 to 4.9 trillion cubic feet in 2015, then grow more slowly to 5.8 trillion cubic feet in 2030. This capacity will be obtained through new and expanded onshore and offshore facilities.
Facility Implications
Energy analysts are in general agreement that most of the approved and proposed
facilities on FERC’s list will not be built, not to mention FERC’s supplemental March 8 list of 13 potential onshore and offshore facilities identified by project sponsors. It is obvious, for example, that only eight facilities with a peak capacity of 2 Bcfd (billion cubic feet per day) operating at peak capacity for 365 days would be needed to accommodate the 5.8 trillion cubic feet capacity projected by EIA for 2030.
However, there is also general agreement that particular areas of the Gulf Coast have competitive advantages for securing facilities, including large markets in Texas and Louisiana, a pipeline network extending to the rest of the nation, and an absence of opposition to facility siting in areas that are already dominated by oil and gas related facilities. A number of East
9 EIA says that natural gas consumption will be limited by high natural gas prices, particularly after 2017, and that the
natural gas share of total energy consumption will drop from 23 percent in 2004 to 21 percent in 2030.

10
0
0.5
1
1.5
2
2.5
3
3.5
4
4.5
5
2003
2005
2007
2009
2011
2013
2015
2017
2019
2021
2023
2025
2027
2029
Vo
lum
e (
Tri
llio
n C
ub
ic F
ee
t)
Coast and West Coast facilities on FERC’s list have already been abandoned or are in jeopardy because of local opposition.
Source: FERC Office of Energy Projects.
Figure 2. Projected U.S. LNG Imports to 2030
5.2.2.2 Lake Charles Area Facilities There are three LNG facilities in the Lake Charles area that will have an affect on considerations related to the Calcasieu Ship Channel, of which one (Trunkline LNG) is in existence, one (Cameron LNG) is under construction, and one (Creole Trail LNG) has been approved by FERC.
Trunkline LNG (Trunkline)
Trunkline is an existing facility nine miles southwest of Lake Charles on the Calcasieu
Ship Channel. It has been in operation since 1982 and was acquired by the Southern Union Company in Houston in June 2003 through the purchase of Panhandle Energy from CMS Energy. The facility originally had three storage tanks, one unloading dock, a peak sendout capacity of 1 Bcfd, and a sustained sendout capacity of 0.630 Bcfd. The BG Group had full capacity utilization rights in the facility from its inception.
Trunkline operated for only a short time before closing and was reopened in 1989, receiving minimal shipments in the next decade. It received the largest annual volume of any

11
U.S. terminal in 2003 (latest year readily available) with receipts of 238 Bcf, all through short-term or spot cargo sales. Although peak sendout capacity was reached many days during the summer of 2003, the facility has continued to remain underutilized.
An application for expansion of the Trunkline facility was submitted by CMS Energy to FERC in December 2001, final approval was given in December 2003, an authorization to construct was given in March 2003, and a final Environmental Assessment was issued in July 2004. The BG Group acquired full capacity utilization rights in the expansion in February 2004.
The expansion was completed in April 2006 and included an additional storage tank and an additional unloading dock, raising the number of storage tanks to four and the number of unloading docks to two. These improvements have increased the peak sendout capacity to 2.1 Bcfd and the sustained sendout capacity to 1.8 Bcfd (although the website says in addition that when the facility is operating at peak capacity, it can regasify and send out at a maximum rate of 1.5 Bcfd).
The Environmental Assessment indicates that the design capacity of the expanded facility is 225 ships.
Cameron LNG (Sempra)
Cameron is a facility under construction at an existing liquefied petroleum gas site on the
Calcasieu Ship Channel a few miles north of Hackberry that was purchased by Sempra Energy of San Diego from Dynegy in April 2003. The FERC application was submitted in May 2002, a final Environmental Impact Statement was issued in August 2003, final approval was given in October 2003, and an authorization to construct was given in August 2005. Eni obtained 40 percent of capacity through a 20-year agreement in August 2005, and construction began in September, with operations expected to begin in late 2008. The facility will have three storage tanks, two unloading docks, and a peak sendout capacity of 1.5 Bcfd.
An expansion application was submitted to FERC in July 2006, which would add one storage tank. The improvements would add another 1.15 Bcfd of capacity, raising the total peak sendout capacity to 2.65 Bcfd. Construction is expected to begin in 2007 and end in 2010. An agreement was reached in March 2006 with Merrill Lynch Commodities for 0.5 Bcfd of the capacity, which would be from the first phase of the project or from the expansion. The Eni and Merrill Lynch Commodities agreements together account for 1.1 Bcfd of the total 2.65 Bcfd capacity.
The expansion project report for January 2006 filed with FERC indicates that the facility will be able to handle 346 ships per year, with one-half assumed to be of 145,000 cubic meter size. However, the report points out that the average LNG ship size will probably increase to 200,000 cubic meters, reducing traffic to 233 ships per year.
Creole Trail LNG (Cheniere)
Creole Trail is a FERC-approved facility that would be owned by Houston-based
Cheniere Energy and would be located on the Calcasieu Ship Channel below Calcasieu Lake. The FERC application was submitted in May 2005, a final Environmental Impact Statement was issued in May 2006, and final approval was given in June 2006. An authorization to construct has not yet been given, and there are as yet no capacity utilization agreements, although Cheniere Energy indicates that it is reaching for long-term agreements.

12
The facility will have four storage tanks, two unloading docks, and a peak sendout capacity of 3.3 Bcfd, which would make it North America’s largest facility. The Environmental Impact Statement indicates that the facility would have the capacity to unload 300-400 LNG ships per year, although the actual number may be fewer depending on ship sizes and terminal user agreement conditions. 5.2.2.3 LNG Imports The maximum LNG imports would occur at Calcasieu River assuming that the three plants were fully developed with respect to the expansion of Trunkline, construction and expansion of Creole Trail (Cheniere), and full development of Cameron (Sempra). Table 5 identifies the projected peak capacity for each facility and the baseline capacity, which is converted into daily and annual tonnes of LNG imports. The data indicate that the three plants, fully developed and used under baseline capacity for an entire year, would require about 40 million tonnes of LNG imports annually. Essentially, the LNG plants have a potential to become nearly twice as large (in terms of importation of tonnes of LNG) as the existing refineries for crude oil.
Table 5. Estimated Annual LNG Imports for Calcasieu River Plants
Peak Baseline
Capacity Capacity Daily Tonnes Annual Tonnes
Plant (BCF) (BCF) LNG LNG
Trunkline 2.100 1.386 28,460 10,387,885
Sempra 2.650 1.749 35,914 13,108,522
Cheniere 3.300 2.178 44,723 16,323,819
Total 8.050 5.313 109,097 39,820,226
Notes: Peak Capacity is stated as billion cubic feet (BCF) of natural gas per day.
Baseline Capacity is stated as 2/3 of Peak Capacity.
Daily Tonnes LNG is Baseline Capacity divided by 48.7, which is the equivalent
of one billion cubic feet of natural gas per tonne of LNG.
Annual Tonnes LNG is Daily Tonnes LNG multiplied by 365.
Peak Capacity and Baseline Capacity have been rounded.
Source: G.E.C., Inc.
Developments in the LNG sector suggest that many of the proposed plants will not be constructed or fully developed. However, there is reason to believe that the Calcasieu River location is likely to be more favorable for the development of plants other than the Trunkline facility (Cheniere and Sempra) because of the presence of an existing facility, underway construction of a second facility (Sempra), and followup with a third facility (Cheniere). The unknown factor is the extent to which these facilities will be fully developed relative to capacity expansion plans and fully utilized relative to baseline capacity in relation to peak capacity. It seems reasonable to have some forecast scenarios that would exclude the proposed Cheniere plant and/or halve the LNG tonnage to record an order of magnitude of slower development. Excluding the Cheniere facility from the computation would reduce LNG annual imports at Calcasieu River from nearly 40 million metric tonnes to about 24 million metric tonnes. Halving the fully developed LNG annual import tonnages at Calcasieu River would result in 20 million

13
metric tonnes. Finally, excluding Cheniere and then halving the tonnages for Trunkline and Sempra would reduce the LNG annual imports to about 12 million tonnes.
Regardless of the reductions of possible maximum LNG imports, the magnitude of possible lower volumes (ranging from 24 million to 12 million metric tonnes) is considerably larger than the record 5.4 million short tons imported by the Trunkline plant in 2003 (refer to Table 3), which is the equivalent of 4.9 million metric tonnes. 5.2.3 Summary of Commodity Movements Current and future commodity movements evaluated in this analysis are summarized, by origin, in Table 6. Under current conditions, approximately 24.71 million tonnes of crude petroleum and LNG move through the Calcasieu River annually. These movements include 19.95 million tonnes of crude petroleum and 4.76 million tonnes of LNG. Assuming full development of the three LNG facilities, total future annual movements are projected at 59.76 million tonnes, including 39.81 million tonnes of LNG and 19.95 million tonnes of crude petroleum. To address the uncertainty that the three LNG plants will operate at baseline capacity, three operational scenarios were developed. Scenario 1 excludes tonnages associated with the approved Cheniere LNG facility, Scenario 2 assumes all three LNG facilities operate at 50 percent of their baseline capacity, and Scenario 3 assumes that the Trunkline and Sempra LNG facilities operate at 50 percent of capacity and the Cheniere facility is not developed. Crude petroleum movements were assumed to remain constant at 19.95 million tonnes for all scenarios. As a result, total shipments under Scenario 1 are projected at 43.44 million tonnes, including 23.49 million tonnes of LNG. A total of 19.91 million tonnes of LNG are projected to move under Scenario 2, which assumes all three LNG facilities operate at 50 percent of their baseline capacity. Total shipments (crude petroleum and LNG) under Scenario 2 are 39.86 million tonnes. Under Scenario 3, total annual LNG shipments are projected at 11.745 million tonnes, with total crude petroleum and LNG movements projected at 31.70 million tonnes. Table 6. Current and Future Commodity Movements Under Various Utilization Scenarios
(1,000,000s of Tonnes)
Commodity/Origin Current Fully Utilized Scenario 1 Scenario 2 Scenario 3
Crude Petroleum (1,000,000 of Tonnes)
South America 12.25 12.25 12.25 12.25 12.25
Bahamas 4.20 4.20 4.20 4.20 4.20
Mexico 3.50 3.50 3.50 3.50 3.50
Subtotal 19.95 19.95 19.95 19.95 19.95
LNG
Egypt 4.20 35.03 20.67 17.52 10.34
Trinidad 0.56 4.78 2.82 2.39 1.41
Subtotal 4.76 39.81 23.49 19.91 11.75
Total 24.71 59.76 43.44 39.86 31.70
Source: G.E.C., Inc.

14
6.0 DETERMINE EXISTING AND FORECAST FUTURE VESSEL FLEET COMPOSITION
Table 7 lists the vessel calls for the shippers/receivers at Calcasieu River primarily for the period March through June 2006. Conoco has the most vessel movements (primarily barges), followed by Citgo, which had the largest number of deep draft vessel movements. Vessel traffic declined in June with the closure of the Calcasieu River to commercial navigation from June 21 until July 1. Table 8 presents the average shipment size by type of vessel for each shipper/receiver. The data indicate that the two refineries (Citgo and Conoco) dominate in the largest average shipment size for deep-draft vessels expressed in metric tonnes. Citgo’s average shipment size ranged from 62,000 tonnes to 72,000 tonnes. Because of a mixture of imports of crude and exports of refined products in smaller shipments, Conoco exhibited more variability, with average shipment size ranging from 22,000 tonnes to nearly 82,000 tonnes. Citgo shipments reflect imports of almost entirely crude oil. With a few exceptions, most crude oil receipts are in the range of 70,000 tonnes.10 The Public Port has a wide range of shipment sizes for self-propelled vessels characterized by a number of small shipments. There are comparatively few aggregate shipments (rock to Mexico), and the vessel carries fewer than 50,000 tonnes. The Trunkline facility had six, nine, and seven LNG vessel calls in April, May, and June, respectively, with average vessel receipts of nearly 58,000 to 59,000 tonnes. Table 9 provides a 10-year summary of the total vessel trips, by vessel type, for the Calcasieu River for the period 1995 through 2004. The full data set is contained in Attachment 2. The data indicate that the total number of vessel trips has remained relatively constant, with the preponderance of vessels being domestic dry cargo or tugs/barges. Foreign flag vessels calling at Calcasieu River average about 1,000 a year, divided nearly evenly between dry cargo and tanker. Table 10 contains the inbound vessel trips and drafts reported between 30 and greater than or equal to 40 feet for all foreign flag vessels and tankers for the period 1995 through 2004 calling Calcasieu River. The deepest drafting vessels are tankers, which account for nearly all of the inbound trips with drafts of 37 feet or more. Table 11 contains the distribution of total trips and drafts between 30 and greater than or equal to 40 feet for Calcasieu River inbound foreign flag for all vessels and tankers. Figure 3 presents the same information for drafts between 36 and greater than or equal to 40 feet. The subtotal of inbound vessel percentages for drafts between 37 and greater than or equal to 40 feet indicates that nearly 80 percent of total inbound
10
For example, eight of the 10 receipts of crude in June exceeded 70,000 tonnes. There is evidence that some vessels are discharging elsewhere and taking a residual to Citgo (for example, the Kareela Spirit called in May with 13,455 tonnes and in June with 6,390 tonnes).

15
Table 7. Waterborne Commerce at Calcasieu River: Vessel Calls, March, April, May, and June 2006
Shipper/Receiver March April May Junea
Public Port Vessels 9 9 8 7
Barges 1 3 3 2
Total 10 12 11 9
Port Aggregates Vessels 2 1 2 1
Barges 0 0 0 0
Total 2 1 2 1
HalliburtonbVessels 1 1 1
Barges 0 0 0
Total 0 1 1 1
Citgo Vessels 20 16 15 10
Barges 0 0 0 0
Total 20 16 15 10
PPG Vessels 13 4 13 6
Barges 0 3 1 4
Total 13 7 14 10
Conoco Vessels 5 7 11 5
Barges 99 106 95 77
Total 104 113 106 82
Westlake StyrenecVessels 0 1 3 0
Barges 11 8 5 11
Total 11 9 8 11
TrunklinebVessels 6 9 7
Barges 0 0 0
Total 0 6 9 7
CII Carbon Vessels 1 1 2 1
Barges 9 21 23 22
Total 10 22 25 23
Alcoa Vessels 1 0 2 2
Barges 2 18 15 15
Total 3 18 17 17
Total Vessels 51 46 66 40
Barges 122 159 142 131
Total 173 205 208 171
Notes: aJune vessel calls are lower in part because of closure of the
Calcasieu River for an oil spill cleanup.bMarch statistics not reported for Halliburton and Trunkline.cMonths of October 2005 through January 2006 were received for Westlake Styrene.
Source: G.E.C., Inc., based on data furnished by the Port of Lake Charles.

16
Table 8. Waterborne Commerce at Calcasieu River: Average Shipment Size in Metric Tonnes,
March, April, May, and June 2006
Shipper/Receiver March April May Junea
Public Port Vessels 10,949 5,984 6,056 13,478
Barges 619 3,930 1,043 1,007
Port Aggregates Vessels 46,297 46,594 46,042 46,566
Barges 0 0 0 0
HalliburtonbVessels 0 59,449 58,560 56,899
Barges 0 0 0 0
Citgo Vessels 62,815 72,222 68,273 62,720
Barges 0 0 0 0
PPG Vessels 5,493 9,532 3,858 3,225
Barges 0 5,630 5,712 4,200
Conoco Vessels 43,355 74,171 81,882 22,604
Barges 5,091 4,042 4,193 5,042
Westlake StyrenecVessels 0 13,692 0 0
Barges 1,507 1,362 1,427 1,507
TrunklinebVessels 0 56,722 57,732 59,297
Barges 0 0 0 0
CII Carbon Vessels 9,921 16,551 7,826 11,023
Barges 1,661 1,682 1,645 1,695
Alcoa Vessels 12,397 0 16,734 15,164
Barges 1,670 1,522 1,527 1,529
Notes: aJune vessel calls are lower in part because of closure of the Calcasieu
River for an oil spill cleanup.bMarch statistics not reported for Halliburton and Trunkline.cMonths of October 2005 through January 2006 were received for Westlake Styrene.
Source: G.E.C., Inc., based on data furnished by the Port of Lake Charles.

Tab
le 9
. C
alc
asie
u R
iver
Vessel T
rip
s, b
y V
es
sel
Typ
e,
1995-2
004
Ye
ar
So
urc
eT
ota
lD
ry C
arg
oT
an
ke
rT
ow
or
Tu
gD
ry C
arg
oT
an
ke
rT
ota
lD
ry C
arg
oT
an
ke
rT
ow
or
Tu
gD
ry C
arg
oT
an
ke
r
2004
Tota
l50,8
17
39,9
19
617
3,2
28
1,8
22
5,2
31
50,8
99
39,7
67
618
3,2
26
2,0
58
5,2
30
Fore
ign
1,0
60
545
490
16
90
921
393
489
18
21
0
Dom
estic
49,7
57
39,3
74
127
3,2
12
1,8
13
5,2
31
49,9
78
39,3
74
129
3,2
08
2,0
37
5,2
30
2003
Tota
l23,9
32
13,0
55
612
3,2
39
1,9
85
5,0
41
23,8
23
12,7
82
629
3,1
92
2,0
43
5,1
77
Fore
ign
960
419
490
22
29
0848
299
489
21
39
0
Dom
estic
22,9
72
12,6
36
122
3,2
17
1,9
56
5,0
41
22,9
75
12,4
83
140
3,1
71
2,0
04
5,1
77
2002
Tota
l24,8
28
14,5
93
520
3,0
00
1,9
59
4,7
56
24,8
05
14,5
27
525
2,9
22
2,0
35
4,7
96
Fore
ign
756
258
392
84
22
0723
273
393
30
25
2
Dom
estic
24,0
72
14,3
35
128
2,9
16
1,9
37
4,7
56
24,0
82
14,2
54
132
2,8
92
2,0
10
4,7
94
2001
Tota
l26,6
94
16,9
37
596
2,5
02
1,8
77
4,7
82
26,8
95
16,8
67
612
2,4
86
2,0
44
4,8
86
Fore
ign
1,0
01
497
457
24
23
0804
302
459
22
20
1
Dom
estic
25,6
93
16,4
40
139
2,4
78
1,8
54
4,7
82
26,0
91
16,5
65
153
2,4
64
2,0
24
4,8
85
2000
Tota
l26,1
56
15,8
87
659
2,8
20
2,0
72
4,7
18
26,5
65
15,8
73
643
2,9
02
2,2
67
4,8
80
Fore
ign
907
392
469
23
23
0782
284
445
24
28
1
Dom
estic
25,2
49
15,4
95
190
2,7
97
2,0
49
4,7
18
25,7
83
15,5
89
198
2,8
78
2,2
39
4,8
79
1999
Tota
l25,6
65
798
322
3,2
60
1,9
57
4,9
62
25,3
54
14,7
57
605
2,9
60
1,8
92
5,1
40
Fore
ign
1,3
79
795
172
379
33
0955
429
448
44
34
0
Dom
estic
24,2
86
3150
2,8
81
1,9
24
4,9
62
24,3
99
14,3
28
157
2,9
16
1,8
58
5,1
40
1998
Tota
l26,9
68
15,9
63
550
3,2
06
1,6
04
5,6
45
26,9
70
15,9
60
562
3,1
90
1,5
96
5,6
62
Fore
ign
981
427
416
76
60
2954
426
417
62
49
0
Dom
estic
25,9
87
15,5
36
134
3,1
30
1,5
44
5,6
43
26,0
16
15,5
34
145
3,1
28
1,5
47
5,6
62
1997
Tota
l24,1
92
12,6
55
552
3,3
70
1,7
09
5,9
06
24,2
97
12,6
79
560
3,4
97
1,6
70
5,9
81
Fore
ign
930
374
414
68
73
1877
339
420
55
63
0
Dom
estic
23,2
62
12,2
81
138
3,3
02
1,6
36
5,9
05
23,4
20
12,3
40
140
3,4
42
1,6
07
5,9
81
1996
Tota
l24,6
83
12,8
53
435
3,8
73
1,6
84
5,8
38
24,6
20
12,8
43
433
3,8
49
1,5
89
5,9
06
Fore
ign
790
331
347
57
53
2733
296
343
43
50
1
Dom
estic
23,8
93
12,5
22
88
3,8
16
1,6
31
5,8
36
23,8
87
12,5
47
90
3,8
06
1,5
39
5,9
05
1995
Tota
l22,0
51
10,3
59
435
3,8
84
1,6
14
5,7
59
21,9
70
10,4
18
439
3,7
62
1,5
24
5,8
27
Fore
ign
791
331
344
56
60
0765
303
345
58
59
0
Dom
estic
21,2
60
10,0
28
91
3,8
28
1,5
54
5,7
59
21,2
05
10,1
15
94
3,7
04
1,4
65
5,8
27
Sourc
e:
Wate
rborn
e C
om
merc
e S
tatistics C
ente
r.
Up
Bo
un
dD
ow
n B
ou
nd
Se
lf P
rop
ell
ed
Ve
sse
lsN
on
-Se
lf P
rop
ell
ed
S
elf
Pro
pe
lle
d V
ess
els
No
n-S
elf
Pro
pe
lle
d
17

200
42004
2003
2003
200
22
002
2001
2001
200
02
000
1999
1999
1998
1998
1997
1997
1996
1996
1995
1995
Dra
ftT
ota
lT
anker
Tota
lT
anker
Tota
lT
anker
To
tal
Ta
nker
Tota
lT
anke
rT
ota
lT
anker
Tota
lT
anke
rT
ota
lT
anker
Tota
lT
anke
rT
ota
lT
anker
≥40
83
81
11
11
44
44
11
46
45
87
86
65
72
71
123
123
40
28
28
39
75
71
86
84
33
31
33
23
21
60
57
59
55
49
43
41
54
37
37
38
48
47
83
80
76
76
178
173
74
67
72
71
66
47
34
10
10
38
18
18
37
59
56
61
61
71
71
61
59
29
25
36
36
38
42
24
19
841
13
13
36
80
54
96
74
58
35
64
48
101
81
35
17
24
26
16
16
966
24
24
35
17
12
23
19
19
12
28
21
15
12
30
21
10
82
11
555
16
16
34
13
11
20
16
12
715
11
15
13
65
96
412
548
99
33
10
410
816
12
17
14
19
14
87
79
34
297
17
17
32
11
820
17
51
13
11
16
16
96
68
410
289
10
10
31
64
74
72
10
719
15
11
94
17
13
63
90
15
15
30
13
12
16
10
94
11
616
13
94
510
58
31
35
16
16
Tota
l41
5360
433
384
350
295
401
354
373
322
363
319
293
300
225
262
211
753
203
203
Sourc
e: W
ate
rborn
e C
om
merc
e S
tatis
tics
Cente
r.
200
420
04
200
320
03
2002
20
02
2001
200
120
00
200
019
99
1999
19
98
1998
199
719
97
199
619
96
1995
199
5
Dra
ftT
ota
lT
anker
Tota
lT
anker
Tota
lT
anker
To
tal
Tanker
To
tal
Tanker
Tota
lT
anker
Tota
lT
anker
Tota
lT
anker
Tota
lT
anker
To
tal
Tanker
≥4
020.0
%22
.5%
2.5
%2.9
%1
2.6
%14.9
%0
.2%
0.3
%12
.3%
14.0
%24
.0%
27.0
%26.8
%30
.9%
39.8
%49
.2%
56.3
%66
.9%
39.9
%46.6
%
39
18.1
%19
.7%
19.9
%21
.9%
9.4
%10.5
%0
.7%
0.8
%6
.2%
6.5
%16
.5%
17.9
%16.0
%17
.9%
14.5
%16
.2%
13.5
%15
.4%
27.0
%29.9
%
38
11.6
%13
.1%
19.2
%20
.8%
21.7
%25.8
%44
.4%
48.9
%19
.8%
20.8
%19
.8%
22.3
%17.8
%20
.0%
12.4
%11
.2%
3.1
%3.8
%3
.8%
4.0
%
37
14.2
%15
.6%
14.1
%15
.9%
20.3
%24.1
%15
.2%
16.7
%7
.8%
7.8
%9.9
%1
1.3
%12.9
%11
.5%
11.1
%7
.9%
6.0
%3.0
%3
.1%
2.4
%
36
19.3
%15
.0%
22.2
%19
.3%
16.6
%11.9
%16
.0%
13.6
%27
.1%
25.2
%9.6
%5
.3%
10.5
%7
.3%
6.9
%5
.3%
5.0
%3.4
%7
.8%
4.8
%
Subto
tal
83.1
%85
.8%
77.8
%80
.7%
80.6
%87.1
%76
.6%
80.2
%73
.2%
74.2
%79
.9%
83.7
%84.0
%87
.6%
84.7
%89
.8%
84.0
%92
.5%
81.6
%87.6
%
35
4.1
%3
.3%
5.3
%4.9
%5
.4%
4.1
%7
.0%
5.9
%4
.0%
3.7
%8.3
%6
.6%
3.9
%3
.0%
2.1
%0
.7%
3.5
%1.9
%5
.1%
3.2
%
34
3.1
%3
.1%
4.6
%4.2
%3
.4%
2.4
%3
.7%
3.1
%4
.0%
4.0
%1.7
%1
.6%
3.9
%2
.7%
1.6
%1
.3%
3.8
%1.9
%2
.0%
1.2
%
33
2.4
%1
.1%
2.3
%2.1
%4
.6%
4.1
%4
.2%
4.0
%5
.1%
4.3
%2.2
%2
.2%
1.8
%2
.1%
2.4
%1
.0%
1.3
%0.8
%2
.4%
2.0
%
32
2.7
%2
.2%
4.6
%4.4
%1
.4%
0.3
%3
.2%
3.1
%4
.3%
5.0
%2.5
%1
.9%
2.6
%1
.8%
2.1
%1
.3%
3.1
%0.8
%3
.8%
2.8
%
31
1.4
%1
.1%
1.6
%1.0
%2
.0%
0.7
%2
.5%
2.0
%5
.1%
4.7
%3.0
%2
.8%
2.1
%1
.2%
4.5
%4
.3%
1.9
%1.1
%2
.7%
1.6
%
30
3.1
%3
.3%
3.7
%2.6
%2
.6%
1.4
%2
.7%
1.7
%4
.3%
4.0
%2.5
%1
.3%
1.6
%1
.5%
2.6
%1
.7%
2.5
%1.1
%2
.4%
1.6
%
Tota
l1
00.0
%10
0.0
%1
00.0
%100
.0%
10
0.0
%1
00
.0%
10
0.0
%1
00.0
%10
0.0
%1
00.0
%100
.0%
10
0.0
%1
00
.0%
10
0.0
%1
00.0
%10
0.0
%1
00.0
%100
.0%
10
0.0
%1
00
.0%
Sourc
e:
G.E
.C., I
nc.
Tab
le 1
0.
Up
bo
un
d T
rip
s a
nd
Dra
fts f
or
Calc
asie
u R
iver
for
To
tal
an
d T
an
ker
Fo
reig
n V
essels
, 1995-2
004
Tab
le 1
1.
Up
bo
un
d P
erc
en
tag
e T
rip
s a
nd
Dra
fts f
or
Calc
asie
u R
iver
for
To
tal
an
d T
an
ker
Fo
reig
n V
essels
, 1995-2
004
18

19
0
10
20
30
40
50
60
To
tal
Ta
nk
er
To
tal
Ta
nk
er
To
tal
Ta
nk
er
To
tal
Ta
nk
er
To
tal
Ta
nk
er
To
tal
Ta
nk
er
2004 2004 2003 2003 2002 2002 2001 2001 2000 2000 1999 1999
Pe
rce
nta
ge
Tri
ps
an
d D
raft
s
40 Feet Draft 39 Feet Draft 38 Feet Draft 37 Feet Draft 36 Feet Draft
Source: G.E.C., Inc.
Figure 3. Upbound Percentage Trips and Drafts for Calcasieu River for Total and Tanker Foreign Vessels, 1999-2004 (36 to 40 Feet Draft)
foreign flag vessels and tankers have sailing drafts of 36 feet or more. Moreover, there is an indication that after several years of tanker calls clustered below 39 feet (35 feet to 38 feet), tankers are again calling close to 40-foot drafts. For example, in 2004 nearly 40 percent of tanker calls were reported at drafts of 39 and 40 feet. The clear suggestion is that tankers are calling with tidal assistance based on a 40-foot depth (MLG) authorized channel.11
The crude oil tanker fleet calling at Calcasieu River is the Aframax size category, which ranges from 79,000 deadweight tons (dwt) to 120,000 dwt. An example of a typical crude oil tanker calling at Calcasieu River is the MV Kareela Spirit, which is a 113,000 dwt double-hull vessel constructed in 1999. The LNG vessels currently calling at Calcasieu River range from 125,000 to 147,000 cubic meter capacity. Examples of typical LNG vessels calling at Calcasieu River include MV Artic Princess (147,000 cubic meters) and MV Khannur (125,000 cubic meters). The LNG vessels are approximately 70,000 dwt capacity. In the absence of deepening, it was assumed that the crude oil and LNG fleets would remain constant in size. Both categories of vessels are constrained (light loaded) by the existing 40-
11
The two tide gauges on the Calcasieu River are near the Pass close to fishing jetties in Cameron, Louisiana, and farther inland on the lake near the Civic Center, which are referred to as Calcasieu Pass and Lake Charles, respectively. The tidal datum from MLLW ranges 2.2 feet at Calcasieu Pass and 1.2 feet at Lake Charles (www.shr.noaa.gov/lch/temp/report619.php).

20
foot channel depth. For purposes of describing the fleet, the crude oil carriers were established at 90,000 dwt, and the LNG vessels were established at 76,500 dwt, with an average cubic capacity of 145,000. The size dimensions for a 90,000 dwt crude carrier are 771 feet length over all (Loa), 129 feet beam, and 47.3 feet draught, based on IWR vessel specifications. The crude oil fleet calling at Calcasieu River will likely range from 90,000 dwt to 120,000 dwt depending on charter availability.12 The size characteristics of a typical LNG tanker calling at Calcasieu River are between 70,000 dwt and 80,000 dwt, 930 feet Loa, 147 feet beam, and 37 feet draught. The LNG fleet calling at Calcasieu River will likely range between 125,000 to 147,000 cubic meters capacity, or from 70,000 dwt to 85,000 dwt. LNG vessels in the upper size range can be expected to be draft constrained, calling at Calcasieu River under fully loaded circumstances.13
The number of vessel trips, by commodity and channel depth, for the various scenarios evaluated in this analysis are presented in Table 12. Crude petroleum vessel trips are based on the use of 90,000 dwt crude carriers. The tankers were assumed to carry 68,000 tonnes of cargo and draft 40.22 feet under unrestricted conditions on the Calcasieu River, and carry 43,292 tonnes of cargo assuming ten feet less of water depth (30-foot channel) on the Calcasieu River. LNG vessel trips are based on the use of 76,500 dwt LNG vessels carrying 62,000 tonnes of cargo and drafting 35.86 feet under unrestricted conditions on the Calcasieu River, and carrying 40,952 tonnes of cargo per trip assuming ten feet less depth on the Calcasieu River. The number of crude petroleum vessel trips are constant across all scenarios (for each channel depth), ranging from a total of 293 trips (180 trips from South America, 62 trips from the Bahamas, and 51 trips from Mexico) assuming 40 foot depths on the Calcasieu River, to 461 trips (283 trips from South America, 97 trips from the Bahamas, and 81 trips from Mexico) assuming channel depths of 30 feet. The number of LNG vessel trips fluctuates from a low of 190 trips (167 trips from Egypt and 23 trips from Trinidad) assuming a 40-foot channel under Scenario 3, to a high of 973 trips (856 trips from Egypt and 117 trips from Trinidad) assuming a 30-foot channel under the full utilization of all three LNG facilities.
12
Above 90,000 dwt, the crude vessels calling Calcasieu River will be light-loaded unless they are making a call prior to Calcasieu River to partially unload. 13
The extent to which these draft-constrained larger LNG vessels might lighter at offshore facilities prior to calling Calcasieu River is not known.

21
Table 12. Current and Future Vessel Movements Under Various Utilization Scenarios (Number of Trips)
Commodity/Origin Current Fully Utilized Scenario 1 Scenario 2 Scenario 3
Crude Petroleum Vessel Trips
South America
VE -0 180 180 180 180 180
VE -1 187 187 187 187 187
VE - 2 194 194 194 194 194
VE - 3 202 202 202 202 202
VE - 4 211 211 211 211 211
VE - 5 220 220 220 220 220
VE -6 230 230 230 230 230
VE - 7 242 242 242 242 242
VE - 8 254 254 254 254 254
VE - 9 268 268 268 268 268
VE - 10 283 283 283 283 283
Bahamas
BR - 0 62 62 62 62 62
BR - 1 64 64 64 64 64
BR - 2 67 67 67 67 67
BR - 3 69 69 69 69 69
BR - 4 72 72 72 72 72
BR - 5 75 75 75 75 75
BR - 6 79 79 79 79 79
BR - 7 83 83 83 83 83
BR - 8 87 87 87 87 87
BR - 9 92 92 92 92 92
BR - 10 97 97 97 97 97
Mexico
MX - 0 51 51 51 51 51
MX - 1 53 53 53 53 53
MX - 2 56 56 56 56 56
MX - 3 58 58 58 58 58
MX - 4 60 60 60 60 60
MX - 5 63 63 63 63 63
MX- 6 66 66 66 66 66
MX - 7 69 69 69 69 69
MX - 8 73 73 73 73 73
MX - 9 76 76 76 76 76
MX - 10 81 81 81 81 81LNG
Egypt
EG - 0 68 565 333 283 167
EG - 1 70 585 345 293 173
EG - 2 73 606 358 303 179
EG - 3 75 629 371 315 186
EG - 4 78 654 386 327 193
EG - 5 82 681 402 340 201
EG - 6 85 710 419 355 209
EG - 7 89 741 437 371 219
EG - 8 93 776 458 388 229
EG - 9 98 814 480 407 240
EG - 10 103 856 505 428 252
Trinidad
TR - 0 9 77 45 39 23
TR - 1 9 80 47 40 24
TR - 2 10 83 49 41 24
TR - 3 10 86 51 43 25
TR - 4 10 89 53 45 26
TR - 5 11 93 55 46 27
TR - 6 11 97 57 48 29
TR - 7 12 101 60 51 30
TR - 8 12 106 62 53 31
TR - 9 13 111 65 55 33
TR - 10 14 117 69 58 34Total
Total - 0 370 935 671 615 483
Total - 1 383 969 696 637 501
Total - 2 400 1006 724 661 520
Total - 3 414 1044 751 687 540
Total - 4 431 1086 782 715 562
Total - 5 451 1132 815 744 586
Total - 6 471 1182 851 778 613
Total - 7 495 1236 891 816 643
Total - 8 519 1296 934 855 674
Total - 9 547 1361 981 898 709
Total - 10 578 1434 1035 947 747
22
7.0 CURRENT AND FUTURE COMMODITY MOVEMENT COSTS 7.1 Current Commodity Movement Costs Table 13 contains the current commodity movement costs for the existing foreign flag deep-draft vessels, representing approximately 20 million tonnes of annual crude oil imports and nearly five million tonnes of LNG imports. Crude oil annual voyage costs are developed for vessels deployed from Venezuela (VE), The Bahamas (BR), and Mexico (MX).14 LNG annual voyage costs are developed for vessels deployed from Egypt (EG) and Trinidad (TR).15
The vessel costs are computed for round-trip movements using the typical shipment sizes recorded by shipper data (refer to Attachment 2).16 For crude oil, the typical shipment size is nearly 70,000 tonnes; and for LNG, the typical shipment size is just under 60,000 tonnes. Table 13 computes the current annual vessel transportation costs based on average daily vessel voyage costs at sea and in port for loading and unloading using IWR Foreign Flag Vessel hourly costs. Crude petroleum transportation costs were based on 2008 IWR foreign flag deep-draft 90,000 dwt crude carriers, with average at-sea vessel costs of $986 per hour and in-port costs of $810 per hour. IWR does not estimate vessel operating costs for specialized vessels such as LNG pressurized vessels. Using 2008 IWR crude carrier operating costs, the USACE Galveston District (SWG) estimated at-sea and in-port operating costs for LNG vessels as part of the Sabine-Neches Waterway (SNWW) Channel Improvement Project (CIP) Feasibility Report. The SNWW Feasibility Report is evaluating the deepening of the SNWW which is located at the Texas/Louisiana State line and serves the Ports of Beaumont, Port Authur, and Orange, Texas. SWG estimated operating costs for 76,500 dwt, 100,000 dwt, and 125,000 dwt LNG vessels. LNG vessel operating costs were based on crude carrier costs that were adjusted to reflect increased capital costs, insurance premiums, crew sizes and repair requirements compared to crude carriers. The hourly at-sea costs for the 76,500 dwt vessels were estimated at $1,773, and the hourly in-port costs were estimated at $1,506. To maintain consistency with recent analyses, the LNG vessel operating costs estimated by SWG for the SNWW Feasibility Report will be used in this analysis. The voyage costs in Table 13 do not include accessory costs such as pilotage, tug assistance, or any of the port fees associated with vessel (dockage) or cargo (wharfage).17 The vessel voyage-related costs should comprise nearly all of the total transportation costs between the origin ports and the Calcasieu River. Table 13 computes the annual vessel voyage cost to move the tonnes of cargo on the respective trade routes. For example, for crude imports from Venezuela (estimated to be 12.25 million tonnes per year) a typical Aframax 90,000 dwt would carry 68,000 tonnes of crude, with round-trip vessel voyage costs of $261,798, and calling at
14
Some South America crude is loaded at Colombia, which has nearly the same voyage distance as Venezuela to Calcasieu River. 15
Some LNG is also reported loaded in Nigeria, which has nearly the same voyage distance as Egypt to Calcasieu River. 16
The shipper data included vessel name and shipment weight (pounds), but no other vessel characteristics (dwt, draft, etc.) were provided. 17
The accessory costs are relatively minor compared to the daily vessel costs and can be safely disregarded for the purposes of developing estimated voyage costs.

23
Table 13. Effects of Decreased Sailing Drafts on Annual Vessel Voyage Costs for Existing Deep-Draft Cargo Imports via Calcasieu River for Crude Oil and LNG
Trade Vessel Size Distance Cargo At Sea In Port Round Trip RT/Tone Vessel Max. Max. Sailing Annual Tones & Annual Excess
Lower Draft (DWT) (Miles) (Tonnes) (Vessel Costs) (Vessel Costs) (Vessel Costs) (Vessel Costs) Draft (feet) Draft (feet) Vessel Costs Vessel Costs
Crude - SA 12,250,000
VE -0 90,000 1785 68,000 $118,920 $11,979 $261,798 $3.85 47.3 40.22 $47,162,115 $0
VE -1 90,000 1785 65,529 $118,920 $11,632 $261,104 $3.98 47.3 39.22 $48,810,650 $1,648,535
VE - 2 90,000 1785 63,058 $118,920 $11,285 $260,410 $4.13 47.3 38.22 $50,588,374 $3,426,259
VE - 3 90,000 1785 60,588 $118,920 $10,938 $259,716 $4.29 47.3 37.22 $52,511,090 $5,348,975
VE - 4 90,000 1785 58,117 $118,920 $10,591 $259,022 $4.46 47.3 36.22 $54,597,293 $7,435,178
VE - 5 90,000 1785 55,646 $118,920 $10,244 $258,328 $4.64 47.3 35.22 $56,868,760 $9,706,645
VE -6 90,000 1785 53,175 $118,920 $9,897 $257,634 $4.85 47.3 34.22 $59,351,315 $12,189,200
VE - 7 90,000 1785 50,704 $118,920 $9,550 $256,940 $5.07 47.3 33.22 $62,075,818 $14,913,703
VE - 8 90,000 1785 48,234 $118,920 $9,204 $256,246 $5.31 47.3 32.22 $65,079,450 $17,917,335
VE - 9 90,000 1785 45,763 $118,920 $8,857 $255,552 $5.58 47.3 31.22 $68,407,422 $21,245,307
VE - 10 90,000 1785 43,292 $118,920 $8,510 $254,858 $5.89 47.3 30.22 $72,115,269 $24,953,154
Crude - BR 4,200,000
BR - 0 90,000 1145 68,000 $76,282 $11,979 $176,522 $2.60 47.3 40.22 $10,902,841 $0
BR - 1 90,000 1145 65,529 $76,282 $11,632 $175,828 $2.68 47.3 39.22 $11,269,458 $366,617
BR - 2 90,000 1145 63,058 $76,282 $11,285 $175,134 $2.78 47.3 38.22 $11,664,805 $761,964
BR - 3 90,000 1145 60,588 $76,282 $10,938 $174,440 $2.88 47.3 37.22 $12,092,397 $1,189,557
BR - 4 90,000 1145 58,117 $76,282 $10,591 $173,746 $2.99 47.3 36.22 $12,556,347 $1,653,506
BR - 5 90,000 1145 55,646 $76,282 $10,244 $173,052 $3.11 47.3 35.22 $13,061,498 $2,158,657
BR - 6 90,000 1145 53,175 $76,282 $9,897 $172,358 $3.24 47.3 34.22 $13,613,592 $2,710,751
BR - 7 90,000 1145 50,704 $76,282 $9,550 $171,664 $3.39 47.3 33.22 $14,219,493 $3,316,652
BR - 8 90,000 1145 48,234 $76,282 $9,204 $170,971 $3.54 47.3 32.22 $14,887,470 $3,984,629
BR - 9 90,000 1145 45,763 $76,282 $8,857 $170,277 $3.72 47.3 31.22 $15,627,576 $4,724,735
BR - 10 90,000 1145 43,292 $76,282 $8,510 $169,583 $3.92 47.3 30.22 $16,452,163 $5,549,322
Crude - MX 3,500,000
MX - 0 90,000 688 68,000 $45,836 $11,979 $115,630 $1.70 47.3 40.22 $5,951,545 $0
MX - 1 90,000 688 65,529 $45,836 $11,632 $114,936 $1.75 47.3 39.22 $6,138,885 $187,340
MX - 2 90,000 688 63,058 $45,836 $11,285 $114,242 $1.81 47.3 38.22 $6,340,906 $389,361
MX - 3 90,000 688 60,588 $45,836 $10,938 $113,548 $1.87 47.3 37.22 $6,559,404 $607,859
MX - 4 90,000 688 58,117 $45,836 $10,591 $112,854 $1.94 47.3 36.22 $6,796,481 $844,935
MX - 5 90,000 688 55,646 $45,836 $10,244 $112,160 $2.02 47.3 35.22 $7,054,611 $1,103,065
MX- 6 90,000 688 53,175 $45,836 $9,897 $111,466 $2.10 47.3 34.22 $7,336,729 $1,385,183
MX - 7 90,000 688 50,704 $45,836 $9,550 $110,772 $2.18 47.3 33.22 $7,646,342 $1,694,796
MX - 8 90,000 688 48,234 $45,836 $9,204 $110,078 $2.28 47.3 32.22 $7,987,675 $2,036,130
MX - 9 90,000 688 45,763 $45,836 $8,857 $109,384 $2.39 47.3 31.22 $8,365,867 $2,414,321
MX - 10 90,000 688 43,292 $45,836 $8,510 $108,690 $2.51 47.3 30.22 $8,787,227 $2,835,682
LNG Trunkline 4,200,000
EG - 0 70,000 6629 62,000 $794,136 $20,706 $1,629,685 $26.29 37 35.86 $110,398,001 $0
EG - 1 70,000 6629 59,895 $794,136 $20,157 $1,628,586 $27.19 37 34.86 $114,200,466 $3,802,465
EG - 2 70,000 6629 57,790 $794,136 $19,607 $1,627,487 $28.16 37 33.86 $118,279,912 $7,881,911
EG - 3 70,000 6629 55,686 $794,136 $19,057 $1,626,387 $29.21 37 32.86 $122,667,748 $12,269,747
EG - 4 70,000 6629 53,581 $794,136 $18,508 $1,625,288 $30.33 37 31.86 $127,400,316 $17,002,315
EG - 5 70,000 6629 51,476 $794,136 $17,958 $1,624,189 $31.55 37 30.86 $132,519,903 $22,121,902
EG - 6 70,000 6629 49,371 $794,136 $17,409 $1,623,090 $32.88 37 29.86 $138,076,008 $27,678,008
EG - 7 70,000 6629 47,266 $794,136 $16,859 $1,621,991 $34.32 37 28.86 $144,126,947 $33,728,946
EG - 8 70,000 6629 45,162 $794,136 $16,310 $1,620,892 $35.89 37 27.86 $150,741,905 $40,343,904
EG - 9 70,000 6629 43,057 $794,136 $15,760 $1,619,793 $37.62 37 26.86 $158,003,598 $47,605,597
EG - 10 70,000 6629 40,952 $794,136 $15,211 $1,618,694 $39.53 37 25.86 $166,011,746 $55,613,745
560,000
TR - 0 70,000 2260 62,000 $270,742 $20,706 $582,896 $9.40 37 35.86 $5,264,867 $0
TR - 1 70,000 2260 59,895 $270,742 $20,157 $581,797 $9.71 37 34.86 $5,439,605 $174,738
TR - 2 70,000 2260 57,790 $270,742 $19,607 $580,698 $10.05 37 33.86 $5,627,072 $362,205
TR - 3 70,000 2260 55,686 $270,742 $19,057 $579,599 $10.41 37 32.86 $5,828,710 $563,843
TR - 4 70,000 2260 53,581 $270,742 $18,508 $578,500 $10.80 37 31.86 $6,046,191 $781,324
TR - 5 70,000 2260 51,476 $270,742 $17,958 $577,400 $11.22 37 30.86 $6,281,456 $1,016,589
TR - 6 70,000 2260 49,371 $270,742 $17,409 $576,301 $11.67 37 29.86 $6,536,781 $1,271,914
TR - 7 70,000 2260 47,266 $270,742 $16,859 $575,202 $12.17 37 28.86 $6,814,845 $1,549,978
TR - 8 70,000 2260 45,162 $270,742 $16,310 $574,103 $12.71 37 27.86 $7,118,829 $1,853,962
TR - 9 70,000 2260 43,057 $270,742 $15,760 $573,004 $13.31 37 26.86 $7,452,532 $2,187,665
TR - 10 70,000 2260 40,952 $270,742 $15,211 $571,905 $13.97 37 25.86 $7,820,538 $2,555,671
Notes: Vessel "At Sea" voyage costs and "In Port" vessel costs based on IWR Foreign Flag Vessel Costs (2008 price levels) for Tankers and adjusted upward for LNG vessels.
Vessel costs do not include port and related loading/unloading costs and accessory costs such as pilotage, tug assistance, etc.
Trades reflect existing crude oil and LNG imports for Calcasieu River as follows: SA = South America (Venezuela and Colombia)
BR = Bahamas; MX = Mexico; LNG imports from EG = Egypt and TR = Trinidad
Source: G.E.C., Inc.

24
Calcasieu River with an estimated maximum sailing draft of just over 40 feet (40.22 feet).18 To move 12.25 million tonnes of crude in this lane (Venezuela), the total annual vessel voyage costs would be $47.16 million. Similarly, for LNG imports from Egypt, a 76,500 dwt LNG vessel is estimated to carry 62,000 tonnes, with a round-trip voyage cost of $1,629,685, and calling at Calcasieu River with an estimated maximum draft of 35.86 feet. The 35.86 foot sailing draft of these vessels is an overall estimate based on cargo and does not include allowances for bunkers, water, stores, etc. which add about a foot to the draft. (For this analysis, access to actual sailing drafts for particular vessels, other than the number of trips and vessel drafts, as presented in Table 10, were not available.) LNG and other pressurized vessels will commonly call with a four-foot underkeel clearance, nearly double that of dry bulk and non-pressurized tankers. Therefore, to move 4.2 million tonnes of LNG in this lane (Egypt), the total annual vessel voyage costs would be $110.4 million.19 Table 14 compiles the current annual vessel voyage costs (Existing Cargo Vessel Costs) as $179.7 million per year, which is the summation of the three crude oil lanes and the two LNG lanes from Table 13.
Table 14. Effects of Decreased Sailing Draft on Annual Vessel Voyage Costs for Existing and Expanded Cargo Imports by Calcasieu River
Existing Cargo Expanded Cargo
Lower Draft Existing Cargo Increased Expanded Cargo Increased
(Feet) Vessel Costs Vessel Costs Vessel Costs Vessel Costs
0 $179,679,369 $0 $805,562,636 $0
1 $185,859,065 $6,179,696 $833,274,322 $27,711,686
2 $192,501,069 $12,821,700 $863,016,763 $57,454,127
3 $199,659,350 $19,979,981 $895,021,776 $89,459,140
4 $207,396,627 $27,717,258 $929,557,881 $123,995,245
5 $215,786,227 $36,106,858 $966,937,861 $161,375,225
6 $224,914,425 $45,235,056 $1,007,528,283 $201,965,647
7 $234,883,445 $55,204,076 $1,051,761,588 $246,198,952
8 $245,815,328 $66,135,959 $1,100,151,598 $294,588,961
9 $257,856,995 $78,177,626 $1,153,313,616 $347,750,980
10 $271,186,943 $91,507,574 $1,211,990,821 $406,428,185
Note: Existing Cargo Vessel Costs from Table 13 and Expanded Cargo Vessel Costs from Table 15.
Source: G.E.C., Inc
18
Sailing drafts estimated based on IWR average vessel characteristics (tpi) and not for particular vessels for which TPI could be slightly higher or lower, resulting in small differences in actual sailing drafts (not including allowances for trim). 19
LNG and other pressurized vessels will commonly call with a four-foot underkeel clearance, nearly double that of dry bulk and non-pressurized tankers.
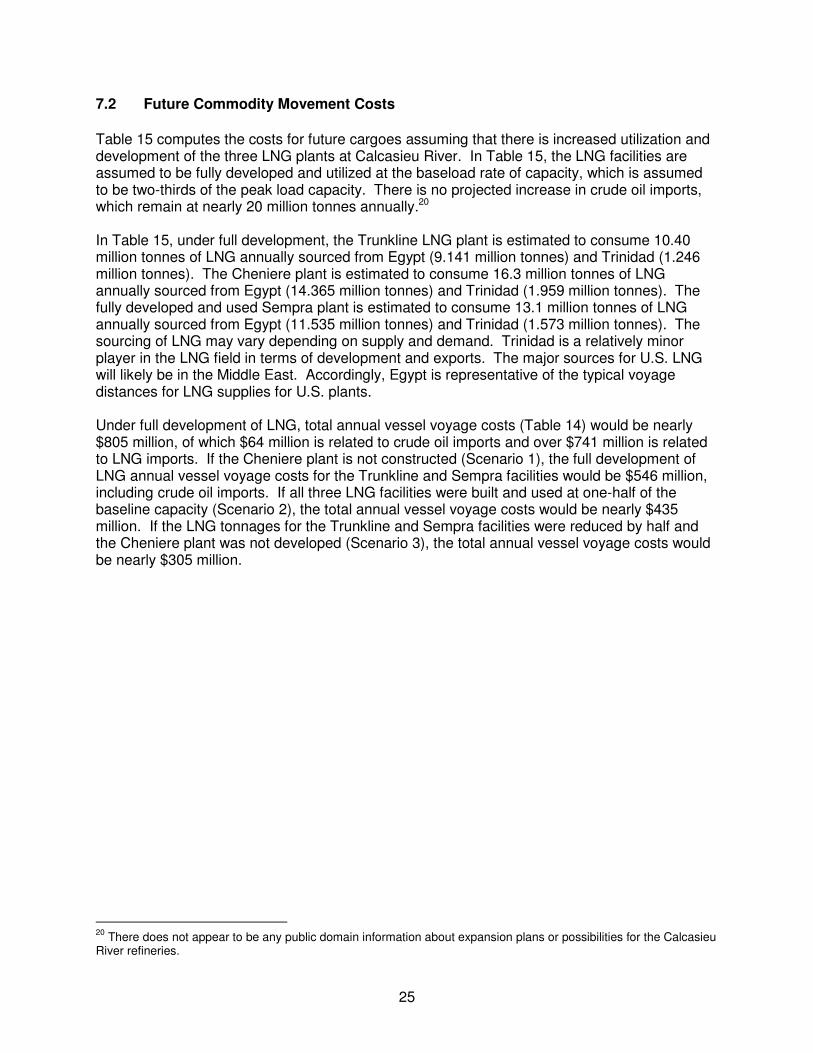
25
7.2 Future Commodity Movement Costs
Table 15 computes the costs for future cargoes assuming that there is increased utilization and development of the three LNG plants at Calcasieu River. In Table 15, the LNG facilities are assumed to be fully developed and utilized at the baseload rate of capacity, which is assumed to be two-thirds of the peak load capacity. There is no projected increase in crude oil imports, which remain at nearly 20 million tonnes annually.20 In Table 15, under full development, the Trunkline LNG plant is estimated to consume 10.40 million tonnes of LNG annually sourced from Egypt (9.141 million tonnes) and Trinidad (1.246 million tonnes). The Cheniere plant is estimated to consume 16.3 million tonnes of LNG annually sourced from Egypt (14.365 million tonnes) and Trinidad (1.959 million tonnes). The fully developed and used Sempra plant is estimated to consume 13.1 million tonnes of LNG annually sourced from Egypt (11.535 million tonnes) and Trinidad (1.573 million tonnes). The sourcing of LNG may vary depending on supply and demand. Trinidad is a relatively minor player in the LNG field in terms of development and exports. The major sources for U.S. LNG will likely be in the Middle East. Accordingly, Egypt is representative of the typical voyage distances for LNG supplies for U.S. plants. Under full development of LNG, total annual vessel voyage costs (Table 14) would be nearly $805 million, of which $64 million is related to crude oil imports and over $741 million is related to LNG imports. If the Cheniere plant is not constructed (Scenario 1), the full development of LNG annual vessel voyage costs for the Trunkline and Sempra facilities would be $546 million, including crude oil imports. If all three LNG facilities were built and used at one-half of the baseline capacity (Scenario 2), the total annual vessel voyage costs would be nearly $435 million. If the LNG tonnages for the Trunkline and Sempra facilities were reduced by half and the Cheniere plant was not developed (Scenario 3), the total annual vessel voyage costs would be nearly $305 million.
20
There does not appear to be any public domain information about expansion plans or possibilities for the Calcasieu River refineries.

26
Table 15. Effects of Decreased Sailing Drafts on Annual Vessel Voyage Costs for Expanded Deep Draft
Trade Vessel Size Distance Cargo At Sea In Port Round Trip RT/Tone Vessel Max. Max. Sailing Annual Tones & Annual Excess
Lower Draft (DWT) (Miles) (Tonnes) (Vessel Costs) (Vessel Costs) (Vessel Costs) (Vessel Costs) Draft (feet) Draft (feet) Vessel Costs Vessel Costs
Crude - SA 12,250,000
VE -0 90,000 1785 68,000 $118,920 $11,979 $261,798 $3.85 47.3 40.22 $47,162,115 $0
VE -1 90,000 1785 65,529 $118,920 $11,632 $261,104 $3.98 47.3 39.22 $48,810,650 $1,648,535
VE - 2 90,000 1785 63,058 $118,920 $11,285 $260,410 $4.13 47.3 38.22 $50,588,374 $3,426,259
VE - 3 90,000 1785 60,588 $118,920 $10,938 $259,716 $4.29 47.3 37.22 $52,511,090 $5,348,975
VE - 4 90,000 1785 58,117 $118,920 $10,591 $259,022 $4.46 47.3 36.22 $54,597,293 $7,435,178
VE - 5 90,000 1785 55,646 $118,920 $10,244 $258,328 $4.64 47.3 35.22 $56,868,760 $9,706,645
VE -6 90,000 1785 53,175 $118,920 $9,897 $257,634 $4.85 47.3 34.22 $59,351,315 $12,189,200
VE - 7 90,000 1785 50,704 $118,920 $9,550 $256,940 $5.07 47.3 33.22 $62,075,818 $14,913,703
VE - 8 90,000 1785 48,234 $118,920 $9,204 $256,246 $5.31 47.3 32.22 $65,079,450 $17,917,335
VE - 9 90,000 1785 45,763 $118,920 $8,857 $255,552 $5.58 47.3 31.22 $68,407,422 $21,245,307
VE - 10 90,000 1785 43,292 $118,920 $8,510 $254,858 $5.89 47.3 30.22 $72,115,269 $24,953,154
Crude - BR 4,200,000
BR - 0 90,000 1145 68,000 $76,282 $11,979 $176,522 $2.60 47.3 40.22 $10,902,841 $0
BR - 1 90,000 1145 65,529 $76,282 $11,632 $175,828 $2.68 47.3 39.22 $11,269,458 $366,617
BR - 2 90,000 1145 63,058 $76,282 $11,285 $175,134 $2.78 47.3 38.22 $11,664,805 $761,964
BR - 3 90,000 1145 60,588 $76,282 $10,938 $174,440 $2.88 47.3 37.22 $12,092,397 $1,189,557
BR - 4 90,000 1145 58,117 $76,282 $10,591 $173,746 $2.99 47.3 36.22 $12,556,347 $1,653,506
BR - 5 90,000 1145 55,646 $76,282 $10,244 $173,052 $3.11 47.3 35.22 $13,061,498 $2,158,657
BR - 6 90,000 1145 53,175 $76,282 $9,897 $172,358 $3.24 47.3 34.22 $13,613,592 $2,710,751
BR - 7 90,000 1145 50,704 $76,282 $9,550 $171,664 $3.39 47.3 33.22 $14,219,493 $3,316,652
BR - 8 90,000 1145 48,234 $76,282 $9,204 $170,971 $3.54 47.3 32.22 $14,887,470 $3,984,629
BR - 9 90,000 1145 45,763 $76,282 $8,857 $170,277 $3.72 47.3 31.22 $15,627,576 $4,724,735
BR - 10 90,000 1145 43,292 $76,282 $8,510 $169,583 $3.92 47.3 30.22 $16,452,163 $5,549,322
Crude - MX 3,500,000
MX - 0 90,000 688 68,000 $45,836 $11,979 $115,630 $1.70 47.3 40.22 $5,951,545 $0
MX - 1 90,000 688 65,529 $45,836 $11,632 $114,936 $1.75 47.3 39.22 $6,138,885 $187,340
MX - 2 90,000 688 63,058 $45,836 $11,285 $114,242 $1.81 47.3 38.22 $6,340,906 $389,361
MX - 3 90,000 688 60,588 $45,836 $10,938 $113,548 $1.87 47.3 37.22 $6,559,404 $607,859
MX - 4 90,000 688 58,117 $45,836 $10,591 $112,854 $1.94 47.3 36.22 $6,796,481 $844,935
MX - 5 90,000 688 55,646 $45,836 $10,244 $112,160 $2.02 47.3 35.22 $7,054,611 $1,103,065
MX- 6 90,000 688 53,175 $45,836 $9,897 $111,466 $2.10 47.3 34.22 $7,336,729 $1,385,183
MX - 7 90,000 688 50,704 $45,836 $9,550 $110,772 $2.18 47.3 33.22 $7,646,342 $1,694,796
MX - 8 90,000 688 48,234 $45,836 $9,204 $110,078 $2.28 47.3 32.22 $7,987,675 $2,036,130
MX - 9 90,000 688 45,763 $45,836 $8,857 $109,384 $2.39 47.3 31.22 $8,365,867 $2,414,321
MX - 10 90,000 688 43,292 $45,836 $8,510 $108,690 $2.51 47.3 30.22 $8,787,227 $2,835,682
LNG Trunkline 9,141,339
EG - 0 70,000 6629 62,000 $519,570 $13,062 $1,065,264 $17.18 37 35.86 $157,063,502 $0
EG - 1 70,000 6629 59,895 $519,570 $12,715 $1,064,570 $17.77 37 34.86 $162,477,112 $5,413,610
EG - 2 70,000 6629 57,790 $519,570 $12,368 $1,063,877 $18.41 37 33.86 $168,285,062 $11,221,561
EG - 3 70,000 6629 55,686 $519,570 $12,022 $1,063,184 $19.09 37 32.86 $174,532,070 $17,468,569
EG - 4 70,000 6629 53,581 $519,570 $11,675 $1,062,490 $19.83 37 31.86 $181,269,877 $24,206,375
EG - 5 70,000 6629 51,476 $519,570 $11,328 $1,061,797 $20.63 37 30.86 $188,558,688 $31,495,186
EG - 6 70,000 6629 49,371 $519,570 $10,982 $1,061,104 $21.49 37 29.86 $196,468,974 $39,405,472
EG - 7 70,000 6629 47,266 $519,570 $10,635 $1,060,410 $22.43 37 28.86 $205,083,759 $48,020,257
EG - 8 70,000 6629 45,162 $519,570 $10,288 $1,059,717 $23.47 37 27.86 $214,501,545 $57,438,043
EG - 9 70,000 6629 43,057 $519,570 $9,942 $1,059,024 $24.60 37 26.86 $224,840,094 $67,776,592
EG - 10 70,000 6629 40,952 $519,570 $9,595 $1,058,330 $25.84 37 25.86 $236,241,378 $79,177,876
1,246,546
TR - 0 70,000 2260 62,000 $177,135 $13,062 $380,394 $6.14 37 35.86 $7,648,034 $0
TR - 1 70,000 2260 59,895 $177,135 $12,715 $379,700 $6.34 37 34.86 $7,902,366 $254,333
TR - 2 70,000 2260 57,790 $177,135 $12,368 $379,007 $6.56 37 33.86 $8,175,225 $527,192
TR - 3 70,000 2260 55,686 $177,135 $12,022 $378,313 $6.79 37 32.86 $8,468,711 $820,677
TR - 4 70,000 2260 53,581 $177,135 $11,675 $377,620 $7.05 37 31.86 $8,785,255 $1,137,221
TR - 5 70,000 2260 51,476 $177,135 $11,328 $376,927 $7.32 37 30.86 $9,127,685 $1,479,651
TR - 6 70,000 2260 49,371 $177,135 $10,982 $376,233 $7.62 37 29.86 $9,499,312 $1,851,278
TR - 7 70,000 2260 47,266 $177,135 $10,635 $375,540 $7.95 37 28.86 $9,904,037 $2,256,003
TR - 8 70,000 2260 45,162 $177,135 $10,288 $374,847 $8.30 37 27.86 $10,346,486 $2,698,453
TR - 9 70,000 2260 43,057 $177,135 $9,942 $374,153 $8.69 37 26.86 $10,832,194 $3,184,160
TR - 10 70,000 2260 40,952 $177,135 $9,595 $373,460 $9.12 37 25.86 $11,367,829 $3,719,795
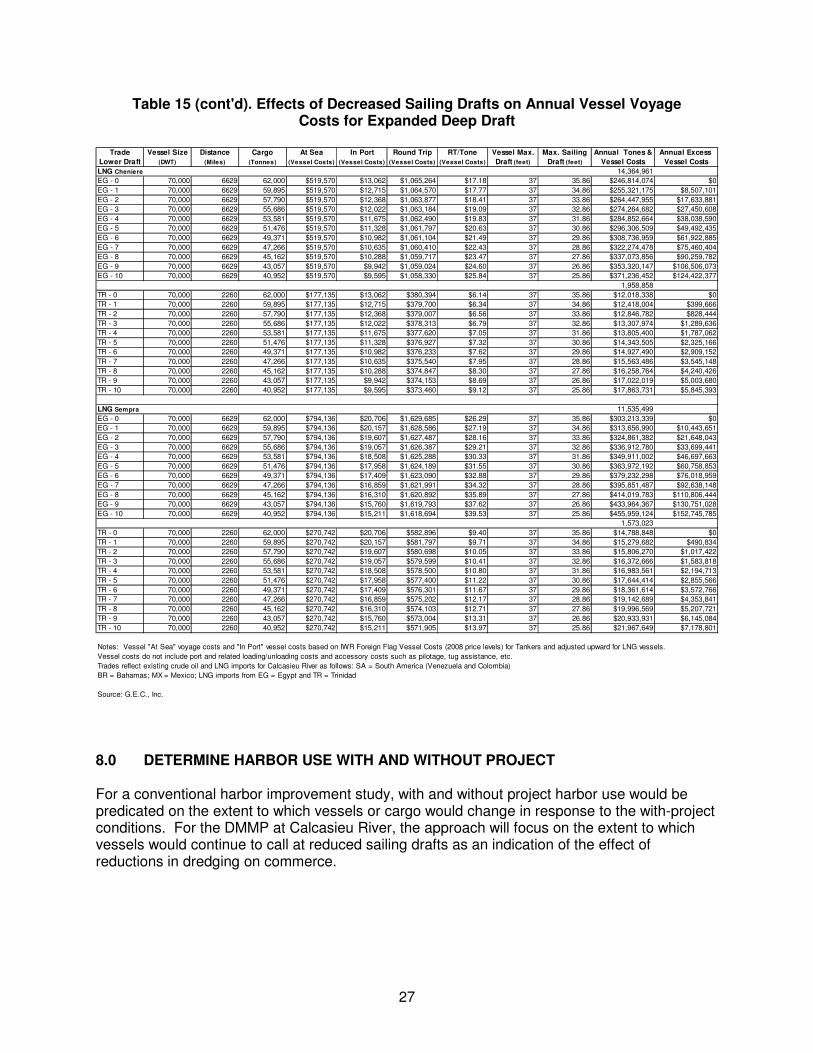
27
Table 15 (cont'd). Effects of Decreased Sailing Drafts on Annual Vessel Voyage Costs for Expanded Deep Draft
Trade Vessel Size Distance Cargo At Sea In Port Round Trip RT/Tone Vessel Max. Max. Sailing Annual Tones & Annual Excess
Lower Draft (DWT) (Miles) (Tonnes) (Vessel Costs) (Vessel Costs) (Vessel Costs) (Vessel Costs) Draft (feet) Draft (feet) Vessel Costs Vessel Costs
LNG Cheniere 14,364,961
EG - 0 70,000 6629 62,000 $519,570 $13,062 $1,065,264 $17.18 37 35.86 $246,814,074 $0
EG - 1 70,000 6629 59,895 $519,570 $12,715 $1,064,570 $17.77 37 34.86 $255,321,175 $8,507,101
EG - 2 70,000 6629 57,790 $519,570 $12,368 $1,063,877 $18.41 37 33.86 $264,447,955 $17,633,881
EG - 3 70,000 6629 55,686 $519,570 $12,022 $1,063,184 $19.09 37 32.86 $274,264,682 $27,450,608
EG - 4 70,000 6629 53,581 $519,570 $11,675 $1,062,490 $19.83 37 31.86 $284,852,664 $38,038,590
EG - 5 70,000 6629 51,476 $519,570 $11,328 $1,061,797 $20.63 37 30.86 $296,306,509 $49,492,435
EG - 6 70,000 6629 49,371 $519,570 $10,982 $1,061,104 $21.49 37 29.86 $308,736,959 $61,922,885
EG - 7 70,000 6629 47,266 $519,570 $10,635 $1,060,410 $22.43 37 28.86 $322,274,478 $75,460,404
EG - 8 70,000 6629 45,162 $519,570 $10,288 $1,059,717 $23.47 37 27.86 $337,073,856 $90,259,782
EG - 9 70,000 6629 43,057 $519,570 $9,942 $1,059,024 $24.60 37 26.86 $353,320,147 $106,506,073
EG - 10 70,000 6629 40,952 $519,570 $9,595 $1,058,330 $25.84 37 25.86 $371,236,452 $124,422,377
1,958,858
TR - 0 70,000 2260 62,000 $177,135 $13,062 $380,394 $6.14 37 35.86 $12,018,338 $0
TR - 1 70,000 2260 59,895 $177,135 $12,715 $379,700 $6.34 37 34.86 $12,418,004 $399,666
TR - 2 70,000 2260 57,790 $177,135 $12,368 $379,007 $6.56 37 33.86 $12,846,782 $828,444
TR - 3 70,000 2260 55,686 $177,135 $12,022 $378,313 $6.79 37 32.86 $13,307,974 $1,289,636
TR - 4 70,000 2260 53,581 $177,135 $11,675 $377,620 $7.05 37 31.86 $13,805,400 $1,787,062
TR - 5 70,000 2260 51,476 $177,135 $11,328 $376,927 $7.32 37 30.86 $14,343,505 $2,325,166
TR - 6 70,000 2260 49,371 $177,135 $10,982 $376,233 $7.62 37 29.86 $14,927,490 $2,909,152
TR - 7 70,000 2260 47,266 $177,135 $10,635 $375,540 $7.95 37 28.86 $15,563,486 $3,545,148
TR - 8 70,000 2260 45,162 $177,135 $10,288 $374,847 $8.30 37 27.86 $16,258,764 $4,240,426
TR - 9 70,000 2260 43,057 $177,135 $9,942 $374,153 $8.69 37 26.86 $17,022,019 $5,003,680
TR - 10 70,000 2260 40,952 $177,135 $9,595 $373,460 $9.12 37 25.86 $17,863,731 $5,845,393
LNG Sempra 11,535,499
EG - 0 70,000 6629 62,000 $794,136 $20,706 $1,629,685 $26.29 37 35.86 $303,213,339 $0
EG - 1 70,000 6629 59,895 $794,136 $20,157 $1,628,586 $27.19 37 34.86 $313,656,990 $10,443,651
EG - 2 70,000 6629 57,790 $794,136 $19,607 $1,627,487 $28.16 37 33.86 $324,861,382 $21,648,043
EG - 3 70,000 6629 55,686 $794,136 $19,057 $1,626,387 $29.21 37 32.86 $336,912,780 $33,699,441
EG - 4 70,000 6629 53,581 $794,136 $18,508 $1,625,288 $30.33 37 31.86 $349,911,002 $46,697,663
EG - 5 70,000 6629 51,476 $794,136 $17,958 $1,624,189 $31.55 37 30.86 $363,972,192 $60,758,853
EG - 6 70,000 6629 49,371 $794,136 $17,409 $1,623,090 $32.88 37 29.86 $379,232,298 $76,018,959
EG - 7 70,000 6629 47,266 $794,136 $16,859 $1,621,991 $34.32 37 28.86 $395,851,487 $92,638,148
EG - 8 70,000 6629 45,162 $794,136 $16,310 $1,620,892 $35.89 37 27.86 $414,019,783 $110,806,444
EG - 9 70,000 6629 43,057 $794,136 $15,760 $1,619,793 $37.62 37 26.86 $433,964,367 $130,751,028
EG - 10 70,000 6629 40,952 $794,136 $15,211 $1,618,694 $39.53 37 25.86 $455,959,124 $152,745,785
1,573,023
TR - 0 70,000 2260 62,000 $270,742 $20,706 $582,896 $9.40 37 35.86 $14,788,848 $0
TR - 1 70,000 2260 59,895 $270,742 $20,157 $581,797 $9.71 37 34.86 $15,279,682 $490,834
TR - 2 70,000 2260 57,790 $270,742 $19,607 $580,698 $10.05 37 33.86 $15,806,270 $1,017,422
TR - 3 70,000 2260 55,686 $270,742 $19,057 $579,599 $10.41 37 32.86 $16,372,666 $1,583,818
TR - 4 70,000 2260 53,581 $270,742 $18,508 $578,500 $10.80 37 31.86 $16,983,561 $2,194,713
TR - 5 70,000 2260 51,476 $270,742 $17,958 $577,400 $11.22 37 30.86 $17,644,414 $2,855,566
TR - 6 70,000 2260 49,371 $270,742 $17,409 $576,301 $11.67 37 29.86 $18,361,614 $3,572,766
TR - 7 70,000 2260 47,266 $270,742 $16,859 $575,202 $12.17 37 28.86 $19,142,689 $4,353,841
TR - 8 70,000 2260 45,162 $270,742 $16,310 $574,103 $12.71 37 27.86 $19,996,569 $5,207,721
TR - 9 70,000 2260 43,057 $270,742 $15,760 $573,004 $13.31 37 26.86 $20,933,931 $6,145,084
TR - 10 70,000 2260 40,952 $270,742 $15,211 $571,905 $13.97 37 25.86 $21,967,649 $7,178,801
Notes: Vessel "At Sea" voyage costs and "In Port" vessel costs based on IWR Foreign Flag Vessel Costs (2008 price levels) for Tankers and adjusted upward for LNG vessels.
Vessel costs do not include port and related loading/unloading costs and accessory costs such as pilotage, tug assistance, etc.
Trades reflect existing crude oil and LNG imports for Calcasieu River as follows: SA = South America (Venezuela and Colombia)
BR = Bahamas; MX = Mexico; LNG imports from EG = Egypt and TR = Trinidad
Source: G.E.C., Inc.
8.0 DETERMINE HARBOR USE WITH AND WITHOUT PROJECT For a conventional harbor improvement study, with and without project harbor use would be predicated on the extent to which vessels or cargo would change in response to the with-project conditions. For the DMMP at Calcasieu River, the approach will focus on the extent to which vessels would continue to call at reduced sailing drafts as an indication of the effect of reductions in dredging on commerce.

28
The natural depth of the Calcasieu River has been estimated to be shallow to the degree that commercial navigation would cease in the absence of dredging.21 For the without-project conditions (that is, without dredging), there would eventually be no commercial navigation on the Calcasieu River. The effective closure of the waterway would displace the nearly 50 million tonnes of cargo that is currently handled and upwards of 80 to 90 million tonnes assuming fullscale development and utilization of the three LNG plants. To capture some sense of the value of dredging the Calcasieu River, the deepest draft vessels with the largest existing and projected cargo volumes were assumed to be sequentially draft constrained by increments of one foot from the existing 40-foot channel to a 30-foot channel. Tables 13 and 15 indicate the annual vessel voyage costs in response to sailing draft reductions of one foot to 10 feet, corresponding to 39 to 30 foot drafts for existing and future commodity flows, respectively. The same vessel sizes are assumed to sail with less cargo and therefore make more trips. Substituting smaller vessels for draft reductions results in higher annual vessel voyage costs than increased light loading of the existing fleet of 90,000 dwt crude carriers and 70,000 dwt LNG carriers.22 In Table 13, a reduction in sailing draft to 39 feet for the crude oil Venezuela trade (VE – 1) would result in total annual vessel voyage costs of $48.8 million, up from total annual vessel voyage costs of $47.1 million under the 40-foot authorized depth (VE – 0). The increase in annual vessel voyage costs is $1.65 million. Similarly for the existing Trunkline facility level of capacity and utilization in Table 11, a one-foot sailing draft reduction for the Egypt lane (EG – 1) results in total annual vessel voyage costs of $114.2 million. This is an increase of $3.8 million from the 40-foot draft (EG – 0) total annual vessel voyage costs of $110.4 million. The increased annual vessel voyage costs are developed in the same manner in Table 13 for the crude oil volumes, which are not forecasted to increase, and the LNG volumes, which are forecasted to develop up to 40 million tonnes under full plant expansion and full (baseline) utilization. For example, a fully developed and utilized Trunkline plant is estimated to import 9.141 million tonnes of LNG from the Middle East (Egypt) at a total annual vessel voyage cost of $157.1 million for the existing 40-foot deep channel (EG – 0). For a 39-foot deep channel (EG – 1), the total annual vessel voyage costs would be $162.5 million, which is an increase of $5.4 million. Table 14 summarizes the total annual vessel voyage costs for existing cargo (Table 13) and future cargo constituted by fully developed and utilized LNG plants (Table 15). The increased annual vessel voyage costs for existing cargo (nearly 20 million tonnes of crude oil imports and nearly five million tonnes of LNG imports) range from $6.2 million for a one-foot reduction in project depth, (a 39-foot deep channel), to $91.5 million for a 10-foot reduction in project depth (a 30-foot deep channel). For the future cargo under full LNG plant expansion and utilization, the increase in annual total vessel voyage costs would range from $27.7 million for a one-foot reduction (39-foot draft) to $406.4 million for a 10-foot reduction (30-foot draft).
21
Communication with W. D. Mears, Gahagan & Bryant Associates, Inc., July 24, 2006, estimating that the controlling depth without dredging would be reduced to the natural depth of the remainder of the lake, which varies between five and seven feet. 22
It is likely beyond some modest reduction in sailing draft that the crude tankers would begin to make split deliveries, effectively light loading before calling Calcasieu River. There is some evidence of split deliveries occurring now as noted earlier for some of the MV Kareela Spirit calls. The increased costs of light-loaded split calls in response to less draft at Calcasieu River would be the additional sailing time and related port costs. A similar phenomenon is also possible for LNG vessels constrained by a substantial reduction in sailing draft at Calcasieu River.

29
Table 16 contains the three scenarios for total annual vessel voyage costs pertaining to different developments and utilization of LNG plants at Calcasieu River; Scenario 1 excludes the Cheniere facility under a “no-build” scenario; Scenario 2 halves the fully developed LNG import tonnages at the three Calcasieu River plants; and Scenario 3 excludes Cheniere and halves the LNG import tonnages for the Trunkline and Sempra plants. For Scenario 1, future annual vessel voyage costs would increase by $18.8 million for the first foot of draft reduction, increasing to $276.2 million for a 10-foot draft reduction. For Scenario 2 (halving LNG imports), the future annual vessel voyage costs would increase by $14.95 million for the first foot of draft reduction and up to $219.9 million for a 10-foot draft reduction. For Scenario 3 (excluding Cheniere and halving Trunkline and Sempra imports), future annual vessel voyage costs would increase by $10.5 million for the first foot of draft reduction and increase to $154.7 million for a 10-foot draft reduction.
Table 16. Effects of Decreased Sailing Drafts on Annual Vessel Voyage Costs for Expanded Cargo Import Scenarios by Calcasieu River
Scenario 1 Scenario 2 Scenario 3
Scenario 1 Expanded Cargo Scenario 2 Expanded Cargo Scenario 3 Expanded Cargo
Lower Draft Expanded Cargo Increased Expanded Cargo Increased Expanded Cargo Increased
(Feet) Vessel Costs Vessel Costs Vessel Costs Vessel Costs Vessel Costs Vessel Costs
0 $546,730,223 $0 $434,789,569 $0 $305,373,362 $0
1 $565,535,143 $18,804,920 $449,746,658 $14,957,089 $315,877,068 $10,503,706
2 $585,722,025 $38,991,802 $465,805,424 $31,015,855 $327,158,055 $21,784,693
3 $607,449,120 $60,718,896 $483,092,334 $48,302,765 $339,306,006 $33,932,643
4 $630,899,817 $84,169,593 $501,754,001 $66,964,433 $352,424,969 $47,051,607
5 $656,287,847 $109,557,623 $521,961,365 $87,171,796 $366,636,358 $61,262,995
6 $683,863,834 $137,133,611 $543,914,960 $109,125,391 $382,082,735 $76,709,373
7 $713,923,624 $167,193,401 $567,851,621 $133,062,052 $398,932,639 $93,559,276
8 $746,818,977 $200,088,754 $594,053,096 $159,263,527 $417,386,786 $112,013,424
9 $782,971,451 $236,241,227 $622,857,241 $188,067,672 $437,686,158 $132,312,795
10 $822,890,639 $276,160,415 $654,672,740 $219,883,171 $460,122,649 $154,749,286
Notes: Scenario 1 reflects exclusion of the Cheniere plant LNG tonnages under a "no build" assumption (includes 23.49 million tonnes
of LNG and 19.95 million tonnes of crude petroleum).
Scenario 2 reflects halving of the baseline tonnages for the three LNG plants (includes 19.91 million tonnes of LNG and 19.95 million
tonnes of crude petroleum).
Scenario 3 reflects exclusion of the Cheniere plant LNG tonnages and halving of the baseline tonnages for the Trunkline and Sempra
plants (includes 11.75 million tonnes of LNG and 19.95 million tonnes of crude petroleum).
Source: G.E.C., Inc. 9.0 COMPUTE BENEFITS 9.1 Major Assumptions Used in Computing Benefits As with any forecast involving multiple interacting factors, assumptions were made during the development of this economic analysis. The major assumptions used in this analysis are as follows:
1. The current volume of crude oil imports at Calcasieu River was assumed to remain at nearly 20 million metric tonnes over the period of analysis. The sources of imported crude were assumed to be South America (Venezuela and Colombia), The Bahamas, and Mexico, or ports of similar distance from Calcasieu River.

30
2. The sources of LNG were assumed to be Egypt and Trinidad, or ports of similar distance from Calcasieu River.
3. The full and/or partial development/operation of the following LNG facilities at Calcasieu
River was assumed: (1) Trunkline, (2) Creole Trail (Cheniere), and (3) Cameron (Sempra).
4. Three operational scenarios were assumed.
a) Scenario 1 excludes tonnages associated with the approved Cheniere LNG facility, with total annual shipments of 43.44 million tonnes, including 23.49 million tonnes of LNG.
b) Scenario 2 assumes all three LNG facilities operate at 50 percent of their baseline capacity, with total annual shipments of 39.86 million tones, including 19.91 million tonnes of LNG.
c) Scenario 3 assumes that the Trunkline and Sempra LNG facilities operate at 50 percent of capacity and the Cheniere facility is not developed, with total annual shipment of 31.70 million tones, including 11.745 million tonnes of LNG.
5. Two average annual without-project shoaling rates (draft reduction rates) were assumed: (1) one foot of draft reduction per year, and (2) one foot of draft reduction every two years (one-half foot a year). Under both assumptions, and for with-project conditions, there would be no draft reductions for the first two years after a dredging event. Assuming one foot of draft reduction every two years results in a maximum draft reduction of 9 feet by year 19 of the project. Assuming one foot of draft reduction per year, the maximum draft reductions of 10 feet occurs in year 12 of the project; this reduction was assumed to remain constant for the remainder of the project.
6. Crude petroleum vessel costs assumed the use of 90,000 dwt crude carriers, carrying 68,000 tonnes of cargo and drafting 40.22 feet under unrestricted conditions on the Calcasieu River.
7. LNG vessel costs assumed the use of 76,500 dwt LNG vessels, carrying 62,000 tonnes
of cargo and drafting 35.86 feet under unrestricted conditions on the Calcasieu River. LNG vessel costs are based on costs developed by the Galveston District (SWG) using 2008 IWR crude carriers operating costs.
8. LNG vessels call at Calcasieu River with a four-foot underkeel clearance, nearly double
that of non-pressurized tankers.
9. Crude carriers were assumed to carry 2,471 tonnes less of product per foot of light loading.
10. LNG vessels were assumed to carry 2,105 tonnes less of product per foot of light loading.
9.2 Transportation Savings The absence of maintenance dredging and the resulting shoaling of the Calcasieu River would lead to substantially higher transportation costs for the major portion of the deep-draft fleet, with respect to imports of crude oil and LNG, prior to eventual cessation of larger self-propelled vessels. Ultimately, draft reductions will affect other cargoes as well, including barges, should

31
there be a complete cessation of maintenance dredging. This analysis has simulated the effects of draft reductions for the major deep-draft fleets calling at Calcasieu River. The existing fleet and cargo base would incur increased total annual vessel voyage costs from $6.2 million for a one-foot draft reduction (39-foot drafts) to $91.5 million for a 10-foot draft reduction to 30 feet. The average increase in annual vessel voyage costs is nearly $9 million per foot over the 10-foot range.23
The projected fleet will be influenced primarily by the annual volume of imported LNG to the existing, permitted, and proposed plants at Calcasieu River. The volume of imported LNG will vary based on the scale of full development and utilization of these plants. Under a full development and utilization scenario, the average increase in total annual vessel voyage costs would be $40.6 million per foot of draft reduction, ranging from $27.7 million for the first foot of reduction (39-foot channel) to $406.4 million for a 10-foot reduction (30-foot channel). Three LNG expansion scenarios were prepared to reflect that not all the plants may be developed (Cheniere) or fully utilized. Under a “no-build” scenario for the Cheniere facility (Scenario 1), the average increase in total annual vessel voyage costs would be $27.6 million per foot of draft reduction, ranging from $18.8 million for the first foot of reduction (39-foot channel) to $276.2 million for a 10-foot reduction (30-foot channel). For a halving of baseline tonnages for all three plants (Scenario 2), the average increase in total annual vessel voyage costs would be $21.9 million per foot of draft reduction, ranging from $14.95 million for the first foot of reduction (39-foot channel) to $219.9 million for a 10-foot reduction (30-foot channel). For a “no-build” scenario for Cheniere and a halving of utilization of the Trunkline and Sempra facilities (Scenario 3), the average increase in total annual vessel voyage costs would be $15.5 million, ranging from $10.5 million for the first foot of reduction (39-foot channel) to $154.7 million for a 10-foot reduction (30-foot channel). Table 17 summarizes the benefits from maintenance dredging for the largest deep-draft sector of the fleet calling at Calcasieu River with respect to crude oil imports and current and projected LNG imports. The benefits in Table 17 do not reflect the complete closure of the Calcasieu River to all commercial navigation, but are intended to portray the existing significant annual deep-draft vessel voyage-related costs for the two largest imports. The data do not include other shippers/receivers that would be affected by a cessation of dredging and eventual closure of the Calcasieu River. The deepest draft navigation sector for crude oil and LNG imports has been used as a surrogate to identify the substantial impacts on vessel voyage costs for a reduction in sailing draft. The full dynamics of vessel and port interactions are summarized in the increase in the annual vessel voyage costs for presumed light-loaded vessels. Alternatively, it could be argued that the existing crude oil imports could possibly be handled through other ports and sent by pipeline to Calcasieu River refineries, assuming that there is pipeline capacity and connections for the refineries at Calcasieu River. Similarly, it might be argued that in the cessation of dredging, an offshore LNG unloading facility and pipeline could be constructed to the affected plants. The capital and operating costs of these alternatives are not known, but presumably would necessitate large one-time capital expenditures in addition to operations costs.
23
Because of diseconomies of scale for less efficient use of vessels, annual total voyage costs increase from nearly $6.2 million for the first foot of reduction (39-foot channel) to nearly $13.3 million for the last foot of reduction (30-foot channel).

32
Table 17. Examples of Estimated Benefits from Maintenance
Dredging of Calcasieu River
Scenario 1 Scenario 2 Scenario 3
Existing Cargo Expanded Cargo Expanded Cargo Expanded Cargo Expanded Cargo
Lower Draft Increased Increased Increased Increased Increased
(Feet) Vessel Costs Vessel Costs Vessel Costs Vessel Costs Vessel Costs
0 $0 $0 $0 $0 $0
1 $6,179,696 $27,711,686 $18,804,920 $14,957,089 $10,503,706
2 $12,821,700 $57,454,127 $38,991,802 $31,015,855 $21,784,693
3 $19,979,981 $89,459,140 $60,718,896 $48,302,765 $33,932,643
4 $27,717,258 $123,995,245 $84,169,593 $66,964,433 $47,051,607
5 $36,106,858 $161,375,225 $109,557,623 $87,171,796 $61,262,995
6 $45,235,056 $201,965,647 $137,133,611 $109,125,391 $76,709,373
7 $55,204,076 $246,198,952 $167,193,401 $133,062,052 $93,559,276
8 $66,135,959 $294,588,961 $200,088,754 $159,263,527 $112,013,424
9 $78,177,626 $347,750,980 $236,241,227 $188,067,672 $132,312,795
10 $91,507,574 $406,428,185 $276,160,415 $219,883,171 $154,749,286
Notes: Existing cargo reflects constant crude petroleum imports and existing LNG imports.
Expanded Cargo reflects full development and utilization of three LNG plants on Calcasieu River.
Scenario 1 reflects exclusion of the Cheniere plant LNG tonnages under a "no build" assumption.
Scenario 2 reflects halving of the baseline tonnages for the three LNG plants.
Scenario 3 reflects exclusion of the Cheniere plant LNG tonnages and halving of the baseline tonnages for
the Trunkline and Sempra plants.
Assumes vessels will light load for all decreased depths.
Source: G.E.C., Inc.
9.3 Average Annual Benefits In order to estimate actual project benefits, the limiting depths of the Calcasieu River under with- and without-project conditions are needed for each year of the project. Based on past dredging cycles, the limiting segment of the river is assumed to be river miles 14-17. Therefore, the depth of the channel for each project-year, or an average annual shoaling rate, for this segment of the river under with- and without-project conditions is needed. Review of historical survey data, past experience, and history of the channel indicate that historically mile 14-17 has shoaled at a rate of about 2 feet a year during the typical two-year dredging cycle. Historically, no draft restrictions have resulted between dredging events due to the fact after a dredging event, shoaling initially occurs adjacent to the channel banks with a 40-foot deep cut down the centerline of the channel remaining. The third year after dredging, the channel could possibly experience a 1-foot draft restriction, and a 2-foot draft restriction in the fourth year, and so on. However, the shoaling (and resulting draft reductions) over the entire 20-year project life cannot be estimate. When the channel is dredged, the channel shoaling rate increases because a larger quantity of water and sediment is conveyed through the deeper channel. As the channel shoals, less water and sediment moves through the channel; and therefore, less sediment falls out. However, with available data, the future shoaling rate after year two or three of the project cannot be estimated. Although the channel shoals at a rate of two feet a year during the typical two-year dredging cycle, two years after dredging, there should still be a 150-foot wide channel available to allow vessels to use the channel at unrestricted drafts. (This is due to shoaling patterns and over-
33
dredging of the channel.) Therefore, under with-project conditions, although the channel will shoal, vessel drafts should not be restricted between the two-year dredging cycles. The channel will narrow during the course of the two years due to shoaling, but the channel will be dredged prior to reaching conditions that warrant draft reductions. Without-project shoaling rates or draft reductions are not available; however, past experience indicates that the channel at mile 14-17 will shoal at a rate of less than two feet a year over the long-term, with draft reductions most likely occurring at a rate of approximately 1 foot per year (starting two years after dredging). For this analysis, two average annual shoaling rates (draft reduction rates) will be assumed: (1) one foot of draft reduction every two years (one-half foot a year), and (2) one foot of draft reduction per year. Under both assumptions, and for with-project conditions, there would be no draft reductions for the first two years after a dredging event. As illustrated in Table 18, assuming one foot of draft reduction every two years results in a maximum draft reduction of 9 feet by year 19 of the project. Assuming one foot of draft reduction per year, the maximum draft reductions of 10 feet occurs in year 12 of the project; this reduction was assumed to remain constant for the remainder of the project. These assumed draft reduction rates were used to estimate the shipping costs per project year, based on the amount of light loading required to access the shoaled river segment. The net present value of these streams of increased annual transportation costs (benefits) were converted to an average annual basis, using the current water resources discount rate of 4.375 percent, and are presented in Table 18. Transportation savings under the two assumed shoaling rates were developed for three alternative LNG facility operation scenarios, intended to address the uncertainty that the three LNG plants will operate at baseline capacity. Scenario 1 excludes tonnages associated with the approved Cheniere LNG facility, Scenario 2 assumes all three LNG facilities operate at 50 percent of their baseline capacity, and Scenario 3 assumes that the Trunkline and Sempra LNG facilities operate at 50 percent of capacity and the Cheniere facility is not developed. Crude petroleum movements were assumed to remain constant at 19.95 million tonnes for all scenarios. The net present value (NPV) of transportation savings assuming an increase of one-foot of draft reduction every two years (one-half foot of shoaling per year) are estimated at $1.15 billion for Scenario 1, $913 million for Scenario 2, and $642 million for Scenario 3. Based on a 20-year project life and the current water resources discount rate of 4.375 percent yields average annual benefits of $87.3 million for Scenario 1, $69.5 million for Scenario 2, and $48.8 million for Scenario 3. The annual transportation savings and present value of those savings, by year and draft restriction, for each LNG development scenario that were used to develop Table 18 are presented in table A-1 through A-7 in the appendix. The average annual benefits assuming an increase of one-foot of draft reduction every year (one foot of shoaling per year) are estimated at $1,99 billion for Scenario 1, $1,59 billion for Scenario 2, and $1,12 billion for Scenario 3. Based on a water resources discount rate of 4.375 percent yields average annual benefits of $151.6 million for Scenario 1, $120.7 million for Scenario 2, and $84.9 million for Scenario 3.

T
ab
le 1
8. T
ran
sp
ort
ati
on
Savin
gs a
nd
Pre
sen
t V
alu
e o
f B
en
efi
ts,
for
Scen
ari
os 1
-3 f
or
Calc
asie
u R
iver
DM
MP
(
$1,0
00)
A
dd
itio
na
l 1
-Fo
ot
Dra
ft R
ed
uc
tio
n E
ve
ry T
wo
Ye
ars
Ad
dit
ion
al 1
-Fo
ot
Dra
ft R
ed
uc
tio
n E
ve
ry Y
ea
r
Dra
ftS
ce
na
rio
1S
ce
na
rio
2S
ce
na
rio
3D
raft
Sc
en
ari
o 1
Sc
en
ari
o 2
Sc
en
ari
o 3
Re
du
cti
on
P.V
. o
fP
.V. o
fP
.V. o
fR
ed
uc
tio
nP
.V. o
fP
.V. o
fP
.V. o
f
Ye
ar
(Fe
et)
Be
ne
fits
Be
ne
fits
Be
ne
fits
Be
ne
fits
Be
ne
fits
Be
ne
fits
(Fe
et)
Be
ne
fits
Be
ne
fits
Be
ne
fits
Be
ne
fits
Be
ne
fits
Be
ne
fits
10
$0
$0
$0
$0
$0
$0
0$
0$
0$
0$
0$
0$
0
20
$0
$0
$0
$0
$0
$0
0$
0$
0$
0$
0$
0$
0
31
$1
8,8
05
$1
6,5
38
$1
4,9
57
$1
3,1
54
$1
0,5
04
$9
,23
71
$1
8,8
05
$1
6,5
38
$1
4,9
57
$1
3,1
54
$1
0,5
04
$9
,23
7
41
$1
8,8
05
$1
5,8
45
$1
4,9
57
$1
2,6
03
$1
0,5
04
$8
,85
02
$3
8,9
92
$3
2,8
54
$3
1,0
16
$2
6,1
34
$2
1,7
85
$1
8,3
55
52
$3
8,9
92
$3
1,4
77
$3
1,0
16
$2
5,0
38
$2
1,7
85
$1
7,5
86
3$
60
,71
9$
49
,01
6$
48
,30
3$
38
,99
3$
33
,93
3$
27
,39
3
62
$3
8,9
92
$3
0,1
57
$3
1,0
16
$2
3,9
89
$2
1,7
85
$1
6,8
49
4$
84
,17
0$
65
,09
9$
66
,96
4$
51
,79
2$
47
,05
2$
36
,39
1
73
$6
0,7
19
$4
4,9
93
$4
8,3
03
$3
5,7
93
$3
3,9
33
$2
5,1
44
5$
10
9,5
58
$8
1,1
83
$8
7,1
72
$6
4,5
95
$6
1,2
63
$4
5,3
97
83
$6
0,7
19
$4
3,1
07
$4
8,3
03
$3
4,2
93
$3
3,9
33
$2
4,0
90
6$
13
7,1
34
$9
7,3
58
$1
09
,12
5$
77
,47
4$
76
,70
9$
54
,46
0
94
$8
4,1
70
$5
7,2
51
$6
6,9
64
$4
5,5
49
$4
7,0
52
$3
2,0
04
7$
16
7,1
93
$1
13
,72
4$
13
3,0
62
$9
0,5
08
$9
3,5
59
$6
3,6
38
10
4$
84
,17
0$
54
,85
2$
66
,96
4$
43
,63
9$
47
,05
2$
30
,66
38
$2
00
,08
9$
13
0,3
94
$1
59
,26
4$
10
3,7
89
$1
12
,01
3$
72
,99
7
11
5$
10
9,5
58
$6
8,4
04
$8
7,1
72
$5
4,4
27
$6
1,2
63
$3
8,2
50
9$
23
6,2
41
$1
47
,50
1$
18
8,0
68
$1
17
,42
3$
13
2,3
13
$8
2,6
11
12
5$
10
9,5
58
$6
5,5
37
$8
7,1
72
$5
2,1
46
$6
1,2
63
$3
6,6
47
10
$2
76
,16
0$
16
5,1
98
$2
19
,88
3$
13
1,5
33
$1
54
,74
9$
92
,57
0
13
6$
13
7,1
34
$7
8,5
94
$1
09
,12
5$
62
,54
2$
76
,70
9$
43
,96
41
0$
27
6,1
60
$1
58
,27
3$
21
9,8
83
$1
26
,01
9$
15
4,7
49
$8
8,6
90
14
6$
13
7,1
34
$7
5,3
00
$1
09
,12
5$
59
,92
0$
76
,70
9$
42
,12
11
0$
27
6,1
60
$1
51
,63
9$
21
9,8
83
$1
20
,73
7$
15
4,7
49
$8
4,9
72
15
7$
16
7,1
93
$8
7,9
57
$1
33
,06
2$
70
,00
1$
93
,55
9$
49
,22
01
0$
27
6,1
60
$1
45
,28
3$
21
9,8
83
$1
15
,67
6$
15
4,7
49
$8
1,4
11
16
7$
16
7,1
93
$8
4,2
70
$1
33
,06
2$
67
,06
7$
93
,55
9$
47
,15
71
0$
27
6,1
60
$1
39
,19
3$
21
9,8
83
$1
10
,82
8$
15
4,7
49
$7
7,9
98
17
8$
20
0,0
89
$9
6,6
23
$1
59
,26
4$
76
,90
9$
11
2,0
13
$5
4,0
92
10
$2
76
,16
0$
13
3,3
59
$2
19
,88
3$
10
6,1
82
$1
54
,74
9$
74
,72
9
18
8$
20
0,0
89
$9
2,5
73
$1
59
,26
4$
73
,68
5$
11
2,0
13
$5
1,8
24
10
$2
76
,16
0$
12
7,7
69
$2
19
,88
3$
10
1,7
31
$1
54
,74
9$
71
,59
7
19
9$
23
6,2
41
$1
04
,71
8$
18
8,0
68
$8
3,3
64
$1
32
,31
3$
58
,65
01
0$
27
6,1
60
$1
22
,41
3$
21
9,8
83
$9
7,4
67
$1
54
,74
9$
68
,59
5
20
9$
23
6,2
41
$1
00
,32
9$
18
8,0
68
$7
9,8
70
$1
32
,31
3$
56
,19
21
0$
27
6,1
60
$1
17
,28
2$
21
9,8
83
$9
3,3
82
$1
54
,74
9$
65
,72
0
To
tal
$1
,14
8,5
27
$9
13
,98
9$
64
2,5
41
$1
,99
4,0
76
$1
,58
7,4
18
$1
,11
6,7
62
Ave
rag
e A
nn
ua
l B
en
efi
ts$
87
,34
1$
69
,50
5$
48
,86
2$
15
1,6
41
$1
20
,71
6$
84
,92
5
No
tes
: S
ce
na
rio
s 1
-3 "
Be
ne
fits
" a
re th
e in
cre
as
ed
co
sts
of ve
ss
el s
ailin
gs
as
so
cia
ted
with
th
e a
ss
um
ed
dra
ft r
ed
uctio
n to
th
e L
NG
pla
nts
an
d r
efin
eri
es
co
veri
ng
riv
er
mile
s 5
to
36
an
d D
evi
l's E
lbo
w fo
r e
ach
pro
ject ye
ar.
So
urc
e: G
.E.C
., In
c.
"P.V
. o
f B
en
efits
" fo
r S
ce
na
rio
s 1
-3 a
re th
e p
res
en
t va
lue
of th
e in
cre
as
ed
ve
ss
els
sa
ilin
g c
os
ts.
34

35
10.0 COMPARE BENEFITS AND COSTS The present value of the transportation savings benefits presented in Table 18 were compared to the present value of the total DMMP costs, as presented in Appendix D, Cost Estimation to develop benefit-to-cost (B/C) ratios for various channel depth restriction, by river segment.24 The DMMP river segment costs were developed for the preferred plan. Annual costs for 20 years were developed for the DMMP for river mile segments as follows: the Bar/Entrance Channel (miles -32 to 5); (1) 5 to 9.5; (2) 9.5 to 12; (3) 12 to 16; (4) 16 to 21; (5) Devil’s Elbow; (6) 21 to 22; (7) 22 to 26; (8) 26 to 30; (9) 30 to 34; (10) 34 to 36. The DMMP costs were compiled into three river segments corresponding to particular major industrial users with deep-draft vessels previously identified to be LNG plants and crude oil receipts. The three segments germane to the LNG and crude oil receipts were as follows: (1) Segment 1 from river mile -32 to river mile 21 for the Cameron LNG plant (Sempra Energy) (there is a prospective LNG plant, Creole Trail [Cheniere Energy] that would be located below Calcasieu Lake and would be located within Segment 1, if constructed); (2) Segment 2 consisting of Devil’s Elbow for the Trunkline LNG plant (about nine miles southwest of Lake Charles); and (3) Segment 3 from river mile 21 to river mile 36 for the refineries receiving crude oil.25 The transportation savings generated by dredging to the current authorized channel depth were measured for the largest vessels and users expected to use the waterway, consisting of LNG and crude oil receipts. Table 19 presents the DMMP costs by project year, the present value of the DMMP costs and the present value of the stream of benefits over the project life for three LNG development scenarios, and two shoaling rate assumptions. The net present value of the annual stream of DMMP construction and O&M costs is $448.9 million, yielding an average annual cost of $34.1 million, based on a 20-year project life and 4.375 percent water resource discount rate. The net present value of the stream of benefit over the life of the project assuming 1-foot of draft reduction every two years, ranged from $1.15 billion for LNG development Scenario 1 to $642 million for Scenario 3. Average annual benefits ranged from $87.3 million for Scenario 1 to nearly $49 million for Scenario 3, yielding benefit-to-cost ratios of 2.56 for Scenario 1, 2.04 for Scenario 2, and 1.43 for Scenario 3. The net present value of the stream of benefit over the life of the project assuming 1-foot of draft reduction every year, ranged from $1.99 billion for LNG development Scenario 1 to $1.12 billion for Scenario 3. Average annual benefits ranged from $151.6 million for Scenario 1 to nearly $85 million for Scenario 3, yielding benefit-to-cost ratios of 4.44 for Scenario 1, 3.54 for Scenario 2, and 2.49 for Scenario 3. The benefit-to-cost ratios indicate that very slight draft reductions in the range of one to two feet per year (commencing two years after the latest dredge cycle) for the Calcasieu River (river miles -32 through 36) under “no action” dredge alternative will yield sufficient increased costs for the largest vessels calling (LNG and crude oil imports) to significantly exceed the DMMP costs projected for 20 years.
24
Nothing in this analysis of DMMP maintenance dredging benefits is in any way related to capital dredging with respect to deepening of the current authorized channel depth. 25
The benefit methodology focused on a subset of the largest vessels and commodities. Other navigation sectors characterized by smaller vessels and/or cargo volumes were not addressed.

36
Table 19. Costs, Benefits, and Benefit/Cost Ratios,
for Scenarios 1-3 for Calcasieu River DMMP ($1,000)
DMMP Additional 1-Foot Draft Reduction Every Two Years Additional 1-Foot Draft Reduction Every Year
Cost Draft Draft
DMMP Present Reduction NPV of Benefits Reduction NPV of Benefits
Year Costs Value (Feet) Scenario 1 Scenario 2 Scenario 3 (Feet) Scenario 1 Scenario 2 Scenario 3
1 $55,035 $52,728 0 $0 $0 $0 0 $0 $0 $0
2 $36,984 $33,949 0 $0 $0 $0 0 $0 $0 $0
3 $40,956 $36,019 1 $16,538 $13,154 $9,237 1 $16,538 $13,154 $9,237
4 $51,379 $43,291 1 $15,845 $12,603 $8,850 2 $32,854 $26,134 $18,355
5 $33,825 $27,306 2 $31,477 $25,038 $17,586 3 $49,016 $38,993 $27,393
6 $30,513 $23,600 2 $30,157 $23,989 $16,849 4 $65,099 $51,792 $36,391
7 $15,987 $11,847 3 $44,993 $35,793 $25,144 5 $81,183 $64,595 $45,397
8 $47,633 $33,817 3 $43,107 $34,293 $24,090 6 $97,358 $77,474 $54,460
9 $20,509 $13,950 4 $57,251 $45,549 $32,004 7 $113,724 $90,508 $63,638
10 $27,805 $18,120 4 $54,852 $43,639 $30,663 8 $130,394 $103,789 $72,997
11 $47,389 $29,588 5 $68,404 $54,427 $38,250 9 $147,501 $117,423 $82,611
12 $24,670 $14,757 5 $65,537 $52,146 $36,647 10 $165,198 $131,533 $92,570
13 $33,285 $19,076 6 $78,594 $62,542 $43,964 10 $158,273 $126,019 $88,690
14 $25,849 $14,194 6 $75,300 $59,920 $42,121 10 $151,639 $120,737 $84,972
15 $12,896 $6,784 7 $87,957 $70,001 $49,220 10 $145,283 $115,676 $81,411
16 $44,508 $22,433 7 $84,270 $67,067 $47,157 10 $139,193 $110,828 $77,998
17 $28,568 $13,796 8 $96,623 $76,909 $54,092 10 $133,359 $106,182 $74,729
18 $37,404 $17,305 8 $92,573 $73,685 $51,824 10 $127,769 $101,731 $71,597
19 $13,266 $5,880 9 $104,718 $83,364 $58,650 10 $122,413 $97,467 $68,595
20 $24,700 $10,490 9 $100,329 $79,870 $56,192 10 $117,282 $93,382 $65,720
Total $448,930 $1,148,527 $913,989 $642,541 $1,994,076 $1,587,418 $1,116,762
Average Annual $34,139 $87,341 $69,505 $48,862 $151,641 $120,716 $84,925
B/C Ratio 2.56 2.04 1.43 4.44 3.54 2.49
Notes: "DMMP Costs" is the vector of annual DMMP costs for the twenty year period covering river miles -32 through 36 and Devils' Elbow.
"DMMP Costs Present Value" is the present value of annual DMMP costs for the twenty year period covering river miles -32 through 36 and Devils' Elbow.
Source: G.E.C., Inc.
"NPV of Benefits for Scenarios 1-3" are the present value of increased costs for vessels sailing associated with the draft reduction to the LNG plants and
refineries covering river miles 5 to 36 and Devil's Elbow.
"B/C Ratio" is the benefit-to-cost ratio computed by dividing the average annual increased vessel costs for each scenario by the average annual DMMP costs.
11.0 SUMMARY Historically, an estimate of the average annual maintenance costs on Calcasieu, to include dredging, hydrographic surveys, engineer and design of plans and specifications, supervision and administration of contacts, project management, environmental clearances, etc., is regarded as roughly $12 million.26 A more detailed time series of annual channel maintenance expenditures is contained in Table 19. Historical annual dredging expenditures between FY 1998 and FY 2007 average $10.7 million for channel maintenance costs and $16.3 million with salt water barrier costs (SWB). Dropping the two extreme values (lowest and highest) results in an annual average for channel maintenance costs of $10.7 million and $14.5 million with SWB. Calcasieu River and Pass commercial navigation accounts for nearly 50 million tonnes of cargo annually (see Table 1). Among the predominant cargoes are crude oil and Liquefied Natural Gas (LNG) imports. Crude oil imports account for nearly 20 million tonnes annually, and LNG imports currently account for about five million tonnes annually (see Table 2).
26
E-mail communication from Tracy Falk, Operations Manager August 31, 2006.
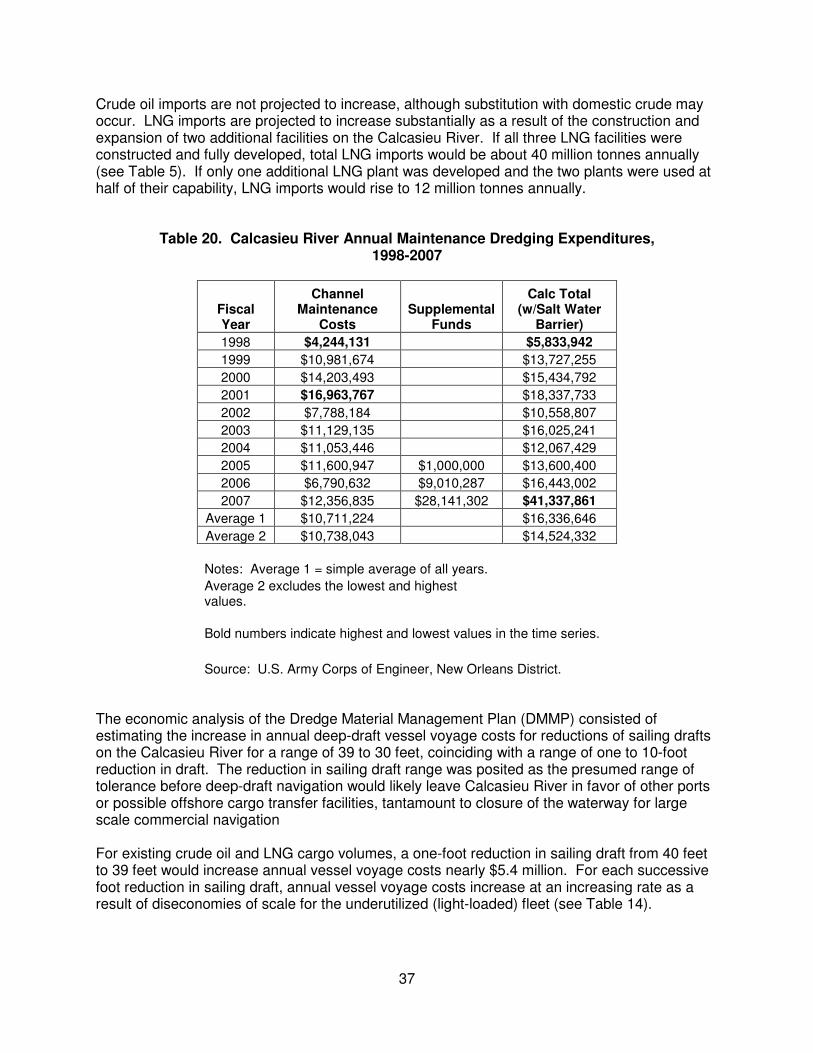
37
Crude oil imports are not projected to increase, although substitution with domestic crude may occur. LNG imports are projected to increase substantially as a result of the construction and expansion of two additional facilities on the Calcasieu River. If all three LNG facilities were constructed and fully developed, total LNG imports would be about 40 million tonnes annually (see Table 5). If only one additional LNG plant was developed and the two plants were used at half of their capability, LNG imports would rise to 12 million tonnes annually.
Table 20. Calcasieu River Annual Maintenance Dredging Expenditures, 1998-2007
Fiscal Year
Channel Maintenance
Costs Supplemental
Funds
Calc Total (w/Salt Water
Barrier)
1998 $4,244,131 $5,833,942
1999 $10,981,674 $13,727,255
2000 $14,203,493 $15,434,792
2001 $16,963,767 $18,337,733
2002 $7,788,184 $10,558,807
2003 $11,129,135 $16,025,241
2004 $11,053,446 $12,067,429
2005 $11,600,947 $1,000,000 $13,600,400
2006 $6,790,632 $9,010,287 $16,443,002
2007 $12,356,835 $28,141,302 $41,337,861
Average 1 $10,711,224 $16,336,646
Average 2 $10,738,043 $14,524,332
Notes: Average 1 = simple average of all years.
Average 2 excludes the lowest and highest values.
Bold numbers indicate highest and lowest values in the time series.
Source: U.S. Army Corps of Engineer, New Orleans District.
The economic analysis of the Dredge Material Management Plan (DMMP) consisted of estimating the increase in annual deep-draft vessel voyage costs for reductions of sailing drafts on the Calcasieu River for a range of 39 to 30 feet, coinciding with a range of one to 10-foot reduction in draft. The reduction in sailing draft range was posited as the presumed range of tolerance before deep-draft navigation would likely leave Calcasieu River in favor of other ports or possible offshore cargo transfer facilities, tantamount to closure of the waterway for large scale commercial navigation For existing crude oil and LNG cargo volumes, a one-foot reduction in sailing draft from 40 feet to 39 feet would increase annual vessel voyage costs nearly $5.4 million. For each successive foot reduction in sailing draft, annual vessel voyage costs increase at an increasing rate as a result of diseconomies of scale for the underutilized (light-loaded) fleet (see Table 14).

38
Future commodity movement total annual vessel voyage costs are substantially higher because of the use of LNG vessels, which are more expensive than non-pressurized vessels and sail long distances, primarily from the Middle East to the U.S. If LNG imports were to fully develop at Calcasieu River (40 million tonnes annually), a one-foot decrease in sailing draft would increase annual vessel voyage costs by nearly $24 million, including crude and LNG imports (see Table 14). If future LNG imports were less than 40 million tonnes as a result of reductions in LNG plant development and utilization at Calcasieu River, a one-foot sailing draft reduction would increase annual vessel voyage costs between $9 million and $17 million per year (see Table 16). The sailing draft reductions ranging from -1 to -10 feet at Calcasieu River are intended to simulate the effects of a cessation of dredging (“no action” alternative) relative to the importance of the existing navigation capabilities to the port and the major plants that use both deep-draft self-propelled vessels and shallow-draft barges. A complete cessation of all maintenance dredging at Calcasieu River would result in an estimated natural water depth of between four to six feet, effectively closing the Calcasieu River to commercial navigation. Although sailing draft reductions would increase vessel costs, at some point vessels would likely begin to lighter by calling at other ports before calling at Calcasieu River. Ultimately, commercial navigation would cease, and major imports such as crude and LNG would have to use pipeline capabilities, if these existed, to supplant navigation. The benefit-to-cost ratios for the three LNG development scenarios and the two assumed shoaling rates indicate that there are substantial increased costs resulting from slight reductions in sailing drafts relative to a cessation of dredging and commercial navigation. The bebefit-to-cost ratios indicate that very slight draft reductions in the range of one to two feet per year (commencing two years after the latest dredge cycle) for the Calcasieu River (river miles -32 through 36) under “no action” dredge alternative will yield sufficient increased costs for the largest vessels calling (LNG and crude oil imports) to significantly exceed the DMMP costs projected for 20 years.

APPENDIX


Tab
le A
-1.
B
en
efi
t/C
ost
Rati
os f
or
Scen
ari
o 1
fo
r C
alc
asie
u R
iver
DM
MP
fo
r S
eg
men
t 1 (
$1,0
00)
Ye
ar
Se
gm
en
t 1
Se
g 1
PV
Se
mp
ra 1
Se
m 1
PV
Se
mp
ra
2S
em
2 P
VS
em
pra
3S
em
3 P
VS
em
pra
4S
em
4 P
VS
em
pra
5S
em
5 P
VS
em
pra
6S
em
6 P
VS
em
pra
7S
em
7 P
VS
em
pra
8S
em
8 P
VS
em
pra
9S
em
9 P
VS
em
pra
10
Se
m 1
0 P
V
1$
42,5
13$
40
,731
$10
,934
$10
,476
$22,6
65
$21,
715
$35,2
83
$33,8
04
$48
,892
$46,8
43
$6
3,6
14$
60,9
48
$79,5
92
$76,2
56
$96,9
92
$92,9
26
$11
6,0
14$
111,15
1$
136,8
96
$13
1,15
8$
159,9
25
$15
3,2
21
2$
19,4
10$
17,8
17$
10,9
34
$10
,037
$22,6
65
$20,8
05
$35,2
83
$32,3
87
$48
,892
$44,8
80
$6
3,6
14$
58,3
93
$79,5
92
$73,0
59
$96,9
92
$89,0
31
$11
6,0
14$
106,4
92
$13
6,8
96
$12
5,6
60
$15
9,9
25
$14
6,7
99
3$
32,199
$28
,317
$10
,934
$9,6
16$
22,6
65
$19
,933
$35,2
83
$3
1,030
$48
,892
$42,9
98
$6
3,6
14$
55,9
46
$79,5
92
$69,9
97
$96,9
92
$85,2
99
$11
6,0
14$
102,0
29
$13
6,8
96
$12
0,3
93
$15
9,9
25
$14
0,6
45
4$
36,3
41
$30,6
20
$10
,934
$9,2
13$
22,6
65
$19
,098
$35,2
83
$29,7
29
$48
,892
$41,19
6$
63,6
14$
53,6
01
$79,5
92
$67,0
63
$96,9
92
$81,7
24
$11
6,0
14$
97,7
52
$13
6,8
96
$11
5,3
47
$15
9,9
25
$13
4,7
50
5$
21,457
$17
,322
$10
,934
$8,8
27
$22,6
65
$18
,297
$35,2
83
$28,4
83
$48
,892
$39,4
69
$6
3,6
14$
51,354
$79,5
92
$64,2
52
$96,9
92
$78,2
98
$11
6,0
14$
93,6
54
$13
6,8
96
$11
0,5
12$
159,9
25
$12
9,102
6$
24,3
67
$18
,846
$10
,934
$8,4
57
$22,6
65
$17
,530
$35,2
83
$27,2
89
$48
,892
$37,8
15$
63,6
14$
49,2
01
$79,5
92
$61,559
$96,9
92
$75,0
17$
116,0
14$
89,7
29
$13
6,8
96
$10
5,8
80
$15
9,9
25
$12
3,6
90
7$
8,8
07
$6,5
26
$10
,934
$8,103
$22,6
65
$16
,795
$35,2
83
$2
6,145
$48
,892
$36,2
30
$6
3,6
14$
47,139
$79,5
92
$58,9
78
$96,9
92
$71,8
72
$11
6,0
14$
85,9
68
$13
6,8
96
$10
1,442
$15
9,9
25
$11
8,5
06
8$
42,2
33
$29,9
83
$10
,934
$7,7
63
$22,6
65
$16
,091
$35,2
83
$25,0
49
$48
,892
$34,7
11$
63,6
14$
45,163
$79,5
92
$56,5
06
$96,9
92
$68,8
60
$11
6,0
14$
82,3
64
$13
6,8
96
$97,189
$15
9,9
25
$11
3,5
39
9$
10,0
01
$6,8
03
$10
,934
$7,4
38
$22,6
65
$15
,417
$35,2
83
$23,9
99
$48
,892
$33,2
56
$6
3,6
14$
43,2
70
$79,5
92
$54,138
$96,9
92
$65,9
73
$11
6,0
14$
78,9
12$
136,8
96
$93,116
$15
9,9
25
$10
8,7
79
10$
14,6
84
$9,5
69
$10
,934
$7,126
$22,6
65
$14
,771
$35,2
83
$22,9
93
$48
,892
$31,862
$6
3,6
14$
41,456
$79,5
92
$51,868
$96,9
92
$63,2
08
$11
6,0
14$
75,6
04
$13
6,8
96
$89,2
13$
159,9
25
$10
4,2
20
11$
38,153
$23
,821
$10
,934
$6,8
27
$22,6
65
$14
,152
$35,2
83
$22,0
30
$48
,892
$30,5
27
$6
3,6
14$
39,7
19$
79,5
92
$49,6
94
$96,9
92
$60,5
58
$11
6,0
14$
72,4
35
$13
6,8
96
$85,4
73
$15
9,9
25
$99,8
51
12$
14,4
02
$8
,615
$10
,934
$6,5
41
$22,6
65
$13
,558
$35,2
83
$21,10
6$
48
,892
$29,2
47
$6
3,6
14$
38,0
54
$79,5
92
$47,6
11$
96,9
92
$58,0
20
$11
6,0
14$
69,3
99
$13
6,8
96
$81,890
$15
9,9
25
$9
5,6
66
13$
27,4
60
$15
,738
$10
,934
$6,2
67
$22,6
65
$12
,990
$35,2
83
$20,2
22
$48
,892
$28,0
21
$6
3,6
14$
36,4
59
$79,5
92
$45,6
16$
96,9
92
$55,5
88
$11
6,0
14$
66,4
90
$13
6,8
96
$78,4
58
$15
9,9
25
$91,656
14$
20,9
32
$11
,494
$10
,934
$6,0
04
$22,6
65
$12
,446
$35,2
83
$19
,374
$48
,892
$26,8
47
$6
3,6
14$
34,9
30
$79,5
92
$43,7
04
$96,9
92
$53,2
58
$11
6,0
14$
63,7
03
$13
6,8
96
$75,169
$15
9,9
25
$87,8
14
15$
6,7
03
$3,5
26
$10
,934
$5,7
52
$22,6
65
$11
,924
$35,2
83
$18
,562
$48
,892
$25,7
21
$6
3,6
14$
33,4
66
$79,5
92
$41,872
$96,9
92
$51,0
26
$11
6,0
14$
61,033
$13
6,8
96
$72,0
18$
159,9
25
$84,133
16$
31,676
$15
,966
$10
,934
$5,5
11$
22,6
65
$11
,424
$35,2
83
$17
,784
$48
,892
$24,6
43
$6
3,6
14$
32,0
64
$79,5
92
$40,117
$96,9
92
$48,8
87
$11
6,0
14$
58,4
75
$13
6,8
96
$69,0
00
$15
9,9
25
$8
0,6
07
17$
20,9
32
$10
,108
$10
,934
$5,2
80
$22,6
65
$10
,945
$35,2
83
$17
,038
$48
,892
$23,6
10$
63,6
14$
30,7
20
$79,5
92
$38,4
35
$96,9
92
$46,8
38
$11
6,0
14$
56,0
24
$13
6,8
96
$66,108
$15
9,9
25
$7
7,2
28
18$
32,4
08
$14
,994
$10
,934
$5,0
59
$22,6
65
$10
,486
$35,2
83
$16
,324
$48
,892
$22,6
21
$6
3,6
14$
29,4
32
$79,5
92
$36,8
24
$96,9
92
$44,8
74
$11
6,0
14$
53,6
75
$13
6,8
96
$63,3
37
$15
9,9
25
$73,9
91
19$
7,6
69
$3,3
99
$10
,934
$4,8
47
$22,6
65
$10
,047
$35,2
83
$15
,640
$48
,892
$21,672
$6
3,6
14$
28,198
$79,5
92
$35,2
80
$96,9
92
$42,9
93
$11
6,0
14$
51,425
$13
6,8
96
$60,6
82
$15
9,9
25
$7
0,8
90
20
$19
,792
$8,4
05
$10
,934
$4,6
44
$22,6
65
$9,6
26
$35,2
83
$14
,984
$48
,892
$20,7
64
$6
3,6
14$
27,0
16$
79,5
92
$33,8
02
$96,9
92
$41,19
1$
116,0
14$
49,2
70
$13
6,8
96
$58,138
$15
9,9
25
$67,9
18
To
tal
$472,139
$322,6
02
$218
,690
$14
3,7
88
$4
53,3
09
$298,0
50
$705,6
65
$463,9
74
$977
,848
$642,9
34
$1,272,2
88
$8
36,5
29
$1,591,835
$1,046,6
30
$1,
939,8
40
$1,275,4
43
$2,3
20,2
83
$1,525,5
84
$2,7
37,9
22
$1,800,182
$3,198,4
92
$2,10
3,0
06
B/C
Ra
tio
0.4
50
.92
1.4
41.
99
2.5
93
.24
3.9
54
.73
5.5
86
.52
No
tes:
Se
mp
ra 1
is the v
ecto
r o
f in
cre
ased c
osts
fo
r LN
G v
esse
ls s
aili
ng w
ith a
one fo
ot d
raft
redu
ctio
n to
th
e S
em
pra
Energ
y L
NG
pla
nt near C
am
ero
n.
Sem
1 P
V is
the p
resent
valu
e o
f th
e in
cre
ased c
osts
fo
r LN
G v
ess
els
saili
ng w
ith a
one fo
ot d
raft
redu
ctio
n to
th
e S
em
pra
Energ
y p
lant near C
am
ero
n.
Segm
ent 1 is
the v
ecto
r o
f annual D
MM
P c
os
ts fo
r th
e t
wenty
ye
ar perio
d c
overing riv
er m
iles
-32 to
21.
Seg 1 P
V is
the p
resen
t valu
e o
f ann
ual D
MM
P c
osts
fo
r th
e tw
enty
year pe
rio
d c
ov
ering riv
er
mile
s -32 t
o 2
1.
B/C
Ratio
is t
he b
enefit
co
st
rati
o c
om
pute
d b
y div
idin
g the s
um
of th
e p
resent valu
e o
f in
cre
ased v
essel c
os
ts f
rom
dra
ft reduc
tio
ns
by
the
pre
sent valu
e o
f th
e D
MM
P c
osts
.
Incre
ase
d c
osts
fo
r S
em
pra
are
pre
sente
d fo
r o
ne fo
ot to
ten
fo
ot dra
ft reductio
ns (re
fer to
Table
15).
So
urc
e:
GE
C

Tab
le A
-2.
Ben
efi
t/C
ost
Rati
os f
or
Scen
ari
o 1
fo
r C
alc
asie
u R
iver
DM
MP
fo
r S
eg
men
t 2 (
$1,0
00)
Y
ea
rS
eg
me
nt
2S
eg
2 P
VT
ru
nk
lin
e 1
Tru
nk
1 P
VT
run
kli
ne
2T
ru
nk
2 P
VT
run
kli
ne
3T
ru
nk
3 P
VT
run
kli
ne
4T
ru
nk
4 P
VT
run
kli
ne
5T
ru
nk
5 P
VT
run
kli
ne
6T
ru
nk
6 P
VT
ru
nk
lin
e 7
T
ru
nk
7 P
VT
ru
nk
lin
e 8
T
ru
nk
8 P
VT
ru
nk
lin
e 9
Tru
nk
9 P
VT
ru
nk
lin
e 1
0T
ru
nk
10
PV
1$
7,4
33
$7,1
21
$5,6
68
$5
,430
$11
,749
$11
,256
$18
,28
9$
17,5
23
$25,3
44
$24
,281
$32,9
75
$31,
593
$41,25
7$
39,5
27
$50,2
76
$48
,169
$60,13
6$
57
,616
$70,9
61
$6
7,9
86
$82,8
98
$79,4
23
2$
0$
0$
5,6
68
$5
,203
$11
,749
$10
,784
$18
,28
9$
16,7
88
$25,3
44
$23
,264
$32,9
75
$30
,268
$41,25
7$
37
,871
$50,2
76
$46
,150
$60,13
6$
55
,201
$70,9
61
$65
,137
$82,8
98
$76,0
94
3$
3,7
75
$3
,320
$5,6
68
$4
,985
$11
,749
$10
,332
$18
,28
9$
16,0
84
$25,3
44
$22
,288
$32,9
75
$29
,000
$41,25
7$
36,2
83
$50,2
76
$44
,215
$60,13
6$
52,8
87
$70,9
61
$6
2,4
06
$82,8
98
$72,9
04
4$
420
$354
$5,6
68
$4
,776
$11
,749
$9
,899
$18
,28
9$
15,4
10$
25,3
44
$21,
354
$32,9
75
$27
,784
$41,25
7$
34,7
62
$50,2
76
$4
2,3
62
$60,13
6$
50,6
70
$70,9
61
$59
,791
$82,8
98
$69,8
48
5$
3,7
75
$3
,047
$5,6
68
$4
,576
$11
,749
$9
,484
$18
,28
9$
14,7
64
$25,3
44
$20
,459
$32,9
75
$26
,620
$41,25
7$
33,3
05
$50,2
76
$4
0,5
86
$60,13
6$
48,5
46
$70,9
61
$5
7,2
84
$82,8
98
$66,9
21
6$
220
$17
0$
5,6
68
$4
,384
$11
,749
$9
,087
$18
,28
9$
14,145
$25,3
44
$19
,602
$32,9
75
$25
,504
$41,25
7$
31,
909
$50,2
76
$3
8,8
85
$60,13
6$
46
,511
$70,9
61
$5
4,8
83
$82,8
98
$64,116
7$
3,7
20
$2
,757
$5,6
68
$4
,200
$11
,749
$8
,706
$18
,28
9$
13,5
53
$25,3
44
$18
,780
$32,9
75
$24
,435
$41,25
7$
30,5
72
$50,2
76
$3
7,2
55
$60,13
6$
44,5
62
$70,9
61
$5
2,5
83
$82,8
98
$61,42
8
8$
641
$455
$5,6
68
$4
,024
$11
,749
$8
,341
$18
,28
9$
12,9
84
$25,3
44
$17
,993
$32,9
75
$23
,411
$41,25
7$
29,2
90
$50,2
76
$3
5,6
94
$60,13
6$
42,6
94
$70,9
61
$5
0,3
79
$82,8
98
$58,8
53
9$
3,7
20
$2
,530
$5,6
68
$3
,855
$11
,749
$7
,991
$18
,28
9$
12,4
40
$25,3
44
$17
,239
$32,9
75
$22
,429
$41,25
7$
28,0
63
$50,2
76
$34
,198
$60,13
6$
40,9
04
$70,9
61
$4
8,2
67
$82,8
98
$56,3
86
10$
641
$4
18$
5,6
68
$3
,694
$11
,749
$7
,656
$18
,28
9$
11,9
19$
25,3
44
$16
,516
$32,9
75
$21,
489
$41,25
7$
26,8
86
$50,2
76
$3
2,7
64
$60,13
6$
39
,190
$70,9
61
$4
6,2
44
$82,8
98
$54,0
23
11$
3,7
20
$2
,323
$5,6
68
$3
,539
$11
,749
$7
,336
$18
,28
9$
11,4
19$
25,3
44
$15
,824
$32,9
75
$20
,588
$41,25
7$
25,7
59
$50,2
76
$31,
391
$60,13
6$
37,5
47
$70,9
61
$4
4,3
05
$82,8
98
$51,75
8
12$
220
$13
2$
5,6
68
$3,3
91
$11
,749
$7
,028
$18
,28
9$
10,9
41
$25,3
44
$15
,160
$32,9
75
$19
,725
$41,25
7$
24,6
80
$50,2
76
$3
0,0
75
$60,13
6$
35,9
73
$70,9
61
$4
2,4
48
$82,8
98
$49,5
89
13$
3,7
20
$2,1
32
$5,6
68
$3
,248
$11
,749
$6
,733
$18
,28
9$
10,4
82
$25,3
44
$14
,525
$32,9
75
$18
,899
$41,25
7$
23,6
45
$50,2
76
$28
,814
$60,13
6$
34,4
65
$70,9
61
$4
0,6
69
$82,8
98
$47,5
10
14$
220
$12
1$
5,6
68
$3,1
12$
11,7
49
$6
,451
$18
,28
9$
10,0
43
$25,3
44
$13
,916
$32,9
75
$18
,106
$41,25
7$
22,6
54
$50,2
76
$2
7,6
07
$60,13
6$
33
,021
$70,9
61
$3
8,9
64
$82,8
98
$45,5
19
15$
3,7
20
$1,9
57
$5,6
68
$2
,982
$11
,749
$6,1
81
$18
,28
9$
9,6
22
$25,3
44
$13
,333
$32,9
75
$17
,347
$41,25
7$
21,
704
$50,2
76
$2
6,4
49
$60,13
6$
31,
637
$70,9
61
$37
,331
$82,8
98
$43,6
11
16$
220
$11
1$
5,6
68
$2
,857
$11
,749
$5
,922
$18
,28
9$
9,2
18$
25,3
44
$12
,774
$32,9
75
$16
,620
$41,25
7$
20,7
95
$50,2
76
$25
,341
$60,13
6$
30
,311
$70,9
61
$3
5,7
66
$82,8
98
$41,78
3
17$
3,7
20
$1,7
96
$5,6
68
$2
,737
$11
,749
$5
,674
$18
,28
9$
8,8
32
$25,3
44
$12
,238
$32,9
75
$15
,924
$41,25
7$
19,9
23
$50,2
76
$2
4,2
79
$60,13
6$
29,0
40
$70,9
61
$3
4,2
67
$82,8
98
$40,0
32
18$
220
$10
2$
5,6
68
$2
,622
$11
,749
$5
,436
$18
,28
9$
8,4
62
$25,3
44
$11
,726
$32,9
75
$15
,256
$41,25
7$
19,0
88
$50,2
76
$23
,261
$60,13
6$
27,8
23
$70,9
61
$32
,831
$82,8
98
$38,3
54
19$
3,7
20
$1,6
49
$5,6
68
$2,5
12$
11,7
49
$5
,208
$18
,28
9$
8,107
$25,3
44
$11
,234
$32,9
75
$14
,617
$41,25
7$
18,2
88
$50,2
76
$2
2,2
86
$60,13
6$
26,6
57
$70,9
61
$31,
455
$82,8
98
$36,7
46
20
$220
$93
$5,6
68
$2
,407
$11
,749
$4
,990
$18
,28
9$
7,7
67
$25,3
44
$10
,763
$32,9
75
$14
,004
$41,25
7$
17,5
21
$50,2
76
$21,
352
$60,13
6$
25,5
39
$70,9
61
$30
,136
$82,8
98
$35,2
06
To
tal
$44,0
45
$30
,588
$11
3,3
59
$74
,533
$2
34,9
75
$15
4,4
96
$365,7
85
$240
,503
$506,8
72
$333
,268
$659,4
97
$433
,619
$8
25,13
5$
54
2,5
26
$1,
005,5
25
$661,
132
$1,
202,7
30
$79
0,7
94
$1,4
19,2
15$
93
3,133
$1,
657,9
53
$1,0
90,10
3
B/C
Ra
tio
2.4
45
.05
7.8
610
.90
14.1
817
.74
21.
61
25
.85
30
.51
35
.64
No
tes:
Tru
nklin
e 1
is the v
ecto
r o
f in
cre
ased
co
sts
fo
r LN
G v
esse
ls s
aili
ng w
ith a
one fo
ot dra
ft r
educ
tio
n to
the T
run
klin
e L
NG
pla
nt.
Tru
nk 1 P
V is
the
pre
se
nt valu
e o
f th
e in
cre
as
ed c
osts
fo
r LN
G v
es
sels
saili
ng
with
a o
ne
fo
ot d
raft
redu
ctio
n to
the
Tru
nklin
e p
lan
t.
Segm
ent
2 is
the
vecto
r o
f an
nual D
MM
P c
osts
fo
r th
e tw
enty
year p
erio
d fo
r D
ev
ils' E
lbo
w.
Seg 2
PV
is th
e p
resent v
alu
e o
f ann
ual D
MM
P c
osts
fo
r th
e t
wen
ty y
ear pe
rio
d fo
r D
evil'
s E
lbo
w.
B/C
Ratio
is the
benefi
t co
st ra
tio
div
idin
g th
e s
um
of th
e p
resen
t valu
e o
f in
cre
as
ed v
es
sel c
osts
fro
m d
raft
reduc
tio
ns b
y th
e p
rese
nt valu
e o
f th
e D
MM
P c
osts
.
Inc
reas
ed c
osts
fo
r T
runklin
e a
re p
resen
ted f
or o
ne
fo
ot to
te
n fo
ot
dra
ft re
ductio
ns
(re
fer to
Table
15
).
So
urc
e:
GE
C
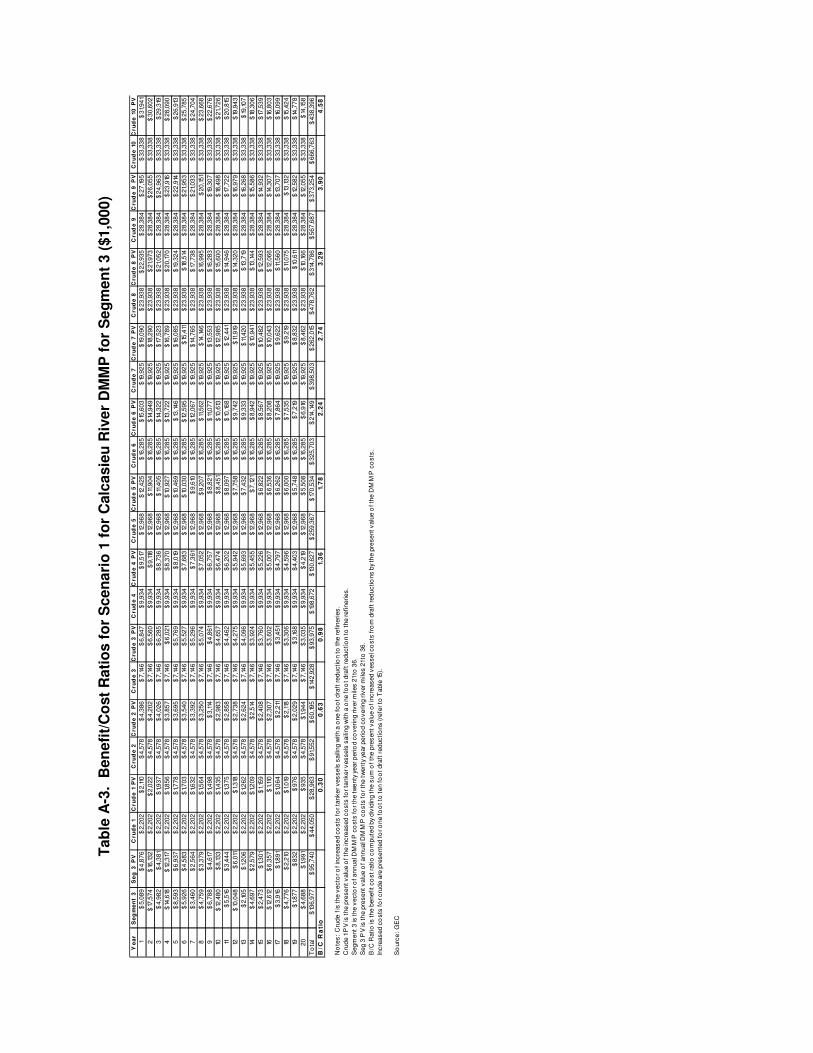
Tab
le A
-3.
Ben
efi
t/C
ost
Rati
os f
or
Scen
ari
o 1
fo
r C
alc
asie
u R
iver
DM
MP
fo
r S
eg
men
t 3 (
$1,0
00)
Y
ea
rS
eg
me
nt
3S
eg
3 P
VC
rud
e 1
Cru
de
1 P
VC
ru
de
2C
ru
de
2 P
VC
ru
de
3C
ru
de
3 P
VC
ru
de
4C
ru
de
4 P
VC
ru
de
5C
ru
de
5 P
VC
ru
de
6C
ru
de
6 P
VC
ru
de
7C
ru
de
7 P
VC
ru
de
8C
ru
de
8 P
VC
ru
de
9C
ru
de
9 P
VC
ru
de
10
Cru
de
10
PV
1$
5,0
89
$4
,876
$2,2
02
$2,1
10$
4,5
78
$4
,386
$7,146
$6
,847
$9,9
34
$9
,517
$12
,96
8$
12,4
25
$16
,28
5$
15,6
03
$19
,92
5$
19,0
90
$23,9
38
$2
2,9
35
$28,3
84
$27
,195
$33,3
38
$31,941
2$
17,5
74
$16
,132
$2,2
02
$2
,022
$4,5
78
$4
,202
$7,146
$6
,560
$9,9
34
$9,1
18$
12,9
68
$11
,904
$16
,28
5$
14,9
49
$19
,92
5$
18,2
90
$23,9
38
$21,
973
$28,3
84
$2
6,0
55
$33,3
38
$30,6
02
3$
4,9
82
$4,3
81
$2,2
02
$1,9
37
$4,5
78
$4
,026
$7,146
$6
,285
$9,9
34
$8
,736
$12
,96
8$
11,4
05
$16
,28
5$
14,3
22
$19
,92
5$
17,5
23
$23,9
38
$21,
052
$28,3
84
$2
4,9
63
$33,3
38
$29,3
19
4$
14,6
18$
12,3
17$
2,2
02
$1,8
56
$4,5
78
$3
,857
$7,146
$6
,021
$9,9
34
$8
,370
$12
,96
8$
10,9
27
$16
,28
5$
13,7
22
$19
,92
5$
16,7
89
$23,9
38
$20
,170
$28,3
84
$23
,916
$33,3
38
$28,0
90
5$
8,5
93
$6
,937
$2,2
02
$1,7
78
$4,5
78
$3
,695
$7,146
$5
,769
$9,9
34
$8
,019
$12
,96
8$
10,4
69
$16
,28
5$
13,146
$19
,92
5$
16,0
85
$23,9
38
$19
,324
$28,3
84
$22
,914
$33,3
38
$26,9
13
6$
5,9
26
$4
,583
$2,2
02
$1,7
03
$4,5
78
$3
,540
$7,146
$5
,527
$9,9
34
$7
,683
$12
,96
8$
10,0
30
$16
,28
5$
12,5
95
$19
,92
5$
15,4
11$
23,9
38
$18
,514
$28,3
84
$21,
953
$33,3
38
$25,7
85
7$
3,4
60
$2
,564
$2,2
02
$1,6
32
$4,5
78
$3
,392
$7,146
$5
,296
$9,9
34
$7
,361
$12
,96
8$
9,6
10$
16,2
85
$12
,067
$19
,92
5$
14,7
65
$23,9
38
$17
,738
$28,3
84
$21,
033
$33,3
38
$24,7
04
8$
4,7
59
$3
,379
$2,2
02
$1,5
64
$4,5
78
$3
,250
$7,146
$5
,074
$9,9
34
$7
,052
$12
,96
8$
9,2
07
$16
,28
5$
11,5
62
$19
,92
5$
14,146
$23,9
38
$16
,995
$28,3
84
$20
,151
$33,3
38
$23,6
68
9$
6,7
88
$4,6
17$
2,2
02
$1,4
98
$4,5
78
$3,1
14$
7,146
$4
,861
$9,9
34
$6
,757
$12
,96
8$
8,8
21
$16
,28
5$
11,0
77
$19
,92
5$
13,5
53
$23,9
38
$16
,283
$28,3
84
$19
,307
$33,3
38
$22,6
76
10$
12,4
80
$8,1
33
$2,2
02
$1,4
35
$4,5
78
$2
,983
$7,146
$4
,657
$9,9
34
$6
,474
$12
,96
8$
8,4
51
$16
,28
5$
10,6
13$
19,9
25
$12
,985
$23,9
38
$15
,600
$28,3
84
$18
,498
$33,3
38
$21,72
6
11$
5,5
16$
3,4
44
$2,2
02
$1,3
75
$4,5
78
$2
,858
$7,146
$4
,462
$9,9
34
$6
,202
$12
,96
8$
8,0
97
$16
,28
5$
10,168
$19
,92
5$
12,4
41
$23,9
38
$14
,946
$28,3
84
$17
,722
$33,3
38
$20,8
15
12$
10,0
48
$6,0
11$
2,2
02
$1,3
18$
4,5
78
$2
,738
$7,146
$4
,275
$9,9
34
$5
,942
$12
,96
8$
7,7
58
$16
,28
5$
9,7
42
$19
,92
5$
11,9
19$
23,9
38
$14
,320
$28,3
84
$16
,979
$33,3
38
$19
,94
3
13$
2,105
$1,2
06
$2,2
02
$1,2
62
$4,5
78
$2
,624
$7,146
$4
,096
$9,9
34
$5
,693
$12
,96
8$
7,4
32
$16
,28
5$
9,3
33
$19
,92
5$
11,4
20
$23,9
38
$13
,719
$28,3
84
$16
,268
$33,3
38
$19
,107
14$
4,6
97
$2
,579
$2,2
02
$1,2
09
$4,5
78
$2
,514
$7,146
$3
,924
$9,9
34
$5
,455
$12
,96
8$
7,1
21
$16
,28
5$
8,9
42
$19
,92
5$
10,9
41
$23,9
38
$13
,144
$28,3
84
$15
,586
$33,3
38
$18
,30
6
15$
2,4
73
$1,3
01
$2,2
02
$1,15
9$
4,5
78
$2
,408
$7,146
$3
,760
$9,9
34
$5
,226
$12
,96
8$
6,8
22
$16
,28
5$
8,5
67
$19
,92
5$
10,4
82
$23,9
38
$12
,593
$28,3
84
$14
,932
$33,3
38
$17
,53
9
16$
12,6
12$
6,3
57
$2,2
02
$1,11
0$
4,5
78
$2
,307
$7,146
$3
,602
$9,9
34
$5
,007
$12
,96
8$
6,5
36
$16
,28
5$
8,2
08
$19
,92
5$
10,0
43
$23,9
38
$12
,066
$28,3
84
$14
,307
$33,3
38
$16
,80
3
17$
3,9
16$
1,8
91
$2,2
02
$1,0
64
$4,5
78
$2,2
11$
7,146
$3
,451
$9,9
34
$4
,797
$12
,96
8$
6,2
62
$16
,28
5$
7,8
64
$19
,92
5$
9,6
22
$23,9
38
$11
,560
$28,3
84
$13
,707
$33,3
38
$16
,09
9
18$
4,7
76
$2,2
10$
2,2
02
$1,0
19$
4,5
78
$2,1
18$
7,146
$3
,306
$9,9
34
$4
,596
$12
,96
8$
6,0
00
$16
,28
5$
7,5
35
$19
,92
5$
9,2
19$
23,9
38
$11
,075
$28,3
84
$13
,132
$33,3
38
$15
,42
4
19$
1,877
$832
$2,2
02
$976
$4,5
78
$2
,029
$7,146
$3
,168
$9,9
34
$4
,403
$12
,96
8$
5,7
48
$16
,28
5$
7,2
19$
19,9
25
$8,8
32
$23,9
38
$10
,611
$28,3
84
$12
,582
$33,3
38
$14
,77
8
20
$4,6
88
$1,9
91
$2,2
02
$935
$4,5
78
$1,
944
$7,146
$3
,035
$9,9
34
$4
,219
$12
,96
8$
5,5
08
$16
,28
5$
6,9
16$
19,9
25
$8,4
62
$23,9
38
$10
,166
$28,3
84
$12
,055
$33,3
38
$14
,158
To
tal
$13
6,9
77
$95
,740
$44,0
50
$28
,963
$91,552
$60
,195
$14
2,9
28
$93
,975
$19
8,6
72
$13
0,6
27
$259,3
67
$17
0,5
34
$325,7
03
$214
,149
$398,5
03
$262
,015
$478,7
62
$314
,786
$567,6
87
$37
3,2
54
$666,7
63
$438,3
96
B/C
Ra
tio
0.3
00
.63
0.9
81.
36
1.7
82
.24
2.7
43
.29
3.9
04
.58
No
tes:
Cru
de
1 is
the v
ecto
r o
f in
cre
ase
d c
osts
fo
r ta
nke
r ves
sels
saili
ng
with
a o
ne
fo
ot d
raft
redu
ctio
n to
the
refine
ries.
Cru
de 1
PV
is t
he p
resent v
alu
e o
f th
e in
cre
ased c
osts
fo
r ta
nker v
esse
ls s
aili
ng w
ith a
one fo
ot dra
ft r
educti
on
to
the re
finerie
s.
Segm
ent
3 is
the
vecto
r o
f an
nual D
MM
P c
osts
fo
r th
e tw
enty
year p
erio
d c
overin
g riv
er m
iles 2
1 to
36.
Seg 3
PV
is th
e p
resent v
alu
e o
f ann
ual D
MM
P c
osts
fo
r th
e t
wen
ty y
ear pe
rio
d c
ov
ering r
iver m
iles 2
1 to
36
.
B/C
Ratio
is the
benefi
t co
st ra
tio
co
mpute
d b
y div
idin
g the s
um
of th
e p
res
ent va
lue o
f in
cre
ased v
essel c
osts
fro
m d
raft
red
uctio
ns b
y th
e p
resent v
alu
e o
f th
e D
MM
P c
osts
.
Inc
reas
ed c
osts
fo
r cru
de a
re p
rese
nte
d fo
r o
ne fo
ot
to ten fo
ot dra
ft r
educ
tio
ns (re
fer to
Table
15).
So
urc
e:
GE
C

Tab
le A
-4.
Ben
efi
t/C
ost
Rati
os f
or
Scen
ari
o 1
fo
r C
alc
asie
u R
iver
DM
MP
fo
r S
eg
men
ts 1
an
d 2
($1,0
00)
Y
ea
rS
eg
1 &
2S
eg
1 &
2 P
VS
& T
1S
& T
1 P
VS
& T
2S
& T
2 P
VS
& T
3S
& T
3 P
VS
& T
4S
& T
4 P
VS
& T
5S
& T
5 P
VS
& T
6S
& T
6 P
VS
& T
7S
& T
7 P
VS
& T
8S
& T
8 P
VS
& T
9S
& T
9 P
VS
& T
10
S &
T 1
0 P
V
1$
49,9
46
$47
,852
$16
,602
$15
,907
$34,4
14$
32
,972
$53,5
73
$51,
327
$74,2
36
$71,12
4$
96,5
89
$92
,541
$12
0,8
48
$11
5,7
83
$14
7,2
68
$14
1,095
$17
6,151
$16
8,7
67
$207,8
57
$19
9,144
$242,8
22
$232,6
44
2$
19,4
10$
17,8
17$
16,6
02
$15
,240
$34,4
14$
31,
590
$53,5
73
$49
,176
$74,2
36
$68
,143
$96,5
89
$88
,662
$12
0,8
48
$11
0,9
30
$14
7,2
68
$13
5,181
$17
6,151
$16
1,693
$207,8
57
$19
0,7
97
$242,8
22
$222,8
93
3$
35,9
74
$31,
637
$16
,602
$14
,601
$34,4
14$
30
,266
$53,5
73
$47,1
14$
74,2
36
$65
,287
$96,5
89
$84
,945
$12
0,8
48
$10
6,2
80
$14
7,2
68
$12
9,5
15$
176,151
$15
4,9
15$
207,8
57
$18
2,7
99
$242,8
22
$2
13,5
50
4$
36,7
61
$30
,974
$16
,602
$13
,989
$34,4
14$
28
,997
$53,5
73
$45
,139
$74,2
36
$62
,550
$96,5
89
$81,
385
$12
0,8
48
$10
1,825
$14
7,2
68
$12
4,0
86
$17
6,151
$14
8,4
22
$207,8
57
$17
5,137
$242,8
22
$204,5
99
5$
25,2
32
$20
,369
$16
,602
$13
,403
$34,4
14$
27
,781
$53,5
73
$43
,247
$74,2
36
$59
,928
$96,5
89
$77
,973
$12
0,8
48
$9
7,5
57
$14
7,2
68
$11
8,8
85
$17
6,151
$14
2,2
01
$207,8
57
$16
7,7
96
$242,8
22
$19
6,0
23
6$
24,5
87
$19
,016
$16
,602
$12
,841
$34,4
14$
26
,617
$53,5
73
$41,
435
$74,2
36
$57
,416
$96,5
89
$74
,705
$12
0,8
48
$9
3,4
68
$14
7,2
68
$11
3,9
02
$17
6,151
$13
6,2
40
$207,8
57
$16
0,7
63
$242,8
22
$18
7,8
06
7$
12,5
27
$9
,283
$16
,602
$12
,303
$34,4
14$
25
,501
$53,5
73
$39
,698
$74,2
36
$55
,010
$96,5
89
$71,
574
$12
0,8
48
$8
9,5
50
$14
7,2
68
$10
9,127
$17
6,151
$13
0,5
30
$207,8
57
$15
4,0
24
$242,8
22
$17
9,9
34
8$
42,8
74
$30
,438
$16
,602
$11
,787
$34,4
14$
24
,432
$53,5
73
$38
,034
$74,2
36
$52
,704
$96,5
89
$68
,574
$12
0,8
48
$8
5,7
96
$14
7,2
68
$10
4,5
53
$17
6,151
$12
5,0
58
$207,8
57
$14
7,5
68
$242,8
22
$17
2,3
92
9$
13,7
21
$9
,333
$16
,602
$11
,293
$34,4
14$
23
,408
$53,5
73
$36
,440
$74,2
36
$50
,495
$96,5
89
$65
,699
$12
0,8
48
$8
2,2
00
$14
7,2
68
$10
0,171
$17
6,151
$11
9,8
16$
207,8
57
$14
1,383
$242,8
22
$16
5,166
10$
15,3
25
$9
,987
$16
,602
$10
,819
$34,4
14$
22
,427
$53,5
73
$34
,912
$74,2
36
$48
,378
$96,5
89
$62
,945
$12
0,8
48
$7
8,7
55
$14
7,2
68
$9
5,9
72
$17
6,151
$11
4,7
94
$207,8
57
$13
5,4
56
$242,8
22
$15
8,2
43
11$
41,873
$26
,144
$16
,602
$10
,366
$34,4
14$
21,
487
$53,5
73
$33
,449
$74,2
36
$46
,350
$96,5
89
$60
,307
$12
0,8
48
$7
5,4
54
$14
7,2
68
$91,
949
$17
6,151
$10
9,9
82
$207,8
57
$12
9,7
79
$242,8
22
$15
1,610
12$
14,6
22
$8
,747
$16
,602
$9,9
31
$34,4
14$
20
,586
$53,5
73
$32
,047
$74,2
36
$44
,408
$96,5
89
$57
,779
$12
0,8
48
$72
,291
$14
7,2
68
$8
8,0
95
$17
6,151
$10
5,3
72
$207,8
57
$12
4,3
39
$242,8
22
$14
5,2
55
13$
31,18
0$
17,8
70
$16
,602
$9,5
15$
34,4
14$
19,7
23
$53,5
73
$30
,703
$74,2
36
$42
,546
$96,5
89
$55
,357
$12
0,8
48
$69
,261
$14
7,2
68
$8
4,4
02
$17
6,151
$10
0,9
55
$207,8
57
$11
9,127
$242,8
22
$13
9,166
14$
21,15
2$
11,6
15$
16,6
02
$9,1
16$
34,4
14$
18,8
97
$53,5
73
$29
,417
$74,2
36
$40
,763
$96,5
89
$53
,037
$12
0,8
48
$6
6,3
58
$14
7,2
68
$8
0,8
65
$17
6,151
$9
6,7
24
$207,8
57
$11
4,134
$242,8
22
$13
3,3
33
15$
10,4
23
$5
,483
$16
,602
$8
,734
$34,4
14$
18,105
$53,5
73
$28
,183
$74,2
36
$39
,054
$96,5
89
$50
,814
$12
0,8
48
$6
3,5
76
$14
7,2
68
$7
7,4
75
$17
6,151
$9
2,6
70
$207,8
57
$10
9,3
50
$242,8
22
$12
7,7
44
16$
31,896
$16
,077
$16
,602
$8
,368
$34,4
14$
17,3
46
$53,5
73
$27
,002
$74,2
36
$37
,417
$96,5
89
$48
,684
$12
0,8
48
$60
,911
$14
7,2
68
$7
4,2
28
$17
6,151
$8
8,7
85
$207,8
57
$10
4,7
66
$242,8
22
$12
2,3
90
17$
24,6
52
$11
,905
$16
,602
$8,0
17$
34,4
14$
16,6
19$
53,5
73
$25
,870
$74,2
36
$35
,849
$96,5
89
$46
,643
$12
0,8
48
$5
8,3
58
$14
7,2
68
$71,11
6$
176,151
$8
5,0
64
$207,8
57
$10
0,3
75
$242,8
22
$11
7,2
60
18$
32,6
28
$15
,096
$16
,602
$7,6
81
$34,4
14$
15,9
22
$53,5
73
$24
,786
$74,2
36
$34
,346
$96,5
89
$44
,688
$12
0,8
48
$55
,912
$14
7,2
68
$68
,135
$17
6,151
$81,
498
$207,8
57
$96
,167
$242,8
22
$11
2,3
44
19$
11,3
89
$5
,048
$16
,602
$7
,359
$34,4
14$
15,2
55
$53,5
73
$23
,747
$74,2
36
$32
,906
$96,5
89
$42
,815
$12
0,8
48
$5
3,5
68
$14
7,2
68
$6
5,2
79
$17
6,151
$7
8,0
82
$207,8
57
$92
,136
$242,8
22
$10
7,6
35
20
$20,0
12$
8,4
99
$16
,602
$7,0
51
$34,4
14$
14,6
15$
53,5
73
$22
,752
$74,2
36
$31,
527
$96,5
89
$41,
020
$12
0,8
48
$51,
323
$14
7,2
68
$6
2,5
43
$17
6,151
$7
4,8
09
$207,8
57
$8
8,2
74
$242,8
22
$10
3,124
To
tal
$516
,184
$353,1
90
$3
32,0
49
$218
,322
$6
88,2
84
$452
,546
$1,0
71,45
0$
704
,478
$1,4
84,7
19$
976
,202
$1,9
31,78
5$
1,270
,147
$2
,416
,97
0$
1,589
,155
$2,9
45,3
65
$1,93
6,5
75
$3
,523,0
13$
2,3
16,3
78
$4
,157,13
7$
2,7
33
,314
$4,8
56,4
45
$3,1
93,10
9
B/C
Ra
tio
0.6
21.
28
1.9
92
.76
3.6
04
.50
5.4
86
.56
7.7
49
.04
No
tes:
S &
T (
Sem
pra
and T
run
klin
e) 1 is
the v
ecto
r o
f in
cre
ased
co
sts
fo
r ta
nker
vesse
ls s
aili
ng w
ith a
one f
oo
t dra
ft reduc
tio
n to
the L
NG
pla
nts
co
vering r
iver m
iles 5
to
21 an
d D
evil'
s E
lbo
w.
S &
T (S
em
pra
and T
runk
line) 1 P
V is
the
pre
sent va
lue o
f th
e in
cre
as
ed c
osts
fo
r ta
nker ve
ssels
sa
ilin
g w
ith a
on
e fo
ot
dra
ft red
uctio
n to
th
e L
NG
pla
nts
co
verin
g riv
e m
iles 5
to
21 a
nd D
evils
' Elb
ow
.
Segm
ent
1 &
2 is
the v
ecto
r o
f ann
ual D
MM
P c
osts
fo
r th
e t
wen
ty y
ear pe
rio
d c
ov
ering r
iver m
iles -32
thro
ug
h 2
1 an
d D
evils
' Elb
ow
.
Seg 1
& 2
PV
is the
pre
se
nt va
lue o
f annu
al D
MM
P c
os
ts fo
r th
e tw
enty
yea
r peri
od c
ove
ring riv
er m
iles -32 t
hro
ugh
21 and D
evils
' Elb
ow
.
B/C
Ratio
is the
benefi
t co
st ra
tio
co
mpute
d b
y div
idin
g the s
um
of th
e p
res
ent va
lue o
f in
cre
ased v
essel c
osts
fro
m d
raft
red
uctio
ns b
y th
e p
resent v
alu
e o
f th
e D
MM
P c
osts
.
Inc
reas
ed c
osts
fo
r segm
ents
1 a
nd
2 a
re p
rese
nte
d fo
r o
ne
fo
ot to
ten fo
ot dra
ft r
educti
ons
(re
fer to
Table
15).
So
urc
e:
GE
C

Tab
le A
-5.
Ben
efi
t/C
ost
Rati
os f
or
Scen
ari
o 1
fo
r C
alc
asie
u R
iver
DM
MP
fo
r S
eg
men
ts 1
– 3
($1,0
00)
Y
ea
rS
eg
1-3
Se
g 1
-3
PV
All
1A
ll 1
PV
All
2A
ll 2
PV
All
3A
ll 3
PV
All
4A
ll 4
PV
All
5A
ll 5
PV
All
6A
ll 6
PV
All
7A
ll 7
PV
All
8A
ll 8
PV
All
9A
ll 9
PV
All
10
A
ll 1
0 P
V
1$
55,0
35
$52
,728
$18
,805
$18
,017
$38,9
92
$37
,357
$60,7
19$
58
,174
$84,17
0$
80
,642
$10
9,5
58
$10
4,9
65
$13
7,13
4$
131,
385
$16
7,19
3$
160
,185
$200,0
89
$19
1,702
$236,2
41
$22
6,3
39
$276,16
0$
264,5
85
2$
36,9
84
$33
,949
$18
,805
$17
,261
$38,9
92
$35
,792
$60,7
19$
55
,735
$84,17
0$
77
,261
$10
9,5
58
$10
0,5
66
$13
7,13
4$
125
,878
$16
7,19
3$
153
,471
$200,0
89
$18
3,6
66
$236,2
41
$216
,852
$276,16
0$
253,4
94
3$
40,9
56
$36
,019
$18
,805
$16
,538
$38,9
92
$34
,291
$60,7
19$
53
,399
$84,17
0$
74
,023
$10
9,5
58
$96
,350
$13
7,13
4$
120
,602
$16
7,19
3$
147,0
38
$200,0
89
$17
5,9
68
$236,2
41
$20
7,7
62
$276,16
0$
242,8
69
4$
51,379
$43
,291
$18
,805
$15
,845
$38,9
92
$32
,854
$60,7
19$
51,16
1$
84,17
0$
70
,920
$10
9,5
58
$92
,312
$13
7,13
4$
115,5
47
$16
7,19
3$
140,8
75
$200,0
89
$16
8,5
92
$236,2
41
$19
9,0
53
$276,16
0$
232,6
89
5$
33,8
25
$27
,306
$18
,805
$15
,181
$38,9
92
$31,
477
$60,7
19$
49
,016
$84,17
0$
67
,947
$10
9,5
58
$88
,442
$13
7,13
4$
110,7
04
$16
7,19
3$
134,9
70
$200,0
89
$16
1,525
$236,2
41
$19
0,7
10$
276,16
0$
222,9
35
6$
30,5
13$
23
,600
$18
,805
$14
,544
$38,9
92
$30
,157
$60,7
19$
46
,962
$84,17
0$
65
,099
$10
9,5
58
$84
,735
$13
7,13
4$
106
,063
$16
7,19
3$
129
,312
$200,0
89
$15
4,7
55
$236,2
41
$18
2,7
16$
276,16
0$
213
,591
7$
15,9
87
$11
,847
$18
,805
$13
,935
$38,9
92
$28
,893
$60,7
19$
44
,993
$84,17
0$
62
,371
$10
9,5
58
$81,
183
$13
7,13
4$
101,
617
$16
7,19
3$
123,8
92
$200,0
89
$14
8,2
68
$236,2
41
$17
5,0
57
$276,16
0$
204,6
38
8$
47,6
33
$33
,817
$18
,805
$13
,351
$38,9
92
$27
,682
$60,7
19$
43
,107
$84,17
0$
59
,756
$10
9,5
58
$77
,780
$13
7,13
4$
97,3
58
$16
7,19
3$
118,6
99
$200,0
89
$14
2,0
53
$236,2
41
$16
7,7
20
$276,16
0$
196,0
60
9$
20,5
09
$13
,950
$18
,805
$12
,791
$38,9
92
$26
,522
$60,7
19$
41,3
01
$84,17
0$
57
,251
$10
9,5
58
$74
,520
$13
7,13
4$
93,2
77
$16
7,19
3$
113,7
24
$200,0
89
$13
6,0
99
$236,2
41
$16
0,6
89
$276,16
0$
187,8
42
10$
27,8
05
$18
,120
$18
,805
$12
,255
$38,9
92
$25
,410
$60,7
19$
39
,569
$84,17
0$
54
,852
$10
9,5
58
$71,
397
$13
7,13
4$
89,3
67
$16
7,19
3$
108,9
57
$200,0
89
$13
0,3
94
$236,2
41
$15
3,9
54
$276,16
0$
179,9
69
11$
47,3
89
$29
,588
$18
,805
$11
,741
$38,9
92
$24
,345
$60,7
19$
37,9
11$
84,17
0$
52
,553
$10
9,5
58
$68
,404
$13
7,13
4$
85
,621
$16
7,19
3$
104,3
90
$200,0
89
$12
4,9
28
$236,2
41
$14
7,5
01
$276,16
0$
172,4
25
12$
24,6
70
$14
,757
$18
,805
$11
,249
$38,9
92
$23
,325
$60,7
19$
36
,322
$84,17
0$
50
,350
$10
9,5
58
$65
,537
$13
7,13
4$
82,0
33
$16
7,19
3$
100
,014
$200,0
89
$11
9,6
92
$236,2
41
$14
1,318
$276,16
0$
165,198
13$
33,2
85
$19
,076
$18
,805
$10
,777
$38,9
92
$22
,347
$60,7
19$
34
,799
$84,17
0$
48
,239
$10
9,5
58
$62
,790
$13
7,13
4$
78,5
94
$16
7,19
3$
95,8
22
$200,0
89
$11
4,6
75
$236,2
41
$13
5,3
95
$276,16
0$
158,2
73
14$
25,8
49
$14
,194
$18
,805
$10
,326
$38,9
92
$21,4
10$
60,7
19$
33
,341
$84,17
0$
46
,217
$10
9,5
58
$60
,158
$13
7,13
4$
75,3
00
$16
7,19
3$
91,
805
$200,0
89
$10
9,8
68
$236,2
41
$12
9,7
19$
276,16
0$
151,639
15$
12,8
96
$6
,784
$18
,805
$9
,893
$38,9
92
$20
,513
$60,7
19$
31,
943
$84,17
0$
44
,280
$10
9,5
58
$57
,636
$13
7,13
4$
72
,143
$16
7,19
3$
87,9
57
$200,0
89
$10
5,2
63
$236,2
41
$12
4,2
82
$276,16
0$
145,2
83
16$
44,5
08
$22
,433
$18
,805
$9
,478
$38,9
92
$19
,653
$60,7
19$
30
,604
$84,17
0$
42
,424
$10
9,5
58
$55
,220
$13
7,13
4$
69
,119
$16
7,19
3$
84,2
70
$200,0
89
$10
0,8
51
$236,2
41
$11
9,0
73
$276,16
0$
139,193
17$
28,5
68
$13
,796
$18
,805
$9,0
81
$38,9
92
$18
,829
$60,7
19$
29
,321
$84,17
0$
40
,646
$10
9,5
58
$52
,906
$13
7,13
4$
66,2
22
$16
7,19
3$
80,7
38
$200,0
89
$9
6,6
23
$236,2
41
$11
4,0
82
$276,16
0$
133,3
59
18$
37,4
04
$17
,305
$18
,805
$8
,700
$38,9
92
$18
,040
$60,7
19$
28
,092
$84,17
0$
38
,942
$10
9,5
58
$50
,688
$13
7,13
4$
63,4
46
$16
7,19
3$
77,3
54
$200,0
89
$9
2,5
73
$236,2
41
$10
9,3
00
$276,16
0$
127,7
69
19$
13,2
66
$5
,880
$18
,805
$8
,336
$38,9
92
$17
,284
$60,7
19$
26
,915
$84,17
0$
37
,310
$10
9,5
58
$48
,563
$13
7,13
4$
60,7
87
$16
7,19
3$
74
,112
$200,0
89
$8
8,6
93
$236,2
41
$10
4,7
18$
276,16
0$
122,4
13
20
$24,7
00
$10
,490
$18
,805
$7
,986
$38,9
92
$16
,559
$60,7
19$
25
,787
$84,17
0$
35
,746
$10
9,5
58
$46
,528
$13
7,13
4$
58,2
39
$16
7,19
3$
71,
005
$200,0
89
$8
4,9
75
$236,2
41
$10
0,3
29
$276,16
0$
117,2
82
To
tal
$65
3,161
$448
,930
$3
76,0
98
$247
,284
$7
79,8
36
$512
,742
$1,2
14,3
78
$798
,452
$1,
683,3
92
$1,10
6,8
29
$2,1
91,15
2$
1,440
,681
$2
,742,6
72
$1,80
3,3
05
$3,3
43,8
68
$2,19
8,5
90
$4
,001,77
5$
2,6
31,
164
$4,7
24,8
25
$3,10
6,5
68
$5,5
23,2
08
$3,6
31,505
B/C
Ra
tio
0.5
51.
141.
78
2.4
73
.21
4.0
24
.90
5.8
66
.92
8.0
9
No
tes:
All
1 is
the v
ecto
r o
f in
cre
ased
co
sts
fo
r v
essels
saili
ng w
ith a
one fo
ot dra
ft re
ductio
n t
o th
e L
NG
pla
nts
an
d refin
eries c
ove
ring r
iver m
iles 5
to
36 a
nd
Devil'
s E
lbo
w.
All
1 P
V is
th
e p
res
ent va
lue o
f th
e in
cre
ased c
osts
fo
r vess
els
saili
ng w
ith a
one
fo
ot dra
ft redu
ctio
n to
the L
NG
pla
nts
and re
fineri
es c
overin
g riv
e m
iles 5
to
36 a
nd D
evils
' Elb
ow
.
Seg 1
-3 is
th
e v
ecto
r o
f a
nnua
l DM
MP
co
sts
fo
r th
e tw
enty
year
perio
d c
overi
ng riv
er m
iles
-32 th
rough 3
6 a
nd D
ev
ils' E
lbo
w.
Seg 1
-3 P
V is
the
pre
se
nt valu
e o
f annua
l DM
MP
co
sts
fo
r th
e tw
enty
yea
r perio
d c
overi
ng riv
er m
iles
-32 t
hro
ugh 3
6 a
nd D
ev
ils' E
lbo
w.
B/C
Ratio
is the
benefi
t co
st ra
tio
co
mpute
d b
y div
idin
g the s
um
of th
e p
res
ent va
lue o
f in
cre
ased v
essel c
osts
fro
m d
raft
red
uctio
ns b
y th
e p
resent v
alu
e o
f th
e D
MM
P c
osts
.
Inc
reas
ed c
osts
fo
r segm
ents
1 - 3
are
pre
sente
d fo
r o
ne f
oo
t to
te
n fo
ot
dra
ft red
uctio
ns (
refe
r to
Ta
ble
15).
So
urc
e:
GE
C

Tab
le A
-6.
Ben
efi
t/C
ost
Rati
os f
or
Scen
ari
o 2
fo
r C
alc
asie
u R
iver
DM
MP
fo
r S
eg
men
ts 1
– 3
($1,0
00)
Y
ea
rS
eg
1-3
Se
g 1
-3
PV
All
1A
ll 1
PV
All
2A
ll 2
PV
All
3A
ll 3
PV
All
4A
ll 4
PV
All
5A
ll 5
PV
All
6A
ll 6
PV
All
7A
ll 7
PV
All
8A
ll 8
PV
All
9A
ll 9
PV
All
10
A
ll 1
0 P
V
1$
55,0
35
$52
,728
$14
,957
$14
,330
$3
1,016
$29
,716
$48,3
03
$46
,278
$66,9
64
$64
,158
$87,17
2$
83
,518
$10
9,12
5$
104
,551
$13
3,0
62
$12
7,4
85
$15
9,2
64
$15
2,5
88
$18
8,0
68
$18
0,185
$219
,88
3$
210
,667
2$
36,9
84
$33
,949
$14
,957
$13
,729
$3
1,016
$28
,470
$48,3
03
$44
,338
$66,9
64
$61,
468
$87,17
2$
80
,017
$10
9,12
5$
100
,169
$13
3,0
62
$12
2,141
$15
9,2
64
$14
6,192
$18
8,0
68
$17
2,6
32
$219
,88
3$
201,836
3$
40,9
56
$36
,019
$14
,957
$13
,154
$3
1,016
$27
,277
$48,3
03
$42
,480
$66,9
64
$58
,892
$87,17
2$
76
,663
$10
9,12
5$
95,9
70
$13
3,0
62
$11
7,0
21
$15
9,2
64
$14
0,0
64
$18
8,0
68
$16
5,3
96
$219
,88
3$
193,3
76
4$
51,379
$43
,291
$14
,957
$12
,603
$3
1,016
$26
,134
$48,3
03
$40
,699
$66,9
64
$56
,423
$87,17
2$
73
,450
$10
9,12
5$
91,
947
$13
3,0
62
$11
2,116
$15
9,2
64
$13
4,193
$18
8,0
68
$15
8,4
63
$219
,88
3$
185,2
70
5$
33,8
25
$27
,306
$14
,957
$12
,074
$3
1,016
$25
,038
$48,3
03
$38
,993
$66,9
64
$54
,058
$87,17
2$
70
,371
$10
9,12
5$
88,0
93
$13
3,0
62
$10
7,4
17$
159,2
64
$12
8,5
68
$18
8,0
68
$15
1,821
$219
,88
3$
177,5
05
6$
30,5
13$
23
,600
$14
,957
$11
,568
$3
1,016
$23
,989
$48,3
03
$37
,359
$66,9
64
$51,
792
$87,17
2$
67
,421
$10
9,12
5$
84
,401
$13
3,0
62
$10
2,9
14$
159,2
64
$12
3,179
$18
8,0
68
$14
5,4
57
$219
,88
3$
170,0
64
7$
15,9
87
$11
,847
$14
,957
$11
,083
$3
1,016
$22
,983
$48,3
03
$35
,793
$66,9
64
$49
,621
$87,17
2$
64
,595
$10
9,12
5$
80,8
63
$13
3,0
62
$9
8,6
00
$15
9,2
64
$11
8,0
16$
188,0
68
$13
9,3
60
$219
,88
3$
162,9
36
8$
47,6
33
$33
,817
$14
,957
$10
,619
$3
1,016
$22
,020
$48,3
03
$34
,293
$66,9
64
$47
,541
$87,17
2$
61,
888
$10
9,12
5$
77,4
74
$13
3,0
62
$9
4,4
67
$15
9,2
64
$11
3,0
69
$18
8,0
68
$13
3,5
19$
219
,88
3$
156,106
9$
20,5
09
$13
,950
$14
,957
$10
,174
$3
1,016
$21,
097
$48,3
03
$32
,855
$66,9
64
$45
,549
$87,17
2$
59
,294
$10
9,12
5$
74,2
26
$13
3,0
62
$9
0,5
08
$15
9,2
64
$10
8,3
30
$18
8,0
68
$12
7,9
22
$219
,88
3$
149,5
63
10$
27,8
05
$18
,120
$14
,957
$9
,747
$3
1,016
$20
,212
$48,3
03
$31,
478
$66,9
64
$43
,639
$87,17
2$
56
,808
$10
9,12
5$
71,11
5$
133,0
62
$86
,714
$15
9,2
64
$10
3,7
89
$18
8,0
68
$12
2,5
60
$219
,88
3$
143,2
94
11$
47,3
89
$29
,588
$14
,957
$9
,339
$3
1,016
$19
,365
$48,3
03
$30
,159
$66,9
64
$41,8
10$
87,17
2$
54
,427
$10
9,12
5$
68
,134
$13
3,0
62
$8
3,0
79
$15
9,2
64
$9
9,4
39
$18
8,0
68
$11
7,4
23
$219
,88
3$
137,2
87
12$
24,6
70
$14
,757
$14
,957
$8
,947
$3
1,016
$18
,554
$48,3
03
$28
,894
$66,9
64
$40
,058
$87,17
2$
52
,146
$10
9,12
5$
65,2
78
$13
3,0
62
$7
9,5
97
$15
9,2
64
$95
,271
$18
8,0
68
$11
2,5
01
$219
,88
3$
131,533
13$
33,2
85
$19
,076
$14
,957
$8
,572
$3
1,016
$17
,776
$48,3
03
$27
,683
$66,9
64
$38
,379
$87,17
2$
49
,960
$10
9,12
5$
62,5
42
$13
3,0
62
$76
,261
$15
9,2
64
$91,
277
$18
8,0
68
$10
7,7
85
$219
,88
3$
126,0
19
14$
25,8
49
$14
,194
$14
,957
$8,2
13$
31,016
$17
,031
$48,3
03
$26
,523
$66,9
64
$36
,770
$87,17
2$
47
,866
$10
9,12
5$
59,9
20
$13
3,0
62
$7
3,0
64
$15
9,2
64
$87
,451
$18
8,0
68
$10
3,2
67
$219
,88
3$
120,7
37
15$
12,8
96
$6
,784
$14
,957
$7
,869
$3
1,016
$16
,317
$48,3
03
$25,4
11$
66,9
64
$35
,229
$87,17
2$
45
,859
$10
9,12
5$
57,4
09
$13
3,0
62
$70
,001
$15
9,2
64
$8
3,7
86
$18
8,0
68
$9
8,9
39
$219
,88
3$
115,6
76
16$
44,5
08
$22
,433
$14
,957
$7
,539
$3
1,016
$15
,633
$48,3
03
$24
,346
$66,9
64
$33
,752
$87,17
2$
43
,937
$10
9,12
5$
55,0
02
$13
3,0
62
$6
7,0
67
$15
9,2
64
$8
0,2
74
$18
8,0
68
$9
4,7
92
$219
,88
3$
110,8
28
17$
28,5
68
$13
,796
$14
,957
$7
,223
$3
1,016
$14
,978
$48,3
03
$23
,326
$66,9
64
$32
,337
$87,17
2$
42
,096
$10
9,12
5$
52,6
97
$13
3,0
62
$6
4,2
56
$15
9,2
64
$7
6,9
09
$18
8,0
68
$90
,818
$219
,88
3$
106,182
18$
37,4
04
$17
,305
$14
,957
$6
,920
$3
1,016
$14
,350
$48,3
03
$22
,348
$66,9
64
$30
,982
$87,17
2$
40
,331
$10
9,12
5$
50,4
88
$13
3,0
62
$61,
563
$15
9,2
64
$7
3,6
85
$18
8,0
68
$87
,012
$219
,88
3$
101,731
19$
13,2
66
$5
,880
$14
,957
$6
,630
$3
1,016
$13
,748
$48,3
03
$21,4
11$
66,9
64
$29
,683
$87,17
2$
38
,640
$10
9,12
5$
48,3
72
$13
3,0
62
$5
8,9
82
$15
9,2
64
$7
0,5
96
$18
8,0
68
$8
3,3
64
$219
,88
3$
97,4
67
20
$24,7
00
$10
,490
$14
,957
$6
,352
$3
1,016
$13
,172
$48,3
03
$20
,514
$66,9
64
$28
,439
$87,17
2$
37
,021
$10
9,12
5$
46,3
44
$13
3,0
62
$56
,510
$15
9,2
64
$6
7,6
37
$18
8,0
68
$7
9,8
70
$219
,88
3$
93,3
82
To
tal
$65
3,161
$448
,930
$2
99,142
$19
6,6
85
$6
20,3
17$
407
,858
$966,0
55
$635,1
81
$1,
339,2
89
$880
,581
$1,
743,4
36
$1,14
6,3
08
$2
,182,5
08
$1,43
4,9
97
$2,6
61,241
$1,74
9,7
64
$3,1
85,2
71
$2,0
94
,313
$3
,761,35
3$
2,4
73,0
87
$4,3
97,6
63
$2,8
91,460
B/C
Ra
tio
0.4
40
.91
1.4
11.
96
2.5
53
.20
3.9
04
.67
5.5
16
.44
No
tes:
All
1 is
the v
ecto
r o
f in
cre
ased
co
sts
fo
r v
essels
saili
ng w
ith a
one fo
ot dra
ft re
ductio
n t
o th
e L
NG
pla
nts
an
d refin
eries c
ove
ring r
iver m
iles 5
to
36 a
nd
Devil'
s E
lbo
w.
All
1 P
V is
th
e p
res
ent va
lue o
f th
e in
cre
ased c
osts
fo
r vess
els
saili
ng w
ith a
one
fo
ot dra
ft redu
ctio
n to
the L
NG
pla
nts
and re
fineri
es c
overin
g riv
e m
iles 5
to
36 a
nd D
evils
' Elb
ow
.
Seg 1
-3 is
th
e v
ecto
r o
f a
nnua
l DM
MP
co
sts
fo
r th
e tw
enty
year
perio
d c
overi
ng riv
er m
iles
-32 th
rough 3
6 a
nd D
ev
ils' E
lbo
w.
Seg 1
-3 P
V is
the
pre
se
nt valu
e o
f annua
l DM
MP
co
sts
fo
r th
e tw
enty
yea
r perio
d c
overi
ng riv
er m
iles
-32 t
hro
ugh 3
6 a
nd D
ev
ils' E
lbo
w.
B/C
Ratio
is the
benefi
t co
st ra
tio
co
mpute
d b
y div
idin
g the s
um
of th
e p
res
ent va
lue o
f in
cre
ased v
essel c
osts
fro
m d
raft
red
uctio
ns b
y th
e p
resent v
alu
e o
f th
e D
MM
P c
osts
.
Inc
reas
ed c
osts
fo
r segm
ents
1 - 3
are
pre
sente
d fo
r o
ne f
oo
t to
te
n fo
ot
dra
ft red
uctio
ns (
refe
r to
Ta
ble
15).
So
urc
e:
GE
C

Tab
le A
-7.
Ben
efi
t/C
ost
Rati
os f
or
Scen
ari
o 3
fo
r C
alc
asie
u R
iver
DM
MP
fo
r S
eg
men
ts 1
– 3
($1,0
00)
Y
ea
rS
eg
1-3
Se
g 1
-3
PV
All
1A
ll 1
PV
All
2A
ll 2
PV
All
3A
ll 3
PV
All
4A
ll 4
PV
All
5A
ll 5
PV
All
6A
ll 6
PV
All
7A
ll 7
PV
All
8A
ll 8
PV
All
9A
ll 9
PV
All
10
A
ll 1
0 P
V
1$
55,0
35
$52
,728
$10
,504
$10
,063
$21,785
$20
,872
$33,9
33
$32
,510
$47,0
52
$45
,079
$61,26
3$
58
,695
$76,7
09
$7
3,4
94
$93,5
59
$8
9,6
38
$11
2,0
13$
107
,318
$13
2,3
13$
126,7
67
$15
4,7
49
$14
8,2
63
2$
36,9
84
$33
,949
$10
,504
$9
,642
$21,785
$19
,997
$33,9
33
$31,14
8$
47,0
52
$43
,190
$61,26
3$
56
,235
$76,7
09
$70
,413
$93,5
59
$8
5,8
80
$11
2,0
13$
102,8
20
$13
2,3
13$
121,
453
$15
4,7
49
$14
2,0
48
3$
40,9
56
$36
,019
$10
,504
$9
,237
$21,785
$19
,159
$33,9
33
$29
,842
$47,0
52
$41,
379
$61,26
3$
53
,878
$76,7
09
$6
7,4
62
$93,5
59
$82
,281
$11
2,0
13$
98
,510
$13
2,3
13$
116,3
62
$15
4,7
49
$13
6,0
94
4$
51,379
$43
,291
$10
,504
$8
,850
$21,785
$18
,355
$33,9
33
$28
,591
$47,0
52
$39
,645
$61,26
3$
51,
619
$76,7
09
$6
4,6
34
$93,5
59
$7
8,8
32
$11
2,0
13$
94
,381
$13
2,3
13$
111,
485
$15
4,7
49
$13
0,3
90
5$
33,8
25
$27
,306
$10
,504
$8
,479
$21,785
$17
,586
$33,9
33
$27
,393
$47,0
52
$37
,983
$61,26
3$
49
,456
$76,7
09
$61,
925
$93,5
59
$7
5,5
27
$11
2,0
13$
90,4
25
$13
2,3
13$
106
,812
$15
4,7
49
$12
4,9
24
6$
30,5
13$
23
,600
$10
,504
$8,1
24
$21,785
$16
,849
$33,9
33
$26
,245
$47,0
52
$36
,391
$61,26
3$
47
,383
$76,7
09
$5
9,3
29
$93,5
59
$7
2,3
62
$11
2,0
13$
86,6
35
$13
2,3
13$
102,3
35
$15
4,7
49
$11
9,6
88
7$
15,9
87
$11
,847
$10
,504
$7
,783
$21,785
$16
,143
$33,9
33
$25
,144
$47,0
52
$34
,866
$61,26
3$
45
,397
$76,7
09
$5
6,8
42
$93,5
59
$6
9,3
28
$11
2,0
13$
83,0
03
$13
2,3
13$
98,0
45
$15
4,7
49
$11
4,6
71
8$
47,6
33
$33
,817
$10
,504
$7
,457
$21,785
$15
,466
$33,9
33
$24
,090
$47,0
52
$33
,404
$61,26
3$
43
,494
$76,7
09
$5
4,4
60
$93,5
59
$6
6,4
22
$11
2,0
13$
79,5
24
$13
2,3
13$
93,9
36
$15
4,7
49
$10
9,8
64
9$
20,5
09
$13
,950
$10
,504
$7,1
45
$21,785
$14
,818
$33,9
33
$23
,081
$47,0
52
$32
,004
$61,26
3$
41,
671
$76,7
09
$52
,177
$93,5
59
$6
3,6
38
$11
2,0
13$
76
,191
$13
2,3
13$
89,9
98
$15
4,7
49
$10
5,2
59
10$
27,8
05
$18
,120
$10
,504
$6
,845
$21,785
$14
,197
$33,9
33
$22,1
13$
47,0
52
$30
,663
$61,26
3$
39
,924
$76,7
09
$4
9,9
90
$93,5
59
$60
,971
$11
2,0
13$
72,9
97
$13
2,3
13$
86,2
26
$15
4,7
49
$10
0,8
47
11$
47,3
89
$29
,588
$10
,504
$6
,558
$21,785
$13
,602
$33,9
33
$21,18
6$
47,0
52
$29
,377
$61,26
3$
38
,250
$76,7
09
$4
7,8
95
$93,5
59
$58
,415
$11
2,0
13$
69,9
37
$13
2,3
13$
82
,611
$15
4,7
49
$96,6
20
12$
24,6
70
$14
,757
$10
,504
$6
,283
$21,785
$13
,031
$33,9
33
$20
,298
$47,0
52
$28
,146
$61,26
3$
36
,647
$76,7
09
$4
5,8
87
$93,5
59
$5
5,9
67
$11
2,0
13$
67,0
06
$13
2,3
13$
79
,149
$15
4,7
49
$92,5
70
13$
33,2
85
$19
,076
$10
,504
$6
,020
$21,785
$12
,485
$33,9
33
$19
,447
$47,0
52
$26
,966
$61,26
3$
35,1
11$
76,7
09
$4
3,9
64
$93,5
59
$53
,621
$11
2,0
13$
64
,197
$13
2,3
13$
75
,831
$15
4,7
49
$88,6
90
14$
25,8
49
$14
,194
$10
,504
$5
,768
$21,785
$11
,962
$33,9
33
$18
,632
$47,0
52
$25
,836
$61,26
3$
33
,639
$76,7
09
$42
,121
$93,5
59
$51,
373
$11
2,0
13$
61,
506
$13
2,3
13$
72,6
53
$15
4,7
49
$84,9
72
15$
12,8
96
$6
,784
$10
,504
$5
,526
$21,785
$11
,461
$33,9
33
$17
,851
$47,0
52
$24
,753
$61,26
3$
32
,229
$76,7
09
$4
0,3
55
$93,5
59
$4
9,2
20
$11
2,0
13$
58,9
28
$13
2,3
13$
69,6
07
$15
4,7
49
$8
1,411
16$
44,5
08
$22
,433
$10
,504
$5
,294
$21,785
$10
,980
$33,9
33
$17
,103
$47,0
52
$23
,715
$61,26
3$
30
,878
$76,7
09
$3
8,6
64
$93,5
59
$47
,157
$11
2,0
13$
56,4
58
$13
2,3
13$
66,6
90
$15
4,7
49
$77,9
98
17$
28,5
68
$13
,796
$10
,504
$5
,072
$21,785
$10
,520
$33,9
33
$16
,386
$47,0
52
$22
,721
$61,26
3$
29
,584
$76,7
09
$3
7,0
43
$93,5
59
$45
,180
$11
2,0
13$
54,0
92
$13
2,3
13$
63,8
94
$15
4,7
49
$74,7
29
18$
37,4
04
$17
,305
$10
,504
$4
,860
$21,785
$10
,079
$33,9
33
$15
,699
$47,0
52
$21,
769
$61,26
3$
28
,344
$76,7
09
$3
5,4
90
$93,5
59
$4
3,2
86
$11
2,0
13$
51,
824
$13
2,3
13$
61,
216
$15
4,7
49
$71,59
7
19$
13,2
66
$5
,880
$10
,504
$4
,656
$21,785
$9
,656
$33,9
33
$15
,041
$47,0
52
$20
,856
$61,26
3$
27
,156
$76,7
09
$3
4,0
03
$93,5
59
$41,
472
$11
2,0
13$
49,6
52
$13
2,3
13$
58,6
50
$15
4,7
49
$68,5
95
20
$24,7
00
$10
,490
$10
,504
$4,4
61
$21,785
$9
,252
$33,9
33
$14
,411
$47,0
52
$19
,982
$61,26
3$
26
,018
$76,7
09
$3
2,5
78
$93,5
59
$3
9,7
34
$11
2,0
13$
47
,571
$13
2,3
13$
56
,192
$15
4,7
49
$65,7
20
To
tal
$65
3,161
$448
,930
$2
10,0
74
$13
8,124
$4
35,6
94
$286
,468
$678,6
53
$446
,214
$9
41,032
$618
,728
$1,
225,2
60
$80
5,6
07
$1,5
34,18
7$
1,00
8,7
27
$1,8
71,18
6$
1,23
0,3
03
$2,2
40,2
68
$1,47
2,9
75
$2,6
46,2
56
$1,739
,911
$3,0
94,9
86
$2,0
34,9
51
B/C
Ra
tio
0.3
10
.64
0.9
91.
38
1.7
92
.25
2.7
43
.28
3.8
84
.53
No
tes:
All
1 is
the v
ecto
r o
f in
cre
ased
co
sts
fo
r v
essels
saili
ng w
ith a
one fo
ot dra
ft re
ductio
n t
o th
e L
NG
pla
nts
an
d refin
eries c
ove
ring r
iver m
iles 5
to
36 a
nd
Devil'
s E
lbo
w.
All
1 P
V is
th
e p
res
ent va
lue o
f th
e in
cre
ased c
osts
fo
r vess
els
saili
ng w
ith a
one
fo
ot dra
ft redu
ctio
n to
the L
NG
pla
nts
and re
fineri
es c
overin
g riv
e m
iles 5
to
36 a
nd D
evils
' Elb
ow
.
Seg 1
-3 is
th
e v
ecto
r o
f a
nnua
l DM
MP
co
sts
fo
r th
e tw
enty
year
perio
d c
overi
ng riv
er m
iles
-32 th
rough 3
6 a
nd D
ev
ils' E
lbo
w.
Seg 1
-3 P
V is
the
pre
se
nt valu
e o
f annua
l DM
MP
co
sts
fo
r th
e tw
enty
yea
r perio
d c
overi
ng riv
er m
iles
-32 t
hro
ugh 3
6 a
nd D
ev
ils' E
lbo
w.
B/C
Ratio
is the
benefi
t co
st ra
tio
co
mpute
d b
y div
idin
g the s
um
of th
e p
res
ent va
lue o
f in
cre
ased v
essel c
osts
fro
m d
raft
red
uctio
ns b
y th
e p
resent v
alu
e o
f th
e D
MM
P c
osts
.
Inc
reas
ed c
osts
fo
r segm
ents
1 - 3
are
pre
sente
d fo
r o
ne f
oo
t to
te
n fo
ot
dra
ft red
uctio
ns (
refe
r to
Ta
ble
15).
So
urc
e:
GE
C