Embed Size (px)
Citation preview
Environmental Noise and Vibration Assessment
Lincoln Meadows Residential Development
Lincoln, California
BAC Job # 2015-291
Prepared For:
Raney Planning & Management, Inc.
Mr. Nick Pappani 1501 Sports Drive Sacramento, California
Prepared By:
Bollard Acoustical Consultants, Inc.
Paul Bollard, President
May 11, 2017
3551 Bankhead Road Loomis, CA 95650 Phone: (916) 663-0500 Fax: (916) 663-0501 BACNOISE.COM
Bollard Acoustical Consultants, Inc. (BAC)
Environmental Noise and Vibration Analysis Lincoln Meadows Residential Development
Lincoln, California Page 1
Introduction
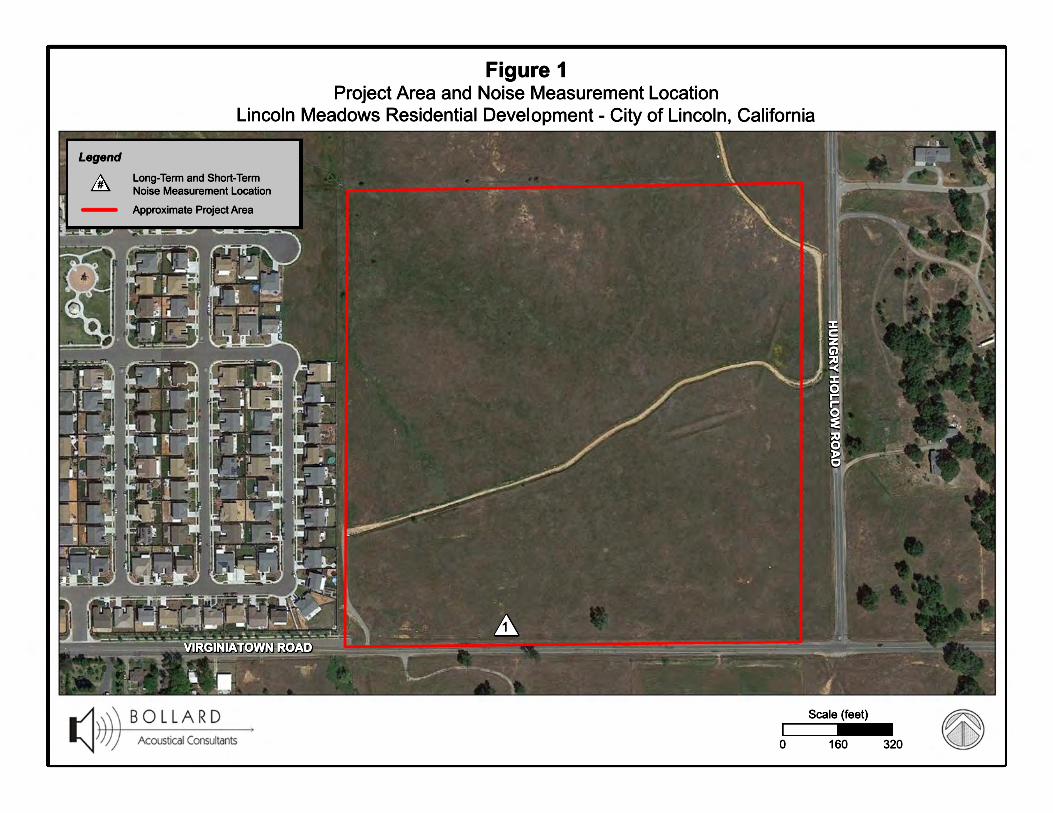
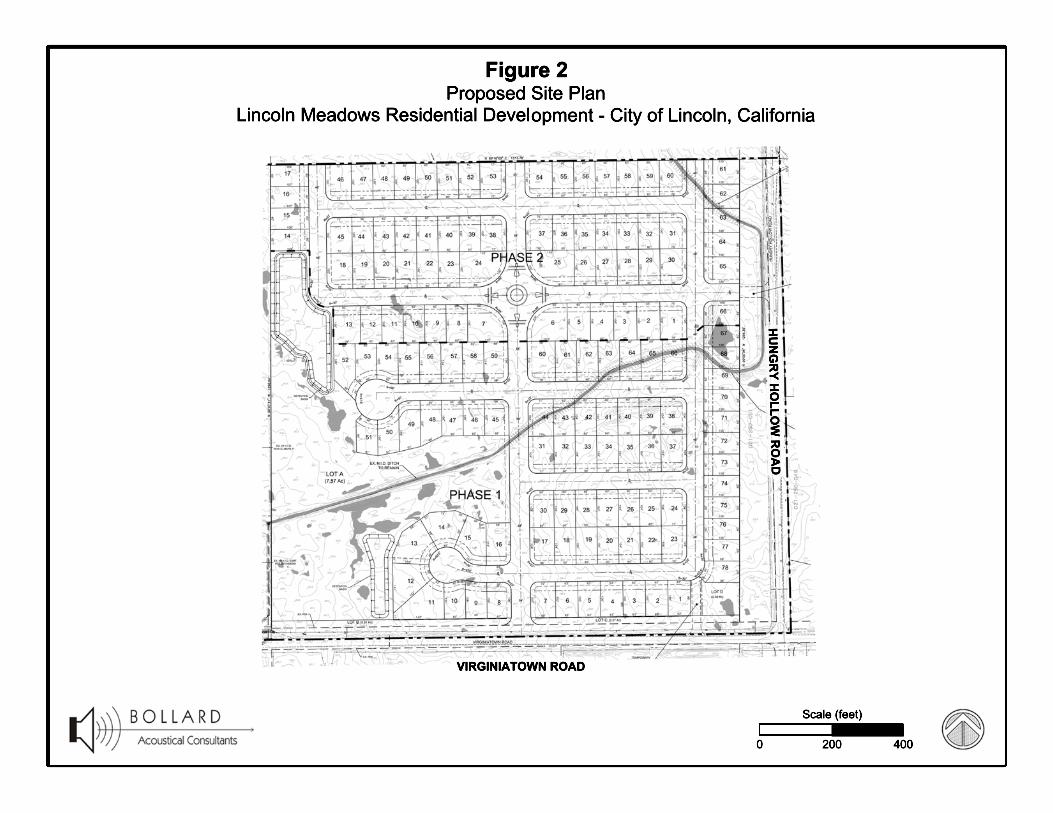
The proposed Lincoln Meadows Residential Development (project) is located on Virginiatown Road, West of Hungry Hollow Road, in the City of Lincoln, California. The project consists of 144 single-family residential units. The project vicinity and site plan are illustrated in Figures 1 and 2, respectively. Traffic on Virginiatown Road is considered to be a significant noise source which may affect the design of the project. As a result, Bollard Acoustical Consultants, Inc. (BAC) was retained by Raney Planning & Management, Inc. to prepare this acoustical analysis. Specifically, this analysis was prepared to determine whether traffic noise from this roadway would cause exterior and interior noise levels in the proposed residences at the project site to exceed acceptable limits as described in the Noise Element of the City of Lincoln General Plan. In addition, this analysis evaluates potential impacts associated with off-site increases in traffic noise resulting from the proposed project.
Environmental Setting
Noise Fundamentals and Terminology
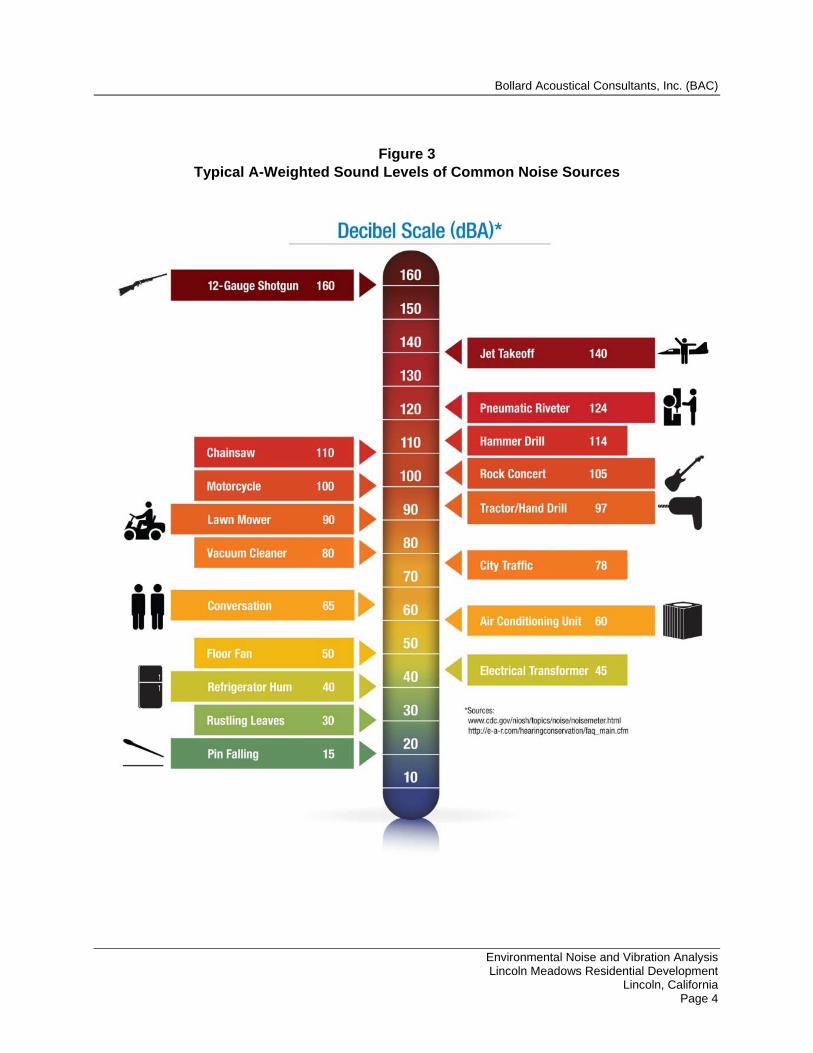
Noise is often described as unwanted sound. Sound is defined as any pressure variation in air that the human ear can detect. If the pressure variations occur frequently enough (at least 20 times per second), they can be heard, and thus are called sound. Measuring sound directly in terms of pressure would require a very large and awkward range of numbers. To avoid this, the decibel scale was devised. The decibel scale allows a million-fold increase in pressure to be expressed as 120 dB. Another useful aspect of the decibel scale is that changes in levels (dB) correspond closely to human perception of relative loudness. Appendix A contains definitions of Acoustical Terminology. Figure 3 shows common noise levels associated with various sources. The perceived loudness of sounds is dependent upon many factors, including sound pressure level and frequency content. However, within the usual range of environmental noise levels, perception of loudness is relatively predictable, and can be approximated by weighing the frequency response of a sound level meter by means of the standardized A-weighing network. There is a strong correlation between A-weighted sound levels (expressed as dBA) and community response to noise. For this reason, the A-weighted sound level has become the standard tool of environmental noise assessment. All noise levels reported in this section are in terms of A-weighted levels in decibels. Community noise is commonly described in terms of the “ambient” noise level, which is defined as the all-encompassing noise level associated with a given noise environment. A common statistical tool to measure the ambient noise level is the average, or equivalent, sound level (Leq) over a given time period (usually one hour). The Leq is the foundation of the Day-Night Average Level noise descriptor, Ldn, and shows very good correlation with community response to noise.
Bollard Acoustical Consultants, Inc. (BAC)
Environmental Noise and Vibration Analysis Lincoln Meadows Residential Development
Lincoln, California Page 4
Figure 3 Typical A-Weighted Sound Levels of Common Noise Sources
Bollard Acoustical Consultants, Inc. (BAC)
Environmental Noise and Vibration Analysis Lincoln Meadows Residential Development
Lincoln, California Page 5
Vibration Fundamentals
Vibration is like noise in that it involves a source, a transmission path, and a receiver. While vibration is related to noise, it differs in that noise is generally considered to be pressure waves transmitted through air, while vibration is usually associated with transmission through the ground or structures. As with noise, vibration consists of an amplitude and frequency. A person’s response to vibration will depend on their individual sensitivity as well as the amplitude and frequency of the source. Vibration can be described in terms of acceleration, velocity, or displacement. A common practice is to monitor vibration measures in terms of peak particle velocities (inches/second). Standards pertaining to perception as well as damage to structures have been developed for vibration in terms of peak particle velocity. As vibrations travel outward from the source, they excite the particles of rock and soil through which they pass and cause them to oscillate. Differences in subsurface geologic conditions and distance from the source of vibration will result in different vibration levels characterized by different frequencies and intensities. In all cases, vibration amplitudes will decrease with increasing distance. The maximum rate, or velocity of particle movement, is the commonly accepted descriptor of the vibration “strength”. Human response to vibration is difficult to quantify. Vibration can be felt or heard well below the levels that produce any damage to structures. The duration of the event has an effect on human response, as does the frequency of the event. Generally, as the duration and vibration frequency increase, the potential for adverse human response increases. According to the Transportation and Construction-Induced Vibration Guidance Manual (Caltrans, June 2004), operation of construction equipment and construction techniques generate ground vibration. Traffic traveling on roadways can also be a source of such vibration. At high enough amplitudes, ground vibration has the potential to damage structures and/or cause cosmetic damage (e.g., crack plaster). Ground vibration can also be a source of annoyance to individuals who live or work close to vibration-generating activities. However, traffic, including heavy trucks traveling on a highway, rarely generates vibration amplitudes high enough to cause structural or cosmetic damage.
Bollard Acoustical Consultants, Inc. (BAC)
Environmental Noise and Vibration Analysis Lincoln Meadows Residential Development
Lincoln, California Page 6
Existing and Future Noise and Vibration Environments
The existing ambient noise environment in the immediate project vicinity is defined primarily by noise from traffic on Virginia Town Road and to a lesser extent by natural sounds and noise from traffic on Hungry Hollow Road, which is lightly travelled. As no other substantive sources of ambient noise were identified in the immediate project vicinity, this analysis focuses on existing and future traffic noise environments. To quantify existing traffic noise levels in the project vicinity, noise surveys were conducted on the project site. Those data were supplemented with noise modeling data where appropriate. Because no discernible sources of vibration were identified through project area inspections, ambient vibration monitoring was not conducted for this project. The following sections describe the existing and projected future traffic noise environment in the immediate project vicinity, both with and without the proposed project. General Ambient Noise Environment To generally quantify existing background noise levels in the project area, continuous (24-hour) ambient noise monitoring was conducted at the project site on September 20, 2016 at the location shown on Figure 1. A Larson Davis Laboratories (LDL) Model 820 precision integrating sound level meter was used for the ambient noise level measurement survey. The meter was calibrated before use with an LDL Model CA200 acoustical calibrator to ensure the accuracy of the measurements. The equipment used meets all pertinent specifications of the American National Standards Institute for Type 1 sound level meters (ANSI S1.4). The noise level meter was programmed to record the maximum and average noise level during each hour of the noise survey, in addition to other statistical descriptors. The ambient noise monitoring results indicate that daytime and nighttime average noise levels were 60 and 54 dB Leq, respectively, with a computed day/night average level of 62 dB Ldn. The complete continuous noise measurement results and graphical depictions of the results are shown in Appendices B and C, respectively. The noise level data shown in Appendices B & C spans the complete 24-hour period of September 20, 2016. As a result, it includes all sources of noise present during that 24-hour period, including nighttime automobile and heavy truck traffic on the local roadways, primarily Virginiatown Road.
Bollard Acoustical Consultants, Inc. (BAC)
Environmental Noise and Vibration Analysis Lincoln Meadows Residential Development
Lincoln, California Page 7
Regulatory Setting
Criteria for Acceptable Noise and Vibration Exposure City of Lincoln General Plan Noise Standards
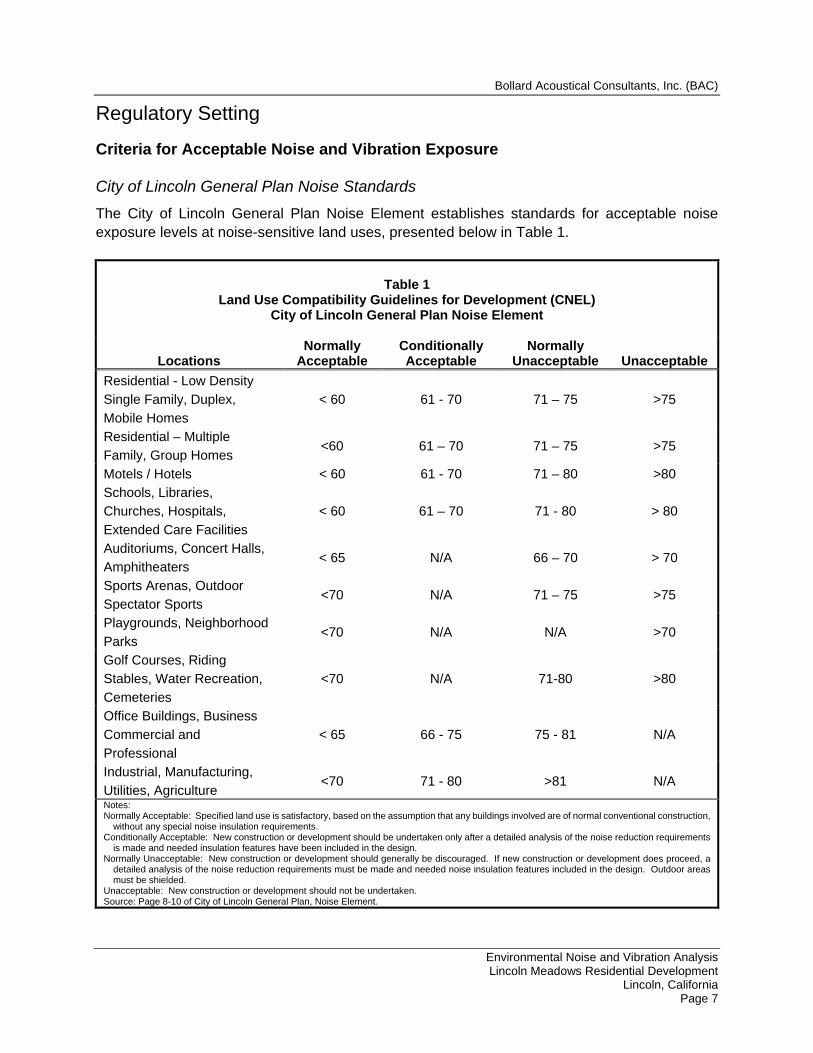
The City of Lincoln General Plan Noise Element establishes standards for acceptable noise exposure levels at noise-sensitive land uses, presented below in Table 1.
Table 1
Land Use Compatibility Guidelines for Development (CNEL) City of Lincoln General Plan Noise Element
Locations Normally
Acceptable Conditionally Acceptable
Normally Unacceptable Unacceptable
Residential - Low Density
Single Family, Duplex,
Mobile Homes
< 60 61 - 70 71 – 75 >75
Residential – Multiple
Family, Group Homes <60 61 – 70 71 – 75 >75
Motels / Hotels < 60 61 - 70 71 – 80 >80
Schools, Libraries,
Churches, Hospitals,
Extended Care Facilities
< 60 61 – 70 71 - 80 > 80
Auditoriums, Concert Halls,
Amphitheaters < 65 N/A 66 – 70 > 70
Sports Arenas, Outdoor
Spectator Sports <70 N/A 71 – 75 >75
Playgrounds, Neighborhood
Parks <70 N/A N/A >70
Golf Courses, Riding
Stables, Water Recreation,
Cemeteries
<70 N/A 71-80 >80
Office Buildings, Business
Commercial and
Professional
< 65 66 - 75 75 - 81 N/A
Industrial, Manufacturing,
Utilities, Agriculture <70 71 - 80 >81 N/A
Notes: Normally Acceptable: Specified land use is satisfactory, based on the assumption that any buildings involved are of normal conventional construction,
without any special noise insulation requirements. Conditionally Acceptable: New construction or development should be undertaken only after a detailed analysis of the noise reduction requirements
is made and needed insulation features have been included in the design. Normally Unacceptable: New construction or development should generally be discouraged. If new construction or development does proceed, a
detailed analysis of the noise reduction requirements must be made and needed noise insulation features included in the design. Outdoor areas must be shielded.
Unacceptable: New construction or development should not be undertaken. Source: Page 8-10 of City of Lincoln General Plan, Noise Element.
Bollard Acoustical Consultants, Inc. (BAC)
Environmental Noise and Vibration Analysis Lincoln Meadows Residential Development
Lincoln, California Page 8
In addition to the exterior noise standards shown above, the City of Lincoln applies a 45 dB Ldn interior noise standard to new residential uses.
Significance of Project-Related Noise Level Increases
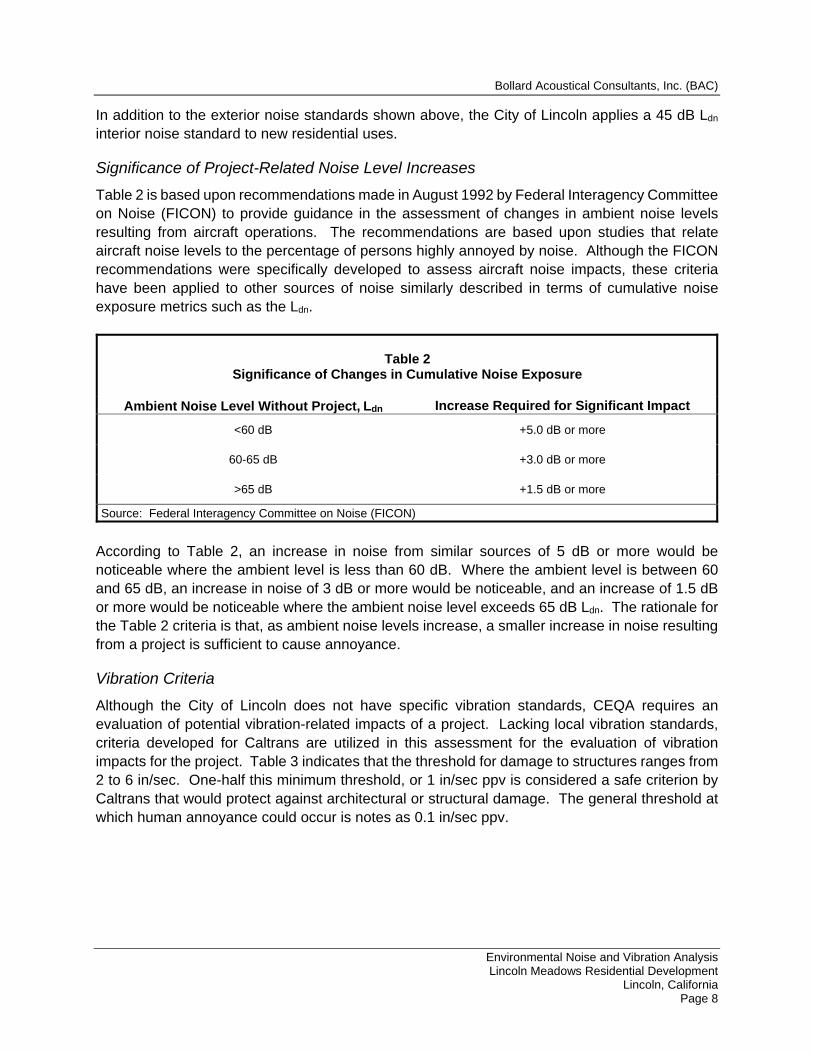
Table 2 is based upon recommendations made in August 1992 by Federal Interagency Committee on Noise (FICON) to provide guidance in the assessment of changes in ambient noise levels resulting from aircraft operations. The recommendations are based upon studies that relate aircraft noise levels to the percentage of persons highly annoyed by noise. Although the FICON recommendations were specifically developed to assess aircraft noise impacts, these criteria have been applied to other sources of noise similarly described in terms of cumulative noise exposure metrics such as the Ldn.
Table 2
Significance of Changes in Cumulative Noise Exposure
Ambient Noise Level Without Project, Ldn Increase Required for Significant Impact
<60 dB +5.0 dB or more
60-65 dB +3.0 dB or more
>65 dB +1.5 dB or more
Source: Federal Interagency Committee on Noise (FICON)
According to Table 2, an increase in noise from similar sources of 5 dB or more would be noticeable where the ambient level is less than 60 dB. Where the ambient level is between 60 and 65 dB, an increase in noise of 3 dB or more would be noticeable, and an increase of 1.5 dB or more would be noticeable where the ambient noise level exceeds 65 dB Ldn. The rationale for the Table 2 criteria is that, as ambient noise levels increase, a smaller increase in noise resulting from a project is sufficient to cause annoyance.
Vibration Criteria
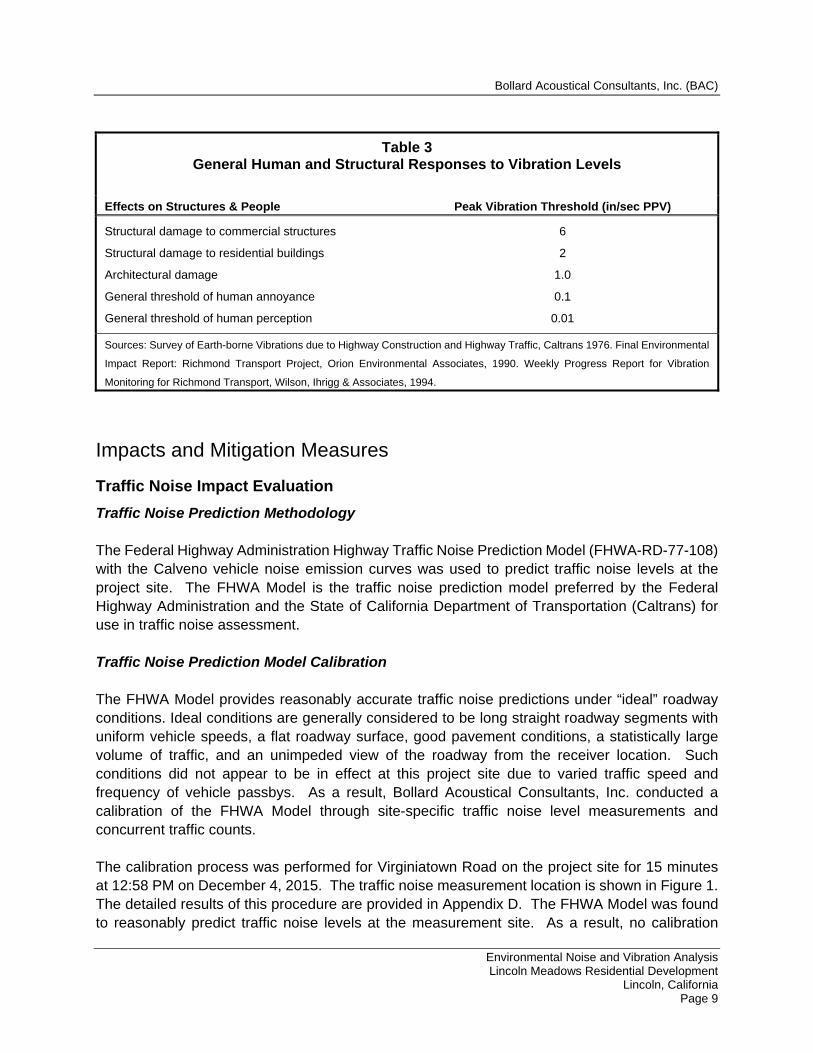
Although the City of Lincoln does not have specific vibration standards, CEQA requires an evaluation of potential vibration-related impacts of a project. Lacking local vibration standards, criteria developed for Caltrans are utilized in this assessment for the evaluation of vibration impacts for the project. Table 3 indicates that the threshold for damage to structures ranges from 2 to 6 in/sec. One-half this minimum threshold, or 1 in/sec ppv is considered a safe criterion by Caltrans that would protect against architectural or structural damage. The general threshold at which human annoyance could occur is notes as 0.1 in/sec ppv.
Bollard Acoustical Consultants, Inc. (BAC)
Environmental Noise and Vibration Analysis Lincoln Meadows Residential Development
Lincoln, California Page 9
Table 3 General Human and Structural Responses to Vibration Levels
Effects on Structures & People Peak Vibration Threshold (in/sec PPV)
Structural damage to commercial structures
Structural damage to residential buildings
Architectural damage
General threshold of human annoyance
General threshold of human perception
6
2
1.0
0.1
0.01
Sources: Survey of Earth-borne Vibrations due to Highway Construction and Highway Traffic, Caltrans 1976. Final Environmental
Impact Report: Richmond Transport Project, Orion Environmental Associates, 1990. Weekly Progress Report for Vibration
Monitoring for Richmond Transport, Wilson, Ihrigg & Associates, 1994.
Impacts and Mitigation Measures
Traffic Noise Impact Evaluation
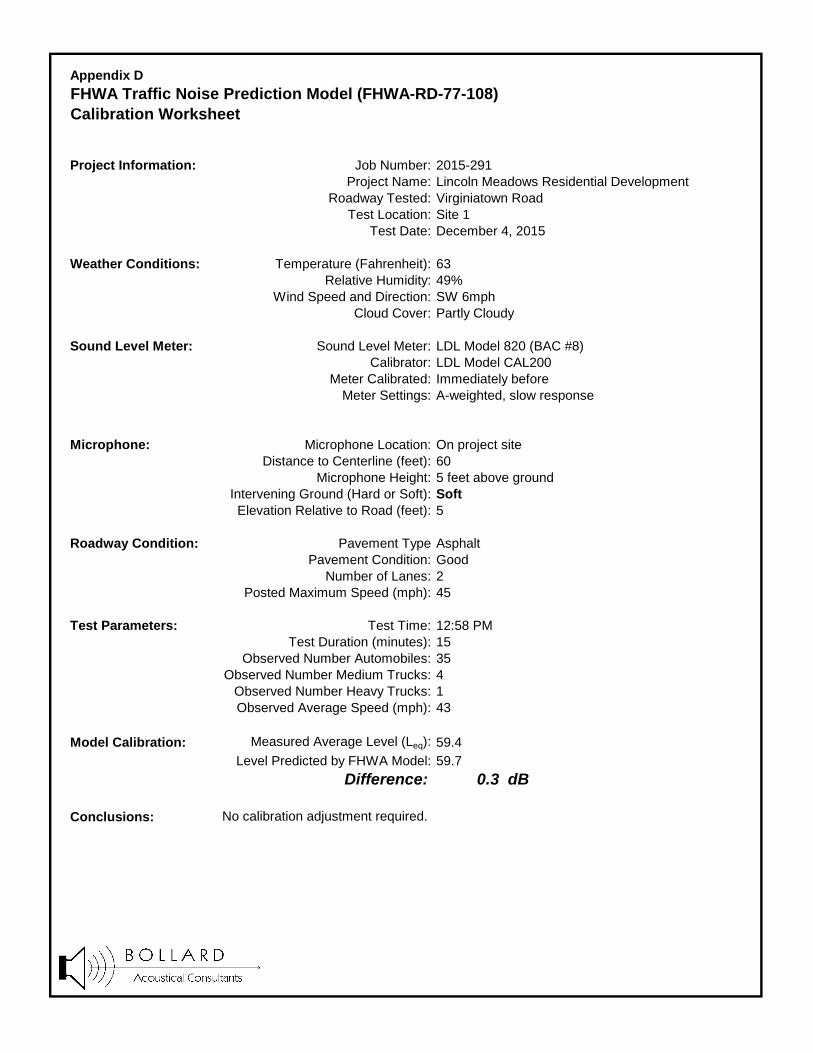
Traffic Noise Prediction Methodology The Federal Highway Administration Highway Traffic Noise Prediction Model (FHWA-RD-77-108) with the Calveno vehicle noise emission curves was used to predict traffic noise levels at the project site. The FHWA Model is the traffic noise prediction model preferred by the Federal Highway Administration and the State of California Department of Transportation (Caltrans) for use in traffic noise assessment. Traffic Noise Prediction Model Calibration The FHWA Model provides reasonably accurate traffic noise predictions under “ideal” roadway conditions. Ideal conditions are generally considered to be long straight roadway segments with uniform vehicle speeds, a flat roadway surface, good pavement conditions, a statistically large volume of traffic, and an unimpeded view of the roadway from the receiver location. Such conditions did not appear to be in effect at this project site due to varied traffic speed and frequency of vehicle passbys. As a result, Bollard Acoustical Consultants, Inc. conducted a calibration of the FHWA Model through site-specific traffic noise level measurements and concurrent traffic counts. The calibration process was performed for Virginiatown Road on the project site for 15 minutes at 12:58 PM on December 4, 2015. The traffic noise measurement location is shown in Figure 1. The detailed results of this procedure are provided in Appendix D. The FHWA Model was found to reasonably predict traffic noise levels at the measurement site. As a result, no calibration
Bollard Acoustical Consultants, Inc. (BAC)
Environmental Noise and Vibration Analysis Lincoln Meadows Residential Development
Lincoln, California Page 10
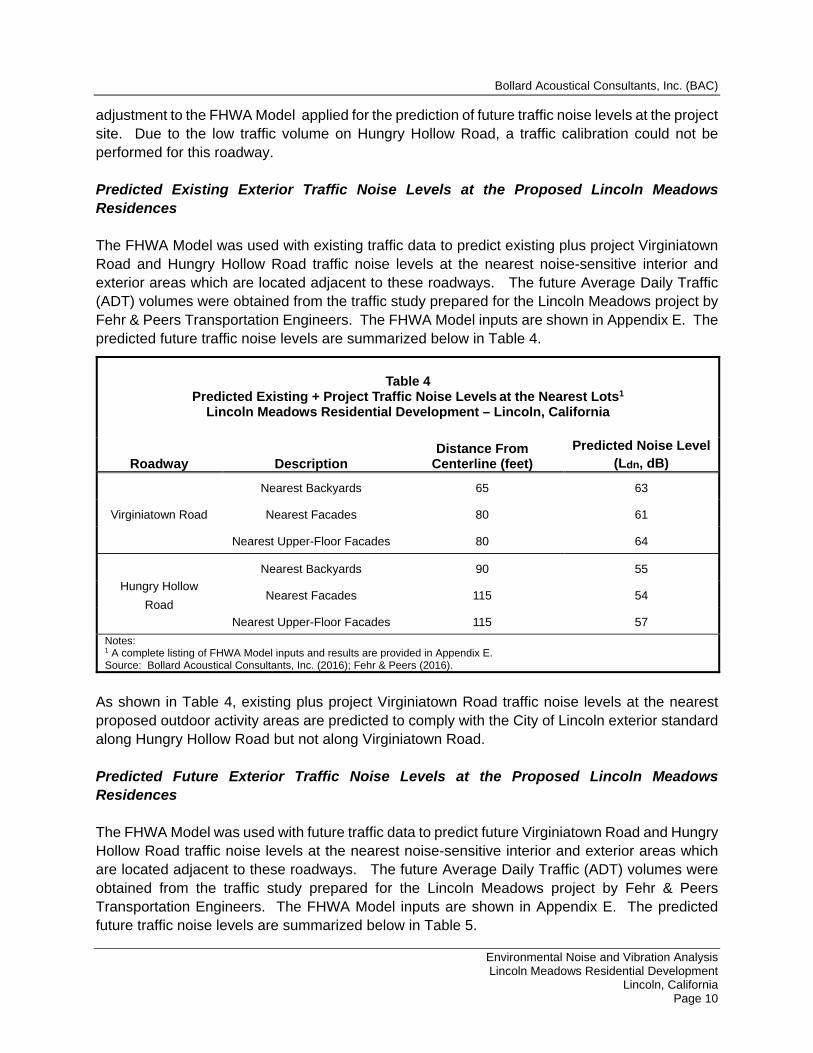
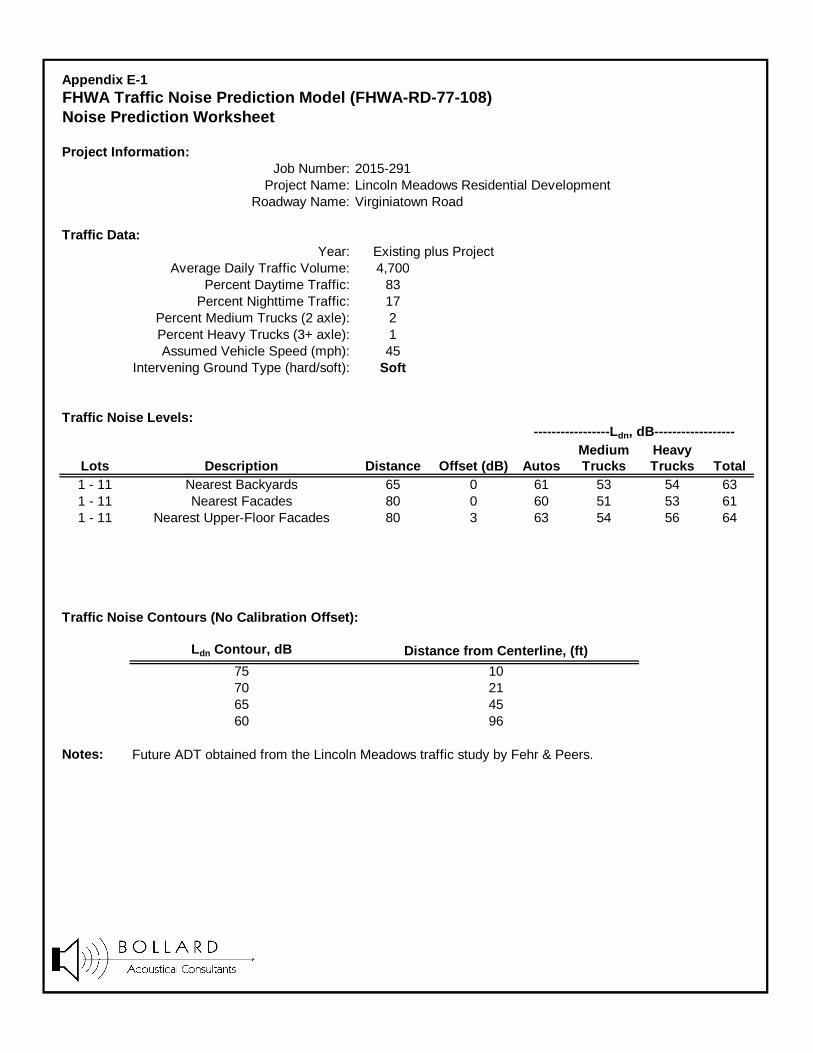
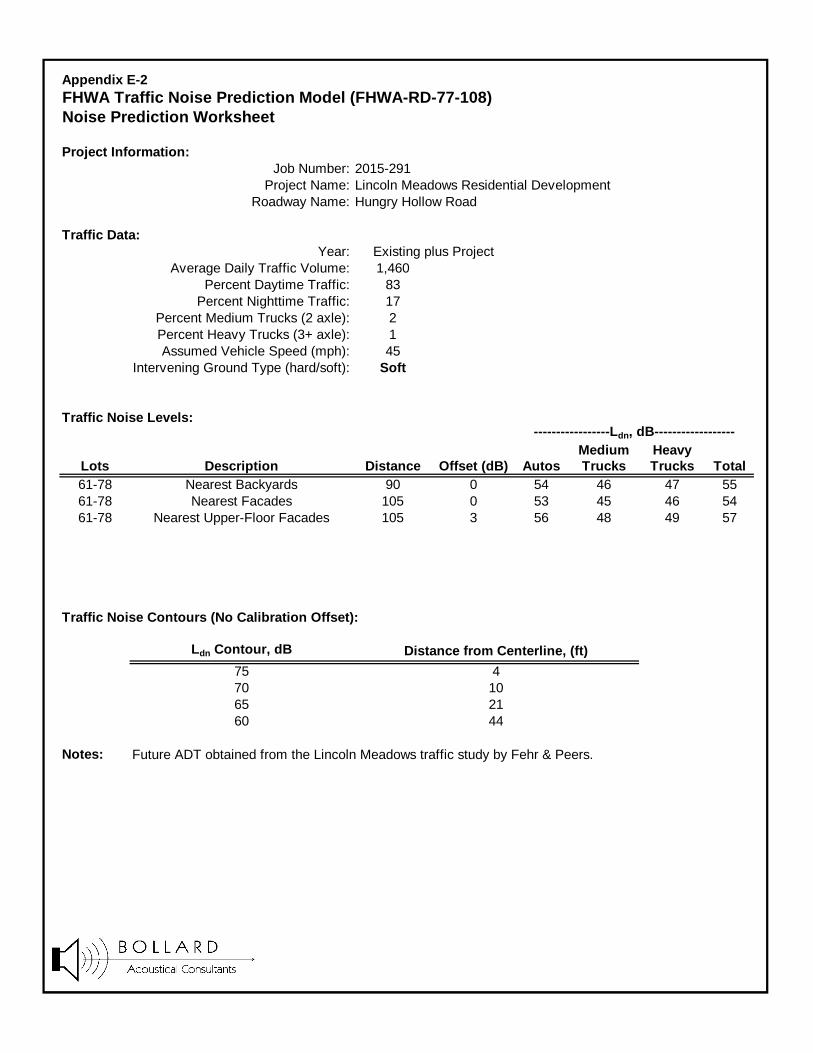
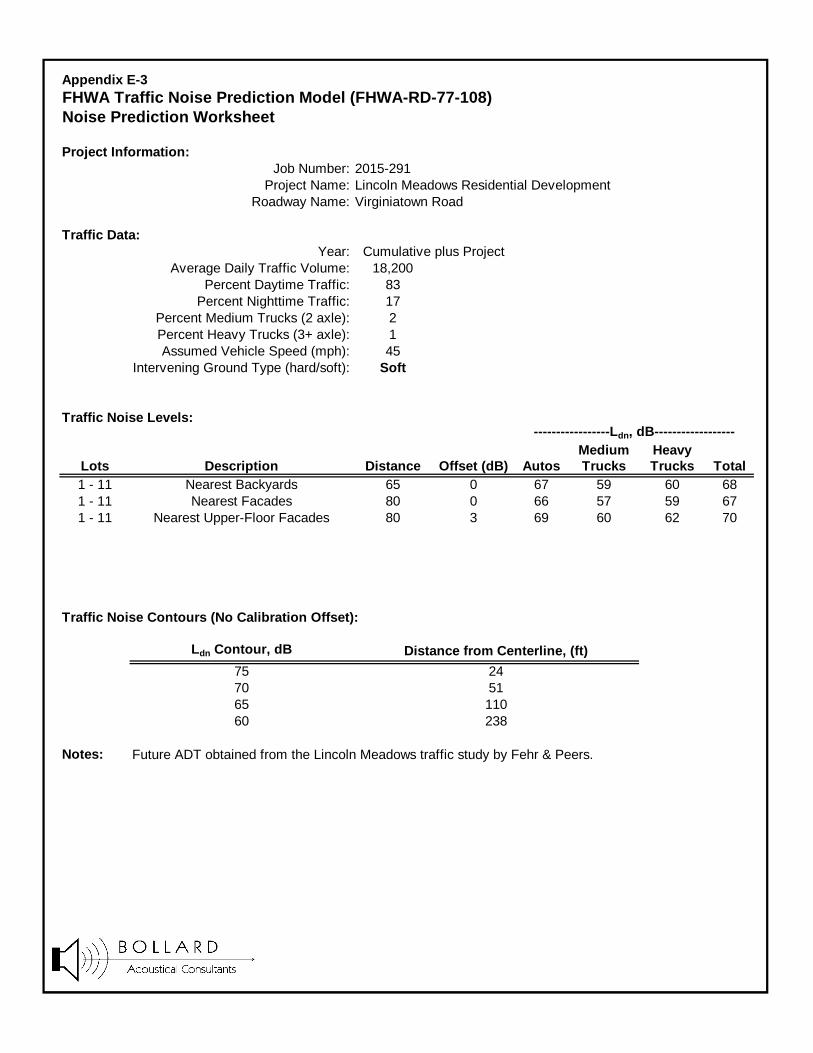
adjustment to the FHWA Model applied for the prediction of future traffic noise levels at the project site. Due to the low traffic volume on Hungry Hollow Road, a traffic calibration could not be performed for this roadway. Predicted Existing Exterior Traffic Noise Levels at the Proposed Lincoln Meadows Residences The FHWA Model was used with existing traffic data to predict existing plus project Virginiatown Road and Hungry Hollow Road traffic noise levels at the nearest noise-sensitive interior and exterior areas which are located adjacent to these roadways. The future Average Daily Traffic (ADT) volumes were obtained from the traffic study prepared for the Lincoln Meadows project by Fehr & Peers Transportation Engineers. The FHWA Model inputs are shown in Appendix E. The predicted future traffic noise levels are summarized below in Table 4.
As shown in Table 4, existing plus project Virginiatown Road traffic noise levels at the nearest proposed outdoor activity areas are predicted to comply with the City of Lincoln exterior standard along Hungry Hollow Road but not along Virginiatown Road. Predicted Future Exterior Traffic Noise Levels at the Proposed Lincoln Meadows Residences The FHWA Model was used with future traffic data to predict future Virginiatown Road and Hungry Hollow Road traffic noise levels at the nearest noise-sensitive interior and exterior areas which are located adjacent to these roadways. The future Average Daily Traffic (ADT) volumes were obtained from the traffic study prepared for the Lincoln Meadows project by Fehr & Peers Transportation Engineers. The FHWA Model inputs are shown in Appendix E. The predicted future traffic noise levels are summarized below in Table 5.
Table 4
Predicted Existing + Project Traffic Noise Levels at the Nearest Lots1
Lincoln Meadows Residential Development – Lincoln, California
Roadway Description Distance From
Centerline (feet)
Predicted Noise Level (Ldn, dB)
Virginiatown Road
Nearest Backyards 65 63
Nearest Facades 80 61
Nearest Upper-Floor Facades 80 64
Hungry Hollow
Road
Nearest Backyards 90 55
Nearest Facades 115 54
Nearest Upper-Floor Facades 115 57
Notes: 1 A complete listing of FHWA Model inputs and results are provided in Appendix E. Source: Bollard Acoustical Consultants, Inc. (2016); Fehr & Peers (2016).
Bollard Acoustical Consultants, Inc. (BAC)
Environmental Noise and Vibration Analysis Lincoln Meadows Residential Development
Lincoln, California Page 11
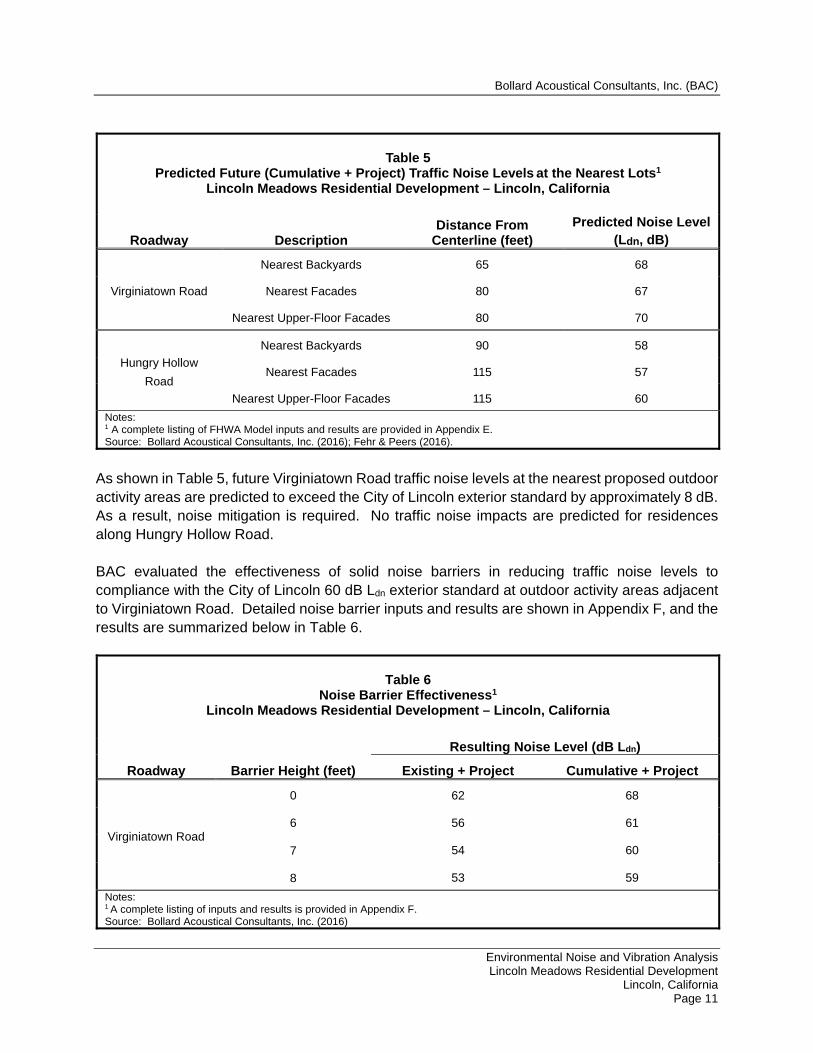
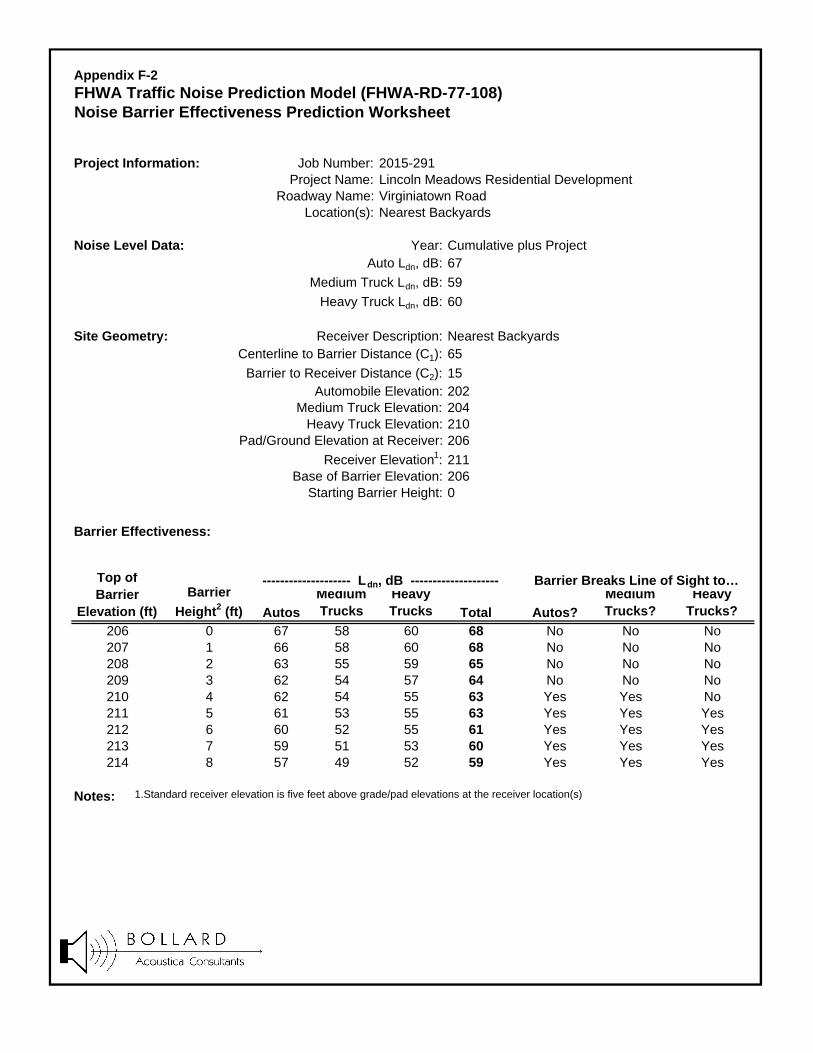
As shown in Table 5, future Virginiatown Road traffic noise levels at the nearest proposed outdoor activity areas are predicted to exceed the City of Lincoln exterior standard by approximately 8 dB. As a result, noise mitigation is required. No traffic noise impacts are predicted for residences along Hungry Hollow Road. BAC evaluated the effectiveness of solid noise barriers in reducing traffic noise levels to compliance with the City of Lincoln 60 dB Ldn exterior standard at outdoor activity areas adjacent to Virginiatown Road. Detailed noise barrier inputs and results are shown in Appendix F, and the results are summarized below in Table 6.
Table 6
Noise Barrier Effectiveness1 Lincoln Meadows Residential Development – Lincoln, California
Resulting Noise Level (dB Ldn)
Roadway Barrier Height (feet) Existing + Project Cumulative + Project
Virginiatown Road
0 62 68
6 56 61
7 54 60
8 53 59
Notes: 1 A complete listing of inputs and results is provided in Appendix F. Source: Bollard Acoustical Consultants, Inc. (2016)
Table 5
Predicted Future (Cumulative + Project) Traffic Noise Levels at the Nearest Lots1
Lincoln Meadows Residential Development – Lincoln, California
Roadway Description Distance From
Centerline (feet)
Predicted Noise Level (Ldn, dB)
Virginiatown Road
Nearest Backyards 65 68
Nearest Facades 80 67
Nearest Upper-Floor Facades 80 70
Hungry Hollow
Road
Nearest Backyards 90 58
Nearest Facades 115 57
Nearest Upper-Floor Facades 115 60
Notes: 1 A complete listing of FHWA Model inputs and results are provided in Appendix E. Source: Bollard Acoustical Consultants, Inc. (2016); Fehr & Peers (2016).
Bollard Acoustical Consultants, Inc. (BAC)
Environmental Noise and Vibration Analysis Lincoln Meadows Residential Development
Lincoln, California Page 12
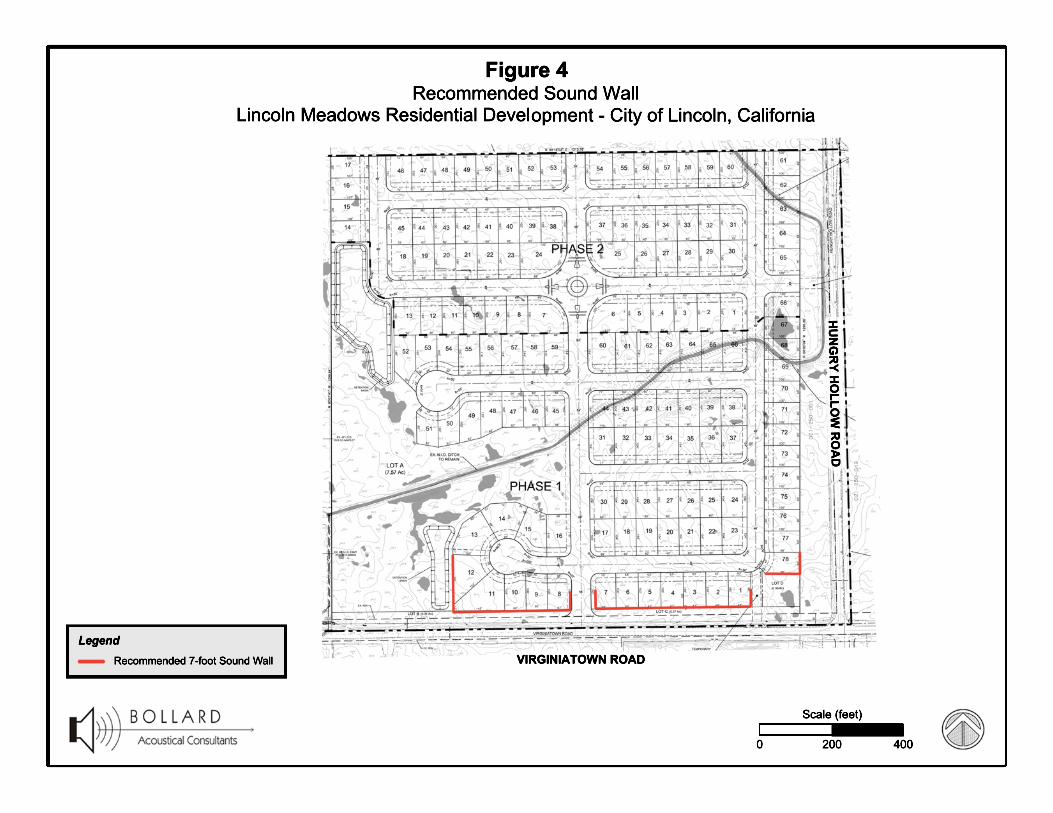
The Table 6 data indicate that a solid noise barrier of 7 feet in height relative to the residential pad elevation would be required to satisfy the City’s 60 dB Ldn exterior noise standard at nearest residences adjacent to Virginiatown Road for cumulative plus project conditions. Recommended noise barrier locations are shown in Figure 4. Predicted Future Interior Traffic Noise Levels within the Proposed Lincoln Meadows Residences After construction of the required noise barrier, future traffic noise levels at the project site are predicted to be less than 60 dB Ldn. At upper-floor locations, reduced ground absorption and lack of shielding by the required barrier would result in noise levels of up to 70 dB Ldn at upper-floor facades located along Virginiatown Road and 60 dB Ldn along Hungry Hollow Road. As a result, building facade noise reductions of up to 25 dB would be required of proposed residences to achieve compliance with the City of Lincoln 45 dB Ldn interior noise standard. Standard residential construction (wood siding, STC-27 windows, door weather-stripping, exterior wall insulation, composition plywood roof), results in an exterior to interior noise reduction of at least 25 dB with windows closed and approximately 15 dB with windows open. Therefore, standard construction would be acceptable for all residences in this development. However, to provide an additional measure of safety, BAC recommends that all upper-floor windows of residences located along Virginiatown Road with a view of the roadway be upgraded to a Sound Transmission Class (STC) rating of 32.
Bollard Acoustical Consultants, Inc. (BAC)
Environmental Noise and Vibration Analysis Lincoln Meadows Residential Development
Lincoln, California Page 14
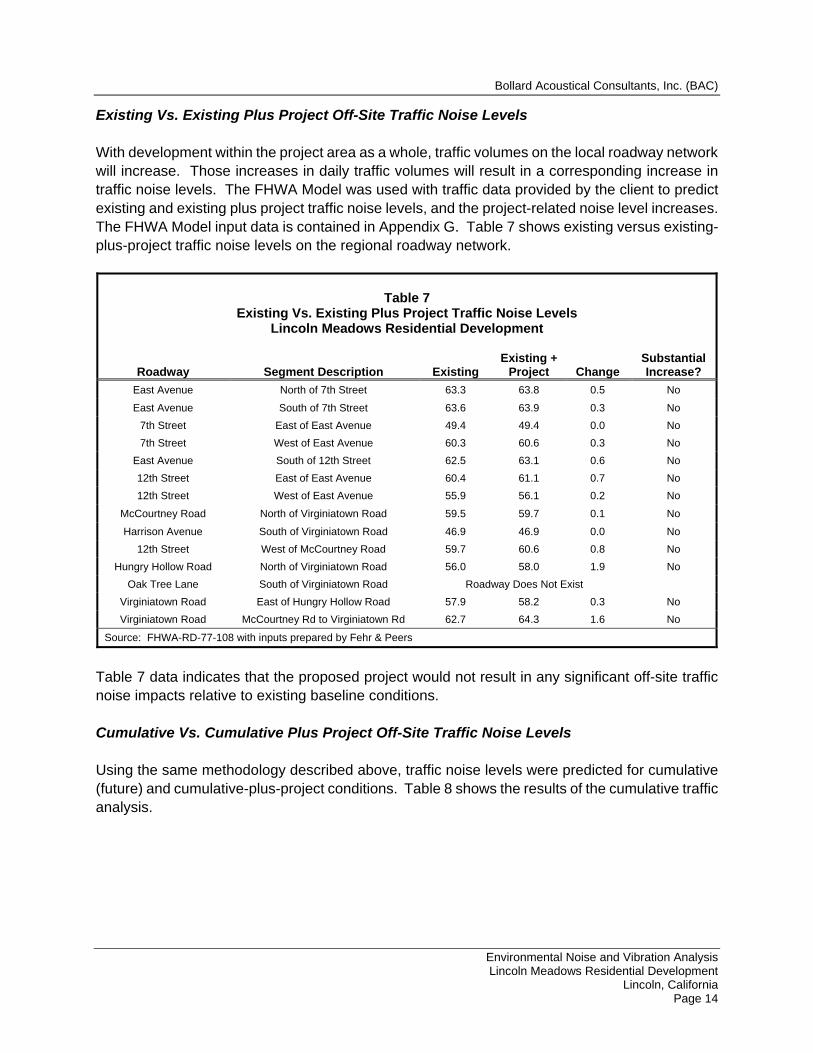
Existing Vs. Existing Plus Project Off-Site Traffic Noise Levels With development within the project area as a whole, traffic volumes on the local roadway network will increase. Those increases in daily traffic volumes will result in a corresponding increase in traffic noise levels. The FHWA Model was used with traffic data provided by the client to predict existing and existing plus project traffic noise levels, and the project-related noise level increases. The FHWA Model input data is contained in Appendix G. Table 7 shows existing versus existing-plus-project traffic noise levels on the regional roadway network.
Table 7
Existing Vs. Existing Plus Project Traffic Noise Levels Lincoln Meadows Residential Development
Roadway Segment Description Existing Existing +
Project Change Substantial Increase?
East Avenue North of 7th Street 63.3 63.8 0.5 No
East Avenue South of 7th Street 63.6 63.9 0.3 No
7th Street East of East Avenue 49.4 49.4 0.0 No
7th Street West of East Avenue 60.3 60.6 0.3 No
East Avenue South of 12th Street 62.5 63.1 0.6 No
12th Street East of East Avenue 60.4 61.1 0.7 No
12th Street West of East Avenue 55.9 56.1 0.2 No
McCourtney Road North of Virginiatown Road 59.5 59.7 0.1 No
Harrison Avenue South of Virginiatown Road 46.9 46.9 0.0 No
12th Street West of McCourtney Road 59.7 60.6 0.8 No
Hungry Hollow Road North of Virginiatown Road 56.0 58.0 1.9 No
Oak Tree Lane South of Virginiatown Road Roadway Does Not Exist
Virginiatown Road East of Hungry Hollow Road 57.9 58.2 0.3 No
Virginiatown Road McCourtney Rd to Virginiatown Rd 62.7 64.3 1.6 No
Source: FHWA-RD-77-108 with inputs prepared by Fehr & Peers
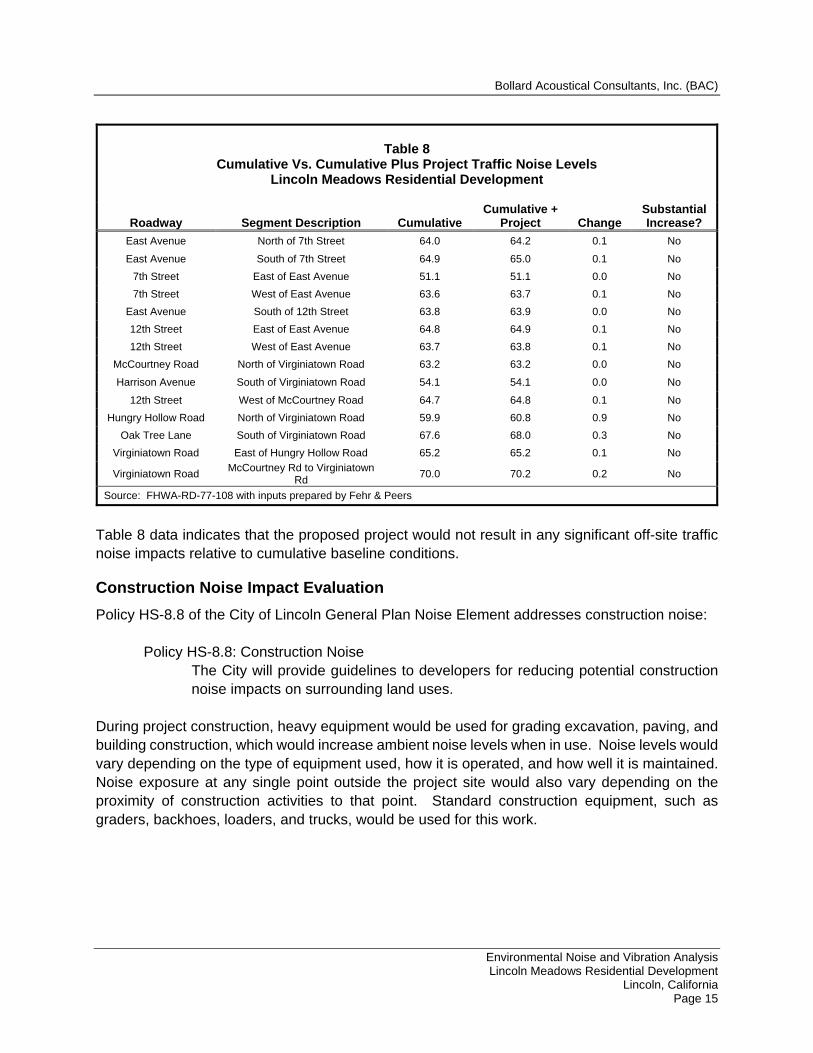
Table 7 data indicates that the proposed project would not result in any significant off-site traffic noise impacts relative to existing baseline conditions. Cumulative Vs. Cumulative Plus Project Off-Site Traffic Noise Levels Using the same methodology described above, traffic noise levels were predicted for cumulative (future) and cumulative-plus-project conditions. Table 8 shows the results of the cumulative traffic analysis.
Bollard Acoustical Consultants, Inc. (BAC)
Environmental Noise and Vibration Analysis Lincoln Meadows Residential Development
Lincoln, California Page 15
Table 8 Cumulative Vs. Cumulative Plus Project Traffic Noise Levels
Lincoln Meadows Residential Development
Roadway Segment Description Cumulative Cumulative +
Project Change Substantial Increase?
East Avenue North of 7th Street 64.0 64.2 0.1 No
East Avenue South of 7th Street 64.9 65.0 0.1 No
7th Street East of East Avenue 51.1 51.1 0.0 No
7th Street West of East Avenue 63.6 63.7 0.1 No
East Avenue South of 12th Street 63.8 63.9 0.0 No
12th Street East of East Avenue 64.8 64.9 0.1 No
12th Street West of East Avenue 63.7 63.8 0.1 No
McCourtney Road North of Virginiatown Road 63.2 63.2 0.0 No
Harrison Avenue South of Virginiatown Road 54.1 54.1 0.0 No
12th Street West of McCourtney Road 64.7 64.8 0.1 No
Hungry Hollow Road North of Virginiatown Road 59.9 60.8 0.9 No
Oak Tree Lane South of Virginiatown Road 67.6 68.0 0.3 No
Virginiatown Road East of Hungry Hollow Road 65.2 65.2 0.1 No
Virginiatown Road McCourtney Rd to Virginiatown
Rd 70.0 70.2 0.2 No
Source: FHWA-RD-77-108 with inputs prepared by Fehr & Peers
Table 8 data indicates that the proposed project would not result in any significant off-site traffic noise impacts relative to cumulative baseline conditions.
Construction Noise Impact Evaluation
Policy HS-8.8 of the City of Lincoln General Plan Noise Element addresses construction noise: Policy HS-8.8: Construction Noise
The City will provide guidelines to developers for reducing potential construction noise impacts on surrounding land uses.
During project construction, heavy equipment would be used for grading excavation, paving, and building construction, which would increase ambient noise levels when in use. Noise levels would vary depending on the type of equipment used, how it is operated, and how well it is maintained. Noise exposure at any single point outside the project site would also vary depending on the proximity of construction activities to that point. Standard construction equipment, such as graders, backhoes, loaders, and trucks, would be used for this work.
Bollard Acoustical Consultants, Inc. (BAC)
Environmental Noise and Vibration Analysis Lincoln Meadows Residential Development
Lincoln, California Page 16
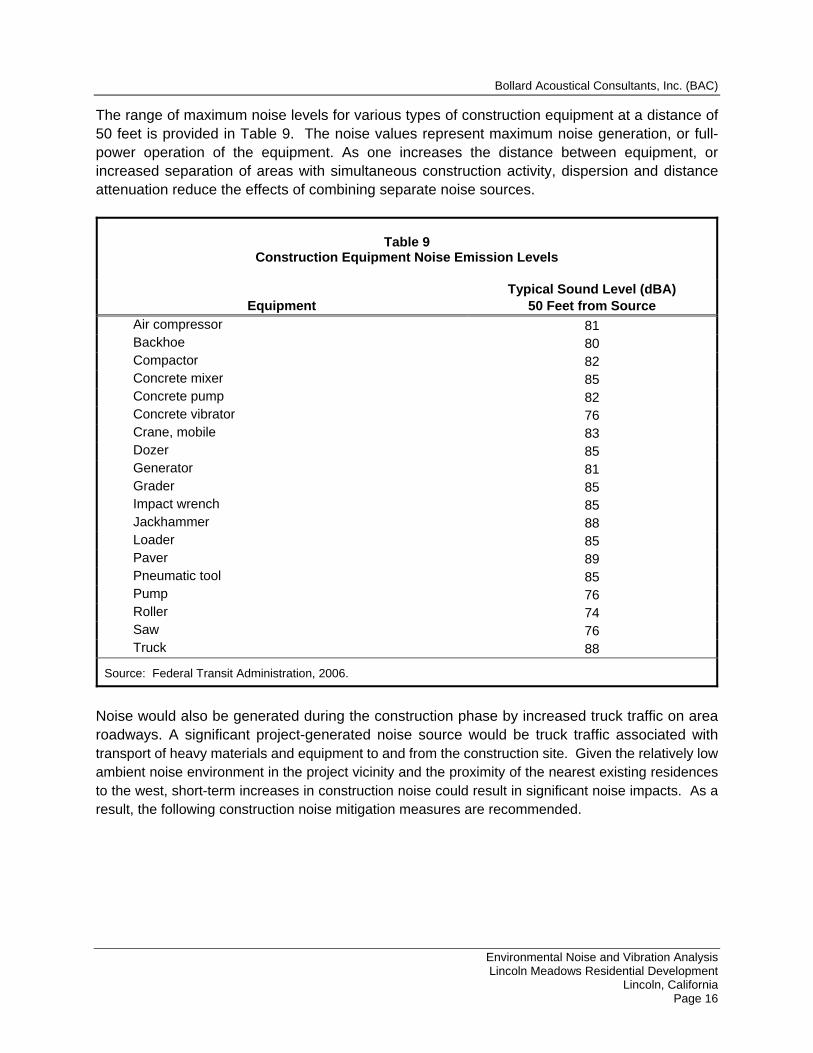
The range of maximum noise levels for various types of construction equipment at a distance of 50 feet is provided in Table 9. The noise values represent maximum noise generation, or full-power operation of the equipment. As one increases the distance between equipment, or increased separation of areas with simultaneous construction activity, dispersion and distance attenuation reduce the effects of combining separate noise sources.
Table 9
Construction Equipment Noise Emission Levels
Equipment Typical Sound Level (dBA)
50 Feet from Source Air compressor 81 Backhoe 80 Compactor 82 Concrete mixer 85 Concrete pump 82 Concrete vibrator 76 Crane, mobile 83 Dozer 85 Generator 81 Grader 85 Impact wrench 85 Jackhammer 88 Loader 85 Paver 89 Pneumatic tool 85 Pump 76 Roller 74 Saw 76 Truck 88
Source: Federal Transit Administration, 2006.
Noise would also be generated during the construction phase by increased truck traffic on area roadways. A significant project-generated noise source would be truck traffic associated with transport of heavy materials and equipment to and from the construction site. Given the relatively low ambient noise environment in the project vicinity and the proximity of the nearest existing residences to the west, short-term increases in construction noise could result in significant noise impacts. As a result, the following construction noise mitigation measures are recommended.
Bollard Acoustical Consultants, Inc. (BAC)
Environmental Noise and Vibration Analysis Lincoln Meadows Residential Development
Lincoln, California Page 17
Construction Noise Mitigation Measures
There is typically an increase in ambient noise between the hours of 7a.m. and 7p.m. in any area with traffic and development. By limiting the hours of construction to these hours, the potential for nuisance noise is reduced because project construction-related noise would be less noticeable. The use of mufflers on construction equipment would decrease the overall noise generated by construction equipment. Because sound diminishes with distance, locating noise-generating equipment away from noise sensitive uses would protect nearby residences from excessive noise levels. Notifying residents within 300 feet of construction areas would enable residents who are particularly sensitive to noise to take precautions, such as keeping windows closed. Implementation of the following noise mitigation measures would reduce the potential for adverse noise impacts on nearby residences during construction to a less-than-significant level.
a) Construction hours shall be limited to 7am to 7pm, Monday through Friday (unless
extended by special permit).
b) All internal combustion engines associated with stationary and mobile construction equipment shall have adequate mufflers equal to or better than those supplied with the equipment by the manufacturer.
c) Onsite construction staging areas shall be located as far as practical from existing
residential areas.
Vibration Impact Evaluation
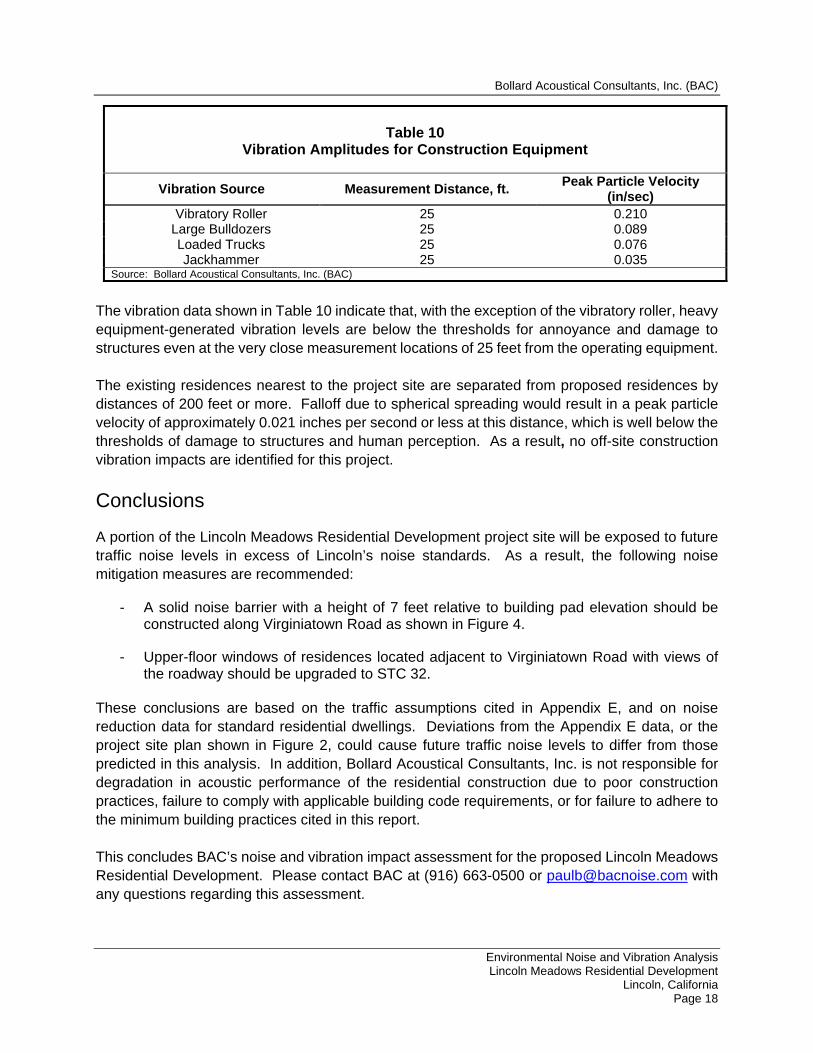
During field visits to the site, BAC staff subjectively evaluated vibration levels as being below the threshold of perception. In addition, the project would not introduce any significant sources of vibration. As a result, no long-term vibration impacts are identified due to or upon this project. However, short-term increases in vibration during construction activities would result in the immediate vicinity of heavy earthmoving equipment operations. To quantify reference vibration levels commonly generated by construction equipment, the publication, Transportation and Construction Vibration Guidance Manual (Caltrans, September 2013), was utilized. Table 18 of that publication, which is reproduced below as Table 10, contains reference peak particle velocity data for such equipment.
Bollard Acoustical Consultants, Inc. (BAC)
Environmental Noise and Vibration Analysis Lincoln Meadows Residential Development
Lincoln, California Page 18
Table 10
Vibration Amplitudes for Construction Equipment
Vibration Source Measurement Distance, ft. Peak Particle Velocity
(in/sec) Vibratory Roller 25 0.210
Large Bulldozers 25 0.089 Loaded Trucks 25 0.076 Jackhammer 25 0.035
Source: Bollard Acoustical Consultants, Inc. (BAC)
The vibration data shown in Table 10 indicate that, with the exception of the vibratory roller, heavy equipment-generated vibration levels are below the thresholds for annoyance and damage to structures even at the very close measurement locations of 25 feet from the operating equipment. The existing residences nearest to the project site are separated from proposed residences by distances of 200 feet or more. Falloff due to spherical spreading would result in a peak particle velocity of approximately 0.021 inches per second or less at this distance, which is well below the thresholds of damage to structures and human perception. As a result, no off-site construction vibration impacts are identified for this project.
Conclusions
A portion of the Lincoln Meadows Residential Development project site will be exposed to future traffic noise levels in excess of Lincoln’s noise standards. As a result, the following noise mitigation measures are recommended:
- A solid noise barrier with a height of 7 feet relative to building pad elevation should be constructed along Virginiatown Road as shown in Figure 4.
- Upper-floor windows of residences located adjacent to Virginiatown Road with views of the roadway should be upgraded to STC 32.
These conclusions are based on the traffic assumptions cited in Appendix E, and on noise reduction data for standard residential dwellings. Deviations from the Appendix E data, or the project site plan shown in Figure 2, could cause future traffic noise levels to differ from those predicted in this analysis. In addition, Bollard Acoustical Consultants, Inc. is not responsible for degradation in acoustic performance of the residential construction due to poor construction practices, failure to comply with applicable building code requirements, or for failure to adhere to the minimum building practices cited in this report. This concludes BAC’s noise and vibration impact assessment for the proposed Lincoln Meadows Residential Development. Please contact BAC at (916) 663-0500 or [email protected] with any questions regarding this assessment.
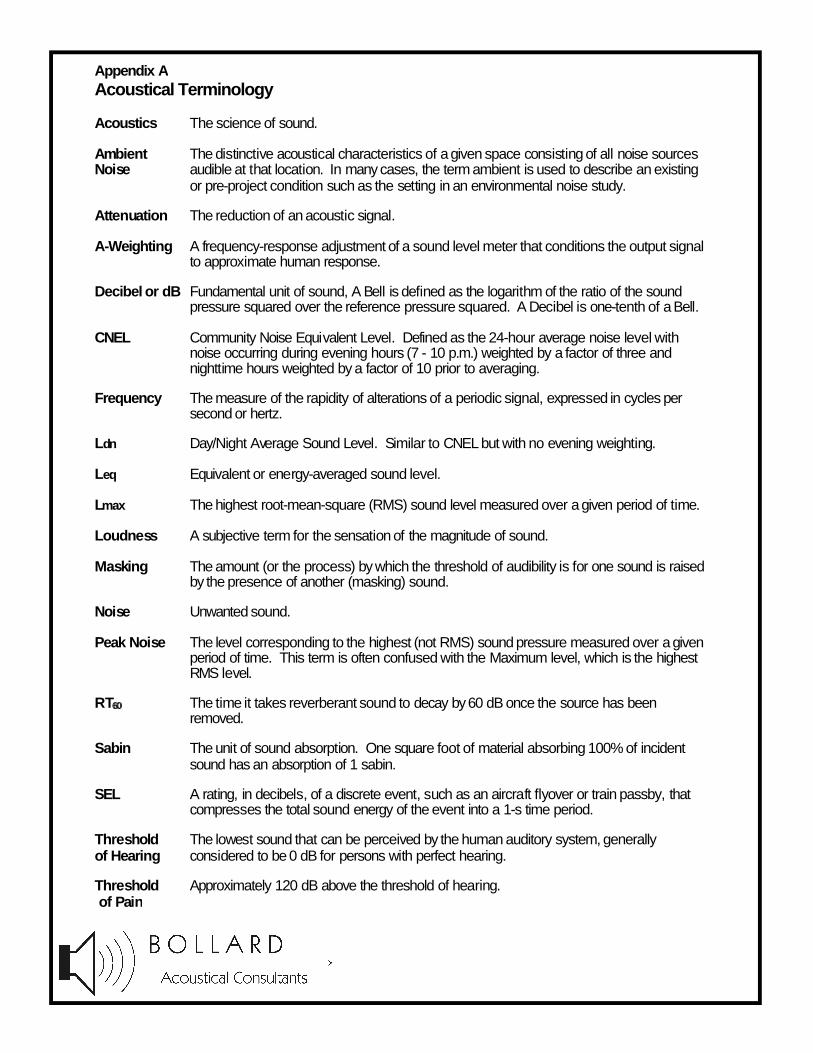
Appendix AAcoustical Terminology
Acoustics The science of sound.
Ambient The distinctive acoustical characteristics of a given space consisting of all noise sources Noise audible at that location. In many cases, the term ambient is used to describe an existing
or pre-project condition such as the setting in an environmental noise study.
Attenuation The reduction of an acoustic signal.
A-Weighting A frequency-response adjustment of a sound level meter that conditions the output signalto approximate human response.
Decibel or dB Fundamental unit of sound, A Bell is defined as the logarithm of the ratio of the soundpressure squared over the reference pressure squared. A Decibel is one-tenth of a Bell.
CNEL Community Noise Equivalent Level. Defined as the 24-hour average noise level withnoise occurring during evening hours (7 - 10 p.m.) weighted by a factor of three andnighttime hours weighted by a factor of 10 prior to averaging.
Frequency The measure of the rapidity of alterations of a periodic signal, expressed in cycles persecond or hertz.
Ldn Day/Night Average Sound Level. Similar to CNEL but with no evening weighting.
Leq Equivalent or energy-averaged sound level.
Lmax The highest root-mean-square (RMS) sound level measured over a given period of time.
Loudness A subjective term for the sensation of the magnitude of sound.
Masking The amount (or the process) by which the threshold of audibility is for one sound is raisedby the presence of another (masking) sound.
Noise Unwanted sound.
Peak Noise The level corresponding to the highest (not RMS) sound pressure measured over a givenperiod of time. This term is often confused with the Maximum level, which is the highestRMS level.
RT6060 The time it takes reverberant sound to decay by 60 dB once the source has beenremoved.
Sabin The unit of sound absorption. One square foot of material absorbing 100% of incidentsound has an absorption of 1 sabin.
SEL A rating, in decibels, of a discrete event, such as an aircraft flyover or train passby, that compresses the total sound energy of the event into a 1-s time period.
Threshold The lowest sound that can be perceived by the human auditory system, generally of Hearing considered to be 0 dB for persons with perfect hearing.
Threshold Approximately 120 dB above the threshold of hearing. of Pain
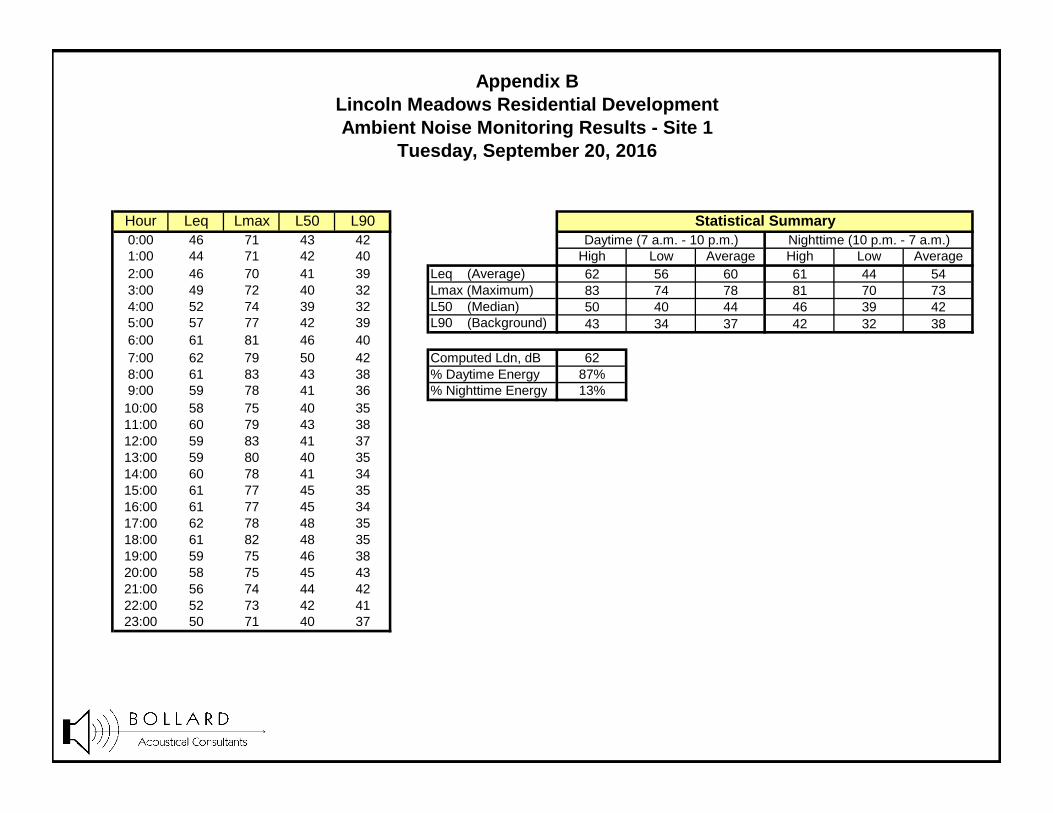
Hour Leq Lmax L50 L900:00 46 71 43 421:00 44 71 42 40 High Low Average High Low Average2:00 46 70 41 39 Leq (Average) 62 56 60 61 44 543:00 49 72 40 32 Lmax (Maximum) 83 74 78 81 70 734:00 52 74 39 32 L50 (Median) 50 40 44 46 39 425:00 57 77 42 39 L90 (Background) 43 34 37 42 32 386:00 61 81 46 407:00 62 79 50 42 Computed Ldn, dB 628:00 61 83 43 38 % Daytime Energy 87%9:00 59 78 41 36 % Nighttime Energy 13%10:00 58 75 40 3511:00 60 79 43 3812:00 59 83 41 3713:00 59 80 40 3514:00 60 78 41 3415:00 61 77 45 3516:00 61 77 45 3417:00 62 78 48 3518:00 61 82 48 3519:00 59 75 46 3820:00 58 75 45 4321:00 56 74 44 4222:00 52 73 42 4123:00 50 71 40 37
Nighttime (10 p.m. - 7 a.m.)Daytime (7 a.m. - 10 p.m.)
Appendix BLincoln Meadows Residential DevelopmentAmbient Noise Monitoring Results - Site 1
Tuesday, September 20, 2016
Statistical Summary
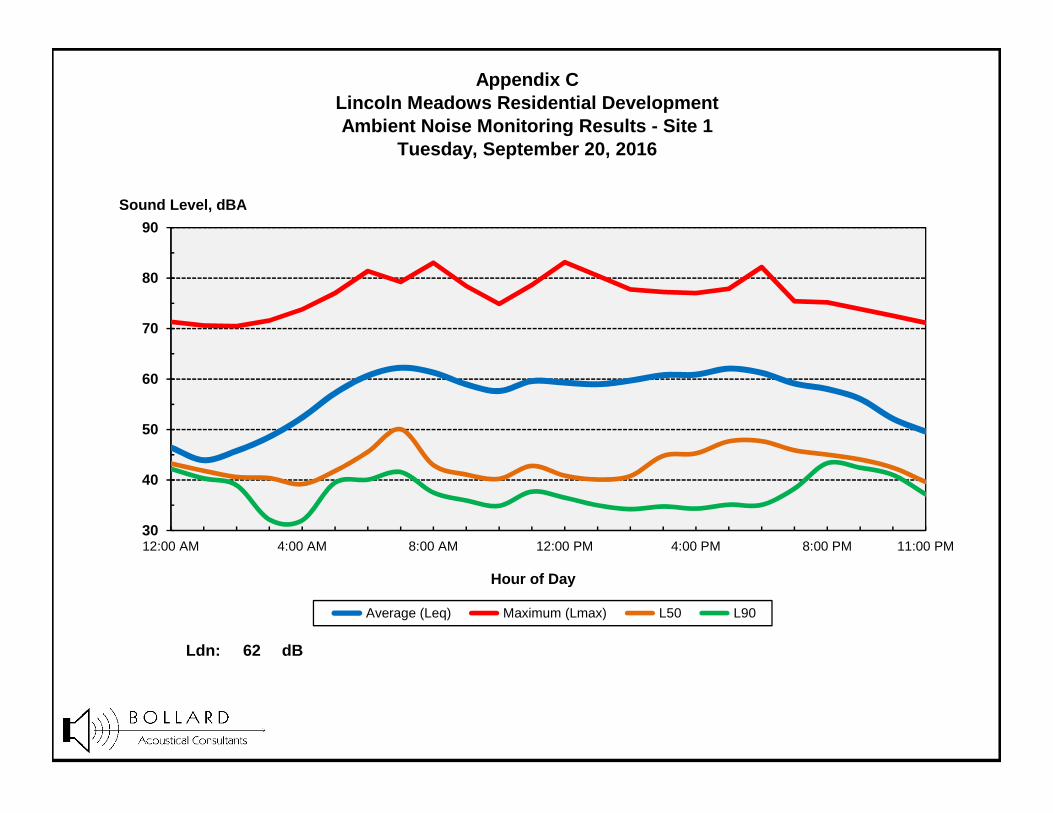
Ldn: 62 dB
Lincoln Meadows Residential DevelopmentAmbient Noise Monitoring Results - Site 1
Tuesday, September 20, 2016
Appendix C
30
40
50
60
70
80
90
12:00 AM 4:00 AM 8:00 AM 12:00 PM 4:00 PM 8:00 PM 11:00 PM
Sound Level, dBA
Hour of Day
Average (Leq) Maximum (Lmax) L50 L90
Job Number: Project Name:
Roadway Tested:Test Location:
Test Date:
Temperature (Fahrenheit):Relative Humidity:
Wind Speed and Direction:Cloud Cover:
Sound Level Meter:Calibrator:
Meter Calibrated:Meter Settings:
Microphone Location:Distance to Centerline (feet):
Microphone Height:Intervening Ground (Hard or Soft):Elevation Relative to Road (feet):
Pavement TypePavement Condition:
Number of Lanes:Posted Maximum Speed (mph):
Test Time:Test Duration (minutes):
Observed Number Automobiles:Observed Number Medium Trucks:
Observed Number Heavy Trucks:Observed Average Speed (mph):
Measured Average Level (Leq):
Level Predicted by FHWA Model:
Difference: 0.3 dB
Test Parameters:
Model Calibration:
43
354
Conclusions: No calibration adjustment required.
Microphone:
Roadway Condition:
Immediately before
On project site605 feet above ground
15
Sound Level Meter:
SW 6mphPartly Cloudy
Weather Conditions:
5
Appendix D
AsphaltGood
FHWA Traffic Noise Prediction Model (FHWA-RD-77-108)
12:58 PM
1
Calibration Worksheet
2015-291Lincoln Meadows Residential DevelopmentVirginiatown Road
Project Information:
December 4, 2015Site 1
6349%
59.7
LDL Model 820 (BAC #8)
245
A-weighted, slow response
LDL Model CAL200
59.4
Soft
4,70083172145
Soft
Medium HeavyLots Description Distance Offset (dB) Autos Trucks Trucks Total1 - 11 Nearest Backyards 65 0 61 53 54 631 - 11 Nearest Facades 80 0 60 51 53 611 - 11 Nearest Upper-Floor Facades 80 3 63 54 56 64
Ldn Contour, dB
75706560
Notes:
Appendix E-1
21
Virginiatown Road
Percent Heavy Trucks (3+ axle):Assumed Vehicle Speed (mph):
FHWA Traffic Noise Prediction Model (FHWA-RD-77-108) Noise Prediction Worksheet
Average Daily Traffic Volume:Percent Daytime Traffic:
Lincoln Meadows Residential Development
Existing plus Project
Project Information:
Traffic Data:
Traffic Noise Levels:
Traffic Noise Contours (No Calibration Offset):
-----------------Ldn, dB------------------
Distance from Centerline, (ft)
10
2015-291
Percent Nighttime Traffic:Percent Medium Trucks (2 axle):
Job Number:Project Name:
Roadway Name:
Year:
Future ADT obtained from the Lincoln Meadows traffic study by Fehr & Peers.
Intervening Ground Type (hard/soft):
4596
1,46083172145
Soft
Medium HeavyLots Description Distance Offset (dB) Autos Trucks Trucks Total61-78 Nearest Backyards 90 0 54 46 47 5561-78 Nearest Facades 105 0 53 45 46 5461-78 Nearest Upper-Floor Facades 105 3 56 48 49 57
Ldn Contour, dB
75706560
Notes: Future ADT obtained from the Lincoln Meadows traffic study by Fehr & Peers.
Intervening Ground Type (hard/soft):
2144
Project Information:
Traffic Data:
Traffic Noise Levels:
Traffic Noise Contours (No Calibration Offset):
-----------------Ldn, dB------------------
Distance from Centerline, (ft)
4
2015-291
Percent Nighttime Traffic:Percent Medium Trucks (2 axle):
Job Number:Project Name:
Roadway Name:
Year:
Appendix E-2
10
Hungry Hollow Road
Percent Heavy Trucks (3+ axle):Assumed Vehicle Speed (mph):
FHWA Traffic Noise Prediction Model (FHWA-RD-77-108) Noise Prediction Worksheet
Average Daily Traffic Volume:Percent Daytime Traffic:
Lincoln Meadows Residential Development
Existing plus Project
18,20083172145
Soft
Medium HeavyLots Description Distance Offset (dB) Autos Trucks Trucks Total1 - 11 Nearest Backyards 65 0 67 59 60 681 - 11 Nearest Facades 80 0 66 57 59 671 - 11 Nearest Upper-Floor Facades 80 3 69 60 62 70
Ldn Contour, dB
75706560
Notes:
Appendix E-3
51
Virginiatown Road
Percent Heavy Trucks (3+ axle):Assumed Vehicle Speed (mph):
FHWA Traffic Noise Prediction Model (FHWA-RD-77-108) Noise Prediction Worksheet
Average Daily Traffic Volume:Percent Daytime Traffic:
Lincoln Meadows Residential Development
Cumulative plus Project
Project Information:
Traffic Data:
Traffic Noise Levels:
Traffic Noise Contours (No Calibration Offset):
-----------------Ldn, dB------------------
Distance from Centerline, (ft)
24
2015-291
Percent Nighttime Traffic:Percent Medium Trucks (2 axle):
Job Number:Project Name:
Roadway Name:
Year:
Future ADT obtained from the Lincoln Meadows traffic study by Fehr & Peers.
Intervening Ground Type (hard/soft):
110238

2,80083172145
Soft
Medium HeavyLots Description Distance Offset (dB) Autos Trucks Trucks Total61-78 Nearest Backyards 90 0 57 48 50 5861-78 Nearest Facades 105 0 56 47 49 5761-78 Nearest Upper-Floor Facades 105 3 59 50 52 60
Ldn Contour, dB
75706560
Notes: Future ADT obtained from the Lincoln Meadows traffic study by Fehr & Peers.
Intervening Ground Type (hard/soft):
3268
Project Information:
Traffic Data:
Traffic Noise Levels:
Traffic Noise Contours (No Calibration Offset):
-----------------Ldn, dB------------------
Distance from Centerline, (ft)
7
2015-291
Percent Nighttime Traffic:Percent Medium Trucks (2 axle):
Job Number:Project Name:
Roadway Name:
Year:
Appendix E-4
15
Hungry Hollow Road
Percent Heavy Trucks (3+ axle):Assumed Vehicle Speed (mph):
FHWA Traffic Noise Prediction Model (FHWA-RD-77-108) Noise Prediction Worksheet
Average Daily Traffic Volume:Percent Daytime Traffic:
Lincoln Meadows Residential Development
Cumulative plus Project

61
53
54
65
15202204210206
2112060
Autos
Medium Trucks
Heavy Trucks Total Autos?
Medium Trucks?
Heavy Trucks?
0 61 52 54 62 No No No1 60 52 54 62 No No No2 57 49 54 59 No No No3 56 48 51 58 No No No4 56 48 50 58 Yes Yes No5 55 47 49 57 Yes Yes Yes6 54 46 49 56 Yes Yes Yes7 53 45 48 54 Yes Yes Yes8 51 43 46 53 Yes Yes Yes
Notes:
207208
Receiver Description:
213
206
Top of Barrier
Elevation (ft)
Barrier
Height2 (ft)
Medium Truck Elevation:Heavy Truck Elevation:
Receiver Elevation1:
214
209210211212
Barrier Breaks Line of Sight to…
Nearest BackyardsCenterline to Barrier Distance (C1):
Barrier to Receiver Distance (C2):
Pad/Ground Elevation at Receiver:
Barrier Effectiveness:
Base of Barrier Elevation:Starting Barrier Height:
Auto Ldn, dB:Existing Plus Project
Job Number:Project Name:
Automobile Elevation:
Roadway Name:
Year:
Lincoln Meadows Residential Development
Heavy Truck Ldn, dB:
Medium Truck Ldn, dB:
2015-291
Noise Barrier Effectiveness Prediction WorksheetFHWA Traffic Noise Prediction Model (FHWA-RD-77-108)Appendix F-1
-------------------- Ldn, dB --------------------
1.Standard receiver elevation is five feet above grade/pad elevations at the receiver location(s)
Project Information:
Noise Level Data:
Site Geometry:
Virginiatown RoadNearest BackyardsLocation(s):
67
59
60
65
15202204210206
2112060
Autos
Medium Trucks
Heavy Trucks Total Autos?
Medium Trucks?
Heavy Trucks?
0 67 58 60 68 No No No1 66 58 60 68 No No No2 63 55 59 65 No No No3 62 54 57 64 No No No4 62 54 55 63 Yes Yes No5 61 53 55 63 Yes Yes Yes6 60 52 55 61 Yes Yes Yes7 59 51 53 60 Yes Yes Yes8 57 49 52 59 Yes Yes Yes
Notes:
207208
Receiver Description:
213
206
Top of Barrier
Elevation (ft)
Barrier
Height2 (ft)
Medium Truck Elevation:Heavy Truck Elevation:
Receiver Elevation1:
214
209210211212
Barrier Breaks Line of Sight to…
Nearest BackyardsCenterline to Barrier Distance (C1):
Barrier to Receiver Distance (C2):
Pad/Ground Elevation at Receiver:
Barrier Effectiveness:
Base of Barrier Elevation:Starting Barrier Height:
Auto Ldn, dB:Cumulative plus Project
Job Number:Project Name:
Automobile Elevation:
Roadway Name:
Year:
Lincoln Meadows Residential Development
Heavy Truck Ldn, dB:
Medium Truck Ldn, dB:
2015-291
Noise Barrier Effectiveness Prediction WorksheetFHWA Traffic Noise Prediction Model (FHWA-RD-77-108)Appendix F-2
-------------------- Ldn, dB --------------------
1.Standard receiver elevation is five feet above grade/pad elevations at the receiver location(s)
Project Information:
Noise Level Data:
Site Geometry:
Virginiatown RoadNearest BackyardsLocation(s):
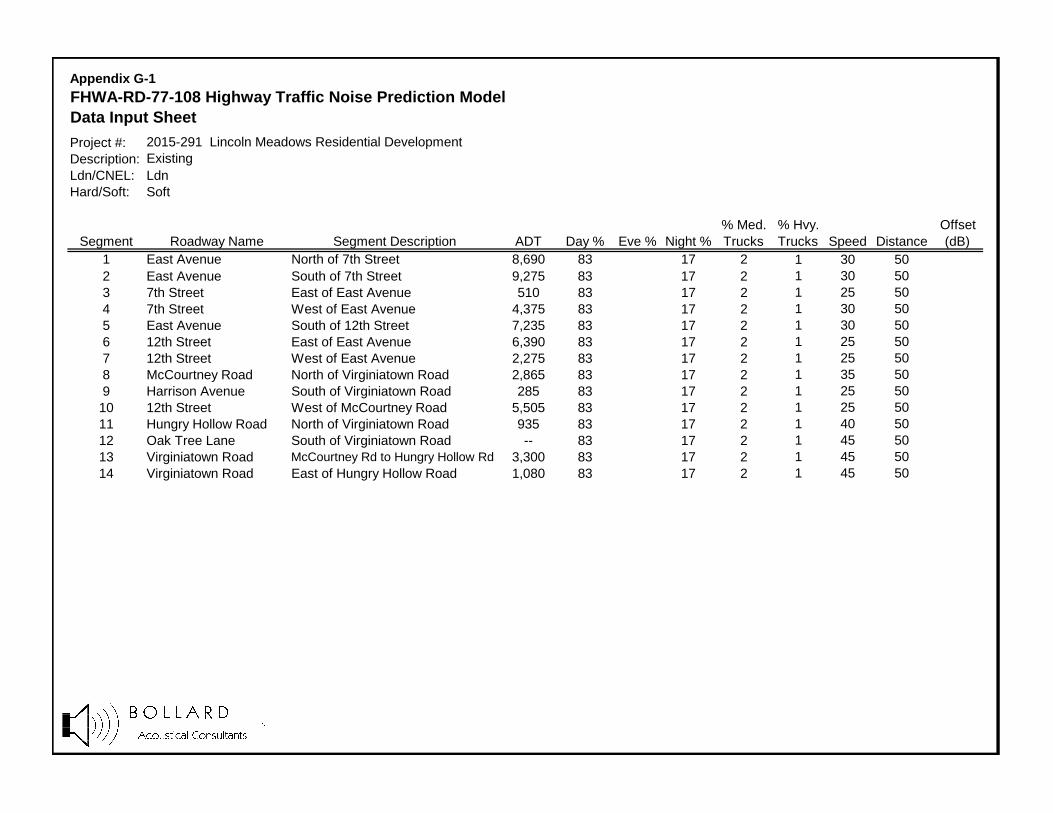
Project #:Description:Ldn/CNEL: LdnHard/Soft: Soft
% Med. % Hvy. OffsetSegment Roadway Name Segment Description ADT Day % Eve % Night % Trucks Trucks Speed Distance (dB)
1 East Avenue North of 7th Street 8,690 83 17 2 1 30 502 East Avenue South of 7th Street 9,275 83 17 2 1 30 503 7th Street East of East Avenue 510 83 17 2 1 25 504 7th Street West of East Avenue 4,375 83 17 2 1 30 505 East Avenue South of 12th Street 7,235 83 17 2 1 30 506 12th Street East of East Avenue 6,390 83 17 2 1 25 507 12th Street West of East Avenue 2,275 83 17 2 1 25 508 McCourtney Road North of Virginiatown Road 2,865 83 17 2 1 35 509 Harrison Avenue South of Virginiatown Road 285 83 17 2 1 25 5010 12th Street West of McCourtney Road 5,505 83 17 2 1 25 5011 Hungry Hollow Road North of Virginiatown Road 935 83 17 2 1 40 5012 Oak Tree Lane South of Virginiatown Road -- 83 17 2 1 45 5013 Virginiatown Road McCourtney Rd to Hungry Hollow Rd 3,300 83 17 2 1 45 5014 Virginiatown Road East of Hungry Hollow Road 1,080 83 17 2 1 45 50
Appendix G-1
2015-291 Lincoln Meadows Residential Development
FHWA-RD-77-108 Highway Traffic Noise Prediction Model
Existing
Data Input Sheet
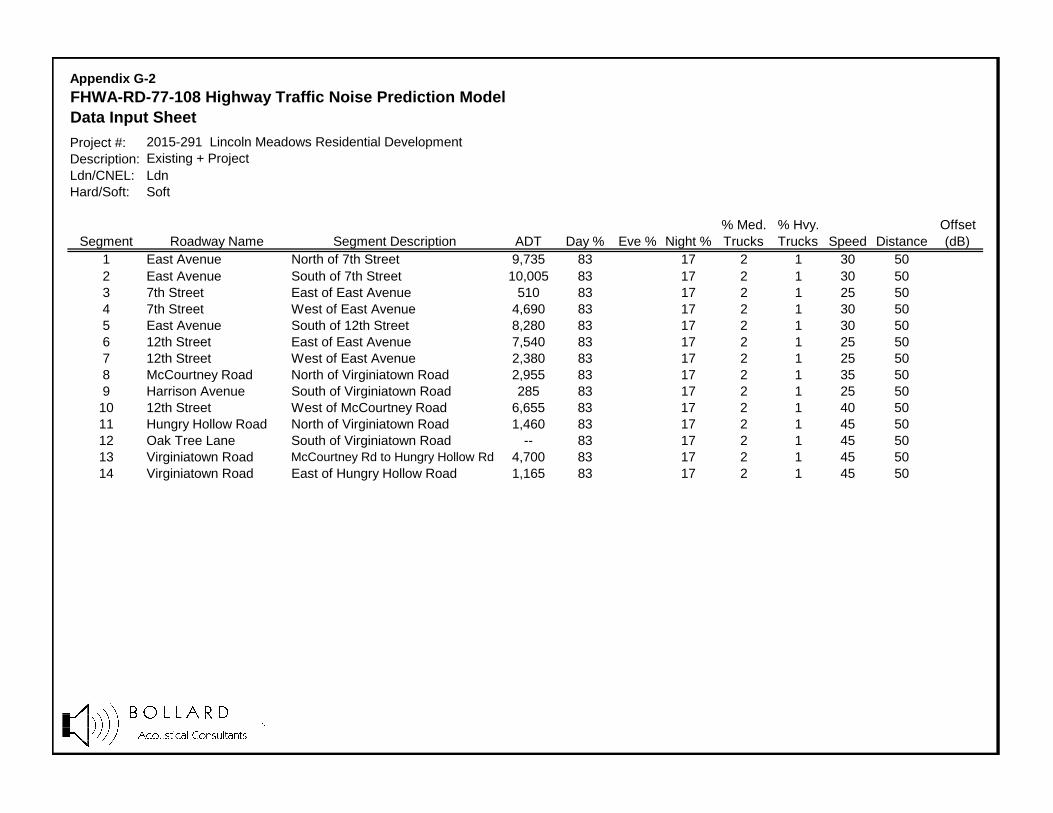
Project #:Description:Ldn/CNEL: LdnHard/Soft: Soft
% Med. % Hvy. OffsetSegment Roadway Name Segment Description ADT Day % Eve % Night % Trucks Trucks Speed Distance (dB)
1 East Avenue North of 7th Street 9,735 83 17 2 1 30 502 East Avenue South of 7th Street 10,005 83 17 2 1 30 503 7th Street East of East Avenue 510 83 17 2 1 25 504 7th Street West of East Avenue 4,690 83 17 2 1 30 505 East Avenue South of 12th Street 8,280 83 17 2 1 30 506 12th Street East of East Avenue 7,540 83 17 2 1 25 507 12th Street West of East Avenue 2,380 83 17 2 1 25 508 McCourtney Road North of Virginiatown Road 2,955 83 17 2 1 35 509 Harrison Avenue South of Virginiatown Road 285 83 17 2 1 25 5010 12th Street West of McCourtney Road 6,655 83 17 2 1 40 5011 Hungry Hollow Road North of Virginiatown Road 1,460 83 17 2 1 45 5012 Oak Tree Lane South of Virginiatown Road -- 83 17 2 1 45 5013 Virginiatown Road McCourtney Rd to Hungry Hollow Rd 4,700 83 17 2 1 45 5014 Virginiatown Road East of Hungry Hollow Road 1,165 83 17 2 1 45 50
Appendix G-2
2015-291 Lincoln Meadows Residential Development
FHWA-RD-77-108 Highway Traffic Noise Prediction Model
Existing + Project
Data Input Sheet
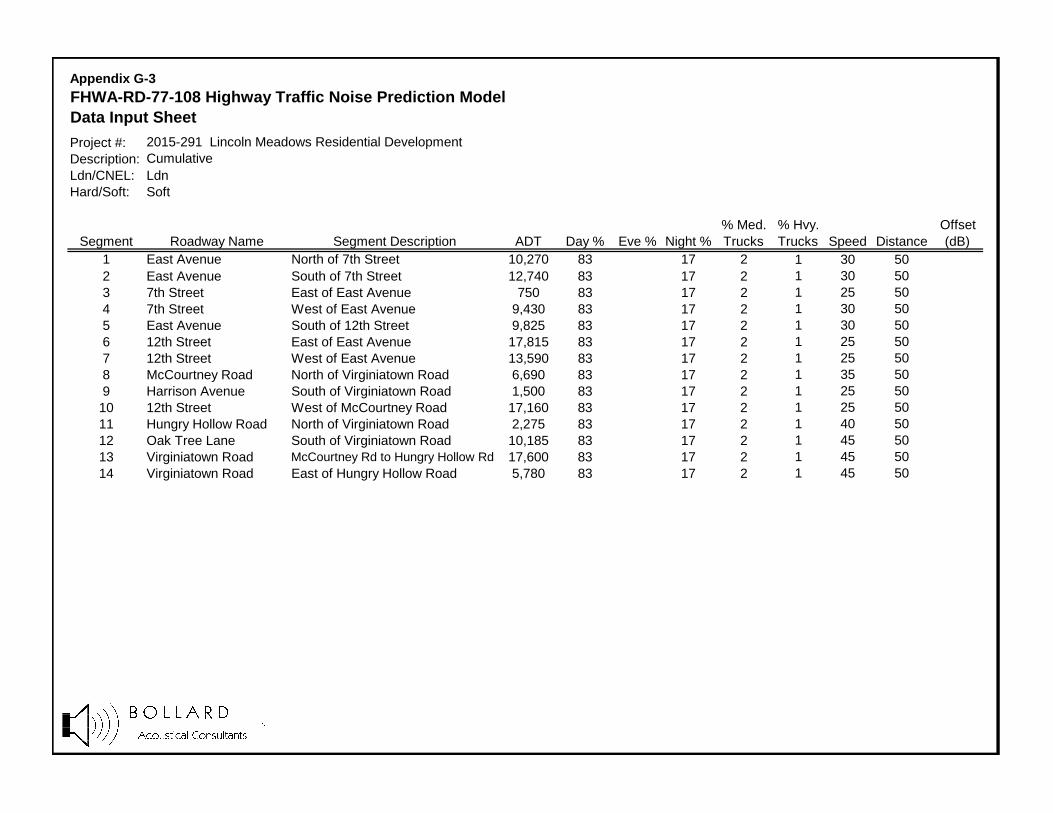
Project #:Description:Ldn/CNEL: LdnHard/Soft: Soft
% Med. % Hvy. OffsetSegment Roadway Name Segment Description ADT Day % Eve % Night % Trucks Trucks Speed Distance (dB)
1 East Avenue North of 7th Street 10,270 83 17 2 1 30 502 East Avenue South of 7th Street 12,740 83 17 2 1 30 503 7th Street East of East Avenue 750 83 17 2 1 25 504 7th Street West of East Avenue 9,430 83 17 2 1 30 505 East Avenue South of 12th Street 9,825 83 17 2 1 30 506 12th Street East of East Avenue 17,815 83 17 2 1 25 507 12th Street West of East Avenue 13,590 83 17 2 1 25 508 McCourtney Road North of Virginiatown Road 6,690 83 17 2 1 35 509 Harrison Avenue South of Virginiatown Road 1,500 83 17 2 1 25 5010 12th Street West of McCourtney Road 17,160 83 17 2 1 25 5011 Hungry Hollow Road North of Virginiatown Road 2,275 83 17 2 1 40 5012 Oak Tree Lane South of Virginiatown Road 10,185 83 17 2 1 45 5013 Virginiatown Road McCourtney Rd to Hungry Hollow Rd 17,600 83 17 2 1 45 5014 Virginiatown Road East of Hungry Hollow Road 5,780 83 17 2 1 45 50
Appendix G-3
2015-291 Lincoln Meadows Residential Development
FHWA-RD-77-108 Highway Traffic Noise Prediction Model
Cumulative
Data Input Sheet
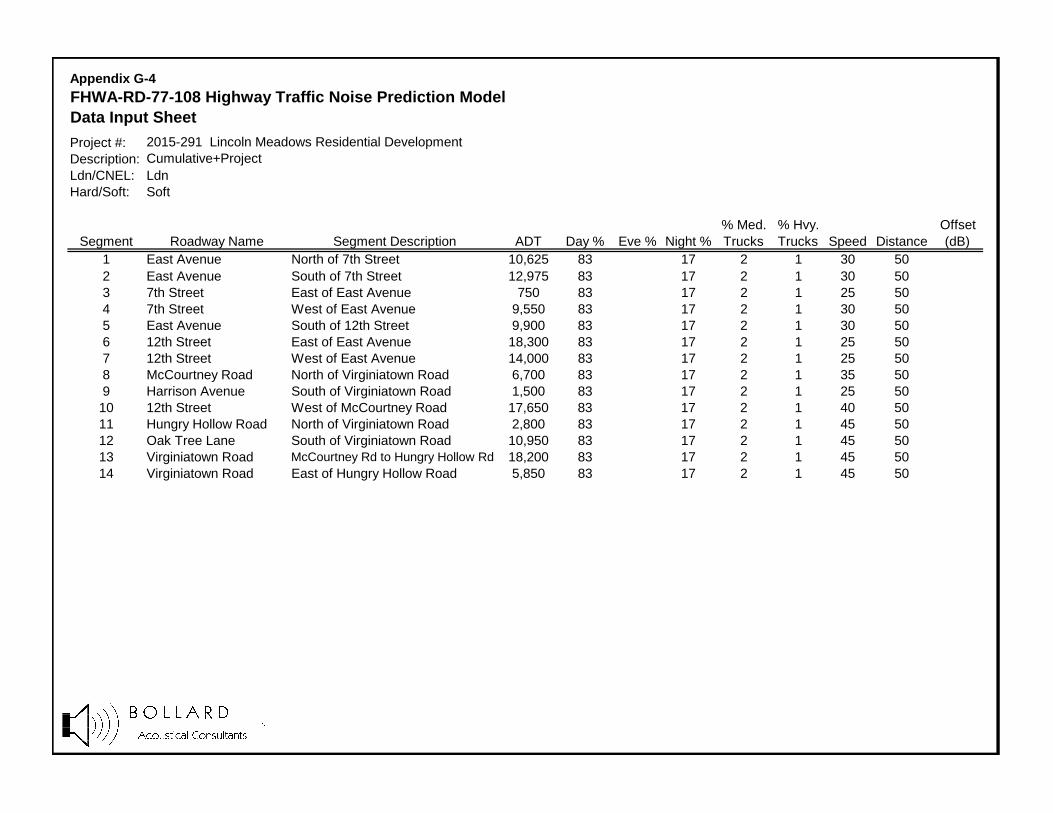
Project #:Description:Ldn/CNEL: LdnHard/Soft: Soft
% Med. % Hvy. OffsetSegment Roadway Name Segment Description ADT Day % Eve % Night % Trucks Trucks Speed Distance (dB)
1 East Avenue North of 7th Street 10,625 83 17 2 1 30 502 East Avenue South of 7th Street 12,975 83 17 2 1 30 503 7th Street East of East Avenue 750 83 17 2 1 25 504 7th Street West of East Avenue 9,550 83 17 2 1 30 505 East Avenue South of 12th Street 9,900 83 17 2 1 30 506 12th Street East of East Avenue 18,300 83 17 2 1 25 507 12th Street West of East Avenue 14,000 83 17 2 1 25 508 McCourtney Road North of Virginiatown Road 6,700 83 17 2 1 35 509 Harrison Avenue South of Virginiatown Road 1,500 83 17 2 1 25 5010 12th Street West of McCourtney Road 17,650 83 17 2 1 40 5011 Hungry Hollow Road North of Virginiatown Road 2,800 83 17 2 1 45 5012 Oak Tree Lane South of Virginiatown Road 10,950 83 17 2 1 45 5013 Virginiatown Road McCourtney Rd to Hungry Hollow Rd 18,200 83 17 2 1 45 5014 Virginiatown Road East of Hungry Hollow Road 5,850 83 17 2 1 45 50
Appendix G-4
2015-291 Lincoln Meadows Residential Development
FHWA-RD-77-108 Highway Traffic Noise Prediction Model
Cumulative+Project
Data Input Sheet