Embed Size (px)
Citation preview
International Journal of Lean Thinking Volume 3, Issue 1 (June 2012)
Lean Thinkingjournal homepage: www.thinkinglean.com/ijlt
Applicability of Value Stream Mapping (VSM) in the Apparel industry in Sri Lanka
Silva, S.K.P.N.* Assistant Lecturer
Department of Electronic and Computer Engineering, Sri Lanka Institute of Information Technology Malabe, Sri Lanka
e-mail: [email protected]
A B S T R A C T K E Y W O R D S
A R T I C L E I N F O
Lean Manufacturing , Value Stream Mapping(VSM), Apparel industry, Seven wastes, Sri Lanka.
Received 12 July 2011 Accepted 03 October 2011 Available online 01 December 2011
Lean Manufacturing can be considered as a business strategy which originated and developed in Japan. It tries to identify waste and eliminate it. Thus it leads to improvement in productivity of manufacturing and service organizations and quality of products leading to a competitive advantage over others. Sri Lankan industries, especially apparel sector have attempted to implement this, but a little research work is carried out in regarding its suitability. This research is an attempt to identify the applicability of one of the most important Lean Manufacturing tool called “Value Stream Mapping (VSM)” for the apparel industry in Sri Lanka.
As the initial stage, a literature review was carried out to study Lean Manufacturing and Value Stream Mapping (VSM). Next step was to explore how VSM can be effectively applied in Sri Lankan context. The purpose of this paper is to investigate the applicability of VSM in apparel manufacturing organizations in Sri Lanka using a case-based approach. The research was administered with one of the leading apparel manufacturers in Sri Lanka using personal interviews, secondary data and observations. The current state map was developed after making necessary observations and calculations. Then various improvement proposals had been identified based on Lean Manufacturing theories and the future state map was developed.
The findings revealed that VSM can be applied to mass production apparel industries in order to derive positive results such as reducing wastes in inventory and defects. Further, VSM helped the managers of the case company to visualize the different types of wastes generated in the organization and future possibilities of eliminating or reducing them. The findings can be extended to similar apparel organizations in the future. ________________________________ * Corresponding Author
SILVA, S.K.P.N. / International Journal of Lean Thinking Volume 3, Issue 1(June2012)
37
1. Introduction
The apparel industry faced considerable changes as a result of the removal of Multi Fiber Agreement in
2005. Delivering high quality garments at low cost in shorter lead times are the major challenges faced by
the apparel manufacturers. Most of the apparel manufacturers are trying to achieve these challenges
successfully.
In 2008, global recession badly affected almost all the apparel manufacturing industries in the world. Due
to that demand for the low cost garments are increased by the customers. Suppliers are forced to deliver
low cost garments. Because of high cost factor in Sri Lanka, most of the companies faced difficulties in
getting orders and some companies were closed down. The companies are seeking ways to minimize their
cost in order to meet the competition by other low cost countries such as China and Bangladesh and to
survive.
In order to face this global challenge, most of the local apparel manufacturers have adopted different
strategies. The recent adoption is Lean Manufacturing to achieve low cost, short lead times and improved
quality. Lean Manufacturing can be defined as "A systematic approach to identify and eliminate waste
through continuous improvement by flowing the product at the demand of the customer” (Introduction
to Lean, 2010). By eliminating waste in the processes, companies can achieve a shorter lead time, lower
cost, highest quality and can achieve a competitive advantage over the others.
2. Background of the Research Problem
“We are no longer a low cost producer of garments and low productive producer. The survival of this
industry depends on moving upmarket where the country needs to cater” said by Professor Lakdas
Fernando, Chairman, Sri Lanka Apparel Institute (Jayasuriya, 2010). In order to cater the upmarket, the
industry needs to provide high quality garments within short lead time. In order to do this, one of the
solutions is Lean Manufacturing. Since it is new to Sri Lankan apparel sector, there is not much
background knowledge of how it suits in Sri Lankan context. When implementing Lean Manufacturing,
companies have to use Lean tools and techniques introduced by “Toyota” motor company. These must be
managed and used carefully in order to prevent potential failures. In this research, the author tries to
investigate the applicability of one of the most important Lean Manufacturing tool called “Value Stream
Mapping” in Sri Lankan apparel sector.
3. Problem Statement
Based on the above explanation a broader research problem can be stated as: “How can VSM be
effectively used to improve the performance of apparel industry?”
SILVA, S.K.P.N. / International Journal of Lean Thinking Volume 3, Issue 1(June2012)
38
4. Objectives of the study
In answering the research problem, the study sought to accomplish the following research objectives.
o To examine the present level of applying VSM in apparel manufacturing organization in Sri Lanka.
o To identify and propose potential avenues for improving present level of VSM
5. Literature Review on Lean Manufacturing
5.1 What is Lean?
Lean Manufacturing can be defined as "A systematic approach to identifying and eliminating waste
through continuous improvement by flowing the product at the demand of the customer." Taiichi Ohno
once said that “Lean Manufacturing is all about looking at the time line from the moment the customer
gives us an order to the point when we collect the cash. And we are reducing that time line by removing
the non – value added wastes” (Ohno, 1988).
Lean always focuses on identifying and eliminating waste and fully utilizing the activities that add value to
the final product. From the customer point of view, value is equivalent to anything he is willing to pay for
the product or service he receives. Formally value adding activities can be defined as: activities that
transform materials and information into products and services the customer wants. On the other hand
non-value adding activities can be defined as: activities that consume resources, but do not directly
contribute to product or service. This non-value adding activities are the waste in Lean Manufacturing.
Waste can be generated due to poor layout (distance), long setup times, incapable processes, poor
maintenance practices, poor work methods, lack of training, large batches, ineffective production
planning/scheduling, lack of workplace organization etc.
By eliminating wastes in the overall process, through continuous improvements the product’s lead time
can be reduced remarkably. By reducing lead time organization can obtain operational benefits
(enhancement of productivity, reduction in work-in-process inventory, improvement in quality, reduction
of space utilization and better work place organization) as well as administrative benefits (reduction in
order processing errors, streamlining of customer service functions so that customers are no longer
placed on hold, reduction of paperwork in office areas, reduction of labor turnover)
SILVA, S.K.P.N. / International Journal of Lean Thinking Volume 3, Issue 1(June2012)
39
5.2 Wastes in Lean Manufacturing
The waste can be categorized into seven types which is commonly referred to as the “Seven wastes”.
Taiichi Ohno suggests that these account for up to 95% of all costs in non – Lean Manufacturing
environments. These wastes are:
o Overproduction – Producing more than the customer demands. There are two types of
overproduction (Shingo, 1989):
1. Quantitative – making more products than needed.
2. Early – making products before needed.
Overproduction is highly costly to a manufacturing plant because it obstructs the smooth flow of
materials and degrades the quality and productivity. Overproduction manufacturing is referred to
as “Just in Case” whereas Lean Manufacturing is referred to as “Just in Time” (McBride, 2003).
The corresponding Lean principle is to manufacture based upon a pull system, or producing
products just as customers order them. Anything produced beyond customer order ties up
valuable labor and material resources that might otherwise be used to respond to customer
demand.
Ohno considered the fundamental waste to be overproduction, since it leads to other wastes
such as overstaffing, storage, and transportation costs because of excess inventory.
o Waiting – Whenever goods are not being moving or being processed, the waste, waiting occurs.
Typically more than 99% of a product’s life cycle time in traditional mass production is spent in
idling. This includes waiting for material, labor, information, equipment etc. Lean requires that
all resources are provided on a just-in-time (JIT) basis – not too soon, not too late by linking
processes together so that one feeds directly into the next and can dramatically reduce waiting.
o Transportation or conveyance – Moving product between processes does not add value to the
product. Excessive movements and handlings can cause damages and can lead to reduction in
quality. Materials should be delivered to its point of use. Lean requires the material be shipped
directly from the vendor to the location in the assembly line where it will be used. This is called
Point-Of-Use-Storage (POUS).

SILVA, S.K.P.N. / International Journal of Lean Thinking Volume 3, Issue 1(June2012)
40
o Over processing or incorrect processing – Taking unneeded steps to process the parts. Some of
the more common examples of this are reworking, inspecting, rechecking etc. This is due to poor
layout, poor tools and poor product design, causing unnecessary motion and producing defects.
o Excess Inventory – Any type of inventory (raw material or in process or finish goods) does not
add value to the product and it should be eliminated or reduced. Excess inventory uses valuable
floor space and hides problems related to process incapabilities. Excess inventory results in
longer lead times, obsolescence, damaged goods, transportation and storage costs, and delay.
o Defects – Defects can be either production defects or service errors. Having a defect results a
tremendous cost to organizations. In most of the organizations the total cost of defects is often a
significant percentage of total manufacturing cost. Repairing of rework, replacement production
and inspection means wasteful handling time, and effort.
o Excess Motion – Any motion that employee has to perform which does not add value the product
is an unnecessary or excess motion. Unnecessary motion is caused by poor workflow, poor
layout, poor housekeeping, and inconsistent or undocumented work methods.
5.3 Lean Approach
Lean organizations are highly customer focused, providing the highest quality, lowest cost products in the
shortest lead time possible. According to the book “Lean Thinking” by James P. Womack and Daniel Jones,
the Lean approach can be summarized in five principles (Womack and Jones, 2003):
o Specify what creates value from the customer’s perspective - Value should be specified from the
customer point of view not by the perspective of individual firms, functions and departments. If
the customer does not pay for an activity, it is a non- value adding activity and should be
eliminated.
o Identify all the steps along the process chain – This means identifying the value stream. It can
be used to identify activities where value is added to the product and those do not.
o Make those processes flow – The value added product must flow continuously from the start to
finish without interruptions, detours, backflows, waiting, scrap and stoppages.

SILVA, S.K.P.N. / International Journal of Lean Thinking Volume 3, Issue 1(June2012)
41
o Make only what is pulled by the customer – The customer should pull the product from the
source as needed rather than process pushing the products onto the customer.
o Strive for perfection – After implementing above steps the team should be continuously remove
wastes as they are uncovered and pursue perfection through continuous improvement.
Lean uses practically proven tools and techniques to systematically implement these Lean principles. If
these are correctly applied, it will bring improvements to quality, cost and delivery of the final product.
Those tools help in implementing, monitoring, and evaluating Lean efforts and its results. On the other
hand if these were used without proper understanding, it can spoil Lean efforts in one’s organization.
One of very important tool is Value Stream Mapping (VSM). In the following section a brief description of
VSM is presented.
6. Literature Review on VSM
VSM is one of the most powerful Lean tools for an organization wanting to plan, implement and improve
on its Lean journey. The car manufacturer Toyota was the first company to use VSM techniques to
implement Lean concepts and tools. It is a graphical tool which is created using a predefined set of
standardized icons that helps the organization to see and understand the flow of material and information
as the product goes along different stages. After drawing the value stream it helps the organization to
differentiate value adding activities from non- value adding activities (the current condition) and identify
kaizen opportunities. The real benefit is, it gets the company away from isolated point kaizen and builds
towards a true system based on the flow of materials and information across the entire value stream (Liker
and Meier, 2007). By practicing VSM, the organization can streamline its business processes and achieve
the goal of eliminating wastes remarkably.
There are four stages of implementing the VSM technique.
1. Identify what product or family of products to be mapped.
2. Draw the current stage of the processes (current VSM).
3. Identify where the improvements can be done to eliminate waste.
4. Draw and implement the future VSM.
Benefits of VSM approach:
o Helps to see linked chain of processes and to envision future Lean value streams.
o Provides a common language and understanding so that everyone has the same vision.

SILVA, S.K.P.N. / International Journal of Lean Thinking Volume 3, Issue 1(June2012)
42
o Integrates material and information flows.
It is desirable to start the Lean journey by drawing the current VSM. Otherwise the rest of process will be
useless. This technique is usually a management lead initiative. In order to create an accurate VSM, a
company must engage their line workers in drawing the value stream.
After drawing the future VSM, an implementation plan is drawn. It can be used as a reference when
employing other Lean tools and techniques. This plan identifies each activity that requires achieving
future state, the responsible persons and the due date. The end result is usually a company with least
amount of waste with maximum productivity.
6.1 VSM Symbols
Following Table I describes the symbols used to draw the current and future state VSMs.
TABLE I. VSM SYMBOLS
(The VSM Font A tool for Value Stream Mapping in Lean Manufacturing / 6-Sigma, n.d.)
Symbol Description
Outside source
Manufacturing process data box
225 gmts
Inventory
Truck shipment
Manual information (paper schedule)
1Process lead time 2Process value added time
1 2

SILVA, S.K.P.N. / International Journal of Lean Thinking Volume 3, Issue 1(June2012)
43
6.2 Usage of VSM in Global Context
In this section author tries to explore how VSM is applied in different organizations in global context.
Hines et al. have applied VSM for the development of a supplier network of electronic, electrical and
mechanical components for a prominent distributor (Hines et al., 1999). Seth and Gupta have applied
VSM to reduce cycle time in an Indian manufacturing industrial scenario (Seth and Gupta, 2005). Lummus
et al. have done a VSM project in a small medical clinic that has resulted in lower patient wait time and
increased patient throughput thereby improving quality (Lummus et al., 2006). Seth et al. have identified
and addressed various wastes in the supply chain of the edible cotton seed oil industry in India using VSM
approach for the improvement of productivity and capacity utilization (Seth et al., 2008). Abdulmalek and
Rajgopal have presented a case where VSM and other Lean principles were adopted at a large integrated
steel mill in India (Abdulmalek and Rajgopal, 2007). Lasa et al. have proved that VSM is a suitable tool for
redesigning the production system of a plastic casing mobile phone manufacture based on a case study
(Lasa et al., 2008).
Based on the global review, it can be seen that VSM principles have been adopted across the world several
years ago. However in Sri Lankan context, most of the organizations have started implementing Lean
concepts recently.
7. Methodology
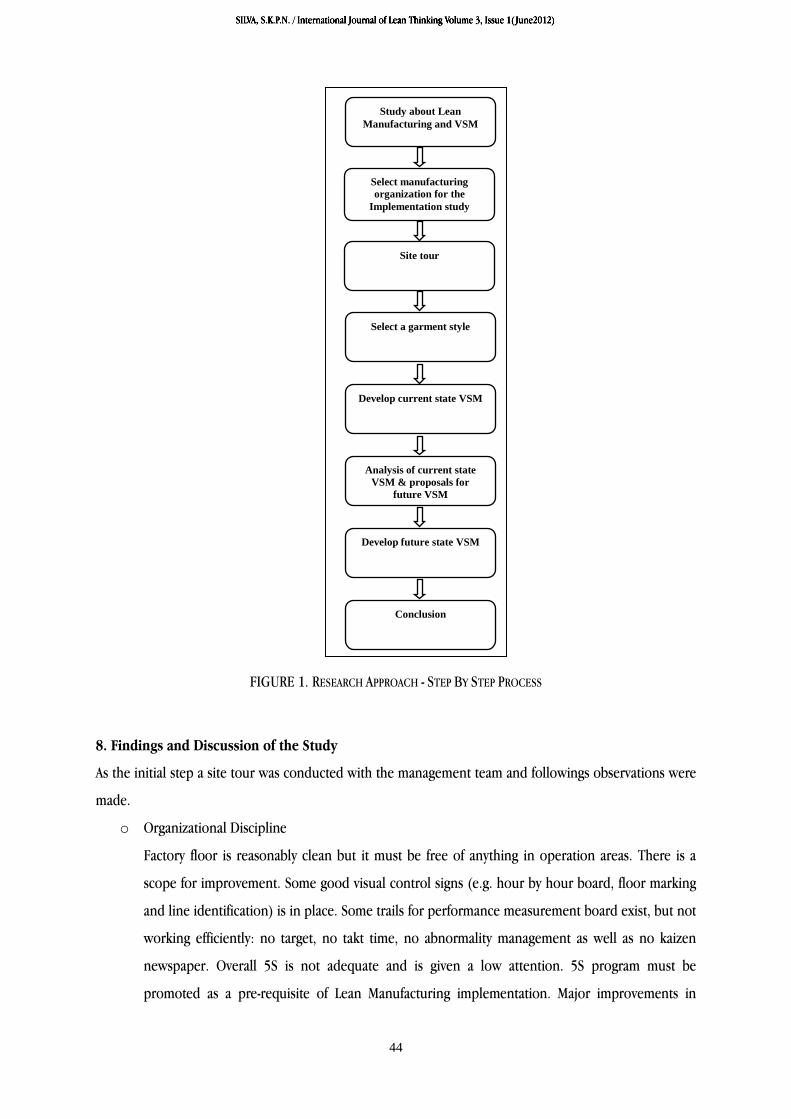
As shown in Fig. 1, a comprehensive literature review was carried out on Lean Manufacturing and VSM.
Then a well reputed apparel manufacturing organization was selected based on judgmental sampling
techniques to carry out the implementation study. As the first step site tour was conducted in order to get
a clear idea about the existing products and the overall process of the company. A garment style was then
selected to draw the current state VSM by collecting the relevant data. In order to carry out this task, a
cross-functional team with 5 executives and 11 managers were formed. There were divided into 4 groups
and were responsible for analyzing the raw material, cutting, sewing and finish goods departments’
processes. Then the current state VSM has been analyzed and various improvement proposals were
identified to reduce the non-value adding waste in the process. After that future state value stream map
was drawn. After the development of future state VSM, the conclusion was made.
SILVA, S.K.P.N. / International Journal of Lean Thinking Volume 3, Issue 1(June2012)
44
FIGURE 1. RESEARCH APPROACH - STEP BY STEP PROCESS
8. Findings and Discussion of the Study
As the initial step a site tour was conducted with the management team and followings observations were
made.
o Organizational Discipline
Factory floor is reasonably clean but it must be free of anything in operation areas. There is a
scope for improvement. Some good visual control signs (e.g. hour by hour board, floor marking
and line identification) is in place. Some trails for performance measurement board exist, but not
working efficiently: no target, no takt time, no abnormality management as well as no kaizen
newspaper. Overall 5S is not adequate and is given a low attention. 5S program must be
promoted as a pre-requisite of Lean Manufacturing implementation. Major improvements in
Study about Lean Manufacturing and VSM
Select manufacturing organization for the
Implementation study
Select a garment style
Develop current state VSM
Analysis of current state VSM & proposals for
future VSM
Conclusion
Develop future state VSM
Site tour
SILVA, S.K.P.N. / International Journal of Lean Thinking Volume 3, Issue 1(June2012)
45
visual management can be made in order to incorporate abnormality management helping to fix
daily issues and to start process of continuous improvement.
o Material flow and processing
The site’s material flow is, at places, disjointed, resulting in excess transportation, labor content
and extended lead times. There are plenty of opportunities exist to create better flow, to better
synchronize processes with reduction in WIP as well as lead time. There are many opportunities
to improve flow and to move towards pull system. Only production department has implemented
line system. Furthermore, there is no evidence of any “pacing” element in the lines to schedule
delivery or processing expectations. Improvements in this area will require TOP: Takt time
establishment, One piece flow implementation and Pull production.
o Machine utilization
No major setup time issues are observed in sewing lines. Reducing line setup time tremendously
is a future challenge, to provide more flexibility to customers’ requirements. No major machine
utilization issues are noted.
o Quality
Rework rates are very high as compared to industry standards. Abnormality management with
quick response time must be implemented first to reduce this rework level. Improvement on
supplier quality level is also a dramatic concern in garment industry. Quality provided at final
customer level is good but this quality is produced at very high cost.
o Sewing
There is always a challenge to run “One piece flow” instead of batch with imbalanced operations.
One piece flow will generate new opportunities for improvement. Current “Hour by hour chart”
does not demonstrate the initiatives on abnormality management to solve day to day, hour by
hour problems. Thus line management including line supervisor and production executive needs
to play the role of Lean leaders and prevent abnormal from becoming normal.
o Visual Management
There is no evidence of visual control and visual management throughout the whole system.
Visual management has to be improved to see abnormalities easily in both production area and
warehouses. 5S is the first basic step of making system more visual and it is below normal in
SILVA, S.K.P.N. / International Journal of Lean Thinking Volume 3, Issue 1(June2012)
46
warehouse areas as well as cutting and numbering. SQCD (Safety, Quality, Cost, and Delivery)
boards with adequate performance measurement, abnormality management with quick response
time as well as Kaizen newspapers must be in place. Quick response time to problem solving is a
key success factor for employee’s motivation in Lean environment. This is a key factor to sustain
result successfully and to move to the next steps.
o Inventory
RM - First, 5S is to be implemented at raw material, cutting and numbering departments. Both
inventory and lead time reduction must be managed in parallel. Better control of inventory level
will be achieved by introducing Pull system for repetitive parts. Poor quality and long lead time
for incoming fabric is always a huge issue for garment industry. Negotiations must be done with
the suppliers of fabric in near future.
WIP- Creating better flow by implementing TOP strategy will help the organization to reduce WIP
as well as manufacturing lead time. Creating one piece flow will be also very helpful in fixing
some Quality issues. This will in turn reduce WIP.
FG – By reducing manufacturing lead time, it will automatically reduce unnecessary finish goods
inventory. Reduction in overall inventory will generate very significant additional cash flow
savings for the organization.
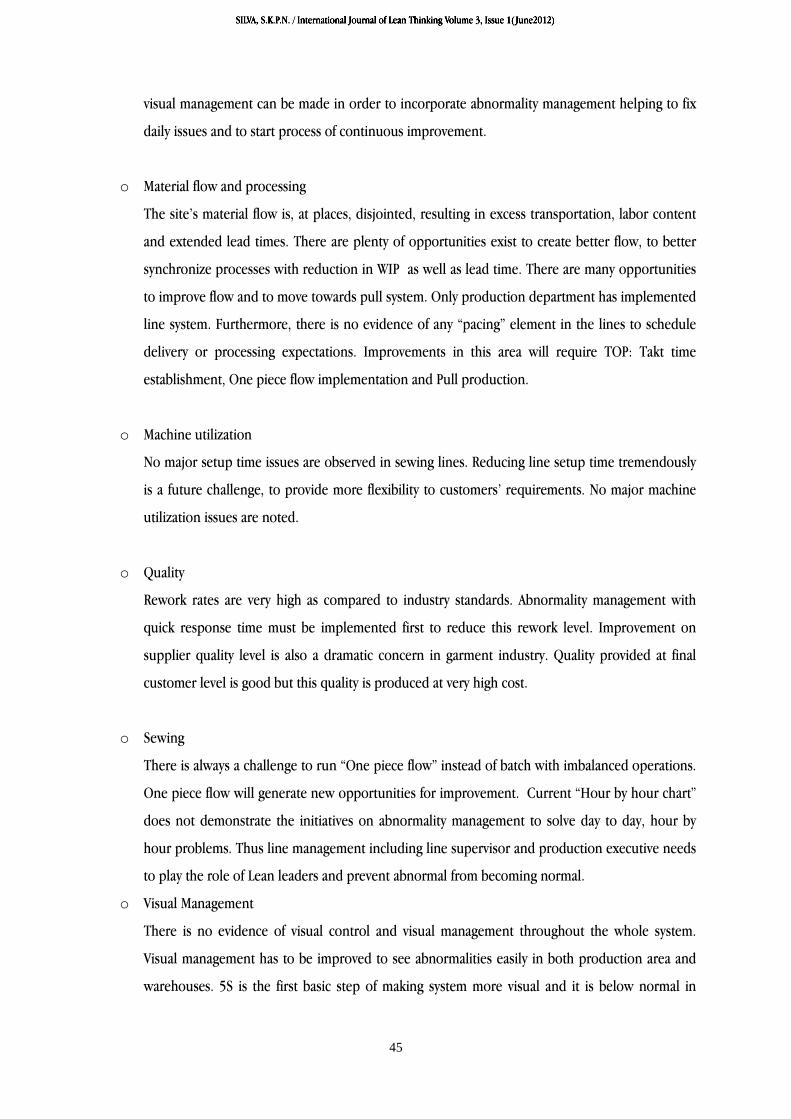
Next current state VSM was drawn for a selected style # 6561 (Fig. 2) according to the standard notations
depicted in Table I. The reason behind the selection of this style is that it has many components which
ensure it goes through all the processes in the organization. A total of 63 processes were involved in
manufacturing the selected style. An assessment of the current state VSM (Fig. 2) demonstrated that out of
63 processes only 11 processes were value adding processes. All other activities involved either
inspection, or stock keeping, or transportation. After that lead time, value added time, takt time and value
adding ratio was calculated based on the current VSM. (Table II)

SILVA, S.K.P.N. / International Journal of Lean Thinking Volume 3, Issue 1(June2012)
47
TABLE II. CALCULATION OF TIME PARAMETERS
Section Minutes
Lead time
RM stores 16,838
Cutting 3055
Sewing 129
Washing 165
FG Stores 3729
Total 23,916
Value-added time 20.93 minutes
Value-added ratio 0.087 %
Take time 0.652 min/ gmt
Source: Based on researcher’s observations and participants insights
SILVA, S.K.P.N. / International Journal of Lean Thinking Volume 3, Issue 1(June2012)
48

SILVA, S.K.P.N. / International Journal of Lean Thinking Volume 3, Issue 1(June2012)
49

SILVA, S.K.P.N. / International Journal of Lean Thinking Volume 3, Issue 1(June2012)
50

SILVA, S.K.P.N. / International Journal of Lean Thinking Volume 3, Issue 1(June2012)
51
FIGURE 2. CURRENT STATE VSM

SILVA, S.K.P.N. / International Journal of Lean Thinking Volume 3, Issue 1(June2012)
37
Source: Based on researcher’s observations and participants insights
Looking at the current state map several common causes were identified: (a) large inventories, (b) the
difference between the total production lead-time (23,916 minutes) and the value added time (20.93
minutes), which is under 1% of the total, and (c) each process producing to its own schedule. In order to
reduce the waste and improve the value adding portion following main opportunities were identified
(Table III).
TABLE III. OPPORTUNITIES IDENTIFIED
Waste Type Opportunity
Transportation o Re-layout of Washing and Drying processes
o Relocate panel inspection section inside the cutting department
Excess inventory
o Reduce embroidery and printing lot size
- Reduce embellishment by giving accurate figures to suppliers.
- Coordinate with embroidery/printing plants and reduce their inventory up to
2 days
o Start One piece flow manufacturing in Sewing department
o Arrange shipment weekly basic to reduce to finish good inventory
o Reduce fabric inventory by having proper fabric in date
Excess motion
o Establish proper scheduling for ratio packing
o Use of folding boards & tools to reduce folding & packing time
o Analyze measuring process and measure only high risk area
o Style wise locate the fabric in stores
Waiting
o Get down the fabric 7 – 10 day before PCD
o Eliminate/ reduce relaxing time of fabric in the cutting department
o Establish an electronic indication method for mechanic support
Overproduction o Cut only next day sewing requirement
o Establish a visual link between cutting and production departments
Over processing
o Eliminate/reduce numbering process
o Eliminate repacking
o Reduce 100% panel inspection
o Reduce no of quality checking points by implementing self checking process by
the sewing machine operators (quality at the needle point)

SILVA, S.K.P.N. / International Journal of Lean Thinking Volume 3, Issue 1(June2012)
38
Defects
o Reduce Fabric Inspection Time
- Get testing reports from fabric suppliers
- Need batch wise test reports from supplier
- Get 100% shrinkage report from supplier
- Supply good quality fabric and trims to reduce inspection lead time.
- Send a person to the fabric mill to inspect fabric before in-house.
o Reject & return fabric to the supplier whenever the fabric fails as per the point
system
o Get the confirmation of fabric width from the supplier
Source: Based on researcher’s observations and participants insights
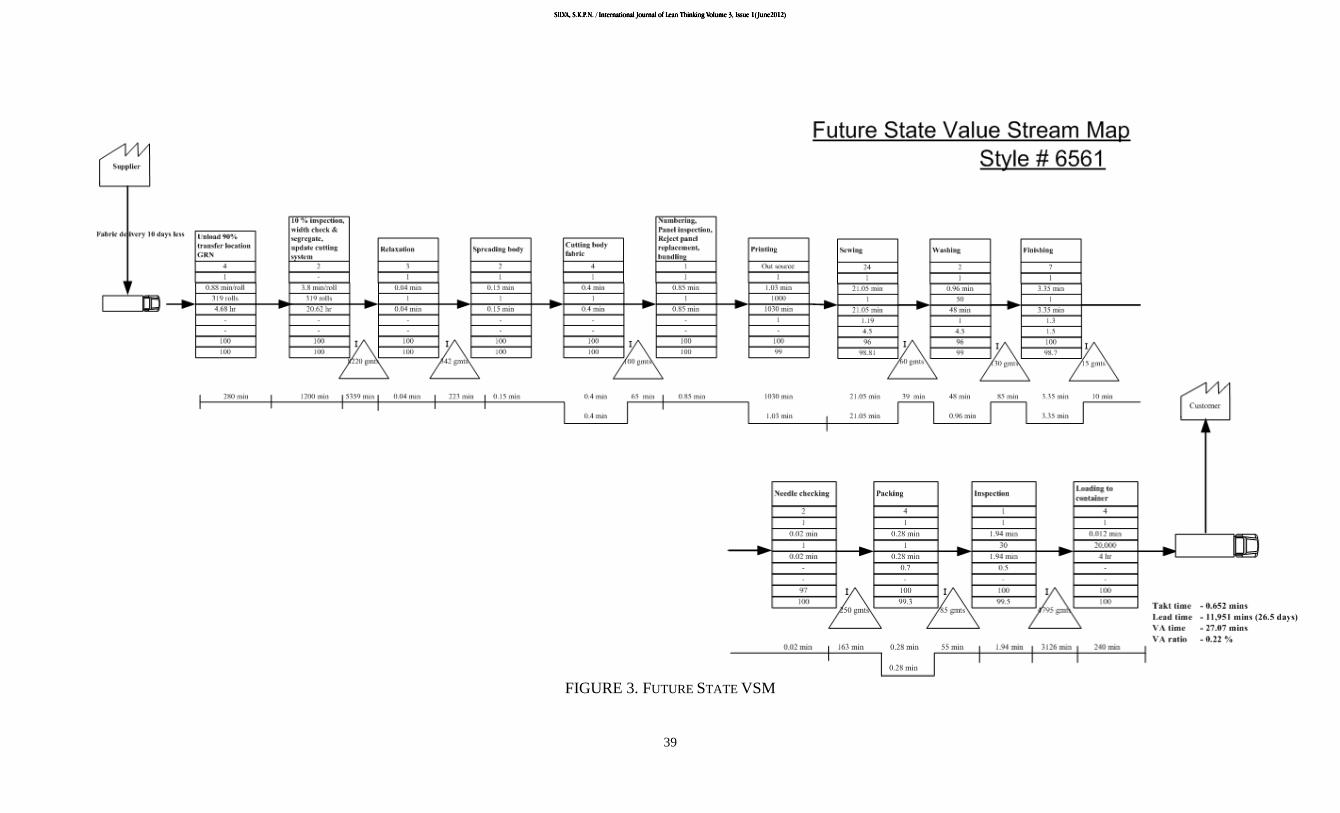
Then future state VSM is drawn (Fig. 3) by progressive elimination of waste in the processes. It applies a
pull inventory control system in contrast to the previous system shown in Fig. 2. Here the lead time has
been reduced remarkbely from 23,916 to 11,951 minutes. Therfore the value added ratio has incresed
from 0.087 % - 0.22 %. Also there is reduction in work-in-progress (WIP) inventory.
SILVA, S.K.P.N. / International Journal of Lean Thinking Volume 3, Issue 1(June2012)
39
FIGURE 3. FUTURE STATE VSM

SILVA, S.K.P.N. / International Journal of Lean Thinking Volume 3, Issue 1(June2012)
40
Source: Based on researcher’s observations and participants insights
9. Conclusion and Recommendation
Modern managers find it difficult to identify the key areas and practices, which can be used to eliminate
waste in their processes. Based on the practical validation conducted, it can be seen that VSM can be
effectively applied to apparel industry as the initial step of waste identification. Using this tool, it is
possible to map the current status and subsequently analyze to achieve waste elimination.
The case study presented in this paper, has shown that the wastes such as transport, inventory and defects
can be reduced which in turn improves the productivity of the organization. In order to accomplish this
task, the managers of the case company have to implement approaches like 5S, One piece flow, Cellular
manufacturing etc. Thus, VSM helps the managers to visualize the present level of wastes occurring in the
organization and the future possibilities of reducing or eliminating them. In order to continuously reduce
or eliminate waste, management of companies need to apply different Lean tools and techniques
accordingly while giving adequate training to their employees.
Therefore organizations of similar type can use the research outcomes as a knowledge base to identify
their wastes and come up with suitable remedies. Findings of this research can be valuable to other
organizations of Sri Lanka, which hope to implement Lean Manufacturing in the near future.
10. Limitations and Further Research
The study has been conducted for a selected garment style in an organization in the apparel sector in Sri
Lanka. In future, researchers can deploy VSM for different styles, for several organizations across the
apparel industry. It is also possible to examine the waste elimination level / improvement level over time
during different periods since present study has taken into observations one single time slot. (E.g.
observing waste elimination over several discrete time periods and variation)

SILVA, S.K.P.N. / International Journal of Lean Thinking Volume 3, Issue 1(June2012)
41
References
1. Abdulmalek, F.A. and Rajgopal, J. (2007). Analyzing the benefits of Lean Manufacturing and Value
Stream Mapping via simulation: a process sector case study, International Journal of Production
Economics, Vol. 107, pp. 223-36.
2. Hines, P., Rich, N. and Esain, A. (1999). Value stream mapping – a distribution industry
application, Benchmarking International Journal, Vol. 6 No. 1, pp. 60-77.
3. Introduction to Lean (n.d.). Available from: http://www.mamtc.com/lean/intro_intro.asp (Accessed
10 May 2010)
4. Jayasuriya, S. Discussions between the Government and the EU on GSP+ underway: Apparel
industry must move upmarket. Available from: http://www.dailynews.lk/2010/05/20/bus01.asp
(Accessed 29 April 2011)
5. Lasa, I.S., Laburu, C.O. and Vila, R.C. (2008). An evaluation of the Value Stream Mapping tool,
Business Process Management, Vol. 14 No. 1, pp. 39-52.
6. Liker, J.K. and Meier, D. (2007). The Toyota Way, Field Book, Tata McGraw-Hill Edition, New Delhi,
pp. 41.
7. Lummus, R.R., Vokurka, J. and Rodeghiero, B. (2006). Improving quality through Value
Stream Mapping: a case study of a physician’s clinic, Total Quality Management, Vol. 17 No. 8, pp.
1063-75.
8. McBride, D. The 7 Manufacturing Wastes. Available from:
http://www.emsstrategies.com/dm090203article2.html (Accessed 05 May 2010)
9. Ohno, T. (1988). Toyota Production System, Productivity Press, New York, pp. ix
10. Seth, D. and Gupta, V. (2005). Application of Value Stream Mapping for Lean operations and cycle
time reduction: an Indian case study, Production Planning & Control, Vol. 16 No. 1, pp. 44-59.
11. Seth, D., Seth, N. and Goel, D. (2008). Application of Value Stream Mapping for minimization of
wastes in the processing side of supply chain of cotton seed oil industry in Indian context, Journal of
Manufacturing Technology and Management, Vol. 16 No. 4, pp. 529-50.
12. Shingo, S. (1989). A Study of the TPS, Revised Edition, CRC Press, New York, pp. 69.
13. The VSM Font A tool for Value Stream Mapping in Lean Manufacturing / 6-Sigma (n.d.). Available from:
http://www.ambor.com/public/vsm/vsmfont.html (Accessed 29 April 2011)
14. Womack, J.P. and Jones, D.T. (2003). Lean Thinking. 1st Free Press ed., New York: Free Press, pp. 16-
26.