Embed Size (px)
Citation preview
8/13/2019 PocketBook VSM
http://slidepdf.com/reader/full/pocketbook-vsm 1/93
MfgData
Lead
Time
ControlCenter
Customer Electronic Info
ArrowFinishedGoods
InventoryOutsideSource
ProcessSharedProcess
Summary TruckUnits
Converter
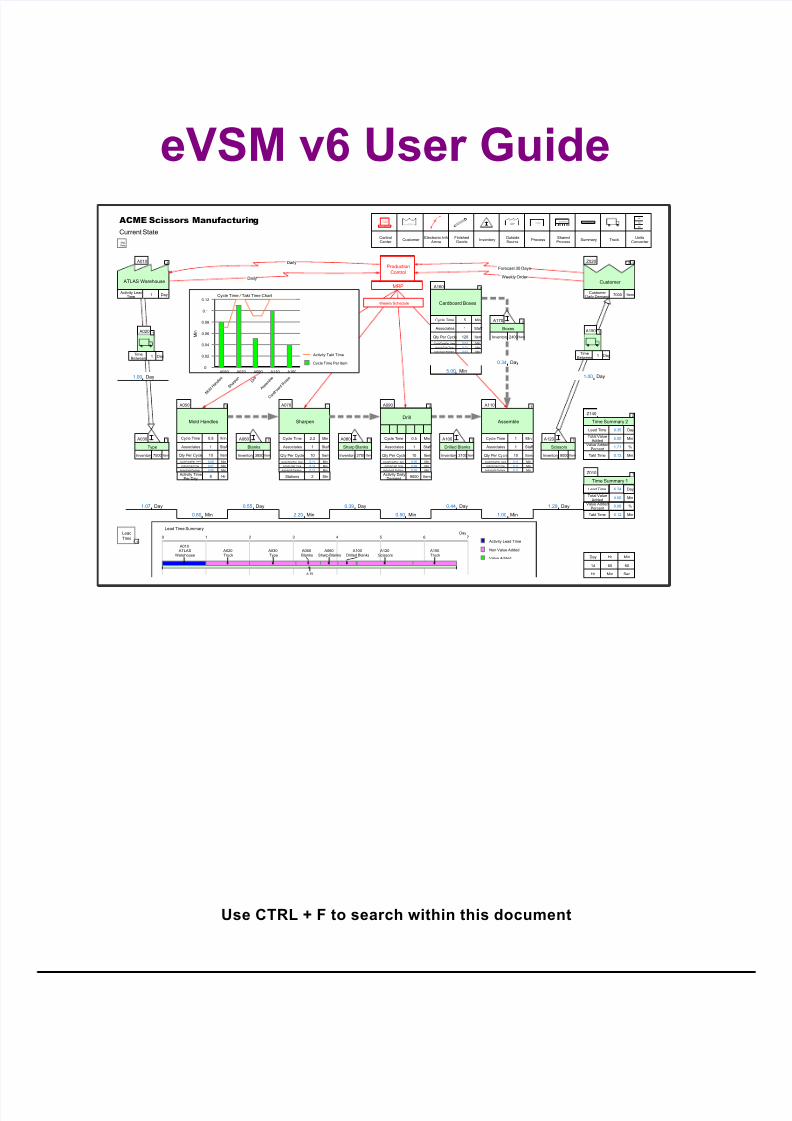
ACME Scissors Manufacturing
Current State
Z020
Customer
7000Customer
Daily DemandItem
1
14
Day
Hr
60
Hr
Min
60
Min
Sec
1 Activity Lead
TimeDay
A010
ATLAS Warehouse
1
1.07 Day
Type
7500Inventory Item
A030 1
1.00 Day
1Time
BetweenDay
A020 1
0.80 Min
1 Associates Staff
10Qty Per Cycle Item
0.8Cycle Time Min
0.08CycleTimePer Item Min
0.07 ActivityTakt Time Min
Mold Handles
A050
0.08 ActivityVA PerItem Min
1
0.55 Day
Blanks
3850Inventory Item
A060 1
2.20 Min
1 Associates Staff
10Qty Per Cycle Item
2.2Cycle Time Min
0.11CycleTimePer Item Min
0.12 ActivityTakt Time Min
Sharpen
A070
0.11 ActivityVA PerItem Min
1
0.39 Day
Sharp Blanks
2700Inventory Item
A080 1
0.50 Min
1 Associates Staff
10Qty Per Cycle Item
0.5Cycle Time Min
0.05CycleTimePer Item Min
0.09 ActivityTakt Time Min
A090
0.05 ActivityVA PerItem Min
1
0.44 Day
Drilled Blanks
3100Inventory Item
A100 1
1.00 Min
1 Associates Staff
10Qty Per Cycle Item
1Cycle Time Min
0.10CycleTimePer Item Min
0.12 ActivityTakt Time Min
Assemble
A110
0.10 ActivityVA PerItem Min
1
1.29 Day
Scissors
9000Inventory Item
A120 1
MRP
Production
ControlForecast 30 Days
Weekly Order
Daily
Daily
Weekly Schedule
Z010
Time Summary 1
0.12Takt Time Min
4.50Total Value
AddedMin
6.74Lead Time Day
0.08Value Added
Percent%
1
Z140
Time Summary 2
0.12Takt Time Min
5.00Total Value
AddedMin
0.35Lead Time Day
1.71Value Added
Percent%
2
1.00 Day
1Time
BetweenDay
A150 1
5.00 Min
1 Associates Staff
120Qty Per Cycle Item
5Cycle Time Min
0.04CycleTimePer Item Min
0.12 ActivityTakt Time Min
Cardboard Boxes
A160
0.04 ActivityVA PerItem Min
2
0.34 Day
Boxes
2400Inventory Item
A170 2
2
2Stations Stn8 Activity Time
Per DayHr 9000
Activity DailyDemand
Item
Drill
MRP
ProductionControl
Customer OutsideSource
ProcessShared Process
Summary 60
Hr
Min
1
Cycle Time / Takt Time Chart
M i n
0
0.02
0.04
0.06
0.08
0.1
0.12
A050
M
o l d H a
n d l e s
A070
S h a r p e n
A090
D r i l l
A110
A s s e m b l e
A160
C a r d b o
a r d B o
x e s
Cycle Time Per Item
Activity Takt Time
Lead Time SummaryDay
0 1 2 3 4 5 6 7
A010 ATLAS
Warehouse A020Truck
A030Type
A060Blanks
A080Sharp Blanks
A100Drilled Blanks
A120Scissors
A150Truck
6.75
Activity Lead Time
Non Value Added
Value Added
eVSM v6 User Guide
Use CTRL + F to search within this document

8/13/2019 PocketBook VSM
http://slidepdf.com/reader/full/pocketbook-vsm 2/93
www.evsm.com 7 November 2013
8/13/2019 PocketBook VSM
http://slidepdf.com/reader/full/pocketbook-vsm 3/93
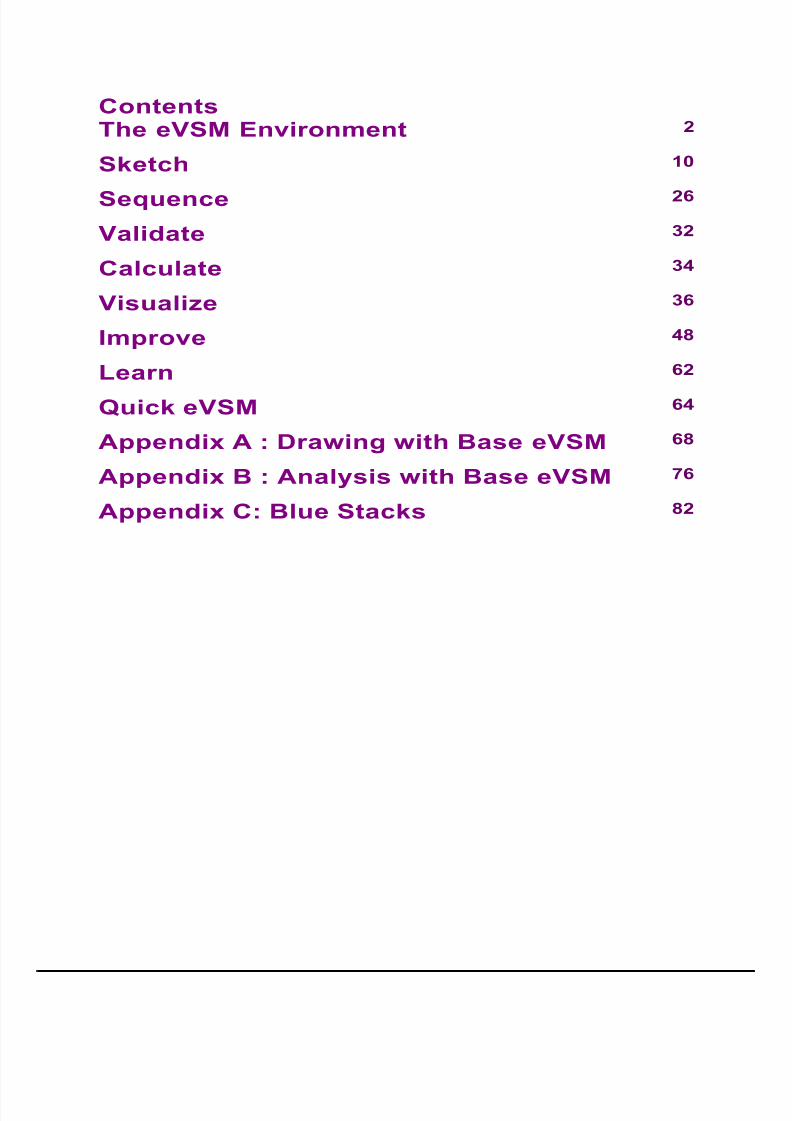
ContentsThe eVSM Environment 2
Sketch 10
Sequence 26
Validate 32
Calculate 34
Visualize 36
Improve 48
Learn 62
Quick eVSM 64
Appendix A : Drawing with Base eVSM 68
Appendix B : Analysis with Base eVSM 76
Appendix C: Blue Stacks 82
8/13/2019 PocketBook VSM
http://slidepdf.com/reader/full/pocketbook-vsm 4/93
Value stream mapping provides a high level view of a lean deployment. Its methodology is well
laid out in the series of workbooks from the Lean Enterprise Institute (www.lean.org). The eVSM
software has been designed to complement these workbooks and provide lean practitioners a tool
to support their value stream mapping activities, starting from paper and pencil through
improvement projects, leading to a leaner future state.
The primary modules in eVSM (Sketch, Sequence, Validate, Calculate, Visualize, Improve) are
deliberately organized to match the process steps that we have seen practitioners follow in their
mapping activities.
We have seen eVSM used in three ways in our user community:
1. By practitioners who simply want to capture a map electronically and want access to a
complete VSM icon set that is easy to use.
2. By practitioners that want to draw a map and do simple calculations in Excel corresponding
to data on the map.
3. By practitioners who want highly standardized and automated maps to include icons as well
as variables, lean equations, charts, and improvement methodology.
While the third approach best leverages the software in a lean deployment, its drawback in the
past has been the learning curve associated with its usage. eVSM has introduced ready-built
stencils for different application areas to address this issue. In eVSM v6, the following stencils
are available.
§ Quick Enterprise- supply chain and logistics maps
§ Quick Manufacturing- plant level maps for discrete parts
§ Quick Processing- plant level maps for food products and chemical processing
§ Quick Transactional- transactional processes
§ Quick Healthcare- patient flows in hospitals
§ Quick MCT- supports manufacturing critical path time calculation assorted with Quick
Response Manufacturing
One hour webinars are available to overview each of the stencils. Contact [email protected] for
details.
eVSM Overview
The eVSM Environment
2
8/13/2019 PocketBook VSM
http://slidepdf.com/reader/full/pocketbook-vsm 5/93
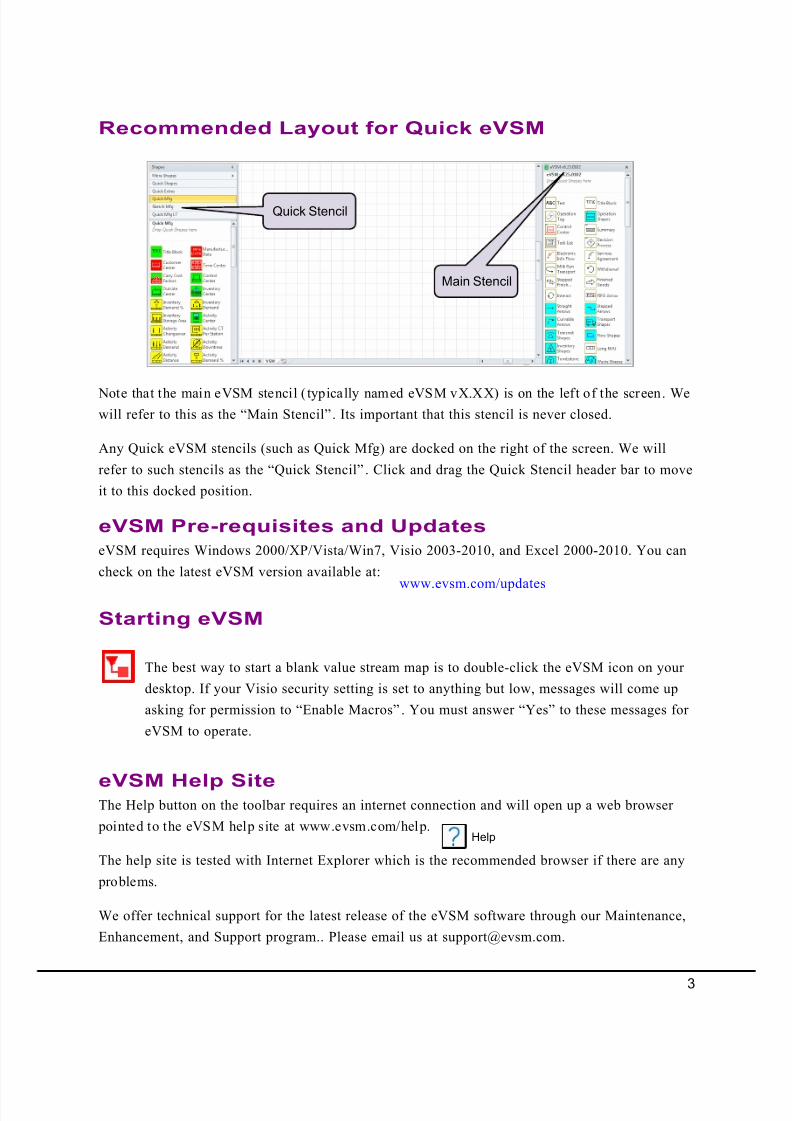
Recommended Layout for Quick eVSM
Note that the main eVSM stencil ( typically named eVSM vX.XX) is on the left of the screen. Wewill refer to this as the “Main Stencil”. Its important that this stencil is never closed.
Any Quick eVSM stencils (such as Quick Mfg) are docked on the right of the screen. We will
refer to such stencils as the “Quick Stencil”. Click and drag the Quick Stencil header bar to move
it to this docked position.
Quick Stencil
Main Stencil
eVSM Pre-requisites and Updates
eVSM requires Windows 2000/XP/Vista/Win7, Visio 2003-2010, and Excel 2000-2010. You can
check on the latest eVSM version available at:
www.evsm.com/updates
The best way to start a blank value stream map is to double-click the eVSM icon on your
desktop. If your Visio security setting is set to anything but low, messages will come up
asking for permission to “Enable Macros”. You must answer “Yes” to these messages for
eVSM to operate.
Starting eVSM
The Help button on the toolbar requires an internet connection and will open up a web browser
pointed to the eVSM help site at www.evsm.com/help.
The help site is tested with Internet Explorer which is the recommended browser if there are any
problems.
We offer technical support for the latest release of the eVSM software through our Maintenance,
Enhancement, and Support program.. Please email us at [email protected].
eVSM Help Site
Help
3
8/13/2019 PocketBook VSM
http://slidepdf.com/reader/full/pocketbook-vsm 6/93
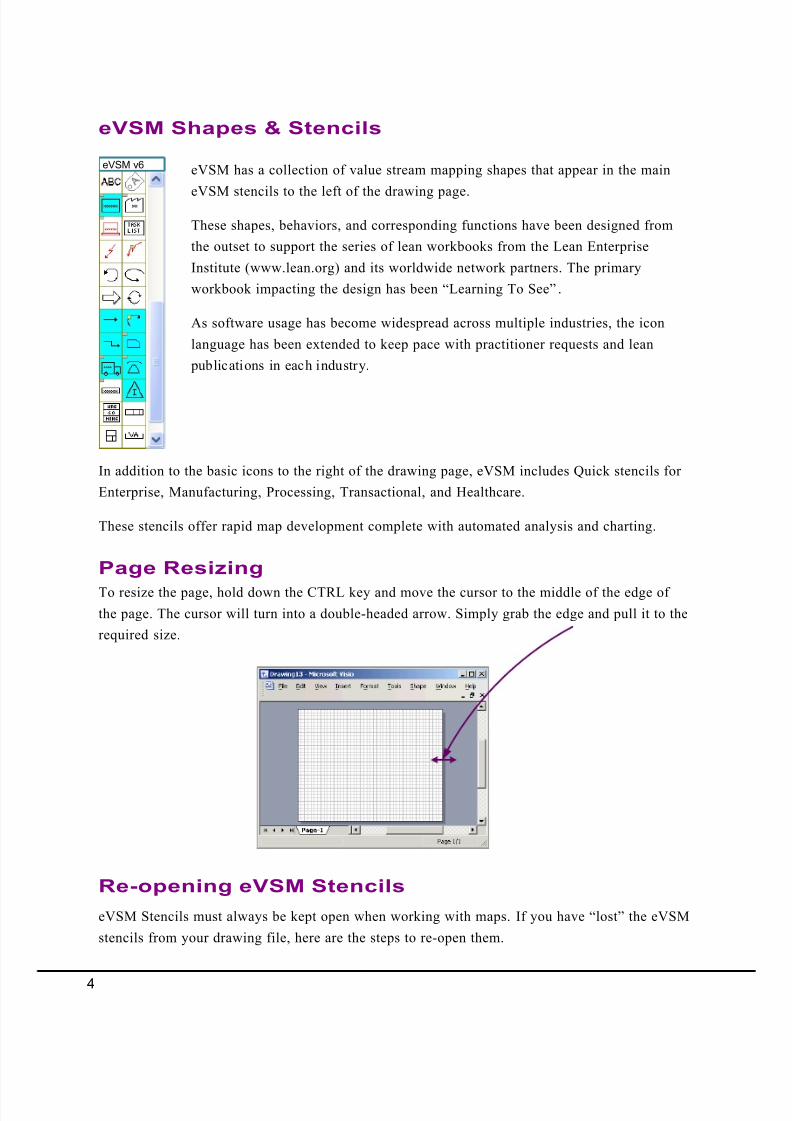
eVSM has a collection of value stream mapping shapes that appear in the main
eVSM stencils to the left of the drawing page.
These shapes, behaviors, and corresponding functions have been designed from
the outset to support the series of lean workbooks from the Lean Enterprise
Institute (www.lean.org) and its worldwide network partners. The primary
workbook impacting the design has been “Learning To See”.
As software usage has become widespread across multiple industries, the icon
language has been extended to keep pace with practitioner requests and lean
publications in each industry.
eVSM Shapes & Stencils
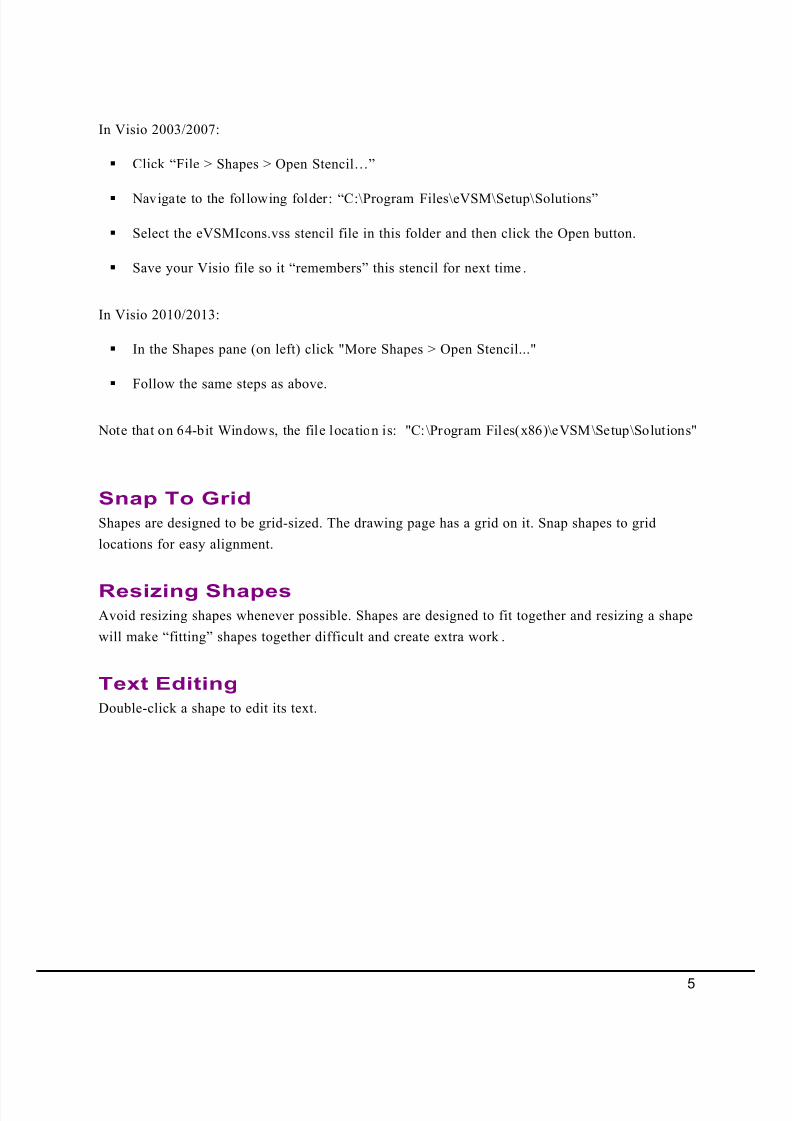
To resize the page, hold down the CTRL key and move the cursor to the middle of the edge of
the page. The cursor will turn into a double-headed arrow. Simply grab the edge and pull it to the
required size.
Page Resizing
In addition to the basic icons to the right of the drawing page, eVSM includes Quick stencils for
Enterprise, Manufacturing, Processing, Transactional, and Healthcare.
These stencils offer rapid map development complete with automated analysis and charting.
Re-opening eVSM Stencils
eVSM Stencils must always be kept open when working with maps. If you have “lost” the eVSM
stencils from your drawing file, here are the steps to re-open them.
eVSM v6
4
8/13/2019 PocketBook VSM
http://slidepdf.com/reader/full/pocketbook-vsm 7/93
In Visio 2003/2007:
§ Click “File > Shapes > Open Stencil…”
§ Navigate to the following folder: “C:\Program Files\eVSM\Setup\Solutions”
§ Select the eVSMIcons.vss stencil file in this folder and then click the Open button.
§ Save your Visio file so it “remembers” this stencil for next time.
In Visio 2010/2013:
§ In the Shapes pane (on left) click "More Shapes > Open Stencil..."
§ Follow the same steps as above.
Note that on 64-bit Windows, the file location is: "C: \Program Files(x86)\eVSM\Setup\Solutions"
Resizing Shapes
Shapes are designed to be grid-sized. The drawing page has a grid on it. Snap shapes to grid
locations for easy alignment.
Snap To Grid
Avoid resizing shapes whenever possible. Shapes are designed to fit together and resizing a shape
will make “fitting” shapes together difficult and create extra work .
Double-click a shape to edit its text.
Text Editing
5
8/13/2019 PocketBook VSM
http://slidepdf.com/reader/full/pocketbook-vsm 8/93
Text on
Connector
Text on
Connector
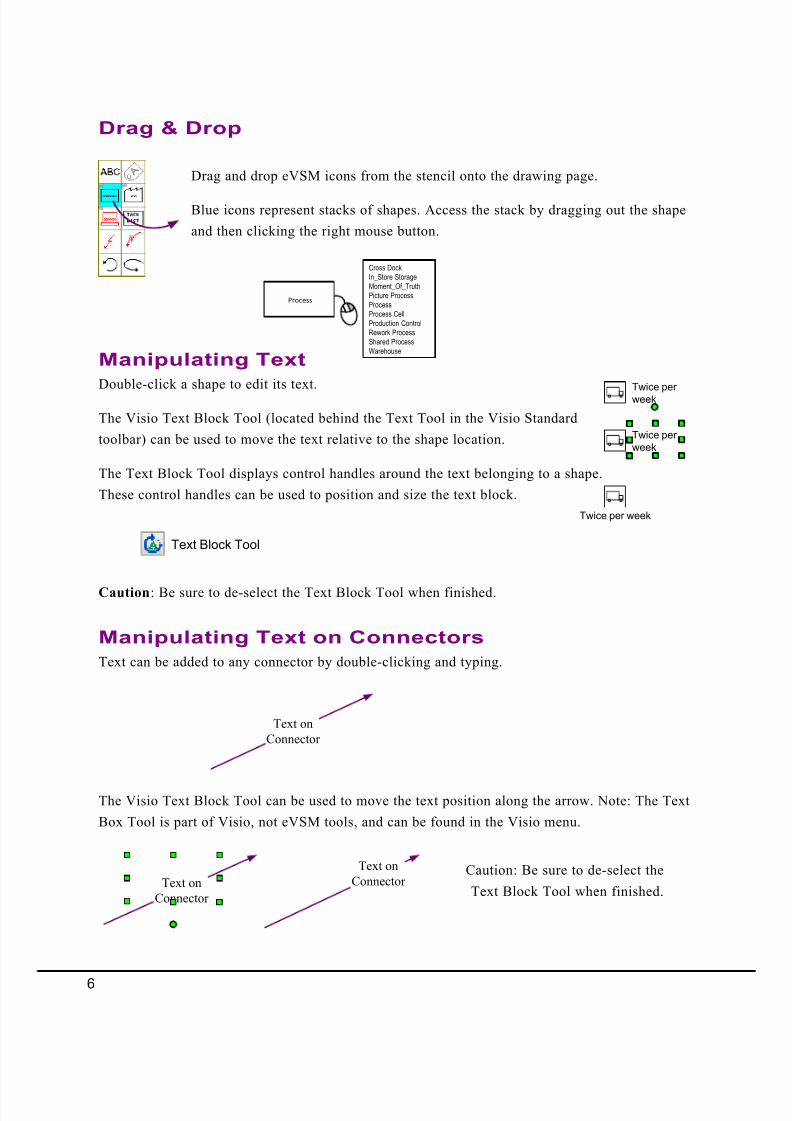
Manipulating Text on Connectors
Text can be added to any connector by double-clicking and typing.
The Visio Text Block Tool can be used to move the text position along the arrow. Note: The Text
Box Tool is part of Visio, not eVSM tools, and can be found in the Visio menu.
Text on
Connector
Caution: Be sure to de-select the
Text Block Tool when finished.
Drag & Drop
Drag and drop eVSM icons from the stencil onto the drawing page.
Blue icons represent stacks of shapes. Access the stack by dragging out the shape
and then clicking the right mouse button.
Cross DockIn_Store StorageMoment_Of_TruthPicture ProcessProcessProcess CellProduction ControlRework ProcessShared ProcessWarehouse
Process
Manipulating Text
Twice per
week
Double-click a shape to edit its text.
The Visio Text Block Tool (located behind the Text Tool in the Visio Standard
toolbar) can be used to move the text relative to the shape location.
The Text Block Tool displays control handles around the text belonging to a shape.
These control handles can be used to position and size the text block.
Twice per week
Twice per
week
Text Block Tool
Caution: Be sure to de-select the Text Block Tool when finished.
6
8/13/2019 PocketBook VSM
http://slidepdf.com/reader/full/pocketbook-vsm 9/93
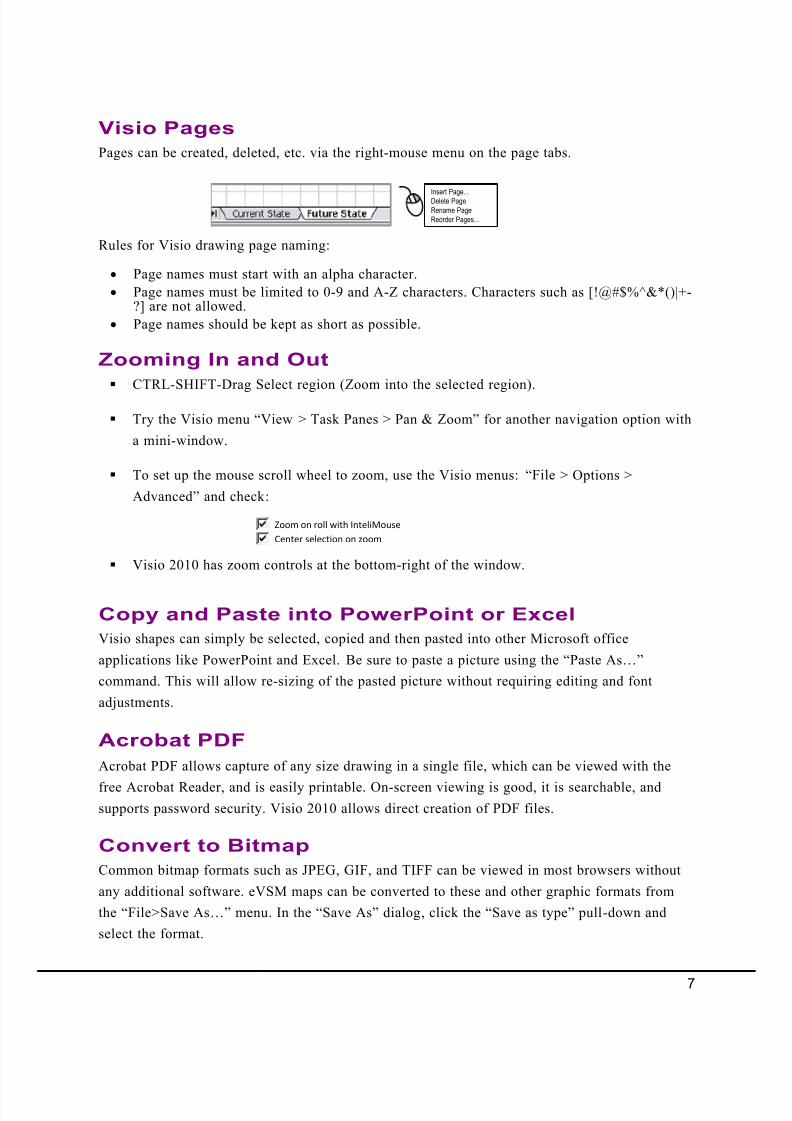
Visio Pages
Pages can be created, deleted, etc. via the right-mouse menu on the page tabs.
Rules for Visio drawing page naming:
· Page names must start with an alpha character.
· Page names must be limited to 0-9 and A-Z characters. Characters such as [!@#$%^&*()|+-?] are not allowed.
· Page names should be kept as short as possible.
Insert Page…
Delete PageRename PageReorder Pages...
Zooming In and Out
§ CTRL-SHIFT-Drag Select region (Zoom into the selected region).
§ Try the Visio menu “View > Task Panes > Pan & Zoom” for another navigation option with
a mini-window.
§ To set up the mouse scroll wheel to zoom, use the Visio menus: “File > Options >
Advanced” and check :
§ Visio 2010 has zoom controls at the bottom-right of the window.
Visio shapes can simply be selected, copied and then pasted into other Microsoft office
applications like PowerPoint and Excel. Be sure to paste a picture using the “Paste As…”
command. This will allow re-sizing of the pasted picture without requiring editing and font
adjustments.
Copy and Paste into PowerPoint or Excel
Acrobat PDF
Convert to Bitmap
Acrobat PDF allows capture of any size drawing in a single file, which can be viewed with the
free Acrobat Reader, and is easily printable. On-screen viewing is good, it is searchable, andsupports password security. Visio 2010 allows direct creation of PDF files.
Common bitmap formats such as JPEG, GIF, and TIFF can be viewed in most browsers without
any additional software. eVSM maps can be converted to these and other graphic formats from
the “File>Save As…” menu. In the “Save As” dialog, click the “Save as type” pull-down and
select the format.
Zoom on roll with InteliMouse
Center selection on zoom
7
8/13/2019 PocketBook VSM
http://slidepdf.com/reader/full/pocketbook-vsm 10/93
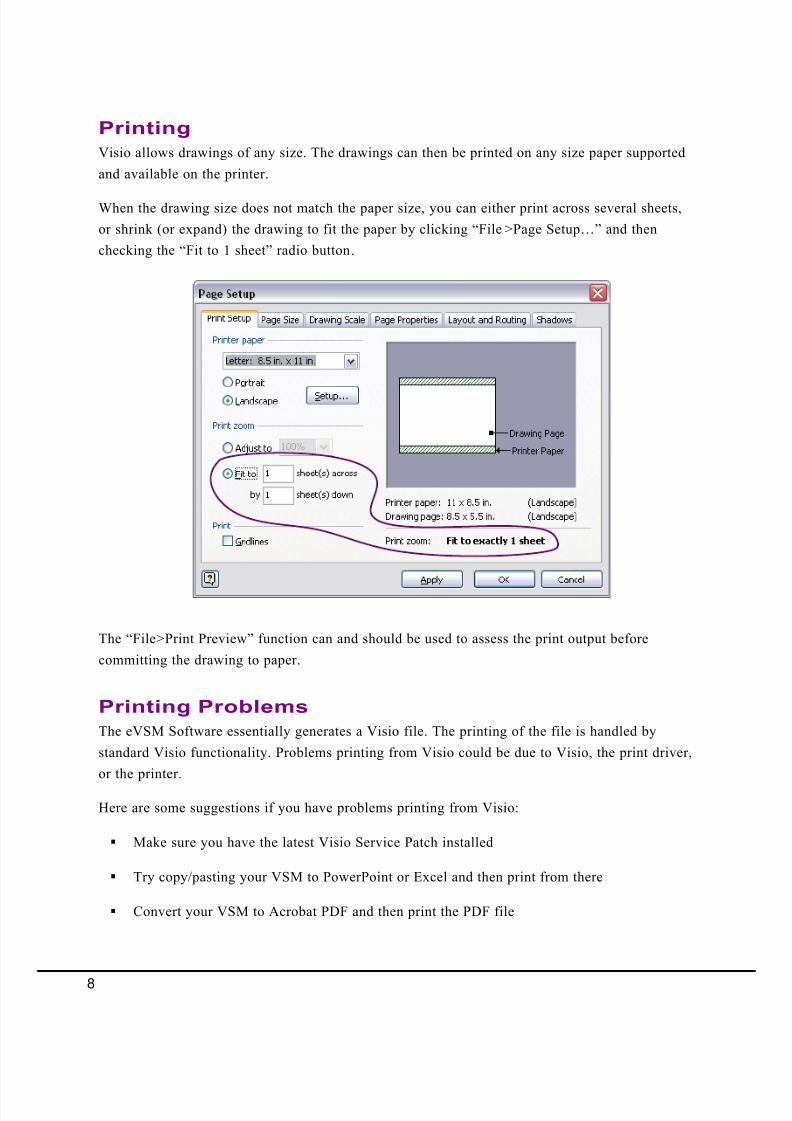
Visio allows drawings of any size. The drawings can then be printed on any size paper supported
and available on the printer.
When the drawing size does not match the paper size, you can either print across several sheets,
or shrink (or expand) the drawing to fit the paper by clicking “File>Page Setup…” and then
checking the “Fit to 1 sheet” radio button.
Printing
The “File>Print Preview” function can and should be used to assess the print output before
committing the drawing to paper.
Printing Problems
The eVSM Software essentially generates a Visio file. The printing of the file is handled by
standard Visio functionality. Problems printing from Visio could be due to Visio, the print driver,
or the printer.
Here are some suggestions if you have problems printing from Visio:
§ Make sure you have the latest Visio Service Patch installed
§ Try copy/pasting your VSM to PowerPoint or Excel and then print from there
§ Convert your VSM to Acrobat PDF and then print the PDF file
8
8/13/2019 PocketBook VSM
http://slidepdf.com/reader/full/pocketbook-vsm 11/93
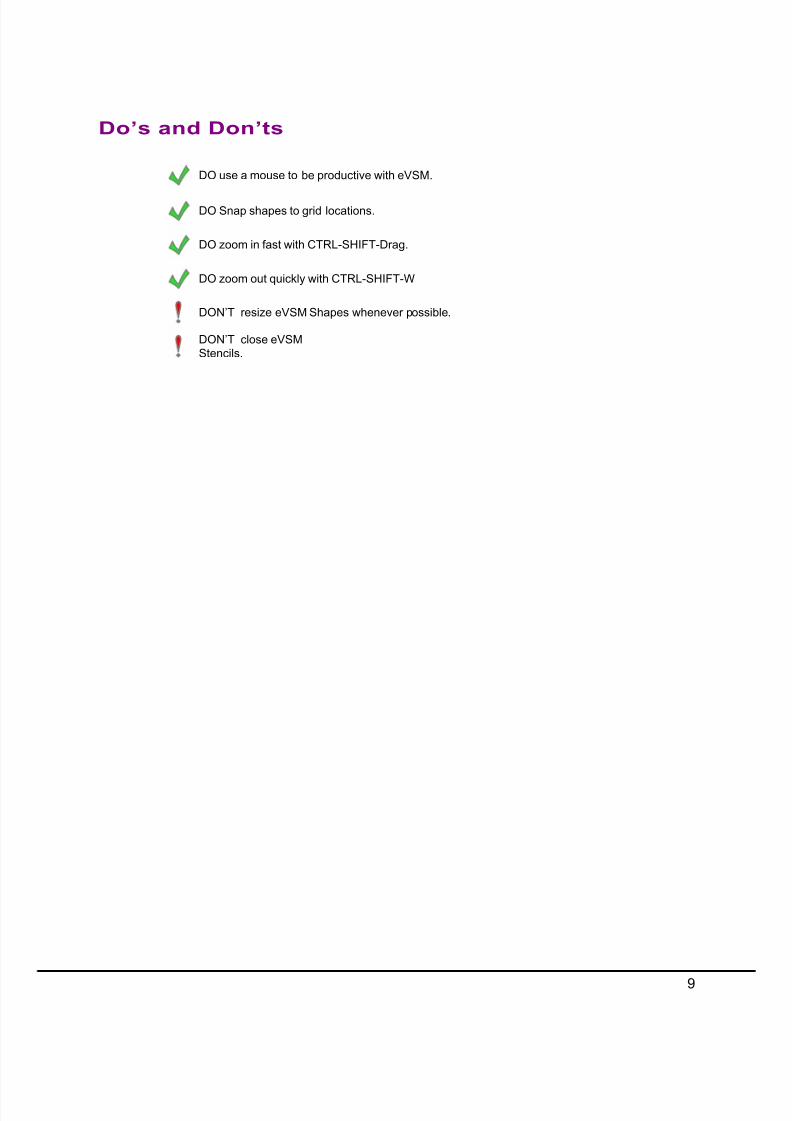
DON’T resize eVSM Shapes whenever possible.
DO Snap shapes to grid locations.
DON’T close eVSM
Stencils.
DO zoom in fast with CTRL-SHIFT-Drag.
DO zoom out quickly with CTRL-SHIFT-W
DO use a mouse to be productive with eVSM.
Do’s and Don’ts
9
8/13/2019 PocketBook VSM
http://slidepdf.com/reader/full/pocketbook-vsm 12/93
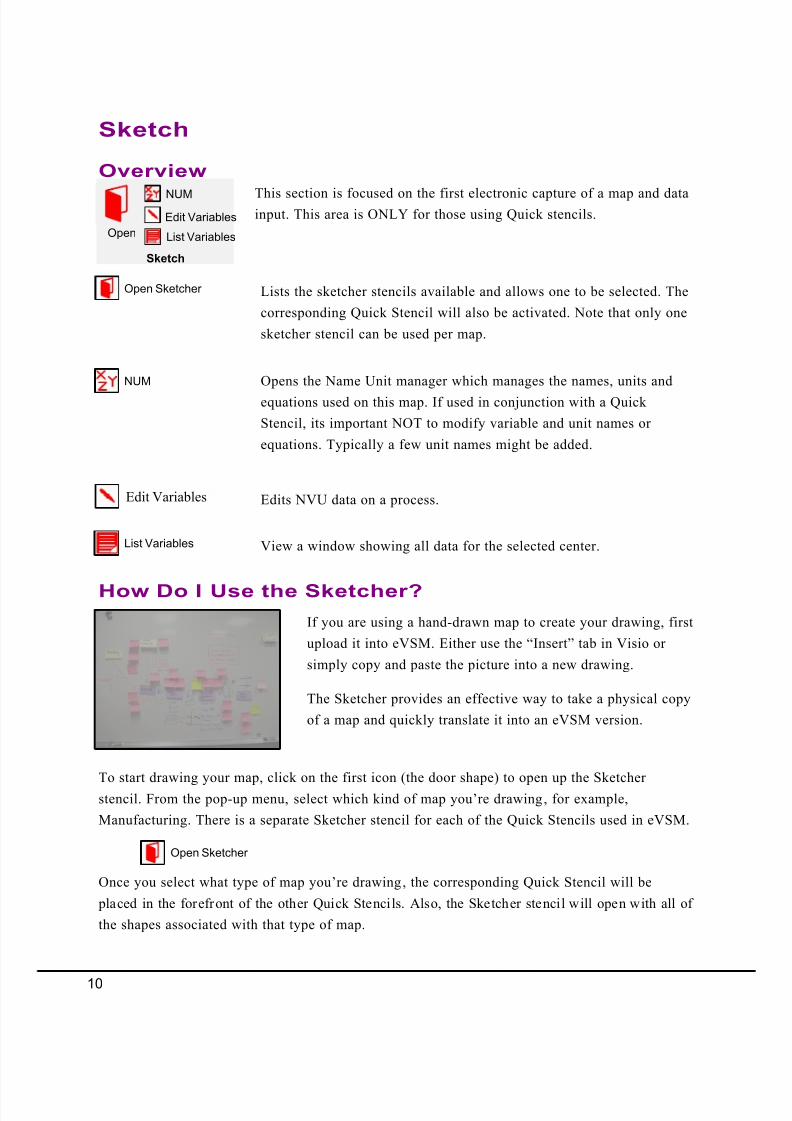
Sketch
Overview
Lists the sketcher stencils available and allows one to be selected. The
corresponding Quick Stencil will also be activated. Note that only one
sketcher stencil can be used per map.
Open Sketcher
NUM Opens the Name Unit manager which manages the names, units and
equations used on this map. If used in conjunction with a Quick
Stencil, its important NOT to modify variable and unit names or
equations. Typically a few unit names might be added.
Edits NVU data on a process.
View a window showing all data for the selected center.
This section is focused on the first electronic capture of a map and datainput. This area is ONLY for those using Quick stencils.
Edit Variables
Open
Sketch
NUM
Edit Variables
How Do I Use the Sketcher?
If you are using a hand-drawn map to create your drawing, first
upload it into eVSM. Either use the “Insert” tab in Visio or
simply copy and paste the picture into a new drawing.
The Sketcher provides an effective way to take a physical copy
of a map and quickly translate it into an eVSM version.
To start drawing your map, click on the first icon (the door shape) to open up the Sketcher
stencil. From the pop-up menu, select which kind of map you’re drawing, for example,
Manufacturing. There is a separate Sketcher stencil for each of the Quick Stencils used in eVSM.
Open Sketcher
Once you select what type of map you’re drawing, the corresponding Quick Stencil will be
placed in the forefront of the other Quick Stencils. Also, the Sketcher stencil will open with all of
the shapes associated with that type of map.
List Variables
List Variables
10
8/13/2019 PocketBook VSM
http://slidepdf.com/reader/full/pocketbook-vsm 13/93
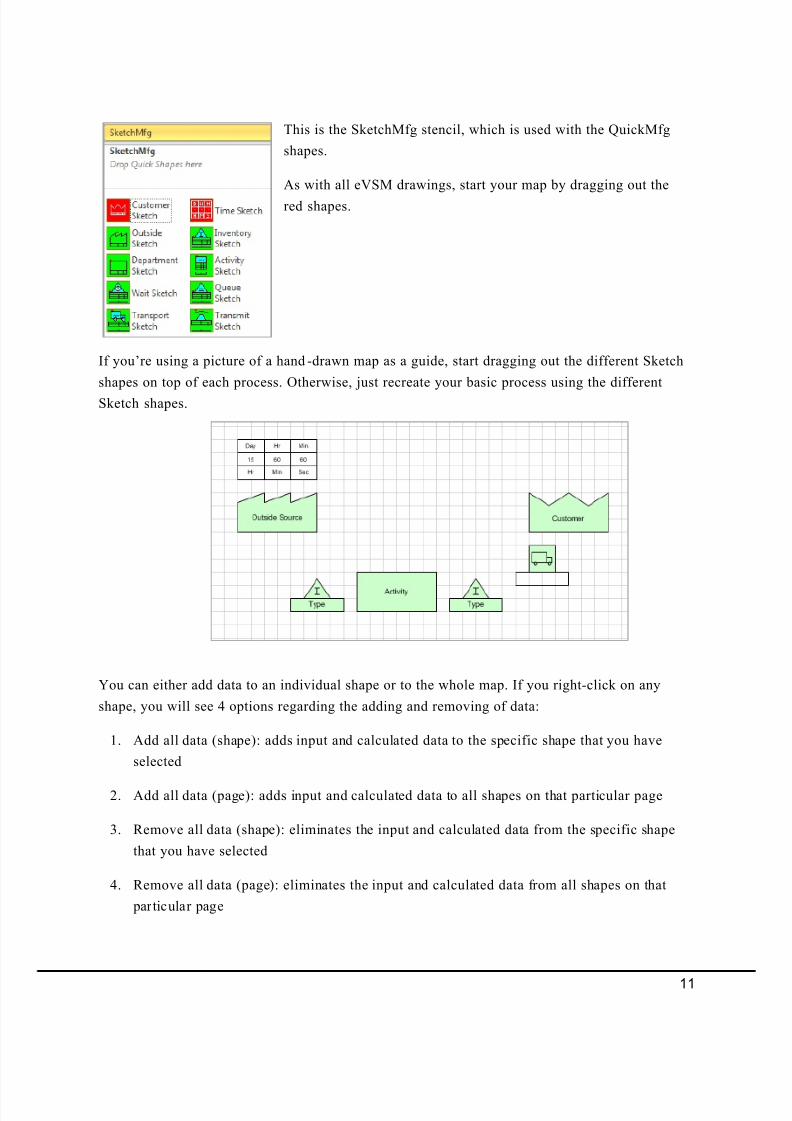
This is the SketchMfg stencil, which is used with the QuickMfg
shapes.
As with all eVSM drawings, start your map by dragging out the
red shapes.
If you’re using a picture of a hand -drawn map as a guide, start dragging out the different Sketch
shapes on top of each process. Otherwise, just recreate your basic process using the different
Sketch shapes.
You can either add data to an individual shape or to the whole map. If you right-click on any
shape, you will see 4 options regarding the adding and removing of data:
1. Add all data (shape): adds input and calculated data to the specific shape that you have
selected
2. Add all data (page): adds input and calculated data to all shapes on that particular page
3. Remove all data (shape): eliminates the input and calculated data from the specific shape
that you have selected
4. Remove all data (page): eliminates the input and calculated data from all shapes on that
particular page
11
8/13/2019 PocketBook VSM
http://slidepdf.com/reader/full/pocketbook-vsm 14/93
2
Item
Screw
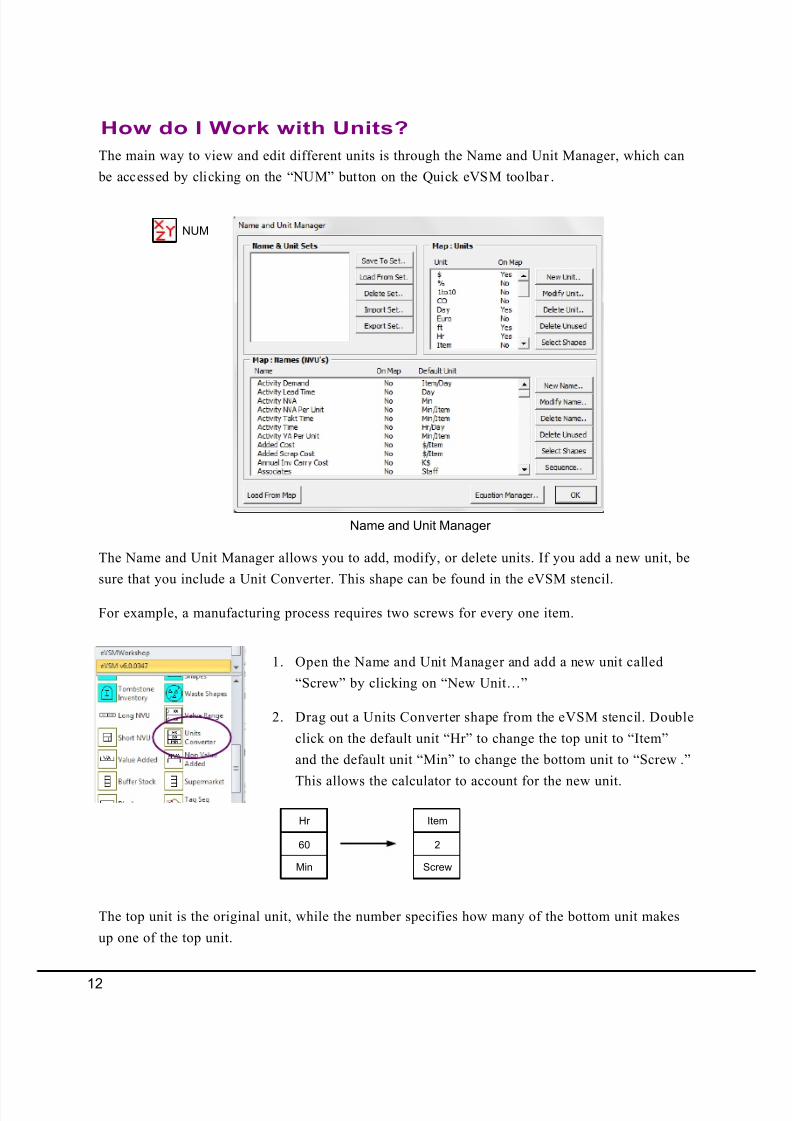
1. Open the Name and Unit Manager and add a new unit called
“Screw” by clicking on “New Unit…”
2. Drag out a Units Converter shape from the eVSM stencil. Double
click on the default unit “Hr” to change the top unit to “Item”
and the default unit “Min” to change the bottom unit to “Screw .”
This allows the calculator to account for the new unit.
60
Hr
Min
The top unit is the original unit, while the number specifies how many of the bottom unit makes
up one of the top unit.
The main way to view and edit different units is through the Name and Unit Manager, which can
be accessed by clicking on the “NUM” button on the Quick eVSM toolbar .
How do I Work with Units?
The Name and Unit Manager allows you to add, modify, or delete units. If you add a new unit, be
sure that you include a Unit Converter. This shape can be found in the eVSM stencil.
For example, a manufacturing process requires two screws for every one item.
NUM
Name and Unit Manager
12
8/13/2019 PocketBook VSM
http://slidepdf.com/reader/full/pocketbook-vsm 15/93
The Name & Unit Manager (NUM) provides a simple way of managing the names and units on a
map via this toolbar button.
The purpose of this management environment is to:
1. Provide a means to type in a name only once and then use it consistently through out the
map.
2. Provide a means to associate a default unit with a name so that when a name is selected, the
unit is automatically set.
3. Provide a means of creating a starter set of names and units for different application areassuch as manufacturing, healthcare, etc. This will allow a company to create standard
variable sets and deploy them easily.
Managing Names & Units
NUM
The NUM function does not allow editing of names and units directly in the data shapes. New
names must first be added to the NUM form. Then they can be accessed via right mouse button
menus on the following data shapes.
Long NVU Short NVU Value Added Non Value Added Units
Converter
Name Unitx.xx Name Unitx.xx Minx.xx Dayx.xx60
Hr
Min
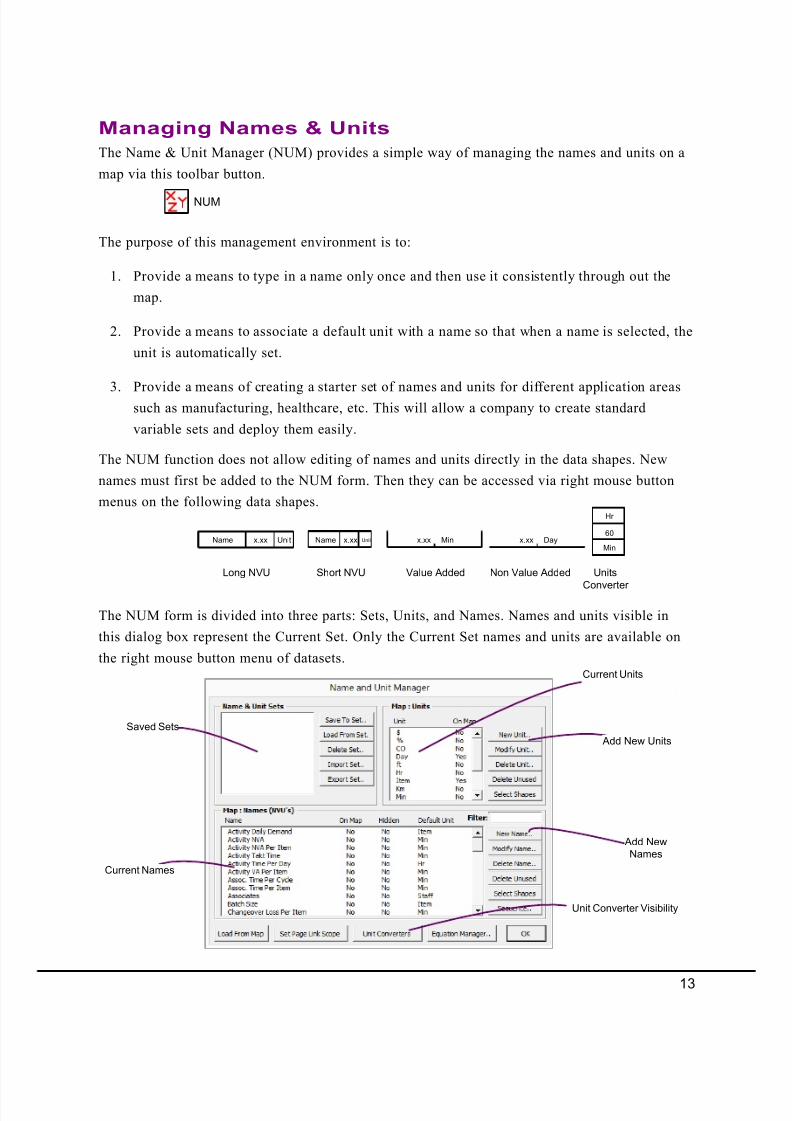
The NUM form is divided into three parts: Sets, Units, and Names. Names and units visible in
this dialog box represent the Current Set. Only the Current Set names and units are available on
the right mouse button menu of datasets.
Saved Sets
Add New Units
Current Units
Current Names
Add New
Names
Unit Converter Visibility
13
8/13/2019 PocketBook VSM
http://slidepdf.com/reader/full/pocketbook-vsm 16/93
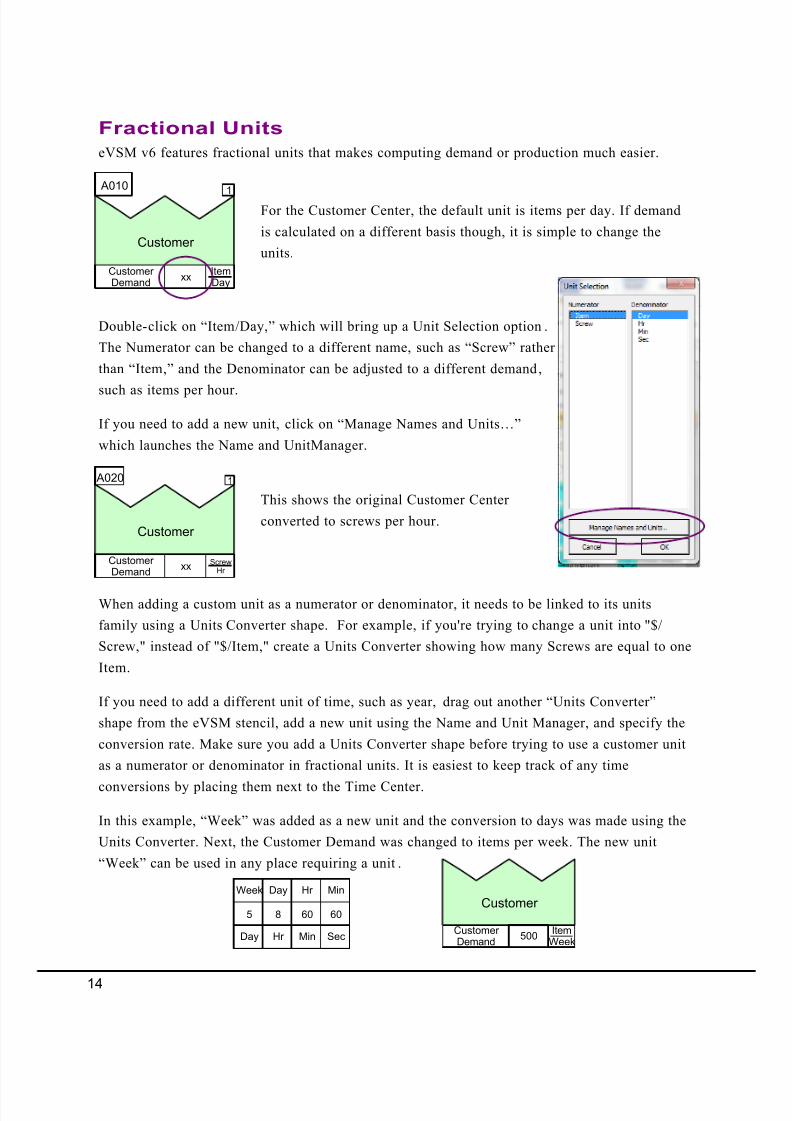
Double-click on “Item/Day,” which will bring up a Unit Selection option .
The Numerator can be changed to a different name, such as “Screw” rather
than “Item,” and the Denominator can be adjusted to a different demand,
such as items per hour.
If you need to add a new unit, click on “Manage Names and Units…”
which launches the Name and UnitManager.
Fractional Units
eVSM v6 features fractional units that makes computing demand or production much easier.
Customer
1
CustomerDemand
ItemDay
xx
A010
For the Customer Center, the default unit is items per day. If demand
is calculated on a different basis though, it is simple to change the
units.
Customer
1
CustomerDemand
ScrewHr
xx
A020
This shows the original Customer Center
converted to screws per hour.
When adding a custom unit as a numerator or denominator, it needs to be linked to its units
family using a Units Converter shape. For example, if you're trying to change a unit into "$/
Screw," instead of "$/Item," create a Units Converter showing how many Screws are equal to one
Item.
If you need to add a different unit of time, such as year, drag out another “Units Converter”
shape from the eVSM stencil, add a new unit using the Name and Unit Manager, and specify the
conversion rate. Make sure you add a Units Converter shape before trying to use a customer unit
as a numerator or denominator in fractional units. It is easiest to keep track of any time
conversions by placing them next to the Time Center.
In this example, “Week” was added as a new unit and the conversion to days was made using the
Units Converter. Next, the Customer Demand was changed to items per week. The new unit
“Week” can be used in any place requiring a unit .
8
Day
Hr
60
Hr
Min
60
Min
Sec
5
Week
Day
Customer
CustomerDemand
ItemWeek
500
14
8/13/2019 PocketBook VSM
http://slidepdf.com/reader/full/pocketbook-vsm 17/93
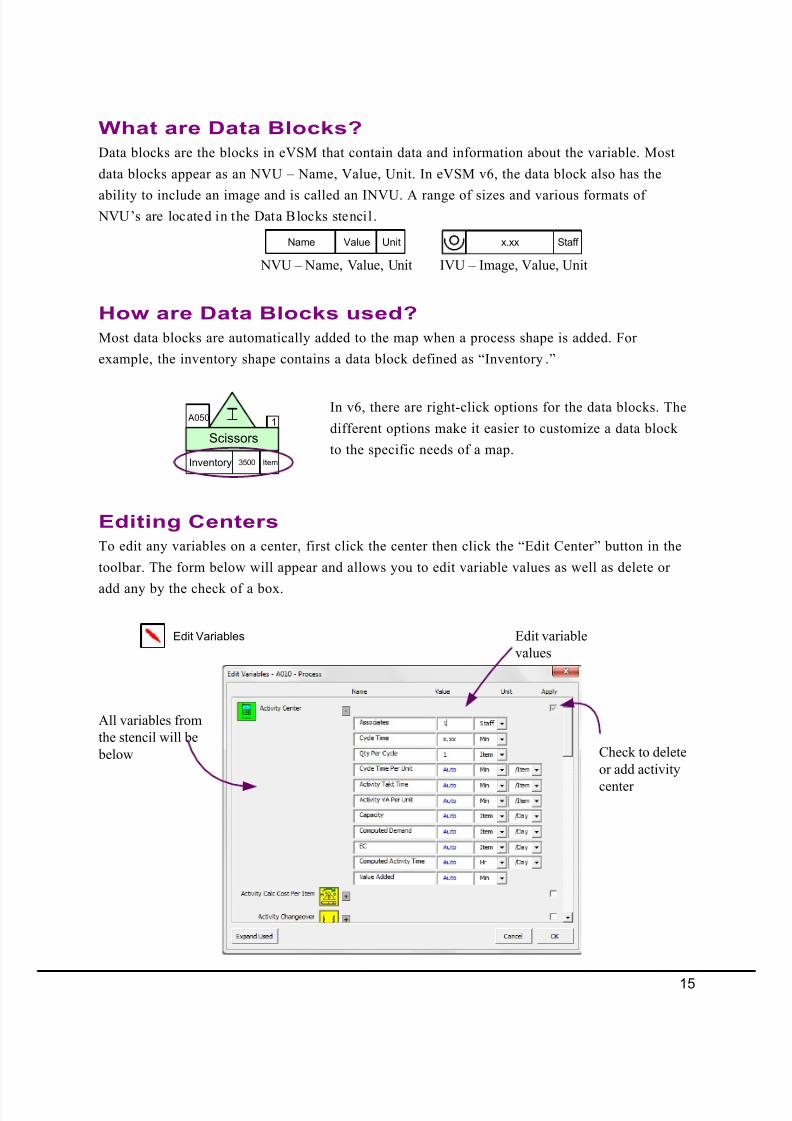
Data blocks are the blocks in eVSM that contain data and information about the variable. Most
data blocks appear as an NVU – Name, Value, Unit. In eVSM v6, the data block also has the
ability to include an image and is called an INVU. A range of sizes and various formats of NVU’s are located in the Data Blocks stencil.
Name UnitValue
How are Data Blocks used?
Most data blocks are automatically added to the map when a process shape is added. For
example, the inventory shape contains a data block defined as “Inventory.”
Staff x.xx
NVU – Name, Value, Unit IVU – Image, Value, Unit
1
Inventory Item3500
A050
Scissors
What are Data Blocks?
In v6, there are right-click options for the data blocks. The
different options make it easier to customize a data block
to the specific needs of a map.
Editing Centers
Edit Variables
To edit any variables on a center, first click the center then click the “Edit Center” button in the
toolbar. The form below will appear and allows you to edit variable values as well as delete or
add any by the check of a box.
Check to delete
or add activity
center
Edit variable
values
All variables from
the stencil will be
below
15
8/13/2019 PocketBook VSM
http://slidepdf.com/reader/full/pocketbook-vsm 18/93
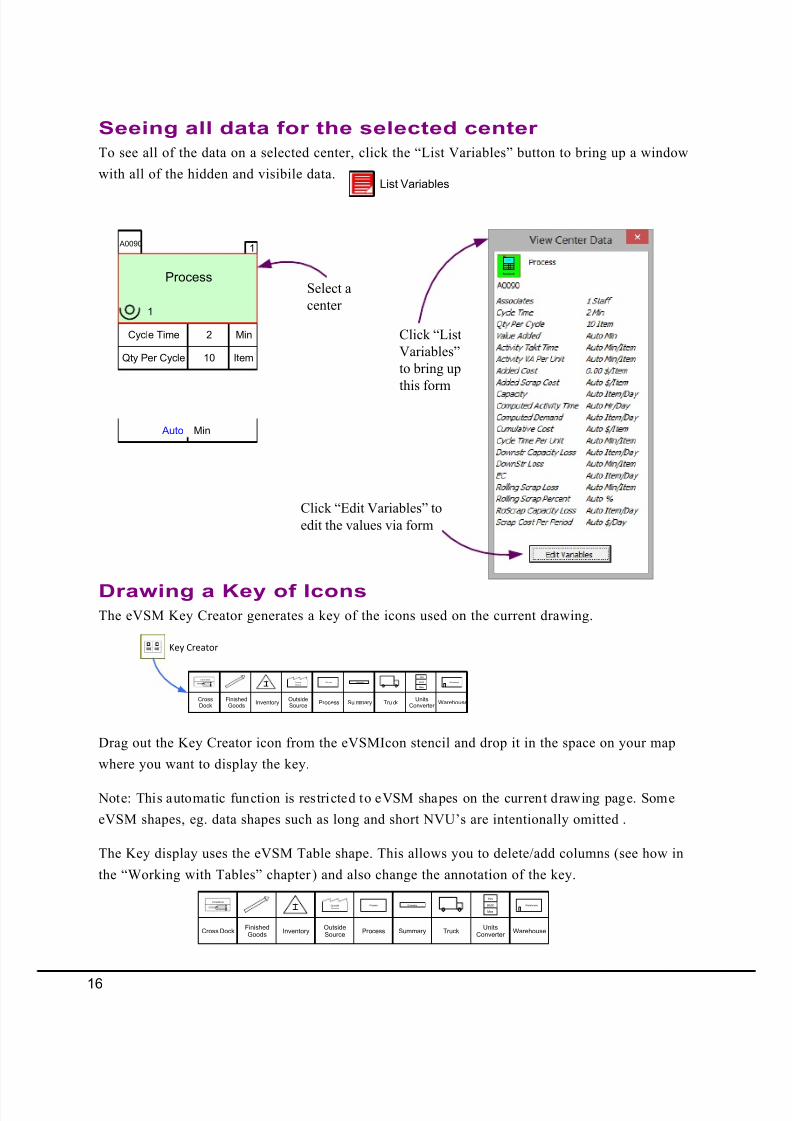
Seeing all data for the selected center
To see all of the data on a selected center, click the “List Variables” button to bring up a window
with all of the hidden and visibile data.
Click “List
Variables”
to bring up
this form
Select a
center
The eVSM Key Creator generates a key of the icons used on the current drawing.
Drawing a Key of Icons
Drag out the Key Creator icon from the eVSMIcon stencil and drop it in the space on your map
where you want to display the key.
Note: This automatic function is restricted to eVSM shapes on the current drawing page. Some
eVSM shapes, eg. data shapes such as long and short NVU’s are intentionally omitted .
The Key display uses the eVSM Table shape. This allows you to delete/add columns (see how in
the “Working with Tables” chapter ) and also change the annotation of the key.
CrossDock
FinishedGoods
InventoryOutsideSource
Process Su mmary Tru ckUnits
Converter Warehouse
Cross Dock
Outside
Source
Process Summary 60.00
Hrs
Mins
Warehouse
Key Creator
Cross DockFinishedGoods
InventoryOutsideSource
Process Summary TruckUnits
Converter Warehouse
Cross Dock
OutsideSource
Process Summary 60.00
Hrs
Mins
Warehouse
Process
1
Qty Per Cycle Item10
Cycle Time Min2
1
A0090
Min Auto
List Variables
Click “Edit Variables” to
edit the values via form
16
8/13/2019 PocketBook VSM
http://slidepdf.com/reader/full/pocketbook-vsm 19/93
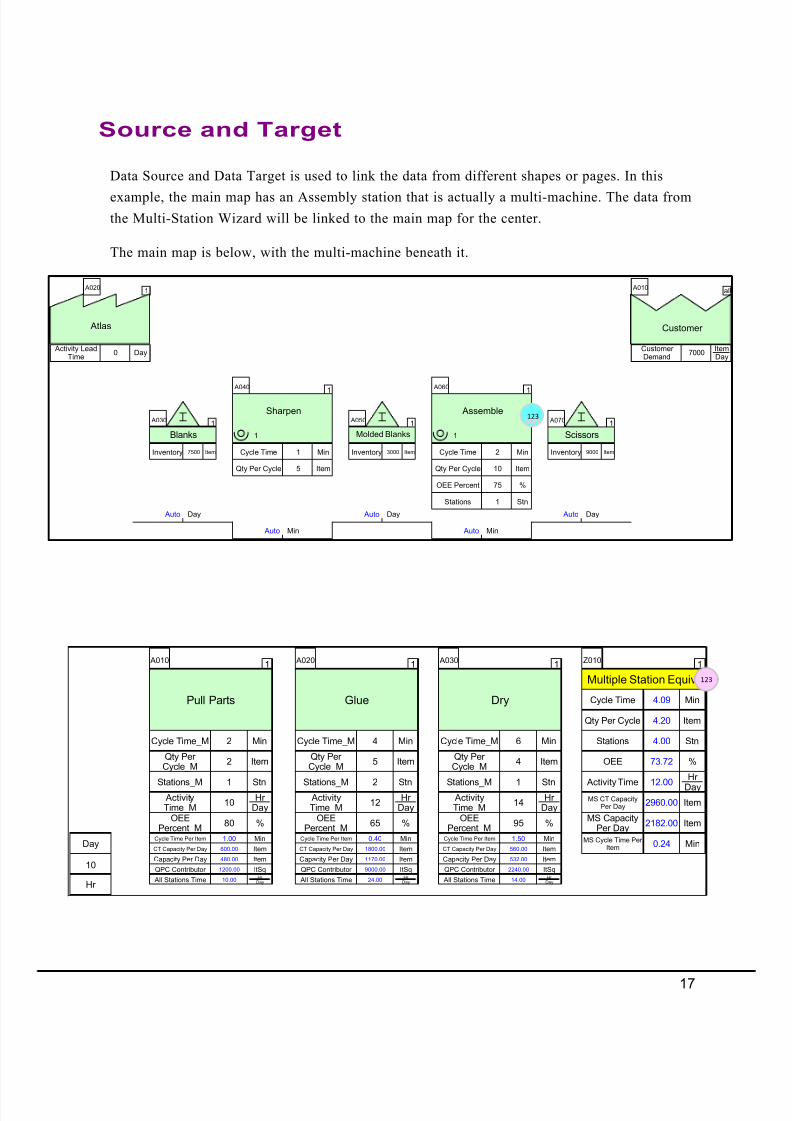
Data Source and Data Target is used to link the data from different shapes or pages. In this
example, the main map has an Assembly station that is actually a multi-machine. The data fromthe Multi-Station Wizard will be linked to the main map for the center.
The main map is below, with the multi-machine beneath it.
Source and Target
Pull Parts
1
Qty PerCycle_M
Item2
Cycle Time_M Min2
Cycle Time Per Item Min1.00
Capacity Per Day Item480.00
Stations_M Stn1 ActivityTime_M
Hr Day
10
OEEPercent_M
%80
CT Capacity Per Day Item600.00
QPC Contributor ItSq1200.00
All Stations Time Hr Day10.00
A010
10
Day
Hr
Glue
1
Qty PerCycle_M
Item5
Cycle Time_M Min4
Cycle Time Per Item Min0.40
Capacity Per Day Item1170.00
Stations_M Stn2 ActivityTime_M
Hr Day
12
OEEPercent_M
%65
CT Capacity Per Day Item1800.00
QPC Contributor ItSq9000.00
All Stations Time Hr Day24.00
A020
Dry
1
Qty PerCycle_M
Item4
Cycle Time_M Min6
Cycle Time Per Item Min1.50
Capacity Per Day Item532.00
Stations_M Stn1 ActivityTime_M
Hr Day
14
OEEPercent_M
%95
CT Capacity Per Day Item560.00
QPC Contributor ItSq2240.00
All Stations Time Hr Day14.00
A030
Multiple Station Equiv.
1
Stations Stn4.00
MS CapacityPer Day
Item2182.00
Activity Time
Hr
Day12.00MS CT Capacity
Per Day Item2960.00
MS Cycle Time PerItem Min0.24
OEE %73.72
Qty Per Cycle Item4.20
Cycle Time Min4.09
Z010
123
all
CustomerDemand
ItemDay
7000
A010
Customer
1
Activity LeadTime
Day0
A020
Atlas
1
Inventory Item7500
A030
Blanks
Day Auto
Sharpen
1
Qty Per Cycle Item5
Cycle Time Min1
1
A040
Min Auto
1
Inventory Item3000
A050
Molded Blanks
Day Auto
Assemble
1
Qty Per Cycle Item10
Cycle Time Min2
1
A060
Min Auto
1
Inventory Item9000
A070
Scissors
Day Auto
OEE Percent %75
Stations Stn1
123
17
8/13/2019 PocketBook VSM
http://slidepdf.com/reader/full/pocketbook-vsm 20/93
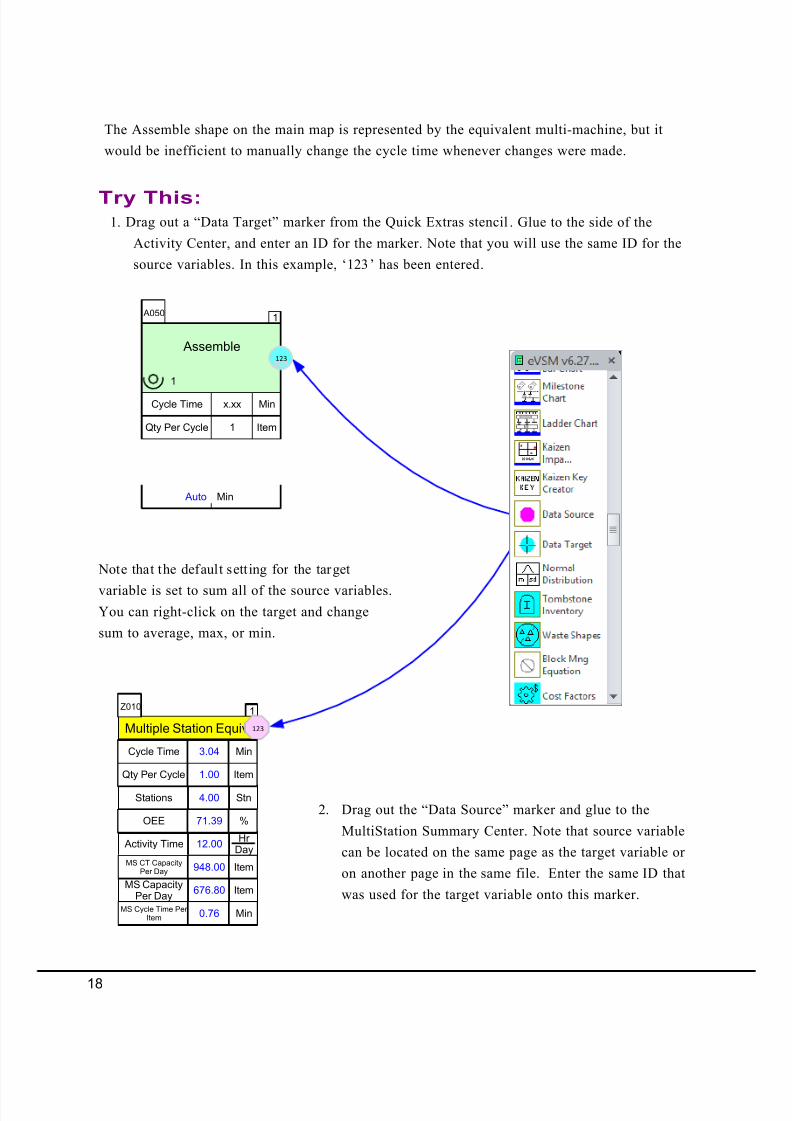
The Assemble shape on the main map is represented by the equivalent multi-machine, but it
would be inefficient to manually change the cycle time whenever changes were made.
Note that the default sett ing for the target
variable is set to sum all of the source variables.You can right-click on the target and change
sum to average, max, or min.
2. Drag out the “Data Source” marker and glue to the
MultiStation Summary Center. Note that source variable
can be located on the same page as the target variable or
on another page in the same file. Enter the same ID that
was used for the target variable onto this marker.
1. Drag out a “Data Target” marker from the Quick Extras stencil. Glue to the side of the
Activity Center, and enter an ID for the marker. Note that you will use the same ID for the
source variables. In this example, ‘123’ has been entered.
Try This:
Assemble
1
Qty Per Cycle Item1
Cycle Time Minx.xx
1
A050
Min Auto
123
Multiple Station Equiv.
1
123
Stations Stn4.00
MS CapacityPer Day
Item676.80
Activity TimeHr
Day12.00
MS CT CapacityPer Day
Item948.00
MS Cycle Time PerItem
Min0.76
OEE %71.39
Qty Per Cycle Item1.00
Cycle Time Min3.04
Z010
18
8/13/2019 PocketBook VSM
http://slidepdf.com/reader/full/pocketbook-vsm 21/93
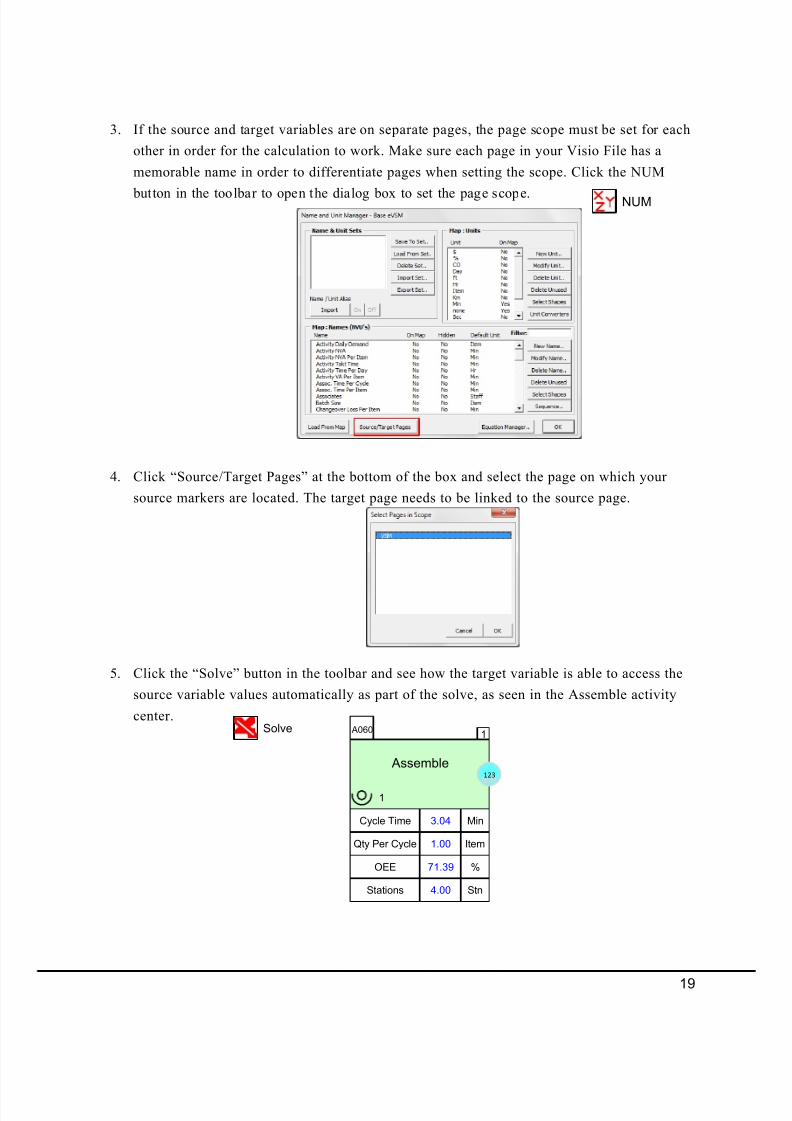
3. If the source and target variables are on separate pages, the page scope must be set for each
other in order for the calculation to work. Make sure each page in your Visio File has a
memorable name in order to differentiate pages when setting the scope. Click the NUM
button in the toolbar to open the dialog box to set the page scope. NUM
4. Click “Source/Target Pages” at the bottom of the box and select the page on which your
source markers are located. The target page needs to be linked to the source page.
5. Click the “Solve” button in the toolbar and see how the target variable is able to access the
source variable values automatically as part of the solve, as seen in the Assemble activity
center.Solve
Assemble
1
1
123
A060
OEE %71.39
Qty Per Cycle Item1.00
Cycle Time Min3.04
Stations Stn4.00
19
8/13/2019 PocketBook VSM
http://slidepdf.com/reader/full/pocketbook-vsm 22/93
Dayx.xxMinx.xx
Dayx.xx
Dayx.xx
Minx.xx
Dayx.xx
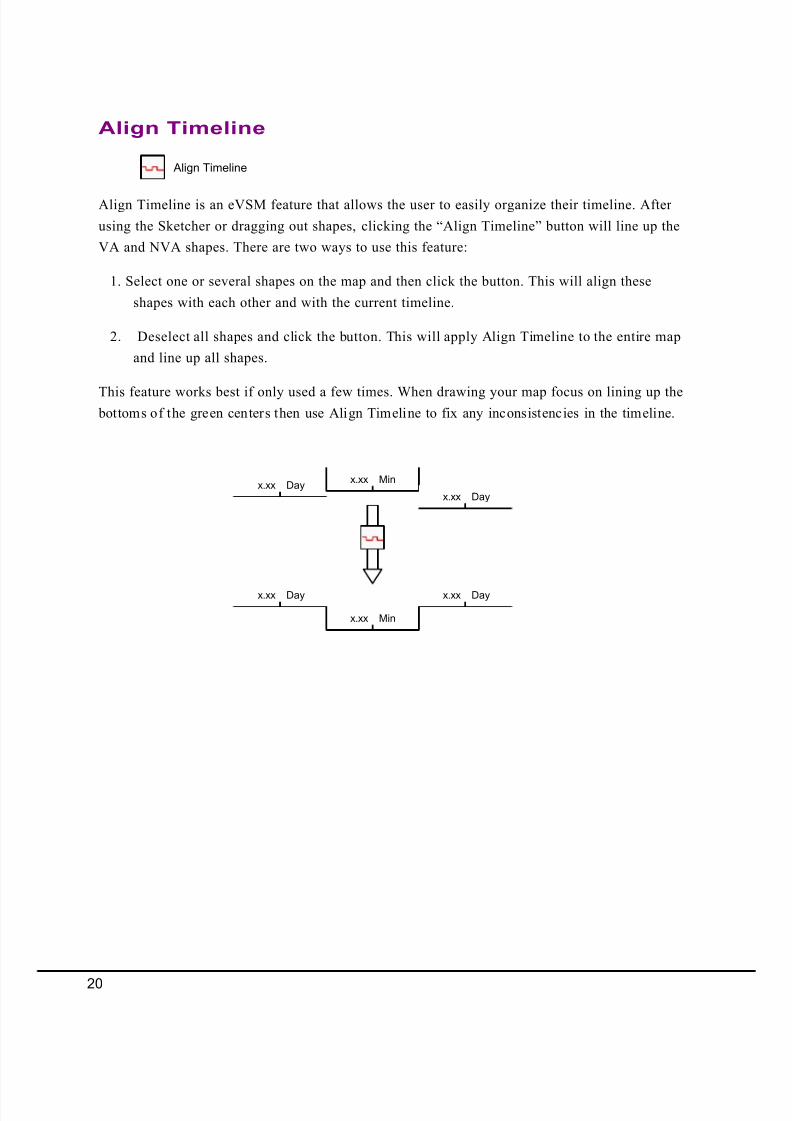
Align Timeline
Align Timeline
Align Timeline is an eVSM feature that allows the user to easily organize their timeline. After
using the Sketcher or dragging out shapes, clicking the “Align Timeline” button will line up the
VA and NVA shapes. There are two ways to use this feature:
1. Select one or several shapes on the map and then click the button. This will align these
shapes with each other and with the current timeline.
2. Deselect all shapes and click the button. This will apply Align Timeline to the entire map
and line up all shapes.
This feature works best if only used a few times. When drawing your map focus on lining up the bottoms of the green centers then use Align Timeline to fix any inconsistencies in the timeline.
20
8/13/2019 PocketBook VSM
http://slidepdf.com/reader/full/pocketbook-vsm 23/93
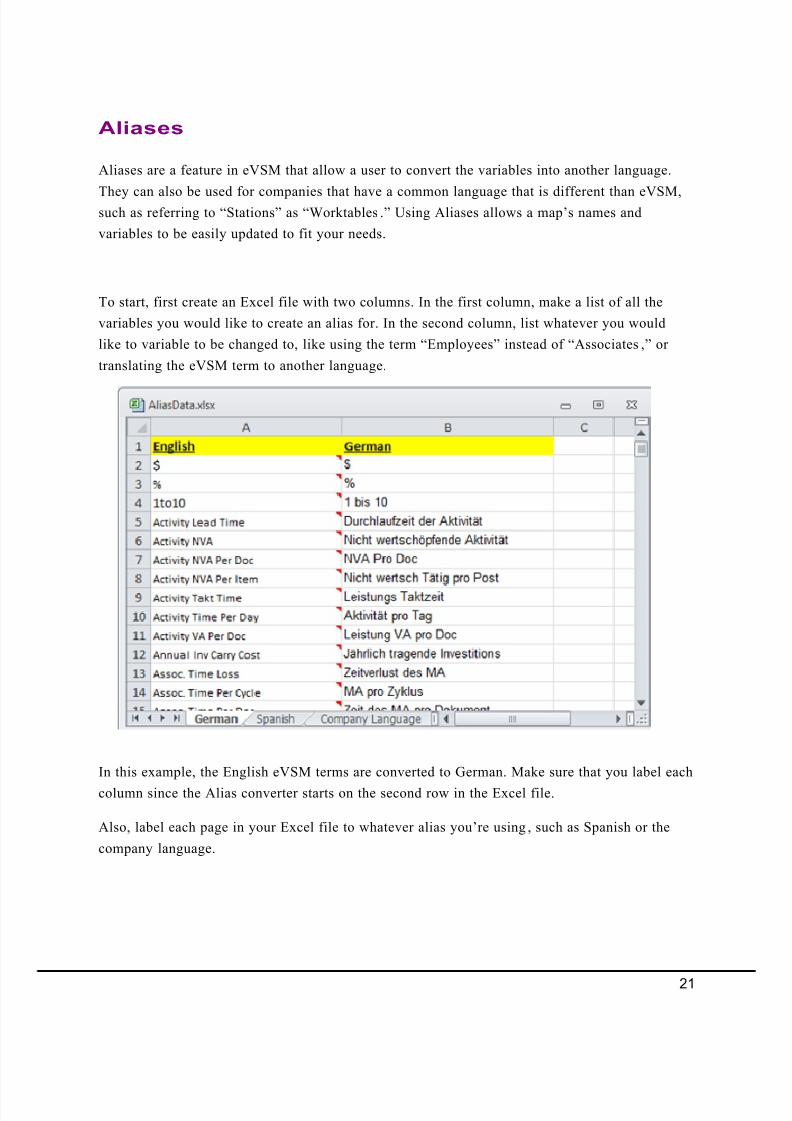
Aliases
Aliases are a feature in eVSM that allow a user to convert the variables into another language.
They can also be used for companies that have a common language that is different than eVSM,such as referring to “Stations” as “Worktables.” Using Aliases allows a map’s names and
variables to be easily updated to fit your needs.
To start, first create an Excel file with two columns. In the first column, make a list of all the
variables you would like to create an alias for. In the second column, list whatever you would
like to variable to be changed to, like using the term “Employees” instead of “Associates,” or
translating the eVSM term to another language.
In this example, the English eVSM terms are converted to German. Make sure that you label each
column since the Alias converter starts on the second row in the Excel file.
Also, label each page in your Excel file to whatever alias you’re using, such as Spanish or the
company language.
21
8/13/2019 PocketBook VSM
http://slidepdf.com/reader/full/pocketbook-vsm 24/93
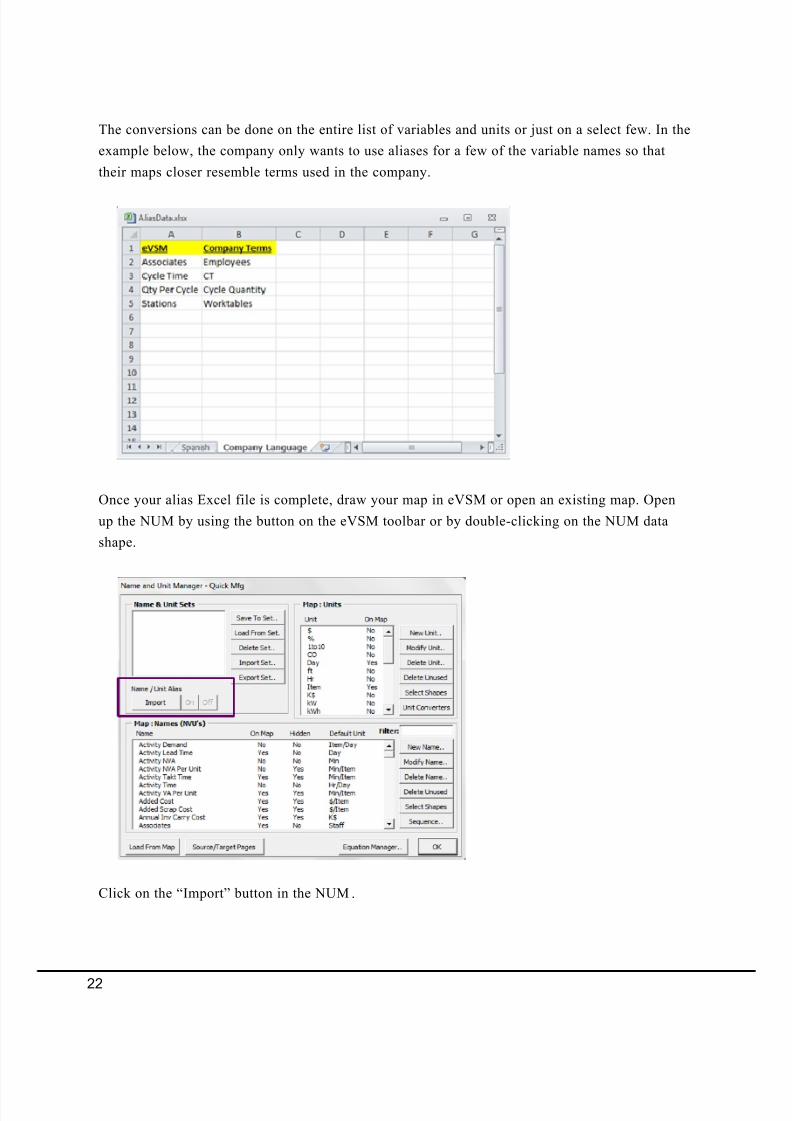
The conversions can be done on the entire list of variables and units or just on a select few. In the
example below, the company only wants to use aliases for a few of the variable names so that
their maps closer resemble terms used in the company.
Once your alias Excel file is complete, draw your map in eVSM or open an existing map. Open
up the NUM by using the button on the eVSM toolbar or by double-clicking on the NUM data
shape.
Click on the “Import” button in the NUM .
22
8/13/2019 PocketBook VSM
http://slidepdf.com/reader/full/pocketbook-vsm 25/93
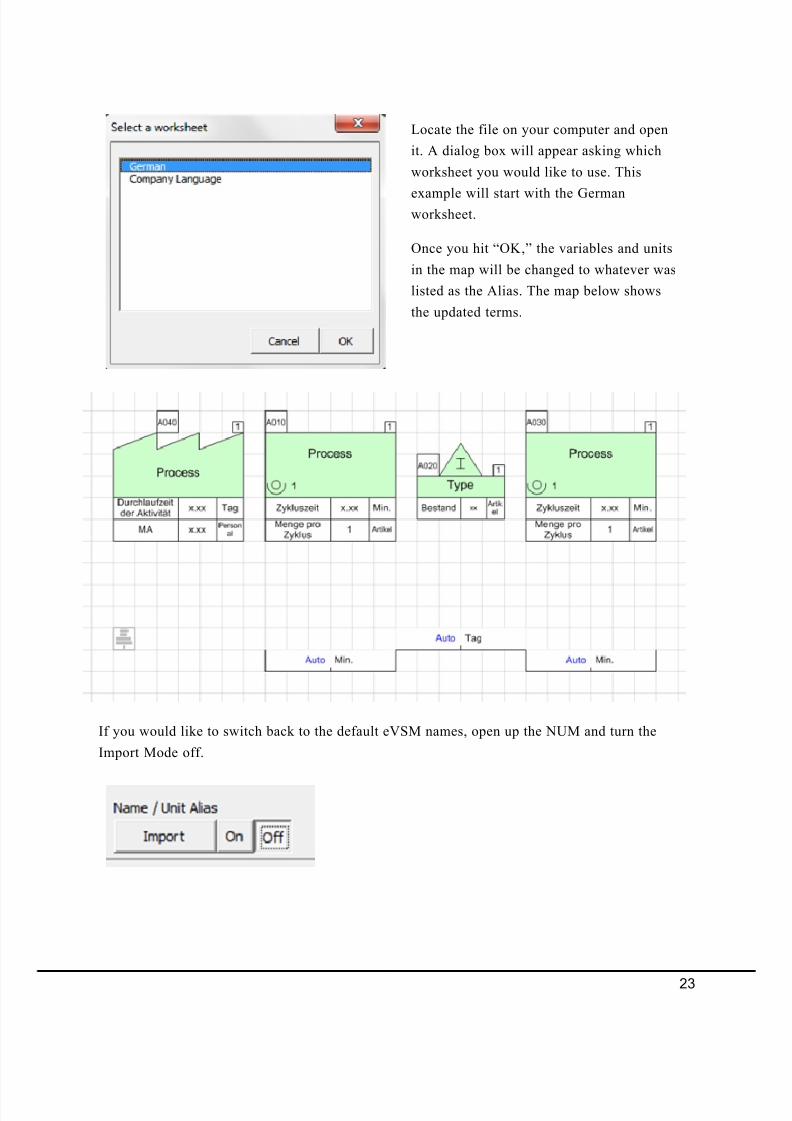
Locate the file on your computer and open
it. A dialog box will appear asking which
worksheet you would like to use. This
example will start with the Germanworksheet.
Once you hit “OK ,” the variables and units
in the map will be changed to whatever was
listed as the Alias. The map below shows
the updated terms.
If you would like to switch back to the default eVSM names, open up the NUM and turn the
Import Mode off.
23
8/13/2019 PocketBook VSM
http://slidepdf.com/reader/full/pocketbook-vsm 26/93
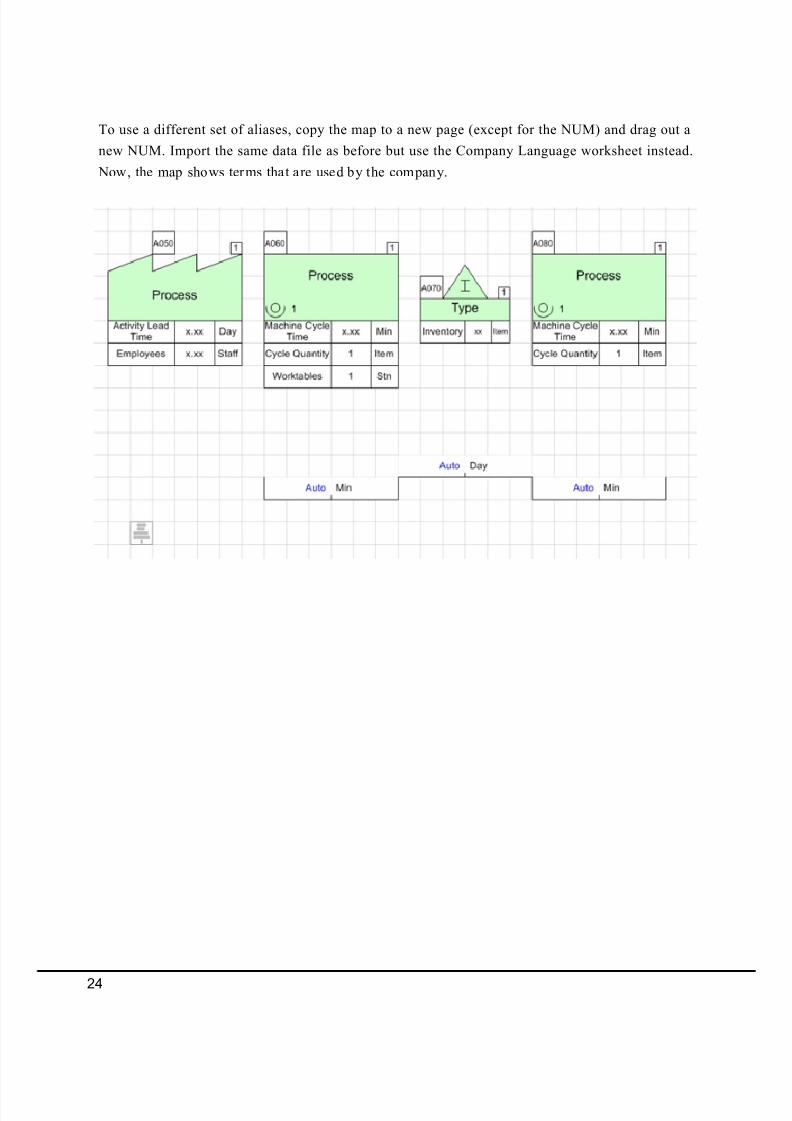
To use a different set of aliases, copy the map to a new page (except for the NUM) and drag out a
new NUM. Import the same data file as before but use the Company Language worksheet instead.
Now, the map shows terms that are used by the company.
24
8/13/2019 PocketBook VSM
http://slidepdf.com/reader/full/pocketbook-vsm 27/93
Adding a new variable
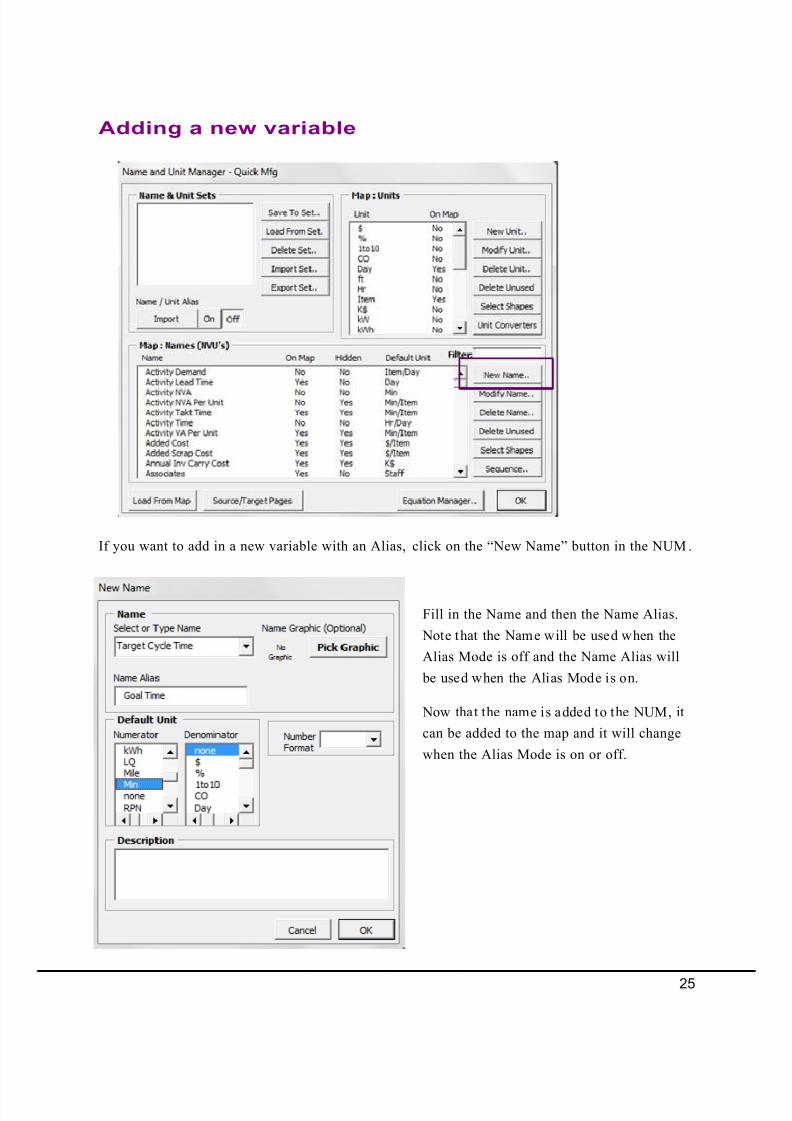
If you want to add in a new variable with an Alias, click on the “New Name” button in the NUM .
Fill in the Name and then the Name Alias.
Note that the Name will be used when the
Alias Mode is off and the Name Alias will
be used when the Alias Mode is on.
Now that the name is added to the NUM, it
can be added to the map and it will change
when the Alias Mode is on or off.
25
8/13/2019 PocketBook VSM
http://slidepdf.com/reader/full/pocketbook-vsm 28/93
Sequence
Overview
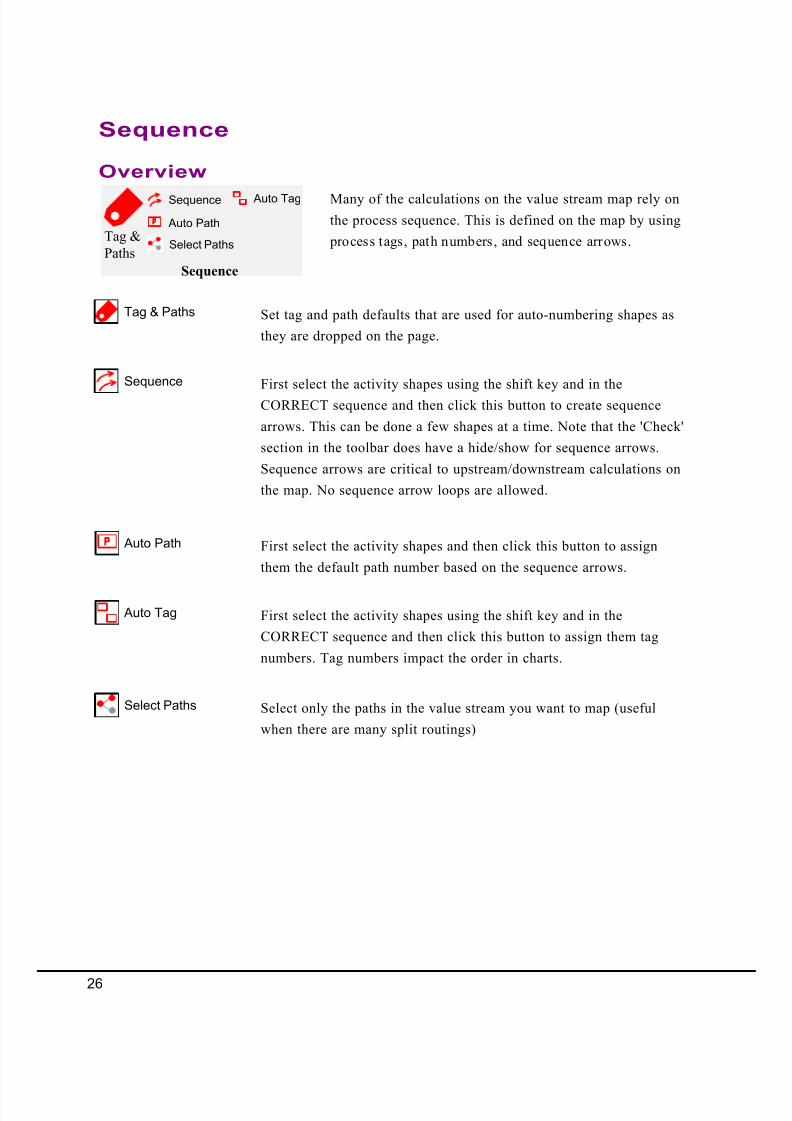
Set tag and path defaults that are used for auto-numbering shapes as
they are dropped on the page.
First select the activity shapes using the shift key and in the
CORRECT sequence and then click this button to create sequence
arrows. This can be done a few shapes at a time. Note that the 'Check'
section in the toolbar does have a hide/show for sequence arrows.
Sequence arrows are critical to upstream/downstream calculations on
the map. No sequence arrow loops are allowed.
Many of the calculations on the value stream map rely on
the process sequence. This is defined on the map by using
process tags, path numbers, and sequence arrows.
Tag & Paths
Sequence
Tag &
PathsSequence
Tag &
Paths
Auto Path
Auto TagSequence
First select the activity shapes and then click this button to assign
them the default path number based on the sequence arrows.
First select the activity shapes using the shift key and in the
CORRECT sequence and then click this button to assign them tag
numbers. Tag numbers impact the order in charts.
Auto Path
Auto Tag
Select Paths Select only the paths in the value stream you want to map (useful
when there are many split routings)
Select Paths
26
8/13/2019 PocketBook VSM
http://slidepdf.com/reader/full/pocketbook-vsm 29/93
Process A Process B
15CT Min 20CT Min
15 Accumulative
TimeMin 45
AccumulativeTime
Min
A010 A020
A030
TransportTime
Min10
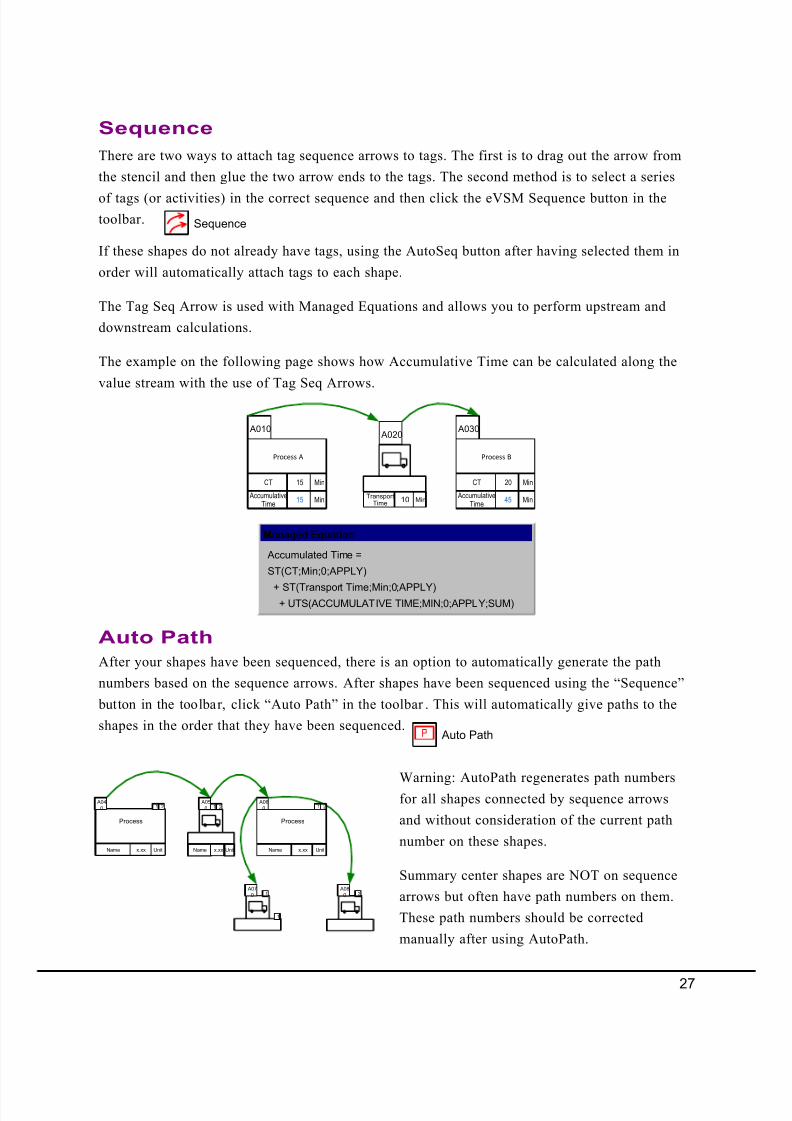
Managed Equation
Accumulated Time =
ST(CT;Min;0;APPLY)
+ ST(Transport Time;Min;0;APPLY) + UTS(ACCUMULATIVE TIME;MIN;0;APPLY;SUM)
After your shapes have been sequenced, there is an option to automatically generate the path
numbers based on the sequence arrows. After shapes have been sequenced using the “Sequence”
button in the toolbar, click “Auto Path” in the toolbar . This will automatically give paths to the
shapes in the order that they have been sequenced.
Auto Path
Auto Path
Process
Name Unitx.xx Name Unitx.xx
Process
Name Unitx.xx
A04
0
A05
0
A06
0
A07
0
A08
0
2 2 2
1
1 1 1
1 2
Sequence
Sequence
There are two ways to attach tag sequence arrows to tags. The first is to drag out the arrow from
the stencil and then glue the two arrow ends to the tags. The second method is to select a series
of tags (or activities) in the correct sequence and then click the eVSM Sequence button in the
toolbar.
If these shapes do not already have tags, using the AutoSeq button after having selected them in
order will automatically attach tags to each shape.
The Tag Seq Arrow is used with Managed Equations and allows you to perform upstream and
downstream calculations.
The example on the following page shows how Accumulative Time can be calculated along the
value stream with the use of Tag Seq Arrows.
Warning: AutoPath regenerates path numbers
for all shapes connected by sequence arrows
and without consideration of the current path
number on these shapes.
Summary center shapes are NOT on sequence
arrows but often have path numbers on them.
These path numbers should be corrected
manually after using AutoPath.
27
8/13/2019 PocketBook VSM
http://slidepdf.com/reader/full/pocketbook-vsm 30/93
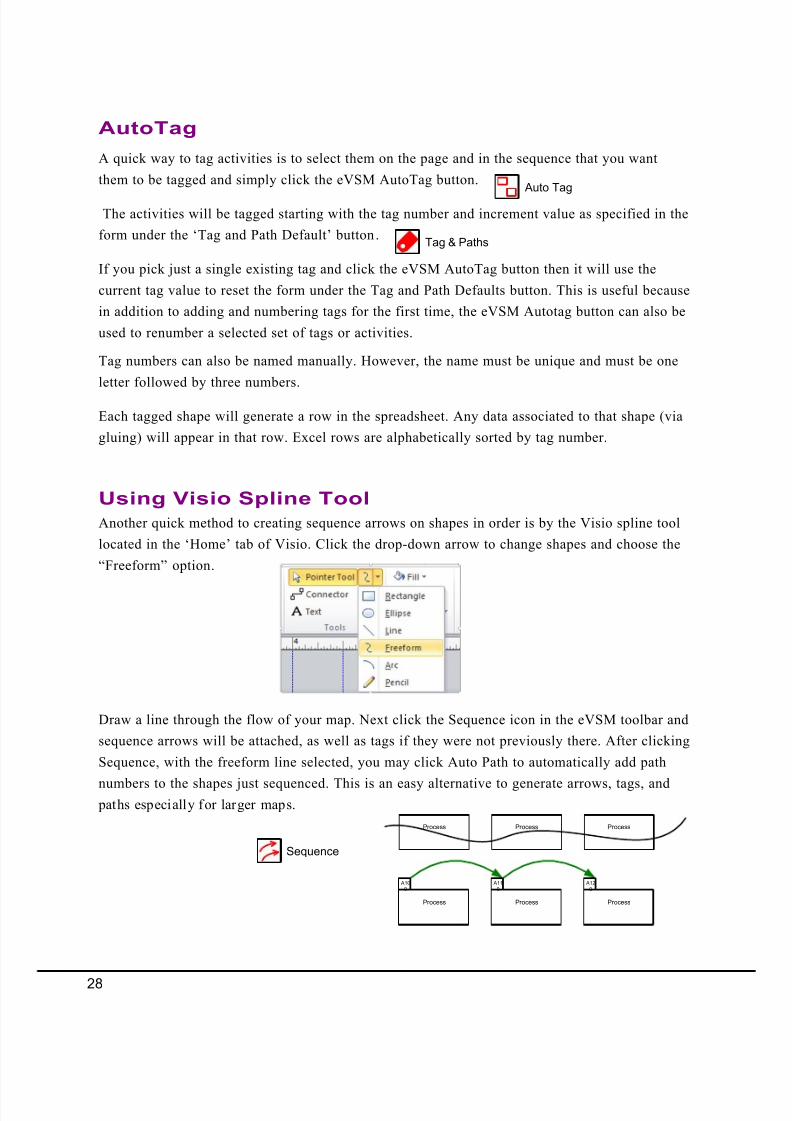
Using Visio Spline Tool
Another quick method to creating sequence arrows on shapes in order is by the Visio spline tool
located in the ‘Home’ tab of Visio. Click the drop-down arrow to change shapes and choose the
“Freeform” option.
Draw a line through the flow of your map. Next click the Sequence icon in the eVSM toolbar and
sequence arrows will be attached, as well as tags if they were not previously there. After clicking
Sequence, with the freeform line selected, you may click Auto Path to automatically add path
numbers to the shapes just sequenced. This is an easy alternative to generate arrows, tags, and paths especially for larger maps.
Process Process Process
Process Process Process
A10
0
A11
0
A12
0
Sequence
Tag numbers can also be named manually. However, the name must be unique and must be one
letter followed by three numbers.
Each tagged shape will generate a row in the spreadsheet. Any data associated to that shape (via
gluing) will appear in that row. Excel rows are alphabetically sorted by tag number.
A quick way to tag activities is to select them on the page and in the sequence that you want
them to be tagged and simply click the eVSM AutoTag button.
The activities will be tagged starting with the tag number and increment value as specified in the
form under the ‘Tag and Path Default’ button.
If you pick just a single existing tag and click the eVSM AutoTag button then it will use the
current tag value to reset the form under the Tag and Path Defaults button. This is useful because
in addition to adding and numbering tags for the first time, the eVSM Autotag button can also be
used to renumber a selected set of tags or activities.
AutoTag
Auto Tag
Tag & Paths
28
8/13/2019 PocketBook VSM
http://slidepdf.com/reader/full/pocketbook-vsm 31/93
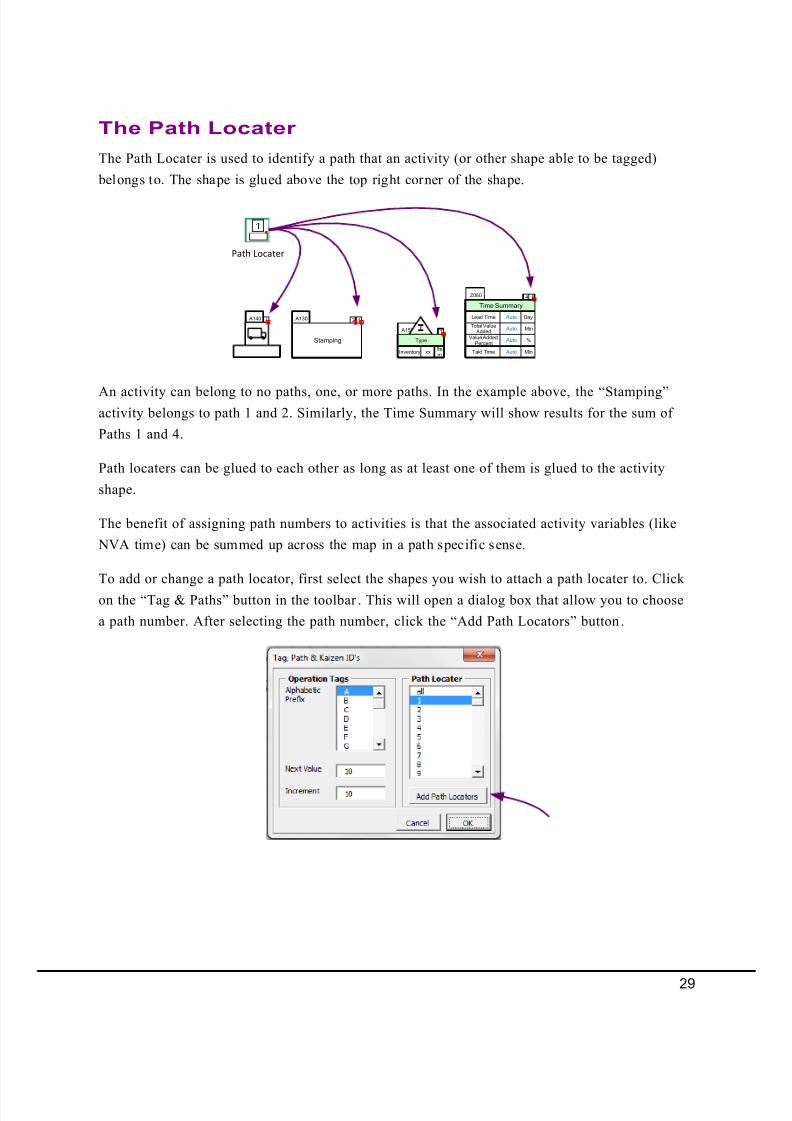
The Path Locater is used to identify a path that an activity (or other shape able to be tagged)
belongs to. The shape is glued above the top right corner of the shape.
Path Locater
Stamping
A130 2 1 A140 1
A150 1
Type
xxInventoryItem
AutoTakt Time Min
AutoTotal Value
AddedMin
AutoLead Time Day
AutoValue Added
Percent%
Z060
Time Summary
14
The Path Locater
An activity can belong to no paths, one, or more paths. In the example above, the “Stamping”activity belongs to path 1 and 2. Similarly, the Time Summary will show results for the sum of
Paths 1 and 4.
Path locaters can be glued to each other as long as at least one of them is glued to the activity
shape.
The benefit of assigning path numbers to activities is that the associated activity variables (like
NVA time) can be summed up across the map in a path specific sense.
To add or change a path locator, first select the shapes you wish to attach a path locater to. Click
on the “Tag & Paths” button in the toolbar . This will open a dialog box that allow you to choose
a path number. After selecting the path number, click the “Add Path Locators” button.
29
8/13/2019 PocketBook VSM
http://slidepdf.com/reader/full/pocketbook-vsm 32/93
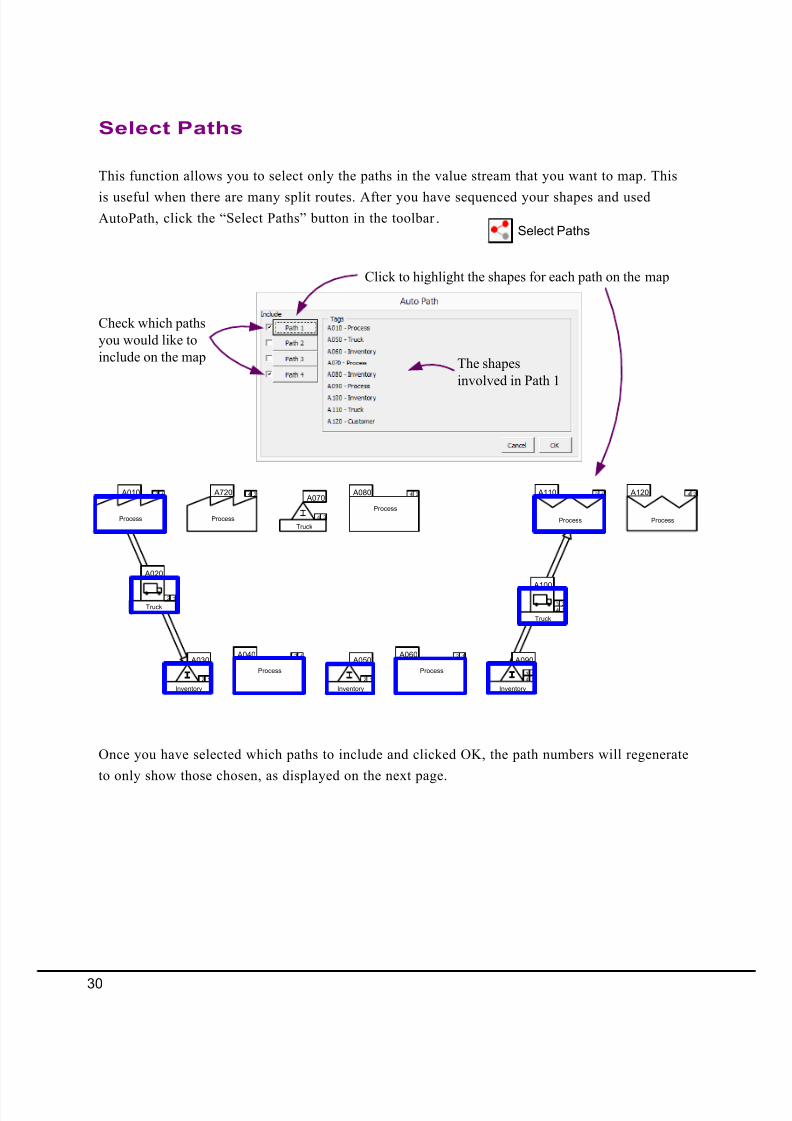
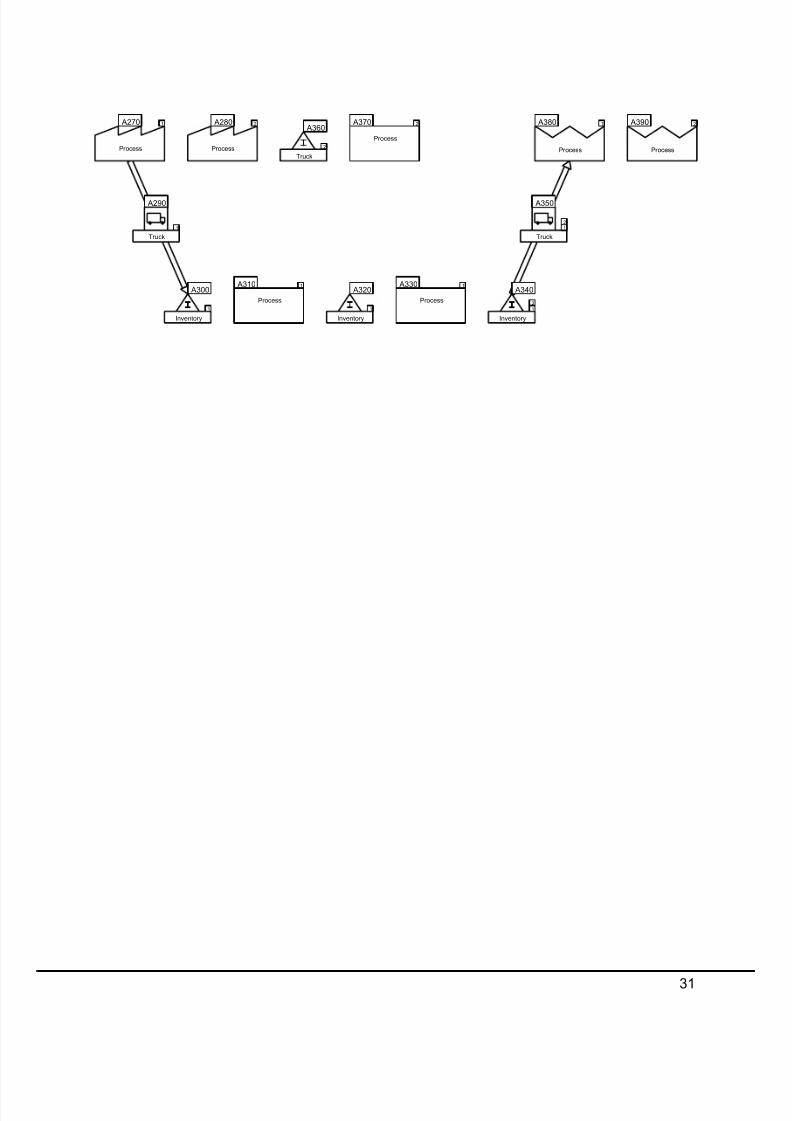
Select Paths
This function allows you to select only the paths in the value stream that you want to map. This
is useful when there are many split routes. After you have sequenced your shapes and usedAutoPath, click the “Select Paths” button in the toolbar .
Once you have selected which paths to include and clicked OK, the path numbers will regenerate
to only show those chosen, as displayed on the next page.
Click to highlight the shapes for each path on the map
Check which paths
you would like to
include on the map The shapes
involved in Path 1
Process Process
Process
Process Process
Inventory
Process
Inventory
Process
Inventory
Truck
Truck
Truck
A010 A720
A020
A030 A040
A050 A060
A090
A100
A070 A080 A110 A12012
12
12
12
12
12
34
34
34
14
14
23
23
13 24
Select Paths
30
8/13/2019 PocketBook VSM
http://slidepdf.com/reader/full/pocketbook-vsm 33/93
Process Process
Process
Process Process
Inventory
Process
Inventory
Process
Inventory
Truck
Truck
A270 A280
A290
A300 A310
A320 A330
A340
A350
A360 A370 A380 A3901
1
1
1
1
1
2
2
1
1
1 2
2
2
2
Truck
31
8/13/2019 PocketBook VSM
http://slidepdf.com/reader/full/pocketbook-vsm 34/93
Validate
Overview
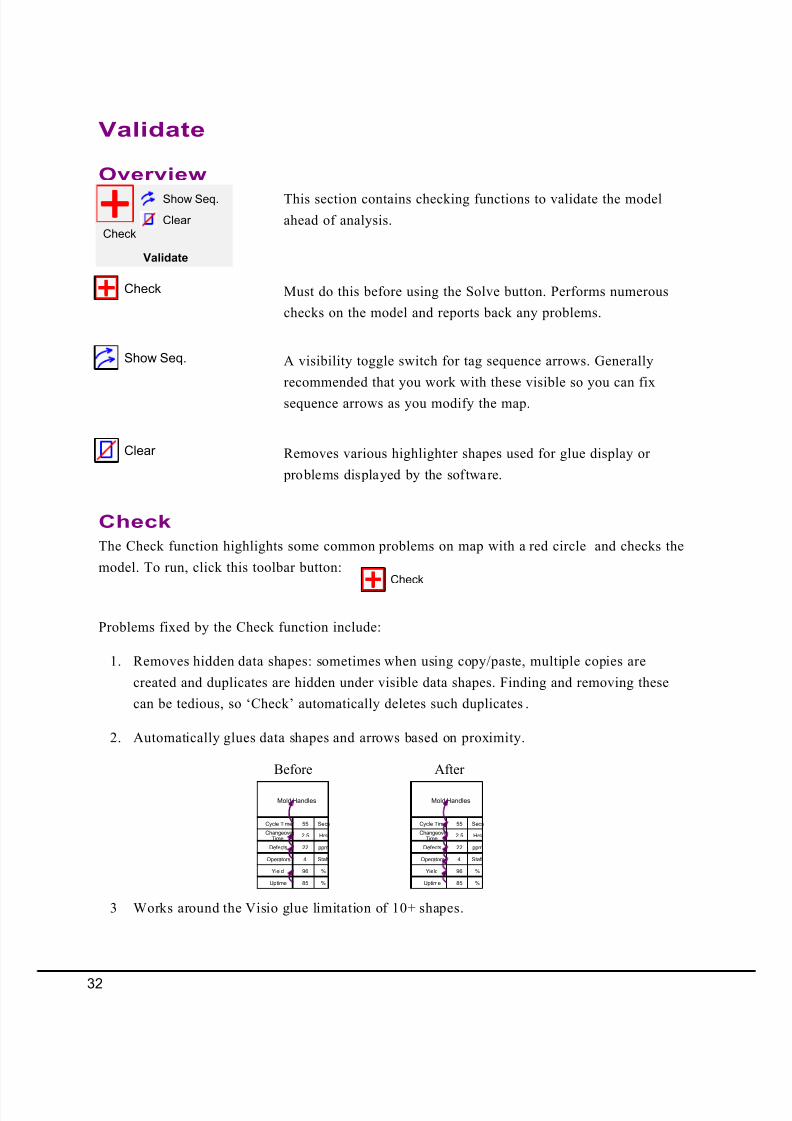
Must do this before using the Solve button. Performs numerous
checks on the model and reports back any problems.
A visibility toggle switch for tag sequence arrows. Generally
recommended that you work with these visible so you can fix
sequence arrows as you modify the map.
Removes various highlighter shapes used for glue display or
problems displayed by the software.
This section contains checking functions to validate the model
ahead of analysis.
Check
Show Seq.
Clear
Check
Show Seq.
Clear
Validate
The Check function highlights some common problems on map with a red circle and checks the
model. To run, click this toolbar button:
Problems fixed by the Check function include:
1. Removes hidden data shapes: sometimes when using copy/paste, multiple copies are
created and duplicates are hidden under visible data shapes. Finding and removing these
can be tedious, so ‘Check’ automatically deletes such duplicates .
2. Automatically glues data shapes and arrows based on proximity.
3 Works around the Visio glue limitation of 10+ shapes.
Check
Check
Mold Handles
55Cycle Time Secs
2.5Changeover
TimeHrs
22Defects ppm
4Operators Staff
96Yield %
85Uptime %
Mold Handles
55Cycle Time Secs
2.5Changeover
TimeHrs
22Defects ppm
4Operators Staff
96Yield %
85Uptime %
Before After
32
8/13/2019 PocketBook VSM
http://slidepdf.com/reader/full/pocketbook-vsm 35/93
Missing Data: Data Shapes which are not properly associated to Rowmaker Shapes (via gluing)
will be missed in the data transfer and are highlighted.
Missing Units Converter: If a variable is used with more then one unit (eg. Cycle time in
minutes and seconds), then a units conversion factor must be provided. Standard time units (e.g.
sec, min, hr, day) are already included in the time center and don’t require a units converter .
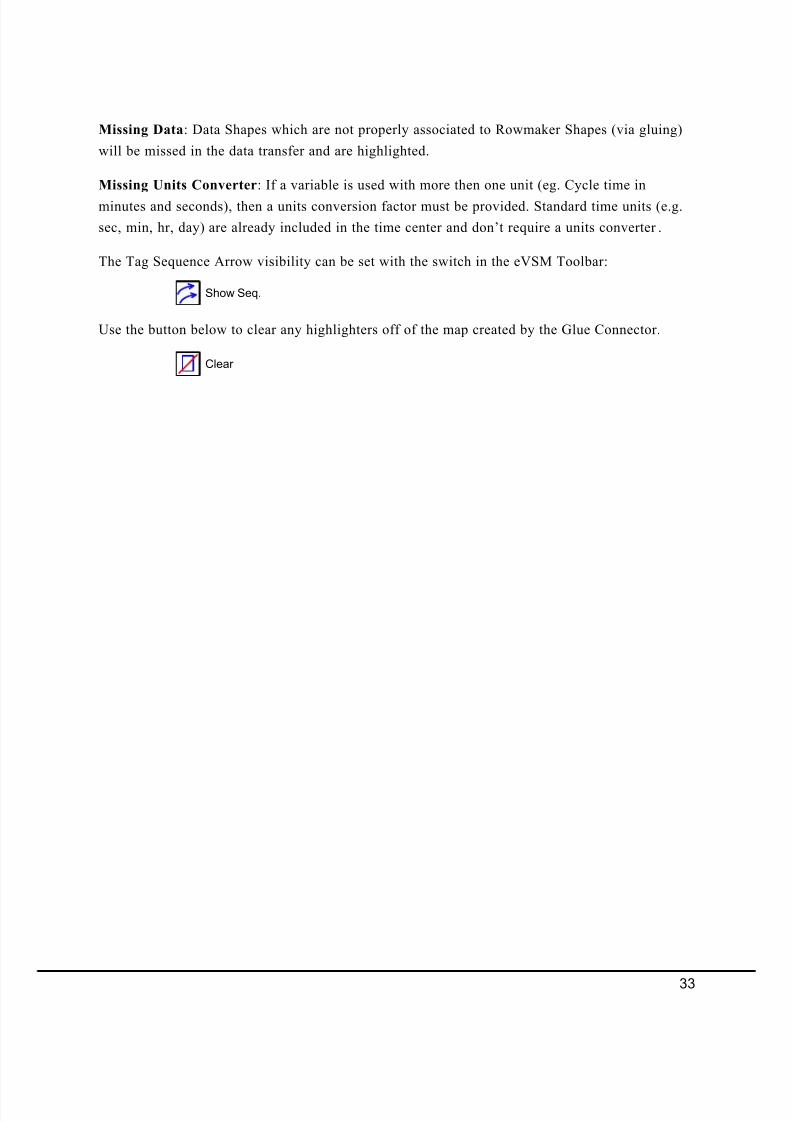
The Tag Sequence Arrow visibility can be set with the switch in the eVSM Toolbar:
Use the button below to clear any highlighters off of the map created by the Glue Connector.
Show Seq.
Clear
33
8/13/2019 PocketBook VSM
http://slidepdf.com/reader/full/pocketbook-vsm 36/93
Calculate
Overview
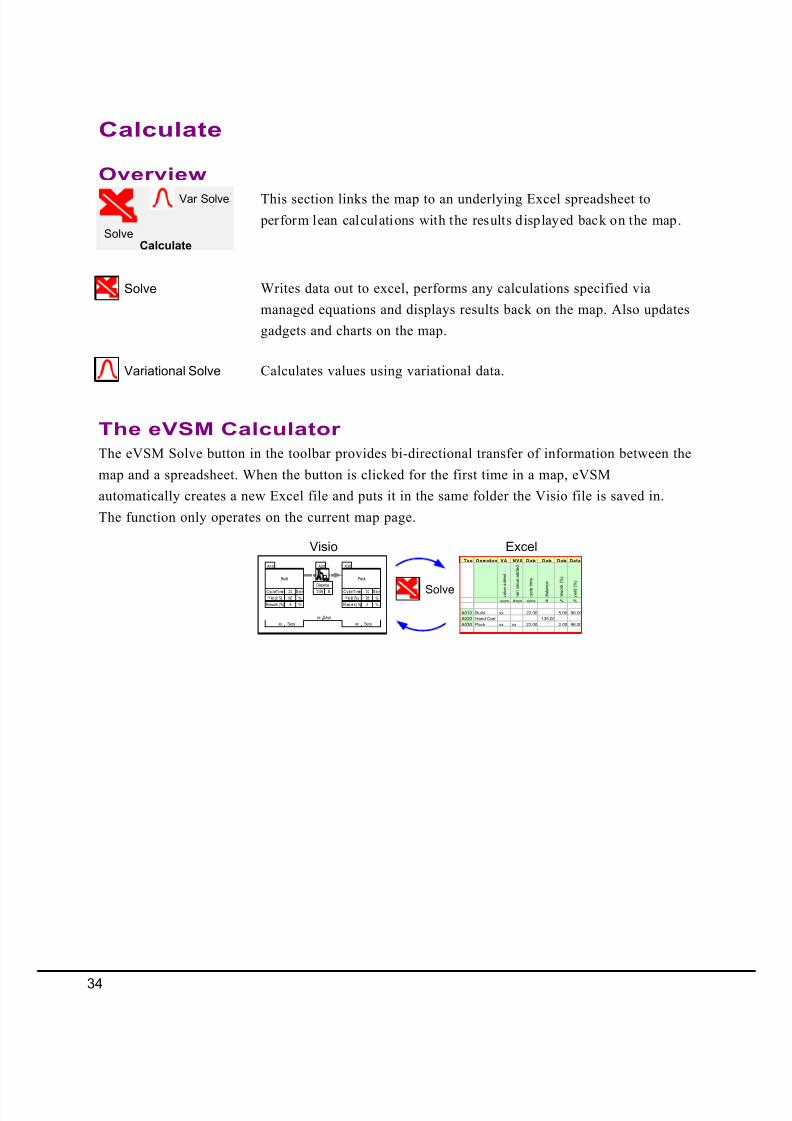
Writes data out to excel, performs any calculations specified via
managed equations and displays results back on the map. Also updates
gadgets and charts on the map.
This section links the map to an underlying Excel spreadsheet to
perform lean calculations with the results displayed back on the map.
Solve
Variational Solve Calculates values using variational data.
SolveCalculate
Var Solve
Tag Operation VA N VA D ata D ata D ata D at a
v a l u e a d d e d
n o n v a l u e a d d e d
c y c l e
t i m e
d i s t a
n c e
r e w o
r k ( % )
y i e l d
( % )
secs days secs ft % %
A010 Build xx 22.00 5.00 96.00
A020 Hand Cart 135.00
A030 Pack xx xx 22.00 2.00 96.00
Excel
Build
A10
22Cyc le Time Secs
96Y iel d ( %) %
Pack
22Cycle Time Secs
96Y ie ld (%) %
A30 A20
135
Distance
ft
5Rework (%) % 2R ew or k ( %) %
xx Days
xx Secs xx Secs
Visio
The eVSM Solve button in the toolbar provides bi-directional transfer of information between the
map and a spreadsheet. When the button is clicked for the first time in a map, eVSM
automatically creates a new Excel file and puts it in the same folder the Visio file is saved in.
The function only operates on the current map page.
The eVSM Calculator
Solve
34
8/13/2019 PocketBook VSM
http://slidepdf.com/reader/full/pocketbook-vsm 37/93
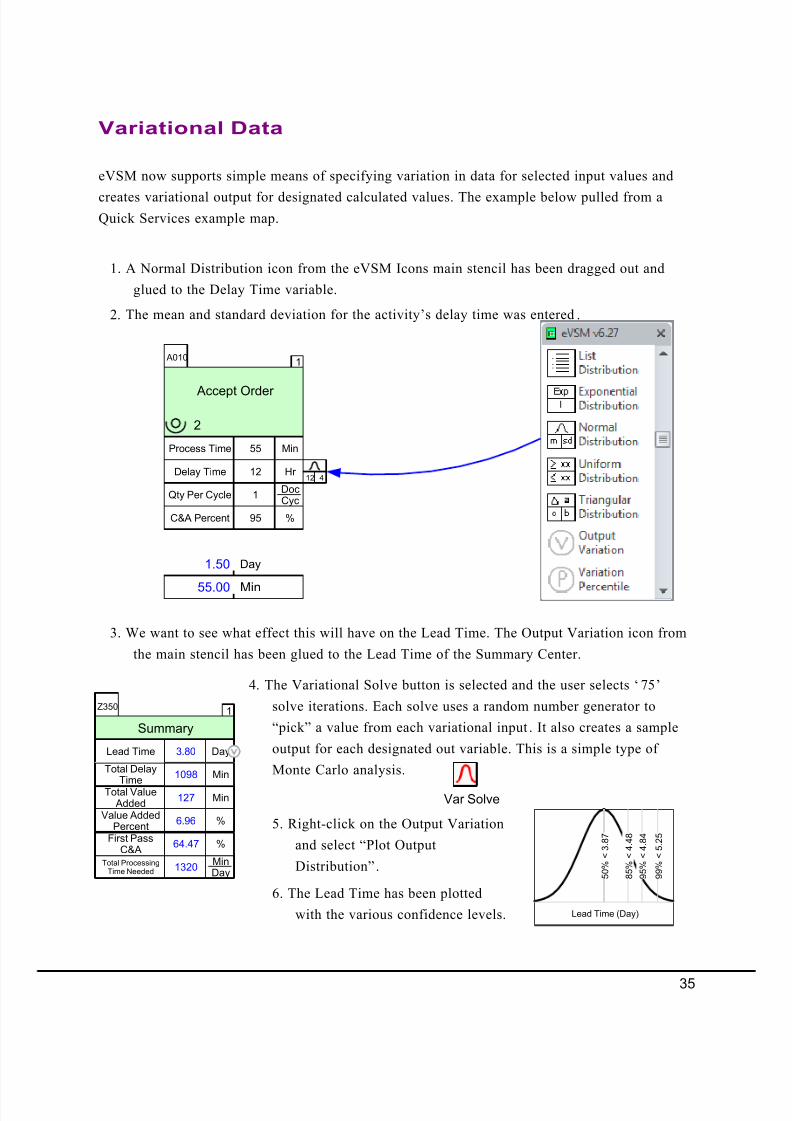
eVSM now supports simple means of specifying variation in data for selected input values and
creates variational output for designated calculated values. The example below pulled from aQuick Services example map.
Process Time Min55
Qty Per CycleDocCyc
1
A010
Delay Time Hr 12
C&A Percent %95
Accept Order
2
1
412
Min55.00
Day1.50
1. A Normal Distribution icon from the eVSM Icons main stencil has been dragged out and
glued to the Delay Time variable.
2. The mean and standard deviation for the activity’s delay time was entered.
3. We want to see what effect this will have on the Lead Time. The Output Variation icon from
the main stencil has been glued to the Lead Time of the Summary Center.
1
Summary
Total Value Added
Min127
Lead Time Day3.80
Value AddedPercent
%6.96
Z350
Total ProcessingTime Needed
MinDay
1320
Total DelayTime
Min1098
First PassC&A
%64.47
4. The Variational Solve button is selected and the user selects ‘75’
solve iterations. Each solve uses a random number generator to
“pick” a value from each variational input. It also creates a sample
output for each designated out variable. This is a simple type of
Monte Carlo analysis.
Var Solve
5. Right-click on the Output Variation
and select “Plot Output
Distribution”.
Lead Time (Day)
5 0 %
< 3 . 8
7
8 5 %
< 4 . 4
8
9 5 %
< 4 . 8
4
9 9 %
< 5 . 2
5
6. The Lead Time has been plotted
with the various confidence levels.
Variational Data
35
8/13/2019 PocketBook VSM
http://slidepdf.com/reader/full/pocketbook-vsm 38/93
Visualize
Overview
Allows management of gadget families providing geometric views of
key numbers of the map with color coding, scale factors and hide/
show.Updates all the geometric gadgets based on the current map values.
The view capability simplifies maps with better utilization of map
space. Also allows the visualization of the numbers using gadgets and
charts.
Gadgets
Update
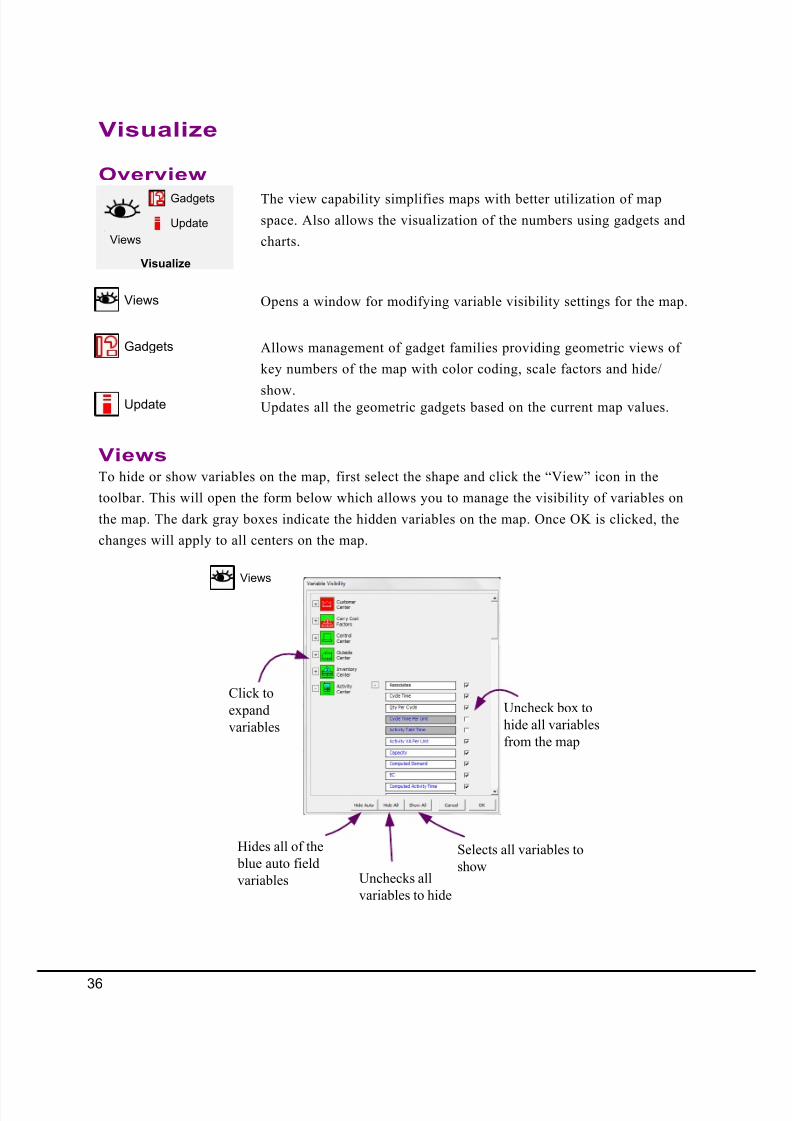
Views Opens a window for modifying variable visibility settings for the map.
Visualize
Update
Views
Gadgets
ViewsTo hide or show variables on the map, first select the shape and click the “View” icon in the
toolbar. This will open the form below which allows you to manage the visibility of variables on
the map. The dark gray boxes indicate the hidden variables on the map. Once OK is clicked, the
changes will apply to all centers on the map.
Uncheck box to
hide all variables
from the map
Hides all of the
blue auto field
variables Unchecks all
variables to hide
Selects all variables to
show
Click to
expand
variables
Views
36
8/13/2019 PocketBook VSM
http://slidepdf.com/reader/full/pocketbook-vsm 39/93
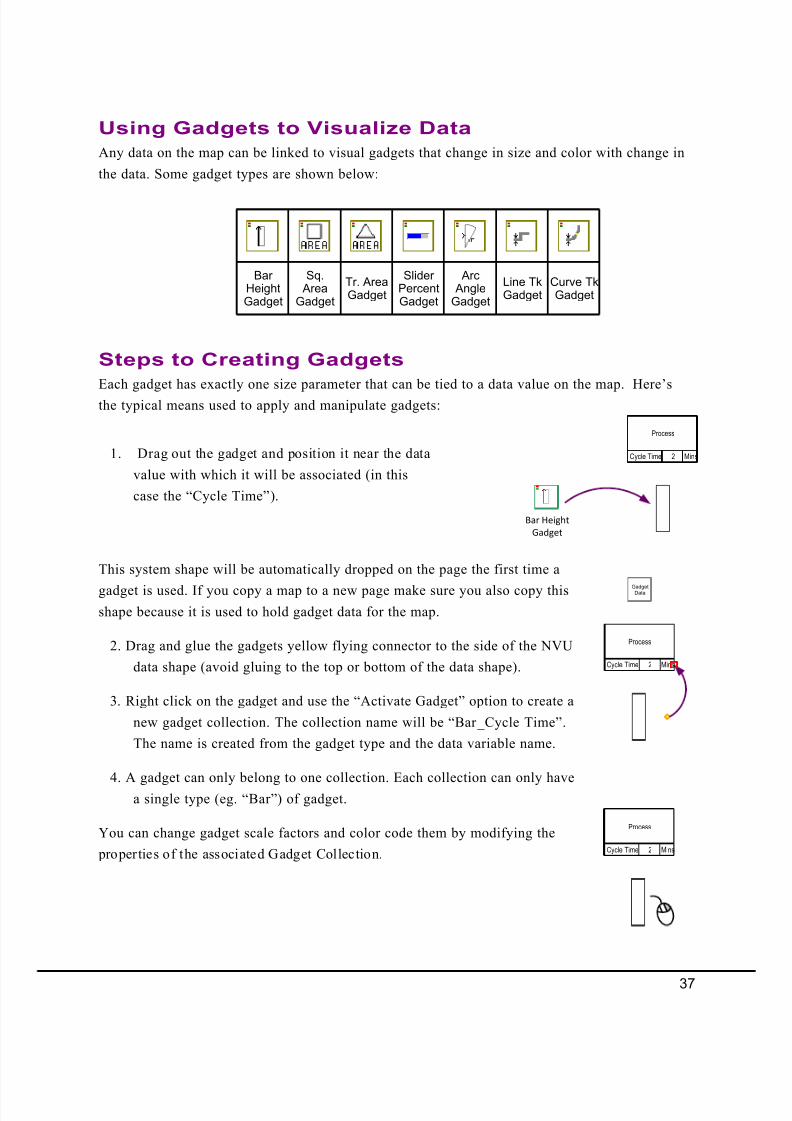
Any data on the map can be linked to visual gadgets that change in size and color with change in
the data. Some gadget types are shown below:
Sq. Area
Gadget
Tr. AreaGadget
SliderPercentGadget
Arc AngleGadget
Line TkGadget
BarHeightGadget
Curve TkGadget
Using Gadgets to Visualize Data
Each gadget has exactly one size parameter that can be tied to a data value on the map. Here’s
the typical means used to apply and manipulate gadgets:
1. Drag out the gadget and position it near the data
value with which it will be associated (in this
case the “Cycle Time”).
Steps to Creating Gadgets
Bar Height
Gadget
Process
2Cycle Time Mins
This system shape will be automatically dropped on the page the first time a
gadget is used. If you copy a map to a new page make sure you also copy thisshape because it is used to hold gadget data for the map.
2. Drag and glue the gadgets yellow flying connector to the side of the NVU
data shape (avoid gluing to the top or bottom of the data shape).
3. Right click on the gadget and use the “Activate Gadget” option to create a
new gadget collection. The collection name will be “Bar _ Cycle Time”.
The name is created from the gadget type and the data variable name.
4. A gadget can only belong to one collection. Each collection can only have
a single type (eg. “Bar”) of gadget.
You can change gadget scale factors and color code them by modifying the
properties of the associated Gadget Collection.
Gadget
Data
Process
2Cycle Time Mins
Process
2Cycle Time Mins
37
8/13/2019 PocketBook VSM
http://slidepdf.com/reader/full/pocketbook-vsm 40/93
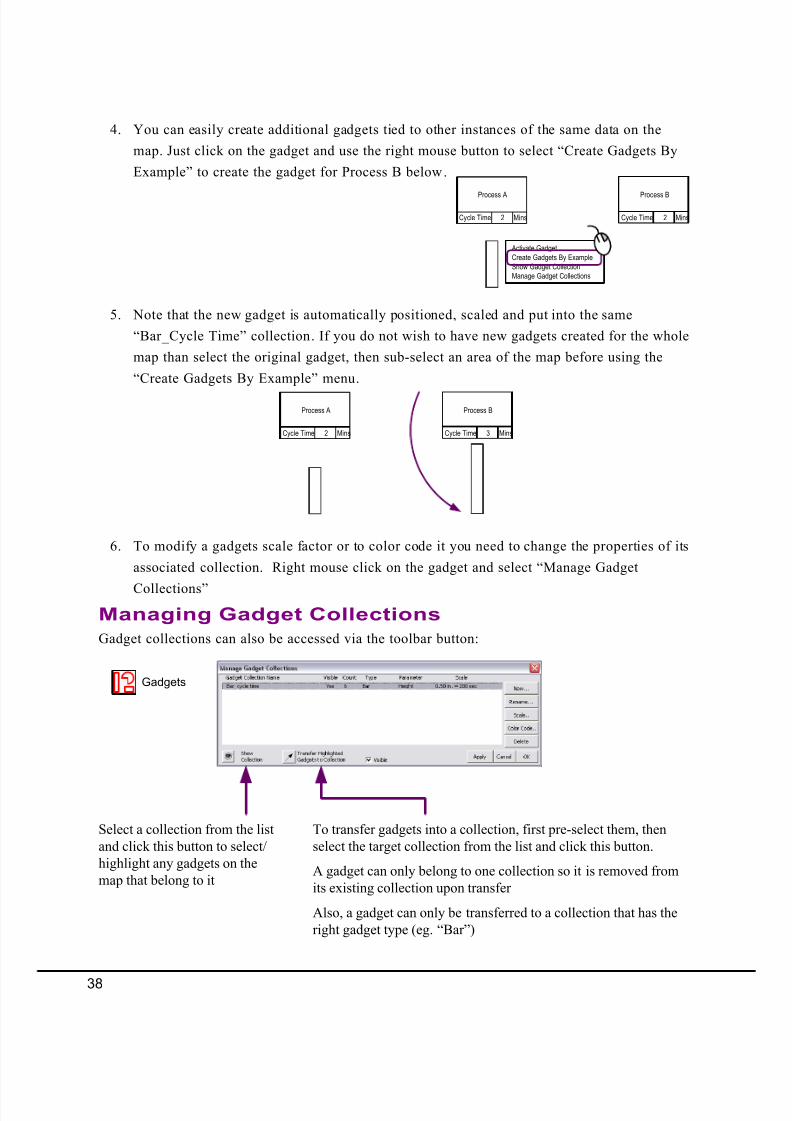
4. You can easily create additional gadgets tied to other instances of the same data on the
map. Just click on the gadget and use the right mouse button to select “Create Gadgets By
Example” to create the gadget for Process B below.
Activate GadgetCreate Gadgets By ExampleShow Gadget CollectionManage Gadget Collections
Process A Process B
2Cycle Time Mins 2Cycle Time Mins
5. Note that the new gadget is automatically positioned, scaled and put into the same
“Bar _ Cycle Time” collection. If you do not wish to have new gadgets created for the whole
map than select the original gadget, then sub-select an area of the map before using the
“Create Gadgets By Example” menu.
Process A
2Cycle Time Mins
Process B
3Cycle Time Mins
6. To modify a gadgets scale factor or to color code it you need to change the properties of its
associated collection. Right mouse click on the gadget and select “Manage Gadget
Collections”
To transfer gadgets into a collection, first pre-select them, then
select the target collection from the list and click this button.
A gadget can only belong to one collection so it is removed from
its existing collection upon transfer
Also, a gadget can only be transferred to a collection that has the
right gadget type (eg. “Bar”)
Select a collection from the list
and click this button to select/
highlight any gadgets on the
map that belong to it
Gadget collections can also be accessed via the toolbar button:
Managing Gadget Collections
Gadgets
38
8/13/2019 PocketBook VSM
http://slidepdf.com/reader/full/pocketbook-vsm 41/93
You can color code the
gadget fill and font
colors based on the value
of the data to which the
gadget is glued. You can
also simply “inherit” the
color from the data shape
or assign a color to a
gadget manually.
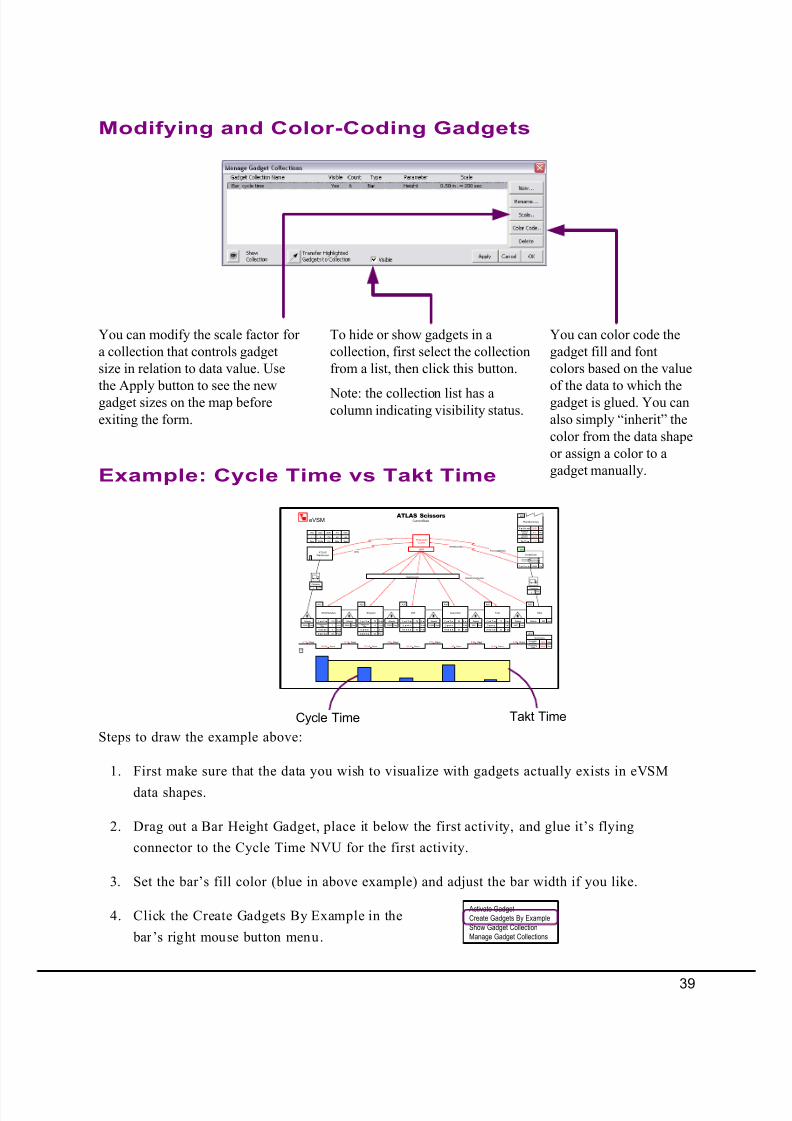
You can modify the scale factor for
a collection that controls gadget
size in relation to data value. Use
the Apply button to see the new
gadget sizes on the map before
exiting the form.
To hide or show gadgets in a
collection, first select the collection
from a list, then click this button.
Note: the collection list has acolumn indicating visibility status.
Modifying and Color-Coding Gadgets
Example: Cycle Time vs Takt Time
Steps to draw the example above:
1. First make sure that the data you wish to visualize with gadgets actually exists in eVSM
data shapes.
2. Drag out a Bar Height Gadget, place it below the first activity, and glue it’s flying
connector to the Cycle Time NVU for the first activity.
3. Set the bar’s fill color (blue in above example) and adjust the bar width if you like.
4. Click the Create Gadgets By Example in the
bar’s right mouse button menu.
DailyShipSchedule
Sharpen
75C yc le Ti me S ec s
15Changeover
TimeHrs
1O per at or s S ta ff
50B at ch Si ze P ai rs
75.00 Secs
2.14 Days
38500
Scissors
Pairs
MoldHandles
130C yc le Ti me S ec s
Name
UnitData
2Changeover
TimeHrs
2O pe ra to rs S ta ff
50B at ch Si ze P ai rs
130.00 Secs
4.17 Days
75000
Scissors
Pairs
Drill
20C yc le Ti me S ec s
1O pe ra to rs S ta ff
50B at ch Si ze P ai rs
20.00 Secs
1.50 Days
27000
Scissors
Pairs
Assemble
85C yc le Ti me S ec s
1O pe ra to rs S ta ff
50B at ch Si ze P ai rs
85 Secs
1.72 Days
31000
Scissors
Pairs
Test
10C yc le Ti me S ec s
1O pe ra to rs S ta ff
50B at ch Si ze P ai rs
10.00 Secs
0.39 Days
7000
Scissors
Pairs
Ship
500Defects ppm
0.28 Days
5000
Scissors
Pairs
18000D ai ly D em an d P ai rs
CrossDock ATLAS
Warehouse
5
Frequency
Per
Week5
Frequency
Per Week
MRP
ProductionControl
Forecast30days
WeeklyOrder
Daily
Daily
WeeklySchedule
Summary
10.19ProductionLeadTime
Days
265.00ProcessingTime
Secs
A10 A20 A30 A40 A50 A60
A70
B10
PlantSummary
62.50R aw M at er ia ls H rs
4.17FinishedGoods
Hrs
86.25WorkinProgress Hrs
110Tak tTi me Secs
B20
5
Wks
Days
2
Days
Shifts
7.5
Shifts
Hrs
60
Hrs
Mins
60
Mins
Secs
eVSMATLAS Scissors
CurrentState
Takt TimeCycle Time
Activate GadgetCreate Gadgets By ExampleShow Gadget CollectionManage Gadget Collections
39
8/13/2019 PocketBook VSM
http://slidepdf.com/reader/full/pocketbook-vsm 42/93
Gadget Key Points
1. Gadgets have a single size parameter that will scale to the data value in which a gadget is
glued via the flying yellow connector.
2. Gadgets are typically glued to NVU, VA or NVA shapes. When gadgets in a
collection are glued to data shapes with different units, Units Converters are needed on the
map to compute the correct scale factors.
3. Gadgets have to belong to a collection. They can be put in a collection using the Activate
Gadget command or by transferring them into a collection via the Manage Gadgets
form.
4. Gadget scale factors and color coding can be controlled via the Manage Gadgets form.
5. An easy way to create a gadget “set” after creating a first gadget is to use the Create
Gadgets By Example in the right mouse button menu.
6. The Visible switch on the Manage Gadgets form is very useful in showing different metrics
on the map in a presentation environment.
7. See the “Examples” section on the eVSM help site (www.evsm.com/help) for usage
examples of the different gadget types.
8. A starter set of gadgets is provided with eVSM. Additional gadgets can be requested by
contacting [email protected].
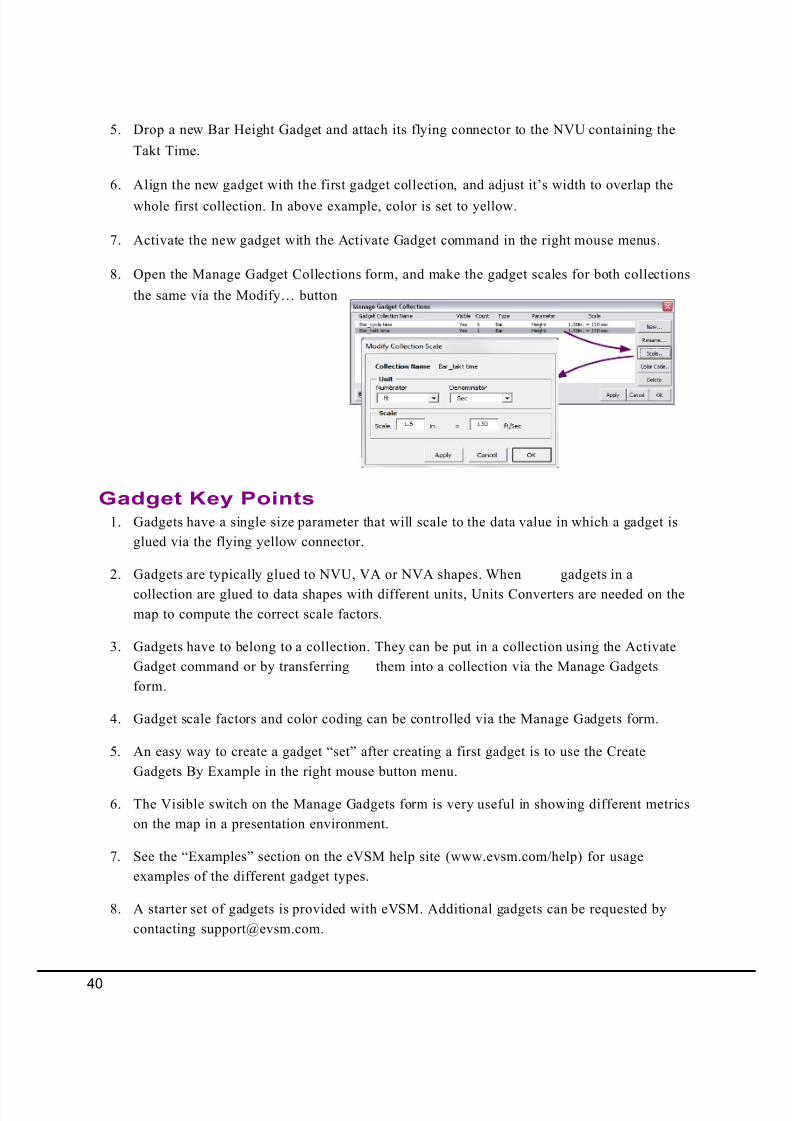
5. Drop a new Bar Height Gadget and attach its flying connector to the NVU containing the
Takt Time.
6. Align the new gadget with the first gadget collection, and adjust it’s width to overlap the
whole first collection. In above example, color is set to yellow.
7. Activate the new gadget with the Activate Gadget command in the right mouse menus.
8. Open the Manage Gadget Collections form, and make the gadget scales for both collections
the same via the Modify… button
40
8/13/2019 PocketBook VSM
http://slidepdf.com/reader/full/pocketbook-vsm 43/93
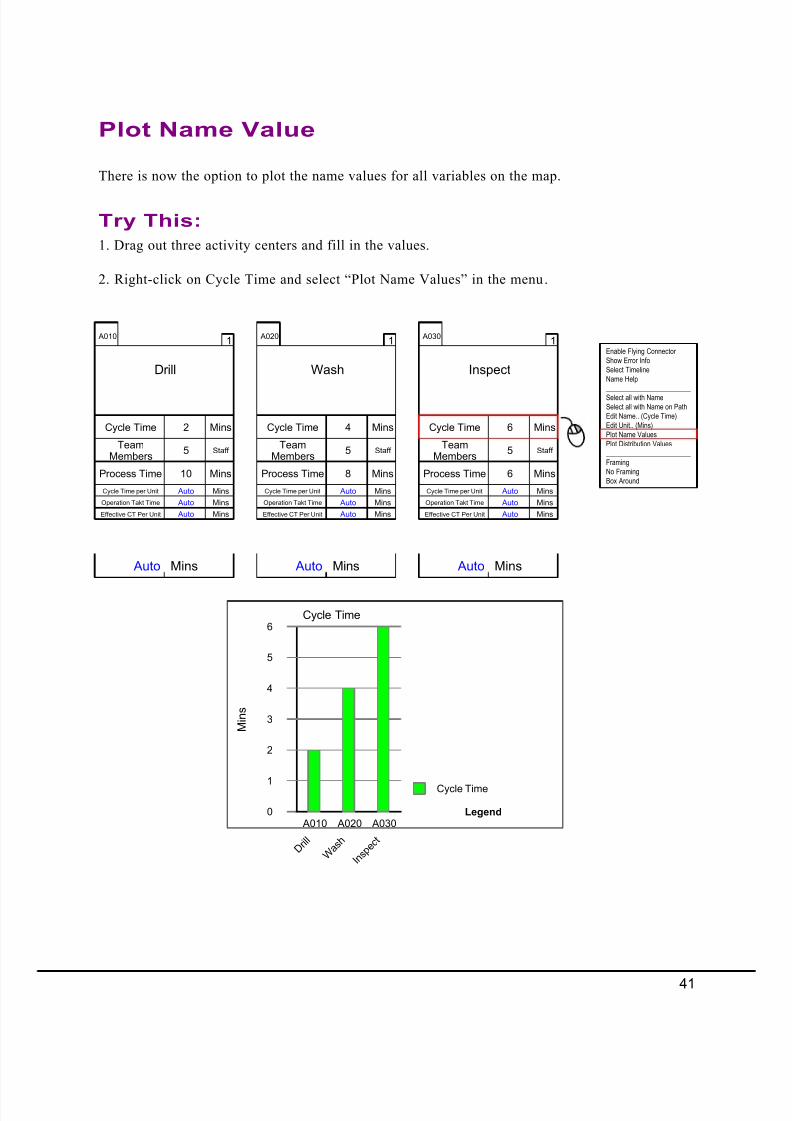
There is now the option to plot the name values for all variables on the map.
Plot Name Value
1
Operation Takt Time Mins Auto
Process Time Mins8
Cycle Time Mins4
TeamMembers
Staff 5
Cycle Time per Unit Mins Auto
Effective CT Per Unit Mins Auto
Mins Auto
Wash
A0201
Operation Takt Time Mins Auto
Process Time Mins10
Cycle Time Mins2
TeamMembers
Staff 5
Cycle Time per Unit Mins Auto
Effective CT Per Unit Mins Auto
Mins Auto
Drill
A0101
Operation Takt Time Mins Auto
Process Time Mins6
Cycle Time Mins6
TeamMembers
Staff 5
Cycle Time per Unit Mins Auto
Effective CT Per Unit Mins Auto
Mins Auto
Inspect
A030
Enable Flying Connector Show Error InfoSelect TimelineName Help ________________________Select all with NameSelect all with Name on PathEdit Name.. (Cycle Time)Edit Unit.. (Mins)Plot Name ValuesPlot Distribution Values ________________________FramingNo FramingBox Around
Try This:
1. Drag out three activity centers and fill in the values.
2. Right-click on Cycle Time and select “Plot Name Values” in the menu.
Cycle Time
M i n s
0
1
2
3
4
5
6
A010
D r i l l
A020
W a s h
A030
I n s p e
c t
Cycle Time
Legend
41
8/13/2019 PocketBook VSM
http://slidepdf.com/reader/full/pocketbook-vsm 44/93
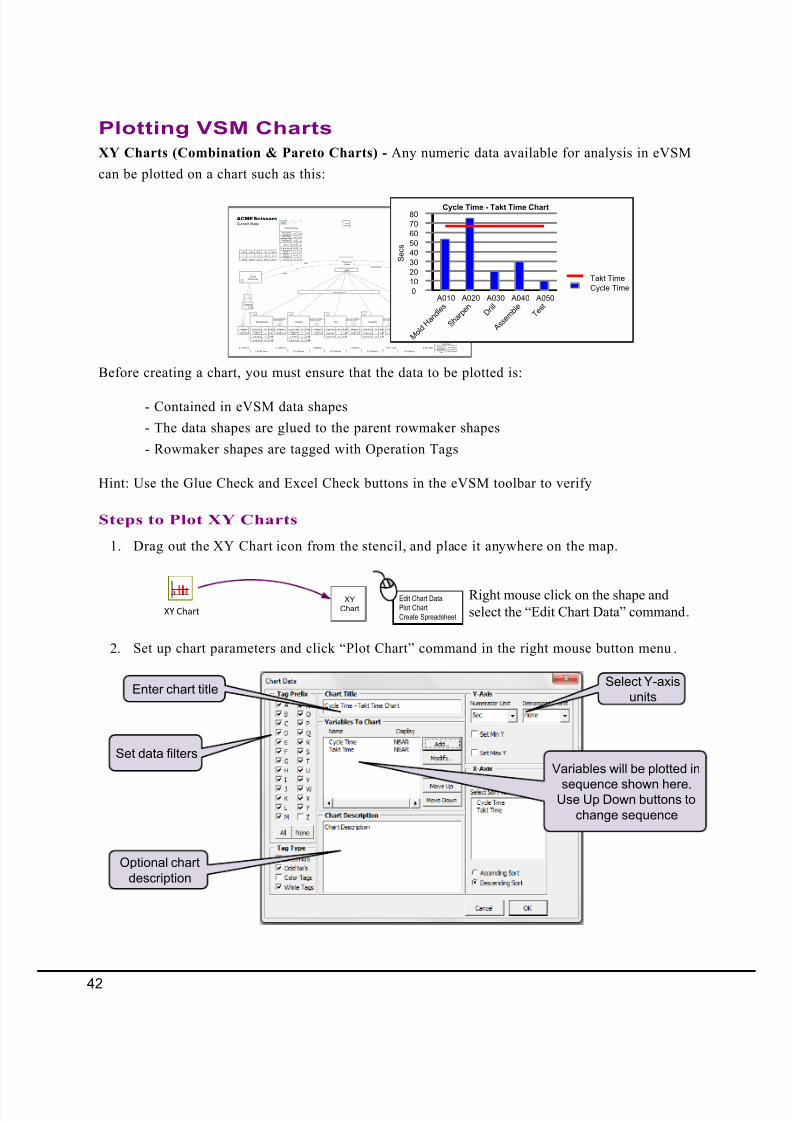
Plotting VSM Charts
XY Charts (Combination & Pareto Charts) - Any numeric data available for analysis in eVSM
can be plotted on a chart such as this:
Cross Dock
Assemble
30C yc le T im e S ec s
1O pe ra to rs S ta ff
50B at ch S iz e P ai rs
Test
10C yc le T im e S ec s
1O pe ra to rs S ta ff
50B at ch S iz e P ai rs
Ship
500Defects p pm
Drill
20C yc le Ti me S ec s
1O pe ra to rs S ta ff
50B at ch S iz e P ai rs
Sharpen
75C yc le Ti me S ec s
15Changeover
TimeHrs
1O pe ra to rs S ta ff
50B at ch S iz e P ai rs
MoldHandles
53C yc le Ti me S ec s
2Changeover
TimeHrs
2O pe ra to rs S ta ff
50B at ch S iz e P ai rs
38500
Scissors
Pairs 27000
Scissors
Pairs 31000
Scissors
Pairs 7000
Scissors
Pairs 5000
Scissors
Pairs75000
Scissors
Pairs
ATLAS
Warehouse
1
Frequency
PerWeek
1
Frequency
PerWeek
MRP
Production
Control
Forecast 30 DaysWeeklyOrder
Daily
Daily
130 .00 Secs
4 .17Days
75 .00Secs
2 .14Days
20 .00Secs
1 .50Days
30 .00Secs
1 .72Days
10 .00Secs
0.39 Days 0.28 Days
WeeklySchedule
Summary
18000D ai ly D em an d P ai r s
10.19ProductionLeadTime
Days
265.00Processing
TimeSecs
Daily ShipSchedule
5
Wks
Days
2
Days
Shifts
7.5
Shifts
Hrs
60
Hrs
Mins
60
Mins
Secs
Plant Summary
2.00Noof Shifts
per DayShifts
5.00Noof Work
Daysper WkDays
15.00ProductionHrs
per DayHrs
500.00Defects ppm
62.50R aw M at er i al s H rs
4.17FinishedGoods
Hrs
86.25Work in
ProgressHrs
67T ak t T im e S ec s
A10 A20 A30 A40 A50 A60
A70
B10
B20
ACME ScissorsCurrent State Chart
Maker
Cycle Time - Takt Time Chart
S e c s
0
10
20
30
40
50
60
70
80
A010
M o l d H a
n d l e s
A020
S h a r p e n
A030
D r i l l
A040
A s s e m b l e
A050
T e s t
Cycle Time
Takt Time
Before creating a chart, you must ensure that the data to be plotted is:
- Contained in eVSM data shapes
- The data shapes are glued to the parent rowmaker shapes
- Rowmaker shapes are tagged with Operation Tags
Hint: Use the Glue Check and Excel Check buttons in the eVSM toolbar to verify
1. Drag out the XY Chart icon from the stencil, and place it anywhere on the map.
2. Set up chart parameters and click “Plot Chart” command in the right mouse button menu.
XY Chart
XY
Chart
Edit Chart DataPlot ChartCreate Spreadsheet
Right mouse click on the shape andselect the “Edit Chart Data” command.
Steps to Plot XY Charts
Select data
variables (eg.
Cycle Time) to plot
Set data filters
Enter chart titleSelect Y-axis
units
Optional chart
description
Variables will be plotted in
sequence shown here.Use Up Down buttons to
change sequence
42
8/13/2019 PocketBook VSM
http://slidepdf.com/reader/full/pocketbook-vsm 45/93
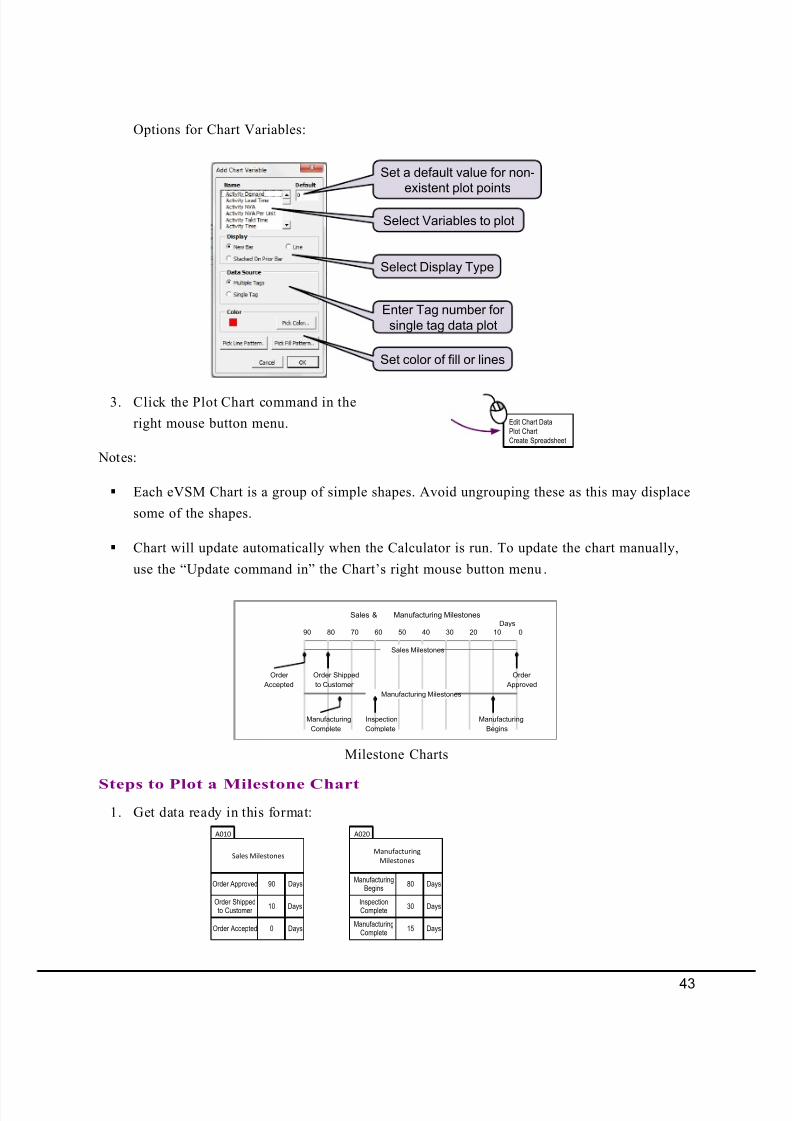
Options for Chart Variables:
3. Click the Plot Chart command in the
right mouse button menu.
Notes:
§ Each eVSM Chart is a group of simple shapes. Avoid ungrouping these as this may displace
some of the shapes.
§ Chart will update automatically when the Calculator is run. To update the chart manually,
use the “Update command in” the Chart’s right mouse button menu.
Edit Chart DataPlot ChartCreate Spreadsheet
Set a default value for non-
existent plot points
Select Variables to plot
Select Display Type
Enter Tag number for
single tag data plot
Set color of fill or lines
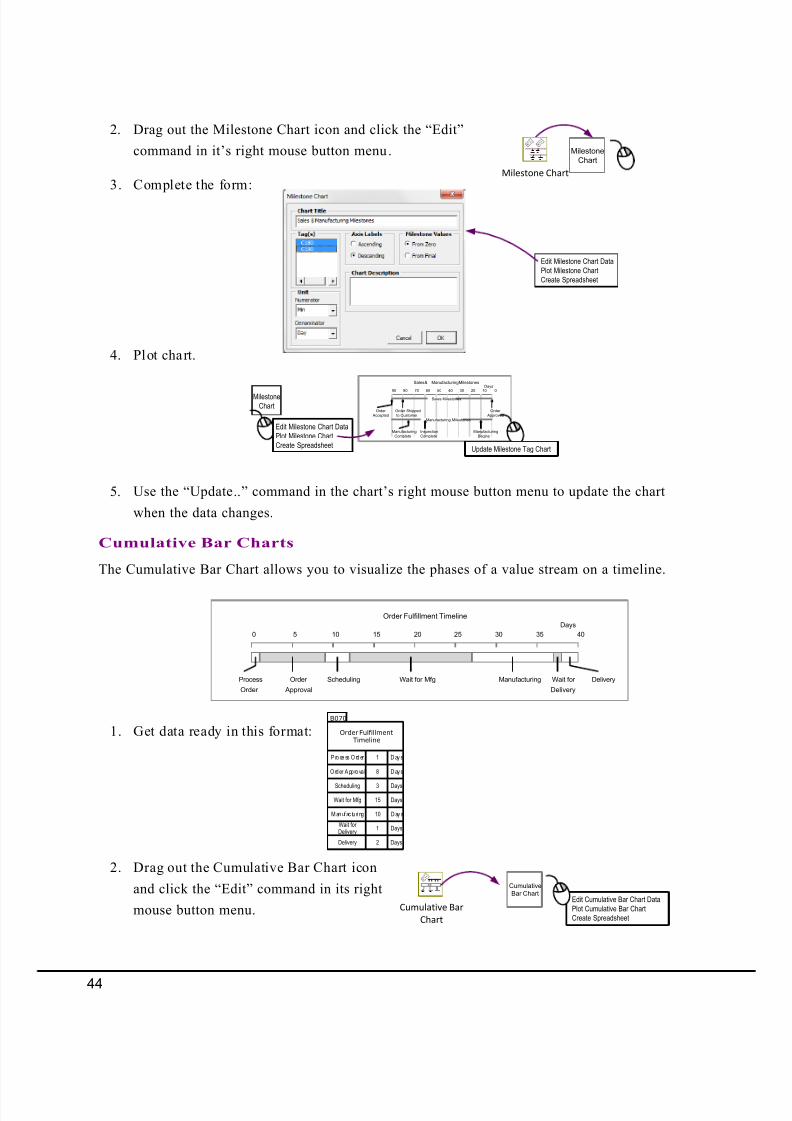
Sales Milestones
90Order Approved Days
10Order Shippedto Customer
Days
0Order Accepted Days
A010
Manufacturing
Milestones
80Manufacturing
BeginsDays
30InspectionComplete
Days
15Manufacturing
CompleteDays
A020
Milestone Charts
Steps to Plot a Milestone Chart
Sales & Manufacturing MilestonesDays
90 80 70 60 50 40 30 20 10 0
Sales Milestones
Manufacturing Milestones
Order
Approved
Order Shipped
to Customer
Order
Accepted
Manufacturing
Begins
Inspection
Complete
Manufacturing
Complete
1. Get data ready in this format:
43
8/13/2019 PocketBook VSM
http://slidepdf.com/reader/full/pocketbook-vsm 46/93
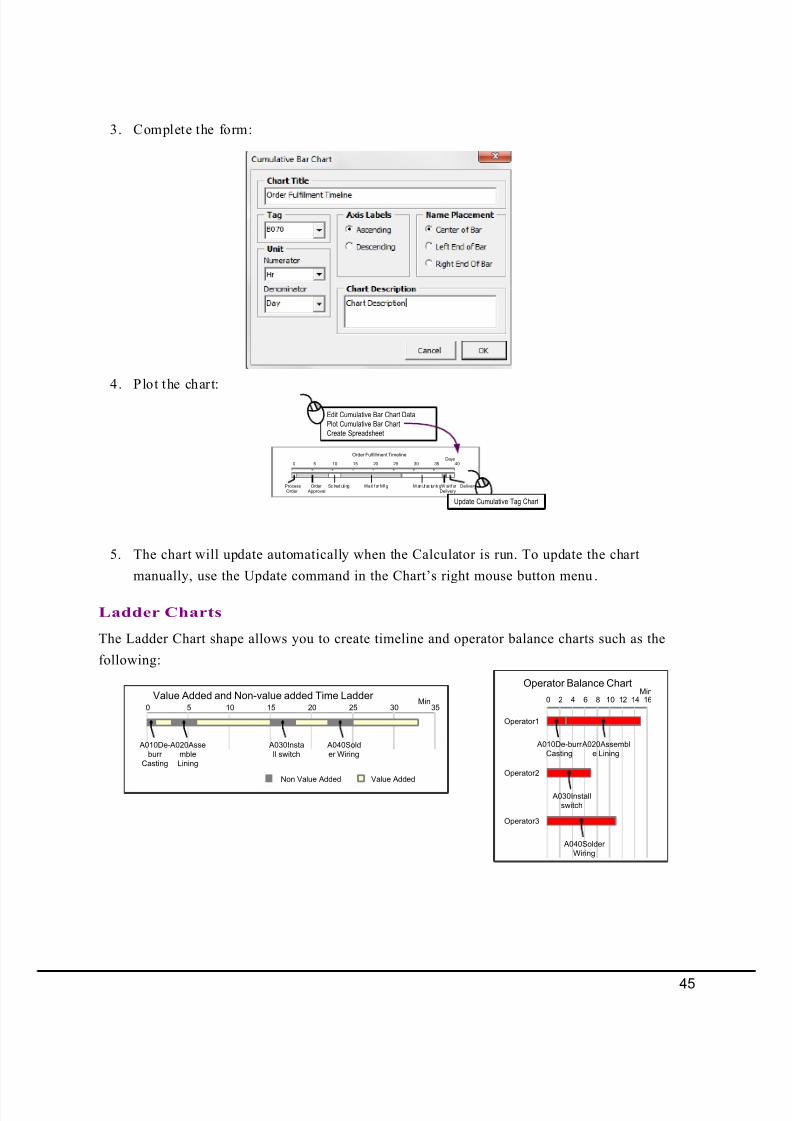
2. Drag out the Milestone Chart icon and click the “Edit”
command in it’s right mouse button menu.
3. Complete the form:
4. Plot chart.
5. Use the “Update..” command in the chart’s right mouse button menu to update the chart
when the data changes.
Sales & Manufacturing MilestonesDays
90 80 70 60 50 40 30 20 10 0
Sales Milestones
Manufacturing Milestones
Order Approved
Order Shippedto Customer
Order Accepted
ManufacturingBegins
InspectionComplete
ManufacturingComplete
Update Milestone Tag Chart
MilestoneChart
Edit Milestone Chart DataPlot Milestone ChartCreate Spreadsheet
Edit Milestone Chart DataPlot Milestone ChartCreate Spreadsheet
Milestone
Chart
Milestone Chart
Cumulative Bar Charts
The Cumulative Bar Chart allows you to visualize the phases of a value stream on a timeline.
Order Fulfillment Timeline
Days
0 5 10 15 20 25 30 35 40
Process
Order
Order
Approval
Scheduling Wait for Mfg Manufacturing Wait for
Delivery
Delivery
1. Get data ready in this format:
2. Drag out the Cumulative Bar Chart icon
and click the “Edit” command in its right
mouse button menu.
Cumulative
Bar ChartEdit Cumulative Bar Chart DataPlot Cumulative Bar ChartCreate Spreadsheet
Cumulative Bar
Chart
Order Fulfillment
Timeline
1P ro ce ss O rd er D ay s
8O rder A pprova l Day s
3Scheduling Days
15Wait for Mfg Days
10M an uf ac tu ri ng D ay s
1Wait forDelivery
Days
2Delivery Days
B070
44
8/13/2019 PocketBook VSM
http://slidepdf.com/reader/full/pocketbook-vsm 47/93
4. Plot the chart:
5. The chart will update automatically when the Calculator is run. To update the chart
manually, use the Update command in the Chart’s right mouse button menu.
Order Fulfillment TimelineDays
0 5 10 15 20 25 30 35 40
ProcessOrder
Order Approval
Sc hed uli ng Wa it f or Mf g M an uf ac tur in gW ai t f orDelivery
Delivery
Update Cumulative Tag Chart
Edit Cumulative Bar Chart DataPlot Cumulative Bar ChartCreate Spreadsheet
Ladder Charts
The Ladder Chart shape allows you to create timeline and operator balance charts such as the
following:
Operator Balance ChartMin
0 2 4 6 8 10 12 14 16
A010De-burr
Casting
Operator1
A020Assembl
e Lining
A030Install
switch
Operator2
A040Solder
Wiring
Operator3
Value Added and Non-value added Time Ladder Min
0 5 10 15 20 25 30 35
A010De-
burr
Casting
A020Asse
mble
Lining
A030Insta
ll switch
A040Sold
er Wiring
Non Value Added Value Added
3. Complete the form:
45
8/13/2019 PocketBook VSM
http://slidepdf.com/reader/full/pocketbook-vsm 48/93
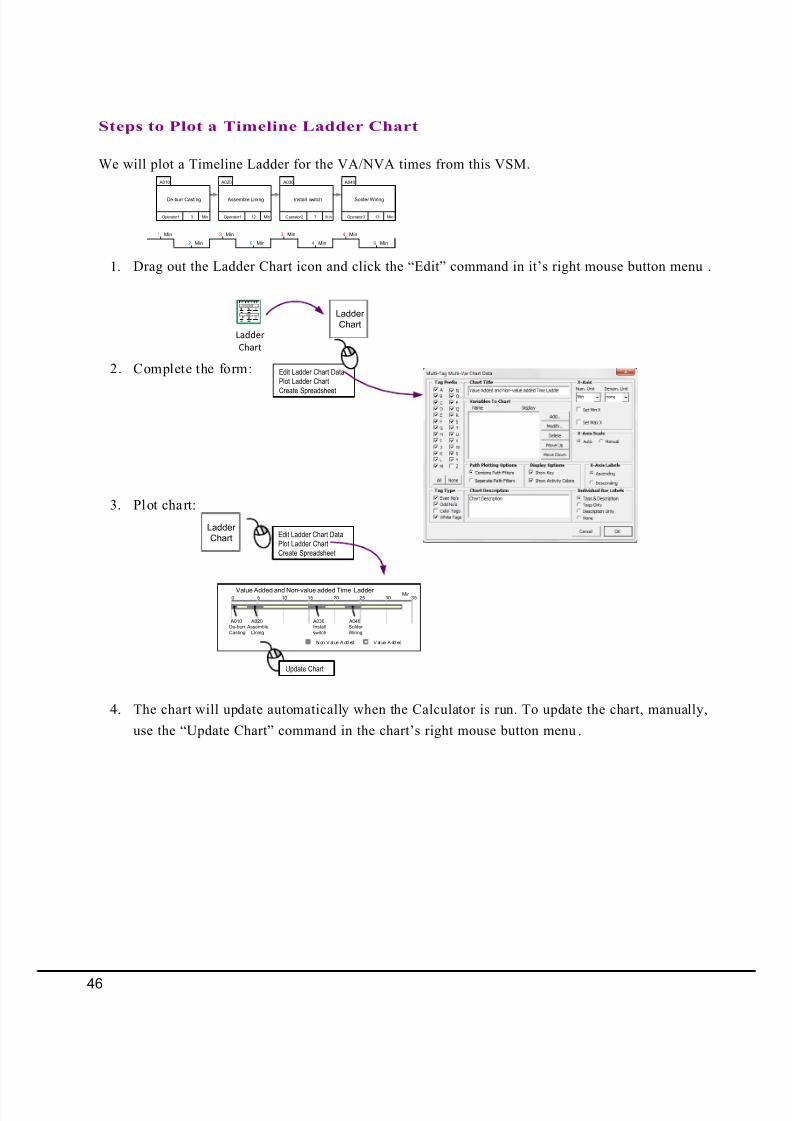
Steps to Plot a Timeline Ladder Chart
We will plot a Timeline Ladder for the VA/NVA times from this VSM.
1. Drag out the Ladder Chart icon and click the “Edit” command in it’s right mouse button menu .
2. Complete the form:
3. Plot chart:
4. The chart will update automatically when the Calculator is run. To update the chart, manually,
use the “Update Chart” command in the chart’s right mouse button menu.
Solder Wiring
13Operator3 Min
A040
9 Min
4 Min
De-burr Casting Assemble Lining Install switch
3Operator1 Min 12Operator1 Min 7Operator2 Min
A010 A020 A030
2 Min
1 Min
9 Min
3 Min
4 Min
3 Min
Ladder
Chart
Edit Ladder Chart DataPlot Ladder Chart
Create Spreadsheet
Ladder
Chart
LadderChart
Value Added and Non-value added Time Ladder Min0 5 10 15 20 25 30 35
A010De-burr
Casting
A020 Assemble
Lining
A030Install
switch
A040Solder
Wiring
N on V al ue A dd ed V al ue A dd ed
Update Chart
Edit Ladder Chart DataPlot Ladder ChartCreate Spreadsheet
46

8/13/2019 PocketBook VSM
http://slidepdf.com/reader/full/pocketbook-vsm 49/9347
8/13/2019 PocketBook VSM
http://slidepdf.com/reader/full/pocketbook-vsm 50/93
Improve
Overview
Creates an Excel spreadsheet of Kaizen's with their Visio Custom
Properties and a one directional transfer.
Allows creation of an A3 sheet with a simple template and stencil.
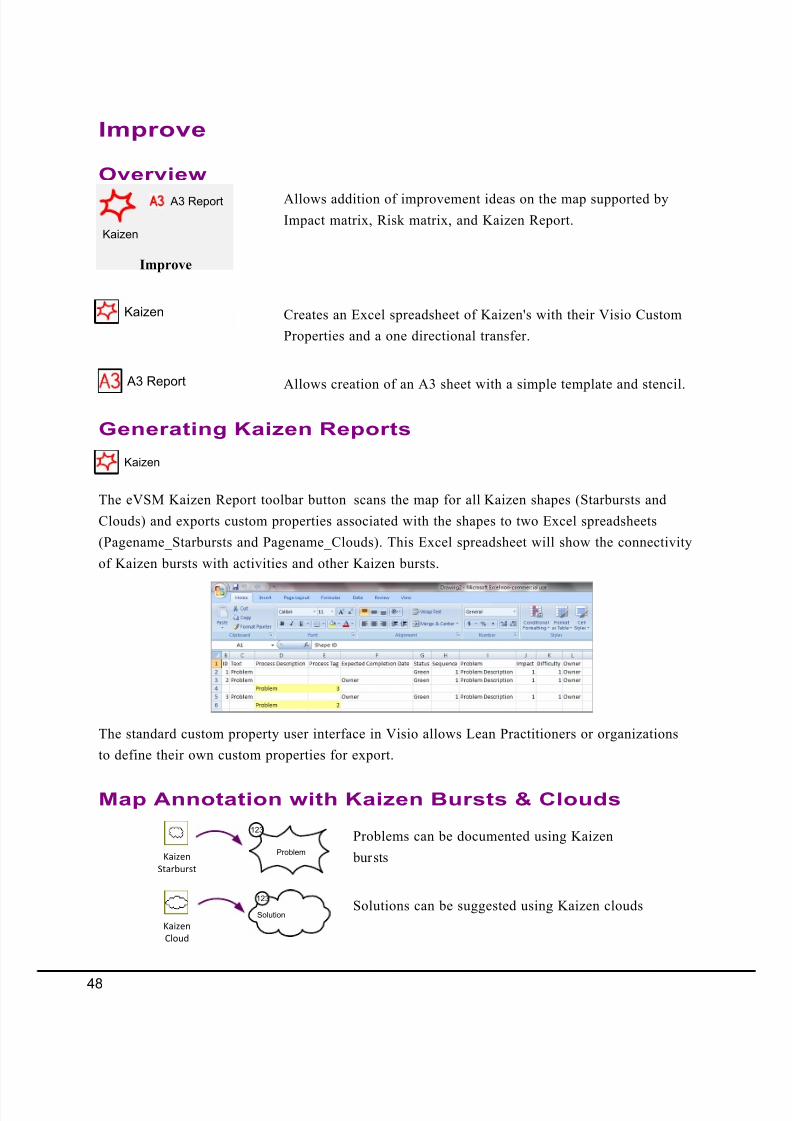
Allows addition of improvement ideas on the map supported by
Impact matrix, Risk matrix, and Kaizen Report.Kaizen
Improve
A3 Report
Kaizen
A3 Report
The eVSM Kaizen Report toolbar button scans the map for all Kaizen shapes (Starbursts and
Clouds) and exports custom properties associated with the shapes to two Excel spreadsheets
(Pagename_Starbursts and Pagename_Clouds). This Excel spreadsheet will show the connectivity
of Kaizen bursts with activities and other Kaizen bursts.
The standard custom property user interface in Visio allows Lean Practitioners or organizations
to define their own custom properties for export.
Generating Kaizen Reports
Kaizen
Map Annotation with Kaizen Bursts & Clouds
Problems can be documented using Kaizen
bursts
Kaizen
Cloud
Kaizen
Starburst
Solutions can be suggested using Kaizen clouds
Problem
123
Solution
123
48
8/13/2019 PocketBook VSM
http://slidepdf.com/reader/full/pocketbook-vsm 51/93
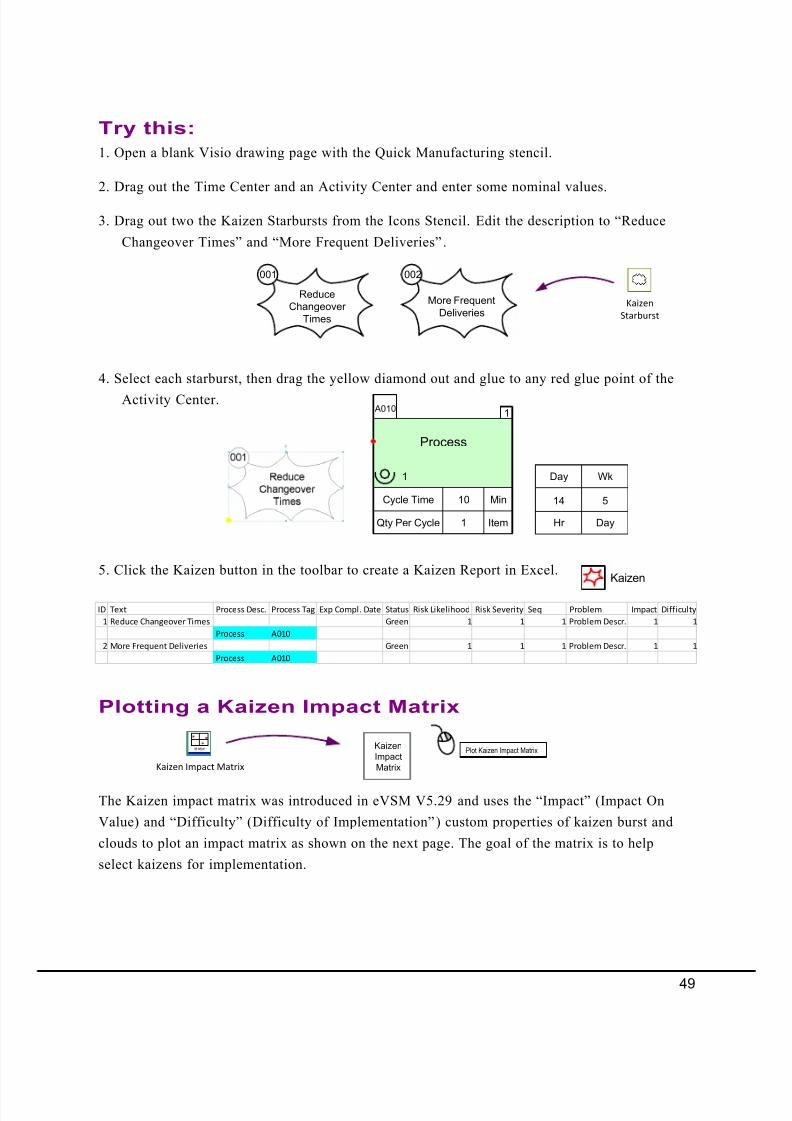
Try this:
1. Open a blank Visio drawing page with the Quick Manufacturing stencil.
2. Drag out the Time Center and an Activity Center and enter some nominal values.
3. Drag out two the Kaizen Starbursts from the Icons Stencil. Edit the description to “Reduce
Changeover Times” and “More Frequent Deliveries”.
Reduce
Changeover
Times
001
More Frequent
Deliveries
002
Kaizen
Starburst
4. Select each starburst, then drag the yellow diamond out and glue to any red glue point of the
Activity Center.
5. Click the Kaizen button in the toolbar to create a Kaizen Report in Excel.Kaizen
Process
1
Qty Per Cycle Item1
Cycle Time Min10
1
A010
14
Day
Hr
5
Wk
Day
ID Text Process Desc. Process Tag Exp Compl. Date Status Risk Likelihood Risk Severity Seq Problem Impact Difficulty
1 Reduce Changeover Times Green 1 1 1 Problem Descr. 1 1
Process A010
2 More Frequent Deliveries Green 1 1 1 Problem Descr. 1 1
Process A010
Plotting a Kaizen Impact Matrix
Kaizen Impact Matrix
Kaizen
Impact
Matrix
Plot Kaizen Impact Matrix
The Kaizen impact matrix was introduced in eVSM V5.29 and uses the “Impact” (Impact On
Value) and “Difficulty” (Difficulty of Implementation”) custom properties of kaizen burst and
clouds to plot an impact matrix as shown on the next page. The goal of the matrix is to help
select kaizens for implementation.
49
8/13/2019 PocketBook VSM
http://slidepdf.com/reader/full/pocketbook-vsm 52/93
Reduce
Changeover
Times
More Frequent
Deliveries
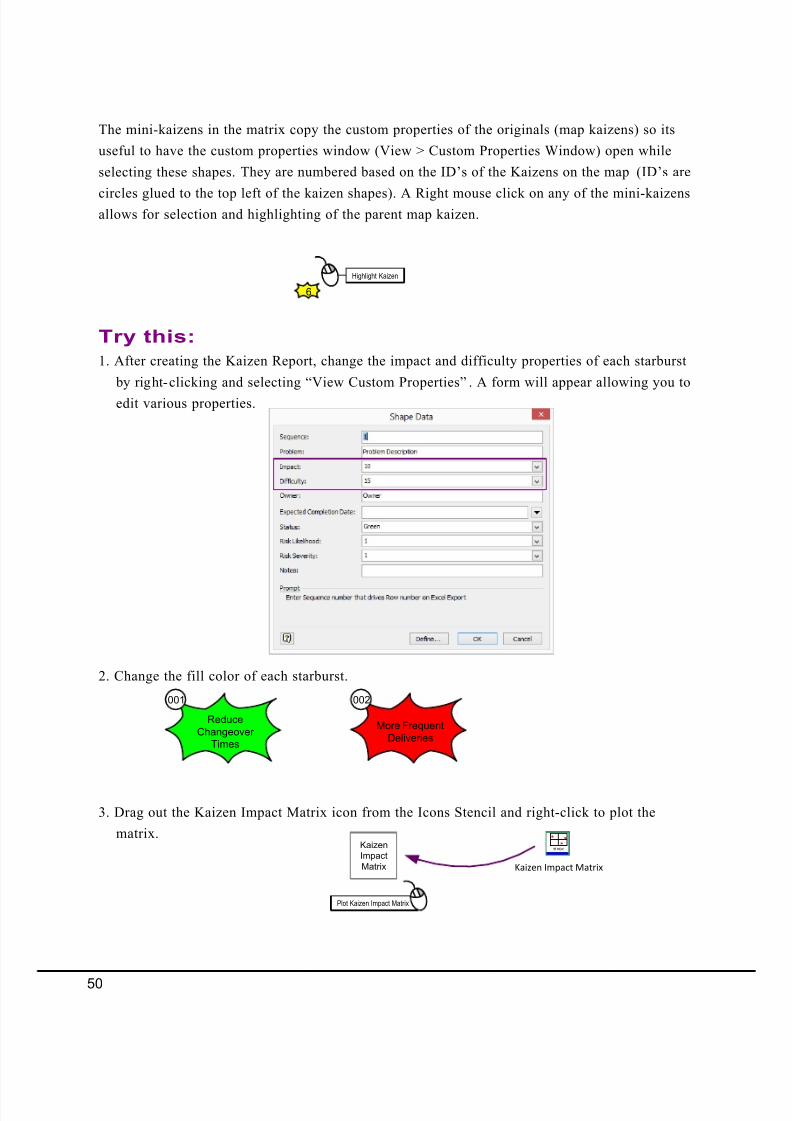
Try this:
1. After creating the Kaizen Report, change the impact and difficulty properties of each starburst
by right-clicking and selecting “View Custom Properties”. A form will appear allowing you to
edit various properties.
2. Change the fill color of each starburst.
3. Drag out the Kaizen Impact Matrix icon from the Icons Stencil and right-click to plot the
matrix.
Kaizen Impact Matrix
KaizenImpact
Matrix
Plot Kaizen Impact Matrix
001 002
The mini-kaizens in the matrix copy the custom properties of the originals (map kaizens) so its
useful to have the custom properties window (View > Custom Properties Window) open while
selecting these shapes. They are numbered based on the ID’s of the Kaizens on the map (ID’s are
circles glued to the top left of the kaizen shapes). A Right mouse click on any of the mini-kaizensallows for selection and highlighting of the parent map kaizen.
6
Highlight Kaizen
50
8/13/2019 PocketBook VSM
http://slidepdf.com/reader/full/pocketbook-vsm 53/93
Kaizen Key Creator
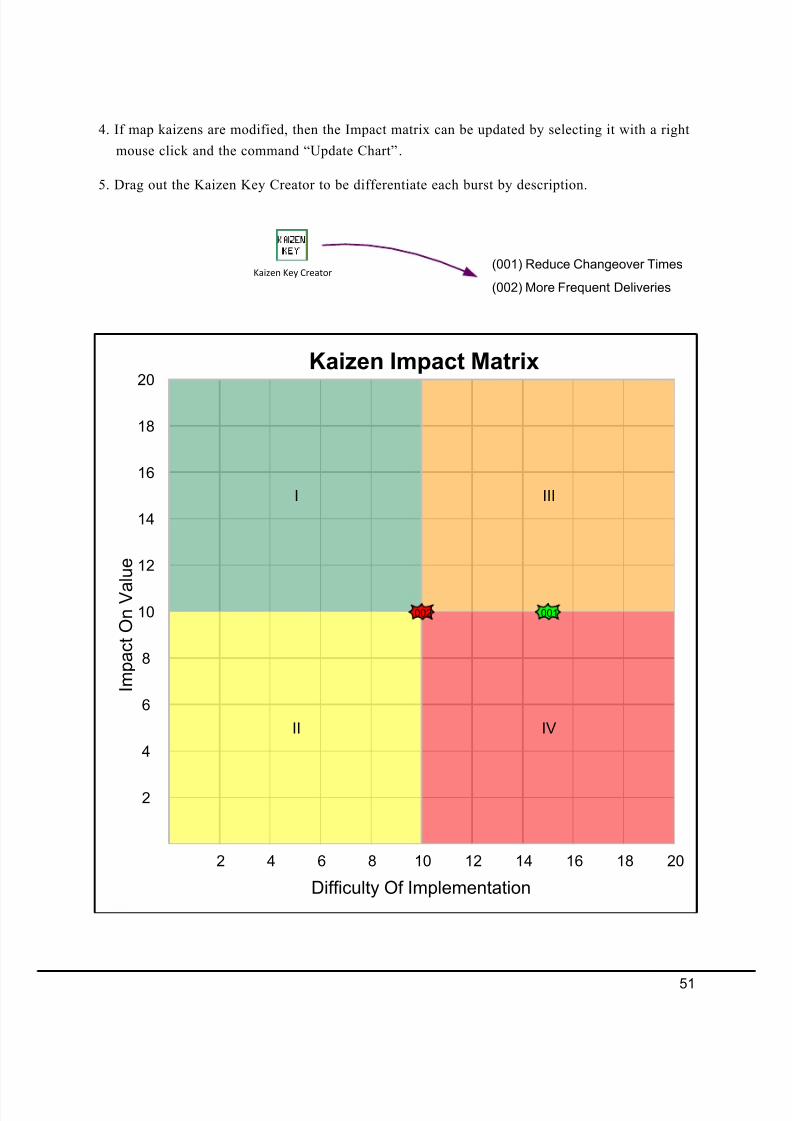
4. If map kaizens are modified, then the Impact matrix can be updated by selecting it with a right
mouse click and the command “Update Chart”.
5. Drag out the Kaizen Key Creator to be differentiate each burst by description.
20
18
16
14
12
10
8
6
4
2
2 4 6 8 10 12 14 16 18 20
IV
I
II
III
Difficulty Of Implementation
I m p a c t O n V a
l u e
Kaizen Impact Matrix
001002
(001) Reduce Changeover Times
(002) More Frequent Deliveries
51
8/13/2019 PocketBook VSM
http://slidepdf.com/reader/full/pocketbook-vsm 54/93
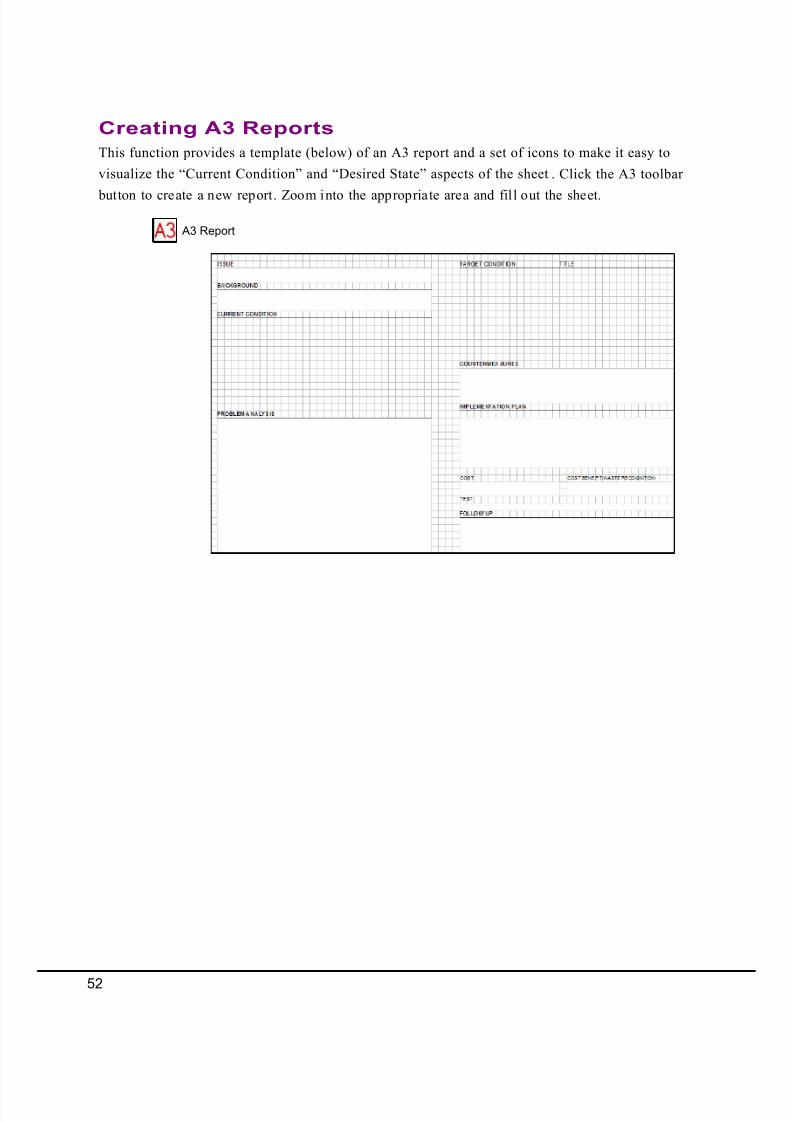
This function provides a template (below) of an A3 report and a set of icons to make it easy to
visualize the “Current Condition” and “Desired State” aspects of the sheet . Click the A3 toolbar
button to create a new report. Zoom into the appropriate area and fil l out the sheet.
Creating A3 Reports
A3 Report
52
8/13/2019 PocketBook VSM
http://slidepdf.com/reader/full/pocketbook-vsm 55/93
P r a c
t i c e
Hospital
Hospital
When to
Operate ?
Erratic OR Priority
OverridesNo centralized
bookingInsurance Impacts
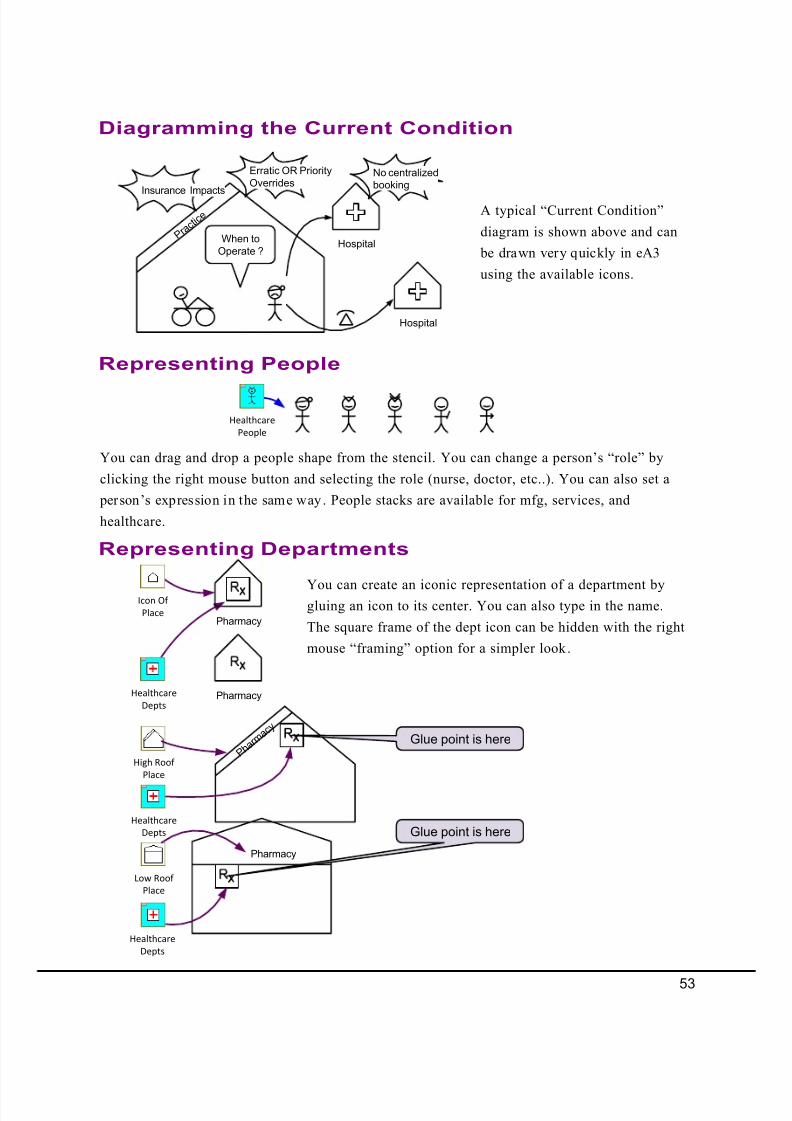
A typical “Current Condition”
diagram is shown above and can
be drawn very quickly in eA3
using the available icons.
You can drag and drop a people shape from the stencil. You can change a person’s “role” by
clicking the right mouse button and selecting the role (nurse, doctor, etc..). You can also set a
person’s expression in the same way. People stacks are available for mfg, services, and
healthcare.
Diagramming the Current Condition
Representing People
Healthcare
People
Pharmacy
P h a r m a c y
Pharmacy
Pharmacy
Icon Of
Place
You can create an iconic representation of a department bygluing an icon to its center. You can also type in the name.
The square frame of the dept icon can be hidden with the right
mouse “framing” option for a simpler look .
High Roof
Place
Low Roof
Place
Representing Departments
Healthcare
Depts
Healthcare
Depts
Healthcare
Depts
Glue point is here
Glue point is here
53
8/13/2019 PocketBook VSM
http://slidepdf.com/reader/full/pocketbook-vsm 56/93
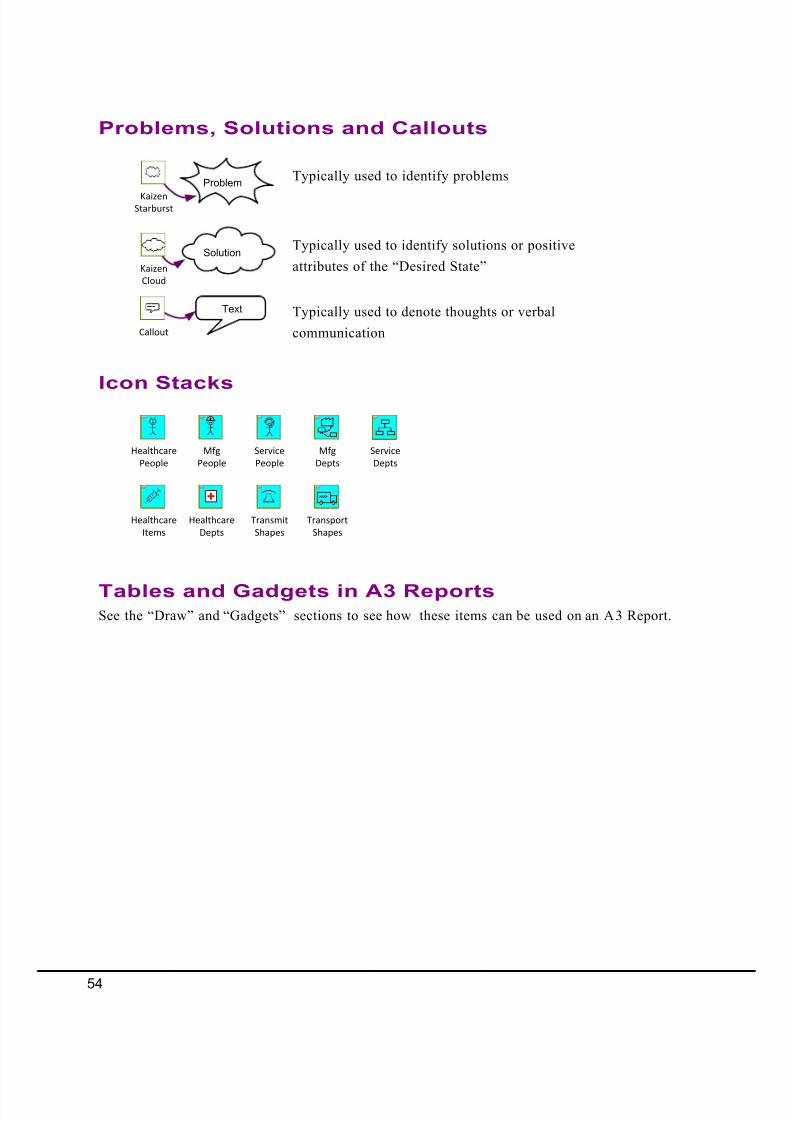
Typically used to identify problemsProblem
Solution
Text
Typically used to identify solutions or positive
attributes of the “Desired State”
Typically used to denote thoughts or verbal
communication
See the “Draw” and “Gadgets” sections to see how these items can be used on an A3 Report.
Problems, Solutions and Callouts
Icon Stacks
Tables and Gadgets in A3 Reports
Healthcare
Depts
Healthcare
People
Mfg
People
Service
People
Mfg
Depts
Service
Depts
Healthcare
Items
Transmit
Shapes
Transport
Shapes
Kaizen
Cloud
KaizenStarburst
Callout
54

8/13/2019 PocketBook VSM
http://slidepdf.com/reader/full/pocketbook-vsm 57/9355
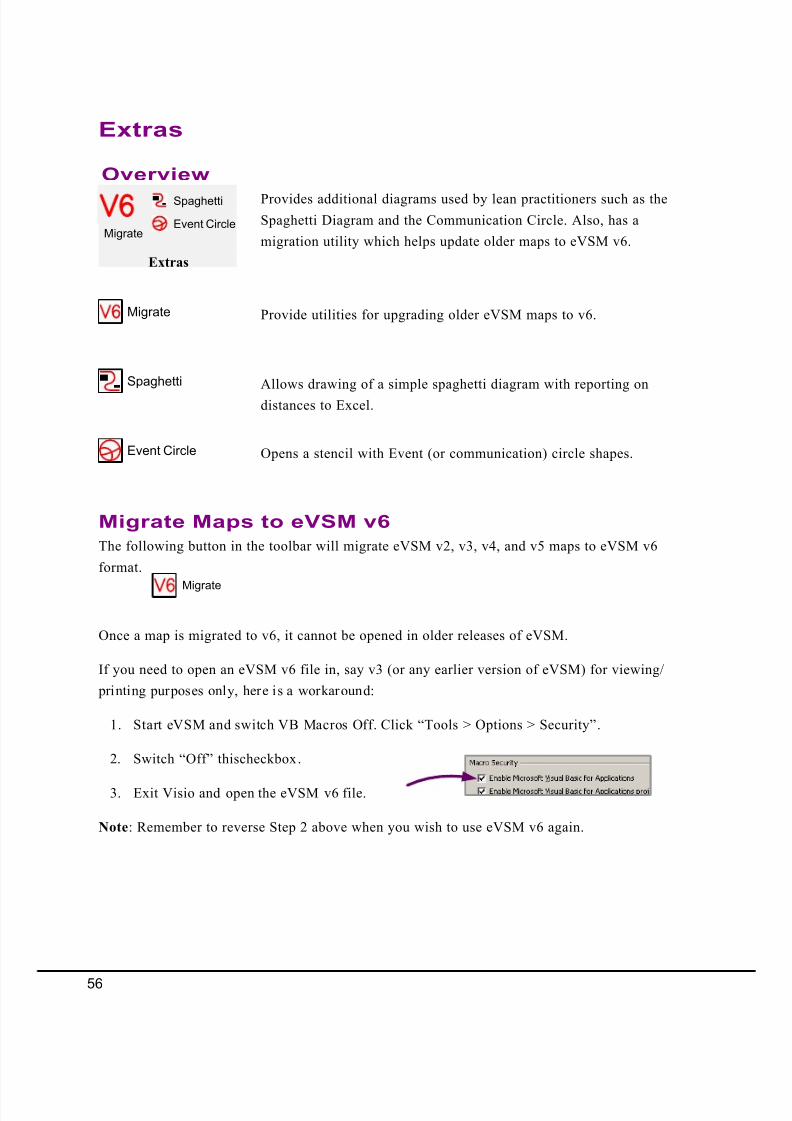
8/13/2019 PocketBook VSM
http://slidepdf.com/reader/full/pocketbook-vsm 58/93
Extras
Overview
Provide utilities for upgrading older eVSM maps to v6.
Allows drawing of a simple spaghetti diagram with reporting on
distances to Excel.
Opens a stencil with Event (or communication) circle shapes.
Provides additional diagrams used by lean practitioners such as the
Spaghetti Diagram and the Communication Circle. Also, has a
migration utility which helps update older maps to eVSM v6.
Extras
Migrate
Spaghetti
Event Circle
Migrate
Event Circle
Spaghetti
Migrate Maps to eVSM v6
The following button in the toolbar will migrate eVSM v2, v3, v4, and v5 maps to eVSM v6
format.
Once a map is migrated to v6, it cannot be opened in older releases of eVSM.
If you need to open an eVSM v6 file in, say v3 (or any earlier version of eVSM) for viewing/
printing purposes only, here is a workaround:
1. Start eVSM and switch VB Macros Off. Click “Tools > Options > Security”.
2. Switch “Off” thischeckbox.
3. Exit Visio and open the eVSM v6 file.
Note: Remember to reverse Step 2 above when you wish to use eVSM v6 again.
Migrate
56
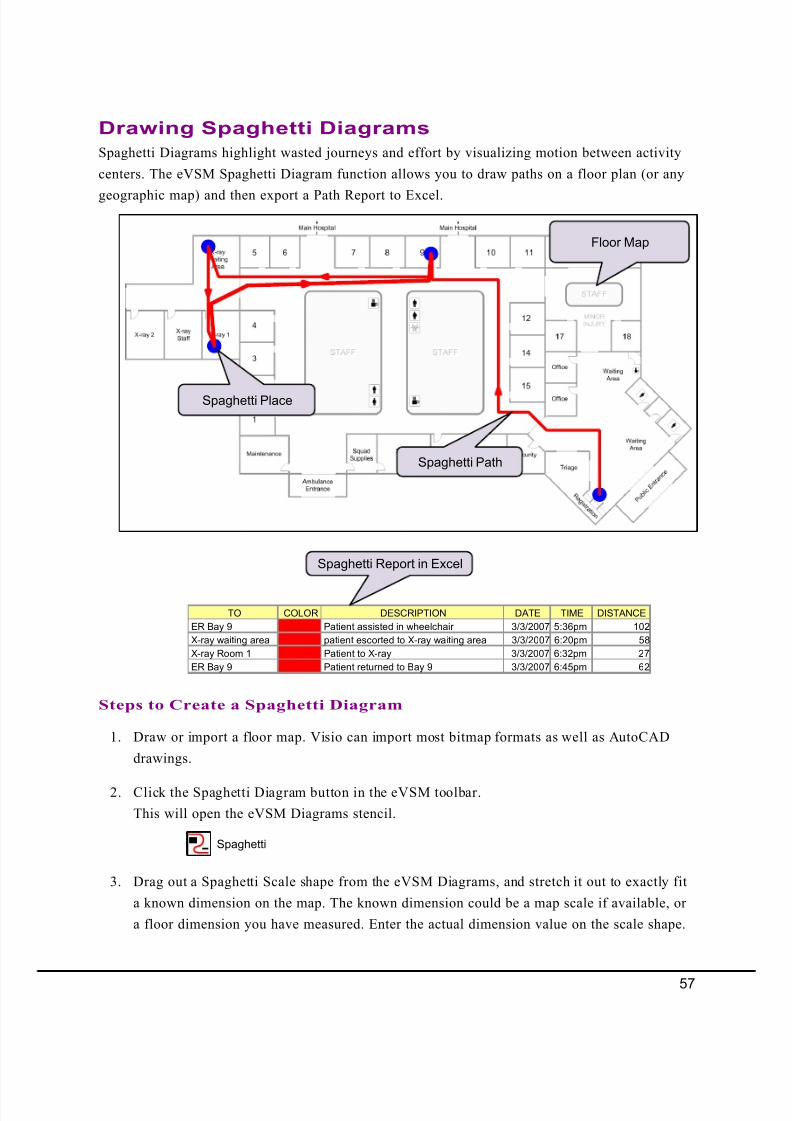
8/13/2019 PocketBook VSM
http://slidepdf.com/reader/full/pocketbook-vsm 59/93
Spaghetti Diagrams highlight wasted journeys and effort by visualizing motion between activity
centers. The eVSM Spaghetti Diagram function allows you to draw paths on a floor plan (or any
geographic map) and then export a Path Report to Excel.
TO COLOR DESCRIPTION DATE TIME DISTANCE
ER Bay 9 Patient assisted in wheelchair 3/3/2007 5:36pm 102
X-ray waiting area patient escorted to X-ray waiting area 3/3/2007 6:20pm 58
X-ray Room 1 Patient to X-ray 3/3/2007 6:32pm 27
ER Bay 9 Patient returned to Bay 9 3/3/2007 6:45pm 62
Drawing Spaghetti Diagrams
Spaghetti Report in Excel
1. Draw or import a floor map. Visio can import most bitmap formats as well as AutoCAD
drawings.
2. Click the Spaghetti Diagram button in the eVSM toolbar.
This will open the eVSM Diagrams stencil.
3. Drag out a Spaghetti Scale shape from the eVSM Diagrams, and stretch it out to exactly fit
a known dimension on the map. The known dimension could be a map scale if available, or
a floor dimension you have measured. Enter the actual dimension value on the scale shape.
Steps to Create a Spaghetti Diagram
Spaghetti
Floor Map
Spaghetti Path
Spaghetti Place
57
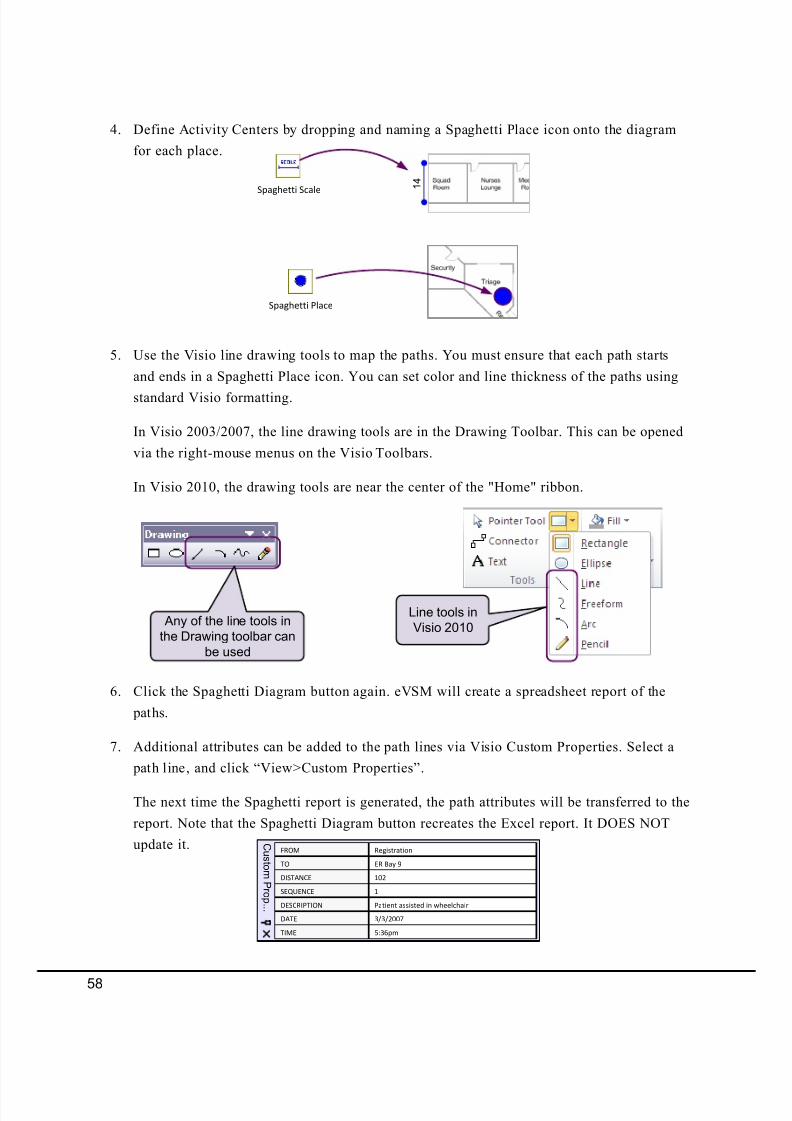
8/13/2019 PocketBook VSM
http://slidepdf.com/reader/full/pocketbook-vsm 60/93
4. Define Activity Centers by dropping and naming a Spaghetti Place icon onto the diagram
for each place.
5. Use the Visio line drawing tools to map the paths. You must ensure that each path starts
and ends in a Spaghetti Place icon. You can set color and line thickness of the paths using
standard Visio formatting.
In Visio 2003/2007, the line drawing tools are in the Drawing Toolbar. This can be opened
via the right-mouse menus on the Visio Toolbars.
In Visio 2010, the drawing tools are near the center of the "Home" ribbon.
6. Click the Spaghetti Diagram button again. eVSM will create a spreadsheet report of the
paths.
7. Additional attributes can be added to the path lines via Visio Custom Properties. Select a
path line, and click “View>Custom Properties”.
The next time the Spaghetti report is generated, the path attributes will be transferred to the
report. Note that the Spaghetti Diagram button recreates the Excel report. It DOES NOT
update it.
Spaghetti Place
Spaghetti Scale 1 4
Any of the line tools in
the Drawing toolbar can
be used
Line tools in
Visio 2010
FROM Registration
ER Bay 9TO
DISTANCE 102
SEQUENCE 1
DESCRIPTION Patient assisted in wheelchair
DATE 3/3/2007
TIME 5:36pm
C u s t om P r o p...
58
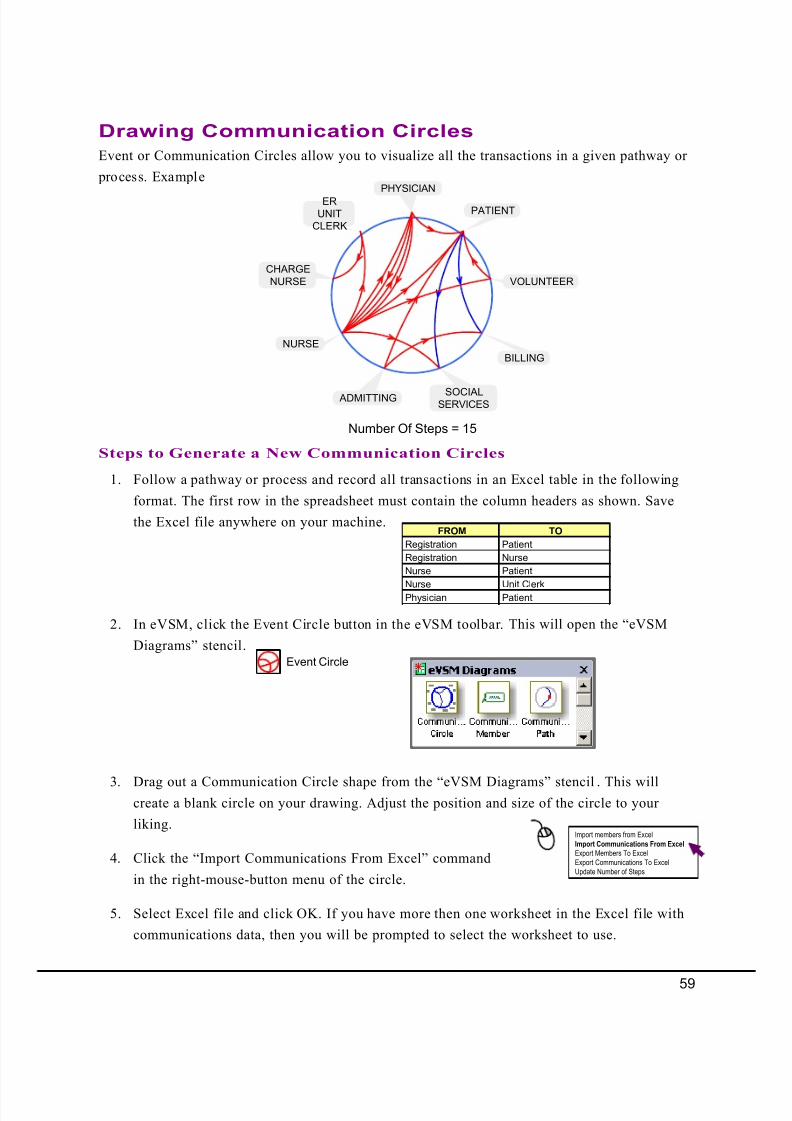
8/13/2019 PocketBook VSM
http://slidepdf.com/reader/full/pocketbook-vsm 61/93
Event or Communication Circles allow you to visualize all the transactions in a given pathway or
process. Example
Drawing Communication Circles
1. Follow a pathway or process and record all transactions in an Excel table in the following
format. The first row in the spreadsheet must contain the column headers as shown. Save
the Excel file anywhere on your machine.
2. In eVSM, click the Event Circle button in the eVSM toolbar. This will open the “eVSM
Diagrams” stencil.
3. Drag out a Communication Circle shape from the “eVSM Diagrams” stencil . This willcreate a blank circle on your drawing. Adjust the position and size of the circle to your
liking.
4. Click the “Import Communications From Excel” command
in the right-mouse-button menu of the circle.
5. Select Excel file and click OK. If you have more then one worksheet in the Excel file with
communications data, then you will be prompted to select the worksheet to use.
Steps to Generate a New Communication Circles
FROM TO
Registration Patient
Registration Nurse
Nurse Patient
Nurse Unit Clerk
Physician Patient
Event Circle
Import members from ExcelImport Communications From ExcelExport Members To ExcelExport Communications To ExcelUpdate Number of Steps
Number Of Steps = 15
PHYSICIAN
PATIENT
VOLUNTEER
BILLING
SOCIALSERVICES
ADMITTING
NURSE
CHARGE
NURSE
ER
UNIT
CLERK
59
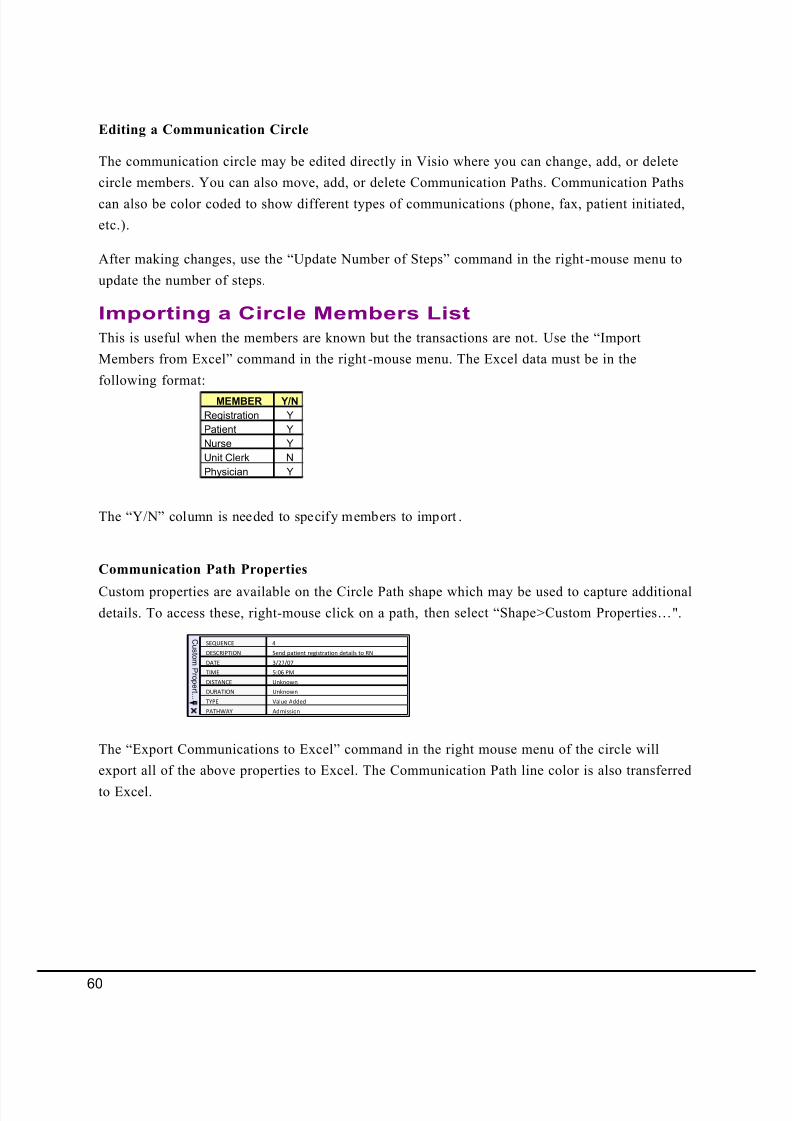
8/13/2019 PocketBook VSM
http://slidepdf.com/reader/full/pocketbook-vsm 62/93
The communication circle may be edited directly in Visio where you can change, add, or delete
circle members. You can also move, add, or delete Communication Paths. Communication Paths
can also be color coded to show different types of communications (phone, fax, patient initiated,
etc.).
After making changes, use the “Update Number of Steps” command in the right-mouse menu to
update the number of steps.
Editing a Communication Circle
Importing a Circle Members List
This is useful when the members are known but the transactions are not. Use the “Import
Members from Excel” command in the right-mouse menu. The Excel data must be in the
following format:
The “Y/ N” column is needed to specify members to import .
MEMBER Y/N
Registration Y
Patient Y
Nurse Y
Unit Clerk N
Physician Y
Communication Path Properties
Custom properties are available on the Circle Path shape which may be used to capture additional
details. To access these, right-mouse click on a path, then select “Shape>Custom Properties…".
The “Export Communications to Excel” command in the right mouse menu of the circle will
export all of the above properties to Excel. The Communication Path line color is also transferred
to Excel.
C u s t om P r o p er t ...
SEQUENCE 4
Send patient registration details to RNDESCRIPTION
DATE 3/27/07
TIME 5:06 PM
DISTANCE Unknown
DURATION Unknown
TYPE Value Added
PATHWAY Admission
60

8/13/2019 PocketBook VSM
http://slidepdf.com/reader/full/pocketbook-vsm 63/9361
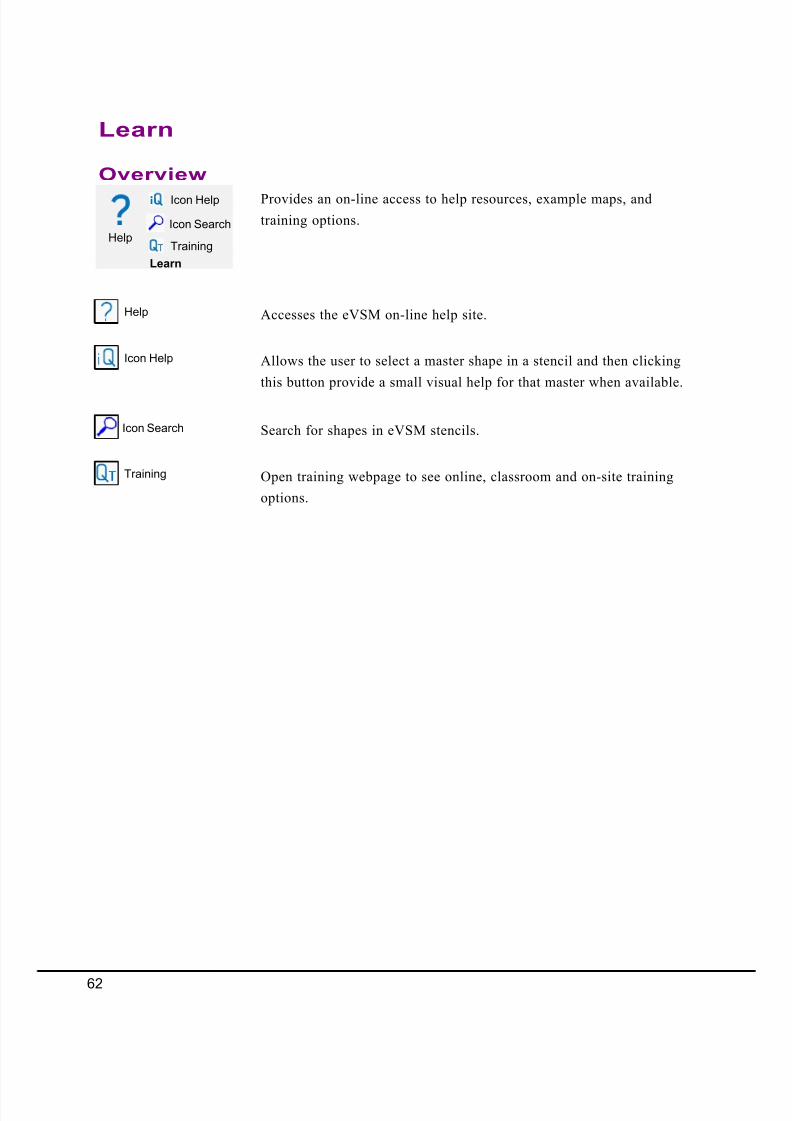
8/13/2019 PocketBook VSM
http://slidepdf.com/reader/full/pocketbook-vsm 64/93
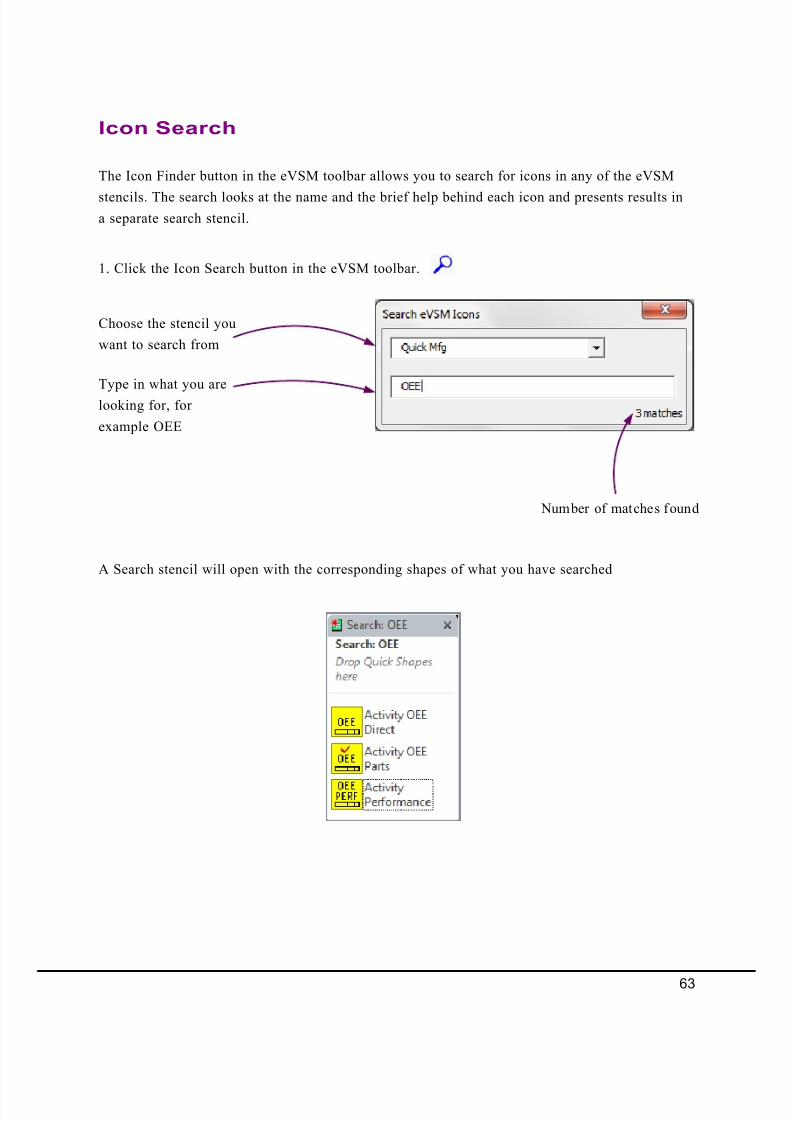
8/13/2019 PocketBook VSM
http://slidepdf.com/reader/full/pocketbook-vsm 65/93
Icon Search
The Icon Finder button in the eVSM toolbar allows you to search for icons in any of the eVSM
stencils. The search looks at the name and the brief help behind each icon and presents results ina separate search stencil.
1. Click the Icon Search button in the eVSM toolbar.
Choose the stencil you
want to search from
Type in what you are
looking for, for
example OEE
A Search stencil will open with the corresponding shapes of what you have searched
Number of matches found
63
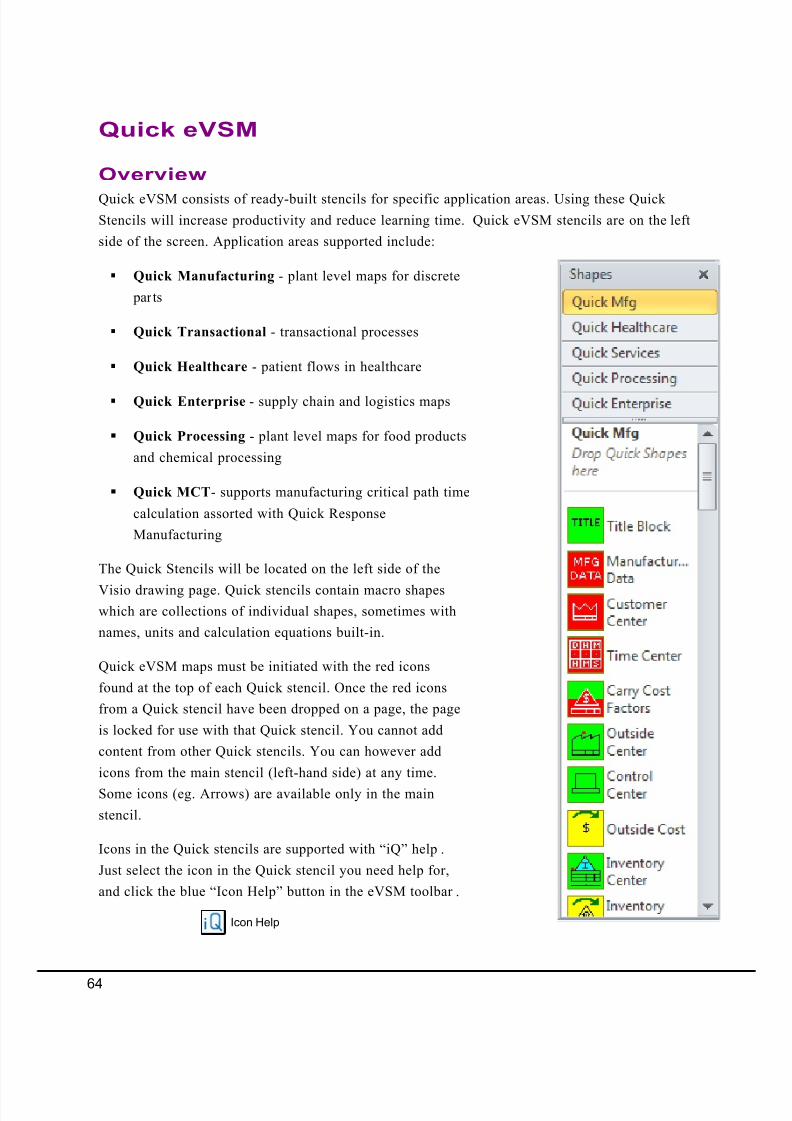
8/13/2019 PocketBook VSM
http://slidepdf.com/reader/full/pocketbook-vsm 66/93
Quick eVSM consists of ready-built stencils for specific application areas. Using these Quick
Stencils will increase productivity and reduce learning time. Quick eVSM stencils are on the left
side of the screen. Application areas supported include:
§ Quick Manufacturing - plant level maps for discrete
parts
§ Quick Transactional - transactional processes
§ Quick Healthcare - patient flows in healthcare
§ Quick Enterprise - supply chain and logistics maps
§ Quick Processing - plant level maps for food products
and chemical processing
§ Quick MCT- supports manufacturing critical path time
calculation assorted with Quick Response
Manufacturing
The Quick Stencils will be located on the left side of the
Visio drawing page. Quick stencils contain macro shapeswhich are collections of individual shapes, sometimes with
names, units and calculation equations built-in.
Quick eVSM maps must be initiated with the red icons
found at the top of each Quick stencil. Once the red icons
from a Quick stencil have been dropped on a page, the page
is locked for use with that Quick stencil. You cannot add
content from other Quick stencils. You can however add
icons from the main stencil (left-hand side) at any time.
Some icons (eg. Arrows) are available only in the main
stencil.
Icons in the Quick stencils are supported with “iQ” help .
Just select the icon in the Quick stencil you need help for,
and click the blue “Icon Help” button in the eVSM toolbar .
Quick eVSM
Icon Help
Overview
64
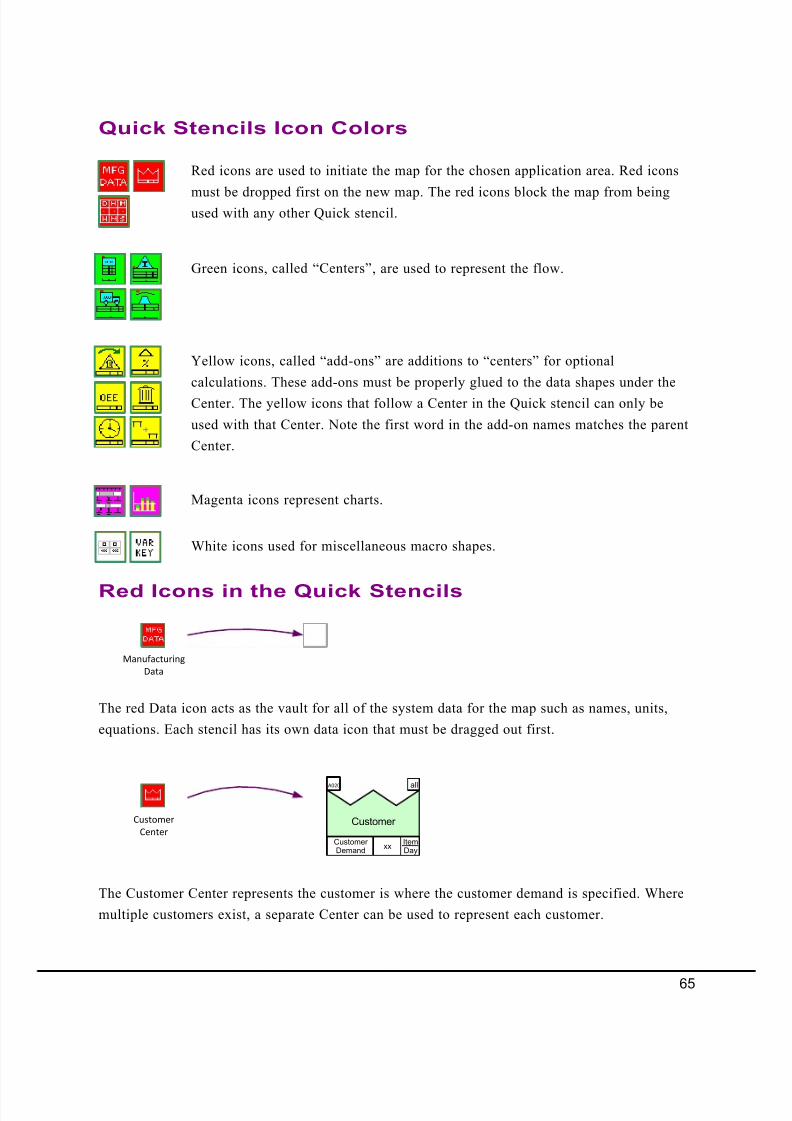
8/13/2019 PocketBook VSM
http://slidepdf.com/reader/full/pocketbook-vsm 67/93
Quick Stencils Icon Colors
Red icons are used to initiate the map for the chosen application area. Red icons
must be dropped first on the new map. The red icons block the map from beingused with any other Quick stencil.
Green icons, called “Centers”, are used to represent the flow.
Yellow icons, called “add-ons” are additions to “centers” for optional
calculations. These add-ons must be properly glued to the data shapes under the
Center. The yellow icons that follow a Center in the Quick stencil can only be
used with that Center. Note the first word in the add-on names matches the parent
Center.
Magenta icons represent charts.
White icons used for miscellaneous macro shapes.
The red Data icon acts as the vault for all of the system data for the map such as names, units,
equations. Each stencil has its own data icon that must be dragged out first.
Red Icons in the Quick Stencils
Manufacturing
Data
Customer
Center
all
Customer
CustomerDemand
ItemDay
xx
A020
The Customer Center represents the customer is where the customer demand is specified. Where
multiple customers exist, a separate Center can be used to represent each customer.
65
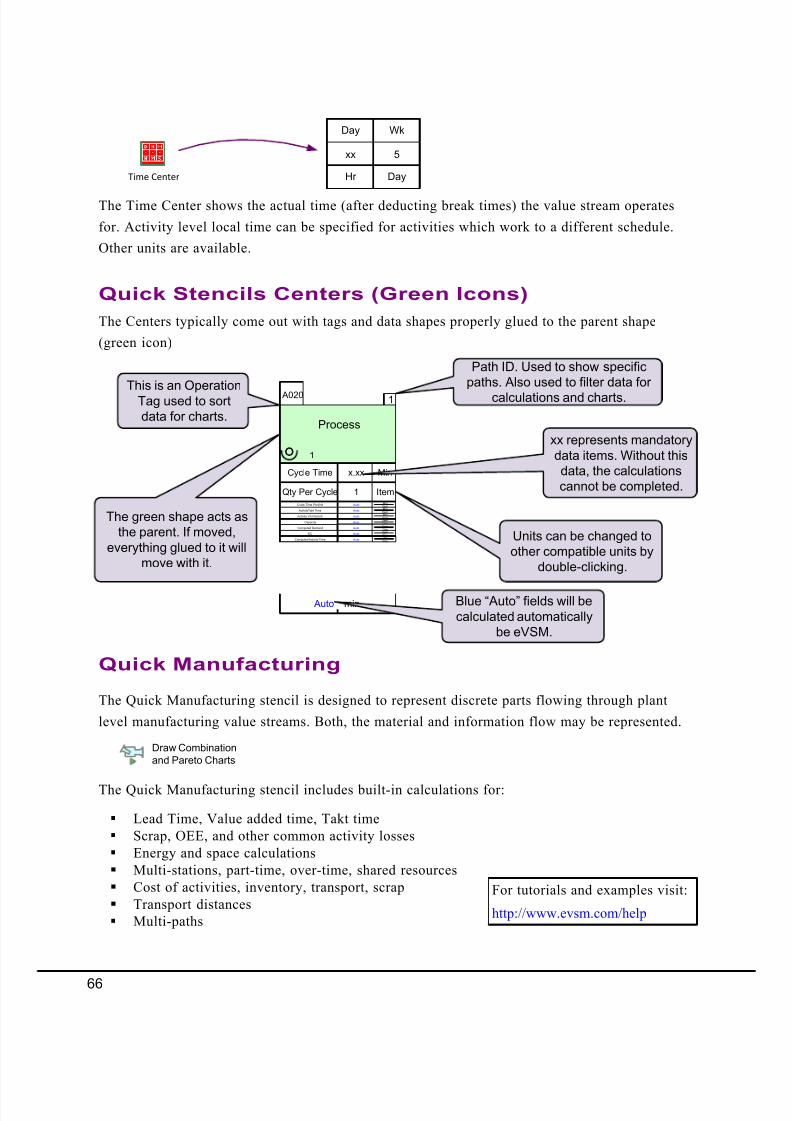
8/13/2019 PocketBook VSM
http://slidepdf.com/reader/full/pocketbook-vsm 68/93
Time Center
The Time Center shows the actual time (after deducting break times) the value stream operates
for. Activity level local time can be specified for activities which work to a different schedule.
Other units are available.
xx
Day
Hr
5
Wk
Day
Quick Stencils Centers (Green Icons)
The Centers typically come out with tags and data shapes properly glued to the parent shape
(green icon)
This is an Operation
Tag used to sort
data for charts.
Path ID. Used to show specific
paths. Also used to filter data for
calculations and charts.
The green shape acts as
the parent. If moved,
everything glued to it will
move with it.
1
min Auto
Qty Per Cycle Item1
Cycle Time Minx.xx
Cycle Time PerUnitMinItem
Auto
ActivityTakt TimeMinItem
Auto
Activity VA PerUnitMinItem
Auto
A020
Process
1
CapacityItemDay
Auto
Computed DemandItemDay
Auto
ECItemDay
Auto
Computed Activity TimeHr
Day Auto
xx represents mandatory
data items. Without this
data, the calculations
cannot be completed.
Units can be changed to
other compatible units by
double-clicking.
Blue “Auto” fields will be
calculated automatically
be eVSM.
Quick Manufacturing
The Quick Manufacturing stencil is designed to represent discrete parts flowing through plant
level manufacturing value streams. Both, the material and information flow may be represented.
The Quick Manufacturing stencil includes built-in calculations for:
§ Lead Time, Value added time, Takt time
§ Scrap, OEE, and other common activity losses
§ Energy and space calculations
§ Multi-stations, part-time, over-time, shared resources
§ Cost of activities, inventory, transport, scrap
§ Transport distances
§ Multi-paths
Draw Combination
and Pareto Charts
For tutorials and examples visit:
http://www.evsm.com/help
66
8/13/2019 PocketBook VSM
http://slidepdf.com/reader/full/pocketbook-vsm 69/93
Quick Transactional
Used to draw office, administrative, and general services value stream maps. May be used for
any value streams concerned primarily with information flow.
For tutorials and examples visit:
Supported calculations include:
§ Lead Time, Value added time, Takt time, Cumulative Rolling Time
§ %Complete & Accurate (%C&A)
§ Multi-stations, part-time, over-time, shared resources
§ Multi-paths
http://www.evsm.com/help
Quick Healthcare
Used to capture value streams that require following a patient through admin and non-clinical
processes.
For tutorials and examples visit:
Supported calculations include:
§ Lead Time, Value added time, Takt time, Cumulative Rolling Time
§ %Complete & Accurate (%C&A)
§ Multi-stations, part-time, over-time, shared resources
§ Multi-paths
Quick Enterprise
The Quick Enterprise stencil is designed to provide mapping support for enterprise, supply chain
and logistics maps. The stencil was developed after a review of the workbooks “Seeing The
Whole” and “Lean Fulfillment” from the Lean Enterprise Institute (www.lean.org). The stencil
has been subsequently refined through enterprise mapping projects the eVSM group has been
involved in.
For tutorials and examples visit:
The Quick Processing stencil is designed to provide mapping support for plant level
manufacturing in Process Industries. The stencil was developed after a review of the Peter King’s
book “Lean for the Process Industries”. It is an adaption of standard Value Stream Mapping
methodology to address the non-discrete nature of process manufacturing.. The stencil has been
subsequently refined through processing mapping projects the eVSM group has been involved in.
For tutorials and examples visit:
Quick Processing
http://www.evsm.com/help
http://www.evsm.com/help
67
http://www.evsm.com/help
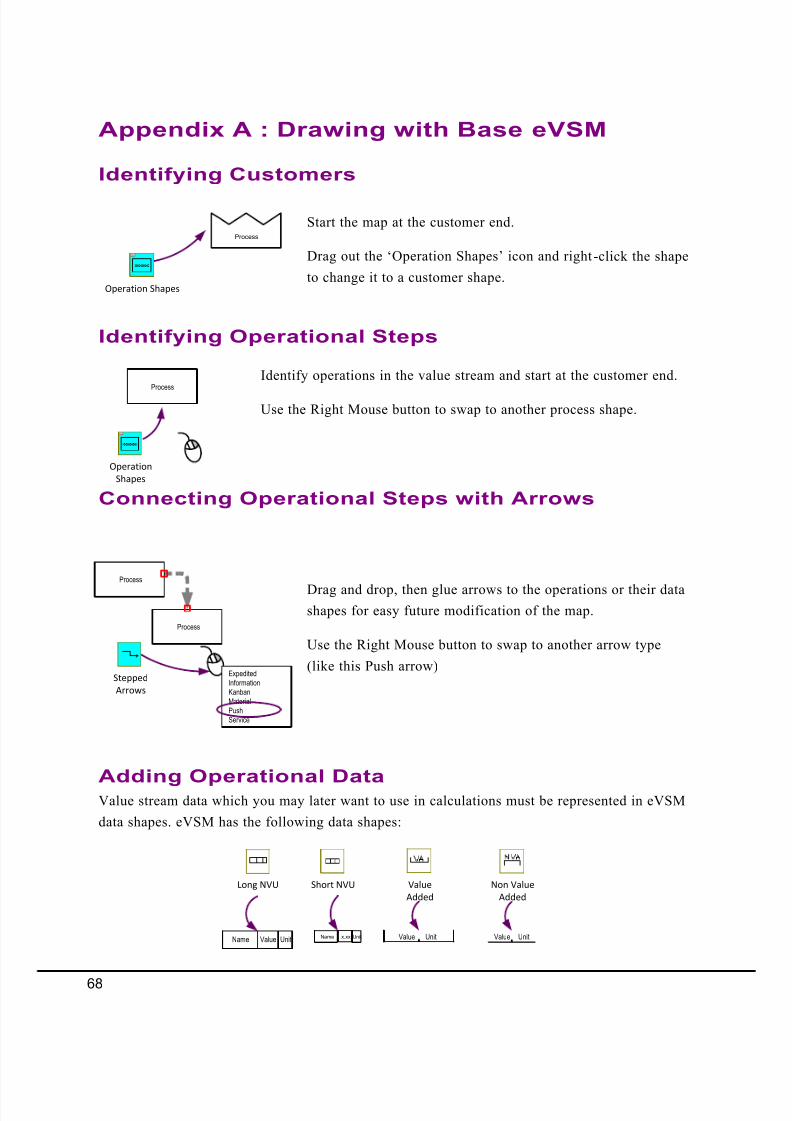
8/13/2019 PocketBook VSM
http://slidepdf.com/reader/full/pocketbook-vsm 70/93
Identify operations in the value stream and start at the customer end.
Use the Right Mouse button to swap to another process shape.
Identifying Operational Steps
Process
Operation
Shapes
Identifying Customers
Start the map at the customer end.
Drag out the ‘Operation Shapes’ icon and right-click the shape
to change it to a customer shape.
Appendix A : Drawing with Base eVSM
Process
Operation Shapes
Process
Process
Drag and drop, then glue arrows to the operations or their datashapes for easy future modification of the map.
Use the Right Mouse button to swap to another arrow type
(like this Push arrow)
Connecting Operational Steps with Arrows
Stepped
Arrows
ExpeditedInformationKanbanMaterialPushService
Adding Operational Data
Value stream data which you may later want to use in calculations must be represented in eVSM
data shapes. eVSM has the following data shapes:
ValueName Unit Value Unit Value Unit
Long NVU Value
Added
Non Value
Added
Name Unitx.xx
Short NVU
68
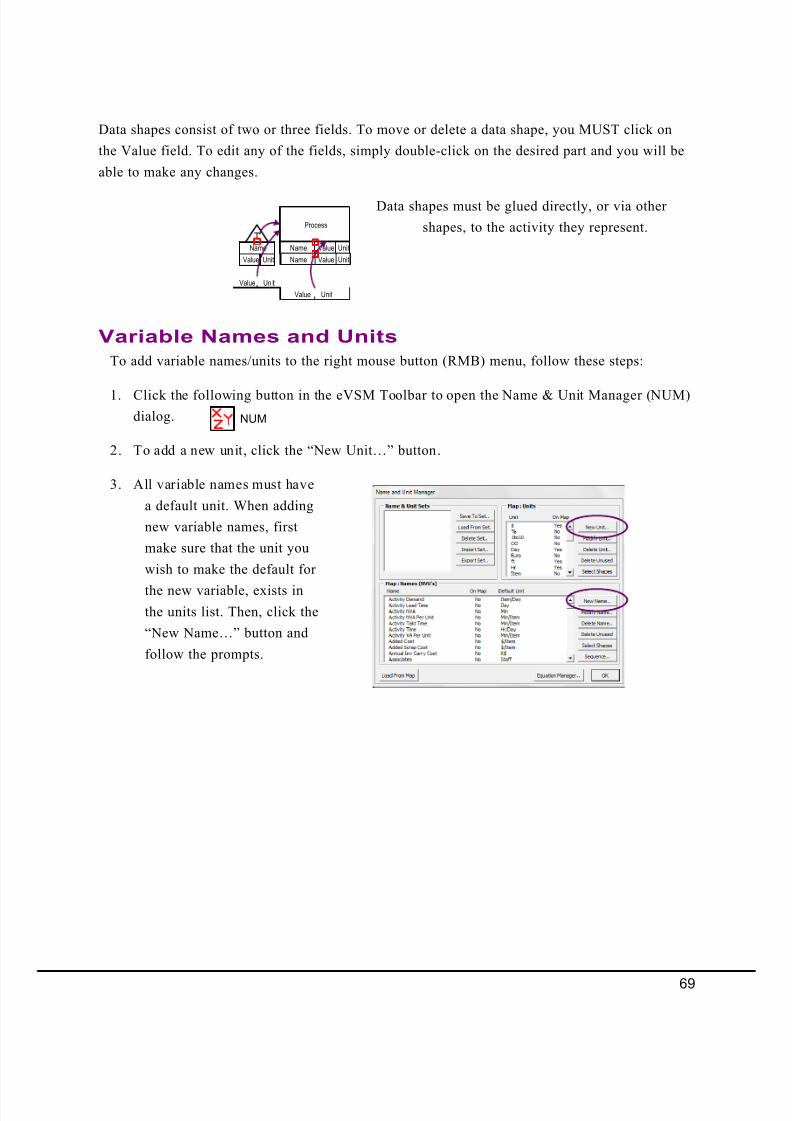
8/13/2019 PocketBook VSM
http://slidepdf.com/reader/full/pocketbook-vsm 71/93
ValueName Unit
Process
ValueName UnitValue
Name
Unit
Value Unit
Value Un it
Variable Names and Units
To add variable names/units to the right mouse button (RMB) menu, follow these steps:
1. Click the following button in the eVSM Toolbar to open the Name & Unit Manager (NUM)
dialog.
2. To add a new unit, click the “New Unit…” button.
3. All variable names must have
a default unit. When adding
new variable names, first
make sure that the unit you
wish to make the default for
the new variable, exists inthe units list. Then, click the
“New Name…” button and
follow the prompts.
NUM
Data shapes consist of two or three fields. To move or delete a data shape, you MUST click on
the Value field. To edit any of the fields, simply double-click on the desired part and you will be
able to make any changes.
Data shapes must be glued directly, or via other
shapes, to the activity they represent.
69
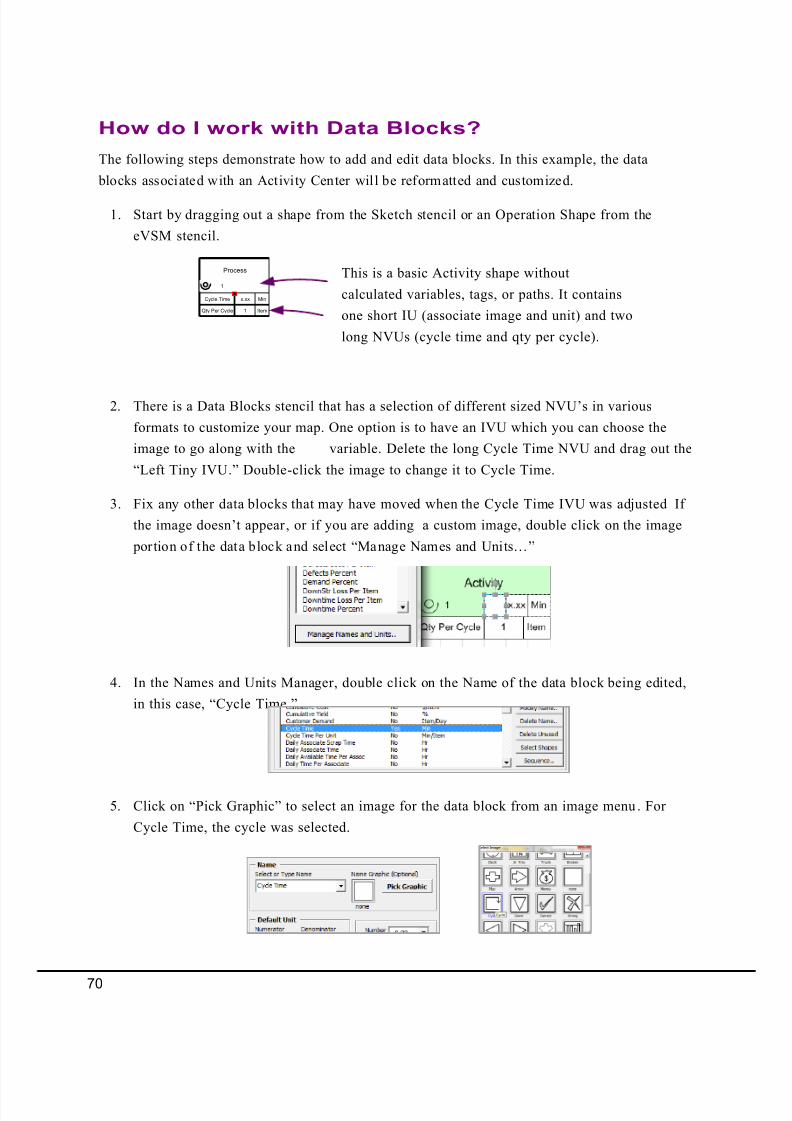
8/13/2019 PocketBook VSM
http://slidepdf.com/reader/full/pocketbook-vsm 72/93
How do I work with Data Blocks?
The following steps demonstrate how to add and edit data blocks. In this example, the data
blocks associated with an Activity Center will be reformatted and customized.
1. Start by dragging out a shape from the Sketch stencil or an Operation Shape from the
eVSM stencil.
2. There is a Data Blocks stencil that has a selection of different sized NVU’s in various
formats to customize your map. One option is to have an IVU which you can choose the
image to go along with the variable. Delete the long Cycle Time NVU and drag out the
“Left Tiny IVU.” Double-click the image to change it to Cycle Time.
3. Fix any other data blocks that may have moved when the Cycle Time IVU was adjusted If
the image doesn’t appear , or if you are adding a custom image, double click on the image
portion of the data block and select “Manage Names and Units…”
4. In the Names and Units Manager, double click on the Name of the data block being edited,
in this case, “Cycle Time.”
5. Click on “Pick Graphic” to select an image for the data block from an image menu. For
Cycle Time, the cycle was selected.
This is a basic Activity shape without
calculated variables, tags, or paths. It contains
one short IU (associate image and unit) and two
long NVUs (cycle time and qty per cycle).
Process
Cycle Time Minx.xx
Qty Per Cycle Item1
1
70
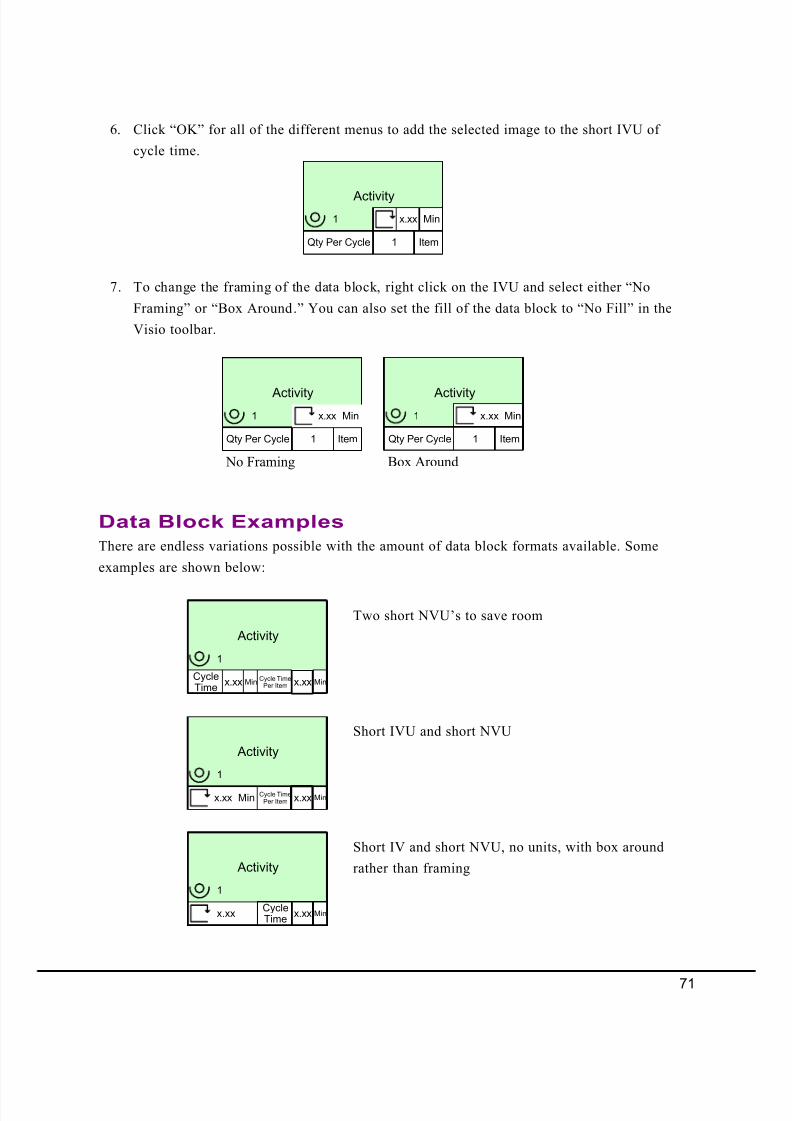
8/13/2019 PocketBook VSM
http://slidepdf.com/reader/full/pocketbook-vsm 73/93
6. Click “OK” for all of the different menus to add the selected image to the short IVU of
cycle time.
7. To change the framing of the data block, right click on the IVU and select either “No
Framing” or “Box Around.” You can also set the fill of the data block to “No Fill” in the
Visio toolbar.
Activity
1
Qty Per Cycle Item1
Minx.xx
Activity
1
Qty Per Cycle Item1
Minx.xx
Activity
1
Qty Per Cycle Item1
Minx.xx
No Framing Box Around
There are endless variations possible with the amount of data block formats available. Some
examples are shown below:
Activity
1
Two short NVU’s to save room
Data Block Examples
CycleTime
Minx.xx Cycle TimePer Item Minx.xx
Activity
1
Activity
1
Short IVU and short NVU
Minx.xx
x.xx
Short IV and short NVU, no units, with box around
rather than framing
Cycle TimePer Item
Minx.xx
CycleTime
Minx.xx
71
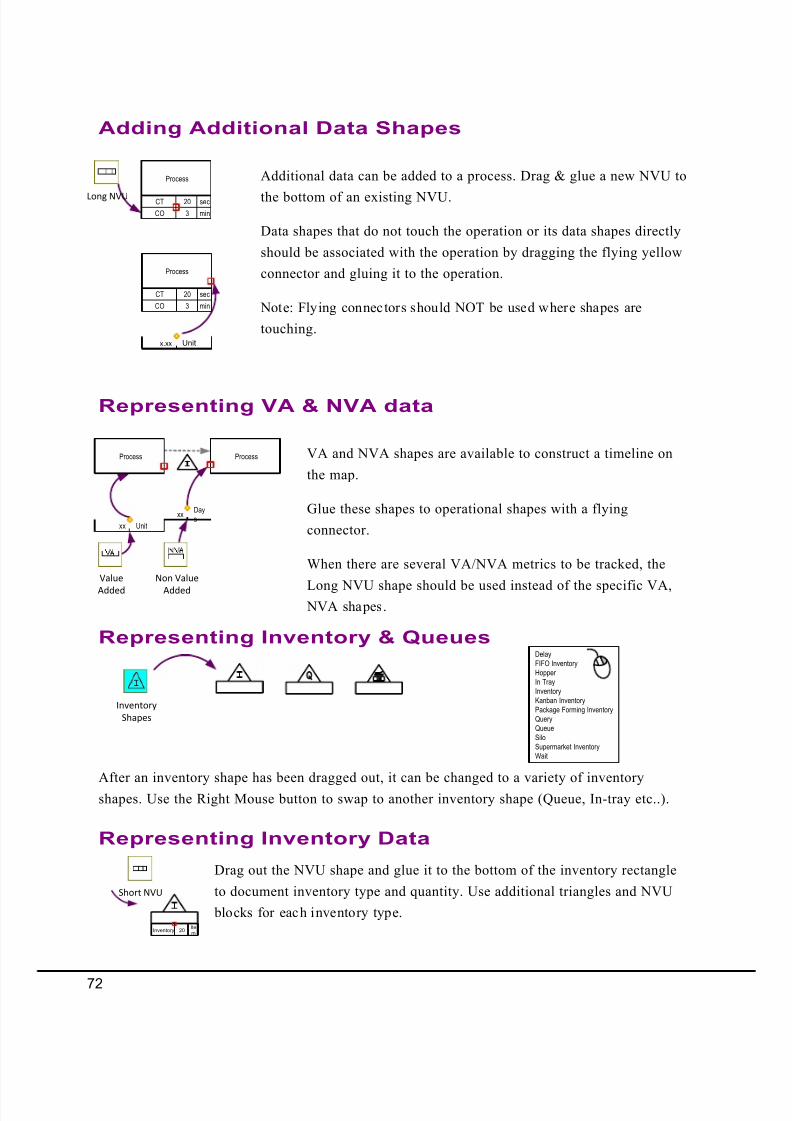
8/13/2019 PocketBook VSM
http://slidepdf.com/reader/full/pocketbook-vsm 74/93
3CO min
20CT sec
3CO min
20CT sec
Process Additional data can be added to a process. Drag & glue a new NVU to
the bottom of an existing NVU.
Data shapes that do not touch the operation or its data shapes directly
should be associated with the operation by dragging the flying yellow
connector and gluing it to the operation.
Note: Flying connectors should NOT be used where shapes are
touching.
Process
Adding Additional Data Shapes
Long NVU
x.xx Unit
xxDays
xx Unit
Process VA and NVA shapes are available to construct a timeline on
the map.
Glue these shapes to operational shapes with a flying
connector.
When there are several VA/NVA metrics to be tracked, the
Long NVU shape should be used instead of the specific VA, NVA shapes.
Process
Representing VA & NVA data
Value
Added
Non Value
Added
Drag out the NVU shape and glue it to the bottom of the inventory rectangle
to document inventory type and quantity. Use additional triangles and NVU
blocks for each inventory type.
Representing Inventory Data
After an inventory shape has been dragged out, it can be changed to a variety of inventory
shapes. Use the Right Mouse button to swap to another inventory shape (Queue, In-tray etc..).
Representing Inventory & Queues
Inventory
Shapes
Short NVU
DelayFIFO InventoryHopper In TrayInventoryKanban InventoryPackage Forming InventoryQueryQueueSiloSupermarket InventoryWait
InventoryItem
20
72
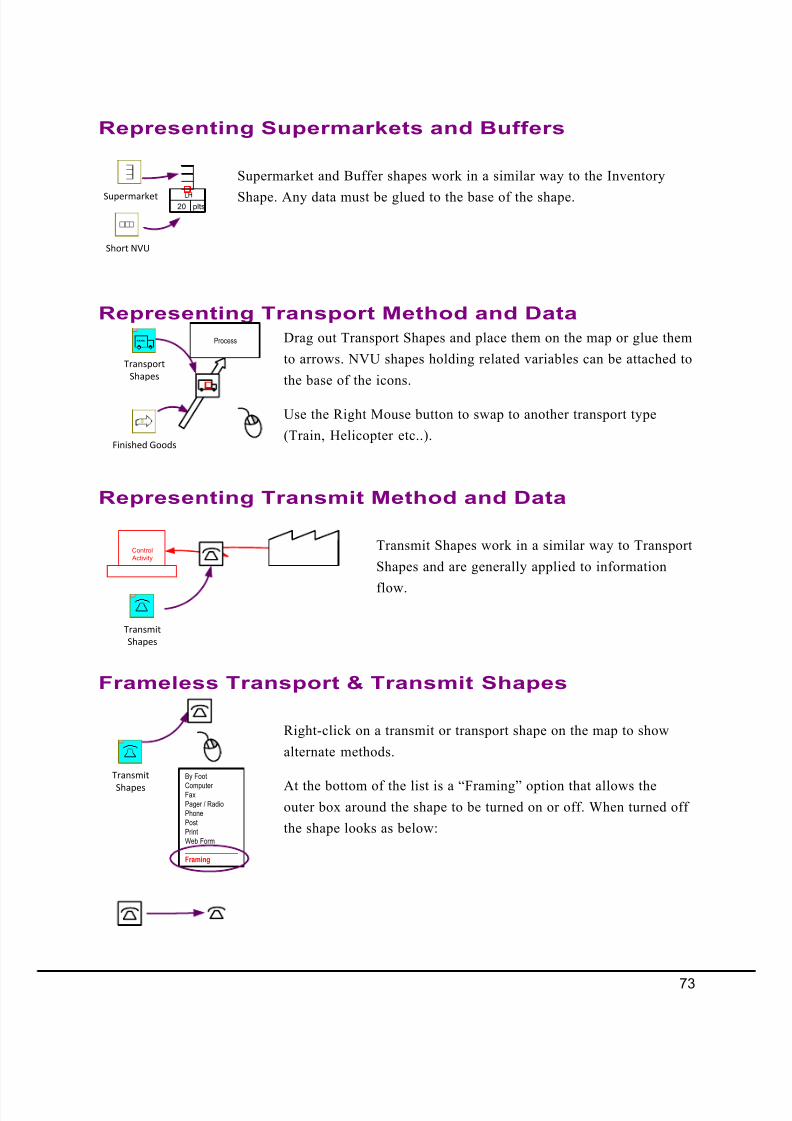
8/13/2019 PocketBook VSM
http://slidepdf.com/reader/full/pocketbook-vsm 75/93
20LH
plts
Supermarket and Buffer shapes work in a similar way to the Inventory
Shape. Any data must be glued to the base of the shape.
Representing Supermarkets and Buffers
Supermarket
Short NVU
Drag out Transport Shapes and place them on the map or glue them
to arrows. NVU shapes holding related variables can be attached to
the base of the icons.
Use the Right Mouse button to swap to another transport type
(Train, Helicopter etc..).
Representing Transport Method and Data
Process
Transport
Shapes
Finished Goods
Representing Transmit Method and Data
Transmit Shapes work in a similar way to Transport
Shapes and are generally applied to information
flow.
Transmit
Shapes
Control
Activity
Frameless Transport & Transmit Shapes
Transmit
Shapes
By Foot
Computer FaxPager / RadioPhonePostPrintWeb Form _______________Framing
Right-click on a transmit or transport shape on the map to show
alternate methods.
At the bottom of the list is a “Framing” option that allows theouter box around the shape to be turned on or off. When turned off
the shape looks as below:
73
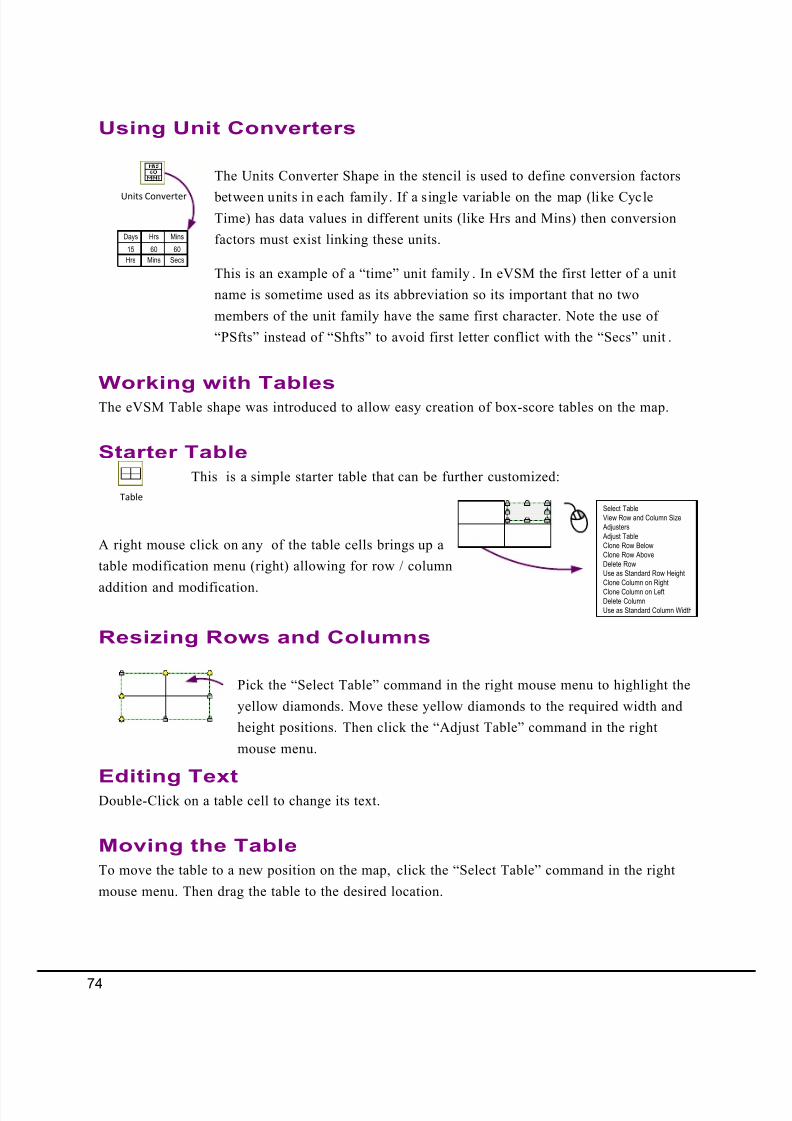
8/13/2019 PocketBook VSM
http://slidepdf.com/reader/full/pocketbook-vsm 76/93
The Units Converter Shape in the stencil is used to define conversion factors
between units in each family. If a single variable on the map (like CycleTime) has data values in different units (like Hrs and Mins) then conversion
factors must exist linking these units.
This is an example of a “time” unit family . In eVSM the first letter of a unit
name is sometime used as its abbreviation so its important that no two
members of the unit family have the same first character. Note the use of
“PSfts” instead of “Shfts” to avoid first letter conflict with the “Secs” unit.
Using Unit Converters
Units Converter
15
Days
Hrs
60
Hrs
Mins
60
Mins
Secs
Table
This is a simple starter table that can be further customized:
A right mouse click on any of the table cells brings up a
table modification menu (right) allowing for row / column
addition and modification.
Select TableView Row and Column Size Adjusters Adjust TableClone Row BelowClone Row AboveDelete RowUse as Standard Row HeightClone Column on Right
Clone Column on LeftDelete ColumnUse as Standard Column Width
The eVSM Table shape was introduced to allow easy creation of box-score tables on the map.
Starter Table
Working with Tables
Pick the “Select Table” command in the right mouse menu to highlight the
yellow diamonds. Move these yellow diamonds to the required width and
height positions. Then click the “Adjust Table” command in the right
mouse menu.
Resizing Rows and Columns
Moving the Table
To move the table to a new position on the map, click the “Select Table” command in the right
mouse menu. Then drag the table to the desired location.
Editing Text
Double-Click on a table cell to change its text.
74
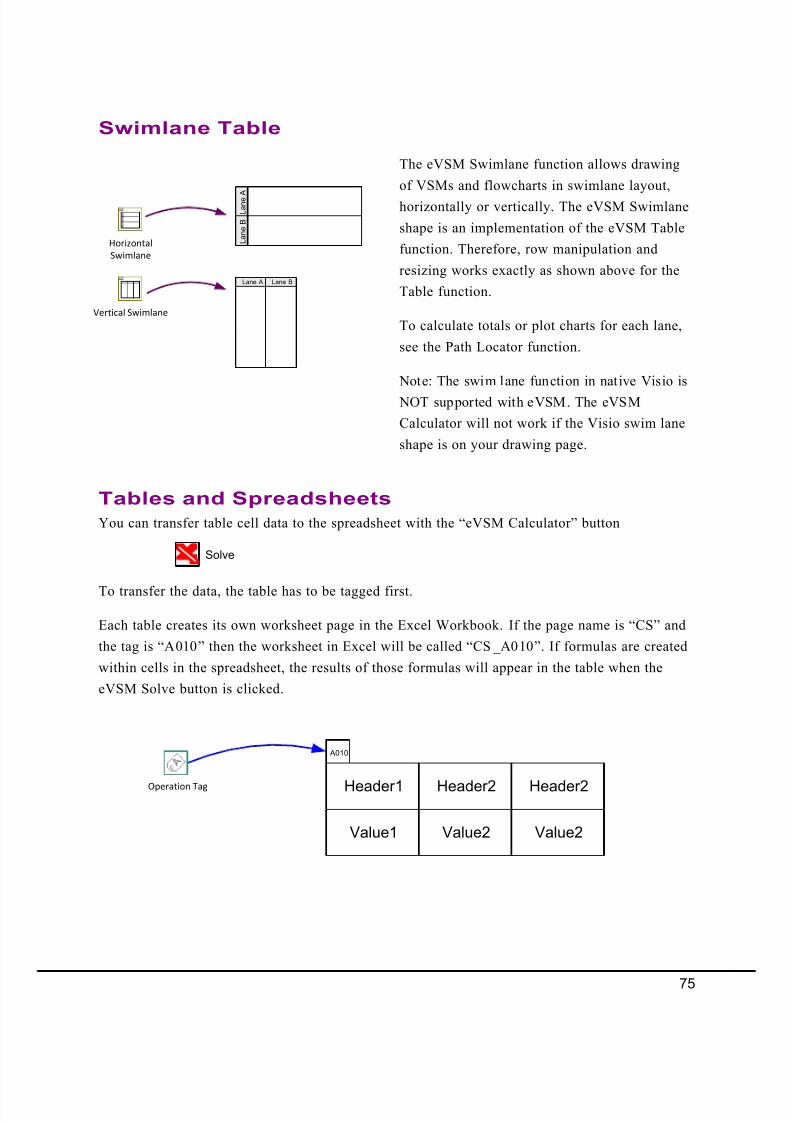
8/13/2019 PocketBook VSM
http://slidepdf.com/reader/full/pocketbook-vsm 77/93
Header1 Header2
Value2Value1
Header2
Value2
Swimlane Table
The eVSM Swimlane function allows drawing
of VSMs and flowcharts in swimlane layout,
horizontally or vertically. The eVSM Swimlane
shape is an implementation of the eVSM Table
function. Therefore, row manipulation and
resizing works exactly as shown above for the
Table function.
To calculate totals or plot charts for each lane,
see the Path Locator function.
Note: The swim lane function in native Visio is
NOT supported with eVSM. The eVSM
Calculator will not work if the Visio swim lane
shape is on your drawing page.
Horizontal
Swimlane
Vertical Swimlane
Tables and Spreadsheets
You can transfer table cell data to the spreadsheet with the “eVSM Calculator” button
To transfer the data, the table has to be tagged first.
Each table creates its own worksheet page in the Excel Workbook. If the page name is “CS” and
the tag is “A010” then the worksheet in Excel will be called “CS _A010”. If formulas are created
within cells in the spreadsheet, the results of those formulas will appear in the table when the
eVSM Solve button is clicked.
Operation Tag
Solve
Lane A Lane B
L a n e A
L a n e B
A010
75
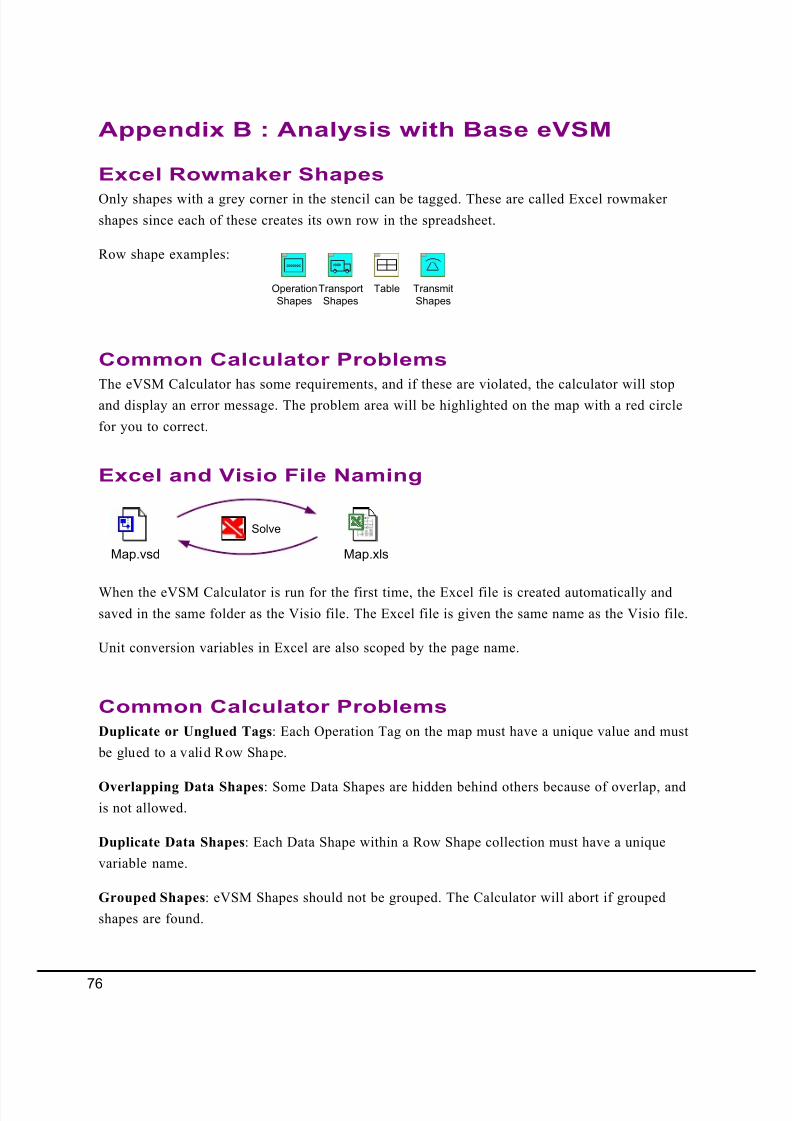
8/13/2019 PocketBook VSM
http://slidepdf.com/reader/full/pocketbook-vsm 78/93
Only shapes with a grey corner in the stencil can be tagged. These are called Excel rowmaker
shapes since each of these creates its own row in the spreadsheet.
Row shape examples:
Excel Rowmaker Shapes
Operation
Shapes
Transport
Shapes
Table Transmit
Shapes
Common Calculator Problems
The eVSM Calculator has some requirements, and if these are violated, the calculator will stop
and display an error message. The problem area will be highlighted on the map with a red circle
for you to correct.
Appendix B : Analysis with Base eVSM
Map.xlsMap.vsd
When the eVSM Calculator is run for the first time, the Excel file is created automatically and
saved in the same folder as the Visio file. The Excel file is given the same name as the Visio file.
Unit conversion variables in Excel are also scoped by the page name.
Excel and Visio File Naming
Solve
Duplicate or Unglued Tags: Each Operation Tag on the map must have a unique value and must
be glued to a valid Row Shape.
Overlapping Data Shapes: Some Data Shapes are hidden behind others because of overlap, andis not allowed.
Duplicate Data Shapes: Each Data Shape within a Row Shape collection must have a unique
variable name.
Grouped Shapes: eVSM Shapes should not be grouped. The Calculator will abort if grouped
shapes are found.
Common Calculator Problems
76
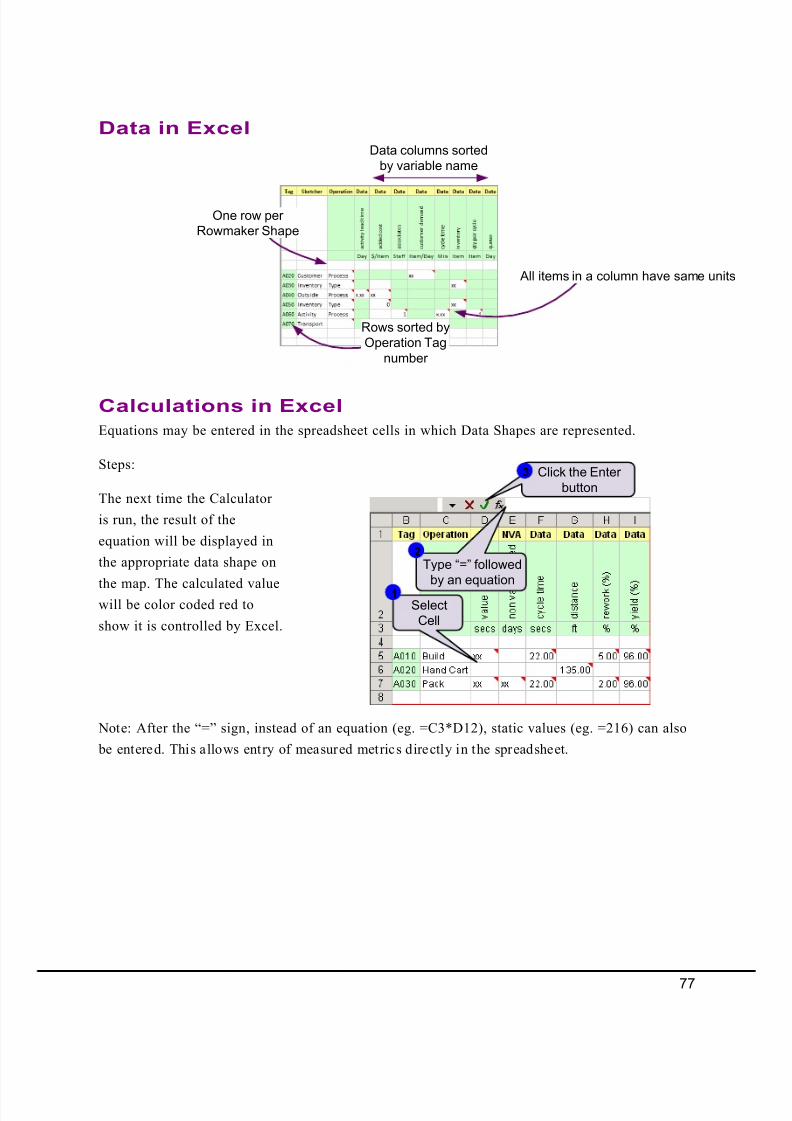
8/13/2019 PocketBook VSM
http://slidepdf.com/reader/full/pocketbook-vsm 79/93
Data columns sorted
by variable name
Data in Excel
One row per
Rowmaker Shape
Rows sorted by
Operation Tag
number
All items in a column have same units
Calculations in Excel
Equations may be entered in the spreadsheet cells in which Data Shapes are represented.
Steps:
The next time the Calculator
is run, the result of the
equation will be displayed in
the appropriate data shape on
the map. The calculated valuewill be color coded red to
show it is controlled by Excel.
Note: After the “=” sign, instead of an equation (eg. =C3*D12), static values (eg. =216) can also
be entered. This allows entry of measured metrics directly in the spreadsheet.
Select
Cell
1
Type “=” followed
by an equation
Click the Enter
button
2
3
77
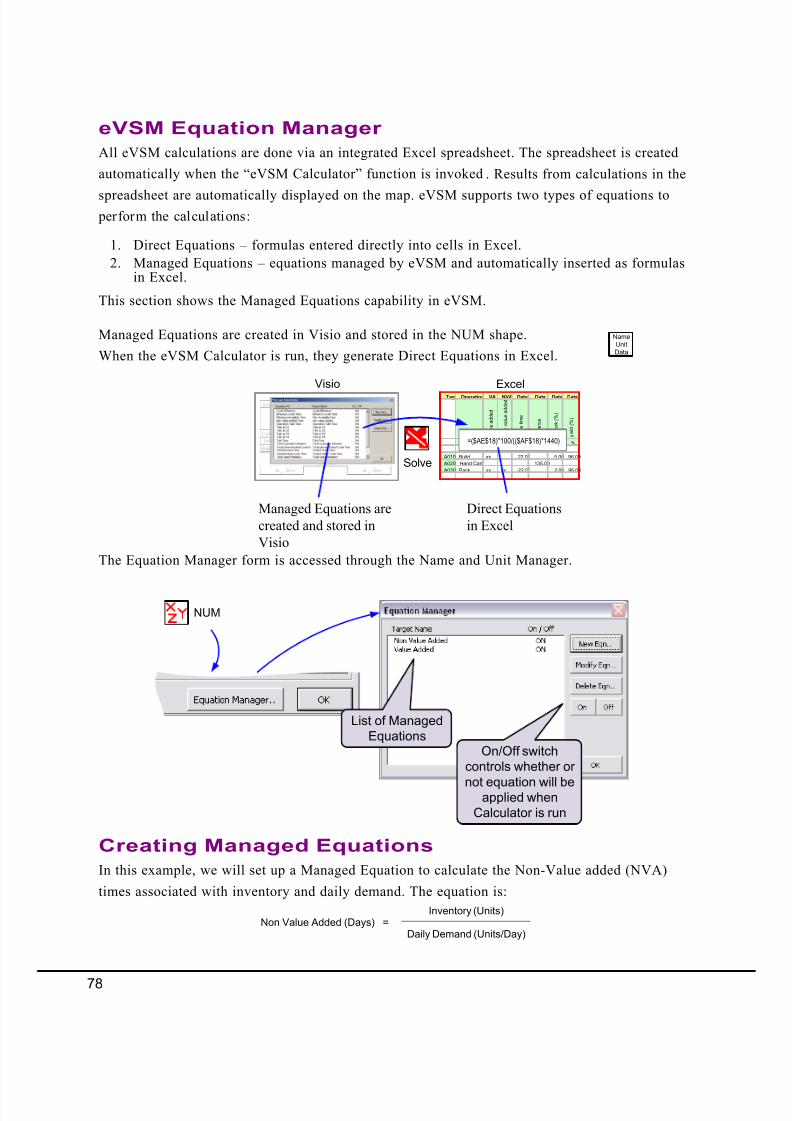
8/13/2019 PocketBook VSM
http://slidepdf.com/reader/full/pocketbook-vsm 80/93
eVSM Equation Manager
Visio
Build
A10
22Cyc le Time Secs
96Yield (%) %
Pack
22Cyc le Time Secs
96Yiel d (%) %
A30 A20
135
Distance
ft
5Rework (%) % 2R ew or k ( %) %
xx Days
xx Secs xx Secs
All eVSM calculations are done via an integrated Excel spreadsheet. The spreadsheet is created
automatically when the “eVSM Calculator” function is invoked . Results from calculations in the
spreadsheet are automatically displayed on the map. eVSM supports two types of equations to perform the calculations:
1. Direct Equations – formulas entered directly into cells in Excel.
2. Managed Equations – equations managed by eVSM and automatically inserted as formulasin Excel.
This section shows the Managed Equations capability in eVSM.
Managed Equations are created in Visio and stored in the NUM shape.
When the eVSM Calculator is run, they generate Direct Equations in Excel.
The Equation Manager form is accessed through the Name and Unit Manager.
Tag Operation VA NVA Data Data Data Data
v a l u e a d d e d
n o n v a l u e a d d e d
c y c l e t i m e
d i s t a n c e
r e w o r k ( % )
y i e l d ( % )
secs days secs ft % %
A010 Build xx 22.00 5.00 96.00
A020 Hand Cart 135.00
A030 Pack xx xx 22.00 2.00 96.00
Excel
=($AE$18)*100/(($AF$18)*1440)
Name
Unit
Data
Managed Equations are
created and stored in
Visio
Direct Equations
in Excel
Solve
List of Managed
EquationsOn/Off switch
controls whether or
not equation will beapplied when
Calculator is run
NUM
Creating Managed Equations
Non Value Added (Days) =Inventory (Units)
Daily Demand (Units/Day)
In this example, we will set up a Managed Equation to calculate the Non-Value added (NVA)
times associated with inventory and daily demand. The equation is:
78
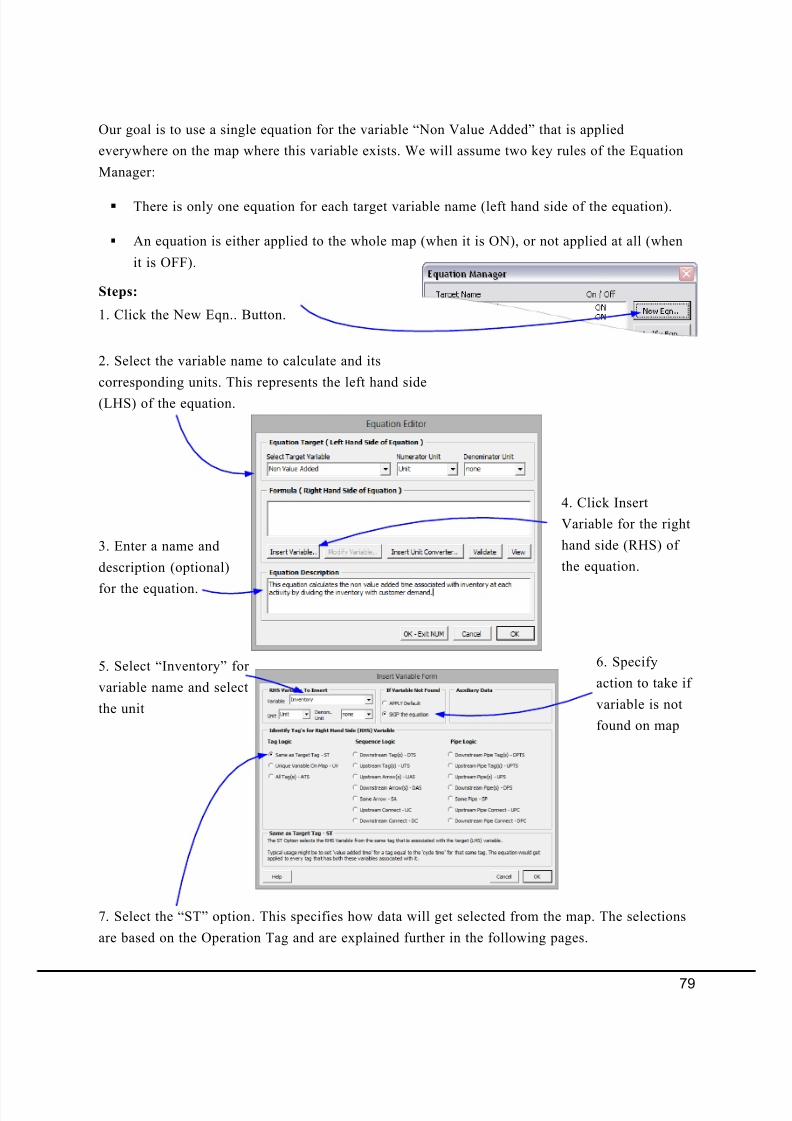
8/13/2019 PocketBook VSM
http://slidepdf.com/reader/full/pocketbook-vsm 81/93
Our goal is to use a single equation for the variable “Non Value Added” that is applied
everywhere on the map where this variable exists. We will assume two key rules of the Equation
Manager:
§ There is only one equation for each target variable name (left hand side of the equation).
§ An equation is either applied to the whole map (when it is ON), or not applied at all (when
it is OFF).
Steps:
1. Click the New Eqn.. Button.
3. Enter a name and
description (optional)
for the equation.
2. Select the variable name to calculate and its
corresponding units. This represents the left hand side
(LHS) of the equation.
4. Click Insert
Variable for the right
hand side (RHS) of
the equation.
5. Select “Inventory” for
variable name and select
the unit
6. Specify
action to take if
variable is not
found on map
7. Select the “ST” option. This specifies how data will get selected from the map. The selections
are based on the Operation Tag and are explained further in the following pages.
79
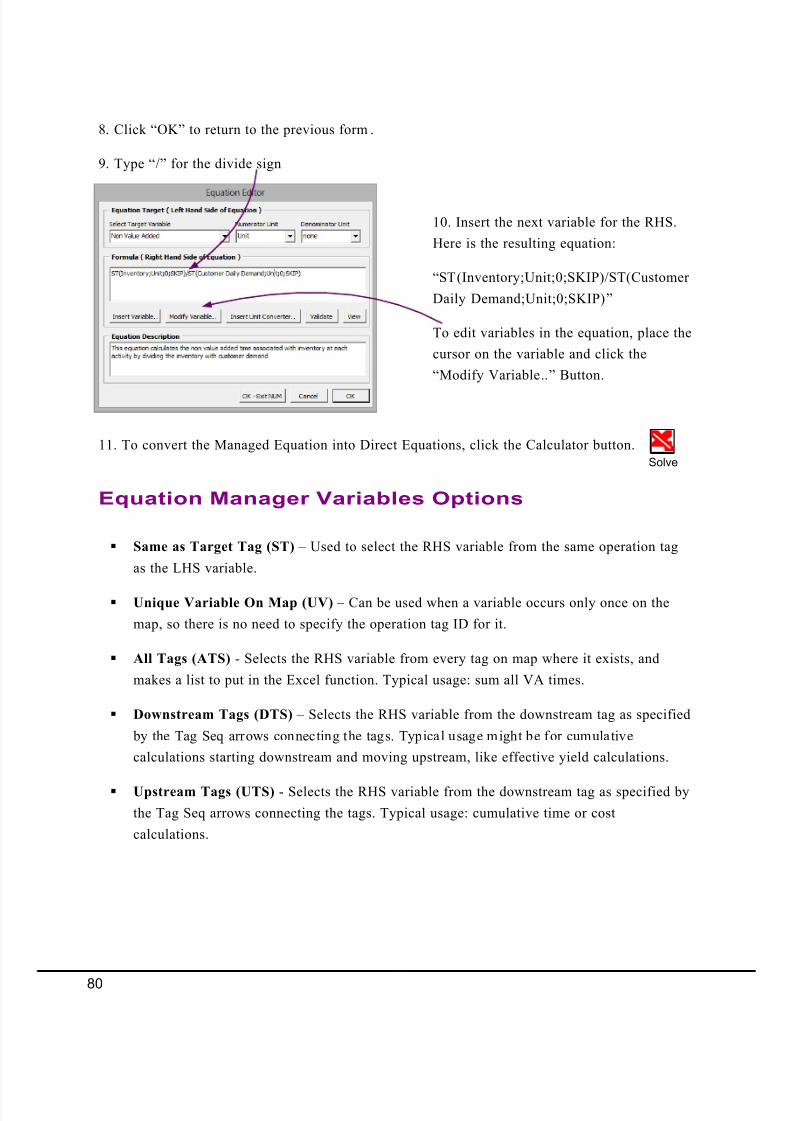
8/13/2019 PocketBook VSM
http://slidepdf.com/reader/full/pocketbook-vsm 82/93
8. Click “OK” to return to the previous form .
9. Type “/” for the divide sign
Solve
Equation Manager Variables Options
§ Same as Target Tag (ST) – Used to select the RHS variable from the same operation tag
as the LHS variable.
§ Unique Variable On Map (UV) – Can be used when a variable occurs only once on the
map, so there is no need to specify the operation tag ID for it.
§ All Tags (ATS) - Selects the RHS variable from every tag on map where it exists, and
makes a list to put in the Excel function. Typical usage: sum all VA times.
§ Downstream Tags (DTS) – Selects the RHS variable from the downstream tag as specified
by the Tag Seq arrows connecting the tags. Typical usage might be for cumulative
calculations starting downstream and moving upstream, like effective yield calculations.
§ Upstream Tags (UTS) - Selects the RHS variable from the downstream tag as specified by
the Tag Seq arrows connecting the tags. Typical usage: cumulative time or cost
calculations.
11. To convert the Managed Equation into Direct Equations, click the Calculator button.
10. Insert the next variable for the RHS.
Here is the resulting equation:
“ST(Inventory;Unit;0;SKIP)/ST(Customer
Daily Demand;Unit;0;SKIP)”
To edit variables in the equation, place the
cursor on the variable and click the
“Modify Variable..” Button.
80
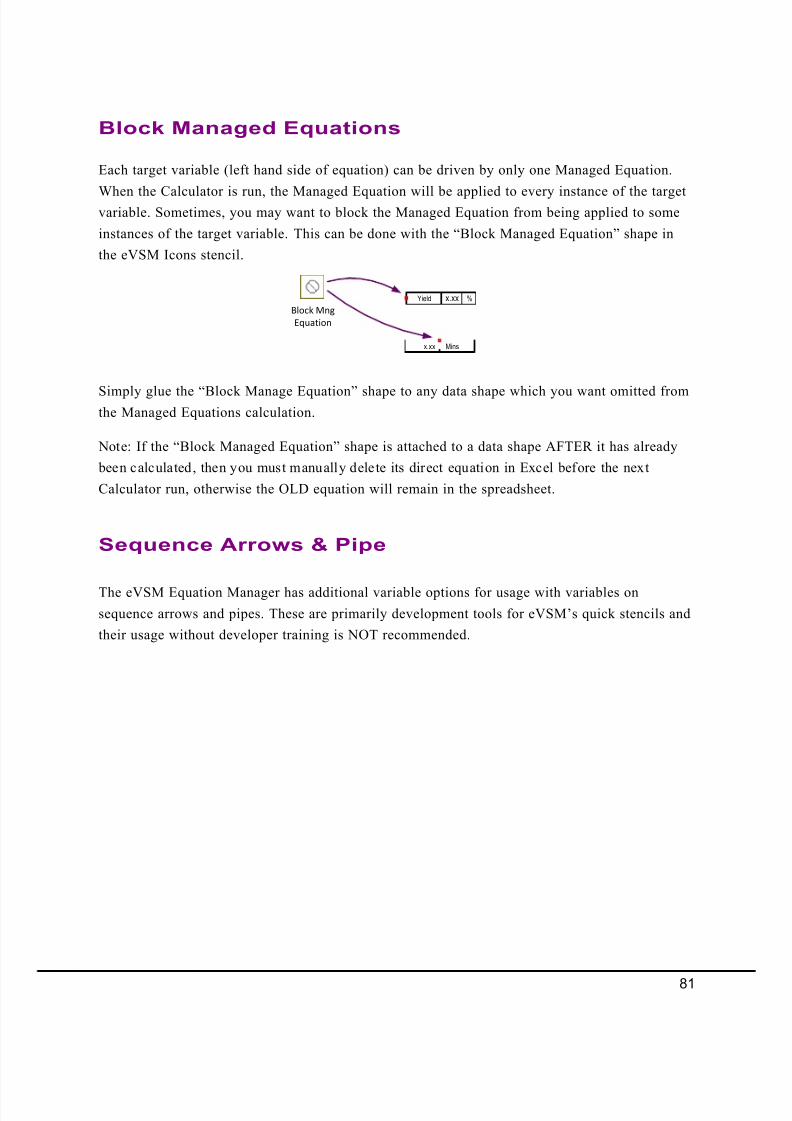
8/13/2019 PocketBook VSM
http://slidepdf.com/reader/full/pocketbook-vsm 83/93
Block Managed Equations
Each target variable (left hand side of equation) can be driven by only one Managed Equation.
When the Calculator is run, the Managed Equation will be applied to every instance of the targetvariable. Sometimes, you may want to block the Managed Equation from being applied to some
instances of the target variable. This can be done with the “Block Managed Equation” shape in
the eVSM Icons stencil.
Simply glue the “Block Manage Equation” shape to any data shape which you want omitted fromthe Managed Equations calculation.
Note: If the “Block Managed Equation” shape is attached to a data shape AFTER it has already
been calculated, then you must manually delete its direct equation in Excel before the next
Calculator run, otherwise the OLD equation will remain in the spreadsheet.
Block Mng
Equation
x.xxYield %
x.xx Mins
Sequence Arrows & Pipe
The eVSM Equation Manager has additional variable options for usage with variables on
sequence arrows and pipes. These are primarily development tools for eVSM’s quick stencils and
their usage without developer training is NOT recommended.
81
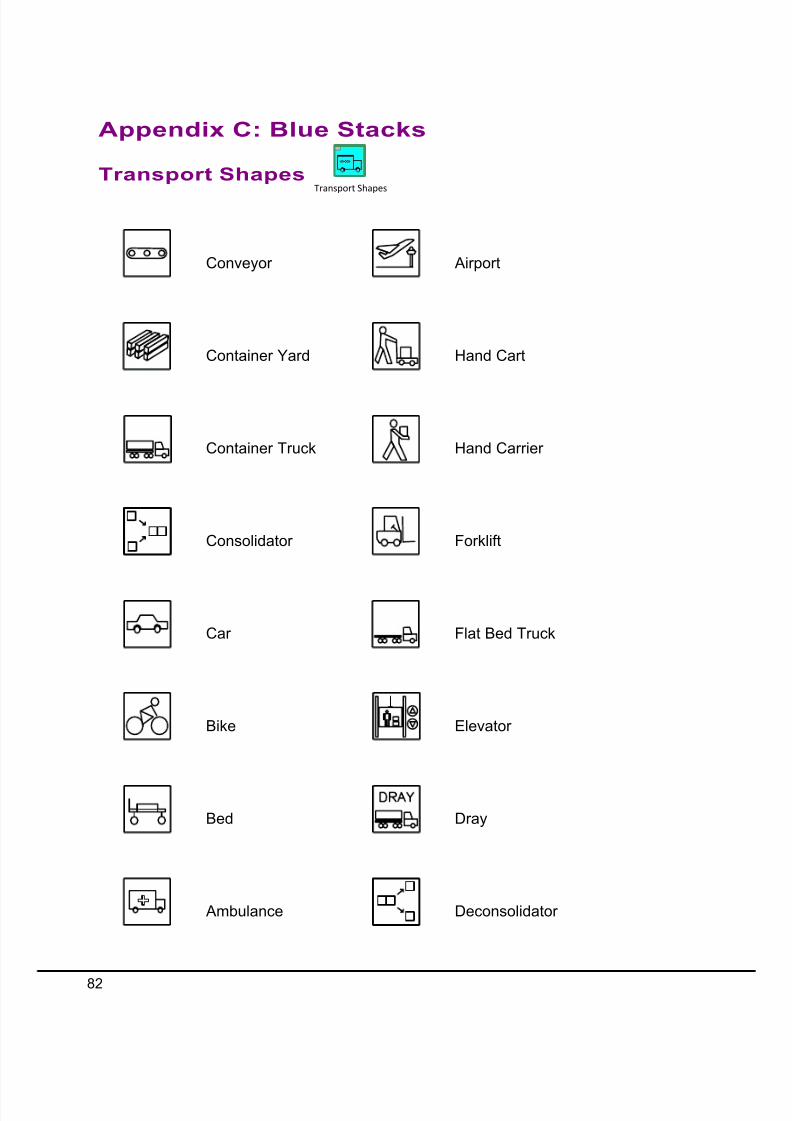
8/13/2019 PocketBook VSM
http://slidepdf.com/reader/full/pocketbook-vsm 84/93
Appendix C: Blue Stacks
Transport Shapes
Airport
Ambulance
Bed
Bike
Car
Consolidator
Container Truck
Container Yard
Conveyor
Transport Shapes
Deconsolidator
Dray
Elevator
Flat Bed Truck
Forklift
Hand Carrier
Hand Cart
82
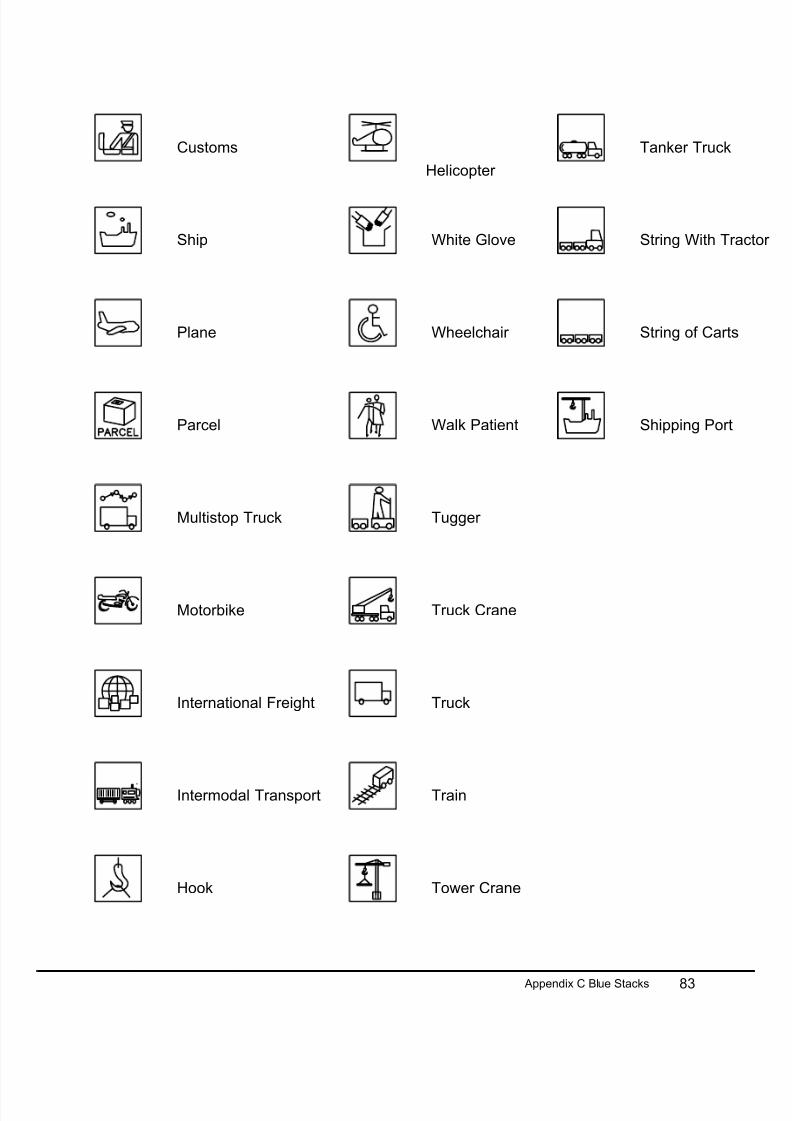
8/13/2019 PocketBook VSM
http://slidepdf.com/reader/full/pocketbook-vsm 85/93
Customs
Helicopter
Hook
Intermodal Transport
International Freight
Motorbike
Multistop Truck
Parcel
Plane
Ship
Shipping Port
String of Carts
String With Tra
Tanker Truck
Tower Crane
Train
Truck
Truck Crane
Tugger
Walk Patient
Wheelchair
White Glove
83 Appendix C Blue Stacks
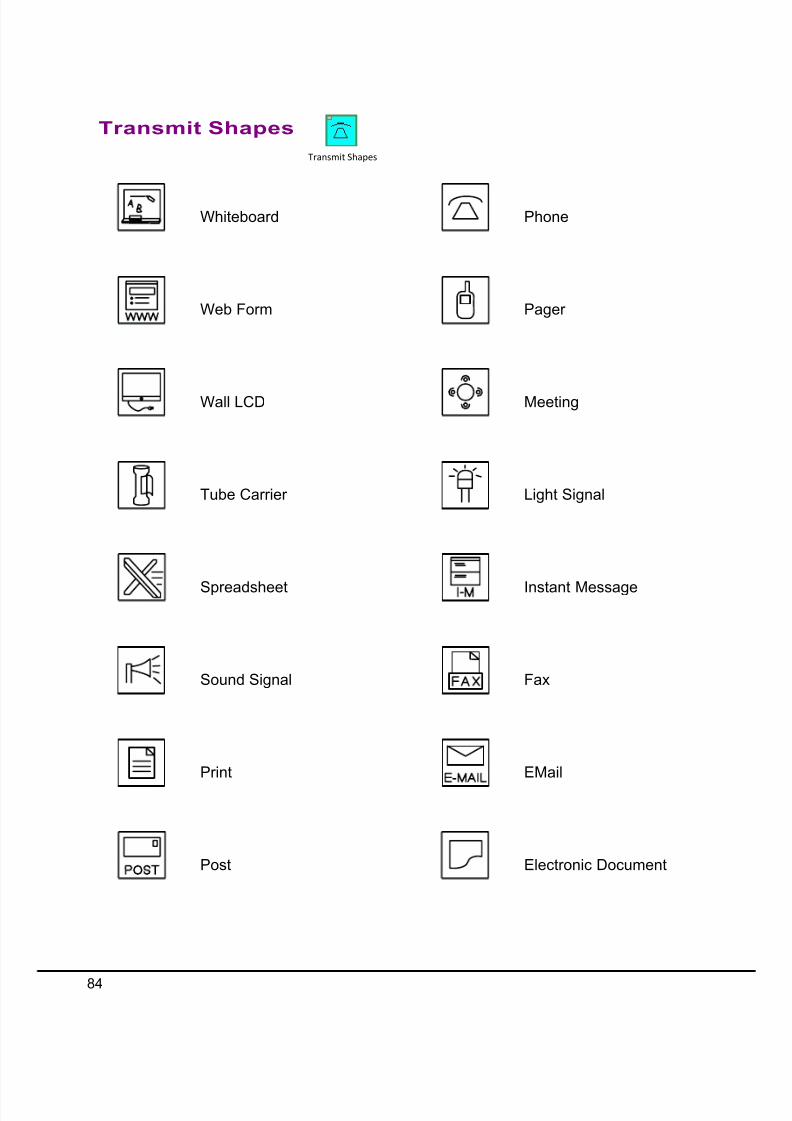
8/13/2019 PocketBook VSM
http://slidepdf.com/reader/full/pocketbook-vsm 86/93
Transmit Shapes
Transmit Shapes
Electronic Document
Fax
Instant Message
Light Signal
Meeting
Pager
Phone
Post
Sound Signal
Spreadsheet
Tube Carrier
Wall LCD
Web Form
Whiteboard
84

8/13/2019 PocketBook VSM
http://slidepdf.com/reader/full/pocketbook-vsm 87/93
By Foot
Color Flags
Computer
Database
85 Appendix C Blue Stacks
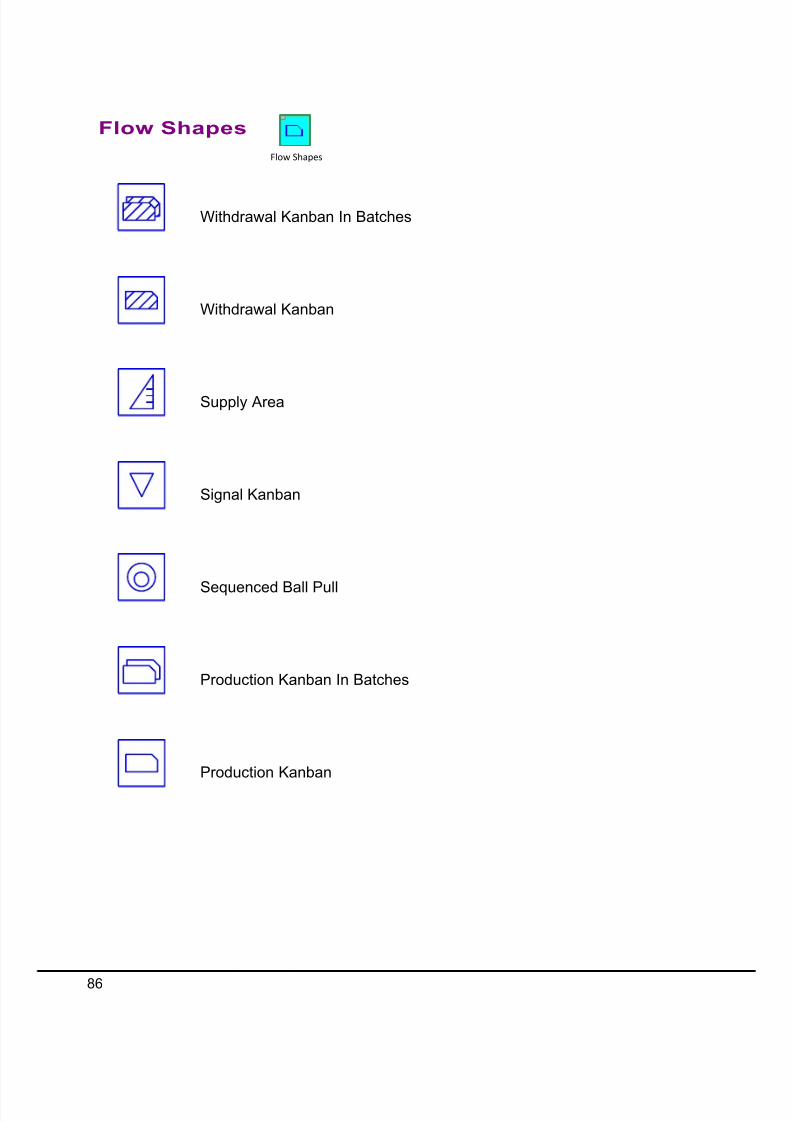
8/13/2019 PocketBook VSM
http://slidepdf.com/reader/full/pocketbook-vsm 88/93
Flow Shapes
Flow Shapes
Production Kanban
Production Kanban In Batches
Sequenced Ball Pull
Signal Kanban
Supply Area
Withdrawal Kanban
Withdrawal Kanban In Batches
86
8/13/2019 PocketBook VSM
http://slidepdf.com/reader/full/pocketbook-vsm 89/93
“Go See” Scheduling
Bottleneck
FIFO
Kanban Post
Load Leveling
Lot Formation
87 Appendix C Blue Stacks
8/13/2019 PocketBook VSM
http://slidepdf.com/reader/full/pocketbook-vsm 90/93
Index
A
a3 report 52
aligntimeline 20
arrows 68
autopath 27
B
blue icons 6
C
calculator 75
calculator problems 76
chart variables 44,42
check 32
communication circle 59
corrected 27
current set 13
cycle time 39
D
data blocks 15
direct equations 78
Eenable macros 3
equation manager 80,78
evsm stencils 5
F
flying connectors 72
fractional units 14
G
gadget collections 38
gadget color-coding 39
gadget hide/show 39
gadget key points 40
gadget scale factor 39
grid 5
H
help 62
K
kaizen cloud 54
kaizen impact matrix 49
kaizen report 48
kaizen starburst 54
key creator 16
L
ladder chart 45
lean enterprise institute 4
list variables 16
M
main stencil 3
managed equations 78
milestone chart 44
N
name & unit manager 13
non value added 72
nva 72
O
open sketcher 10
operational data 68
P
pipes 81
printing 8
Q
quick stencil 3
S
security setting 3
shapes 4
snap 5
solve 34
spaghetti diagram 57
spaghetti place 58
spaghetti report 57
spaghetti scale 58
88
8/13/2019 PocketBook VSM
http://slidepdf.com/reader/full/pocketbook-vsm 91/93
stencils 4
swimlane 75
Ttag seq arrow 27
tags 80
takt time 39
text editing 5
transport shapes 73
U
unit family 74
units converter 74,12
V
v6 migration 56
va 72
value added 72
visual gadgets 37
W
www.evsm.com/updates 3
X
xy chart 42
Z
zooming 7
89 Appendix C Blue Stacks

8/13/2019 PocketBook VSM
http://slidepdf.com/reader/full/pocketbook-vsm 92/9390

8/13/2019 PocketBook VSM
http://slidepdf.com/reader/full/pocketbook-vsm 93/93