Embed Size (px)
Citation preview

¨
APPLICANT TRACKING SYSTEMS SOFTWAREJanuary 2017
CONTENTS4678
3334
Introduction
Defining ATS Software
The Quadrant
ATS FrontRunners Index
Runners Up
Methodology Basics
FRONTRUNNERS9 Greenhouse
10 BambooHR
11 ApplicantPRO
12 Recruiterbox
13 Workable
14 HiringThing
15 PCRecruiter
16 IBMKenexaBrassRing
17 JazzHR
18 PeopleMatter
19 Lever
20 Jobscience
21 HireCentric
22 Ascentis
23 ClearCompany
24 Newton
25 APS
26 TheApplicantManager
27 Zoho Recruit
28 Fitzii
29 SmartSearch
30 JobAdder
31 BirdDogHR
32 myStaffingPro
4J A N U A R Y 2 0 1 7
INTRODUCTION
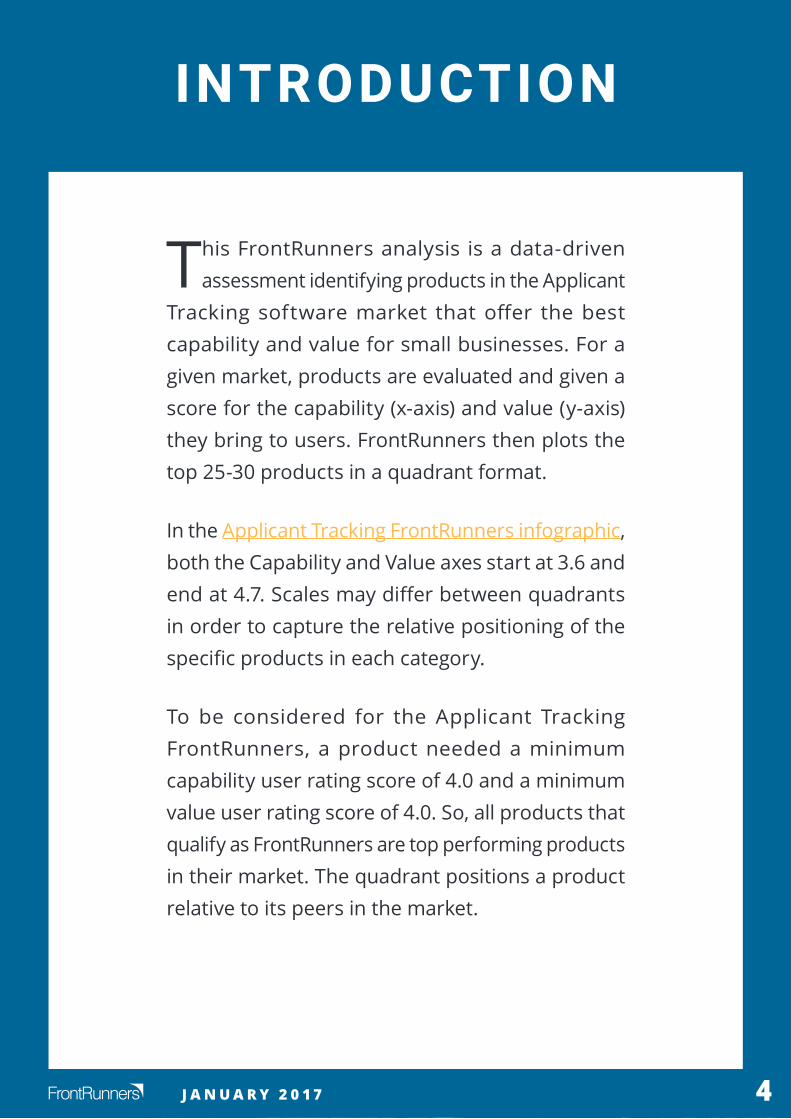
This FrontRunners analysis is a data-driven assessment identifying products in the Applicant
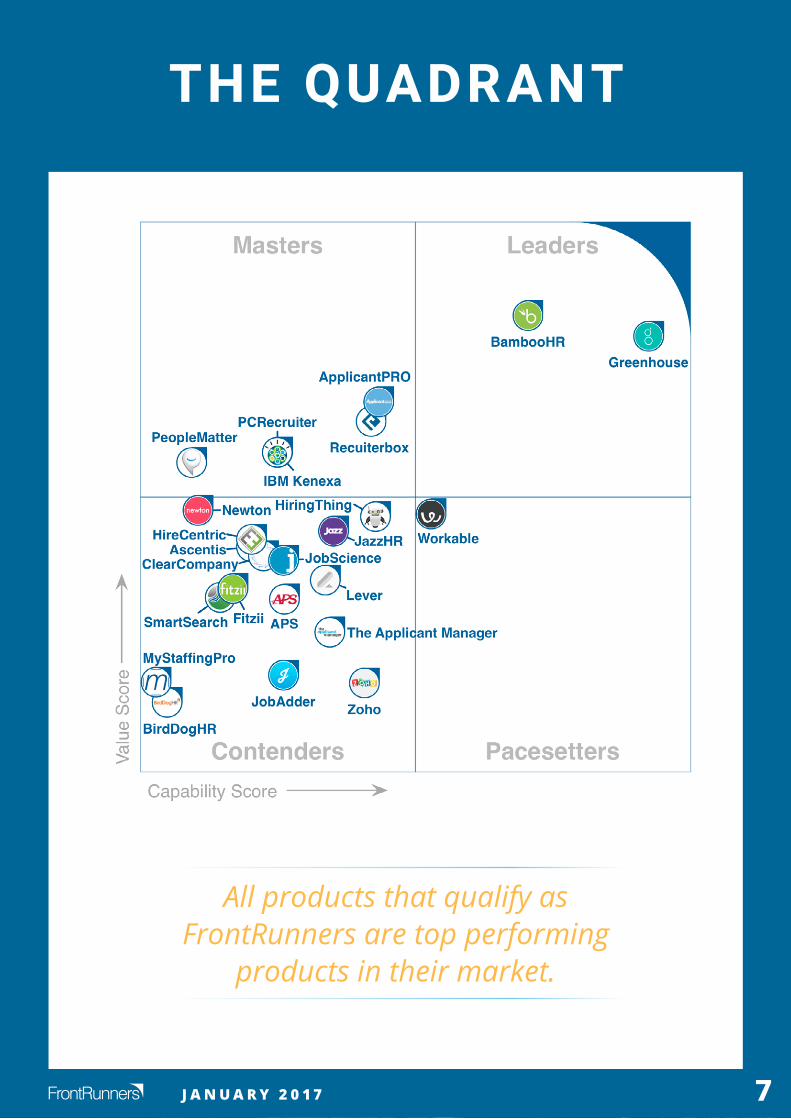
Tracking software market that offer the best capability and value for small businesses. For a given market, products are evaluated and given a score for the capability (x-axis) and value (y-axis) they bring to users. FrontRunners then plots the top 25-30 products in a quadrant format.
In the Applicant Tracking FrontRunners infographic, both the Capability and Value axes start at 3.6 and end at 4.7. Scales may differ between quadrants in order to capture the relative positioning of the specific products in each category.
To be considered for the Applicant Tracking FrontRunners, a product needed a minimum capability user rating score of 4.0 and a minimum value user rating score of 4.0. So, all products that qualify as FrontRunners are top performing products in their market. The quadrant positions a product relative to its peers in the market.
I N T R O D U C T I O N
5J A N U A R Y 2 0 1 7
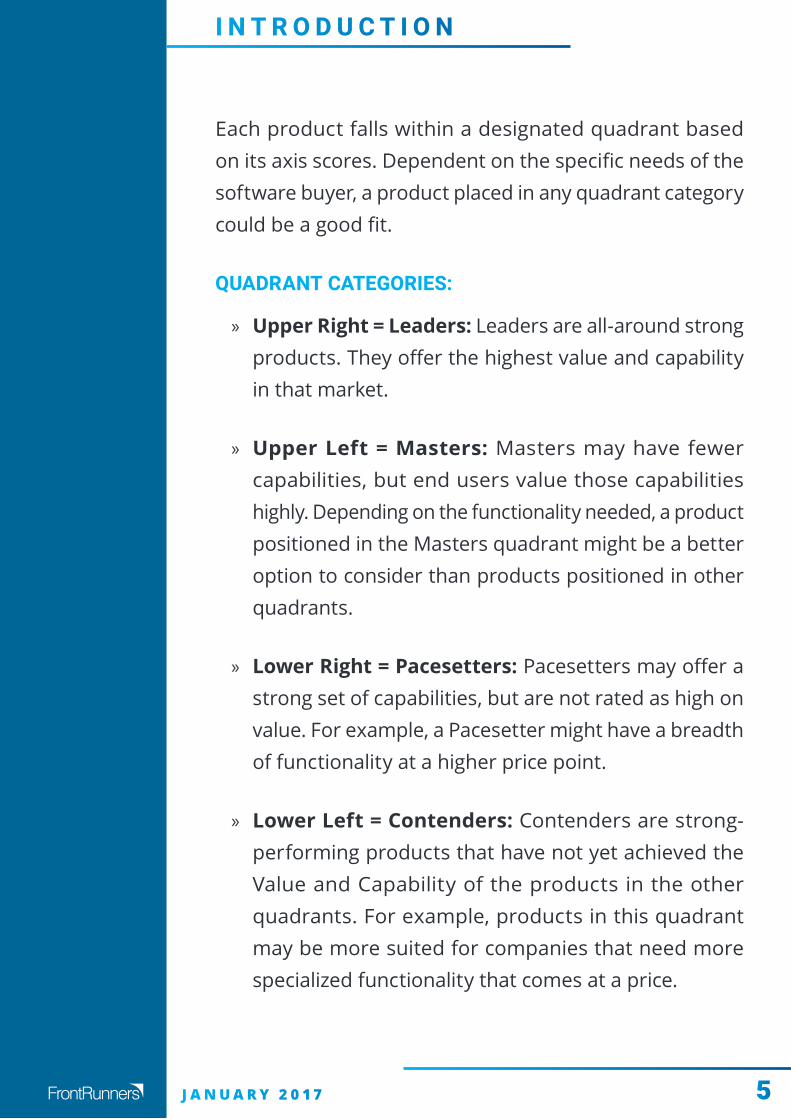
Each product falls within a designated quadrant based on its axis scores. Dependent on the specific needs of the software buyer, a product placed in any quadrant category could be a good fit.
QUADRANT CATEGORIES:
» Upper Right = Leaders: Leaders are all-around strong products. They offer the highest value and capability in that market.
» Upper Left = Masters: Masters may have fewer capabilities, but end users value those capabilities highly. Depending on the functionality needed, a product positioned in the Masters quadrant might be a better option to consider than products positioned in other quadrants.
» Lower Right = Pacesetters: Pacesetters may offer a strong set of capabilities, but are not rated as high on value. For example, a Pacesetter might have a breadth of functionality at a higher price point.
» Lower Left = Contenders: Contenders are strong-performing products that have not yet achieved the Value and Capability of the products in the other quadrants. For example, products in this quadrant may be more suited for companies that need more specialized functionality that comes at a price.
6J A N U A R Y 2 0 1 7
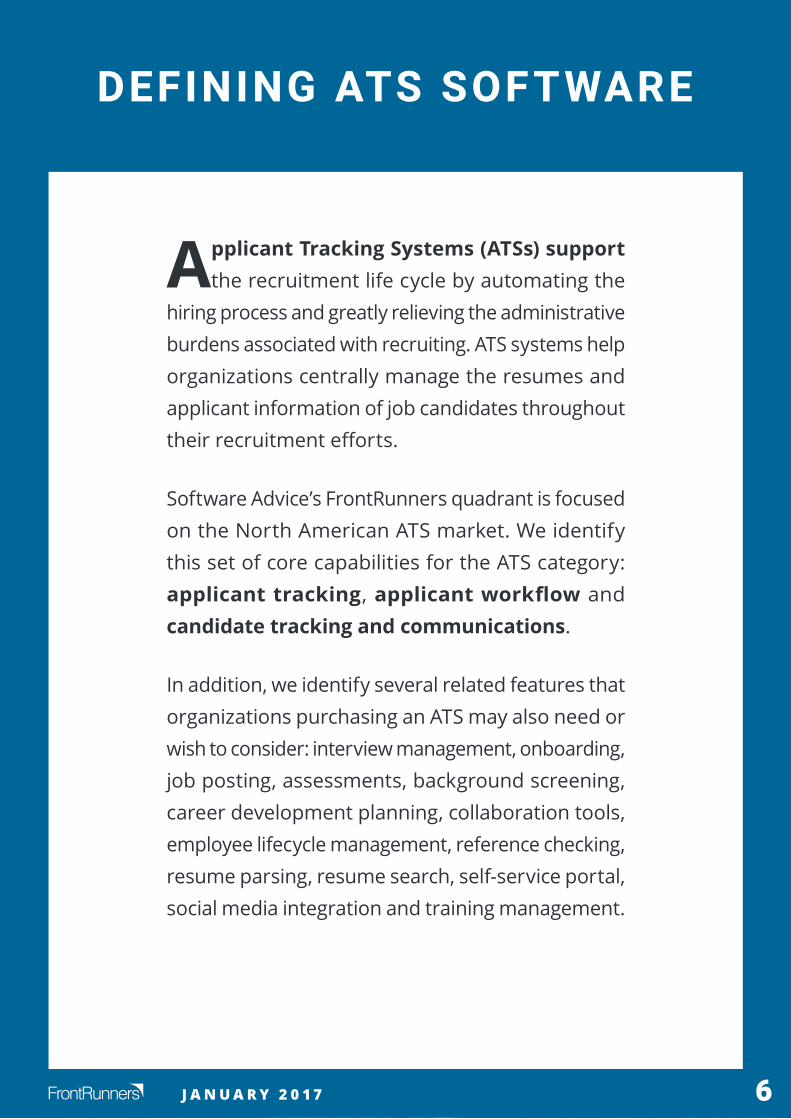
ApplicantTrackingSystems(ATSs)support the recruitment life cycle by automating the
hiring process and greatly relieving the administrative burdens associated with recruiting. ATS systems help organizations centrally manage the resumes and applicant information of job candidates throughout their recruitment efforts.
Software Advice’s FrontRunners quadrant is focused on the North American ATS market. We identify this set of core capabilities for the ATS category: applicant tracking, applicantworkflow and candidate tracking and communications.
In addition, we identify several related features that organizations purchasing an ATS may also need or wish to consider: interview management, onboarding, job posting, assessments, background screening, career development planning, collaboration tools, employee lifecycle management, reference checking, resume parsing, resume search, self-service portal, social media integration and training management.
DEFINING ATS SOFTWARE
7J A N U A R Y 2 0 1 7
THE QUADRANT
All products that qualify as FrontRunners are top performing
products in their market.
8J A N U A R Y 2 0 1 7
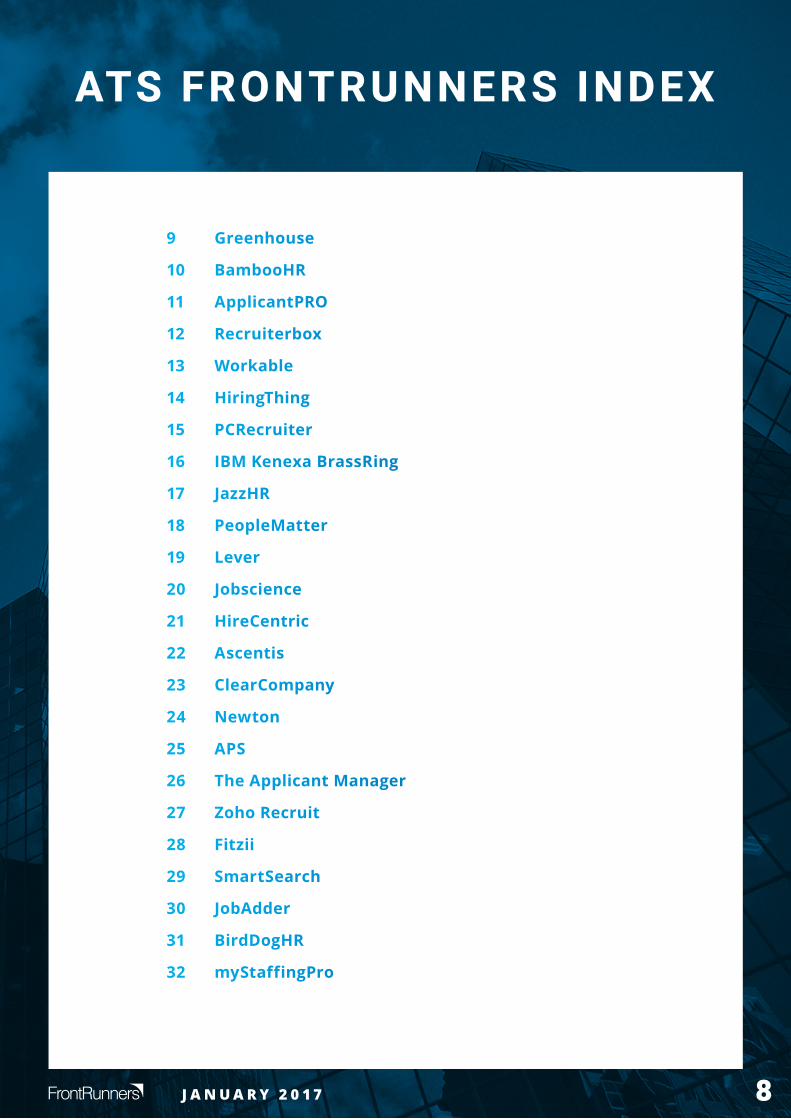
ATS FRONTRUNNERS INDEX
9 Greenhouse
10 BambooHR
11 ApplicantPRO
12 Recruiterbox
13 Workable
14 HiringThing
15 PCRecruiter
16 IBM Kenexa BrassRing
17 JazzHR
18 PeopleMatter
19 Lever
20 Jobscience
21 HireCentric
22 Ascentis
23 ClearCompany
24 Newton
25 APS
26 TheApplicantManager
27 Zoho Recruit
28 Fitzii
29 SmartSearch
30 JobAdder
31 BirdDogHR
32 myStaffingPro

9
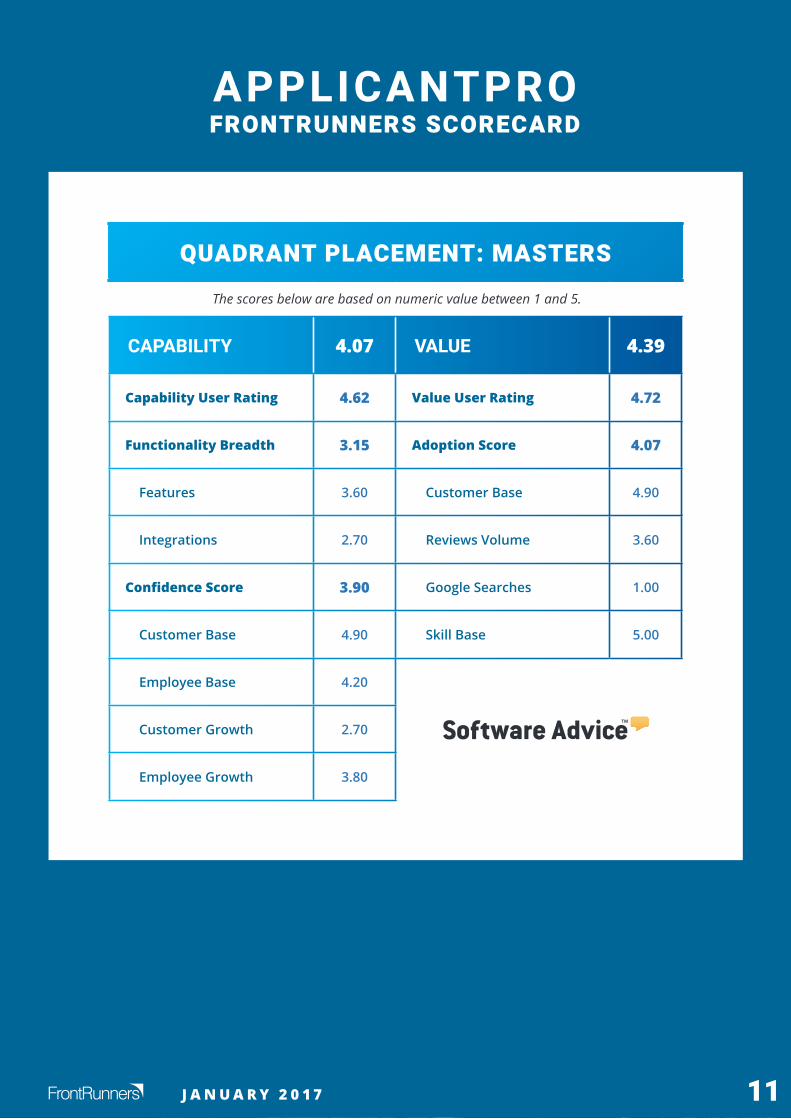
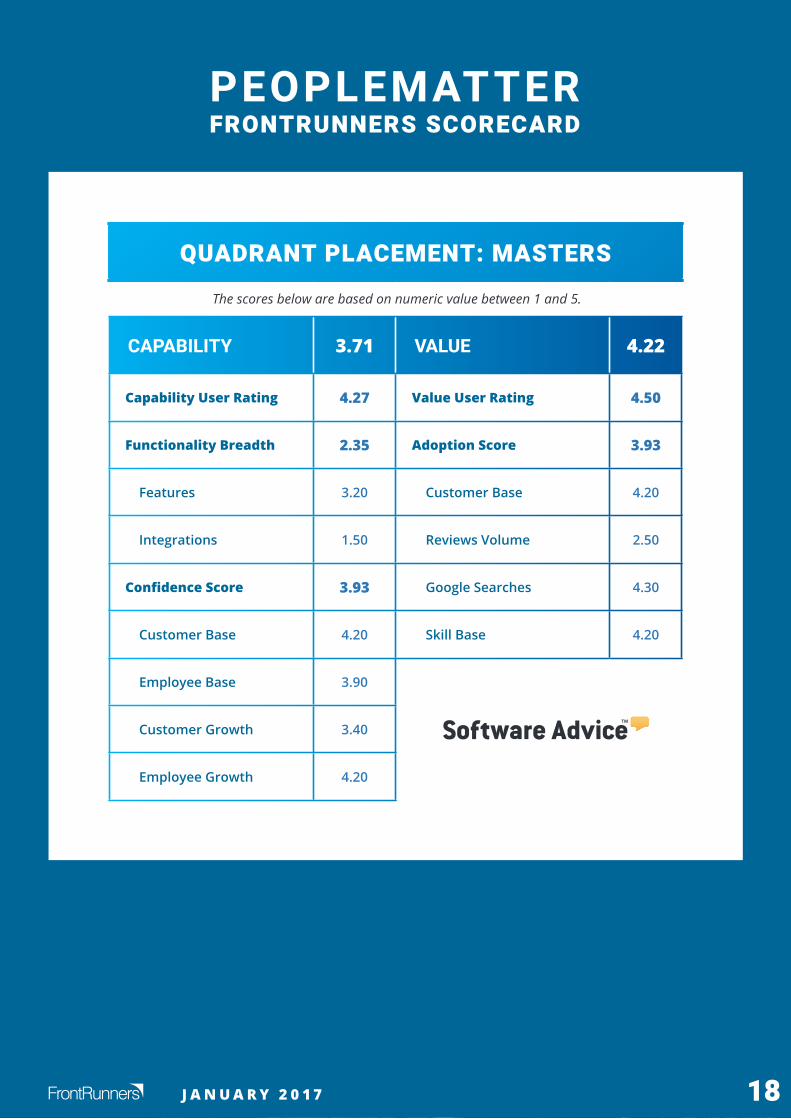
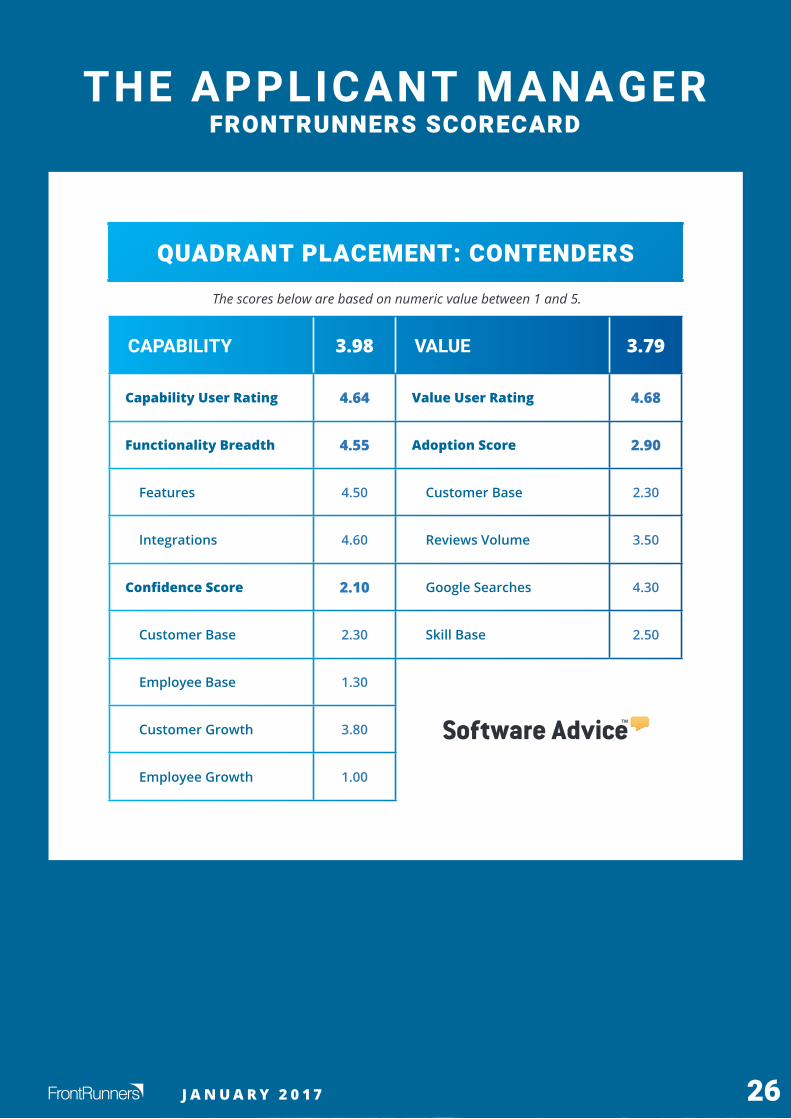
The scores below are based on numeric value between 1 and 5.
CAPABILITY VALUE
Capability User Rating Value User Rating
Functionality Breadth Adoption Score
Features Customer Base
Integrations Reviews Volume
Confidence Score Google Searches
Customer Base Skill Base
Employee Base
Customer Growth
Employee Growth
J A N U A R Y 2 0 1 7
FRONTRUNNERS SCORECARDGREENHOUSE
QUADRANT PLACEMENT: LEADERS
4.62 4.55
4.52 4.55
4.75 4.55
4.50 4.80
5.00 4.70
4.68 5.00
4.80 4.00
4.60
4.70
4.60
10
The scores below are based on numeric value between 1 and 5.
CAPABILITY VALUE
Capability User Rating Value User Rating
Functionality Breadth Adoption Score
Features Customer Base
Integrations Reviews Volume
Confidence Score Google Searches
Customer Base Skill Base
Employee Base
Customer Growth
Employee Growth
J A N U A R Y 2 0 1 7
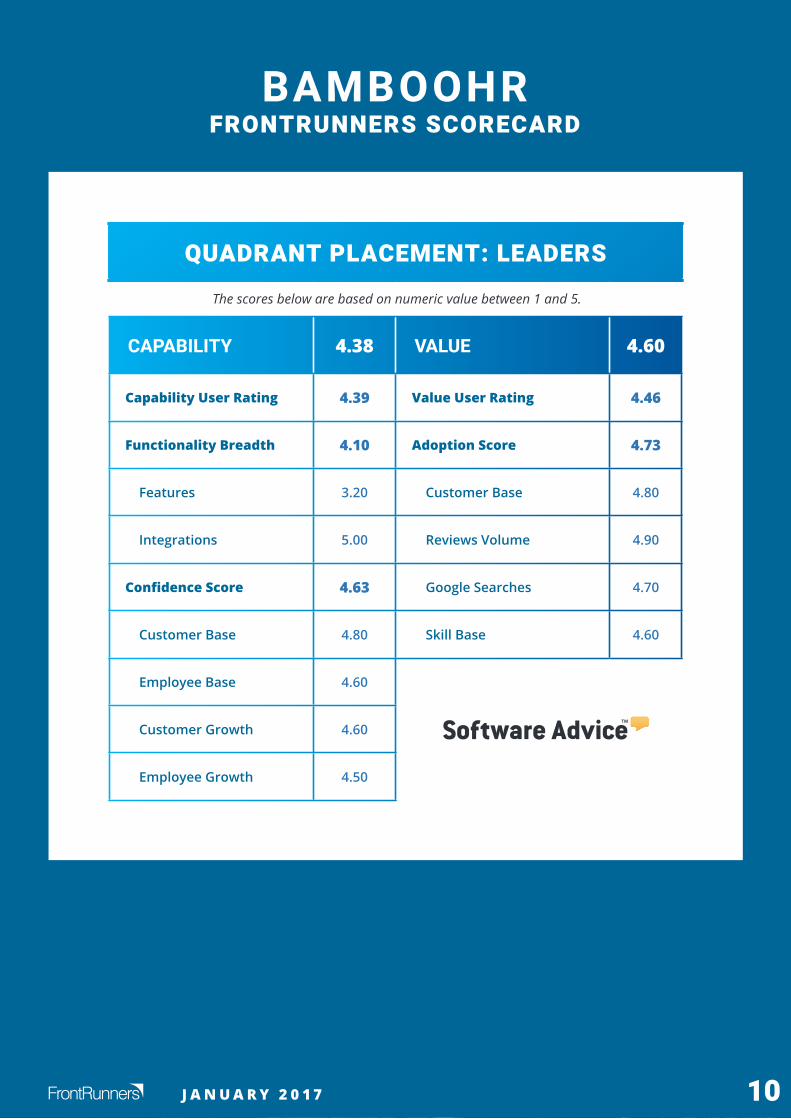
FRONTRUNNERS SCORECARDBAMBOOHR
QUADRANT PLACEMENT: LEADERS
4.38 4.60
4.39 4.46
4.10 4.73
3.20 4.80
5.00 4.90
4.63 4.70
4.80 4.60
4.60
4.60
4.50
11
The scores below are based on numeric value between 1 and 5.
CAPABILITY VALUE
Capability User Rating Value User Rating
Functionality Breadth Adoption Score
Features Customer Base
Integrations Reviews Volume
Confidence Score Google Searches
Customer Base Skill Base
Employee Base
Customer Growth
Employee Growth
J A N U A R Y 2 0 1 7
FRONTRUNNERS SCORECARDAPPLICANTPRO
QUADRANT PLACEMENT: MASTERS
4.07 4.39
4.62 4.72
3.15 4.07
3.60 4.90
2.70 3.60
3.90 1.00
4.90 5.00
4.20
2.70
3.80

12
The scores below are based on numeric value between 1 and 5.
CAPABILITY VALUE
Capability User Rating Value User Rating
Functionality Breadth Adoption Score
Features Customer Base
Integrations Reviews Volume
Confidence Score Google Searches
Customer Base Skill Base
Employee Base
Customer Growth
Employee Growth
J A N U A R Y 2 0 1 7
FRONTRUNNERS SCORECARDRECRUITERBOX
QUADRANT PLACEMENT: MASTERS
4.06 4.33
4.57 4.69
2.95 3.97
2.70 4.70
3.20 4.20
4.15 1.00
4.70 4.60
3.40
4.10
4.40
13
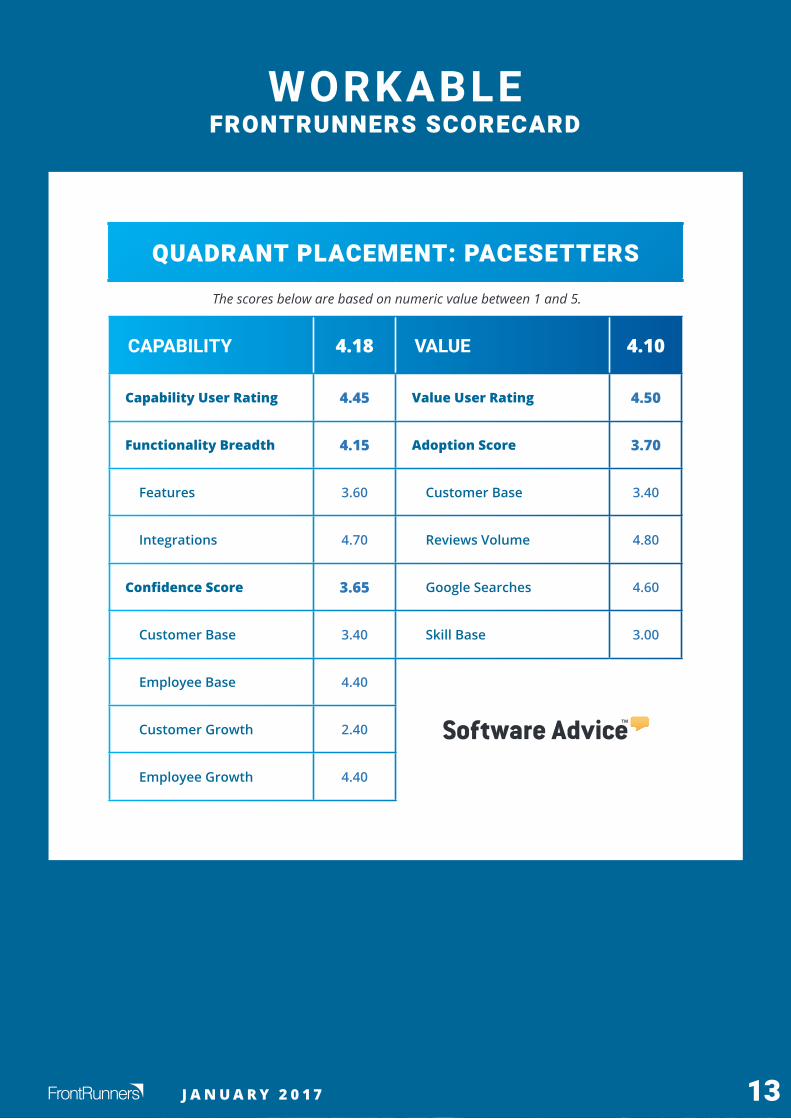
The scores below are based on numeric value between 1 and 5.
CAPABILITY VALUE
Capability User Rating Value User Rating
Functionality Breadth Adoption Score
Features Customer Base
Integrations Reviews Volume
Confidence Score Google Searches
Customer Base Skill Base
Employee Base
Customer Growth
Employee Growth
J A N U A R Y 2 0 1 7
FRONTRUNNERS SCORECARDWORKABLE
QUADRANT PLACEMENT: PACESETTERS
4.18 4.10
4.45 4.50
4.15 3.70
3.60 3.40
4.70 4.80
3.65 4.60
3.40 3.00
4.40
2.40
4.40

14
The scores below are based on numeric value between 1 and 5.
CAPABILITY VALUE
Capability User Rating Value User Rating
Functionality Breadth Adoption Score
Features Customer Base
Integrations Reviews Volume
Confidence Score Google Searches
Customer Base Skill Base
Employee Base
Customer Growth
Employee Growth
J A N U A R Y 2 0 1 7
FRONTRUNNERS SCORECARDHIRINGTHING
QUADRANT PLACEMENT: CONTENDERS
4.07 4.09
4.60 4.65
4.05 3.53
4.50 3.60
3.60 3.00
3.05 3.60
3.60 3.70
1.60
3.90
3.10

15
The scores below are based on numeric value between 1 and 5.
CAPABILITY VALUE
Capability User Rating Value User Rating
Functionality Breadth Adoption Score
Features Customer Base
Integrations Reviews Volume
Confidence Score Google Searches
Customer Base Skill Base
Employee Base
Customer Growth
Employee Growth
J A N U A R Y 2 0 1 7
FRONTRUNNERS SCORECARDPCRECRUITER
QUADRANT PLACEMENT: MASTERS
3.88 4.26
4.14 4.13
4.05 4.38
3.20 4.40
4.90 4.50
3.20 3.60
4.40 4.70
3.80
1.90
2.70
16
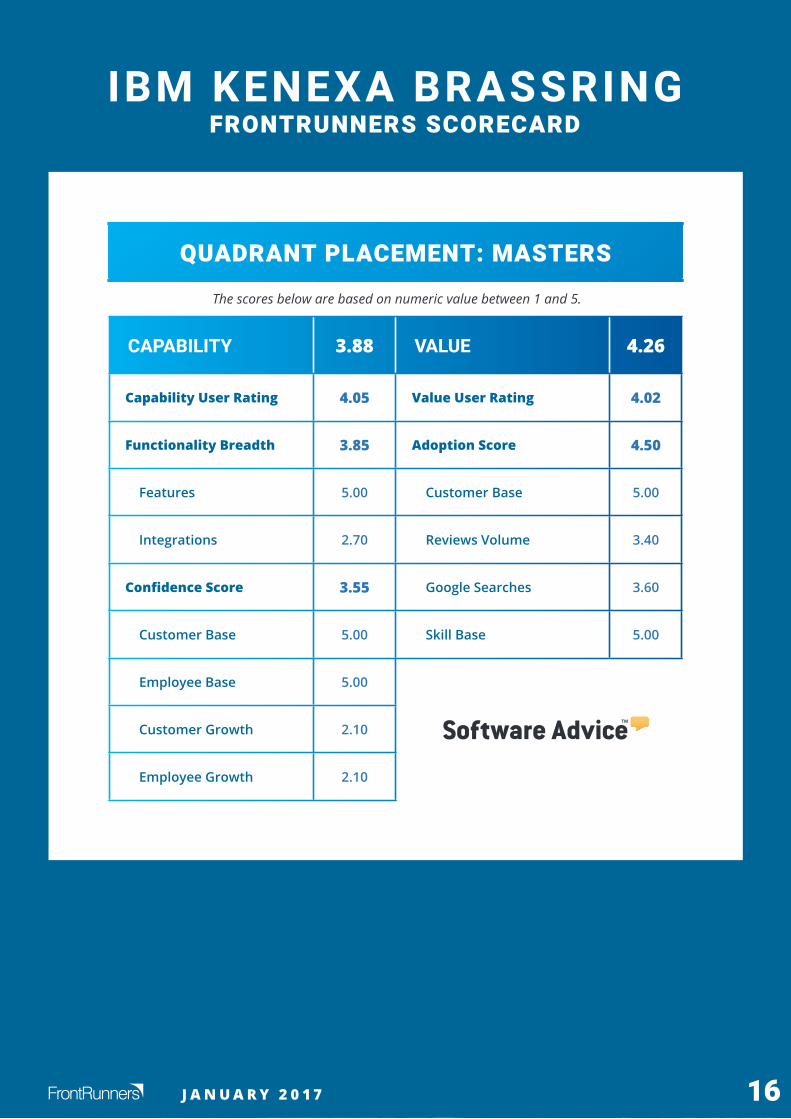
The scores below are based on numeric value between 1 and 5.
CAPABILITY VALUE
Capability User Rating Value User Rating
Functionality Breadth Adoption Score
Features Customer Base
Integrations Reviews Volume
Confidence Score Google Searches
Customer Base Skill Base
Employee Base
Customer Growth
Employee Growth
J A N U A R Y 2 0 1 7
FRONTRUNNERS SCORECARDIBM KENEXA BRASSRING
QUADRANT PLACEMENT: MASTERS
3.88 4.26
4.05 4.02
3.85 4.50
5.00 5.00
2.70 3.40
3.55 3.60
5.00 5.00
5.00
2.10
2.10
17
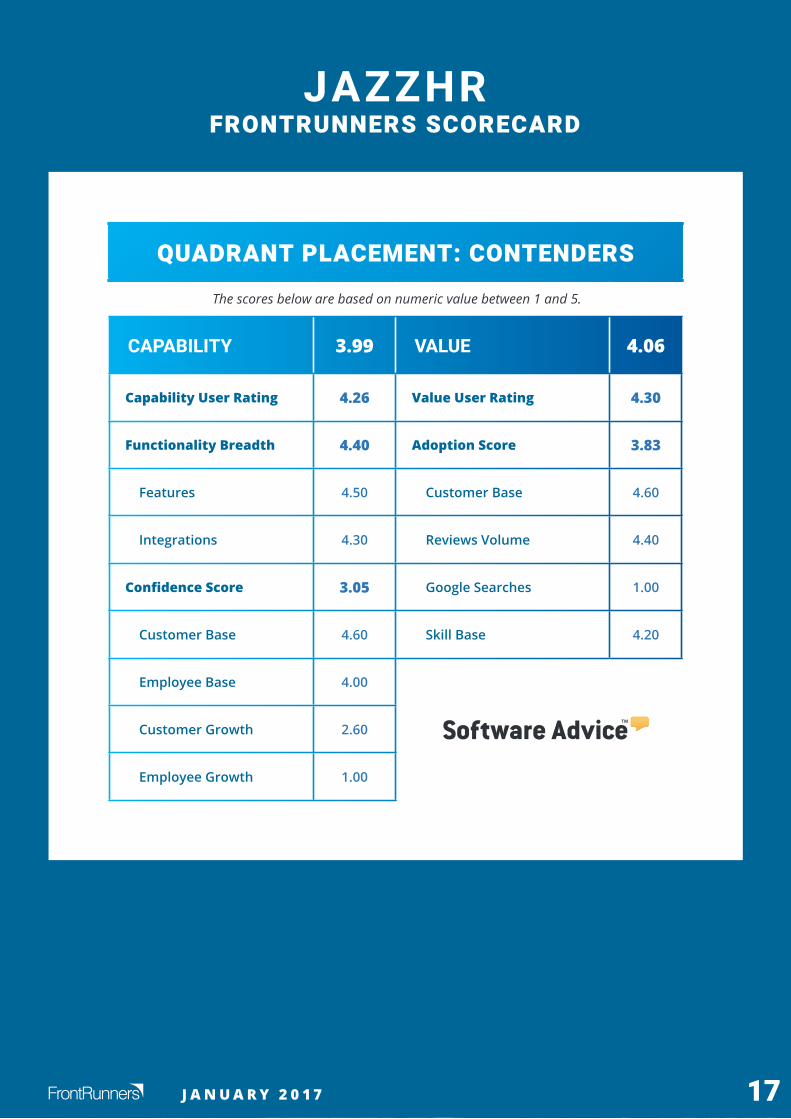
The scores below are based on numeric value between 1 and 5.
CAPABILITY VALUE
Capability User Rating Value User Rating
Functionality Breadth Adoption Score
Features Customer Base
Integrations Reviews Volume
Confidence Score Google Searches
Customer Base Skill Base
Employee Base
Customer Growth
Employee Growth
J A N U A R Y 2 0 1 7
FRONTRUNNERS SCORECARDJAZZHR
QUADRANT PLACEMENT: CONTENDERS
3.99 4.06
4.26 4.30
4.40 3.83
4.50 4.60
4.30 4.40
3.05 1.00
4.60 4.20
4.00
2.60
1.00
18
The scores below are based on numeric value between 1 and 5.
CAPABILITY VALUE
Capability User Rating Value User Rating
Functionality Breadth Adoption Score
Features Customer Base
Integrations Reviews Volume
Confidence Score Google Searches
Customer Base Skill Base
Employee Base
Customer Growth
Employee Growth
J A N U A R Y 2 0 1 7
FRONTRUNNERS SCORECARDPEOPLEMATTER
QUADRANT PLACEMENT: MASTERS
3.71 4.22
4.27 4.50
2.35 3.93
3.20 4.20
1.50 2.50
3.93 4.30
4.20 4.20
3.90
3.40
4.20
19
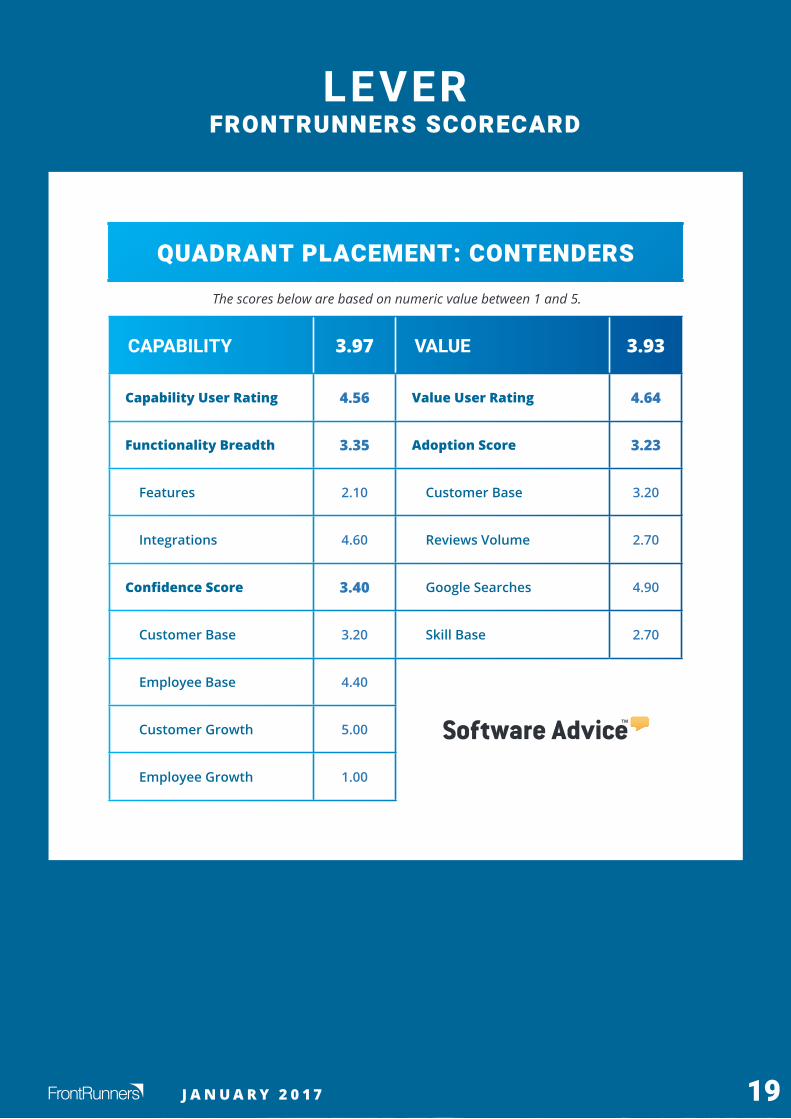
The scores below are based on numeric value between 1 and 5.
CAPABILITY VALUE
Capability User Rating Value User Rating
Functionality Breadth Adoption Score
Features Customer Base
Integrations Reviews Volume
Confidence Score Google Searches
Customer Base Skill Base
Employee Base
Customer Growth
Employee Growth
J A N U A R Y 2 0 1 7
FRONTRUNNERS SCORECARDLEVER
QUADRANT PLACEMENT: CONTENDERS
3.97 3.93
4.56 4.64
3.35 3.23
2.10 3.20
4.60 2.70
3.40 4.90
3.20 2.70
4.40
5.00
1.00

20
The scores below are based on numeric value between 1 and 5.
CAPABILITY VALUE
Capability User Rating Value User Rating
Functionality Breadth Adoption Score
Features Customer Base
Integrations Reviews Volume
Confidence Score Google Searches
Customer Base Skill Base
Employee Base
Customer Growth
Employee Growth
J A N U A R Y 2 0 1 7
FRONTRUNNERS SCORECARDJOBSCIENCE
QUADRANT PLACEMENT: CONTENDERS
3.89 3.98
4.16 4.19
3.90 3.77
3.60 4.30
4.20 3.40
3.35 1.00
4.30 4.80
4.20
2.20
2.70
21
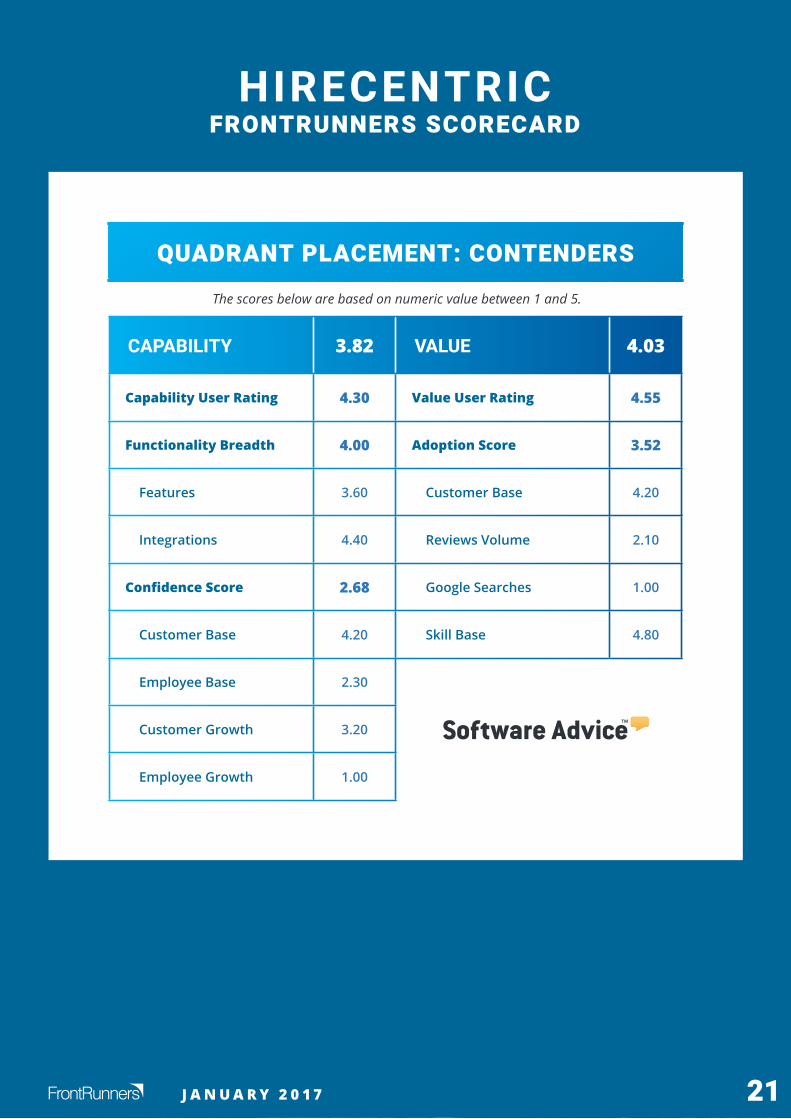
The scores below are based on numeric value between 1 and 5.
CAPABILITY VALUE
Capability User Rating Value User Rating
Functionality Breadth Adoption Score
Features Customer Base
Integrations Reviews Volume
Confidence Score Google Searches
Customer Base Skill Base
Employee Base
Customer Growth
Employee Growth
J A N U A R Y 2 0 1 7
FRONTRUNNERS SCORECARDHIRECENTRIC
QUADRANT PLACEMENT: CONTENDERS
3.82 4.03
4.30 4.55
4.00 3.52
3.60 4.20
4.40 2.10
2.68 1.00
4.20 4.80
2.30
3.20
1.00

22
The scores below are based on numeric value between 1 and 5.
CAPABILITY VALUE
Capability User Rating Value User Rating
Functionality Breadth Adoption Score
Features Customer Base
Integrations Reviews Volume
Confidence Score Google Searches
Customer Base Skill Base
Employee Base
Customer Growth
Employee Growth
J A N U A R Y 2 0 1 7
FRONTRUNNERS SCORECARDASCENTIS
QUADRANT PLACEMENT: CONTENDERS
3.82 4.02
4.47 4.25
2.40 3.78
2.70 4.60
2.10 1.20
3.95 4.50
4.60 3.90
4.50
2.90
3.80

23
The scores below are based on numeric value between 1 and 5.
CAPABILITY VALUE
Capability User Rating Value User Rating
Functionality Breadth Adoption Score
Features Customer Base
Integrations Reviews Volume
Confidence Score Google Searches
Customer Base Skill Base
Employee Base
Customer Growth
Employee Growth
J A N U A R Y 2 0 1 7
FRONTRUNNERS SCORECARDCLEARCOMPANY
QUADRANT PLACEMENT: CONTENDERS
3.85 3.99
4.30 4.32
2.55 3.65
3.60 4.00
1.50 4.10
4.23 1.00
4.00 4.40
4.00
4.30
4.60

24
The scores below are based on numeric value between 1 and 5.
CAPABILITY VALUE
Capability User Rating Value User Rating
Functionality Breadth Adoption Score
Features Customer Base
Integrations Reviews Volume
Confidence Score Google Searches
Customer Base Skill Base
Employee Base
Customer Growth
Employee Growth
J A N U A R Y 2 0 1 7
FRONTRUNNERS SCORECARDNEWTON
QUADRANT PLACEMENT: CONTENDERS
3.72 4.11
4.24 4.12
2.65 4.10
3.20 4.10
2.10 2.80
3.75 5.00
4.10 4.30
3.60
4.00
3.30
25
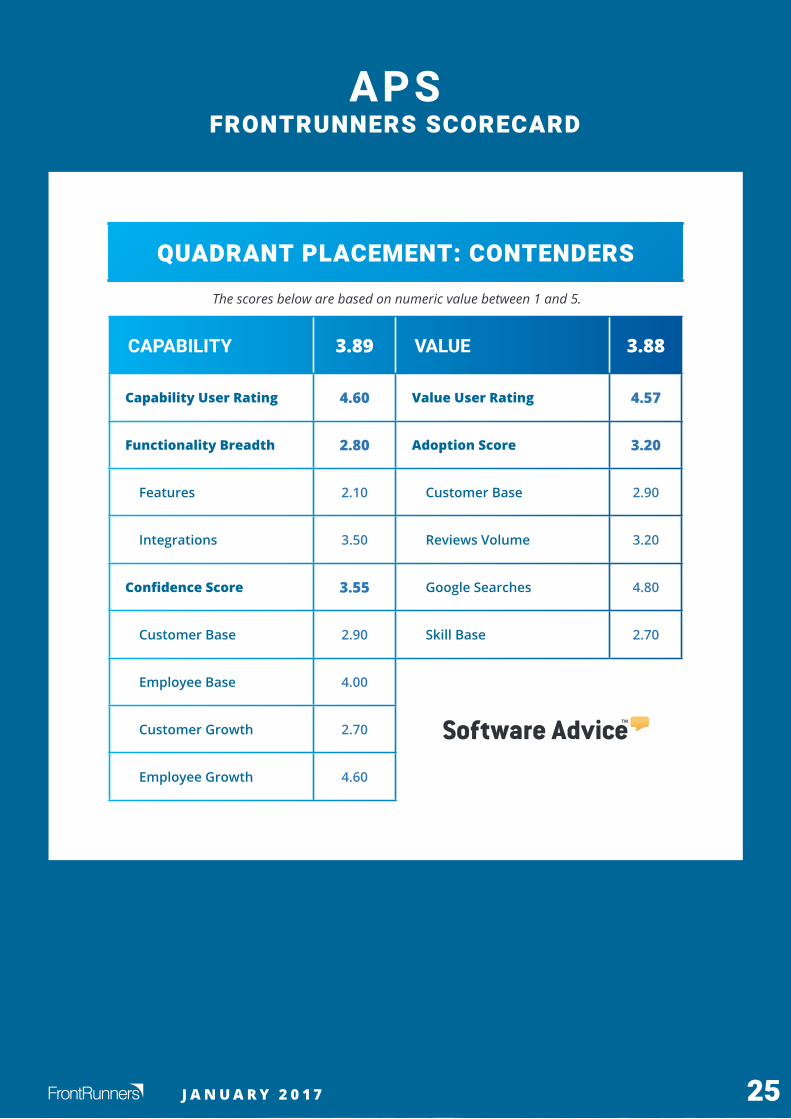
The scores below are based on numeric value between 1 and 5.
CAPABILITY VALUE
Capability User Rating Value User Rating
Functionality Breadth Adoption Score
Features Customer Base
Integrations Reviews Volume
Confidence Score Google Searches
Customer Base Skill Base
Employee Base
Customer Growth
Employee Growth
J A N U A R Y 2 0 1 7
FRONTRUNNERS SCORECARDAPS
QUADRANT PLACEMENT: CONTENDERS
3.89 3.88
4.60 4.57
2.80 3.20
2.10 2.90
3.50 3.20
3.55 4.80
2.90 2.70
4.00
2.70
4.60
26
The scores below are based on numeric value between 1 and 5.
CAPABILITY VALUE
Capability User Rating Value User Rating
Functionality Breadth Adoption Score
Features Customer Base
Integrations Reviews Volume
Confidence Score Google Searches
Customer Base Skill Base
Employee Base
Customer Growth
Employee Growth
J A N U A R Y 2 0 1 7
FRONTRUNNERS SCORECARDTHE APPLICANT MANAGER
QUADRANT PLACEMENT: CONTENDERS
3.98 3.79
4.64 4.68
4.55 2.90
4.50 2.30
4.60 3.50
2.10 4.30
2.30 2.50
1.30
3.80
1.00
27
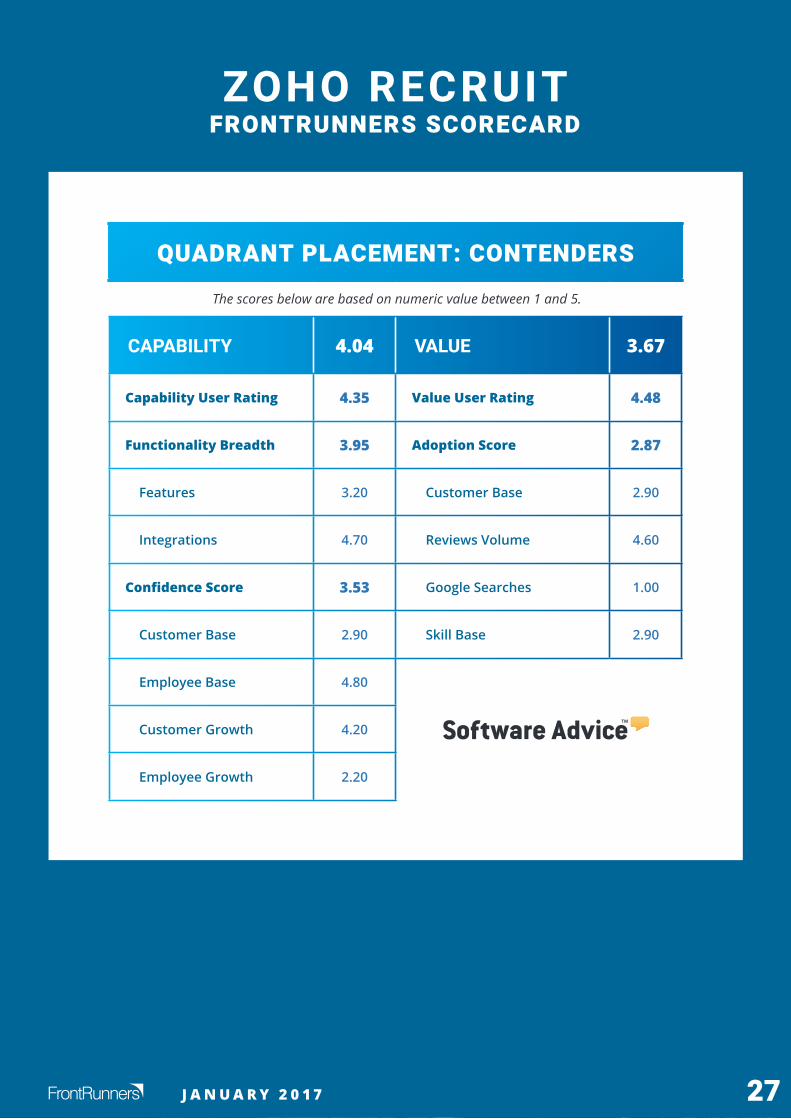
The scores below are based on numeric value between 1 and 5.
CAPABILITY VALUE
Capability User Rating Value User Rating
Functionality Breadth Adoption Score
Features Customer Base
Integrations Reviews Volume
Confidence Score Google Searches
Customer Base Skill Base
Employee Base
Customer Growth
Employee Growth
J A N U A R Y 2 0 1 7
FRONTRUNNERS SCORECARDZOHO RECRUIT
QUADRANT PLACEMENT: CONTENDERS
4.04 3.67
4.35 4.48
3.95 2.87
3.20 2.90
4.70 4.60
3.53 1.00
2.90 2.90
4.80
4.20
2.20
28
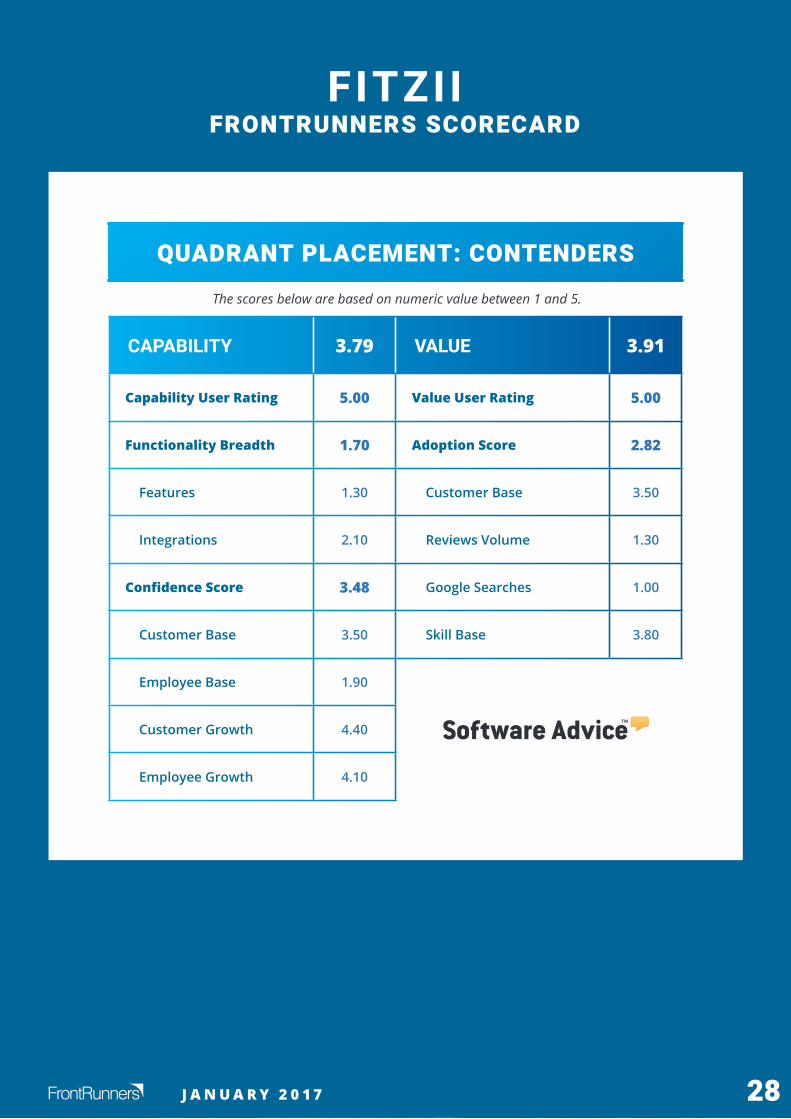
The scores below are based on numeric value between 1 and 5.
CAPABILITY VALUE
Capability User Rating Value User Rating
Functionality Breadth Adoption Score
Features Customer Base
Integrations Reviews Volume
Confidence Score Google Searches
Customer Base Skill Base
Employee Base
Customer Growth
Employee Growth
J A N U A R Y 2 0 1 7
FRONTRUNNERS SCORECARDFITZII
QUADRANT PLACEMENT: CONTENDERS
3.79 3.91
5.00 5.00
1.70 2.82
1.30 3.50
2.10 1.30
3.48 1.00
3.50 3.80
1.90
4.40
4.10

29
The scores below are based on numeric value between 1 and 5.
CAPABILITY VALUE
Capability User Rating Value User Rating
Functionality Breadth Adoption Score
Features Customer Base
Integrations Reviews Volume
Confidence Score Google Searches
Customer Base Skill Base
Employee Base
Customer Growth
Employee Growth
J A N U A R Y 2 0 1 7
FRONTRUNNERS SCORECARDSMARTSEARCH
QUADRANT PLACEMENT: CONTENDERS
3.76 3.89
4.77 4.77
2.55 3.02
3.60 4.30
1.50 1.30
2.95 1.00
4.30 3.60
1.90
2.70
2.90

30
The scores below are based on numeric value between 1 and 5.
CAPABILITY VALUE
Capability User Rating Value User Rating
Functionality Breadth Adoption Score
Features Customer Base
Integrations Reviews Volume
Confidence Score Google Searches
Customer Base Skill Base
Employee Base
Customer Growth
Employee Growth
J A N U A R Y 2 0 1 7
FRONTRUNNERS SCORECARDJOBADDER
QUADRANT PLACEMENT: CONTENDERS
3.89 3.69
4.40 4.41
3.20 2.97
2.70 2.70
3.70 3.60
3.58 3.60
2.70 2.60
3.60
4.60
3.40

31
The scores below are based on numeric value between 1 and 5.
CAPABILITY VALUE
Capability User Rating Value User Rating
Functionality Breadth Adoption Score
Features Customer Base
Integrations Reviews Volume
Confidence Score Google Searches
Customer Base Skill Base
Employee Base
Customer Growth
Employee Growth
J A N U A R Y 2 0 1 7
FRONTRUNNERS SCORECARDBIRDDOGHR
QUADRANT PLACEMENT: CONTENDERS
3.66 3.62
4.11 4.02
3.15 3.22
3.60 3.90
2.70 2.90
3.28 1.00
3.90 3.80
4.80
2.30
2.10

32
The scores below are based on numeric value between 1 and 5.
CAPABILITY VALUE
Capability User Rating Value User Rating
Functionality Breadth Adoption Score
Features Customer Base
Integrations Reviews Volume
Confidence Score Google Searches
Customer Base Skill Base
Employee Base
Customer Growth
Employee Growth
J A N U A R Y 2 0 1 7
FRONTRUNNERS SCORECARDMYSTAFFINGPRO
QUADRANT PLACEMENT: CONTENDERS
3.60 3.67
4.24 4.25
2.75 3.08
3.60 3.60
1.90 3.30
3.18 1.00
3.60 3.50
5.00
3.10
1.00
33J A N U A R Y 2 0 1 7
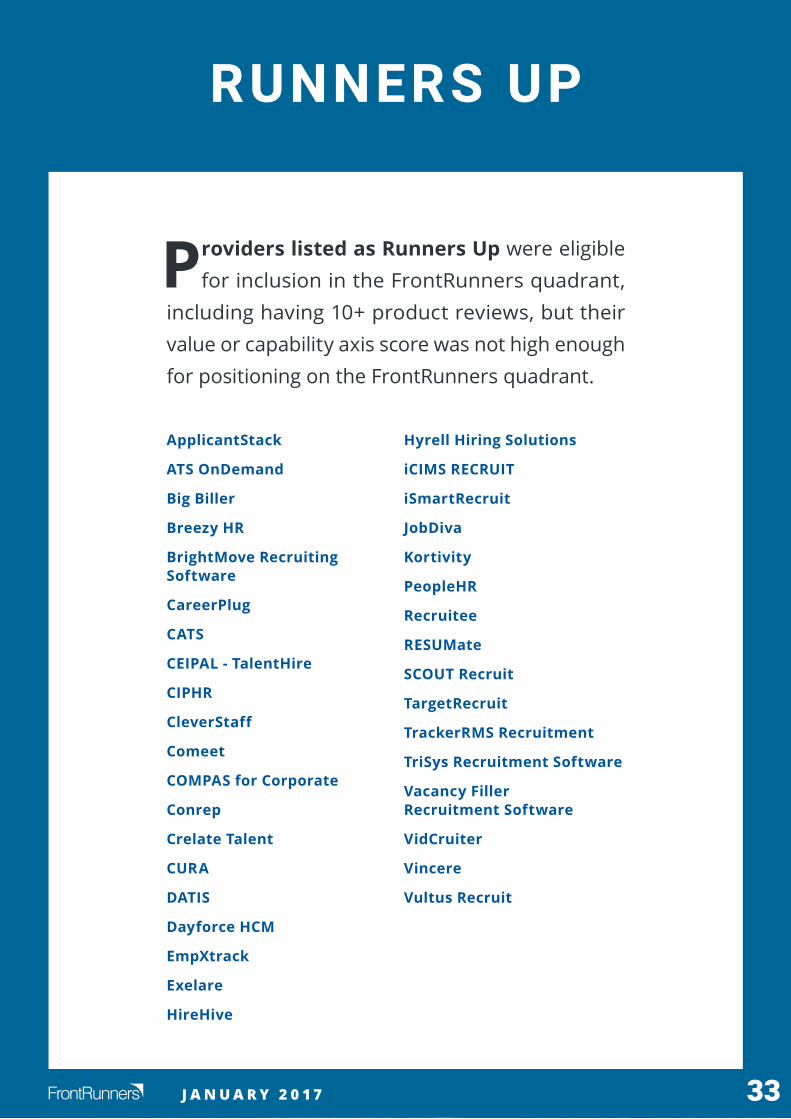
Providers listed as Runners Up were eligible for inclusion in the FrontRunners quadrant,
including having 10+ product reviews, but their value or capability axis score was not high enough for positioning on the FrontRunners quadrant.
RUNNERS UP
ApplicantStack
ATSOnDemand
Big Biller
Breezy HR
BrightMove Recruiting Software
CareerPlug
CATS
CEIPAL-TalentHire
CIPHR
CleverStaff
Comeet
COMPAS for Corporate
Conrep
CrelateTalent
CURA
DATIS
Dayforce HCM
EmpXtrack
Exelare
HireHive
Hyrell Hiring Solutions
iCIMSRECRUIT
iSmartRecruit
JobDiva
Kortivity
PeopleHR
Recruitee
RESUMate
SCOUTRecruit
TargetRecruit
TrackerRMSRecruitment
TriSysRecruitmentSoftware
Vacancy Filler Recruitment Software
VidCruiter
Vincere
Vultus Recruit
34J A N U A R Y 2 0 1 7
The FrontRunners methodology assesses and calculates a score for products on two primary
dimensions: Capability on the x-axis and Value on the y-axis.
THE CAPABILITY SCORE IS AN OVERALL WEIGHTED AVERAGE OF SCORES INCLUDING:
» End-user ratings of one to five stars on the product’s functionality.
» End-user ratings of one to five stars on the product’s ease of use.
» End-user ratings of one to five stars on the product’s customer support.
» A score, relative to other products in the market, for the product’s inclusion of key functionality for the software category.
» A score, relative to other products in the market, representing the number of other products that integrate with it.
METHODOLOGY BASICS
M E T H O D O L O G Y B A S I C S
35J A N U A R Y 2 0 1 7
THE VALUE SCORE IS AN OVERALL WEIGHTED AVERAGE OF SCORES INCLUDING:
» End-user ratings of one to five stars on overall satisfaction with the product.
» End-user ratings of one to five stars on how valuable users consider the product to be relative to its price.
» End-user ratings of one to five stars on how likely they are to recommend the product to others.
» A score, relative to other products in the market, for the size of the product’s customer base.
» A score, relative to other products in the market, for the number of professionals in the market who have experience with the product (e.g., users, developers, administrators).
» A score, relative to other products in the market, representing the total number of user reviews across the three Gartner web properties.
» A score, relative to other products in the market, representing the average number of times per month internet users search for the product on Google.
M E T H O D O L O G Y B A S I C S
36J A N U A R Y 2 0 1 7
Markets are defined by a core set of functionality, and products considered for, and included in, FrontRunners must offer that core set of functionality. Additional related functionality can contribute to the capability score for a product. To qualify for consideration in FrontRunners for a software category, a product must have at least 10 unique user-submitted product reviews across the three Gartner Digital Markets web properties:softwareadvice.com, capterra.com and getapp.com.

¨