Embed Size (px)
Citation preview

APPLICATION OF GIS IN ECOTOURISMDEVELOPMENT DECISIONS:Evidence from the Pearl of Africa
By
James Obadiah Bukenya
RESEARCH PAPER 2012
Research AssistantNatural Resource Economics Program, West Virginia University
Morgantown, WV 26506-6108Tel. 304-293-4832 ext. 4476E-mail: [email protected]
JEL: L830, Q200, Q260, 7210, 0130, Q210,
Key words: Ecotourism, environmental management, spatial analysis, GIS
Abstract: This study demonstrates the uses of geographical information system (GIS)and multi-criterion decision-making framework (MCDM) in solving a spatial multi-objective problem of ranking and prioritizing Uganda’s national parks for ecotourismdevelopment. The ranking model adopted allows formal analysis of the effects ofalternative weighting schemes and their spatial sensitivity on national park ranking. Theresults show that (1) Uganda’s national parks can be arranged and ranked into three sub-groups, and (2) the national parks in the western region of the country are ranked higherthan those in the other regions.

2
APPLICATION OF GIS IN ECOTOURISM DEVELOPMENTDECISIONS:EVIDENCE FROM THE PEARL OF AFRICA
I. INTRODUCTION
In recent years, researchers have begun to examine how local populations can
direct tourism activities and benefit from them. In the 1980s, alternative forms of tourism
began attracting the interest of governments, communities and scholars alike. These were
given a raft of names—“nature tourism,” “soft tourism,” “responsible tourism,” “green
tourism,” “ecotourism” (Schaller, 1999), but all were seen as alternatives to mass
tourism. Among these various labels, the term "ecotourism" has become prominent,
although a consistent definition is by no means found, even among scholars (Schaller,
1999). Most definitions do, however, incorporate concepts associated with sustainable
development. For example, in Sustainable development: Exploring the contradictions,
Redclift (1987) attempted to integrate economic development with ecological
sustainability, and his work has served as a conceptual basis for ecotourism researchers
such as Zurick (1992). Dearden (1991) and Hunter and Green (1995) use the definition
espoused by the World Commission on Environment and Development: "development
that meets the needs of the present without compromising the ability of future generations
to meet their own needs" (WCED, 1987).
Many scholars now agree that ecotourism should require a two-way link between
tourism and environmental conservation (Valentine 1993; Cater, 1994). As the
understanding of the close relationships between tourism and environmental conservation
increases, researchers are calling on ecotourism industry to incorporate economic

3
development as a fundamental element of conservation (West and Brechin, 1991:392).
These concerns highlight a critical difference between “nature tourism” and
“ecotourism,” at least as the latter term will be defined here. Nature tourism is "based
directly on the use of natural resources in a relatively undeveloped state, including
scenery, topography, water features, vegetation and wildlife" (Healy, 1988: 1). It is also
based upon the desire of people to experience nature in their leisure time. The growing
levels of participation have led to the recognition of sub-markets. Eagles (1995a)
proposed that nature-based tourism has at least four sub-markets (Figure 1), differentiated
according to the travel motives of the tourists.
Figure 1. Tourism sub-markets
Among these subdivisions ecotourism may be the fastest growing tourism sub-
market. The growth of ecotourism primarily involves travel by Europeans and North
Americans to all parts of the world. For example, Eagles and Wind (1994) found that
Canadian ecotour companies visited fifty different countries in 1992. Recently, with
rapidly developing economies in Asia, ecotourists from these countries are entering the
market as consumers. The number of ecodestinations expands with the increases in park
numbers. There is now a worldwide nature travel market, with tourists from many
countries traveling to destinations in many other countries (Zurick, 1992). Ecotourism
4
has an idealistic agenda, defined by Drumm (1991: 54) as “progressive, educational
travel, which conserves the environment and benefits local communities.” Because it is
both succinct and sufficiently ambitious, this definition will be used here.
THE ISSUE
The country in focus in this study, Uganda, is emerging from years of political
instability and entrenched poverty. Before Idi Amin took power in 1971, Uganda had a
major tourism industry, but the industry was crashed with the instability of the country.
Today, tourism is picking up again, and Uganda, with diverse, yet endangered natural
resources has found it preferable to pursue ecotourism for the main reason that tourism is
one of the few products, which it can trade in the international marketplace. Uganda is
also receiving generous funding to support these efforts from international non-
governmental organizations such as the Peace Corps Volunteers (PCV), Germany Animal
Protection Society, CARE International, and from financial institutions such as the World
Bank and the United Nations-based Global Environmental Facility (Ringer, 1996).
The World Bank and United Nations-based Global Environmental Facility (GEF)
have paid ever-increasing attention to the development and conservation potentials of
ecotourism. However, while their previous funded projects did have some ecotourism
components, the GEF set a precedent in early 1995 when it funded a ‘four million US
dollars’ ecotourism project in Uganda, and wrapped up negotiations for a similar project
in Zimbabwe (Rembert, 1997). The Uganda National Parks (UNP) and the Uganda
Wildlife Tourism Board (WTB), the tourism governing boards in the country were
responsible for allocating the funds (four million US dollars) to four of the ten major
national parks in the country. Faced with simultaneous objectives, UNP and WTB were
5
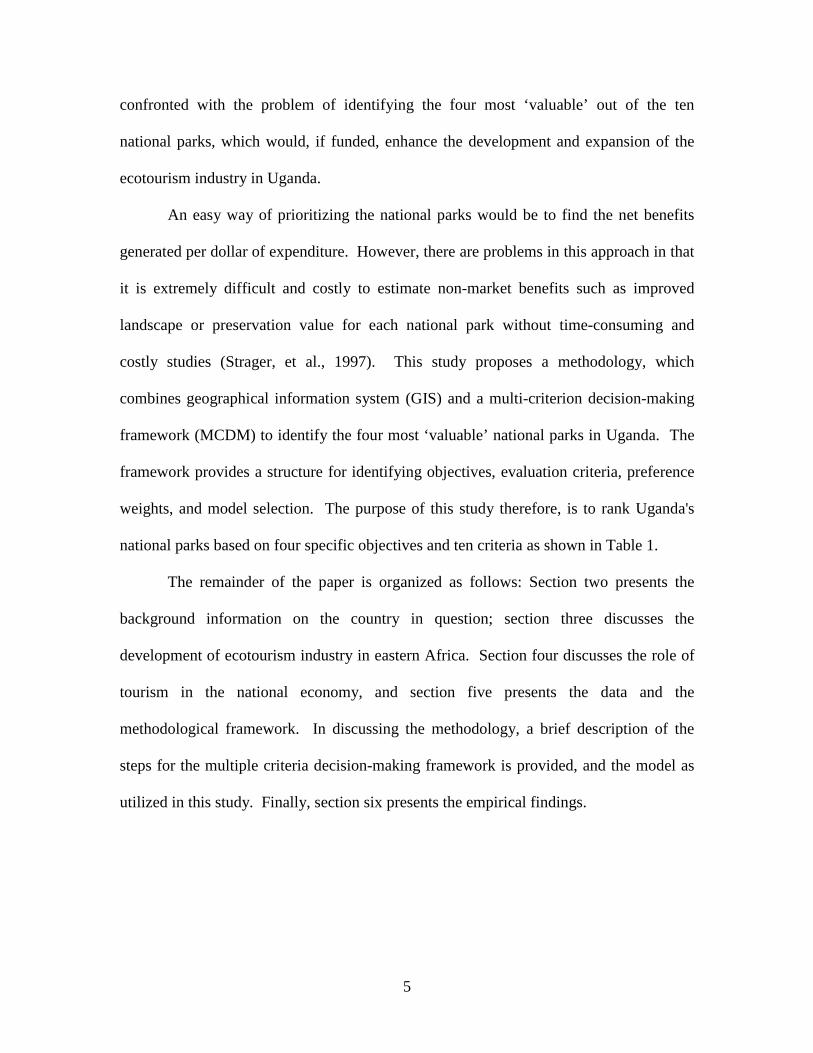
confronted with the problem of identifying the four most ‘valuable’ out of the ten
national parks, which would, if funded, enhance the development and expansion of the
ecotourism industry in Uganda.
An easy way of prioritizing the national parks would be to find the net benefits
generated per dollar of expenditure. However, there are problems in this approach in that
it is extremely difficult and costly to estimate non-market benefits such as improved
landscape or preservation value for each national park without time-consuming and
costly studies (Strager, et al., 1997). This study proposes a methodology, which
combines geographical information system (GIS) and a multi-criterion decision-making
framework (MCDM) to identify the four most ‘valuable’ national parks in Uganda. The
framework provides a structure for identifying objectives, evaluation criteria, preference
weights, and model selection. The purpose of this study therefore, is to rank Uganda's
national parks based on four specific objectives and ten criteria as shown in Table 1.
The remainder of the paper is organized as follows: Section two presents the
background information on the country in question; section three discusses the
development of ecotourism industry in eastern Africa. Section four discusses the role of
tourism in the national economy, and section five presents the data and the
methodological framework. In discussing the methodology, a brief description of the
steps for the multiple criteria decision-making framework is provided, and the model as
utilized in this study. Finally, section six presents the empirical findings.

6
Table 1. Objectives and Criteria
Objectives Criteria
1. *Wildlife management potential 1. Park preservation potential rating fromadvancement land use/land cover
2. Existing park preservation potential
2. *Ecological Value 3. Park size
4. Number of species available
5. Presence of endangered species
6. Park type value for wildlife habitat
3. ** Susceptibility to encroachmentand degradation
4. *Revenue Generation
7. Soil suitability foragriculture/construction
8. Proximity to major roads/towns
9. Number of visitors in a year
10. Entrance Fee
*Maximize the objective **Minimize the objective

7
II. BACKGROUND
Uganda's tourism industry reflects the extraordinary diversity of the country: a
region of lakes, swamps, dense grasslands, and woodlands, rolling plains, forests and
mountainous areas. Owing to a variety of habitats with abundant grass and landscape,
Uganda supports an incredibly high species biodiversity with a high level of endemism.
In order to protect and effectively manage these invaluable resources on a sustainable
basis, the Uganda National Parks Authority was established in 1952. The organization
presently manages ten national parks: Murchison Falls, Queen Elizabeth, Kidepo Valley,
Lake Mburo, Rwenzori Mountain, Bwindi Impenetrable, Mgahinga Gorilla, Mt. Elgon,
Semuliki, and Kibale national parks. Each of these parks is unique and offers a different
experience for tourists.
?
#
*
+
^
x
~
$
=%
Murchison FallsNat. Park
Kidepo FallsNat. Park
Mt. ElgonNat. Park
Mgahinga Nat. Park
Bwindi Nat. Park
Lake Mburo Nat. ParkQueen Elizabeth Nat. Park
Rwenzori Nat. Park
Kibale Nat. ParkSemuliki Nat. Park
ProvinceEAST. PROVKARAMOYONILENORTH. PROVSOUTH BUGANDASOUTH. PROVWEST. PROV
100 0 100 200 Miles
N
EW
S
Map of Uganda
Figure 2. Uganda National Parks.
8
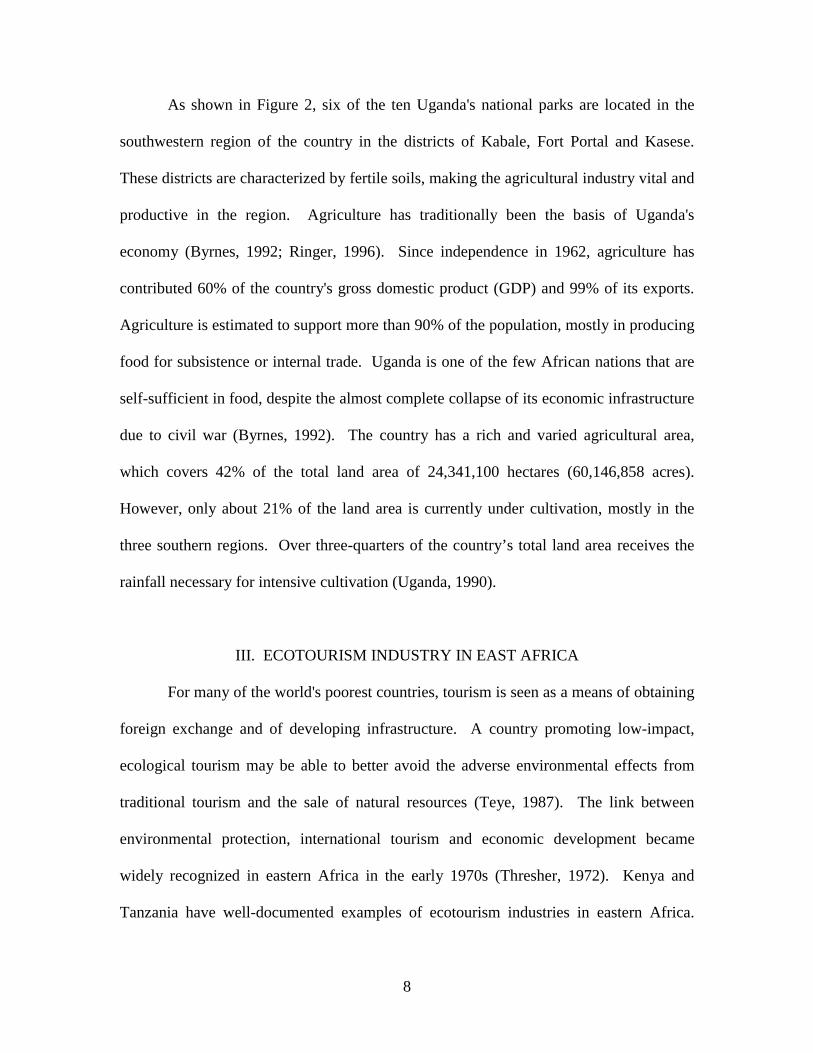
As shown in Figure 2, six of the ten Uganda's national parks are located in the
southwestern region of the country in the districts of Kabale, Fort Portal and Kasese.
These districts are characterized by fertile soils, making the agricultural industry vital and
productive in the region. Agriculture has traditionally been the basis of Uganda's
economy (Byrnes, 1992; Ringer, 1996). Since independence in 1962, agriculture has
contributed 60% of the country's gross domestic product (GDP) and 99% of its exports.
Agriculture is estimated to support more than 90% of the population, mostly in producing
food for subsistence or internal trade. Uganda is one of the few African nations that are
self-sufficient in food, despite the almost complete collapse of its economic infrastructure
due to civil war (Byrnes, 1992). The country has a rich and varied agricultural area,
which covers 42% of the total land area of 24,341,100 hectares (60,146,858 acres).
However, only about 21% of the land area is currently under cultivation, mostly in the
three southern regions. Over three-quarters of the country’s total land area receives the
rainfall necessary for intensive cultivation (Uganda, 1990).
III. ECOTOURISM INDUSTRY IN EAST AFRICA
For many of the world's poorest countries, tourism is seen as a means of obtaining
foreign exchange and of developing infrastructure. A country promoting low-impact,
ecological tourism may be able to better avoid the adverse environmental effects from
traditional tourism and the sale of natural resources (Teye, 1987). The link between
environmental protection, international tourism and economic development became
widely recognized in eastern Africa in the early 1970s (Thresher, 1972). Kenya and
Tanzania have well-documented examples of ecotourism industries in eastern Africa.

9
Starting with only a few thousand tourists in the early 1950s, Tanzania’s tourism
increased to 350,000 in 1995 (Friesen, 1995), and Kenya’s to 865,300 in 1994 (Anon,
1996). In both countries, the tourism industry is closely tied to world-class systems of
national parks and game reserves. For instance, in Kenya the foreign exchange earnings
from tourism rival sometimes exceed those of agriculture, the other important source of
revenue (Western, 1997). Thus, throughout eastern and southern Africa, park-based
tourism is a very important economic activity.
Kenya has been a successful leader in the development of ecotourism industries
based upon a comprehensive structure of national legislation, policy planning and site
management (Pigram, 1990). Furthermore, since the sustainability of the ecotourism
industry is dependent upon the preservation of environmental quality and biodiversity,
policy makers feel that encotourism can bolster conservation efforts (Division for
Sustainable Development, 1998). Thus, while the potential for negative exploitation of
this emerging industry exists, it is nevertheless seen by many as the lesser of many much
more harmful options available to the world's struggling regions such as Africa (Eagle,
1997).
However, not all tourism development efforts in eastern Africa have been
successful. Ankomah and Crompton (1990) identified five factors inhibiting these
development efforts as negative market image, lack of foreign exchange for capital
development, lack of trained personnel for tourism, weak institutional frameworks for
planning and management and political instability. Sournia (1996) contrasts the
management of park tourism in western Africa to that of eastern Africa. He points out
that even with significant natural resources in western Africa, the tourism levels are well
10
below those of eastern Africa. Sournia suggests that the reasons for the lower levels of
use include less visible wildlife concentrations, weak national transportation networks,
inefficient hotel facilities, poorly trained tourism staff, weak marketing and a lack of
tourism infrastructure in the parks (Sournia, 1996).
IV. ROLE OF TOURISM IN THE NATIONAL ECONOMY
The impact of tourism in the economy is felt mainly through forward and
backward linkages expressed as demand for goods and services in the agricultural,
textiles, beverage, transportation, and entertainment sectors. Hence, the tourist dollar has
such multiplier effects that its absence would affect the general government revenue
collection.
4.1 Employment in the Tourism Sector
Since tourism is essentially a service industry, it provides relatively more jobs
than any other economic sector. The industry is labor-intensive and, consequently, its
expansion generates more job opportunities than an equivalent expansion in other sectors
of the economy (Teye, 1987). In addition, allied improvements in tourism infrastructure
also catalyze other economic activities. It was estimated that well over 219,000 people
are currently deriving their livelihood from tourism in Uganda (Ringer, 1996).
4.2 Tourism Earnings
Income from tourism contributes to exports and the Gross Domestic Product
(GDP). Foreign exchange earnings have been increasing steadily over the past ten years
representing an appreciable growth rate. While tourism is sensitive to the level of
economic activity in the country, it provides higher and stable earnings than those from
11
primary products (Ringer, 1996). Tourism earnings tend to increase at a higher rate than
earnings from other export commodities. The earnings incurred are, in turn, used to
offset shortfalls on the visible trading account, and therefore are of critical importance in
the financial reckoning. Tourism contributes greatly to government revenue through
license fees, customs and exercise duty, value added taxes (VAT) on tourism services,
landing fees, passenger service charge, and entry fees to game parks, as well as income
tax levied on employees in the tourism industry. The generated revenues play a pivotal
role in the overall development of a country’s economy (Moore and Carter, 1993).
4.3. Tourism and Development of Infrastructure
The benefits accruing from investments in infrastructure such as hotels and
restaurants, road network and superstructure such as airports, communications, power
and water supply as well as other related public utilities, are widely shared with other
sectors of the economy. Their development enhances the overall development at the
local level and also encourages greater economic diversification. It has been argued by
Schaller (1999) that tourism has larger multiplier effects than any other sectors, since
every unit of tourist expenditure goes through several rounds of income creation and
expenditure before its effect is exhausted. For instance, money spent by a tourist on hotel
accommodation, food and beverages, shopping, entertainment and transportation, does
not stagnate, but provides income to hotel staff, taxi operators, shopkeepers and suppliers
of goods and services. Part of this income is spent on these individuals’ daily
requirements of goods and services. As a result, money accruing from tourism circulates
through numerous segments of the economy through the multiplier process.

12
4.4. Tourism and Regional Development
The tourism industry has been described as a major promoter of international
goodwill and understanding (Moore and Carter, 1993), as well a prime means of
developing social and cultural understanding on the local level. Accordingly, foreign
visitors are considered to be the best ambassadors of their respective countries. In view
of the fact that we are living in a “global village,” the industry contributes significantly to
international commerce and good relation among nations. It is worth noting also that the
development of tourism may serve as an important vehicle for promoting economic
advancement of less developed areas that are not endowed with alternative resources. In
this regard, such developments play an important part in redressing regional development
and income distribution imbalances (Sanchez, 1998).
4.5 Tourism and Cultural Resources
Tourism has always been considered a vital medium for widening the scope of
human interests (Eagles, 1997). It contributes positively to the nurturing and exploration
of cultural heritage of nations. It therefore serves indirectly to improve the individual
cultural understanding of both residents and foreigners, while at the same time
contributing to the gross national product. At the local level, domestic tourism creates an
understanding and appreciation of the attractions thereby, contributing to sustainable
tourism development (Eagles, 1997).
It should be noted also that ecotourists uses local resources and expertise, which
in turn translates into import savings. The use of local resources and expertise also
translates into environmentally sensitive patterns of resource use and local participation
in the tourism industry (Pigram, 1980). Its emphasis on local resources and employment

13
makes it attractive to developing countries, which, although rich in natural resources are
disadvantaged by rural poverty and the lack of export earnings (Eagles, 1997).
V. METHODOLOGY
This section discusses the data compilation, and presents a brief description of the
multiple criteria decision-making framework (MCDM). In presenting the framework, an
outline of the model as used in this study is provided.
5.1 Data Compilation
The spatial data used in this study include topography, land uses, hydrology,
population distribution, elevation, satellite images, meteorological data, transportation
layers, and ecological species distribution. The non-spatial data includes demographic
and socio-economic data. The spatial data is obtained from United States Geology
Survey (USGS—Uganda Metadata), African Data Dissemination Services, and Geo
Community—Geographical Information System Data Deport. Additional spatial data
such as transportation layers are obtained from the World Digital Chart. The non-spatial
data, which includes demographic and socio-economic data, are obtained from the
national parks’ specific websites (www.newafrica.com/nationalparks), and from the
World Bank.
5.2 Multiple Criteria Decision Making (MCDM)
In most everyday decisions, there exist multiple, conflicting, and sometimes
simultaneous, objectives. MCDM framework helps decision-makers choose among
alternatives by showing the tradeoffs between the criteria, which enables them to make
choices in a rational, consistent, and documentable manner (Zeleny, 1992). Romero and
14
Rehman (1989) argued that decision-makers are usually not interested in ranking feasible
alternatives according to a single criterion but strive to find an optimal compromise
among several objectives. In a multiple-criterion problem, human value judgments,
tradeoff valuations, and assessments of the importance of criteria are an integral part of
the evaluation process. The MCDM framework was developed to fill weaknesses
identified in the conventional mathematical programming applications to decision-
making problems (Strager et al., 1997). The multi-criterion problem formulation and
analysis procedure includes the following steps:
1) Defining the desired goals, objectives or purpose of the project. A clear
statement of the recognized problem completes the first step in the decision process
(Gershon and Ducksten, 1983). In this study, the goal is to prioritize and to rank
Uganda's national parks for funding opportunities. The criteria needed to identify the
most suitable national parks include identifying the parks which have, the highest number
of species, wildlife management potential, endangered species, potential to attract more
tourists, and parks that have less susceptibility to encroachment and degradation over the
next decade. With such criterion, the decision-makers could focus their funding priorities
and help ensure that valuable national parks are funded without delay or confusion.
2) Selecting evaluation criteria that can relate technology capabilities for
achieving the desired project goals or objectives (Tecle et al., 1990). A total of ten
evaluation criteria are selected in this study (Table 1). The criteria attempt to build a
loose connection between resource value parameters, such as national park sizes and
composite wildlife value and vulnerability parameters, such as proximity to roads and
developed land uses. Spatial analysis techniques within a Geographic Information

15
System (GIS) provide the needed integration framework. Once the criteria are selected,
they are traditionally rated among each other using weights, which reflect the decision-
makers preference structure (Tecle et al., 1988).
3) Identifying the alternatives that are candidates for ranking. This study
includes ten national parks as the feasible alternatives to be ranked. Each of these
national parks has certain features or physical characteristics that make it more suitable
for funding than corresponding features found in the other national parks. The ten
national parks included to rank in this project are shown in Figure 2.
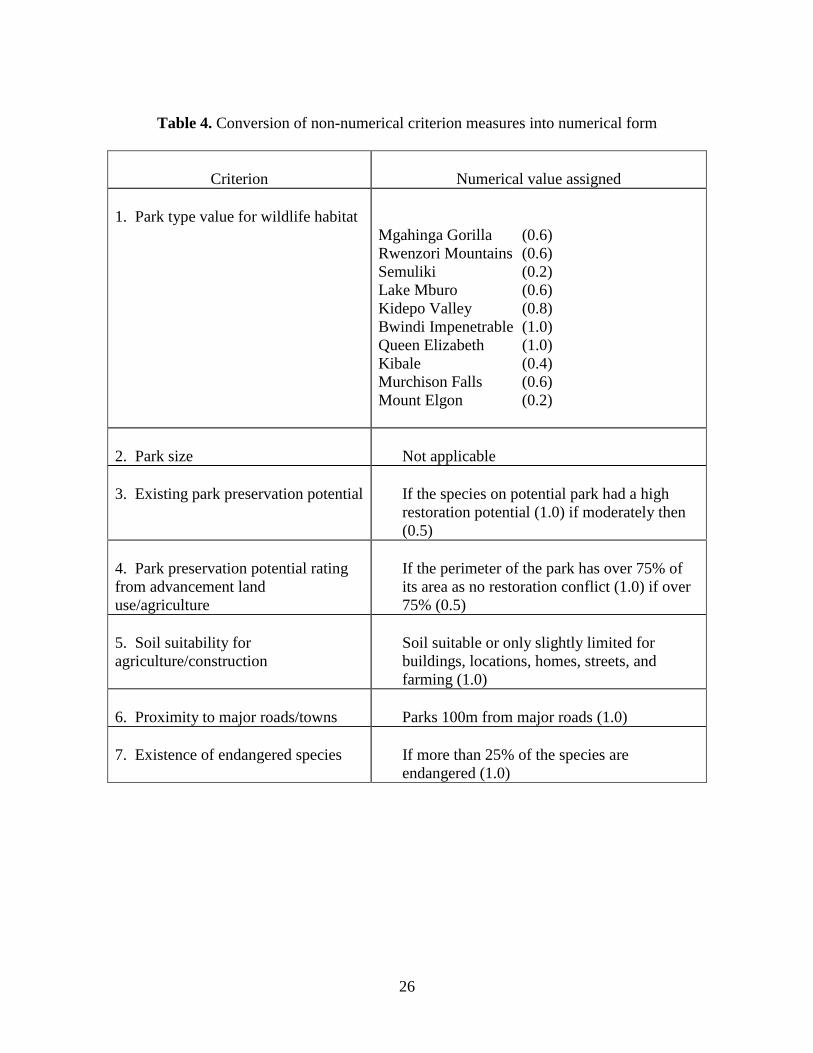
4) Selecting performance indices or measurement scales to describe the
alternatives in terms of the given criteria, to reach the desired objectives. In developing
the indices and scales, GIS is used. For each data layer, existing map and data units are
collected from various sources to produce parameter layers in the GIS. If digital spatial
information is not available, maps are acquired, digitized, mosaicked, and registered to
produce the desired data layer. From the GIS database compilation, data could be
assigned to the evaluation criteria. Table 4, shows the conversion of non-numerical
criterion measures into numerical form for evaluation criteria where applicable.
5) Constructing an evaluation matrix of the alternatives vs. the criteria array.
The matrix (Table 5) represents particular values of each national park in terms of the
evaluation criteria. For ease in evaluating the matrix, the elements of the evaluation
matrix are usually expressed in a ratio scale corresponding to a value function on the
interval zero to one (Strager, 1997). Such a transformation is shown as a payoff matrix in
Table 6. This transformation helps to eliminate the influence of widely differing
numerical sizes of the criterion values upon the outcome, while enabling the description

16
of non-common measurable criteria in a standardized dimensionless scale (Tecle and
Yitayew, 1990).
6) Performing the selection process using one of the MCDM techniques. In this
study, the MCDM model used to rank the national parks in Uganda is compromise
programming. The concept of non-dominance is used in compromise programming to
select the best compromise solution or choice of alternatives. A solution is non-
dominated if there is no other feasible solution that will cause an improvement in the
value of the objective function without making the value of any other objective function
worse.
1.3 MODEL SPECIFICATION
An ideal solution for the compromise programming algorithm as defined by Tecle
and Yitayew (1990), is the vector of objective functions’ values,
)...,,,( **3
*2
*1
*IffffF = ,
where, the decision maker’s maximum values for a criterion i, *if , are the solutions to
equation 1:
J ..., 2, 1,j and I, ... 2, 1,i ),( * === iji fMaxf (1)
and the decision maker’s minimum or worst value for criterion I, **if , are determined
using equation 2:
J ..., 2, 1,j and I, ... 2, 1,i ),( ** === iji fMinf (2)
where,
ijf = the performance index for the values of implementing alternative jA to meet
the desired objectives expressed with respect to the ith criterion.

17
j = the number of alternatives
i = the number of criteria.
Using equations (1) and (2) the decision maker’s maximum (best) and minimum (worst)
criteria from the payoff matrix is identified.
In a compromise programming procedure, the ideal point serves as a reference
point for evaluating the comparative performances of the alternatives in achieving the
desired objectives (Zeleny, 1982). The alternative that gives a solution ‘A’ closest to the
ideal point is the most preferred. The closeness of a solution to the ideal point *if is
determined using a standardized family of Lp metric values (Tecle and Yitayew, 1990).
According to Romero and Rehman (1989), this type of metric can be very helpful, if used
as a measure for human preferences. The Lp metric as a compromise solution with
respect to p is expressed as:
��
��
�
��
��
�
��
��
�
��
���
−−
− �=
pN
i
p
ii
ijiIj ff
ffWAMin
1
1***
*
p ))(
)()(L (3)
where, Lp ( jA ) = the distance metric, a function of the decision alternative jA and theparameter p.
IW = the standardized form of the criterion weight, iw , in which the decision
maker’s relative preference structure among the i criterion is represented
using, i
ii w
wW∋
= , so that 1=∋ iW for all I;
*if = the ideal or best value for criterion I (Equation 1);
**if = the minimum or worst value for criterion I (Equation 2), and
the parameter p can take on values 1<p
18
To solve the multi-criterion problem using the compromise-programming algorithm,
the vector of ideal point values, *if and worst values **
if , are determined using equation
(1), (2) and (3) to compute the Lp distances value from the ideal points. The preferred
alternative has the minimum Lp distance value for each p and weight set that maybe used
and is the best compromise solution. Obviously, the best compromise solution changes
according to the values of the parameter p and of the weights chosen. The parameter p
acts as a weight attached to the deviations according to their magnitudes. Similarly, iw
becomes the weight for the various deviations signifying the relative importance of each
criterion (Romero and Rehman, 1989). In this project, equation (3) is implemented into
the GIS with a parameter p value of 1 while using the payoff matrix data and the criteria
weights imputed from the graphical user interface.
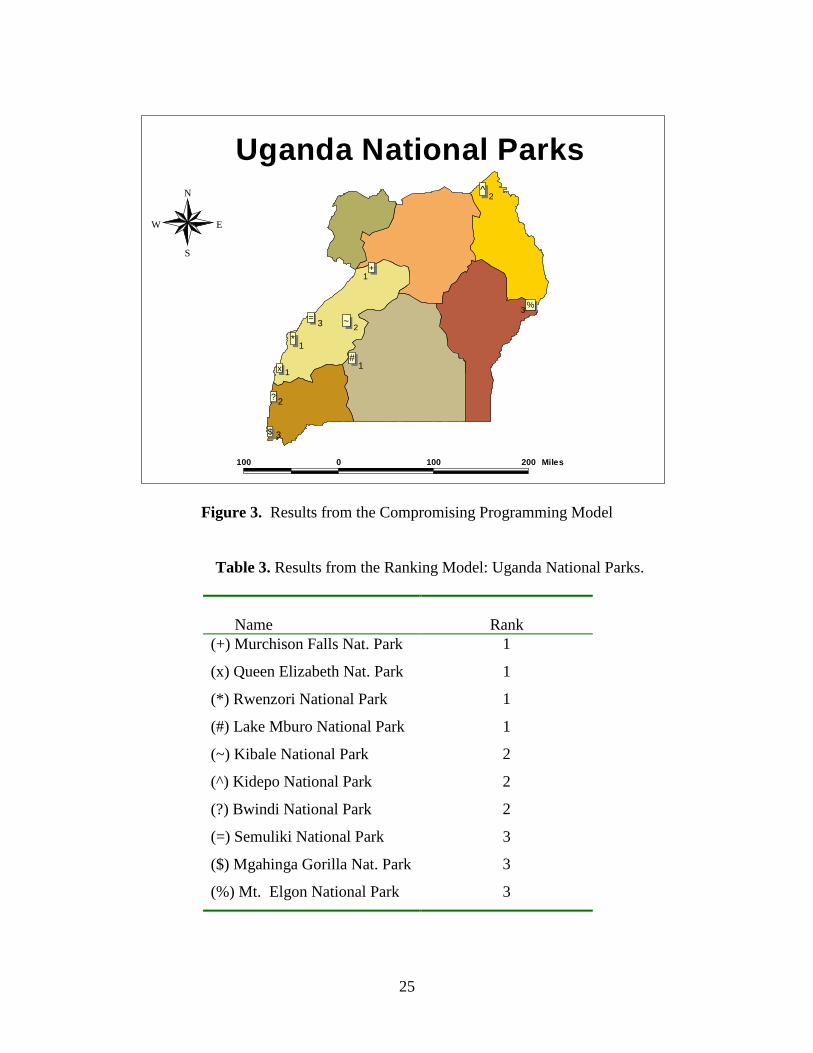
VI. RESULTS
The results of the application of the ranking model, based on iteration by the set
of criteria weights are shown in Figure 3 and Tables 2 and 3. Table 2 presents the
maximum and minimum values estimated using equations 1 and 2, while Figure 3 and
Table 3 present the results of equation 3. The four selected national parks are Murchison
Falls national park, Queen Elizabeth national park, Rwenzori national park, and Lake
Mburo national park. Following the specific objectives and criteria adopted in this study,
the results show that: (1) Among other ranking techniques, Uganda’s national parks can
be arranged into three general sub-groups and ranked accordingly in terms of their

19
specific groups1; and, (2) the national parks in the western region of the country rank
higher than those in the other regions of the country. A possible explanation for the later
finding is that, despite the fertile soils in this region, the topography of western Uganda
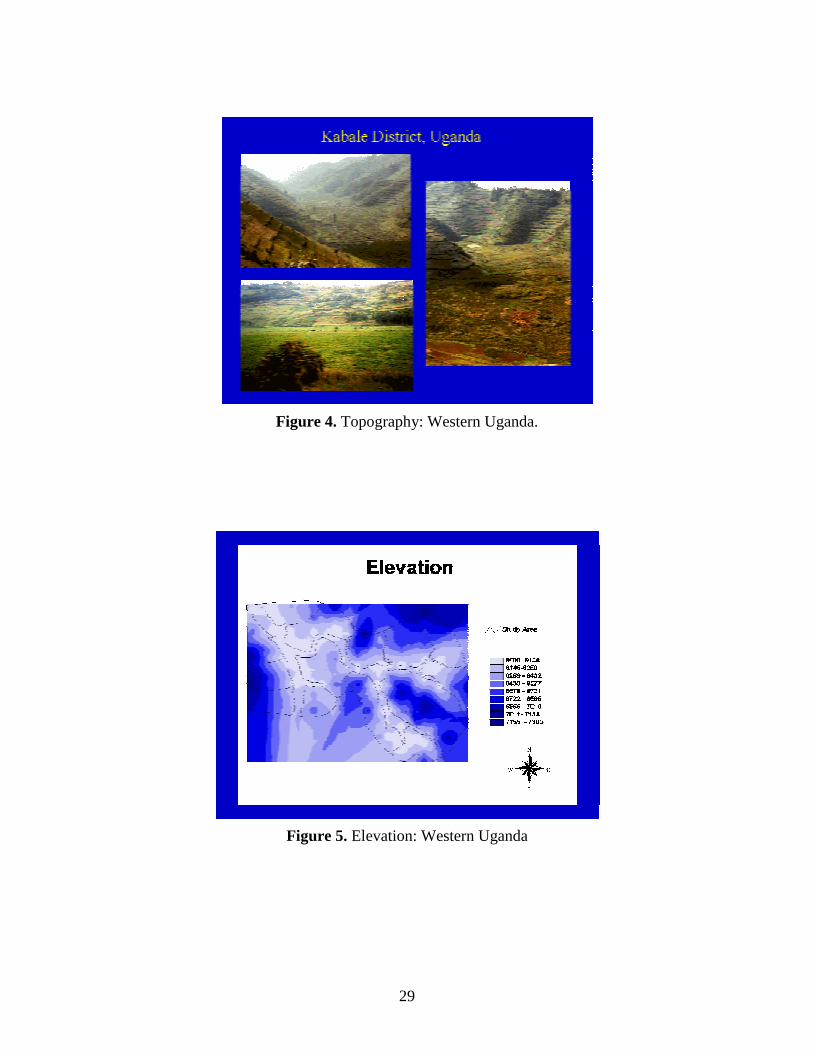
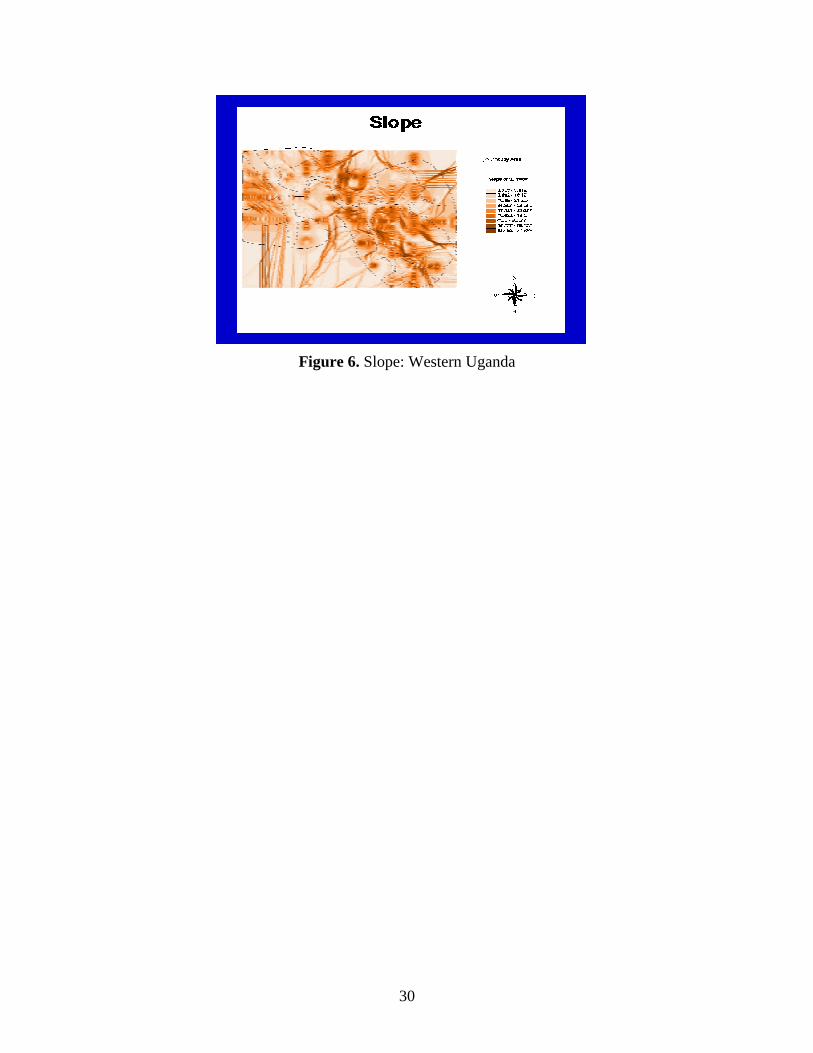
(as shown in Figures 4, 5, and 6), characterized by the East African Rift Valley, opens the
region to massive soil loss and land degradation via erosion, which makes traditional
agricultural practices unsuitable. The region’s undesirability for agriculture combined
with its sceneries, beautiful weather and a perfect environment for wildlife make the
region more attractive for the ecotourism industry.
CONCLUSION
The study has demonstrated the use of geographical information system and
multi-criteria decision making framework in solving a spatial multi-objective problem of
ranking and prioritizing Uganda’s national parks; based on the stated objectives and
criteria for the development of ecotourism industry. The ranking model allowed formal
analysis of the effects of alternative weighting schemes and their spatial sensitivity on
national park ranking. While the problem addressed in this study appears to have been
simple, it demonstrates the applicability of MCDM to similar but more complicated
problems. The advantage of the proposed methodology is that sensitivity analysis can
easily be performed on the results by employing graphical user interface, which allows
the decision-maker to query individual national parks for critical information.
1 The ranking technique (“sub-grouping” other than individual ranking or any other technique) used in this study is a matter ofpreference. Given the general objective of identifying four out of the ten national parks, this ranking technique was preferred.

20
REFERENCES
Ankomah, Paul Kwame and John L. Crompton. 1990. Unrealized tourism potential: TheCase of sub-Saharan Africa. Tourism Management 11(3): 11-27.
Anonymous. 1996. Kenya Tourism Declines. Toronto Globe and Mail, June 5.
Byrnes, M. Rita. 1992. Uganda A Country Study, Library of Congress: WashingtonD.C. pp. 108-111.
Cater, E. 1995. Ecotourism in the Third World--Problems and prospects forsustainability. In E. Cater and G. Lowman, (eds.). Ecotourism: A SustainableOption? Chichester: John Wiley and Sons. 68-87.
Dearden, P. 1991. Tourism and sustainable development in northern Thailand. TheGeographical Review 81 (4): 400-413.
Duckstein, L., A. Tecle, H. P. Nachnebel, and B. F. Hobbs. 1989. MulticriterionAnalysis of Hydropower Operation. Journal of Energy Engineering, 115 (3):132-152.
Duckstein, L., and S. Opricovic. 1980. Multi objective Optimization in River BasinDevelopment. Water Resource Research, 16 (1): 14-20.
Drumm, A. 1991. Integrated Impact Assessment of Nature Tourism in Ecuador's AmazonRegion. Quito: Feprotur.
Eagles, Paul F. J. 1995a. Understanding the Market for Sustainable Tourism. Pages 25-33in Stephen F. McCool and Alan E. Watson, compilers, Linking tourism, theenvironment and sustainability. Proceedings of a special session of the annualmeeting of the National Recreation and Parks Association; 1994 October 12-14;Minneapolis, M N. Gen. Tech. Rep. INT-GTR-323. Ogden, UT: U.S. Departmentof Agriculture, Forest Service, Intermountain Research Station. 95 p.
Eagles, Paul F. J. and Elke Wind. 1994. Canadian Ecotours in 1992: A Content Analysisof Advertising. Journal of Applied Recreation Research 19(1): 67-87.
Eagles, Paul F. J. and Elke Wind. 1997. International Ecotourism Management: UsingAustralia and Africa as Case Studies. Paper prepared for the IUCN WorldCommission on Protected Areas, Protected Areas in the 21st Century: FromIslands to Networks. Albany, Australia. www.ahs.uwaterloo.ca/rec/ecotour.htm
Filani, M. O. 1975. The Role of National Tourist Associations in the Preserving of theEnvironment in Africa. Journal of Travel Research 13 (4): 7-12.

21
Gershon, M., and L. Duckstein. 1983. Multi objective Optimization in River BasinDevelopment. Water Resource Research, 109 (1): 13-28.
Healy, R. G. 1988. Economic Considerations in Nature-Oriented Tourism: The Case ofTropical Forest Tourism. Working Paper No. 39. Raleigh: USDA ForestService Southeastern Forest Experiment Station.
Hunter, C., and H. Green. 1995. Tourism and the Environment: A sustainablerelationship? London and New York: Routledge.
Keeney, R. L., and H. Raiffa. 1993. Decision with Multiple Objectives, Preference andValue Tradeoffs. Cambridge University Press, New York, NY.
Moore, Stewart and Bill Carter. 1993. Ecotourism in the 21st century. TourismManagement (April): 123-130.
Pigram, John J. 1990. Sustainable Tourism - Policy Considerations. The Journal ofTourism Studies 1 (2): 2-9.
Pigram, John J. 1980. Environmental Implications of Tourism Development. Annals ofTourism Research VII (4): 554-583.
Pleumarom, Anita. 1994. "The Political Economy of Tourism," The Ecologist, Vol.24,No.4, July/August pp.142-143.
Redclift, M. 1987. Sustainable Development: Exploring the contradictions. London andNew York: Methuen.
Rembert, T.C. 1997. Opening the Ivory: Elephants in Zimbabwe.http://www.ecotourism.about.com/travel/ecotourism/msub5.htm
Ringer, G. 1996a. Ecotourism Development in Uganda’s National Parkshttp://www.ecotourism.about.com/travel/ecotourism/msub5.htm
Ringer, G. 996b. Gorillas and Guerillas: Ecotourism in Uganda's National Parkshttp://www.ecotourism.about.com/travel/ecotourism/msub5.htm
Romero, C. and T. Rehman. 1989. Multiple Criteria Analysis for Agricultural Decisions. New York, NY: Elsevier Science Publishing Co. Inc.
Sanchez, M. M. 1998. Assessment of Progress in the Implementation of Agenda 21 at theNational Level. Division for Sustainable Development Sixth Session, New Yorkhttp://www.un.org/esa/agenda21/natlinfo/niau/
Schaller, T. D. 1999. Indigenous Ecotourism and Sustainable Development: The Case ofRío Blanco, Ecuador, http://www.eduweb.com/schaller/Section2RioBlanco.html

22
Sournia, Gerard. 1996. Wildlife Tourism in West and Central Africa. Ecodecision 52-54.
Strager, M. P., C. B. Yuill, J. J. Fletcher, P. Kinder, W. Kordek, 1997. A MultipleCriteria Decision-Making Framework to rank Ownership Parcels fro WetlandWildlife Management Potential. West Virginia Division of Natural Resources(Wildlife Resource Section).
Tecle, A., and M. Yitayew. 1990. Preference ranking of Alternative IrrigationTechnologies Via a Multicriterion Decision-Making Procedure. American Societyof Agricultural Engineers, 33 (5): 1509-1517.
Tecle, A., M. M. Fogel, and L. Duckstein. 1988. Multicriterion Analysis of ForestWatershed Management Alternatives. Water Rsources Bulletin – AmericanWater Resources Association, 24 (6): 1169-1177.
Teye, Victory B. 1987. Developing Africa’s Tourism Potential Prospects and Issues.Tourism Recreation Research XII (1): 9-14.
Thresher, P. 1972. African National Parks and Tourism - an Interlinked Future.Biological Conservation 4 (4): 279-284.
Valentine, P. 1993. Nature-based tourism. In B. Weiler and C.M. Hall, (eds.) SpecialInterest Tourism. London: Belhaven Press. 105-128.
West, P. C., and S. R. Brechin, (eds.) 1991. Resident Peoples and National Parks.Tucson: University of Arizona Press.
Western, D. 1997. “50 Years of Challenge and Achievement: Mission of KWS.” http://www.kenya-wildlife-service.org/vision.htm
Zeleny, M. 1982. Multiple Criteria Decision Making. McGraw-Hill Book Company,New York.
Zurick, D. N. 1992. Adventure travel and sustainable tourism in the peripheral economyof Nepal. Annals of the Association of American Geographers 82(4): 608-628.
---- Global Environment Facility. 1995. Uganda: Bwindi Impenetrable National Park andMgahinga Gorilla National Park Conservation. Project Document. World Bank.
---- Government of Uganda. 1990. "Uganda Tourism Development: TourismRehabilitation and Development Planning for Uganda."
---- World Commission on Environment and Development. 1987. Our Common Future.New York: Oxford University Press.

23
---- USAID/Uganda. 1990. "Natural Resources and Tourism Management," ProjectConcept Paper.
---- Uganda, 1990. Uganda a Country Study. http://get.to/bukenya.
---- Uganda- Metadata. http://edcintl.cr.usgs.gov/adds/c1/r2/ug/doc/admn/ugadmn1.html
---- Africa Data Dissemination Service. http://edcintl.cr.usgs.gov/adds/adds.html
---- A compiler for formal metadata. http://geology.usgs.gov/tools/metadata/tools/
---- Geo Community, GIS Data Depot. http://www.gisdatadepot.com/catalog/UG/index.

24
Table 2. Vector of maximum and minimum criterion values
CriterionMaximum
f*Minimum
f**
1. Park type value for wildlife habitat 1.0 0.0
2. Existing park preservation potential 1.0 0.0
3. Park preservation potential rating fromadvancement land use/agriculture 1.0 0.0
4. Soil suitability foragriculture/construction
0.0 -1.0
5. Proximity to major roads/towns 0.0 -1.0
6. Existence of endangered species 1.0 0.0
7. Park Size 1.0 0.23
8. Number of recorded species 1.0 0.5
25
1
3 2
11
1
2
3
3
2
?
#
*
+
^
x
~
$
=%
100 0 100 200 Miles
N
EW
S
Uganda National Parks
Figure 3. Results from the Compromising Programming Model
Table 3. Results from the Ranking Model: Uganda National Parks.
Name Rank(+) Murchison Falls Nat. Park 1
(x) Queen Elizabeth Nat. Park 1
(*) Rwenzori National Park 1
(#) Lake Mburo National Park 1
(~) Kibale National Park 2
(^) Kidepo National Park 2
(?) Bwindi National Park 2
(=) Semuliki National Park 3
($) Mgahinga Gorilla Nat. Park 3
(%) Mt. Elgon National Park 3
26
Table 4. Conversion of non-numerical criterion measures into numerical form
Criterion Numerical value assigned
1. Park type value for wildlife habitatMgahinga Gorilla (0.6)Rwenzori Mountains (0.6)Semuliki (0.2)Lake Mburo (0.6)Kidepo Valley (0.8)Bwindi Impenetrable (1.0)Queen Elizabeth (1.0)Kibale (0.4)Murchison Falls (0.6)Mount Elgon (0.2)
2. Park size Not applicable
3. Existing park preservation potential If the species on potential park had a highrestoration potential (1.0) if moderately then(0.5)
4. Park preservation potential ratingfrom advancement landuse/agriculture
If the perimeter of the park has over 75% ofits area as no restoration conflict (1.0) if over75% (0.5)
5. Soil suitability foragriculture/construction
Soil suitable or only slightly limited forbuildings, locations, homes, streets, andfarming (1.0)
6. Proximity to major roads/towns Parks 100m from major roads (1.0)
7. Existence of endangered species If more than 25% of the species areendangered (1.0)

27
Table 5. Evaluation Matrix of Criteria vs. Individual National Parks
CriterionMgahinga
Gorilla RwenzoriLake
MburoQueen
ElizabethMarchison
Falls Simuliki KibaleMt.
Elgon Kidepo Bwindi
1. Park type value forwildlife habitat
0.6 0.6 06 1.0 0.6 0.2 0.4 02 0.8 1.0
2. Existing parkpreservation potential
1.0 1.0 1.0 1.0 0.5 0.5 1.0 0.5 0.5 0.5
3. Park preservationpotential rating fromadvancement landuse/agriculture
0.5 1.0 1.0 1.0 1.0 1.0 0.5 1.0 1.0 1.0
4. Soil suitability foragriculture/construction
1.0 1.0 1.0 0.0 0.0 1.0 1.0 0.0 0.0 1.0
5. Proximity to majorroads/towns
0.0 1.0 0.0 1.0 1.0 1.0 1.0 0.0 0.0 0.0
6. Existence ofendangered species
0.0 0.0 1.0 0.0 0.0 0.0 1.0 0.0 0.0 1.0
7. Park Size 34sq km 996 sqkm
260 sqkm
1978 sqkm
3860 sqkm
219 sqkm
776 sqkm
1154 sqkm
776 sqkm
331 sqkm
8. Number of recordedspecies
76 70 72 95 76 53 60 24 86 93

28
Table 6. Payoff Matrix of Criteria vs. Individual National Parks
CriterionMgahinga
Gorilla RwenzoriLake
MburoQueen
ElizabethMarchison
Falls Simuliki KibaleMt.
Elgon Kidepo Bwindi
1. Park type value forwildlife habitat
0.6 0.6 06 1.0 0.6 0.2 0.4 02 0.8 1.0
2. Existing parkpreservation potential
1.0 1.0 1.0 1.0 0.5 0.5 1.0 0.5 0.5 0.5
3. Park preservationpotential rating fromadvancementlanduse/agriculture
-0.5 -1.0 -1.0 -1.0 -1.0 -1.0 -0.5 -1.0 -1.0 -1.0
4. Soil suitability foragriculture/construction
-1.0 -1.0 -1.0 0.0 0.0 -1.0 -1.0 0.0 0.0 -1.0
5. Proximity to majorroads/towns
0.0 -1.0 0.0 -1.0 -1.0 -1.0 -1.0 0.0 0.0 0.0
6. Existence ofendangered species
0.0 0.0 1.0 0.0 0.0 0.0 1.0 0.0 0.0 1.0
7. Park Size 0.01 0.23 0.07 0.5 1.0 0.06 0.23 0.34 0.21 0.08
8. Number of recordedspecies
76 70 72 95 76 53 60 24 86 93
29
Figure 4. Topography: Western Uganda.
Figure 5. Elevation: Western Uganda
30
Figure 6. Slope: Western Uganda