Embed Size (px)
Citation preview

See discussions, stats, and author profiles for this publication at: https://www.researchgate.net/publication/7703552
Application of Higher Order Statistics Techniques to EMG Signals to
Characterize the Motor Unit Action Potential
Article in IEEE transactions on bio-medical engineering · August 2005
DOI: 10.1109/TBME.2005.847525 · Source: PubMed
CITATIONS
61READS
489
5 authors, including:
Some of the authors of this publication are also working on these related projects:
MIAPS_ View project
WIISEL View project
Shahjahan Shahid
Edinburgh Bioscience Limited
14 PUBLICATIONS 269 CITATIONS
SEE PROFILE
Jacqueline Walker
University of Limerick
35 PUBLICATIONS 325 CITATIONS
SEE PROFILE
Gearóid ÓLaighin
National University of Ireland, Galway
234 PUBLICATIONS 9,962 CITATIONS
SEE PROFILE
Anand Vishwanath Nene
89 PUBLICATIONS 3,714 CITATIONS
SEE PROFILE
All content following this page was uploaded by Jacqueline Walker on 16 May 2014.
The user has requested enhancement of the downloaded file.
IEEE TRANSACTIONS ON BIOMEDICAL ENGINEERING, VOL. 52, NO. 7, JULY 2005 1195
Application of Higher Order Statistics Techniques toEMG Signals to Characterize the Motor Unit
Action PotentialShahjahan Shahid*, Jacqueline Walker, Member, IEEE, Gerard M. Lyons, Ciaran A. Byrne, and
Anand Vishwanath Nene
Abstract—The electromyographic (EMG) signal provides infor-mation about the performance of muscles and nerves. At any in-stant, the shape of the muscle signal, motor unit action potential(MUAP), is constant unless there is movement of the position ofthe electrode or biochemical changes in the muscle due to changesin contraction level. The rate of neuron pulses, whose exact timesof occurrence are random in nature, is related to the time durationand force of a muscle contraction.
The EMG signal can be modeled as the output signal of a filteredimpulse process where the neuron firing pulses are assumed to bethe input of a system whose transfer function is the motor unit ac-tion potential. Representing the neuron pulses as a point processwith random times of occurrence, the higher order statistics basedsystem reconstruction algorithm can be applied to the EMG signalto characterize the motor unit action potential.
In this paper, we report results from applying a cepstrum ofbispectrum based system reconstruction algorithm to real wired-EMG (wEMG) and surface-EMG (sEMG) signals to estimate theappearance of MUAPs in the Rectus Femoris and Vastus Lateralismuscles while the muscles are at rest and in six other contractionpositions. It is observed that the appearance of MUAPs estimatedfrom any EMG (wEMG or sEMG) signal clearly shows evidenceof motor unit recruitment and crosstalk, if any, due to activity inneighboring muscles. It is also found that the shape of MUAPs re-mains the same on loading.
Index Terms—Electromyographic signals, higher order statis-tics theory, HOS-based blind deconvolution, motor unit actionpotential.
I. INTRODUCTION
E LECTROMYOGRAPHIC (EMG) signals, detected di-rectly from the muscle or from the skin surface by using
indwelling or surface electrodes, respectively, show a train ofmotor unit action potentials (MUAPs) plus noise. An MUAP isthe sum of a group of muscle fiber action potentials (MFAP),where each MFAP is the superimposed information of the
Manuscript received April 7, 2004; revised January 27, 2005. Asterisk indi-cates corresponding author.
*S. Shahid is with g.tec Guger Technologies OEG, Herberstein str. 60, 8020,Graz, Austria (e-mail: [email protected]).
J. Walker and G. M. Lyons are with the Biomedical Electronic Laboratoryof the Department of Electronic and Computer Engineering, University of Lim-erick, Limerick, Ireland.
C. A. Byrne is with BioMedical Research Ltd., Parkmore Business Park West,Galway, Ireland.
A. V. Nene is with the Department of Physical and Rehabilitation Medicine,Roessingh Research and Development, Enschede 7500-AH, The Netherlands.
Digital Object Identifier 10.1109/TBME.2005.847525
muscle and neuron firing signals [1], [2]. To maintain or in-crease a force level, the motor unit (alpha motoneuron) fires(excites each muscle fiber) repeatedly and, consequently, themuscle contracts. The firing pulses are normally considered arandom function of time which is non-Gaussian in nature [3].A simple model of an EMG signal is [1]–[3]
(1)
where is the modeled EMG signal, is a point process,whose times of occurrence have a random characteristic, thatrepresents the firing impulses, represents the MUAP,is a zero mean additive white Gaussian noise which is inde-pendent of that represents the system noise and is thenumber of motor unit firings.
There are many factors which can affect the appearance ofthe MUAP, including the type of electrodes, e.g., whether theyare invasive or noninvasive and the filtering properties of theelectrode [1]. The shape and the amplitude of the MUAP mayalso depend on the characteristics of the muscle fibers and thedistance between the muscle fiber and the recording site [1].The amplitude of the MUAP in the EMG signal is related to acertain extent to the force a muscle may generate and thus to thelevel of contraction [1], [4]. The shape of the MUAP within themotor unit action potential train (MUAPT) is constant unlessthere is movement of the position of the electrode from wherethe EMG signal is recorded, or biochemical changes in themuscle occur [1]. The frequency of occurrence of the MUAPin the EMG signal also changes at different levels of musclecontraction [5].
To characterize the EMG signal, investigators have used a va-riety of signal processing techniques. Due to the difficulty of ex-tracting individual MUAPs from the EMG signal, particularlythe sEMG signal, many investigators have relied on the use ofthe overall signal. The amplitude of the EMG signal, estimatedas either the mean absolute value (MAV) or root mean square(RMS) of its time-varying standard deviation, may be recoveredby de-correlating the signal (following appropriate noise rejec-tion filtering), then demodulating and smoothing it [6]. Param-eters such as the RMS value have been extensively used to as-sess the relationship between the EMG amplitude and the forceof the contraction [4], [7], [8], [13]. The integrated EMG signalmay also be used: for example, a linear relationship between the
0018-9294/$20.00 © 2005 IEEE

1196 IEEE TRANSACTIONS ON BIOMEDICAL ENGINEERING, VOL. 52, NO. 7, JULY 2005
amplitude of the raw integrated wired EMG signal and the forcelevel in the Vastus Lateralis (VL) muscle during linear ramp iso-metric knee extension was found by [9]. A linear correlation wasalso observed in the average integrated EMG signals recordedfrom any place in the VL muscle. Evidence of crosstalk in thesEMG signal of the Rectus Femoris (RF) muscle due to the con-traction of the Vastus Lateralis (VL) muscle was found by anensemble averaging technique applied to both the surface EMG(sEMG) and wired EMG (wEMG) signals [10], [11].
A number of techniques have been developed to assess EMGsignals (both wEMG and sEMG) in the frequency domain. Thespectrum of the EMG signal is mainly composed of energy infrequencies ranging between 50 to 70 Hz [12]. The frequencyspectrum may change due to physiological processes, such as fa-tigue [13]. The change in the frequency spectrum of the fatiguedmuscle EMG signal is a reduction in the power in the higher fre-quencies which suggests that a different type of MUAP may begenerated due to the physiological processes in the muscle. Asimilar behavior of frequency shifting and power reduction athigh frequency was observed in the sEMG signal [12]. Higherorder statistics were used by [3] to analyze the sEMG signal.It was reported that the sEMG becomes less Gaussian on in-creasing mean voluntary contraction (MVC).
Some researchers have worked on establishing the shape ofthe MUAP in the EMG signal. A low-pass differentiator was de-scribed in [13] for estimating MUAPs from the EMG signal. Aconcentric needle electrode was used to record the EMG signaland the MUAP parameters of duration and number of baselinecrossing pulses were visually assessed and measured from therecorded signal by [14]. However, it is very difficult to determineMUAPs when a great number of motor units fire simultaneously.MUAPs were extracted from the wEMG signal by searching andmatching with a pattern (template) of MUAPs that had previ-ously been observed [15], [16].
A template-based approach can work in signals from weaklycontracting muscle as distinct MUAPs can be distinguishedmore clearly during weak contractions when only a few motorunits are active. But with strong contractions, the MUAPsbecome so numerous that the EMG signal becomes noise-likein appearance [15]. In these circumstances, a signal processingtechnique may be applied to extract the MUAPs. As a firststep toward this goal a weighted low pass differential filter wasproposed by [17] to locate MUAPs in the sEMG by estimatingtheir peaks in the sEMG signal. A Wiener filter based sEMGsignal decomposition was proposed by [18]. The proposedmethod theoretically can estimate the intramuscular EMGsignal, i.e., the MUAP when the firing pulses are assumed tobe a Gaussian process. A combination of power spectrum andhigher order spectral techniques was used by [19] to decomposethe MUAP. Results were reported based on simulated EMGsignals. Higher order statistics were also used by [20], [21]for decomposition of MUAPs. Satisfactory results were onlyobtainable for wEMG signals [20] and for reproduction ofsynthetic EMG signals [21].
In this paper we consider an EMG signal to be modeled bya linear time invariant (LTI) moving average (MA) system (asin (1)) with the input to the system generated by firing neuronpulses whose random times of occurrence are non-Gaussian in
nature. We use a higher order statistics (HOS) based systemreconstruction algorithm to estimate the typical shape of theMUAP from an EMG signal; allowing the behavior of the motorunit action potential (MUAP) to be characterized. We report onan initial assessment of the performance of the technique forestimating the appearance of the MUAP from the EMG signal.EMG signals collected from four different subjects under avariety of contraction positions and loading conditions wereconsidered, giving the opportunity to observe the estimatedMUAP shape when the muscle contraction position and/orloading changes.
This paper is organized as follows: a brief introduction toHOS and a system reconstruction technique that is based onHOS are presented in Section II. In Section III the protocolfor recording the EMG signals used for MUAP estimation isdescribed. MUAP estimation and representation techniques arediscussed in Section IV. A discussion and analysis of the shapeof the MUAP in different EMG signals is reported in Section V.Finally, conclusions are presented in Section VI.
II. HOS THEORY FOR EMG SIGNAL ANALYSIS
Frequency domain techniques are amongst the most fun-damental and useful tools in the area of signal processing.Conventional techniques are generally based on the analysisof the first- and second-order moments and cumulants (i.e.,mean, correlation and variance) and their spectral representa-tion (e.g., power spectrum). These techniques provide all theinformation available from the signal only if the underlyingprocess is Gaussian and is operated on by a linear system. Fornon-Gaussian processes and nonlinear systems, more infor-mation can be obtained from the higher order moments andcumulants (third-order to th-order) and their spectral repre-sentation (higher order spectra). The second-order spectrumsuppresses phase relationships, whereas information aboutthe phase of the underlying system is available from higherorder spectra [22]. Among other properties of the higher orderspectra, two important ones are relevant here: 1) the higherorder spectra of the sum of two or more independent sets ofrandom processes is equal to the sum of the spectra of thoserandom processes of the same order; and 2) the higher orderspectra ( 2) of a Gaussian signal are theoretically equal tozero.
Higher order statistics are useful in blind deconvolution andsystem recovery. As they do not suppress phase information,they may be applied to nonminimum phase and nonlinearsystems. As they are able to recover information aboutnon-Gaussian signals, they are useful in systems involvingnon-Gaussian input signals as in the MUAPT model. In thispaper we will use the second-order spectrum, the Bispectrum,to estimate the system information. The bispectrum is the mostaccessible of the higher order spectra as it is the simplest tocompute (computational complexity increases with increasingorder) and its properties have been well explored [22]–[28]. Thefollowing sections show how the bispectrum may be computedfrom the available system output signal [ in (1)] and how,assuming the model for the MUAPT described by (1), thebispectrum may be used to recover the system transfer functionwhich describes the MUAP.

SHAHID et al.: APPLICATION OF HIGHER ORDER STATISTICS TECHNIQUES TO EMG SIGNALS 1197
Fig. 1. Illustration of the signal processing procedure: (a) magnitude of the bispectral estimate (equation (2)) from 1 s of EMG signal. (b) Cepstrum of bispectrum(equation (5)) from 1 s of EMG signal. (c) Magnitude and phase of the system estimate [see (12)] from 1 s of EMG signal. (d) Reconstructed MUAP estimatebefore normalization.
A. Bispectrum
The bispectrum is the expectation of three frequencies: twodirect frequency components and the conjugate frequency ofthe sum of those two frequencies of a random signal [22].Knowing the Fourier frequency components, , of theoutput signal , the bispectrum, , can be estimatedusing the Fourier-Stieltjes representation [22]
(2)
where denotes the statistical expectation, are the dis-crete frequency indexes and denotes the complex conjugate.The bispectrum is complex and, therefore, it has magnitude andphase. If the output signal comes from an LTI system with anon-Gaussian white noise input signal as in (1), it can be writtenas [22], [23]
(3)
where is the skewness that is equal to the bispectrum of theinput signal and is the transfer function of the system
. As the Gaussian white noise is independent of the inputsignal and since, theoretically, the bispectrum of Gaussian whitenoise is zero, there is no effect from the system noise when es-timating the bispectrum of the output [22], [23]. The magnitudeof a typical bispectral estimate from 1 s of EMG signal (detailsof EMG signal acquistion are given in Section III) is shown inFig. 1(a).
B. Cepstrum of Bispectrum System Recovery Technique
The cepstrum of bispectrum, , can be found by ap-plying a 1-D inverse Fourier transform operation to the loga-rithm of the bispectrum (a 2-D frequency domain signal) [24],[25]
(4)
where denotes the 1-D inverse Fourier transform to beapplied on the frequency axis and is the time-like index.The cepstrum of the bispectrum produces a representation ofamplitude versus time versus frequency.

1198 IEEE TRANSACTIONS ON BIOMEDICAL ENGINEERING, VOL. 52, NO. 7, JULY 2005
The cepstrum of bispectrum of any system output signal canbe used to estimate the system from the system outputsignal . By expressing the bispectrum of a system outputsignal in terms of the system transfer function as in (3), (4) canbe manipulated to [25]
(5)
where denotes the 1-D inverse Fourier transform whichis applied on the frequency axis , is the power spectrum,
is the power cepstrum and de-notes the Kronecker delta function. The cepstrum of bispectrumderived from 1 s of EMG signal is shown in Fig. 1(b). Consid-ering only the axis , (5) can be expressed as
(6)
where is a constant. Thus, (6) consists ofthe log of the system transfer function plus a constant. The con-stant can be removed by normalization, since for any blind de-convolution procedure we can only recover the system to withina scale factor [23]. Letting , (6) and gives
(0,0). Thus, the system transfer function can be com-puted as
(7)
The estimated in (7) may not always be accurate asthe estimated phase of the system [i.e., ] may varyfrom the true phase due to the fact that the true bispectrumphase (biphase) may differ by integer multiples of from theestimated biphase. Therefore, it is necessary to include a phaseunwrapping technique [27]. To perform phase unwrapping, weneed to fit the integer values relating the true and estimatedbiphase as below [28]
(8)
where and are the true and es-timated biphase values, respectively, and is a matrix ofintegers.
To find the matrix of , we use a similar technique tothat of [27], first, using the estimated phase of the system
a shadow biphase of the bispectrum is computedas
(9)
where is the biphase coefficient matrix: a set of equationsdescribing the relationship between the system phase and theresulting biphase [27]. Once the shadow biphase is found, theestimated biphase may be subtracted from it in order torecover the matrix of integers as shown in (10) below.
The result may not always be exactly on integer value and hencethe elements of are rounded to the nearest integer value
(10)
Once we have the elements of , we can easily estimatethe true biphase value from (8). A least squares method is thenapplied to estimate the true system phase
(11)
where denotes the transpose of and denotesthe matrix inverse. Now the better estimated system informationcan be computed by using the system’s Fourier magnitude andsystem’s Fourier phase term as
(12)
where is the absolute value of (7). A plot of typicalsystem magnitude and phase as recovered by this approach from1 s of EMG signal is shown in Fig. 1(c). Finally the inverseFourier transform of (12) gives the time domain system infor-mation, as depicted in Fig. 1(d).
III. EMG SIGNAL ACQUISITION AND PROCESSING
The EMG signals were recorded from four subjects. For eachsubject, two sets (using wired and surface electrodes) of EMGsignals were recorded in the gait laboratory of Roessingh Re-search and Development, Enschede, Holland, upon ethical ap-proval from the medical ethics committee of the Het RoessinghHospital. Each set of signals contains two subsets of EMG sig-nals classified on the basis of type of muscle tested—RectusFemoris (RF) and Vastus Lateralis (VL) muscle. Each subsetcontains 42 EMG signals recorded at seven different contractionpositions under three different loading conditions at the ankle ofthe subject.
A. Subjects
Four healthy male volunteers were recruited as subjects withages ranging from 23 to 33 years old (26.2 4). For each sub-ject, the wired and surface EMG measurements were taken atthe same time on each muscle. Three kinds of weight loadingwere tested for each subject: either no weight or by attaching1.13 kg and 2.26 kg weights at the ankle.
B. Placement of Fine Wire and Surface Electrodes to theMuscle
The technique of EMG signal recording followed the guide-lines of [30]. For RF, a line was measured between the anteriorsuperior illiac spine and the superior border of the patella, andthe fine wire electrode was inserted at 50% of the distance be-tween both anatomical landmarks. For VL, a line was measuredbetween the anterior superior illiac spine and the lateral borderof the patella and the same type of fine wire electrode was usedfor EMG signal recording. The fine wire electrode used wasmanufactured by The California Fine Wire Company, GroverBeach, CA, and was made of stainless-steel with a diameter of
SHAHID et al.: APPLICATION OF HIGHER ORDER STATISTICS TECHNIQUES TO EMG SIGNALS 1199
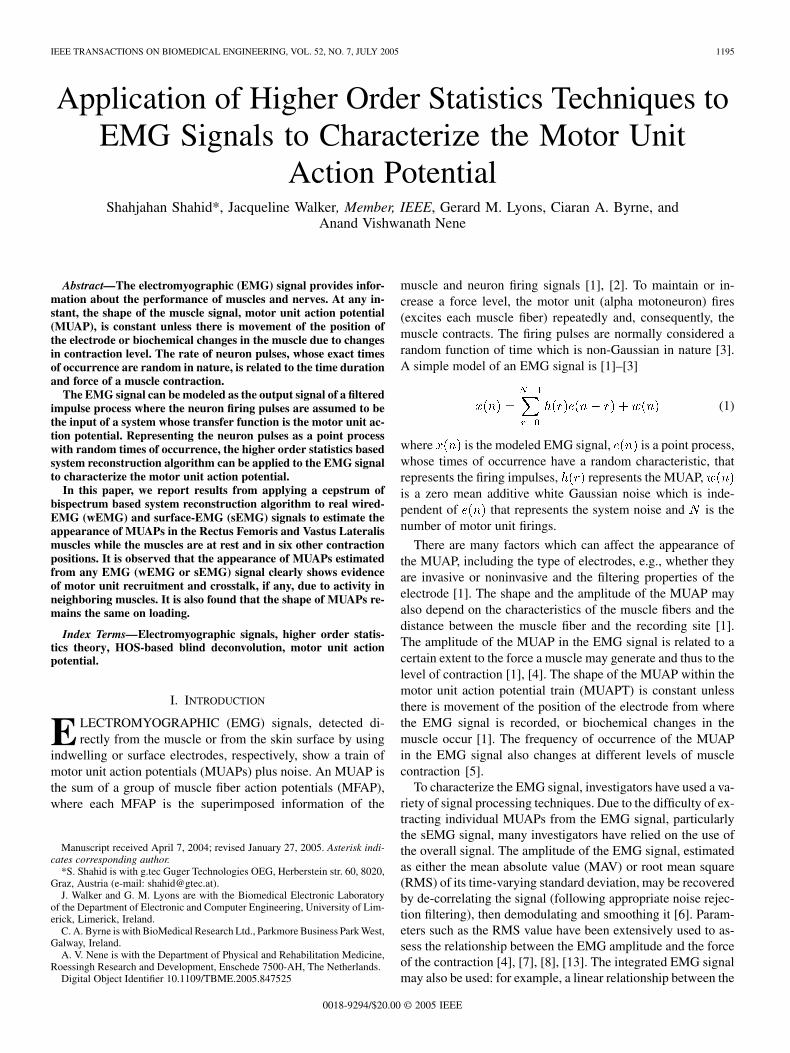
Fig. 2. The different contraction protocols. Dashed lines indicate the rest position and bold lines indicated the measurement positions. (a) Three angles (30 , 60 ,and 90 ) of knee extension contraction. (b) Two angles (15 and 30 ) of hip flexion contraction. (c) Combined contraction protocol beginning in a resting positionfollowed by knee extension to 90 and finally simultaneous knee extension and hip flexion. (adapted from [10]).
50 m, 2-mm recording surface and the rest of the wire wasnylon insulated.
For both RF and VL, surface electrodes were placed eitherside of the fine wire electrode parallel to the direction of themuscle fibers of the muscle [29]. The surface electrode wasmade of Ag/AgCl and square shaped with a 10 mm by 10 mmrecording area, and a 22-mm interelectrode distance (manufac-tured by Meditrace Pellet 180, The Netherlands).
C. Different Positions for Contraction
1) Resting Protocol: All subjects began in a seated positionwith a knee angle of 90 (the dashed line in Fig. 2). This positionis referred to here as the rest state; i.e., “no knee extension” or“no hip flexion.” Two resting EMG measurements (also knownas the baseline measurement) were recorded at this point withthe subject in a relaxed state.
2) Vastii Protocol: Each subject had to extend the knee toangles of 30 , 60 , and 90 from the rest state [Fig. 2(a)] whilewEMG and sEMG signals were simultaneously recorded fromboth muscles. Subsequently 1.13 kg and 2.26 kg weights wereattached at the ankle and the contraction protocol was repeatedusing the aforementioned angles. EMGs were recorded for a 5-to 10-s period for each contraction. Two EMG measurementswere taken for each angle at all weights.
3) Rectus Femoris Protocol: Subjects flexed the hip fromthe rest state to two angles, a low angle approximately 15 anda high angle approximately 30 [Fig. 2(b)]. This process wasrepeated with a 1.13 kg weight followed by a 2.26-kg weightplaced around the ankle. Again, two EMG recordings weretaken for each angle at all weights
4) Combination Protocol: In this case, subjects began withthe leg in the resting position, after which they extended the legto 90 knee extension and concluded with combined knee ex-tension and hip flexion to a hip flexion angle of approximately15 [Fig. 2(c)]. The combination contractions were performedfor each of the contraction weights i.e., 0 kg (no weight),1.13 kg, and 2.26 kg. Two EMG recordings were taken at allweights.
The order in which all muscle contractions were performedwas randomized to prevent fatigue or bias in the results. Eachcontraction protocol was designed to elicit an EMG responsefrom different muscles. Knee extension contractions were de-signed to activate the Vastii only, while the hip flexion contrac-tions have been shown to activate RF only [30]. The combinedcontraction was designed to show the effect of the two differentcontractions on activation in the RF muscle as shown by thewEMG and sEMG. As the knee extension phase of the com-bined contraction was designed to activate the Vastii only, oneexplanation of activity in the RF muscle sEMG, which is absentfrom the RF wEMG signal, would be possible crosstalk fromthe Vastii muscles [10].
D. Acquisition of EMG Signal
On each contraction protocol, four detectors—two elec-trodes for the wEMG signal and two electrodes for the sEMGsignal—were set up and the corresponding EMG signals wererecorded simultaneously. The recording of EMG signals wasperformed using four channels of the “K-lab” EMG measure-ment system (manufactured by Biometrics Europe BV, TheNetherlands). 2048 sample points were taken at a sampling rateof 2 kHz. The measurement system had an input impedanceof 100 and common mode rejection ratio of 100 dB. Athird-order Butterworth high pass filter (hardware filter) withcut-off frequency of 20 Hz was used on all EMG channels toincrease SNR. A 12-bit analog-to-digital converter producedan output in digital format.
E. Technique of MUAP Estimation
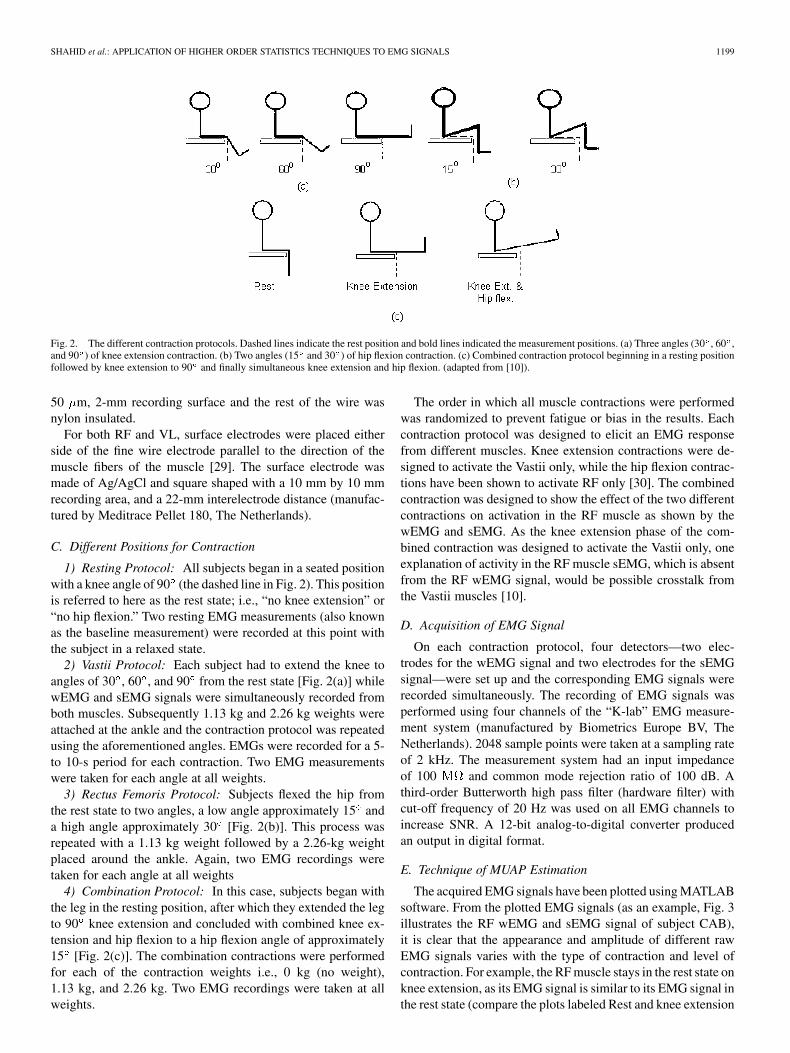
The acquired EMG signals have been plotted using MATLABsoftware. From the plotted EMG signals (as an example, Fig. 3illustrates the RF wEMG and sEMG signal of subject CAB),it is clear that the appearance and amplitude of different rawEMG signals varies with the type of contraction and level ofcontraction. For example, the RF muscle stays in the rest state onknee extension, as its EMG signal is similar to its EMG signal inthe rest state (compare the plots labeled Rest and knee extension
1200 IEEE TRANSACTIONS ON BIOMEDICAL ENGINEERING, VOL. 52, NO. 7, JULY 2005
Fig. 3. wEMG and sEMG signal recorded from Rectus Femoris of subject CAB at four different contraction positions—rest, hip flexion to 30 (HF30d), kneeextension to 60 (KE60d) and combined (COM).
at 60 (KE60d) of Fig. 3). In the combined contraction (COM),it is found that the wEMG signal for the RF muscle shows twodifferent stages: rest and contraction, whereas the sEMG signalfor the RF muscle shows three distinct stages: rest, a low levelof contraction and a higher level of contraction. Recall that boththe wEMG and sEMG signals were recorded simultaneouslyand the combined contraction protocol consists of three parts:rest, knee extension and hip flexion plus knee extension [seeFig. 2(c)].
In order to recover the overall shape of a MUAP, each rawEMG signal has been segmented into segments of 1-s durationwhere each segment contains 2048 data points. Fig. 4 showsplots of 1-s segments of EMG signals from the two differentcontracting muscles of subject CAB. From these plots, it is ob-served that the MUAP in the wEMG signal is sometimes dis-tinguishable at a low contraction level, but it is hard to see theexact shape of the MUAP and determine the number of motorunits involved. On the other hand, it becomes much more dif-ficult to find individual MUAPs when we consider the sEMGsignal of the same contracting muscle. It is also observed thatthe sEMG signal contains more noise that the wEMG signal.
As the raw EMG signal always contains some noise, it can bedifficult to recover directly a good estimate of the MUAP shapefrom a raw EMG signal. By applying the cepstrum of bispec-trum based system reconstruction algorithm to the EMG signal,an estimate of the MUAPs in the signal can be recovered. Bis-pectrum based techniques require more data to produce an es-timate because of the requirement for averaging to reduce thevariance of the bispectrum [22]. Therefore, the estimation of a
MUAP is made from a 1-s segment of raw EMG (wEMG orsEMG) signal. The individual MUAPs within each second ofraw data will each contribute information toward the estimateof the MUAP shape. A set of MUAP estimates may thus bemade for each second, from first to last, of the raw signal. Dueto the inherent limitations of blind deconvolution, normalizedestimates of the MUAPs are computed by considering all esti-mated MUAPs from a given signal.
To illustrate the presentation of estimated MUAPs in anyfigure, we present Fig. 5 as an example where the raw signal is inthe top subplot, the estimated MUAPs without normalization inthe middle subplot and the estimated MUAPs normalized withrespect to the whole recording in the bottom subplot of the figure.The top subplot contains three seconds of a raw EMG signal (i.e.,3X2048 data points). The middle subplot shows three MUAPswhere each MUAP has been estimated from 1 s of the raw signal:i.e., the first MUAP has been estimated from the raw EMG signalof the first second; the second MUAP has been estimated fromthe raw EMG signal of the second and so on. The last subplotis the normalized form of the middle subplot. On the axis ofeach subplot is displayed the time points of the raw signal fromwhich the MUAPs have been estimated and the axis displaysthe amplitude of the raw signal (top subplot) and of the estimatedMUAPs (middle and bottom subplots). Note that the time-scalein the middle and bottom subplots is for delineating the contribu-tion of each second of the raw EMG signal and the presence of anestimated MUAP at a particular time on the time scale does notindicate that the raw EMG signal necessarily contains a MUAPat that exact time instant.

SHAHID et al.: APPLICATION OF HIGHER ORDER STATISTICS TECHNIQUES TO EMG SIGNALS 1201
Fig. 4. wEMG and sEMG signal recorded from the Rectus Femoris of subject CAB at rest, hip flexion to 30 (HF30d), and knee extension to 60 (KE60d).
Fig. 5. MUAP estimation technique. Raw wEMG signal (top), corresponding estimated MUAP (middle) and normalized form of estimated MUAPs (bottom).The x-axes of all subplots are the time scale of the original recording (in seconds). The y axis shows the amplitude of raw data (top), estimated MUAP (middle)and normalized MUAP (bottom).

1202 IEEE TRANSACTIONS ON BIOMEDICAL ENGINEERING, VOL. 52, NO. 7, JULY 2005
Fig. 6. Appearance of MUAP in wEMG (top) and sEMG (bottom) signals of Rectus Femoris muscle (subject-CAB). Both subplots show the estimated MUAPsat five contraction positions: rest, hip flexion 15 (HF15), hip flexion 30 (HF30), knee extension 30 (KE30), knee extension 60 (KE60), knee extension 90(KE90).

SHAHID et al.: APPLICATION OF HIGHER ORDER STATISTICS TECHNIQUES TO EMG SIGNALS 1203
Fig. 7. Appearance of MUAP in wEMG (top) and sEMG (bottom) signals of Vastus Lateralis muscle (subject-CAB). Both subplots show the estimated MUAPsat five contraction positions: rest, hip flexion 15 (HF15), Hip flexion 30 (HF30), knee extension 30 (KE30), knee extension 60 (KE60), knee extension 90(KE90).

1204 IEEE TRANSACTIONS ON BIOMEDICAL ENGINEERING, VOL. 52, NO. 7, JULY 2005
TABLE IMUAP CHARACTERISTICS OF RF AND VL MUSCLE AT DIFFERENT CONTRACTION POSITIONS
IV. RESULTS
Following the procedure described above, MUAPs have beenestimated from the simultaneously recorded wEMG and sEMGsignal of the RF and VL muscles of the four subjects. Here wepresent the results of estimated MUAPs for one subject (CAB)only. Figs. 6 and 7 display the estimated MUAPs for six con-traction positions: rest, hip flexion 15 (HF15), hip flexion 30(HF30), knee extension 30 (KE30), knee extension 60 (KE60)and knee extension 90 (KE90). The behavior of MUAPs in thedifferent contraction positions has been summarized in Table I.To observe the behavior of MUAPs during the combined con-traction we estimated the MUAP from the three separate stagesof the EMG and plotted the results in Fig. 8. We also estimatedthe MUAPs from the EMG signal when the subjects have dif-ferent loads at the ankle. Fig. 9 displays one example of theMUAPs’ behavior which were estimated from the wEMG andsEMG signals of the RF muscles of subject CAB with differentweights at the ankle.
In MUAP observation and analysis, the shape of the MUAPhas been described by the presence and the duration of threephases—rest phase, overshot phase (depolarizing phase), andundershot phase (repolarizing phase). The behavior of theMUAP at different contraction positions is noted below.
A. MUAP in the EMG Signal With Subject at Rest
The MUAP of rest muscle can be seen in the first sequence inboth subplots of Figs. 6 and 7. From these MUAPs the followingpoints can be noted.
1) The shape of the MUAP in resting muscle EMG signal isimpulse-like and the peak may appear randomly to bothsides (positive and negative) of zero level.
2) The shape and appearance of the estimated MUAPs aresimilar in both the wEMG and sEMG signal.
These characteristics are summarized in Table I.
B. MUAP in the EMG Signal With Subject Holding HipFlexion
The MUAPs at this contraction position (see Fig. 2(b): hipflexion to 15 and 30 ) are displayed in the second and thirdsequences in each of the subplots of Figs. 6 and 7. The behaviorof estimated MUAPs can be described as follows and are alsosummarized in Table I.
1) The MUAPs in the RF wEMG signal confirm that the RFmuscle is contracting because: a) the MUAPs have threephases (rest, overshot and undershot phase) and b) thepeaks of all MUAPs appear to only one side of the baseline (zero level).
2) The MUAPs in the RF sEMG signal also show that themuscle is contracting as it behaves similarly to the above.
3) The MUAPs in the VL wEMG signal confirms that themuscle stays at rest in hip flexion as the MUAPs showsimilar behavior to the resting muscle MUAP (see restingmuscle behavior in Table I or the first sequence in Figs. 6and 7).
4) The MUAPs in the VL sEMG signal do not always showthe resting state shape. At a low angle of hip flexion the

SHAHID et al.: APPLICATION OF HIGHER ORDER STATISTICS TECHNIQUES TO EMG SIGNALS 1205
Fig. 8. Appearances of MUAP in Rectus Femoris and Vastus Lateralis muscle (subject-CAB) for the combined contraction. The figure illustrates the MUAPsestimated from Rectus Femoris wEMG (RF-wEMG), Rectus Femoris sEMG (RF-sEMG), Vastus Lateralis wEMG (VL-wEMG) and Vastus Lateralis sEMG(VL-sEMG).
MUAP is similar to the rest state MUAP, but at a highangle of hip flexion the peak amplitude of the MUAPsappear mostly to one side of zero level.
The appearance of the MUAP in the VL sEMG signal ata high angle of hip flexion could be a superimposing effectfrom other muscles (crosstalk) or could indicate contrac-tion (low level contraction). Furthermore, the appearanceof MUAPs in the VL sEMG signal are similar to the ap-pearance of MUAPs in the RF sEMG signal (see Table I orcompare the sEMG subplots in Figs. 6 and 7). Therefore,for this case, this appearance indicates the possibility ofthe presence of a crosstalk signal in the VL muscle due toRF muscle contraction.
C. MUAP in the EMG Signal With Subject Holding KneeExtension
The fourth, fifth and sixth sequences in each subplot of Figs. 6and 7 display the average appearance of MUAPs at this contrac-tion position (Fig. 2(a)—knee extended at 30 , 60 and 90 ).The behavior of the estimated MUAPs are described below andalso summarized in Table I.
1) As expected, the behavior of the MUAPs in the wEMGand sEMG signals from the VL muscle show the appear-ance of a contracting muscles MUAP, having three phasesand with the MUAP peak appearing mostly to one side ofzero level.
2) The MUAPs in the RF sEMG signal would suggest thatthe muscle is not at rest. Thus, there is evidence of acrosstalk signal due to VL muscle contraction as the ap-pearance of the MUAPs in the RF sEMG signal and theVL sEMG at this contraction position are similar.
3) The MUAPs in the RF wEMG signal appear similar tothe baseline Rest state, but as the angle of knee exten-sion increases more of the behavior of nonresting muscleMUAPs becomes apparent: the peak of the MUAPs ap-pear to one side of zero level. However, there is not astrong appearance of three phases of MUAP. This appear-ance may indicate one of two things: 1) the influence ofanother contracting muscle i.e., a crosstalk signal due to aneighboring muscle but not from the VL muscle becauseit is not similar to the appearance of the MUAP as it isestimated from the VL muscle; 2) the RF muscle actuallyis contracting at this time (at a low level).
D. MUAP in the EMG Signal When Subject Executes aCombination Contraction
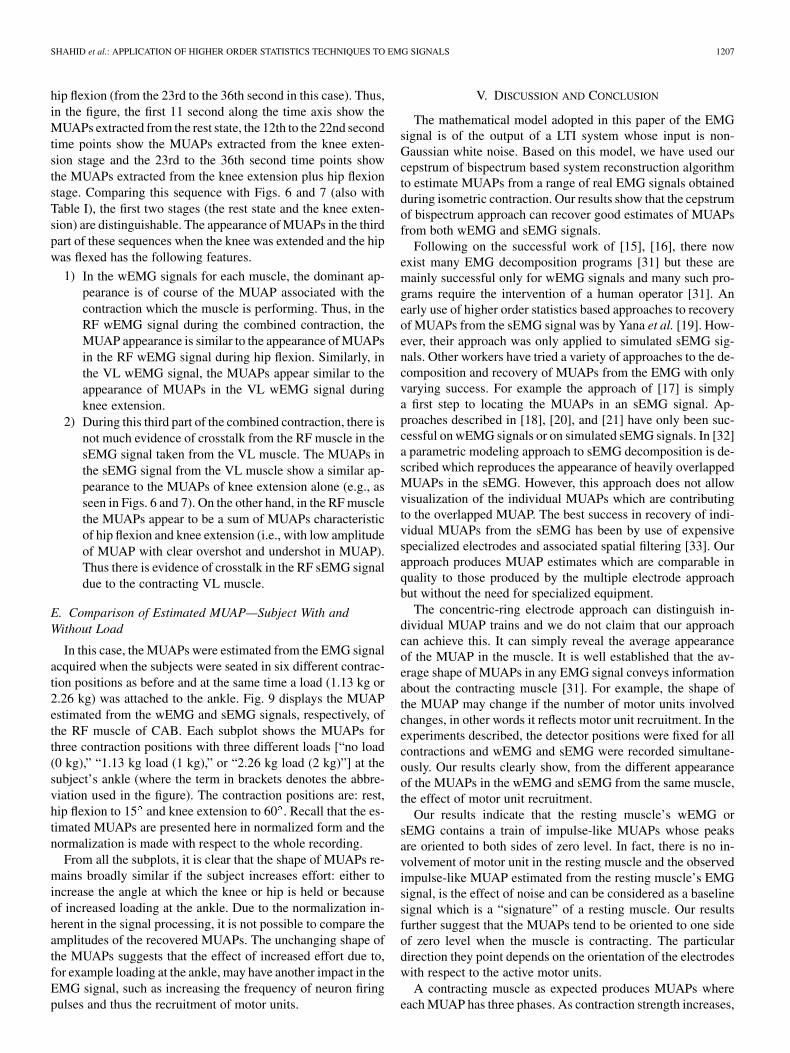
Fig. 8 displays the average appearance of MUAPs during thecombined contraction protocol [Fig. 2(c)]. Recall that the EMGsignal recorded from a combination contraction has three stages:1) rest state (from 1st to the 11th second in this case); 2) kneeextension (from 12th to the 22nd second); 3) knee extension plus
1206 IEEE TRANSACTIONS ON BIOMEDICAL ENGINEERING, VOL. 52, NO. 7, JULY 2005
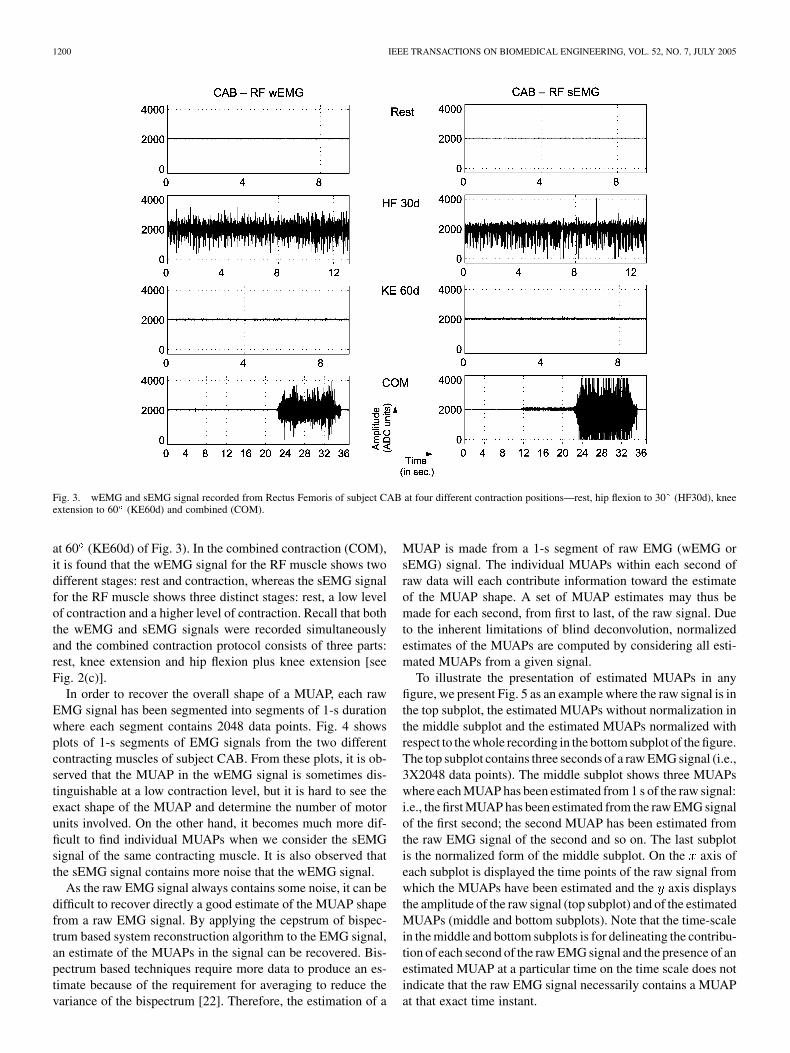
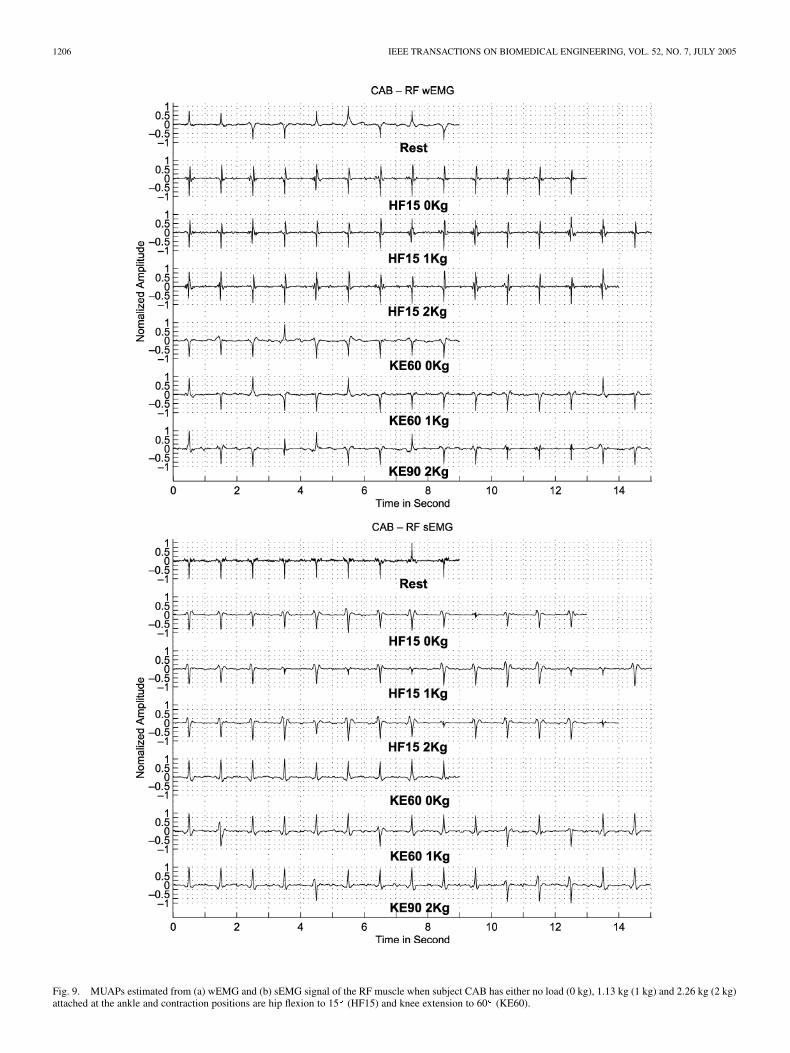
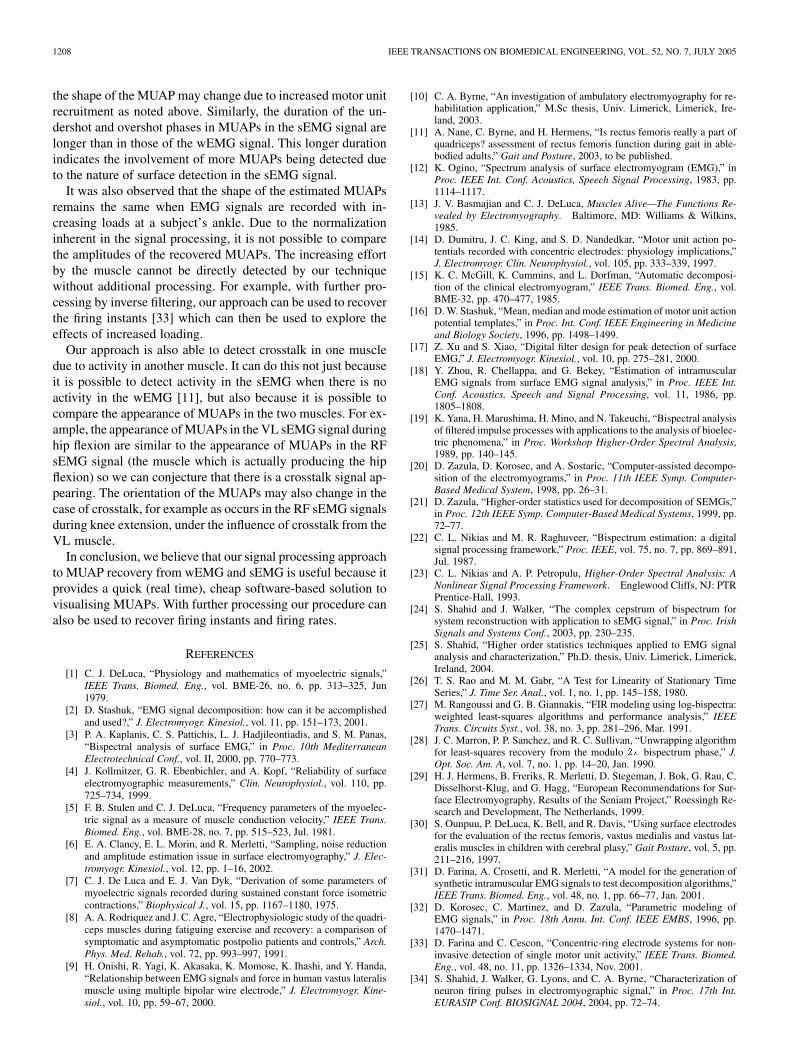
Fig. 9. MUAPs estimated from (a) wEMG and (b) sEMG signal of the RF muscle when subject CAB has either no load (0 kg), 1.13 kg (1 kg) and 2.26 kg (2 kg)attached at the ankle and contraction positions are hip flexion to 15 (HF15) and knee extension to 60 (KE60).
SHAHID et al.: APPLICATION OF HIGHER ORDER STATISTICS TECHNIQUES TO EMG SIGNALS 1207
hip flexion (from the 23rd to the 36th second in this case). Thus,in the figure, the first 11 second along the time axis show theMUAPs extracted from the rest state, the 12th to the 22nd secondtime points show the MUAPs extracted from the knee exten-sion stage and the 23rd to the 36th second time points showthe MUAPs extracted from the knee extension plus hip flexionstage. Comparing this sequence with Figs. 6 and 7 (also withTable I), the first two stages (the rest state and the knee exten-sion) are distinguishable. The appearance of MUAPs in the thirdpart of these sequences when the knee was extended and the hipwas flexed has the following features.
1) In the wEMG signals for each muscle, the dominant ap-pearance is of course of the MUAP associated with thecontraction which the muscle is performing. Thus, in theRF wEMG signal during the combined contraction, theMUAP appearance is similar to the appearance of MUAPsin the RF wEMG signal during hip flexion. Similarly, inthe VL wEMG signal, the MUAPs appear similar to theappearance of MUAPs in the VL wEMG signal duringknee extension.
2) During this third part of the combined contraction, there isnot much evidence of crosstalk from the RF muscle in thesEMG signal taken from the VL muscle. The MUAPs inthe sEMG signal from the VL muscle show a similar ap-pearance to the MUAPs of knee extension alone (e.g., asseen in Figs. 6 and 7). On the other hand, in the RF musclethe MUAPs appear to be a sum of MUAPs characteristicof hip flexion and knee extension (i.e., with low amplitudeof MUAP with clear overshot and undershot in MUAP).Thus there is evidence of crosstalk in the RF sEMG signaldue to the contracting VL muscle.
E. Comparison of Estimated MUAP—Subject With andWithout Load
In this case, the MUAPs were estimated from the EMG signalacquired when the subjects were seated in six different contrac-tion positions as before and at the same time a load (1.13 kg or2.26 kg) was attached to the ankle. Fig. 9 displays the MUAPestimated from the wEMG and sEMG signals, respectively, ofthe RF muscle of CAB. Each subplot shows the MUAPs forthree contraction positions with three different loads [“no load(0 kg),” “1.13 kg load (1 kg),” or “2.26 kg load (2 kg)”] at thesubject’s ankle (where the term in brackets denotes the abbre-viation used in the figure). The contraction positions are: rest,hip flexion to 15 and knee extension to 60 . Recall that the es-timated MUAPs are presented here in normalized form and thenormalization is made with respect to the whole recording.
From all the subplots, it is clear that the shape of MUAPs re-mains broadly similar if the subject increases effort: either toincrease the angle at which the knee or hip is held or becauseof increased loading at the ankle. Due to the normalization in-herent in the signal processing, it is not possible to compare theamplitudes of the recovered MUAPs. The unchanging shape ofthe MUAPs suggests that the effect of increased effort due to,for example loading at the ankle, may have another impact in theEMG signal, such as increasing the frequency of neuron firingpulses and thus the recruitment of motor units.
V. DISCUSSION AND CONCLUSION
The mathematical model adopted in this paper of the EMGsignal is of the output of a LTI system whose input is non-Gaussian white noise. Based on this model, we have used ourcepstrum of bispectrum based system reconstruction algorithmto estimate MUAPs from a range of real EMG signals obtainedduring isometric contraction. Our results show that the cepstrumof bispectrum approach can recover good estimates of MUAPsfrom both wEMG and sEMG signals.
Following on the successful work of [15], [16], there nowexist many EMG decomposition programs [31] but these aremainly successful only for wEMG signals and many such pro-grams require the intervention of a human operator [31]. Anearly use of higher order statistics based approaches to recoveryof MUAPs from the sEMG signal was by Yana et al. [19]. How-ever, their approach was only applied to simulated sEMG sig-nals. Other workers have tried a variety of approaches to the de-composition and recovery of MUAPs from the EMG with onlyvarying success. For example the approach of [17] is simplya first step to locating the MUAPs in an sEMG signal. Ap-proaches described in [18], [20], and [21] have only been suc-cessful on wEMG signals or on simulated sEMG signals. In [32]a parametric modeling approach to sEMG decomposition is de-scribed which reproduces the appearance of heavily overlappedMUAPs in the sEMG. However, this approach does not allowvisualization of the individual MUAPs which are contributingto the overlapped MUAP. The best success in recovery of indi-vidual MUAPs from the sEMG has been by use of expensivespecialized electrodes and associated spatial filtering [33]. Ourapproach produces MUAP estimates which are comparable inquality to those produced by the multiple electrode approachbut without the need for specialized equipment.
The concentric-ring electrode approach can distinguish in-dividual MUAP trains and we do not claim that our approachcan achieve this. It can simply reveal the average appearanceof the MUAP in the muscle. It is well established that the av-erage shape of MUAPs in any EMG signal conveys informationabout the contracting muscle [31]. For example, the shape ofthe MUAP may change if the number of motor units involvedchanges, in other words it reflects motor unit recruitment. In theexperiments described, the detector positions were fixed for allcontractions and wEMG and sEMG were recorded simultane-ously. Our results clearly show, from the different appearanceof the MUAPs in the wEMG and sEMG from the same muscle,the effect of motor unit recruitment.
Our results indicate that the resting muscle’s wEMG orsEMG contains a train of impulse-like MUAPs whose peaksare oriented to both sides of zero level. In fact, there is no in-volvement of motor unit in the resting muscle and the observedimpulse-like MUAP estimated from the resting muscle’s EMGsignal, is the effect of noise and can be considered as a baselinesignal which is a “signature” of a resting muscle. Our resultsfurther suggest that the MUAPs tend to be oriented to one sideof zero level when the muscle is contracting. The particulardirection they point depends on the orientation of the electrodeswith respect to the active motor units.
A contracting muscle as expected produces MUAPs whereeach MUAP has three phases. As contraction strength increases,
1208 IEEE TRANSACTIONS ON BIOMEDICAL ENGINEERING, VOL. 52, NO. 7, JULY 2005
the shape of the MUAP may change due to increased motor unitrecruitment as noted above. Similarly, the duration of the un-dershot and overshot phases in MUAPs in the sEMG signal arelonger than in those of the wEMG signal. This longer durationindicates the involvement of more MUAPs being detected dueto the nature of surface detection in the sEMG signal.
It was also observed that the shape of the estimated MUAPsremains the same when EMG signals are recorded with in-creasing loads at a subject’s ankle. Due to the normalizationinherent in the signal processing, it is not possible to comparethe amplitudes of the recovered MUAPs. The increasing effortby the muscle cannot be directly detected by our techniquewithout additional processing. For example, with further pro-cessing by inverse filtering, our approach can be used to recoverthe firing instants [33] which can then be used to explore theeffects of increased loading.
Our approach is also able to detect crosstalk in one muscledue to activity in another muscle. It can do this not just becauseit is possible to detect activity in the sEMG when there is noactivity in the wEMG [11], but also because it is possible tocompare the appearance of MUAPs in the two muscles. For ex-ample, the appearance of MUAPs in the VL sEMG signal duringhip flexion are similar to the appearance of MUAPs in the RFsEMG signal (the muscle which is actually producing the hipflexion) so we can conjecture that there is a crosstalk signal ap-pearing. The orientation of the MUAPs may also change in thecase of crosstalk, for example as occurs in the RF sEMG signalsduring knee extension, under the influence of crosstalk from theVL muscle.
In conclusion, we believe that our signal processing approachto MUAP recovery from wEMG and sEMG is useful because itprovides a quick (real time), cheap software-based solution tovisualising MUAPs. With further processing our procedure canalso be used to recover firing instants and firing rates.
REFERENCES
[1] C. J. DeLuca, “Physiology and mathematics of myoelectric signals,”IEEE Trans. Biomed. Eng., vol. BME-26, no. 6, pp. 313–325, Jun1979.
[2] D. Stashuk, “EMG signal decomposition: how can it be accomplishedand used?,” J. Electromyogr. Kinesiol., vol. 11, pp. 151–173, 2001.
[3] P. A. Kaplanis, C. S. Pattichis, L. J. Hadjileontiadis, and S. M. Panas,“Bispectral analysis of surface EMG,” in Proc. 10th MediterraneanElectrotechnical Conf., vol. II, 2000, pp. 770–773.
[4] J. Kollmitzer, G. R. Ebenbichler, and A. Kopf, “Reliability of surfaceelectromyographic measurements,” Clin. Neurophysiol., vol. 110, pp.725–734, 1999.
[5] F. B. Stulen and C. J. DeLuca, “Frequency parameters of the myoelec-tric signal as a measure of muscle conduction velocity,” IEEE Trans.Biomed. Eng., vol. BME-28, no. 7, pp. 515–523, Jul. 1981.
[6] E. A. Clancy, E. L. Morin, and R. Merletti, “Sampling, noise reductionand amplitude estimation issue in surface electromyography,” J. Elec-tromyogr. Kinesiol., vol. 12, pp. 1–16, 2002.
[7] C. J. De Luca and E. J. Van Dyk, “Derivation of some parameters ofmyoelectric signals recorded during sustained constant force isometriccontractions,” Biophysical J., vol. 15, pp. 1167–1180, 1975.
[8] A. A. Rodriquez and J. C. Agre, “Electrophysiologic study of the quadri-ceps muscles during fatiguing exercise and recovery: a comparison ofsymptomatic and asymptomatic postpolio patients and controls,” Arch.Phys. Med. Rehab., vol. 72, pp. 993–997, 1991.
[9] H. Onishi, R. Yagi, K. Akasaka, K. Momose, K. Ihashi, and Y. Handa,“Relationship between EMG signals and force in human vastus lateralismuscle using multiple bipolar wire electrode,” J. Electromyogr. Kine-siol., vol. 10, pp. 59–67, 2000.
[10] C. A. Byrne, “An investigation of ambulatory electromyography for re-habilitation application,” M.Sc thesis, Univ. Limerick, Limerick, Ire-land, 2003.
[11] A. Nane, C. Byrne, and H. Hermens, “Is rectus femoris really a part ofquadriceps? assessment of rectus femoris function during gait in able-bodied adults,” Gait and Posture, 2003, to be published.
[12] K. Ogino, “Spectrum analysis of surface electromyogram (EMG),” inProc. IEEE Int. Conf. Acoustics, Speech Signal Processing, 1983, pp.1114–1117.
[13] J. V. Basmajian and C. J. DeLuca, Muscles Alive—The Functions Re-vealed by Electromyography. Baltimore, MD: Williams & Wilkins,1985.
[14] D. Dumitru, J. C. King, and S. D. Nandedkar, “Motor unit action po-tentials recorded with concentric electrodes: physiology implications,”J. Electromyogr. Clin. Neurophysiol., vol. 105, pp. 333–339, 1997.
[15] K. C. McGill, K. Cummins, and L. Dorfman, “Automatic decomposi-tion of the clinical electromyogram,” IEEE Trans. Biomed. Eng., vol.BME-32, pp. 470–477, 1985.
[16] D. W. Stashuk, “Mean, median and mode estimation of motor unit actionpotential templates,” in Proc. Int. Conf. IEEE Engineering in Medicineand Biology Society, 1996, pp. 1498–1499.
[17] Z. Xu and S. Xiao, “Digital filter design for peak detection of surfaceEMG,” J. Electromyogr. Kinesiol., vol. 10, pp. 275–281, 2000.
[18] Y. Zhou, R. Chellappa, and G. Bekey, “Estimation of intramuscularEMG signals from surface EMG signal analysis,” in Proc. IEEE Int.Conf. Acoustics, Speech and Signal Processing, vol. 11, 1986, pp.1805–1808.
[19] K. Yana, H. Marushima, H. Mino, and N. Takeuchi, “Bispectral analysisof filtered impulse processes with applications to the analysis of bioelec-tric phenomena,” in Proc. Workshop Higher-Order Spectral Analysis,1989, pp. 140–145.
[20] D. Zazula, D. Korosec, and A. Sostaric, “Computer-assisted decompo-sition of the electromyograms,” in Proc. 11th IEEE Symp. Computer-Based Medical System, 1998, pp. 26–31.
[21] D. Zazula, “Higher-order statistics used for decomposition of SEMGs,”in Proc. 12th IEEE Symp. Computer-Based Medical Systems, 1999, pp.72–77.
[22] C. L. Nikias and M. R. Raghuveer, “Bispectrum estimation: a digitalsignal processing framework,” Proc. IEEE, vol. 75, no. 7, pp. 869–891,Jul. 1987.
[23] C. L. Nikias and A. P. Petropulu, Higher-Order Spectral Analysis: ANonlinear Signal Processing Framework. Englewood Cliffs, NJ: PTRPrentice-Hall, 1993.
[24] S. Shahid and J. Walker, “The complex cepstrum of bispectrum forsystem reconstruction with application to sEMG signal,” in Proc. IrishSignals and Systems Conf., 2003, pp. 230–235.
[25] S. Shahid, “Higher order statistics techniques applied to EMG signalanalysis and characterization,” Ph.D. thesis, Univ. Limerick, Limerick,Ireland, 2004.
[26] T. S. Rao and M. M. Gabr, “A Test for Linearity of Stationary TimeSeries,” J. Time Ser. Anal., vol. 1, no. 1, pp. 145–158, 1980.
[27] M. Rangoussi and G. B. Giannakis, “FIR modeling using log-bispectra:weighted least-squares algorithms and performance analysis,” IEEETrans. Circuits Syst., vol. 38, no. 3, pp. 281–296, Mar. 1991.
[28] J. C. Marron, P. P. Sanchez, and R. C. Sullivan, “Unwrapping algorithmfor least-squares recovery from the modulo 2� bispectrum phase,” J.Opt. Soc. Am. A, vol. 7, no. 1, pp. 14–20, Jan. 1990.
[29] H. J. Hermens, B. Freriks, R. Merletti, D. Stegeman, J. Bok, G. Rau, C.Disselhorst-Klug, and G. Hagg, “European Recommendations for Sur-face Electromyography, Results of the Seniam Project,” Roessingh Re-search and Development, The Netherlands, 1999.
[30] S. Ounpuu, P. DeLuca, K. Bell, and R. Davis, “Using surface electrodesfor the evaluation of the rectus femoris, vastus medialis and vastus lat-eralis muscles in children with cerebral plasy,” Gait Posture, vol. 5, pp.211–216, 1997.
[31] D. Farina, A. Crosetti, and R. Merletti, “A model for the generation ofsynthetic intramuscular EMG signals to test decomposition algorithms,”IEEE Trans. Biomed. Eng., vol. 48, no. 1, pp. 66–77, Jan. 2001.
[32] D. Korosec, C. Martinez, and D. Zazula, “Parametric modeling ofEMG signals,” in Proc. 18th Annu. Int. Conf. IEEE EMBS, 1996, pp.1470–1471.
[33] D. Farina and C. Cescon, “Concentric-ring electrode systems for non-invasive detection of single motor unit activity,” IEEE Trans. Biomed.Eng., vol. 48, no. 11, pp. 1326–1334, Nov. 2001.
[34] S. Shahid, J. Walker, G. Lyons, and C. A. Byrne, “Characterization ofneuron firing pulses in electromyographic signal,” in Proc. 17th Int.EURASIP Conf. BIOSIGNAL 2004, 2004, pp. 72–74.

SHAHID et al.: APPLICATION OF HIGHER ORDER STATISTICS TECHNIQUES TO EMG SIGNALS 1209
Shahjahan Shahid was born in Bogra, Bangladesh.He received the B.Sc. and M.Sc. degree in ap-plied physics and electronics from the Universityof Rajshahi, Rajshahi, Bangladesh, in 1988 and1990, respectively. He received the Ph.D. degreein electronics and computer engineering from theUniversity of Limerick, Limerick, Ireland, in 2004.
During 1991 to 1997, he was with the BangladeshAtomic Energy Commission as a Scientific Officer.He is currently with g.tec Guger Technologies OEG,Graz, Austria working on bio-signal processing. His
main research interests lie in the area of higher order statistical signal processingand its applications in estimation theory, bio-signal analysis and medical instru-mentation.
Jacqueline Walker (S’91–M’97) was born inLondon, U.K. She received the B.A. and the B.E.(First Class Honors) degrees, both from the Univer-sity of Western Australia, Perth, in 1987 and 1992,respectively. She received the Ph.D. degree fromCurtin University of Technology, Bentley, Australia,in 1997.
During 1996–1997, she was employed as aResearch Engineer by the Australian Telecommuni-cations Research Institute. In November 1997, shejoined the Department of Electronic and Computer
Engineering at the University of Limerick, Limerick, Ireland, as a Lecturer. Herresearch interests include signal processing applied to biomedical, speech andmusic signals with particular interest in blind deconvolution and blind sourceseparation.
Dr. Walker is a member of the Institution of Electrical Engineers.
Gerard M. Lyons received the B.E. degree (FirstClass Honors) in electrical engineering in 1980 andthe M.Eng.Sc. degree in microelectronics in 1982from University College, Cork, Ireland. He receivedthe Ph.D. degree in biomedical engineering from theNational University of Ireland, Galway, in 2000.
From 1985 to 1990 Dr. Lyons worked in thesemiconductor industry in the Santa Clara Valleyand Monterey Peninsula in California. He returnedto Ireland in 1990 and joined the University ofLimerick as a member of faculty and is currently
a Senior Lecturer in Electronic and Computer Engineering, Assistant Dean,Research, College of Informatics and Electronics and Director of the Biomed-ical Electronics Laboratory at the university. His primary research interests aregait rehabilitation using FES, mobility assessment of the elderly, and use ofcomputer-based biofeedback techniques for rehabilitation applications.
Ciaran A. Byrne was born in Drogheda, Ireland, in1977. He received the B.Sc. degree in sport and ex-ercise science from the University of Limerick, Lim-erick, Ireland, in 1999. In 2002, he received the M.Sc.degree from the same institution.
He is currently a Research Scientist for BioMed-ical Research Ltd., an Irish company that developsmuscle stimulation products for the sports, health,and medical markets. His research interests includemuscle stimulation, EMG, and strength and condi-tioning. He is a Certified Strength and Conditioning
Specialist and is a member of the ESSAI.
Anand Vishwanath Nene was born in Bombay,India. He received the M.B.B.S. and M.S. degreesfrom Bombay University, Bombay, India, in 1972and 1976, respectively. He received the MChOrthdegree from the University of Liverpool, Liverpool,U.K., in 1979. In December 1994, he received thePh.D. degree from Twente University, Enschede, TheNetherlands, for his thesis on paraplegic locomotion.
He returned to India in 1983 and worked as an or-thopaedic surgeon in Nagpur, India. Circumstancesbrought him back to the United Kingdom in 1985.
From December 1985 to May 1993 he worked as a Medical Research Fellow inthe Orthotic Research and Locomotor Assessment Unit (ORLAU) at The RobertJones and Agnes Hunt Orthopaedic and District Hospital in Oswestry, Shrop-shire, U.K. There he developed his interest in the subjects of human locomotion,paraplegic locomotion, functional electrical stimulation, and cerebral palsy. Hewas invited to work in the Netherlands. In January 1994, he started work as a Re-search Fellow in Roessingh Research and Development based at Roessingh Re-habilitation Centre in Enschede, The Netherlands. From July 1994 to June 1997,he retrained as a specialist in Physical and Rehabilitation Medicine. Presently,he works as a specialist in Physical and Rehabilitation Medicine, and continuesto work as a Research Fellow in Roessingh Research and Development, basedat Roessingh Rehabilitation Centre in Enschede. He has continued his researchinterests in functional electrical stimulation, gait analysis and its applications inclinical decision making, and balance control in neurological disorders and itsrelation to walking ability.
View publication statsView publication stats