Embed Size (px)
Citation preview

. AIANASME Joint PropuLsim Conference, 12 July 2004, Ft Lauderdale, Florida, USA
i A M - 2 0 4 - 3 8 0 4
Application of Solar Electric Propulsion to a Comet
Surface Sample Return Mission
Mike Cupples' Science Applications IntenatiOnal Corporation
HuntsviUe, Alabama 35806
Victoria Coverstone* and Byoungsam Woo** University of Illinois at Urbana-Champaign,
Urbana, ZUinok 61801
Current NSTAR (planned for the Discovery Mission: Dawn) and NASA's Evolutionary Xenon Thruster based propulsion systems were compared for a comet surface sample return mission to Tempe1 1. Mission and systems analyses were conducted over a range of array power for each propulsion system with an array of 12 kW EOL at 1 AU chosen for a baseline. Engine configurations investigated for NSTAR included 4 operational engines with 1 spare and 5 operational engines with 1 spare. The NEXT configuration investigated included 2 operational engines plus 1 spare, with performance estimated for high thrust and high Isp throttling modes. Figures of merit for this comparison include Solar Electric Propulsion dry mass, average engine throughput, and net non-propulsion payload returned to Earth flyby.
Introduction
With the success of the Deep Space 1 mission'.', the potential of Solar Electric Propulsion Systems (SEPS) was
clearly demonstrated, making SEPS a strong candidate for various interplanetary missions. The long-duration, high-
efficiency operation of SEPS allows new ways to explore the inner and outer solar system, and enables missions that
can be difficult and expensive to reach with chemical propulsion systems. NASA has undertaken an ion propulsion
system development program to create a new ion propulsion system based on NASA's Evolutionary Xenon
Thruster3 (NEXT). This thruster development is being developed under of the NEXT Generation Electric
Propulsion (NGEP) Technology Area4 under the auspices of the In-Space Propulsion Technology Projects at
Marshal Space Flight Center (MSFC). The NEXT based propulsion system has a higher maximum design power
t Systems En,@eer, In-Space Technology Assessmnt Lead, Science Applications International Corporation. 6725 Odyssey Drive, Huntsville, AL 35806
* Associate Professor, Department of Aeronautical and Astronautical Engineering, 306 Talbot Laboratory, 104 S. Wright Street, Urbana, IL 61801, Memkr AAS.
Associate Fellow AIAA
** Graduate Student Depattnmt of Aeronautical and AsUOMutiCal Engineering. 306 Talbot Laboratory, I04 S. Wright Street, Urbana. IL 6180
1 Amencan Institute of Aeronautics and Astronautics
https://ntrs.nasa.gov/search.jsp?R=20040085908 2018-09-01T00:36:59+00:00Z
. . . AIANASME Joint Propulsion Conference, 12 July 2004, Ft Lauderdale, Florida, USA AJAA-204-3804
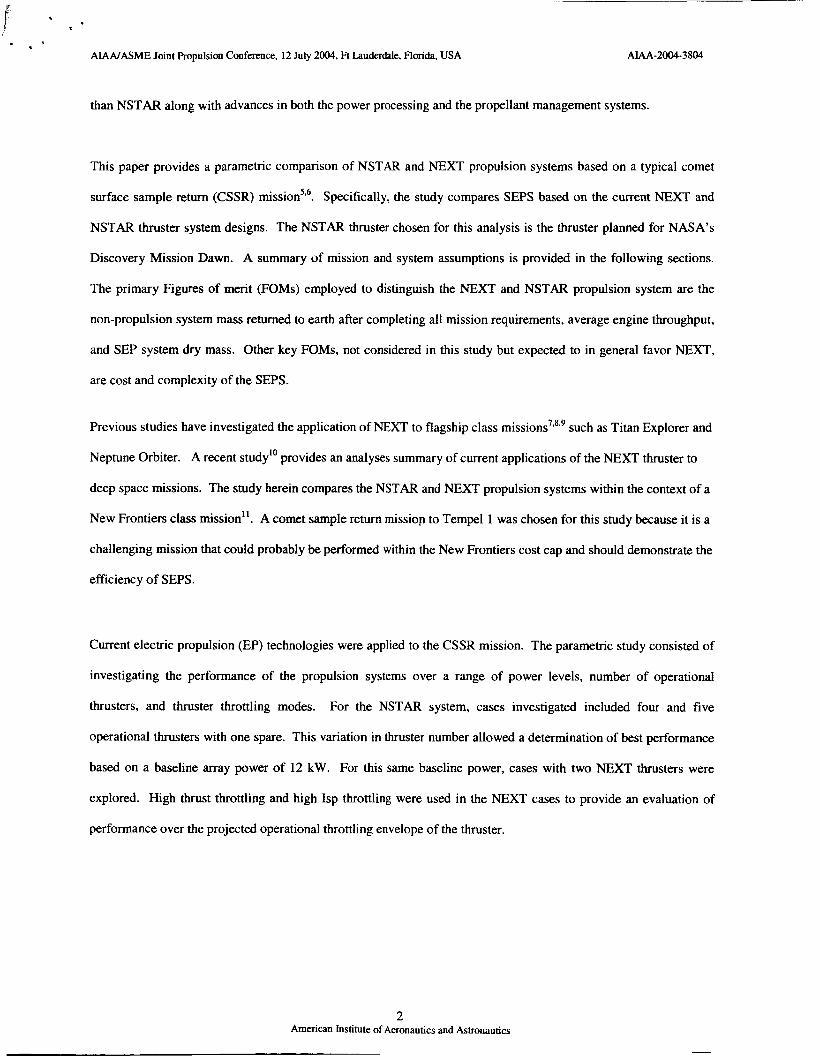
than NSTAR along with advances in both the power processing and the propellant management systems.
This paper provides a parametric comparison of NSTAR and NEXT propulsion systems based on a typical comet
surface sample return (CSSR) mission536. Specifically, the study compares SEPS based on the current NEXT and
NSTAR thruster system designs. The NSTAR thruster chosen for this analysis is the thruster planned for NASA's
Discovery Mission Dawn. A summary of mission and system assumptions is provided in the following sections.
The primary Figures of merit (FOMs) employed to distinguish the NEXT and NSTAR propulsion system are the
non-propulsion system mass returned to earth after completing all mission requirements, average engine throughput,
and SEP system dry mass. Other key FOMs, not considered in this study but expected to in general favor NEXT,
are cost and complexity of the SEPS.
Previous studies have investigated the application of NEXT to flagship class mission^"^^^ such as Titan Explorer and
Neptune Orbiter. A recent study" provides an analyses summary of current applications of the NEXT thruster to
deep space missions. The study herein compares the NSTAR and NEXT propulsion systems within the context of a
New Frontiers class mission". A comet sample return missiop to Tempel 1 was chosen for this study because it is a
challenging mission that could probably be performed within the New Frontiers cost cap and should demonstrate the
efficiency of SEPS.
Current electric propulsion (EP) technologies were applied to the CSSR mission. The parametric study consisted of
investigating the performance of the propulsion systems over a range of power levels, number of operational
thrusters, and thruster throttling modes. For the NSTAR system, cases investigated included four and five
operational thrusters with one spare. This variation in thruster number allowed a determination of best performance
based on a baseline array power of 12 kW. For this same baseline power, cases with two NEXT thrusters were
explored. High thrust throttling and high Isp throttling were used in the NEXT cases to provide an evaluation of
performance over the projected operational throttling envelope of the thruster.
2 American Institute of Aeronautics and Astronautics
AIANASME Joint Propulsion Conference, 12 July 2004, Ft Lauderdale, Florida, USA AIAA-2004-3804
Mission Assumptions.
A summary of mission assumptions are as follows:
1) Mission Type - Comet surface sample return
2) Target - comet Tempel 1
3) Launch Date - 2008 Earth Departure
4) Stay Time Q Target - 60 days
The payload is defined in this study as 50 kg of mass that remains at the comet and the net non-propulsive mass that
is returned to Earth. This net return mass consists of the comet sample, comet sample return capsule with
concomitant mechanisms, and the remaining spacecraft mass (e.g. subsystem including navigation instruments,
communication instruments, science instruments, structure, power, and thermal).
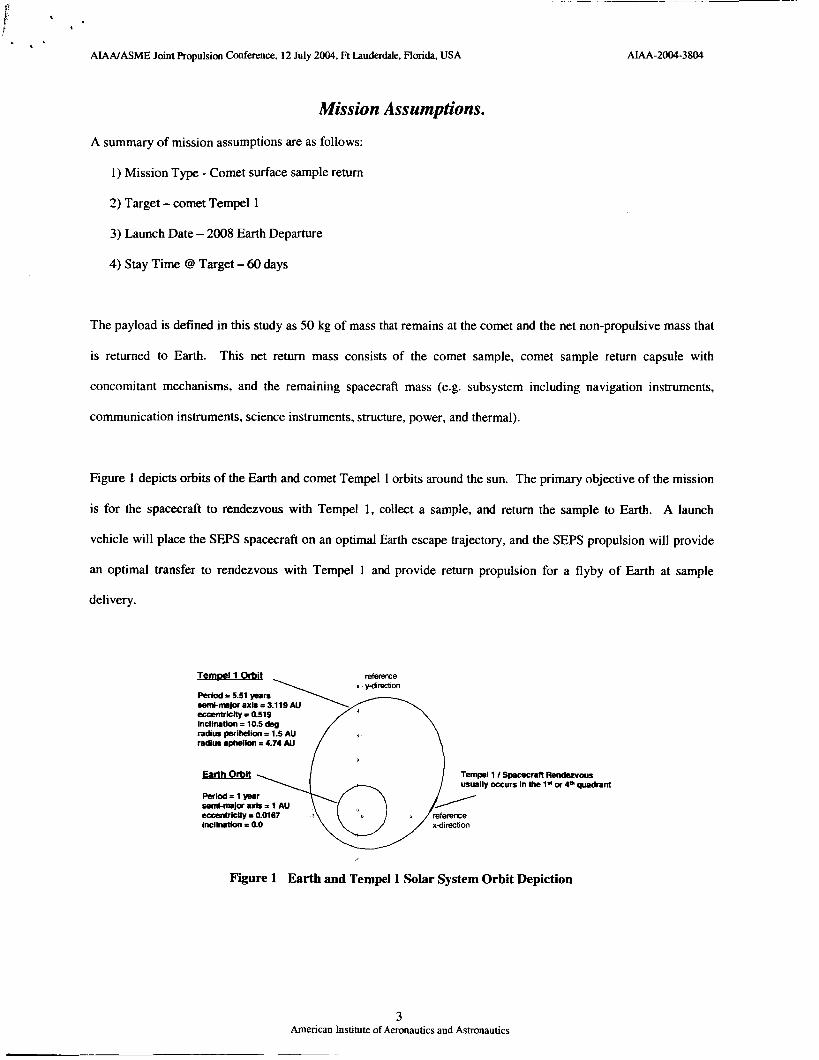
Figure 1 depicts orbits of the Earth and comet Tempel 1 orbits around the sun. The primary objective of the mission
is for the spacecraft to rendezvous with Tempel 1, collect a sample, and return the sample to Earth. A launch
vehicle will place the SEPS spacecraft on an optimal Earth escape trajectory, and the SEPS propulsion will provide
an optimal transfer to rendezvous with Tempel 1 and provide return propulsion for a flyby of Earth at sample
delivery.
Temuel 1 mit Period 5.51 yean Semcmjor axk E 3.119 AU wcentrktty = 0.519 inclination = 10.5 deg =dim parWiar I 1.5 AU ndlur @'&ion = 4.74 AU
Earth O&it
Perlod=1yeSr
Tempel 1 I s p a m a n Renduvws usually occurs In the 1" or 4m wdnnt
wmklljor axk = 1 AU eecentrkky = 0.0167 inclination = a0
Figure 1 Earth and Tempel 1 Solar System Orbit Depiction
3 American Institute of Aeronautics and Astronautics
1 . . * AIANASME Joint Propulsion Conference, 12 July 2004, Ft Lauderdale, Florida, USA AIAA-2004-3804
Systems Assumptions
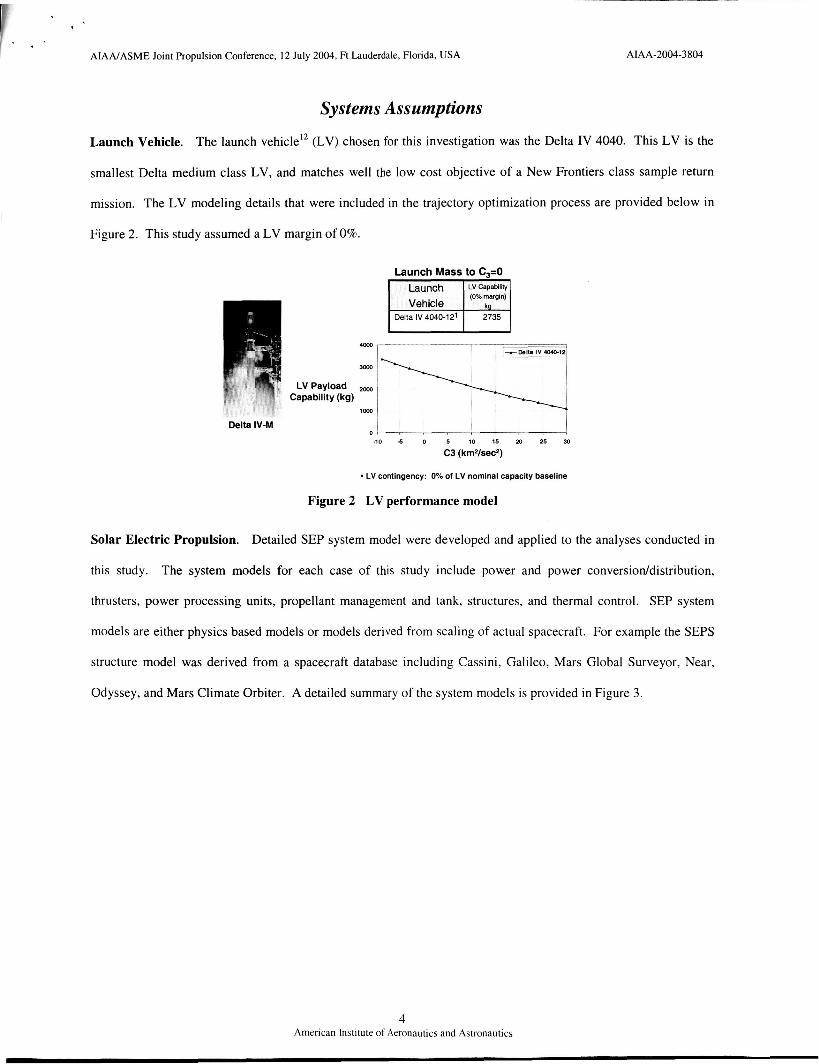
Launch Vehicle. The launch vehicle12 (LV) chosen for this investigation was the Delta IV 4040. This LV is the
smallest Delta medium class LV, and matches well the low cost objective of a New Frontiers class sample return
mission. The LV modeling details that were included in the trajectory optimization process are provided below in
Figure 2. This study assumed a LV margin of 0%.
UXY)
3ooo
LVPayload - Capability (kg)
1m
Delta IV-M 0
Launch Mass to C,=O
(0% margin) Vehicle
-10 -5 0 5 10 15 20 25 90
C3 (km2/sec2)
- LV contingency: 0% of LV nomlnal capactty baseline
Figure 2 LV performance model
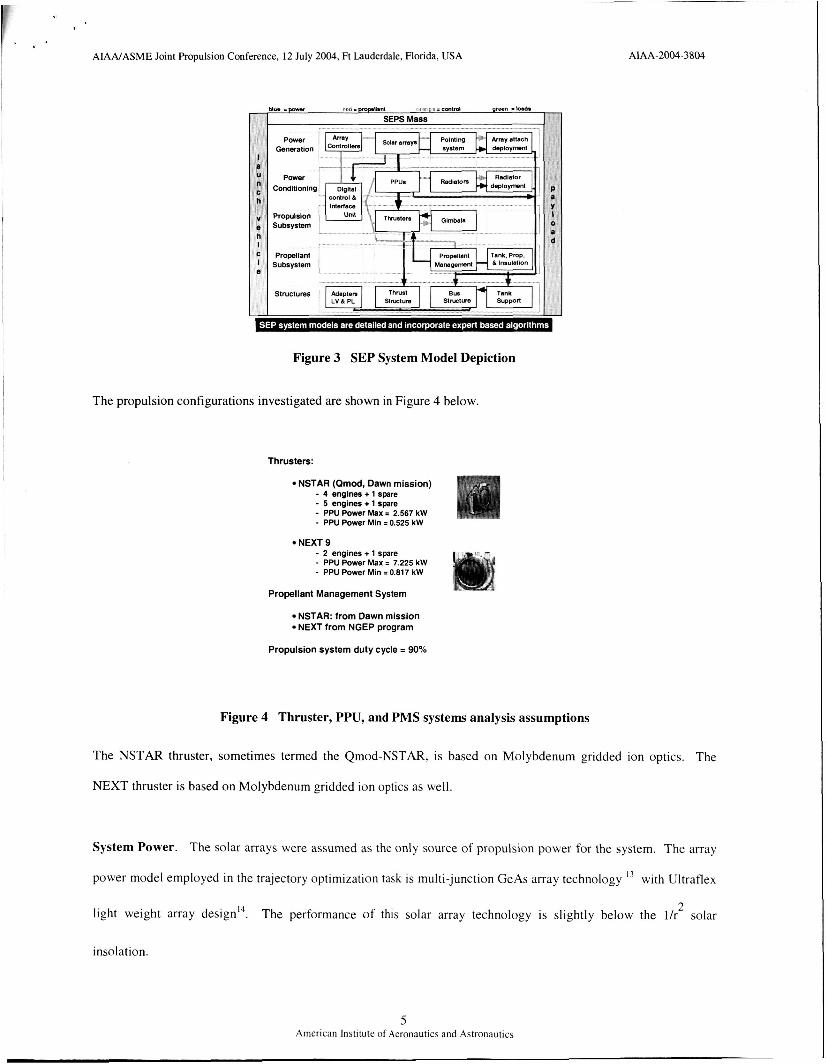
Solar Electric Propulsion. Detailed SEP system model were developed and applied to the analyses conducted in
this study. The system models for each case of this study include power and power conversioddistribution,
thrusters, power processing units, propellant management and tank, structures, and thermal control. SEP system
models are either physics based models or models derived from scaling of actual spacecraft. For example the SEPS
structure model was derived from a spacecraft database including Cassini, Galileo, Mars Global Surveyor, Near,
Odyssey, and Mars Climate Orbiter. A detailed summary of the system models is provided in Figure 3.
4 American Institute of Aeronautics and Astronautics
AIANASME Joint Propulsion Conference, 12 July 2004, Ft Lauderdale, Florida, USA
Power Conditioning
Propulsion Subsystem
F - - - , I
Propellant 1 Subsystem 1
e d
Figure 3 SEP System Model Depiction
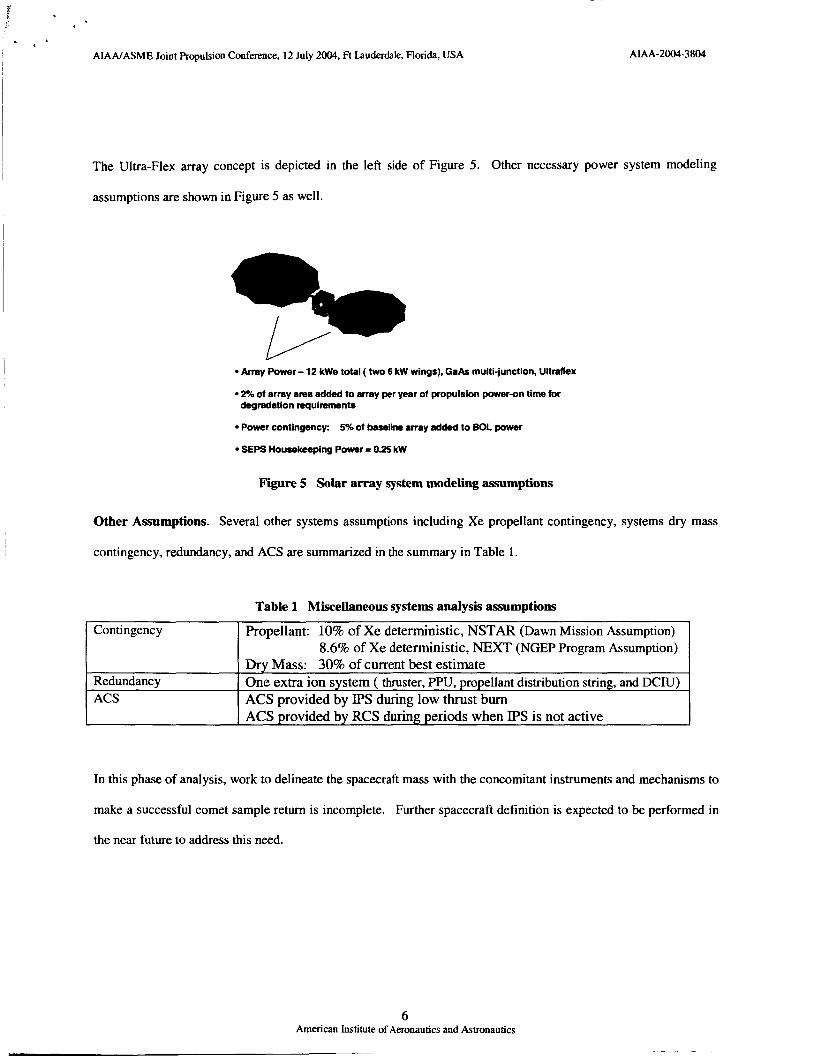
The propulsion configurations investigated are shown in Figure 4 below.
Thrusters:
NSTAR (Qmod, Dawn mission) - 4 engines + 1 spare - 5 engines + 1 spare - PPU Power Max = 2.567 kW - PPU Power Min = 0.525 kW
NEXT 9 - 2 engines + 1 spare
- PPU Power Min = 0.817 kW - PPU Power Max = 7.225 kW
Propellant Management System
NSTAR: from Dawn mission NEXT from NGEP program
Propulsion system duty cycle = 90%
Figure 4 Thruster, PPU, and PMS systems analysis assumptions
The NSTAR thruster, sometimes termed the Qmod-NSTAR, is based on Molybdenum gridded ion optics. The
NEXT thruster is based on Molybdenum gridded ion optics as well.
System Power. The solar arrays were assumed as the only source of propulsion power for the system. The array
power model employed in the trajectory optimization task is multi-junction GeAs array technology l3 with Ultraflex
light weight array d e ~ i g n ' ~ . solar 2
The performance of this solar array technology is slightly below the l / r
insolation.
AIANASME Joint Propulsion Conference, 12 July 2004, Ft Lauderdale, Florida, USA
- Propellant: 10% of Xe deterministic, NSTAR (Dawn Mission Assumption)
8.6% of Xe deterministic, NEXT (NGEP Program Assumption)
AM-2004-3804
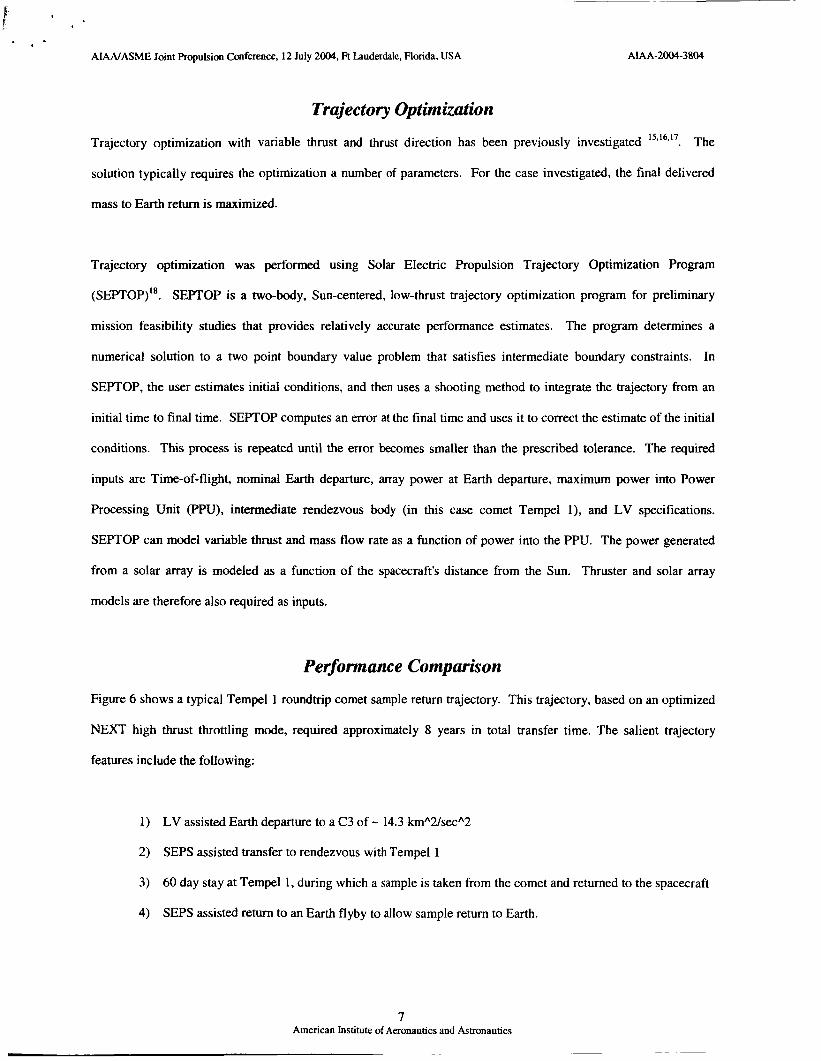
The Ultra-Flex array concept is depicted in the left side of Figure 5. Other necessarypwer system modeling
assumptions are shown in Figure 5 as well.
Array Power - 12 M e total ( two 6 kW wings), GaAs multiijunction, Ultraflex
2% of array area added to array per year of propulsion poweron time for degradation requiremants
Power contingancy: 5% of baseline array added to BOL power
SEPS Housekeeping Power = 0% kW
Figure 5 Solar array system modeling assumptiom
Other Assumptions. Several other systems assumptions including Xe propellant contingency, systems dry mass
contingency, redundancy, and ACS are summarized in the summary in Table 1.
Contingency i--- Redundancy
Dry Mass: 30% of current best estimate One extra ion system ( thruster, PPU, propellant distribution string, and DCIU) ACS provided by IPS during low thrust burn ACS Drovided b; RCS during: Deriods when IPS is not active I
In this phase of analysis, work to delineate the spacecraft mass with the concomitant instruments and mechanisms to
make a successful comet sample return is incomplete. Further spacecraft definition is expected to be performed in
the near future to address this need.
6 American Institute of Aeronautics and Astronautics
F. F
ANNASME Joint Propulsion Conference, 12 July 2004, Ft Lauderdale, Florida, USA AM-2004-3804
Trajectory Optimization
Trajectory optimization with variable thrust and thrust direction has been previously investigated ''J~J' . The
solution typically requires the optimization a number of parameters. For the case investigated, the final delivered
mass to Earth return is maximized.
Trajectory optimization was performed using Solar Electric Propulsion Trajectory Optimization Program
(SEPTOP)". SEFTOP is a two-body, Sun-centered, low-thrust trajectory optimization program for preliminary
mission feasibility studies that provides relatively accurate performance estimates. The program determines a
numerical solution to a two point boundary value problem that satisfies intermediate boundary constraints. In
SEPTOP, the user estimates initial conditions, and then uses a shooting method to integrate the trajectory from an
initial time to final time. SEPTOP computes an error at the final time and uses it to correct the estimate of the initial
conditions. This process is repeated until the error becomes smaller than the prescribed tolerance. The required
inputs are Time-of-flight, nominal Earth departure, array power at Earth departure, maximum power into Power
Processing Unit 0, intermediate rendezvous body (in this case comet Tempel 1). and LV specifications.
SEPTOP can model variable thrust and mass flow rate as a function of power into the PPU. The power generated
from a solar array is modeled as a function of the spacecraft's distance from the Sun. Thruster and solar array
models are therefore also required as inputs.
Performance Comparison
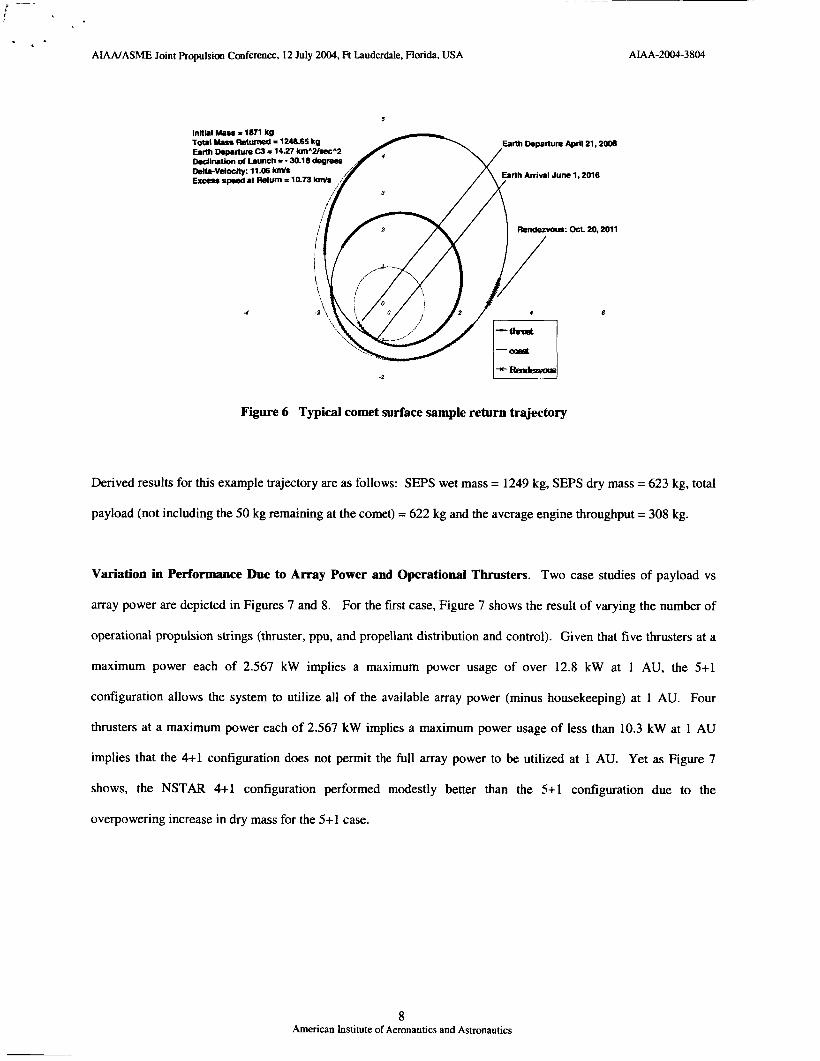
Figure 6 shows a typical Tempel 1 roundtrip comet sample return trajectory. This trajectory, based on an optimized
NEXT high thrust throttling mode, required approximately 8 years in total transfer time. The salient trajectory
features include the following:
1) LV assisted Earth departure to a C3 of - 14.3 kmA2/secA2
2) SEPS assisted transfer to rendezvous with Tempel 1
3) 60 day stay at Tempel 1, during which a sample is taken from the comet and returned to the spacecraft
4) SEPS assisted return to an Earth flyby to allow sample return to Earth.
7 American Institute of Aeronautics and Astronautics
AMMASME Joint Propulsion Conference, 12 July 2004, Ft Lauderdale, Florida, USA AIAA-2004-3804
5
Initial Mass = 1871 kg Tot81 Mass Rstumed = 1246.65 kg E a h Departure C3 = 14.27 bnWtec"2 Ikolh8th of L.umh - 30.18
Earth Departure Aprtl21.2006
Deltcvcloclty: 11.06 kmh Excess speed at Return = 10.73
Rendezvous: Oct. 20,2011
4
2
Figure 6 Typical comet surface sample return trajectory
Derived results for this example trajectory are as follows: SEPS wet mass = 1249 kg, SEPS dry mass = 623 kg, total
payload (not including the 50 kg remaining at the comet) = 622 kg and the average engine throughput = 308 kg.
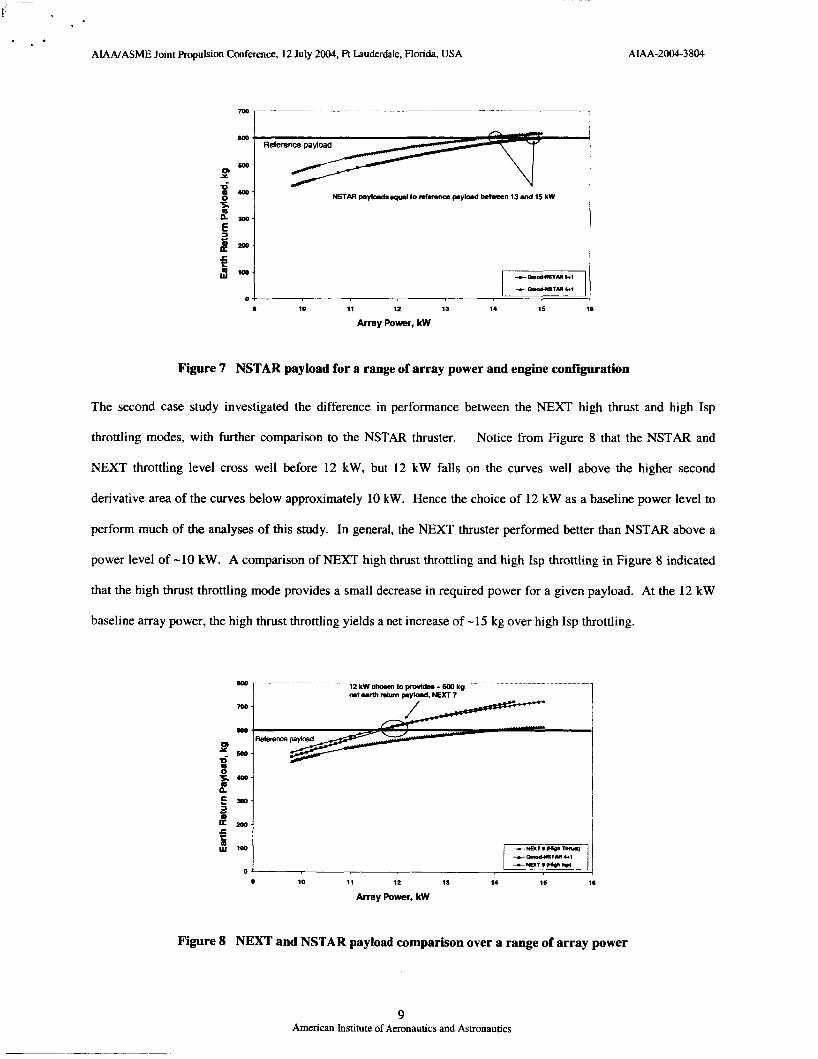
Variation in Performance Due to Array Power and Operational Thrusters. Two case studies of payload vs
array power are depicted in Figures 7 and 8. For the first case, Figure 7 shows the result of varying the number of
operational propulsion strings (thruster, ppu, and propellant distribution and control). Given that five thrusters at a
maximum power each of 2.567 kW implies a maximum power usage of over 12.8 kW at 1 AU, the 5+1
configuration allows the system to utilize all of the available array power (minus housekeeping) at 1 AU. Four
thrusters at a maximum power each of 2.567 kW implies a maximum power usage of less than 10.3 kW at 1 AU
implies that the 4+1 configuration does not permit the full array power to be utilized at 1 AU. Yet as Figure 7
shows, the NSTAR 4+1 configuration performed modestly better than the 5+1 configuration due to the
overpowering increase in dry mass for the 5+ 1 case.
8 American Institute of Aeronautics and Astronautics
AIANASME Joint Propulsion Conference, 12 July 2004, Ft Lauderdale, Florida, USA AIAA-2004-3801
+ O m M T H C I
0 S 10 11 12 13 14 15 1.
Array Power, kW
Figure 7 NSTAR payload for a range of array power and engine configuration
The second case study investigated the difference in performance between the NEXT high thrust and high Isp
throttling modes, with further comparison to the NSTAR thruster. Notice from Figure 8 that the NSTAR and
NEXT throttling level cross well before 12 kW, but 12 kW falls on the curves well above the higher second
derivative area of the curves below approximately 10 kW. Hence the choice of 12 kW as a baseline power level to
perform much of the analyses of this study. In general, the NEXT thruster performed better than NSTAR above a
power level of -10 kW. A comparison of NEXT high thrust throttling and high Isp throttling in Figure 8 indicated
that the high thrust throttling mode provides a small decrease in required power for a given payload. At the 12 kW
baseline array power, the high thrust throttling yields a net increase of -15 kg over high Isp throttling.
12 kW chasn toprovidea -600 kp "1 neteuthrshrnr*y(o.d.m7
-nar.mrphw 1 0
m 10 11 12 I S 14 16 18
Array Power, kW
Figure 8 NEXT and NSTAR payload comparison over a range of array power
9 American Institute of Aeronautics and Astronautics
f
AIANASME Joint Propulsion Conference, 12 July 2004, Ft Lauderdale, Florida, USA AIAA-2004-3804
Detailed Comparison of Payload Delivery Performance at Baseline Array Power. A comparison of NSTAR
and NEXT was performed at a power level of 12 kW. 12 kW was chosen as a baseline power to perform this
analysis for two reasons: the first is that this power level corresponds to a little more than 600 kg of Earth return
payload for NEXT and is near a cross-over in payload between high thrust throttling and high Isp throttling; the
second reason for the 12 kW baseline array power is that a NEXT phase 1 study was performed at 12 kW, thus
allowing the study herein to relate to earlier studies with some continuity. The previous mentioned power level
sweep indicated that above the power level of -10 kW, NEXT provides an increasing advantage in payload mass as
the power level increases.
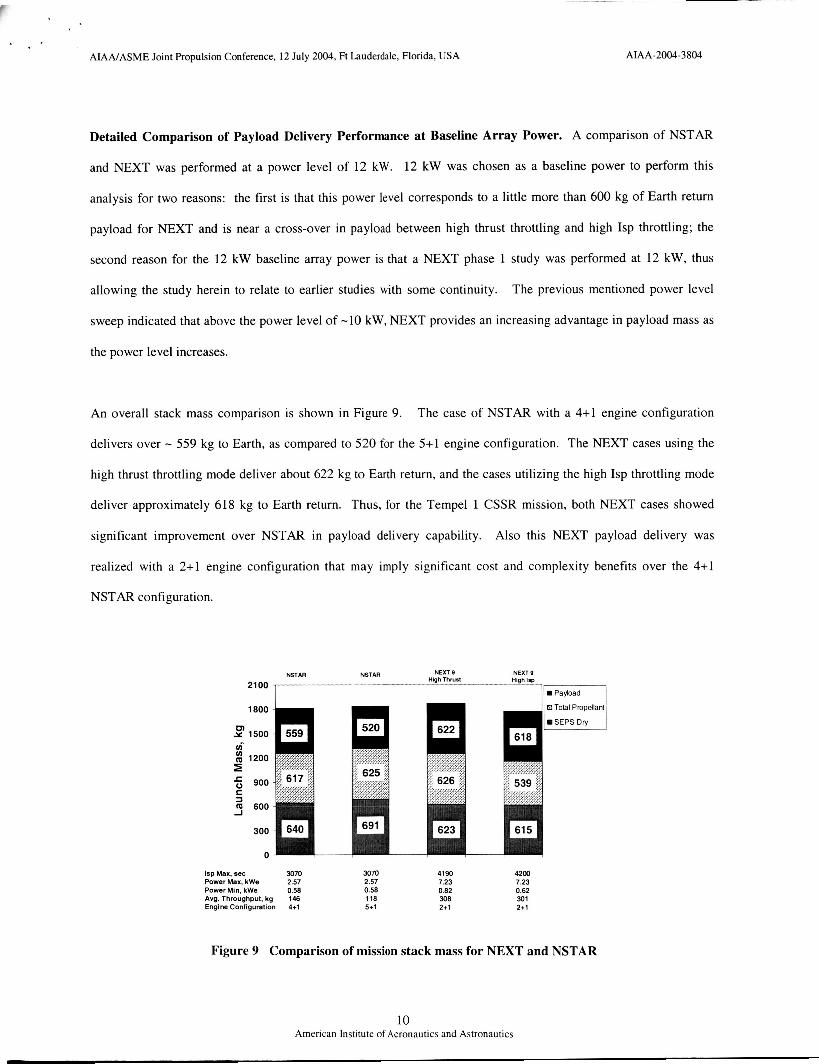
An overall stack mass comparison is shown in Figure 9. The case of NSTAR with a 4+1 engine configuration
delivers over - 559 kg to Earth, as compared to 520 for the 5+1 engine configuration. The NEXT cases using the
high thrust throttling mode deliver about 622 kg to Earth return, and the cases utilizing the high Isp throttling mode
deliver approximately 618 kg to Earth return. Thus, for the Tempel 1 CSSR mission, both NEXT cases showed
significant improvement over NSTAR in payload delivery capability. Also this NEXT payload delivery was
realized with a 2+1 engine configuration that may imply significant cost and complexity benefits over the 4+1
NSTAR configuration.
NSTAR NSTAR
1800
3 1500 6
I g 1200
5 900 C
-I 600
300
0
Isp Max, sec 3070 3070 Power Max, kWe 2.57 2.57 Power Min, kWe 0.58 0.58 Avg. Throughput. kg 146 118 Engine Configuration 4+1 5+1
NEXT 9 HighThrU.1
41 90 7.23 0.82 308 2+1
4200 7.23 0.62 301 2+1
Figure 9 Comparison of mission stack mass for NEXT and NSTAR
10 American Institute of Aeronautics and Astronautics
AIANASME Joint Propulsion Conference, 12 July 2004, Ft Lauderdale, Florida, USA AIAA-2004-3804
In addition to the payload FOM, SEPS dry mass and average engine throughput is shown in Figure 9. In general,
the NEXT SEPS is less massive than NSTAR SEPS because of the lower number of propulsive strings required to
perform the mission. In all NSTAR cases and in the NEXT high Isp case, the average throughput is less than the
engine design requirements of 150 kg and 300 kg respectively. The NEXT high thrust throttling mode case
exceeded the design requirement by approximately 8 kg.
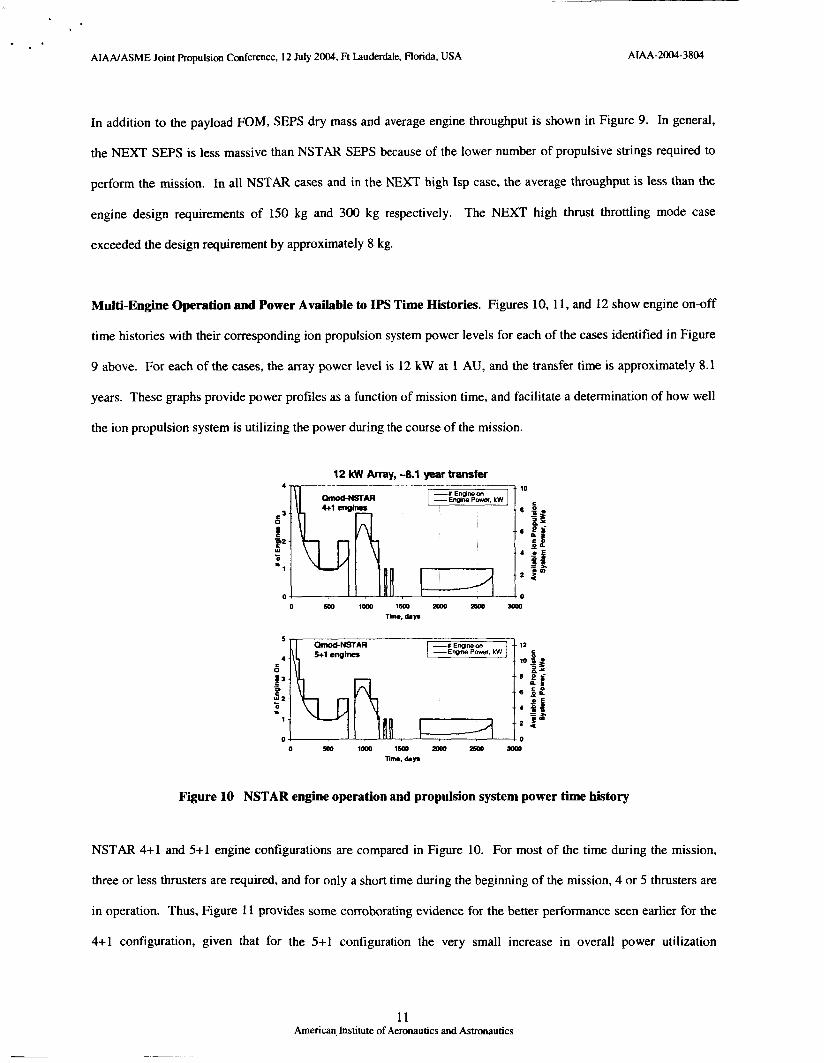
Multi-Engine Operation and Power Available to IPS Time Histories. Figures 10,11, and 12 show engine on-off
time histories with their corresponding ion propulsion system power levels for each of the cases identified in Figure
9 above. For each of the cases, the array power level is 12 kW at 1 AU, and the transfer time is approximately 8.1
years. These graphs provide power profiles as a function of mission time, and facilitate a determination of how well
the ion propulsion system is utilizing the power during the course of the mission.
12 kW Array, -8.1 year transfer 1
cs
t 8 2 -
0 0 5m l w o 1 5 m 2 o o o 2 5 o o S o m
Tho, d.y.
4 12
J o
Figure 10 NSTAR engine operation and propulsion system power time history
NSTAR 4+1 and 5+1 engine configurations are compared in Figure 10. For most of the time during the mission,
three or less thrusters are required, and for only a short time during the beginning of the mission, 4 or 5 thrusters are
in operation. Thus, Figure 11 provides some corroborating evidence for the better performance seen earlier for the
4+1 configuration, given that for the 5+1 configuration the very small increase in overall power utilization
11 Amencap Institute of Aeronautics and Astronautics
AIANASME Joint hpuls ion Conference, 12 July 2004, Ft Iauderdale, Florida, USA AM-2004-3804
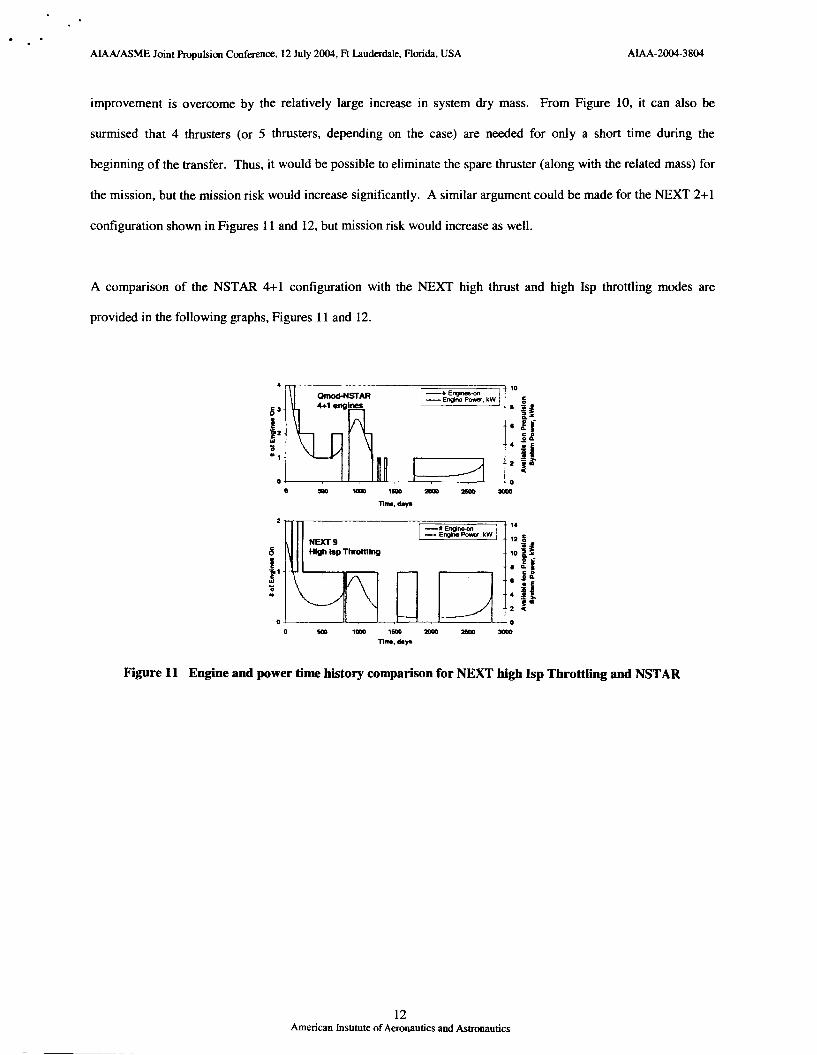
improvement is overcome by the relatively large increase in system dry mass. From Figure 10, it can also be
surmised that 4 thrusters (or 5 thrusters, depending on the case) are needed for only a short time during the
beginning of the transfer. Thus, it would be possible to eliminate the spare thruster (along with the related mass) for
the mission, but the mission risk would increase significantly. A similar argument could be made for the NEXT 2+1
configuration shown in Figures 11 and 12, but mission risk would increase as well.
A comparison of the NSTAR 4+1 configuration with the NEXT high thrust and high Isp throttling modes are
provided in the following graphs, Figures 11 and 12.
4
0
2
0
Figure 11 Engine and power time history comparison for NEXT high Isp Throttling and NSTAR
12 American Institute of Aeronautics and Ashonautics
AIANASME Joint Propulsion Conference, 12 July 2004, Ft Lauderdale, Florida, USA AIAA-2004-3804
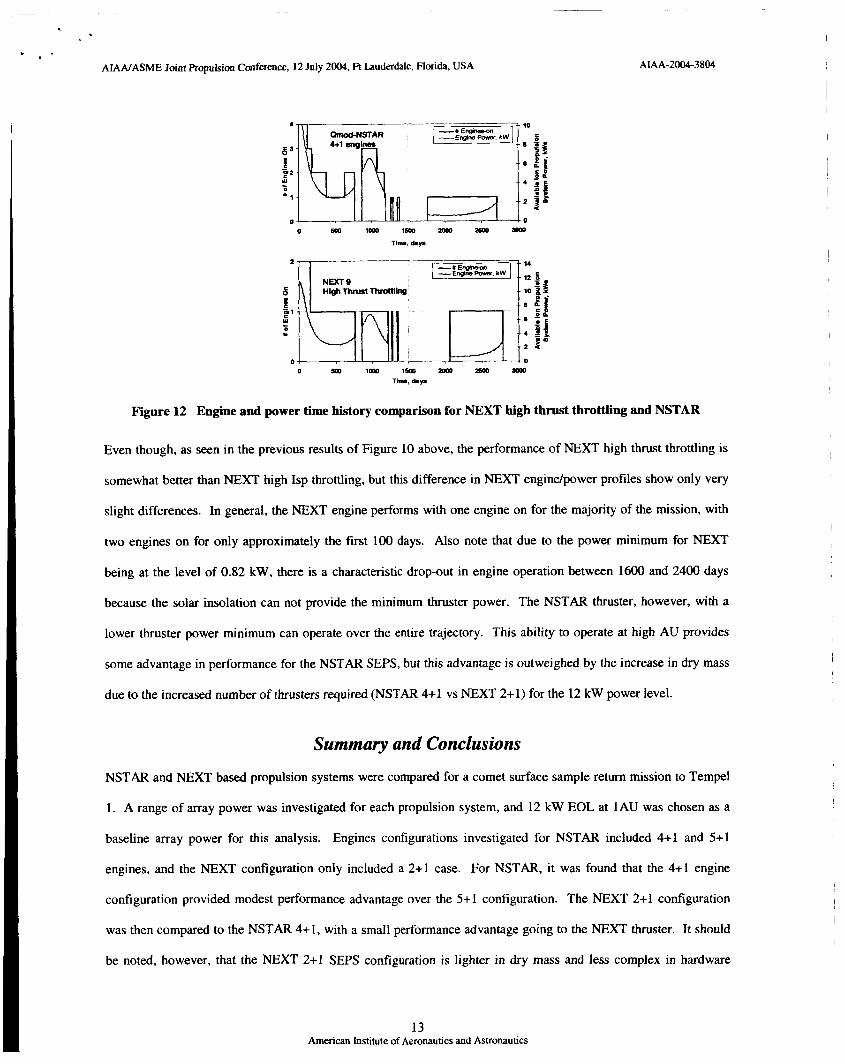
Figure 12 Engine and power time history comparison for NEXT high thrust throttling and NSTAR
Even though, as seen in the previous results of Figure 10 above, the performance of NEXT high thrust throttling is
somewhat better than NEXT high Isp throttling, but this difference in NEXT enginelpower profiles show only very
slight differences. In general, the NEXT engine performs with one engine on for the majority of the mission, with
two engines on for only approximately the first 100 days. Also note that due to the power minimum for NEXT
being at the level of 0.82 kW, there is a characteristic drop-out in engine operation between 1600 and 2400 days
because the solar insolation can not provide the minimum thruster power. The NSTAR thruster, however, with a
lower thruster power minimum can operate over the entire trajectory. This ability to operate at high AU provides
some advantage in performance for the NSTAR SEPS, but this advantage is outweighed by the increase in dry mass
due to the increased number of thrusters required (NSTAR 4+1 vs NEXT 2+1) for the 12 kW power level.
Summary and Conclusions NSTAR and NEXT based propulsion systems were compared for a comet surface sample return mission to Tempe1
1. A range of array power was investigated for each propulsion system, and 12 kW EOL at 1AU was chosen as a
baseline array power for this analysis. Engines configurations investigated for NSTAR included 4+1 and 5+1
engines, and the NEXT configuration only included a 2+1 case. For NSTAR, it was found that the 4+1 engine
configuration provided modest performance advantage over the 5+1 configuration. The NEXT 2+1 configuration
was then compared to the NSTAR 4+1, with a small performance advantage going to the NEXT thruster. It should
be noted, however, that the NEXT 2+1 SEPS configuration is lighter in dry mass and less complex in hardware
13 American Institute of Aeronautics and Astronautics
AIANASME Joint Propulsion Conference, 12 July 2004, Ft Lauderdale, Florida, USA ANA-2004-3804
implementation, resulting in an expected significantly less costly SEPS vehicle than the NSTAR 4+1 SEPS vehicle.
In both the NEXT and NSTAR cases, a powedengine-on time history showed smooth variation in thruster on-off
sequences following the available power to the IPS. It was found for NSTAR that 4 thrusters are needed for only a
short time during the beginning of the transfer. Thus, it would be possible to eliminate the spare thruster (along with
the related mass) for the mission, but the mission risk would increase significantly. A similar argument could be
made for the NEXT 2+1 configuration, but mission risk would increase as well. Finally, engine throughput for
NEXT and NSTAR are within the accepted assumed limits of 300 kg for NEXT and 150 kg for NSTAR for all cases
investigated except for the NEXT high thrust throttling case.
Acknowledgements
The work described in this paper was performed by Science Applications International Corporation (SAIC) under
contract with the NASA Marshall Space Flight Center (MSFC). Special thanks go to Les Johnson, manager of
NASA MSFC In-Space Propulsion Technology Investment Projects, and Randy Baggett, manager of NASA MSFC
Next Generation Electric Propulsion Technology Area, for providing encouragement and direction for this work.
References
’ Rayman, M. D., and Williams, S. N., “Design of the First Interplanetary Solar Electric Propulsion Mission,”
Journal of Spacecrafr and Rockets, Vol. 39, No. 4,2002, pp. 589-595
Rayman, M. D., Chadbourne, P. A., Culwell, J. S., and Williams, S. N., “Mission Design for Deep Space 1: A 2
Low-Thrust Technology Validation Mission,” International Academy of Astronautics, Paper L98-0502, April 1998.
Michael J. Patterson, John E. Foster, Thomas W. Haag, and George C. Soulas, “Next: NASA’S Evolutionary
Xenon Thruster Development Status,” 39” Joint Propulsion Conference, AIAA 2003-4862, Huntsville, AL, July
2003.
Johnson, C.L., Alexander, L., Baggett, R.M., Bonometti, J.A., Herrmann, M., James, B.F., Montgomery, S.E., “NASA’s In-Space Propulsion Technology Program: Overview and Status,” 2004 JANNAF, Las Vegas, NV, May 2004.
Tan, G.H., Sims, J.A., “Mission Design for the Deep Space 4/Champollion Comet sample Return Mission,” AAS
4
98-187, AAS/AIAA Space Flight Mechanics Meeting, Monterey, CA, February, 1998.
Sims, J.A., “Trajectories to Comets Using Solar Electric Propulsion,” A A S 2000-134, AASIAIAA Space Flight
Mechanics Meeting, Clearwater, FL., January 2000.
Cupples, M.L., Green, S.H., Coverstone, V., “Factors Influencing Solar Electric Payload Delivery to Outer Planet 7
Missions,” 2003 AASIAIAA Space Flight Mechanics Conference, AAS 03- 123.
14 American Institute of Aeronautics and Astronautics
~~
t
* * AIANASME Joint Propulsion Conference, 12 July 2004, Ft Lauderdale, Florida, USA AIAA-2004-3804
Cupples, M., Green, S., Donahue, B., Coverstone, V., “Solar Electric and Chemical Propulsion for a Titan 8
Mission,” 39” Joint Propulsion Conference, AIAA 2003-4728, July 2003.
Byoungsam, W., Coverstone, V., Hartmann, J., Cupples, M., “Trajectory and Systems Analysis for Outer Planet
Solar Electric Propulsion Missions,” J o u m l of Spacecrufi and Rockets, pending publication, 2004.
lo Oh, David., Sims, J., Benson, S., Gefert, L., Witzberger, K., Cupples, M., “Deep Space Applications of the NEXT
Thruster,” 40” Joint Propulsion Conference, AIAA 2004- , Ft. Lauderdale, FL., July 2004.
http://centauri.larc.nasa.gov/newfrontiers/
l2 http://elvperf.ksc.nasa.gov
l3 T. Kerslake, “Photovoltaic Array Performance during an Earth-to-Jupiter Heliocentric Transfer,” NASA Glenn
Research Center, PS-496, Aug. 2000.
l4 http://www.aec-able.codarrays/ableultraflex.html
Sauer, C. G., “Optimization of Multiple Target Electric Propulsion Trajectories,” AIAA 1 1 ~ Aerospace Sciences 15
Meeting, AIAA Paper 73-205, Washington, DC, Jan. 1973
l6 Melbourne, W. G., Richardson, D. E., and Sauer, C. G., “Interplanetary Trajectory Optimization with Power-
Limited Propulsion Systems,” Jet Propulsion Laboratory, TR No. 32-173, Pasadena, CA, 1962.
Williams, S. N., and Coverstone, V. L., “Mars Missions Using Solar Electric Propulsion,” Joumul ofspacecrujl
and Rockets, Vol. 37, NO. 1,2000, pp. 71-77.
Williams, S. N., “An Introduction to the use of VARITOP A general purpose low-thrust trajectory optimization
program,” Jet Propulsion Laboratory, JPL D-11475, Pasadena, CA, 1994.
15 American institute of Aeronautics and Astronautics