Embed Size (px)
Citation preview
Application of Statistical
Modelling in Marketing and
Advertising
Mindshare Business Planning
7-Nov-12
“Half the money I spend on advertising is wasted.
The trouble is I don't know which half.”
- John Wanamaker
1895
Cookie Based Attribution Modeling
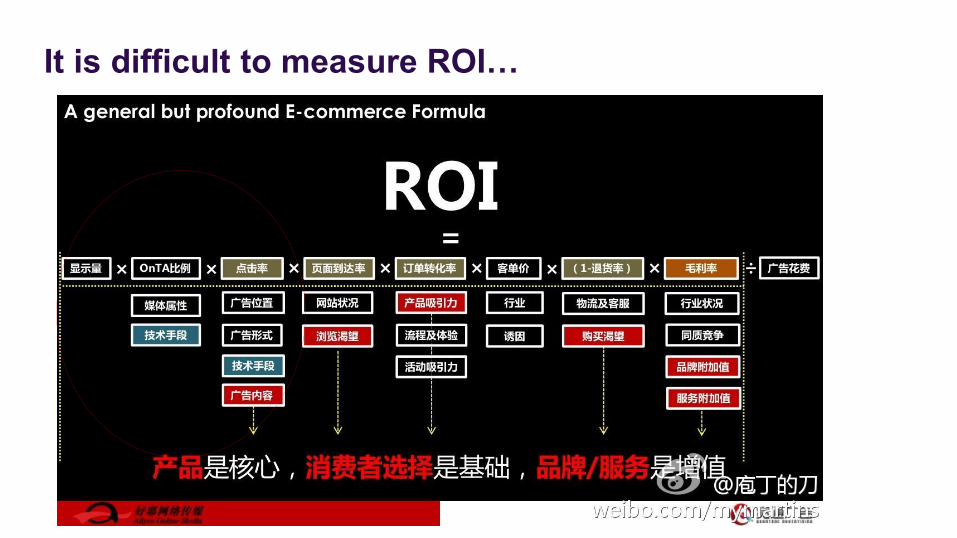
It is difficult to measure ROI…

Last click is not everything
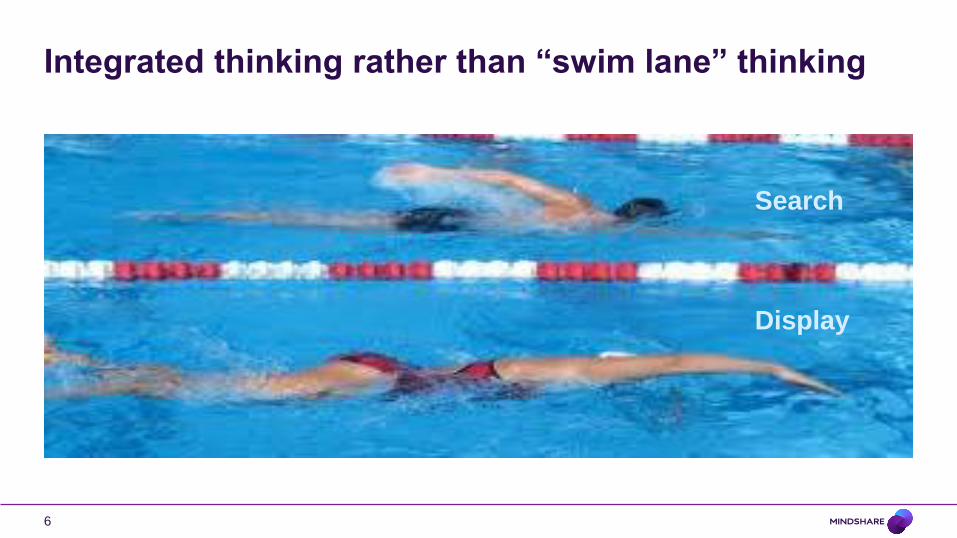
Integrated thinking rather than “swim lane” thinking
Photography credit
6
Search
Display
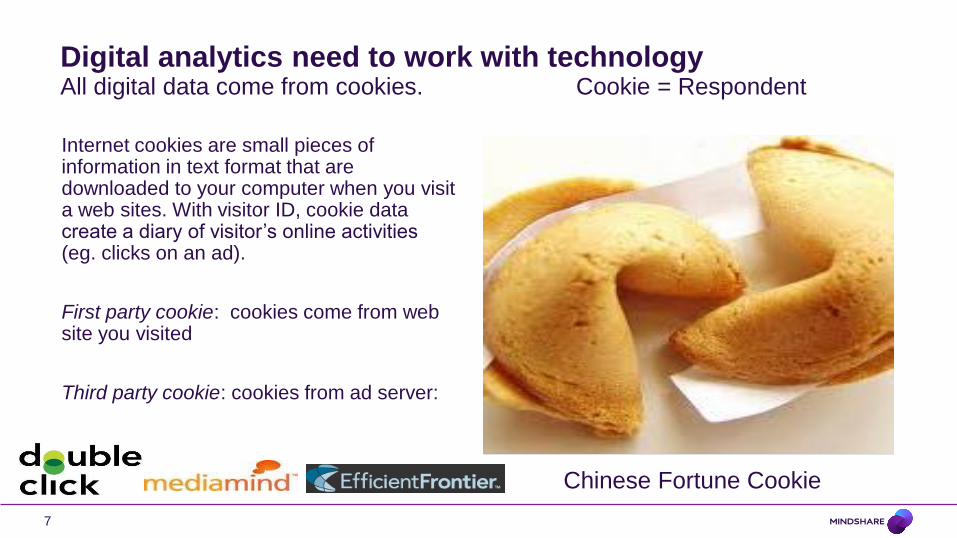
Digital analytics need to work with technology
Internet cookies are small pieces of information in text format that are downloaded to your computer when you visit a web sites. With visitor ID, cookie data create a diary of visitor’s online activities (eg. clicks on an ad).
First party cookie: cookies come from web site you visited
Third party cookie: cookies from ad server:
Photography credit
All digital data come from cookies. Cookie = Respondent
7
Chinese Fortune Cookie
• Typical client questions to be addressed by attribution
modeling:
• Which elements have driven the conversion – was it the last
click, the first click or a particular combination of clicks?
• How can I accelerate this journey by improving the cross-
channel efficiency?
Attribution Modeling
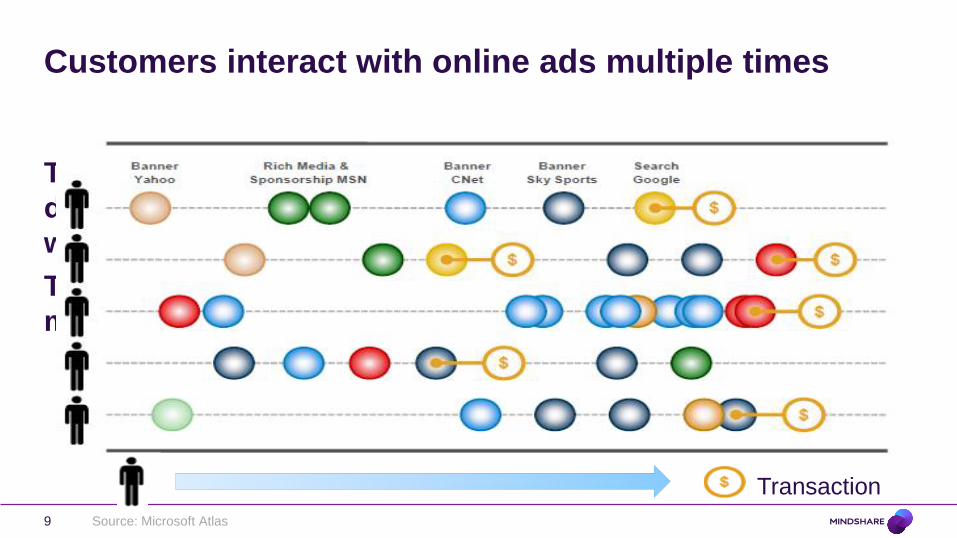
Customers interact with online ads multiple times
To create a new presentation based on this template, simply
delete the slides you don’t want and save the presentation
with a new name.
The next few slides provide tips to help you use this template
more easily and avoid editing complications.
Source: Microsoft Atlas 9
Transaction
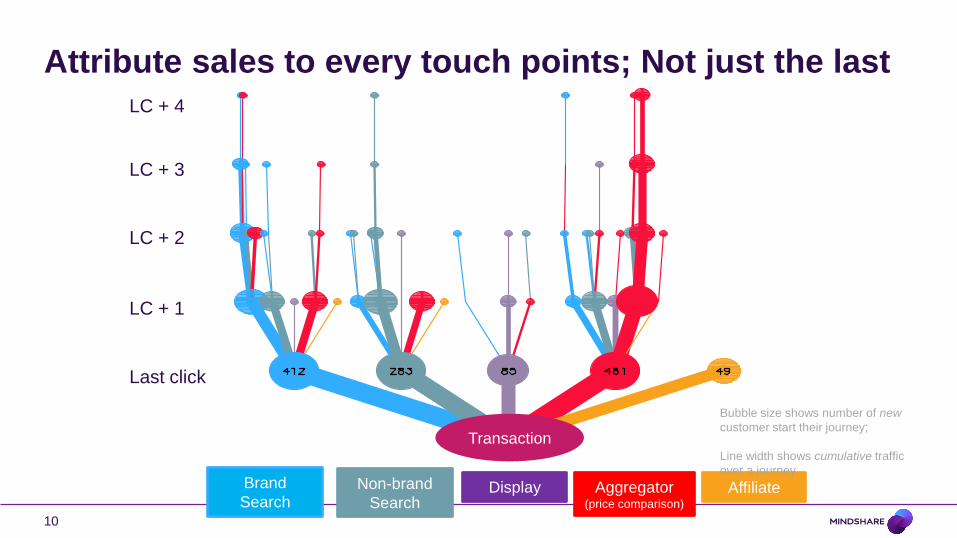
Attribute sales to every touch points; Not just the last
10
Transaction
Brand
Search Display Aggregator
(price comparison)
Affiliate
LC + 1
Last click
LC + 2
LC + 3
LC + 4
Non-brand
Search
Bubble size shows number of new
customer start their journey;
Line width shows cumulative traffic
over a journey.
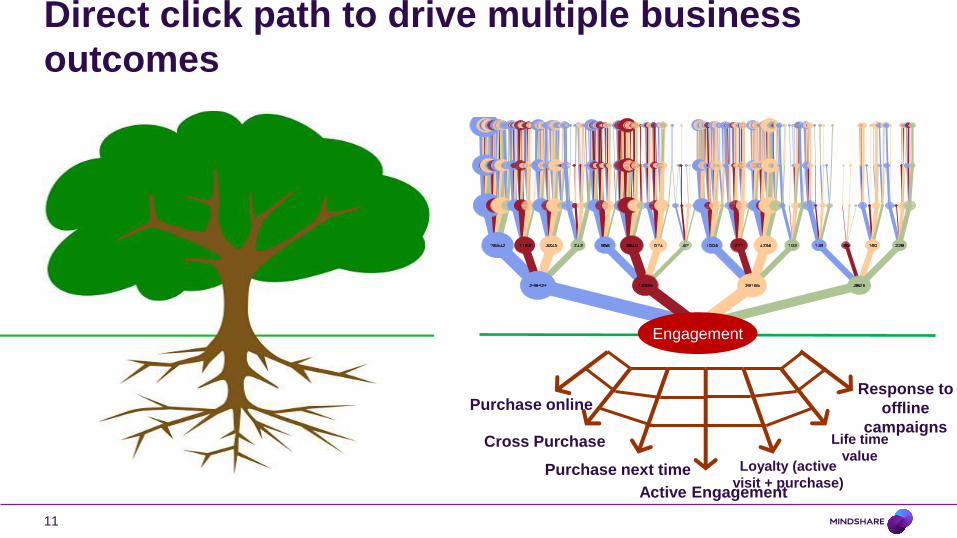
Direct click path to drive multiple business
outcomes
11
Purchase online
Cross Purchase
Purchase next time
Active Engagement
Loyalty (active
visit + purchase)
Life time
value
Response to
offline
campaigns
Engagement
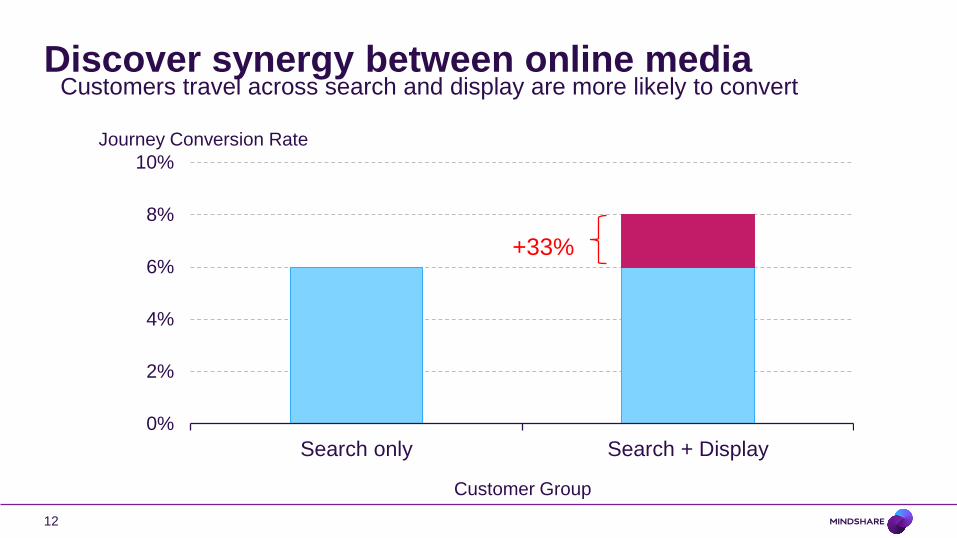
Discover synergy between online media
12
Customers travel across search and display are more likely to convert
0%
2%
4%
6%
8%
10%
Search only Search + Display
Journey Conversion Rate
Customer Group
+33%
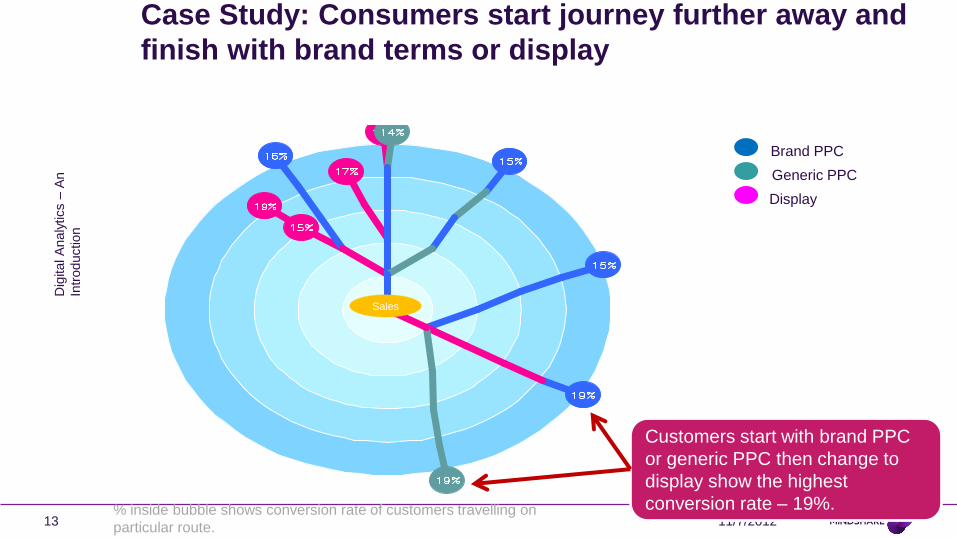
Case Study: Consumers start journey further away and
finish with brand terms or display
11/7/2012 13
Brand PPC
Generic PPC
Display
Sales
Customers start with brand PPC
or generic PPC then change to
display show the highest
conversion rate – 19%. % inside bubble shows conversion rate of customers travelling on
particular route.
Dig
ital A
naly
tics –
An
Intr
oduction
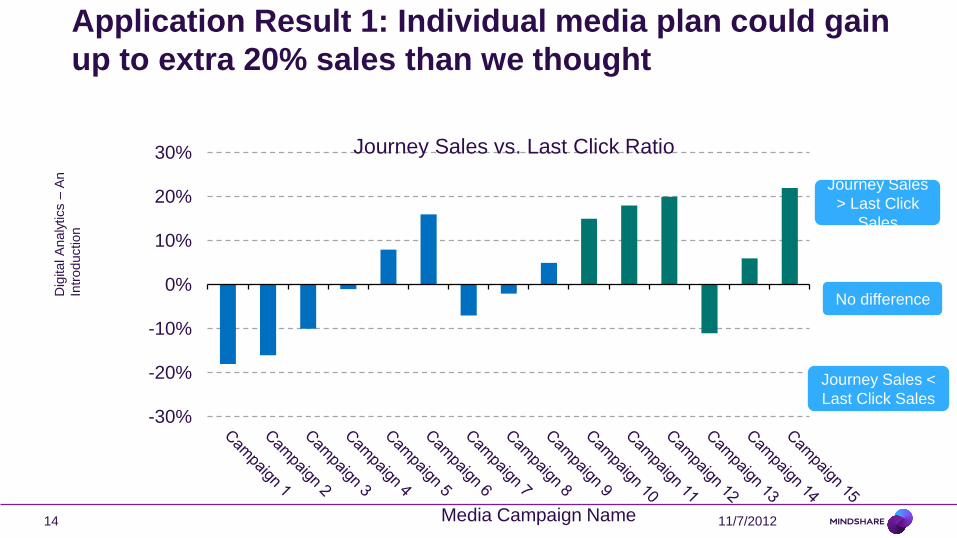
Application Result 1: Individual media plan could gain
up to extra 20% sales than we thought
-30%
-20%
-10%
0%
10%
20%
30% Journey Sales vs. Last Click Ratio
11/7/2012 14
Journey Sales
> Last Click
Sales
Journey Sales <
Last Click Sales
No difference
Media Campaign Name
Dig
ital A
naly
tics –
An
Intr
oduction
How about mass-media ?
How about offline sales?
Marketing Mix Modeling
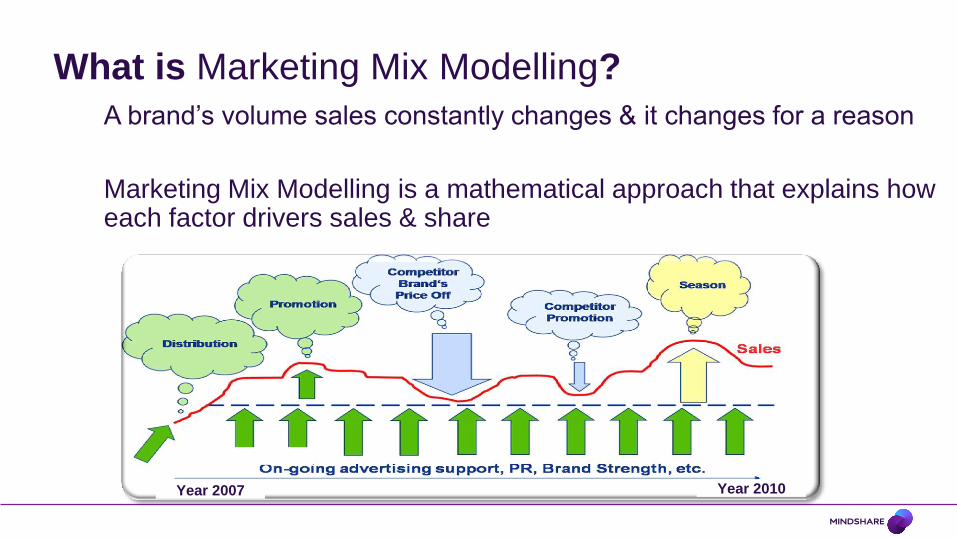
A brand’s volume sales constantly changes & it changes for a reason
Marketing Mix Modelling is a mathematical approach that explains how each factor drivers sales & share
Year 2010 Year 2007
What is Marketing Mix Modelling?
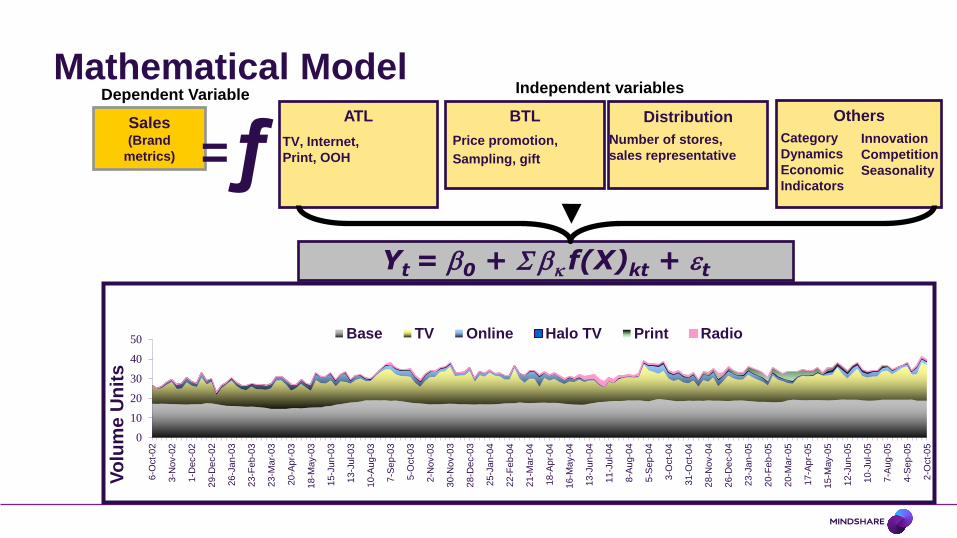
Sales (Brand
metrics)
ATL
Yt = b0 + S bk f(X)kt + et
BTL
ƒ Distribution
Others
TV, Internet,
Print, OOH
Price promotion,
Sampling, gift
Number of stores,
sales representative
Category
Dynamics
Economic
Indicators
Innovation
Competition
Seasonality
Dependent Variable Independent variables
=
0
10
20
30
40
50
6-O
ct-
02
3-N
ov-0
2
1-D
ec-0
2
29
-De
c-0
2
26
-Ja
n-0
3
23
-Fe
b-0
3
23
-Ma
r-0
3
20
-Ap
r-0
3
18
-Ma
y-0
3
15
-Ju
n-0
3
13
-Ju
l-0
3
10
-Au
g-0
3
7-S
ep
-03
5-O
ct-
03
2-N
ov-0
3
30
-No
v-0
3
28
-De
c-0
3
25
-Ja
n-0
4
22
-Fe
b-0
4
21
-Ma
r-0
4
18
-Ap
r-0
4
16
-Ma
y-0
4
13
-Ju
n-0
4
11
-Ju
l-0
4
8-A
ug
-04
5-S
ep
-04
3-O
ct-
04
31
-Oct-
04
28
-No
v-0
4
26
-De
c-0
4
23
-Ja
n-0
5
20
-Fe
b-0
5
20
-Ma
r-0
5
17
-Ap
r-0
5
15
-Ma
y-0
5
12
-Ju
n-0
5
10
-Ju
l-0
5
7-A
ug
-05
4-S
ep
-05
2-O
ct-
05
Vo
lum
e U
nit
s
Base TV Online Halo TV Print Radio
Mathematical Model
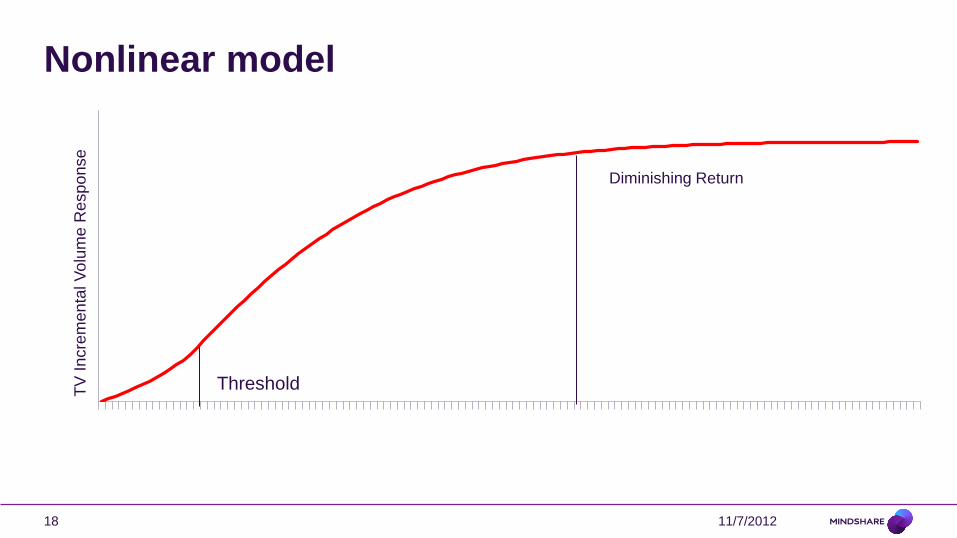
Nonlinear model
11/7/2012 18
TV
In
cre
me
nta
l V
olu
me
Re
sp
on
se
Threshold
Diminishing Return
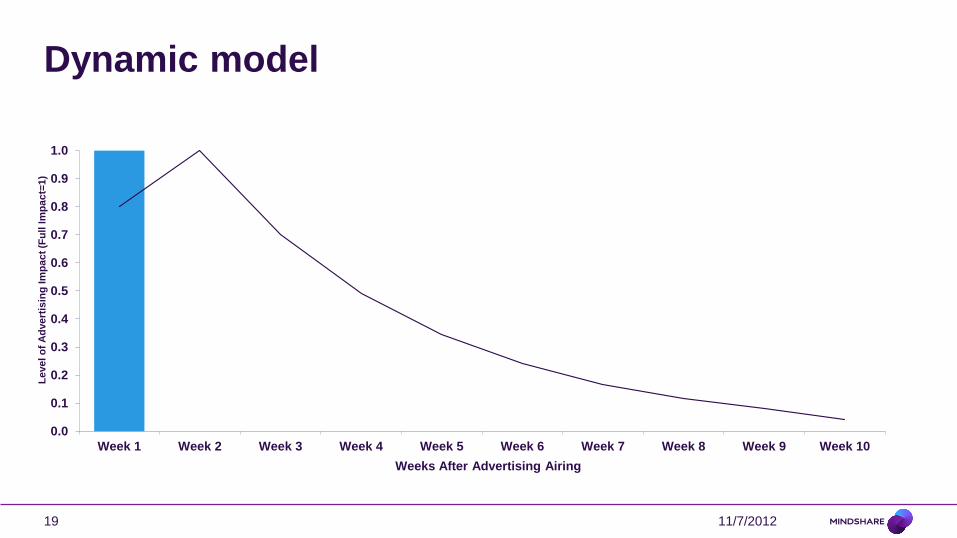
Dynamic model
11/7/2012 19
0.0
0.1
0.2
0.3
0.4
0.5
0.6
0.7
0.8
0.9
1.0
Week 1 Week 2 Week 3 Week 4 Week 5 Week 6 Week 7 Week 8 Week 9 Week 10
Le
ve
l o
f A
dve
rtis
ing
Im
pa
ct
(Fu
ll I
mp
ac
t=1
)
Weeks After Advertising Airing
More than a simple linear regression
1. Non-linear model
2. Dynamic model:
• incorporating lags, time (t, t-1…) and flexible adstock to include the media carry-over
effect, post-promotion dip effect etc
• Incorporating wear-in, wear-out and different stage of market development
3. Multivariate model:
• Incorporating multivariate relationship between different outcomes and inputs, e.g.,
TV’s the impact on search and social media, sales’ impact on social media etc
4. Hierarchical model:
• Incorporating hierarchical Bayesian model to address heterogeneity for panel data
11/7/2012 20
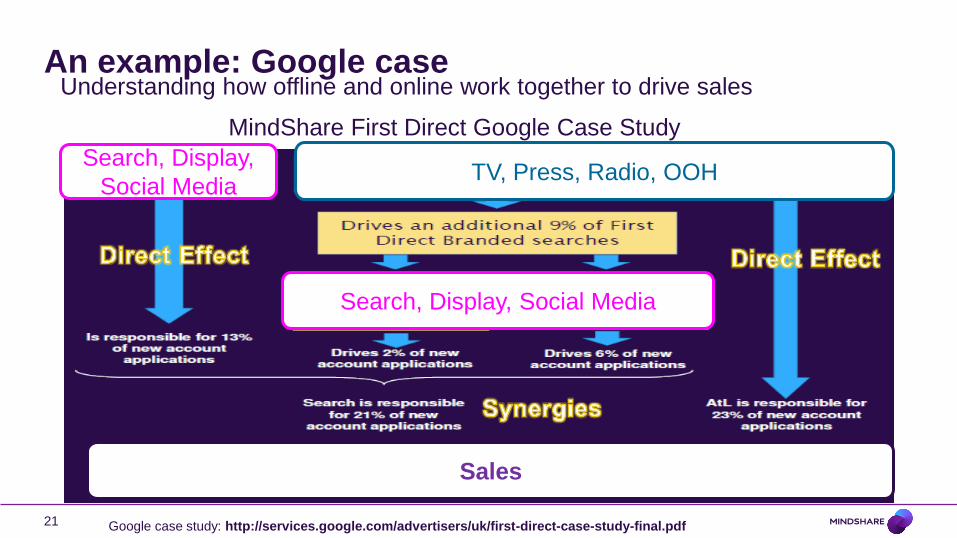
An example: Google case
21
Understanding how offline and online work together to drive sales
MindShare First Direct Google Case Study
Google case study: http://services.google.com/advertisers/uk/first-direct-case-study-final.pdf
Search, Display,
Social Media
Search, Display, Social Media
TV, Press, Radio, OOH
Sales
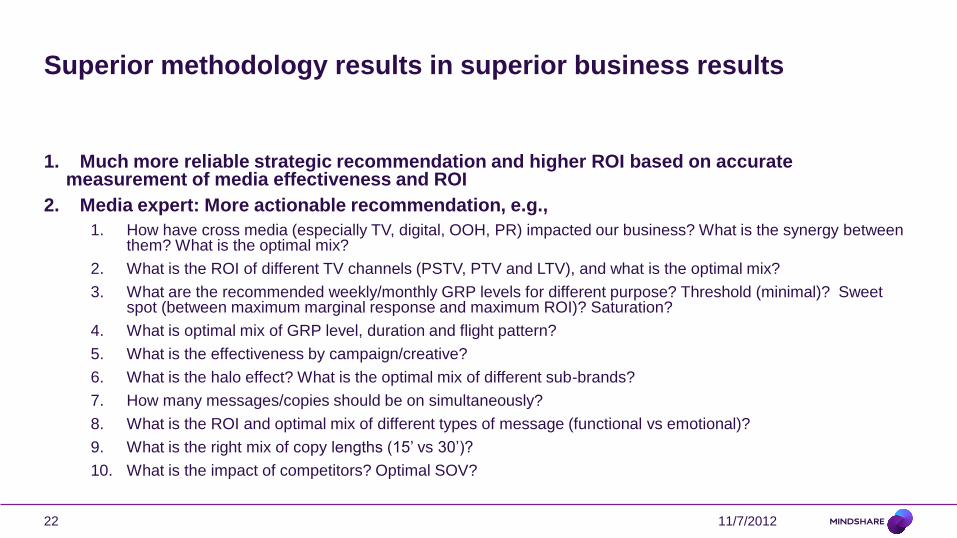
Superior methodology results in superior business results
1. Much more reliable strategic recommendation and higher ROI based on accurate measurement of media effectiveness and ROI
2. Media expert: More actionable recommendation, e.g.,
1. How have cross media (especially TV, digital, OOH, PR) impacted our business? What is the synergy between them? What is the optimal mix?
2. What is the ROI of different TV channels (PSTV, PTV and LTV), and what is the optimal mix?
3. What are the recommended weekly/monthly GRP levels for different purpose? Threshold (minimal)? Sweet spot (between maximum marginal response and maximum ROI)? Saturation?
4. What is optimal mix of GRP level, duration and flight pattern?
5. What is the effectiveness by campaign/creative?
6. What is the halo effect? What is the optimal mix of different sub-brands?
7. How many messages/copies should be on simultaneously?
8. What is the ROI and optimal mix of different types of message (functional vs emotional)?
9. What is the right mix of copy lengths (15’ vs 30’)?
10. What is the impact of competitors? Optimal SOV?
11/7/2012 22
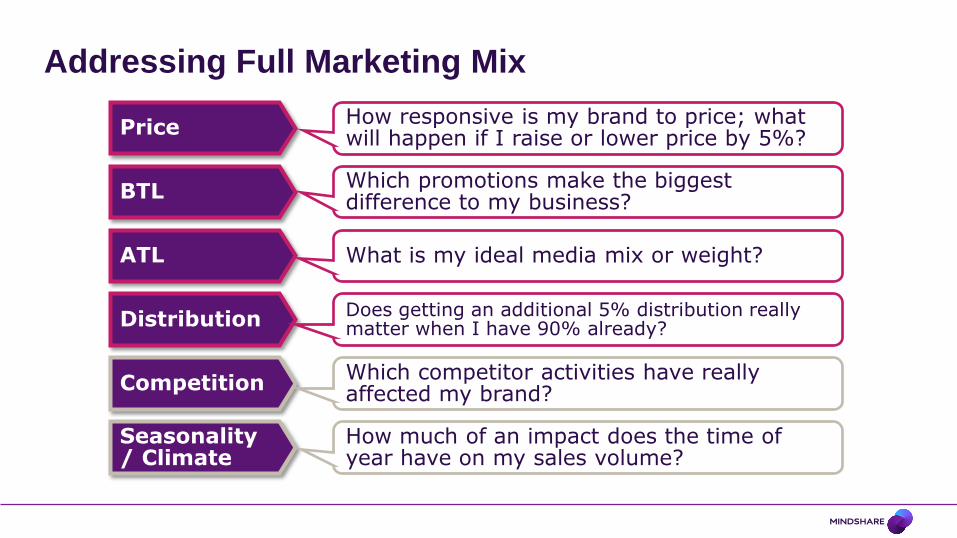
Addressing Full Marketing Mix
BTL
ATL
Distribution
Competition
Seasonality / Climate
How responsive is my brand to price; what will happen if I raise or lower price by 5%?
Which promotions make the biggest difference to my business?
What is my ideal media mix or weight?
Does getting an additional 5% distribution really matter when I have 90% already?
How much of an impact does the time of year have on my sales volume?
Price
Which competitor activities have really affected my brand?
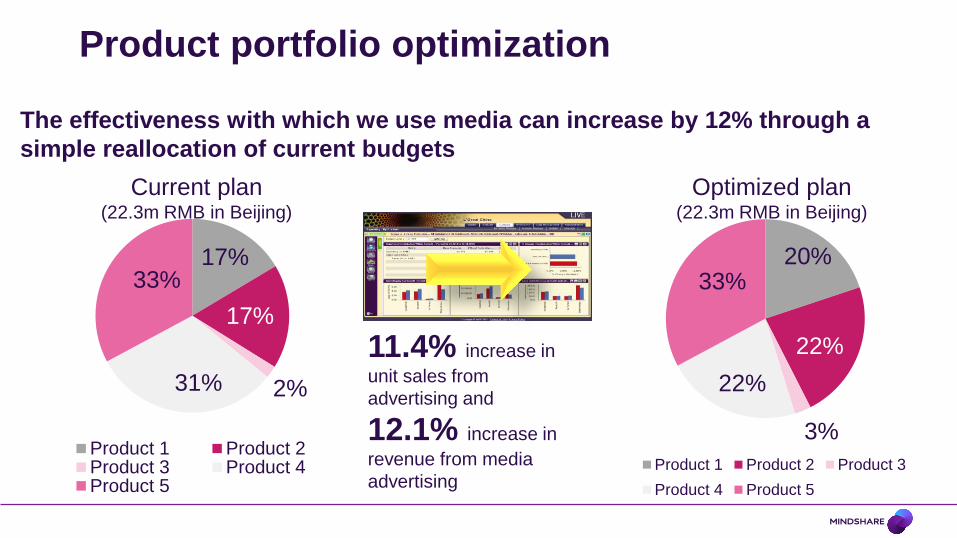
The effectiveness with which we use media can increase by 12% through a
simple reallocation of current budgets
17%
17%
2% 31%
33%
Product 1 Product 2Product 3 Product 4Product 5
Current plan (22.3m RMB in Beijing)
Optimized plan (22.3m RMB in Beijing)
20%
22%
3%
22%
33%
Product 1 Product 2 Product 3
Product 4 Product 5
11.4% increase in
unit sales from
advertising and
12.1% increase in
revenue from media
advertising
Product portfolio optimization
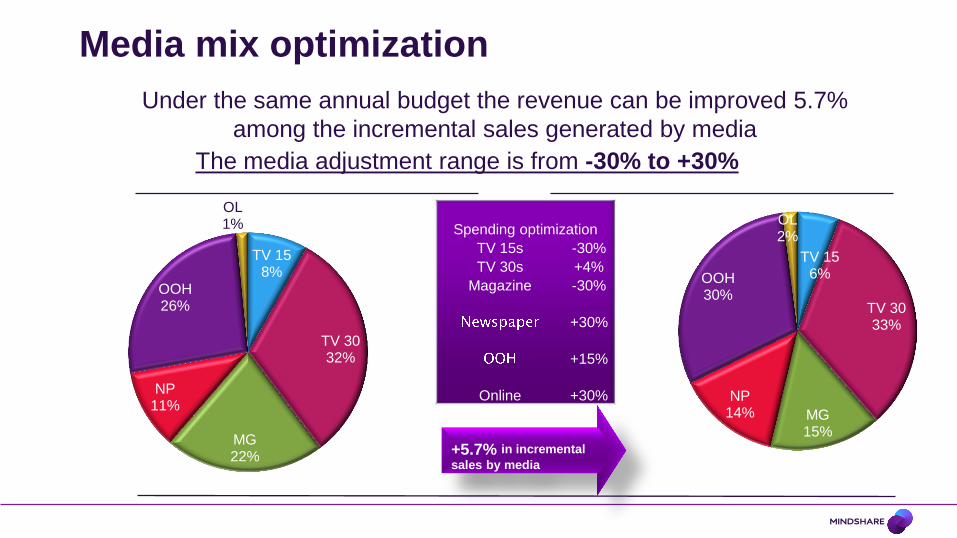
Media mix optimization
4/14/2011 25
TV 15 8%
TV 30 32%
MG 22%
NP 11%
OOH 26%
OL 1%
TV 15 6%
TV 30 33%
MG 15%
NP 14%
OOH 30%
OL 2%
Under the same annual budget the revenue can be improved 5.7%
among the incremental sales generated by media
i) Current spending ii) Suggested spending
+5.7% in incremental
sales by media
Spending optimization
TV 15s -30%
TV 30s +4%
Magazine -30%
+30%
+15%
Online +30%
The media adjustment range is from -30% to +30%
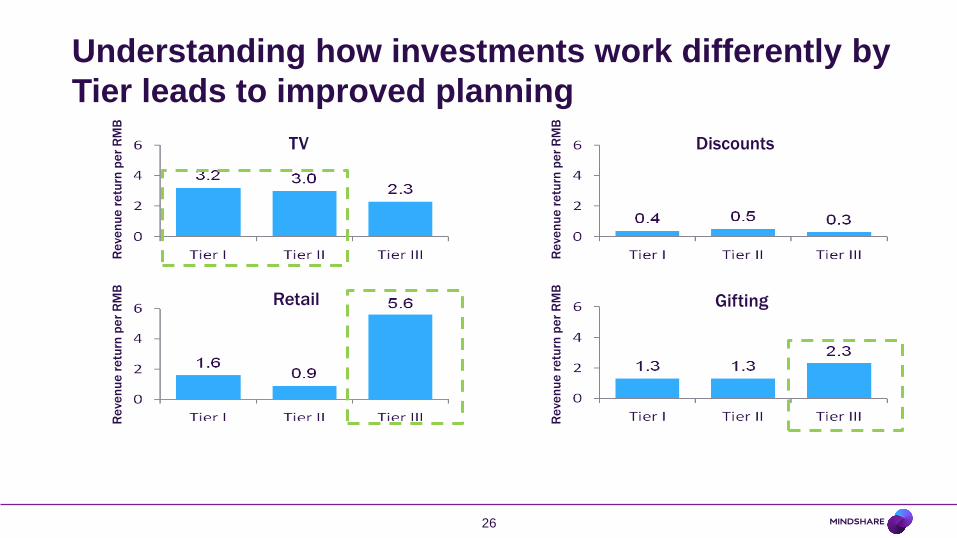
Understanding how investments work differently by
Tier leads to improved planning
26
TV Discounts
Retail Gifting
Re
ven
ue
re
turn
pe
r R
MB
R
eve
nu
e r
etu
rn p
er
RM
B
Re
ven
ue
re
turn
pe
r R
MB
R
eve
nu
e r
etu
rn p
er
RM
B

Beyond ROI
Beyond MMM
1. Computational advertising
• Provide the right product and message to the right consumer in the right time through
the right channel
• Huge data mining, machine learning and optimization problem
• Ad exchange, Real time bidding, Demand side platform
2. Consumer and media research
• Know what consumer really wants and how to contact them
• Conjoint analysis. discrete choice modeling, factor analysis, clustering, latent class
modeling, structural equation modeling, graphical modeling
11/7/2012 28
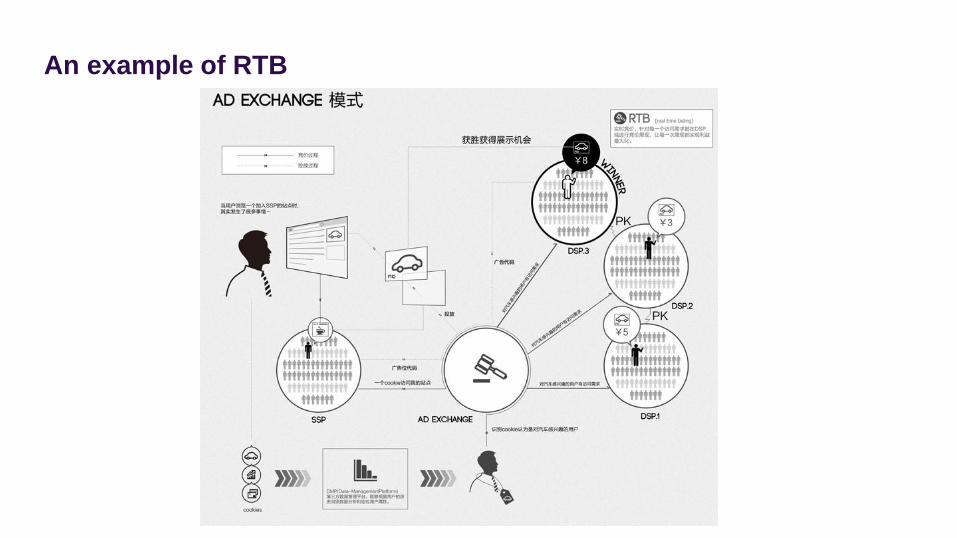
An example of RTB


![Modelling Competitive marketing strategies in Social Networks · arXiv:1805.02081v1 [cs.SI] 5 May 2018 Modelling Competitive marketing strategies in Social Networks Rahul Goel a,](https://img.pdfslide.net/doc/110x75/5ee248e9ad6a402d666cd3e1/modelling-competitive-marketing-strategies-in-social-networks-arxiv180502081v1.jpg)