Embed Size (px)
Citation preview

九州大学学術情報リポジトリKyushu University Institutional Repository
APPLICATION OF VOLCANIC ASH SOIL AND LATERITETO WATER TREATMENT
グエン ティ ハン ガ
https://doi.org/10.15017/1398429
出版情報:九州大学, 2013, 博士(農学), 課程博士バージョン:権利関係:全文ファイル公表済

APPLICATION OF VOLCANIC ASH SOIL AND
LATERITE TO WATER TREATMENT
By
Nguyen Thi Hang Nga
(A dissertation submitted for the degree of Doctor of Philosophy)
Completed in
The Laboratory of Environmental Geochemistry Department of Agro-Environmental Sciences
Kyushu University, Japan
2013

i
ACKNOWLEDGEMENTS ___________________________________________________________________________
I would like to express my sincere gratitude to the Ministry of the Education and Training of Viet
Nam and the Japanese Society for Promoting Sciences (#21380048 and #22246064) for the financial
support that makes this research possible.
I am deeply grateful to my supervisor, Prof. Shin-Ichiro Wada from Kyushu University for his kindly
supports during time I do this research.
I wish to express my gratitude to Prof. Masami Ohtsubo, Prof. Yamakawa Takeo, Prof. Takahiro
Higashi from the Faculty of Agriculture, Kyushu University for academic discussion and review my
thesis.
I would also like to thank Dr. Yuki Mori from Laboratory of Environmental geochemistry, Kyushu
University for his kind helps during time I study in Kyushu University.
I wish to thank the company of environmental treatment technology, Astec.Co for providing volcanic
ash flocculants (TRP-Ai)
To Morishita and Onno san, Ueya, thank you very much for help me to operate equipments.
Additional thanks go to all friends who had been studying in the Lab of Soil Science: Tabuchi, Goto,
Yoshida, Shimasaki, Nagano and other friends for their close friendship. They are so nice friends in
my mind.
I am very grateful to my family for their great love, patience and spirit supports during time I study in
abroad country.

ii
ABSTRACT ___________________________________________________________________________
Volcanic ash soil and laterite are natural materials studied to use as treatment agents to remove
contaminants from water. The present study aims to evaluate the applied ability of these materials to
replace costly chemicals in water treatment. The flocculations of suspended clay particles and
adsorption of phosphorous and heavy metals in contaminated water using volcanic ash soil and
laterite materials were investigated.
In water treatment, water turbidity is a major factor increasing treatment costs. In order to
eliminate water turbidity, suspended clay particles need to be removed. The removal efficiency is
supposed to be strongly dependent on mineralogy of self-clay particles as well as treatment agents.
This study examined the effects of clay mineralogy and interfacial chemistry of clay suspensions on
the performance of a flocculant prepared from weathered volcanic ash rich in allophane and imogolite.
Upon addition of the flocculant into the clay suspension and stirring, fluffy flocs formed and settled
after a standing time. The absorbance of the supernatant gradually decreased to near zero at an
optimum addition and then increased again when more flocculant was added. The optimum flocculant
addition differed significantly among the clay suspensions. Inspection of the results of the flocculation
tests and characterization of the sample clays, particularly stepwise multiple regression analyses,
suggested that the major factors affecting the performance were the effective cation exchange capacity
(ECEC), content of micaceous minerals and average particle size. This was interpreted as indicating
the importance of the amount of negative charge on the external surfaces of particles in the clay
suspensions.
Volcanic ash soil has high potentials in wastewater treatment due to consist of iron and
aluminum oxides. To evaluate the relative flocculating power of allophane and imogolite, we
conducted a series of flocculation experiment using allophane and imogolite sols and their mixtures.
Imogolite was more effective than allophane for all five clay suspensions used. Therefore, weathered
volcanic ash containing more imogolite is suitable for manufacturing flocculating agent. The residual
turbidities of montmorillonite suspensions after treatment with mixed allophane and imogolite sols
were nearly equal to those calculated under the assumption that the contribution of allophane and
imogolite was additive. But the experimental turbidity was much higher than the calculated result for
a soil clay suspension.
In the similar way, the study examined the removal capacity of suspended clay particles by the
laterite samples distributed in Viet Nam. Mineralogy of the laterite and their use as flocculating agents
for suspended clay particle removal were investigated. The laterite sample collected in Thach That
region (1-TT) performed the best flocculation efficiency followed by the laterite sample collected in

iii
Hoa Lac region (2-HL). The sample collected in Quynh Tam commune (3-QT) worked less efficiently
than other two samples. Goethite, gibbisite and hematite are considered to be the main components
that are responsible for flocculation action.
Adsorption of phosphate in artificial model solutions onto laterite was studied by batch
experiments. Equilibrium isotherms and other adsorption experiments showed that phosphate
adsorption was slightly pH dependent whereas the materials containing ferric and aluminum
compounds are proven to be strongly pH dependent. Adsorption capacities of 1.1-1.6 mg P g-1at pH 3
and 1.0-1.4 mg P g-1at pH 9 and an equilibrium concentration of less 2 mg P L-1 can be reached. The
presence of other anions, e.g., sulfates and carbonate was shown to decrease adsorption of phosphate.
In competitive adsorption in the mixed solutions of phosphate, sulfate and carbonate, laterite samples
preferred phosphate to sulfate and carbonate. The order of adsorption selectivity was phosphate >
sulfate > carbonate. From the technological viewpoint, natural laterite is low cost material sources to
remove phosphorous in contaminated water. However, laterite rich in quart mineral is not
recommended to remove phosphorous at alkaline pH range.
The batch experiments of adsorption of Cu2+, Pb2+and Cd2+were carried out at laboratory scale
with artificial model solutions. Adsorption capacity was determined based on Langmuir models. The
results showed that both volcanic ash soil and laterite displayed high adsorption capacity for lead (up
to 1.0-1.2 mg Pb g-1is recorded at pH 5). Adsorption capacity for copper, though not as high as that of
lead, is acceptable if used in water treatment (about 0.5-0.8 mg Cu g-1 at pH 5). Cadmium seemed to
have been hardly removed by laterite and volcanic ash soil. The calculated adsorption capacities were
0.4 mg Cd g-1for laterite and less than 0.1mg Cd g-1 for volcanic ash soil at an initial concentration of
25 mg L-1. The adsorption of heavy metals by laterite and volcanic ash was strongly pH dependent. At
pHs lower than 4, these materials were not effective for metal removal. From a viewpoint of
implementation, the laterite should be used after pH adjustment to over 4 for Pb, Cu, Cd removal from
wastewater. Similar way in use of volcanic ash soil is recommend for Pb and Cu, but volcanic ash soil
is not recommended for Cd removal from wastewater.
Volcanic ash soil and laterite are environmental friendly and effective materials in water
treatments. The laterite is an abundantly available resource in tropical and sub-tropical areas whereas
volcanic ash soil is widely distributed in volcanic zones. Their ability in contaminant adsorption was
described by the present study. Therefore, these materials are recommended to use as bed medium
which may replace sand and gravel materials in water filtering process.

iv
LIST OF CONTENTS
Contents Page
CHAPTER 1. GENERAL INTRODUCTION
1.1 Background
1.2 Motivation
1.3 Objectives
1.4 Thesis outline
CHAPTER 2. LITTERATURE REVIEW
2.1 Conventional water treatment methods
2.2 Remediation technology for heavy metals in water
2.3 Adsorption theory and environmental applications
2.4 Natural materials and their applications in water treatment
CHAPTER 3. EFFECTS OF MINERALOGY OF SUSPENDED MATERIALS ON
PERFORMANCE OF WEATHERED VOLCANIC ASH FLOCCULANT
3.1 Introduction
3.2 Materials and methods
3.3 Results and discussion
3.4 Conclusions
CHAPTER 4. COMPARISON OF ALLOPHANE AND IMOGOLITE SOLS AS A
FLOCCULATING AGENT TO REMOVE SUSPENDED CLAY PARTICLES IN
WATER
4.1 Introduction
4.2 Materials and methods
4.3 Results and discussion
4.4 Conclusions
1
1
1
3
4
6
6
11
14
17
30
30
31
33
42
44
45
45
47
53
v
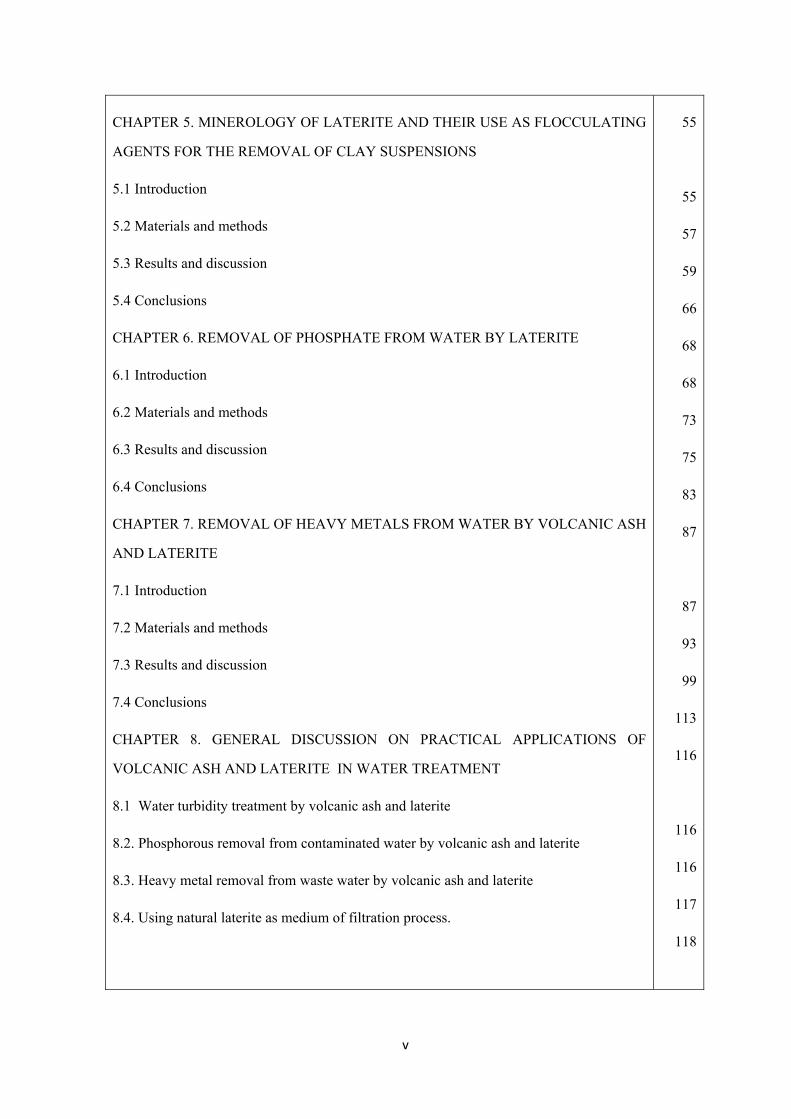
CHAPTER 5. MINEROLOGY OF LATERITE AND THEIR USE AS FLOCCULATING
AGENTS FOR THE REMOVAL OF CLAY SUSPENSIONS
5.1 Introduction
5.2 Materials and methods
5.3 Results and discussion
5.4 Conclusions
CHAPTER 6. REMOVAL OF PHOSPHATE FROM WATER BY LATERITE
6.1 Introduction
6.2 Materials and methods
6.3 Results and discussion
6.4 Conclusions
CHAPTER 7. REMOVAL OF HEAVY METALS FROM WATER BY VOLCANIC ASH
AND LATERITE
7.1 Introduction
7.2 Materials and methods
7.3 Results and discussion
7.4 Conclusions
CHAPTER 8. GENERAL DISCUSSION ON PRACTICAL APPLICATIONS OF
VOLCANIC ASH AND LATERITE IN WATER TREATMENT
8.1 Water turbidity treatment by volcanic ash and laterite
8.2. Phosphorous removal from contaminated water by volcanic ash and laterite
8.3. Heavy metal removal from waste water by volcanic ash and laterite
8.4. Using natural laterite as medium of filtration process.
55
55
57
59
66
68
68
73
75
83
87
87
93
99
113
116
116
116
117
118

vi
LIST OF FIGURES _____________________________________________________________________
Fig. 2.1. Coagulation process as be theoretically described………………………………………..…07
Fig. 2.2. Negatively charged particles repel each other due to electrostatic repulsion……………..…07
Fig. 2.3. Positively charged coagulants attract to negatively charged particles due to electricity….....08
Fig. 2.4. Neutral particles attract due to van der Waal forces………………………………………....08
Fig. 2.5. Particles and coagulants associate together to form flocs……………………………….…..09
Fig. 2.6. An Example of water sample treated by flocculation/coagulation process…………..……...09
Fig. 3.1. X-ray diffraction patterns of the clays in suspensions used for flocculation experiments......34
Fig. 3.2. Electron micrograph of < 2 µm fraction of flocculant…………………………………….....35
Fig. 3.3. Size distribution of suspended particles in clay suspensions used for flocculation
experiment…………………………………………………………………………………………..…37
Fig. 3.4. Results of the flocculation experiments…………………………………………………..….41
Fig. 3.5. The relationship between the measured optimum dose and predicted dose……………..…..42
Fig. 4.1. Surface charge characteristics of allophane (left) and imogolite (right). ……………….…..48
Fig. 4.2 Relative turbidity of montmorillonite and F soil clay suspentions ……………………..…....49
Fig. 4.3. Relationship between relative absorbance of clay suspension after the addition of a fixed
volume of mixed sols and its imogolite content. ……………………………………………….…….50
Fig. 4.4. Photographs of flocs formed after flocculation experiments on the T5 soil clay
suspension…………………………………………………………………………………….……….51
Fig. 5.1. Sampling locations and imagines of raw laterite samples………………………….…… ….57
Fig. 5.2. X-ray diffraction diagram of 1-TT, 2-HL and 3-QT………………………………….……..60
Fig.5.3. Results of differential thermal analysis and thermogravimetric analysis…………….…… 61
Fig.5.4. Surface charge diagrams of laterite samples:1-TT; 2-HL and 3-QT……………..………..…62
Fig.5.5. Mineralogy of soil clay suspensions (T5 and F samples)………………………………..…...63
Fig. 5.6. Flocculation experiments of clay suspensions by laterite flocculants…………………..…...65
Fig. 6.1. Geological and biological phosphorus cycle in nature…………………………………..…..70
Fig. 6.2. Aqueous speciation of phosphorus as function of pH…………………...…………….…….71

vii
Fig.6.3. X-ray diffraction pattern of laterite samples/ Clay fraction. …………………………..……..75
Fig. 6.4. Results of differential thermal analysis and thermo gravimetric analysis…………………...77
Fig.6.5.Surface charge diagrams of laterite samples…………………………………………….……78
Fig.6.6. Phosphorous adsorption isotherm at 25oC and pH 5-6…………………………………….…80
Fig.6.7. Effect of initial pH on phosphate adsorption by laterite………………………………….…..81
Fig.6.8. Phosphorous adsorption kinetic data at 25◦C and pH 5-6…………………………………….82
Fig. 7.1. X-ray diffraction pattern of laterite samples/ Clay fraction………………………..……….100
Fig. 7.2. Electron micrograph of < 2 µm fraction of TRP-Ai………………………………...……...101
Fig. 7.3. Results of differential thermal analysis and thermogravimetric analysis……………..……102
Fig. 7.4. Surface charge diagrams of laterite samples and volcanic ash………………………….….103
Fig 7. 5. Effect of contact time on metal adsorption by laterite and volcanic samples…………...…105
Fig.7.6. Effects of adsorbent dose on metal adsorption by laterite and volcanic samples………..….106
Fig.7.7. Langmuir isotherm of metal adsorption by laterite and volcanic ash samples…………...…108
Fig.7.8. Freundlich isotherm metal adsorption by laterite and volcanic ash samples…………….….109
Fig. 7.9. Effect of pH on metal adsorption by laterite and volcanic ash samples……………………111

viii
LIST OF TABLES
_____________________________________________________________________
Table 3.1. Source of soil and clay samples……………………………………………………………32
Table 3.2. Approximate mineral contents of clay samples………………………………………..…..35
Table 3.3. Colloidal properties of clay samples………………………………………………….……36
Table 4.1. Source of soil and clay samples…………………………………………………………....46
Table 4.2. Colloidal properties of clay samples…………………………………………………….…47
Table 5.1. Source of soil and clay samples……………………………………………………………58
Table 5.2. Some physic-chemical characteristics of laterite samples…………………………………62
Table.5.3. Mineralogy identification of laterite samples………………………………………...……63
Table 5.4. Colloidal properties of clay samples………………………………………………….……64
Table 6.1. Some physic-chemical characteristics of laterite samples……………………………..…..73
Table 6.2. Mineralogy identification of laterite samples………………………………………..…….78
Table 6.3. Estimated isotherm parameters for phosphate adsorption…………………………………79
Table 6.4. Phosphorous adsorption capacities of different materials…………………………...…….80
Table 6.5. Amount of Phosphorus adsorbed (mmol kg-1) in mixed solution of ions………………….82
Table 7.1. Some physic-chemical characteristics of laterite samples…………………………………93
Table 7.2. Mineralogy and characteristics of Hawaii soil…………………………………………….94
Table 7.3. Amount (mL) of acid, base, ionic strength salt and distilled water necessary to establish a
50 mL aliquot consisting of a sequential pH change while maintaining an ionic strength of 0.005, 0.01
and 0.05M. ………………………………………………………………………………………..….96
Table 7.4.Volume (mL) of acid and base added to adjust pH…………………………………….…..98
Table 7.5. Mineralogy identification of laterite samples………………………………………….....104
Table 7.6. Chemical composition (%) of laterite and volcanic ash samples (XRF analysis)……..…104
Table 7.7. Values of Langmuir and Freundlich isotherm constants for the adsorption of heavy metal
ions on materials……………………………………………………………………………………..110
Table 7.8.Optimum pHs for metal adsorption on to laterite and volcanic ash materials……….....…112
1
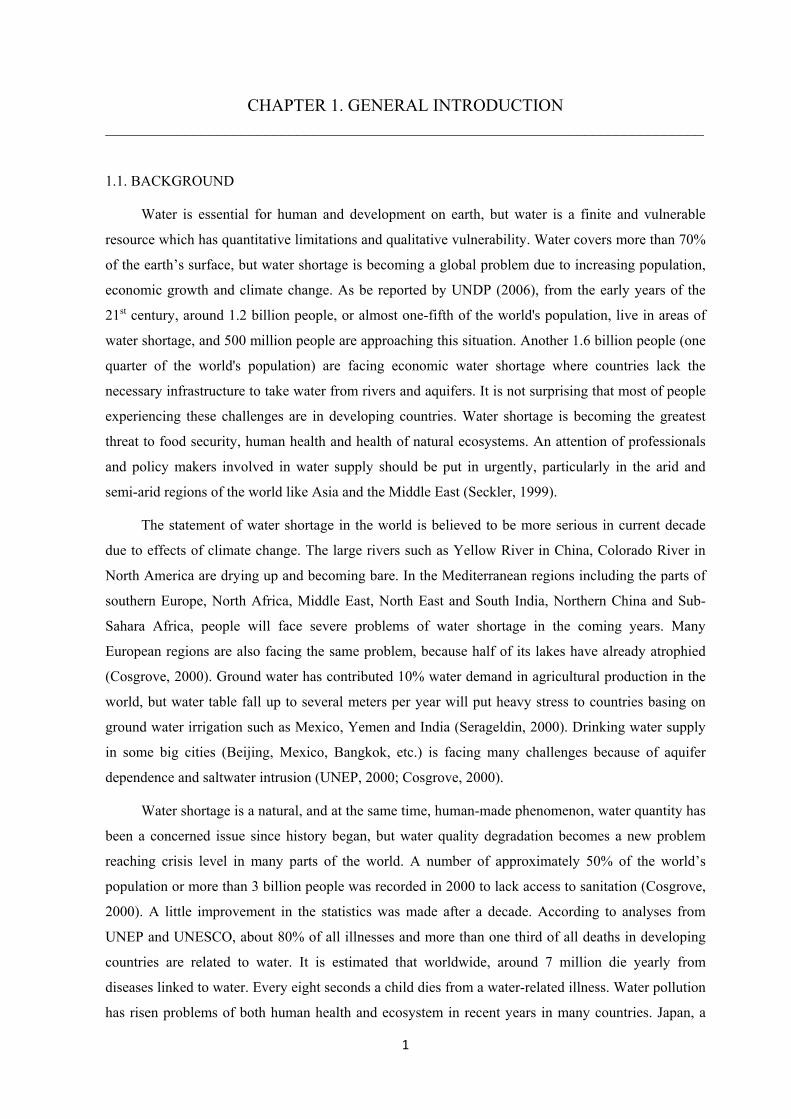
CHAPTER 1. GENERAL INTRODUCTION ___________________________________________________________________________
1.1. BACKGROUND
Water is essential for human and development on earth, but water is a finite and vulnerable
resource which has quantitative limitations and qualitative vulnerability. Water covers more than 70%
of the earth’s surface, but water shortage is becoming a global problem due to increasing population,
economic growth and climate change. As be reported by UNDP (2006), from the early years of the
21st century, around 1.2 billion people, or almost one-fifth of the world's population, live in areas of
water shortage, and 500 million people are approaching this situation. Another 1.6 billion people (one
quarter of the world's population) are facing economic water shortage where countries lack the
necessary infrastructure to take water from rivers and aquifers. It is not surprising that most of people
experiencing these challenges are in developing countries. Water shortage is becoming the greatest
threat to food security, human health and health of natural ecosystems. An attention of professionals
and policy makers involved in water supply should be put in urgently, particularly in the arid and
semi-arid regions of the world like Asia and the Middle East (Seckler, 1999).
The statement of water shortage in the world is believed to be more serious in current decade
due to effects of climate change. The large rivers such as Yellow River in China, Colorado River in
North America are drying up and becoming bare. In the Mediterranean regions including the parts of
southern Europe, North Africa, Middle East, North East and South India, Northern China and Sub-
Sahara Africa, people will face severe problems of water shortage in the coming years. Many
European regions are also facing the same problem, because half of its lakes have already atrophied
(Cosgrove, 2000). Ground water has contributed 10% water demand in agricultural production in the
world, but water table fall up to several meters per year will put heavy stress to countries basing on
ground water irrigation such as Mexico, Yemen and India (Serageldin, 2000). Drinking water supply
in some big cities (Beijing, Mexico, Bangkok, etc.) is facing many challenges because of aquifer
dependence and saltwater intrusion (UNEP, 2000; Cosgrove, 2000).
Water shortage is a natural, and at the same time, human-made phenomenon, water quantity has
been a concerned issue since history began, but water quality degradation becomes a new problem
reaching crisis level in many parts of the world. A number of approximately 50% of the world’s
population or more than 3 billion people was recorded in 2000 to lack access to sanitation (Cosgrove,
2000). A little improvement in the statistics was made after a decade. According to analyses from
UNEP and UNESCO, about 80% of all illnesses and more than one third of all deaths in developing
countries are related to water. It is estimated that worldwide, around 7 million die yearly from
diseases linked to water. Every eight seconds a child dies from a water-related illness. Water pollution
has risen problems of both human health and ecosystem in recent years in many countries. Japan, a

2
developed country in the world, has been well known by their industry development and economic
growth. Though Japan is ranked in the top country group with safe environment at present, they have
experienced a terrible unforgettable past that engraved in their mind with diseases brought about by
cadmium and mercury pollution of water which are called “Minamata and itai-itai diseases”.
Alzheimer’s disease caused by aluminum accumulation in human brain is not strange for people.
Alzheimer's disease has no survivors. It destroys brain cells and causes memory changes, erratic
behaviors and loss of body functions. Alzheimer’s disease affects at least 4 million people in the
United States and probably over 11 million more world-wide, chiefly in the developed countries.
Arsenic contamination in groundwater is a major problem threatening to environment,
ecosystem and human health. Historical arsenic contamination exists in Cornwall in UK, and an
example of a recent arsenic pollution is that of Ron Phibun town in southern Thailand, Guizhou
Province of China where arsenic-related human health effects have been reported. Bangladesh, a
developing country in Asia, now is facing the serious problem of arsenic contamination. Arsenic is
detected to be present in large quantities in the shallow tube-well water of many districts in rural and
small urban areas of Bangladesh. Within two decades, especially the northern areas, many people
have been found to be affected by arsenic toxicity because of drinking tube-well waters were
contaminated with arsenic. Some new publications summarized that more than 90 % of the shallow
tube-wells have been found to contaminate arsenic at concentrations exceeding 0.05 mg L-1 and more
than 7000 arsenicosls patients have been identified in arsenic affected areas in Bangladesh. The
arsenic disease is very dangerous. According to a study in 1999 by the National Academy of Sciences,
arsenic in drinking water causes bladder, lung and skin cancer, and may cause kidney and liver cancer.
The study also found that arsenic harms the central and peripheral nervous systems, as well as heart
and blood vessels, and causes serious skin problems. It also may cause birth defects and reproductive
problems.
A large load of contaminants from effluent of industry, drained water of agriculture and
municipal sources discharging directly into the water bodies is a major reason of water pollution
worldwide. Nitrogen and phosphorous contamination in surface water causes eutrophication in the
lakes, rivers and aquaculture ponds which damages aquatic ecosystem and biodiversity. In addition to
biological problems, eutrophication also poses effects on peoples’ health and livelihoods. Excess
nutrients can directly and indirectly lead to a decline in drinking water quality. Besides that, treatment
cost of water contaminated nutrient elements is also raised to high level because the costs of advanced
equipments are needed. Unfortunately, nutrient water contamination exists as a big problem in almost
of countries and puts a high pressure on control and mitigation methods. We should look at the case of
Gulf of Mexico as a specific example of economical losses and environmental impacts due to
eutrophication. The Gulf of Mexico is a zone with area varies between 6,000 and 7,000 square miles
is used to store drained water for all the major rivers and tributaries in the Midwestern United States

3
of which have run way through farm lands. Now, it becomes a “dead zone” because the bloom of
algae exhausted dissolved oxygen in water and aquatic organism cannot exist due to lack of oxygen.
Development of new treatment technology and conservation solution of water resource has been
an important task for every country, particularly, in the context of global climate change and
increasing pollution. The use of conventional chemicals such as poly aluminum chloride and poly
acrylamide is effective in reducing turbidity of water, but it has several environmental consequences
(Nakanishi and Wada, 2007) (i) an increase in metal concentration in water; (ii) production of large
volumes of (toxic) sludge; (iii) dispersion of acrylamide oligomers which may also be a health hazard.
The more advanced agents that are environment-friendly and highly efficient (charcoal, granule active
carbon-GAC, biopolymers, etc,.), are known. However, the cost for treatment is high and not suitable
for the people getting low income. The local materials such as chitosan, rice husk, straw, moringa
seed are low cost adsorbents and work well in removal of contaminants, but the use at high dose may
increase biological oxygen demand in water (Tripathy and De Ranjan, 2006, Gupta et al., 2011). The
clay minerals and lime stones could not get expected treatment efficiency, but they bring safe for
environment and save treatment cost (Babel and Kurniawan, 2002, Gupta et al., 2011). In search for
materials that may exhibit higher treatment efficiency, I noticed some volcanic ash soils and laterite
fulfill most of the requirement if they are slightly modified. Volcanic ash soils and laterites are natural
materials which are available in Japan and Viet Nam. In order to investigate their possibility in
contaminated water treatment, the present study was carried out.
1.2 MOTIVATION
The suspended particles causing turbidity in water can be removed by using flocculants while
the removal of heavy metals needs adsorbents. Volcanic ash soils and laterites consist of aluminum
and iron bearing minerals which function as both flocculant and adsorbent to remove suspended clay
particles, anions and cations from water. Therefore, these materials are used for primary tests at
laboratory scale aiming to investigate their ability of water purification. The results from the present
study will contribute to develop new trend in water treatment technology and to find new materials
that may be applicable to water filtration process in Viet Nam where sand and gravel are
conventionally used.
1.3. OBJECTIVES
The present study aims to:
i) To give the answer why a flocculant made from volcanic ash soil exhibit different efficiency in
the removal of turbidity for waters from different construction sites in Japan, the study focuses on the
effects of mineralogy of suspended particles that cause turbidity.

4
ii) To investigate flocculation behavior of allophane and imogolite in the removal of suspended
particles, the study compares allophane and imogolite sols as flocculating agents for suspended clay
particles.
iii) To find the ability of laterite from Viet Nam in removal of suspended particles from water,
flocculation experiments at laboratory scale are conducted with clay suspensions and some laterite
samples.
iv) To investigate anion adsorption capacity and kinetics of volcanic ash soil and laterite,
phosphorous adsorption experiments are conducted on these materials
v) To characterize heavy metals adsorption capacity and kinetics of volcanic ash soil and laterite,
adsorption experiments of copper, lead and cadmium absorption onto these materials are conducted.
1.4. THESIS OUTLINE
A general introduction on the research is presented in chapter 1. The literature review is
presented in chapter 2. This chapter lists conventional water treatment methods with description about
mechanism, their advantages and disadvantages. The natural materials applied for water treatment is
also presented in this chapter. Chapter 3 presents mineralogy effects of suspended particles on
flocculation performance of volcanic ash soil flocculant. The content of the chapter 3 was published
in the journal of Clay Science volume 16, number 1 on June, 2012. Chapter 4 shows the power of
allophane and imogolite sols in flocculation clay suspensions. This chapter was also published in the
journal of Clay Science volume 16, number 3 on September, 2012. Chapter 5 presents mineralogy of
laterite from Viet Nam and their performance as flocculating agents to remove suspended clay
particles from water. This content was published in the Journal of Faculty of Agriculture, Kyushu
University, volume 58, number 1 on February, 2013. Chapter 6 describes the removal of phosphorous
in water using laterite from Viet Nam. And the removal of heavy metals by volcanic ash and laterite is
presented in the chapter 7. The last chapter is devoted to general discussion on the ability of volcanic
ash and laterite in water treatment.
REFERENCE
Cosgrove, J. and Rijsberman, F. R., 2000. World Water Vision: Making Water Everybody’s Business.
Earthscan, UK. http://www.watervision.org.
Human Development Report, UNDP, 2006.
Gupta, S. S., Krishna, A., Bhattacharyya, G., 2011. Kinetics of adsorption of metal ions on inorganic
materials: A review. J. Advances in Colloid and Interface Science., 162, 39-58.
Nakanishi, R and Wada, S -I., 2007. Reactivity with phosphate and phytotoxicity of
hydroxyaluminosilicate ions synthesized by instantaneous mixing of aluminum chloride and
sodium orthosilicate solutions. Soil Sci. Plant Nutr., 53, 545-550.

5
Sandhya, B., Tonni, A. K., 2003. Low-cost adsorbents for heavy metals uptake from contaminated
water: a review. J. Hazardous Materials., B97, 219-243.
Seckler, D., Molden, D. and Barker, R., 1999. Water Scarcity in the Twenty-First Century,
International Water Management Institute. www.cgiar.org/iwmi/WB1Cover.htm.
Tripathy, T. and Deranjan, B., 2006. Flocculation: A new way to treat the waste water. J.Physical
Sciences., 10, 93-127.
UNEP., 2002. Fresh water Resources. www.unep.org/vitalwater.
UNESCO., 2003. The UN World Water Development Report: Water for people, Water for life.
www.unesco.org/water/wwap/index.shtml.

6
CHAPTER 2. LITERATURE REVIEW __________________________________________________________________________________
2.1 CONVENTIONAL WATER TREATMENT METHODS
Until now, conventional technologies including key steps of coagulation, flocculation,
sedimentation, and rapid gravity sand filtration have greatly contributed to water quality improvement.
These are well-proven technologies for the removal of suspended solid matter, bacteria, and other
microorganisms. Iron, manganese, tastes and odors may also be removed from the water by these
processes.
2.1.1 Coagulation and flocculation process
The particles existing in water would settle down on their own if enough time is given.-But
settling may take time of days or months due to small particle size and to electrostatic repulsion
between the particles as well as to Brownian motion. Most particles existing in water have negative
charges, so they tend to repel each other. In order to remove suspended particles from water
effectively, coagulation/flocculation process is recommended to apply.
Coagulation is a treatment process that includes chemical addition, rapid mixing, and
flocculation. Coagulation is often the first unit operation in water treatment and it is very crucial for
the removal of suspended particles. Coagulation and flocculation processes are intended to form
particles large enough to be separated and removed by subsequent sedimentation or neutralization the
charges on the colloidal particles in the raw water. Destabilizing stable colloidal particles in the
suspension is essential. In most cases, coagulation is optimized for the removal of inorganic colloidal
particles. It is also used for the removal of natural organic matter by the process of enhanced
coagulation (Gregor et al., 1997). In natural waters, colloids are predominantly negatively charged
and they are stable by virtue of the hydration and electric charges on their surfaces. Coagulation can
remove colloidal particles and natural organic matter in water by three mechanisms:
i) Colloidal destabilization, accomplishment by electrical double layer compression, charge
neutralization, enmeshment, or bridging;
ii) Precipitation;
iii) Co-precipitation (sweep flocculation), primarily by occlusion or surface adsorption but
conceivably by no isomorphic inclusion. Rapid, high energy mixing (for example mechanical mixers,
inline blenders, jet spurge mixing) is necessary to ensure that the coagulant is fully mixed into the
process flow to maximize its effectiveness. The coagulation process occurs very quickly, probably in
a second or minute. Poor mixing can result in poorly developed flocs.
Flocculation is a process following coagulation, allows smaller particles formed during the
rapid coagulation stage to agglomerate into larger particles that are settleable and/or filterable floc
particles. After coagulant addition, a process of slow mixing of 10-30 minutes is conducted. The

7
optimum flocculation time will vary depending on the raw water quality and downstream clarification
process. Gentle mixing conducted in this stage makes small particles contact together to form larger
flocs. Effectiveness of flocculation depends on the delay (or contact) time and mixing clarification
processes. Coagulation process is summarized in Fig 2.1.
Fig.2.1.Coagulation process as be theoretically described
(Source: http://water.me.vccs.edu/courses/env110/lesson4.htm)
2.1.1.1 The chemistry of coagulation and flocculation
The coagulation and flocculation is primarily to electrostatic interactions, i. e., the attraction and
repulsion among negatively or positively charged particles. Like charges (two negatively charged
particles or two positively charged particles) repel each other while opposite charges (a positively
charged particle and a negatively charged particle) attract each other.
Most particles suspended in natural waters have negative charges, so they tend to repel each other. As
a result, they stay dispersed to form stable colloidal aqueous suspensions.
Fig. 2.2.Negatively charged particles repel each other due to electrostatic repulsion.

8
The purpose of addition of coagulant chemicals is to neutralize the negative charges on the
particles to reduce electric repulsion. The amount of coagulant which should be added to the water
depends on the zeta potential, a measure of the electrical potential at a shear plane around charged
particles. If the zeta potential is large, more coagulant is needed. Coagulants having positive charge
isadded it is attracted to the negative charges on the particles as shown below.
Fig. 2.3. Positively charged coagulants attract to negatively
charged particles due to electricity.
The associationof positive and negative charges results in charge neutralization, and the
particles no longer repel each other. The next force which will affect the particles is known as van der
Waal forces. This is the molecular force that occur when moleculeshavingno charge come to close
contact.
Fig. 2.4. Neutral particles attract due to van der Waal forces.
Van der Waal forces make the particles adhered each other to form agglomerates. When enough
particles have attachedtogether, they become flocs and will settle down. The removal of particulate
contaminants from water will be achievedby filtration. The following picture schematically illustrates
thestructure of a floc made in flocculation process (Fig. 2.1)

9
Fig. 2.5. Particles and coagulants associate together to form flocs.
.
Fig.2.6. An Example of water sample treated by flocculation/coagulation process.
(Source: http://www.et.byu.edu/~wanderto/homealgaeproject/Harvesting%20Algae.html)
2.1.1.2 Coagulants and flocculants
Coagulants are chemicals that destabilize suspended particles (particularly colloidal sized
particles). Hydrolyzing metal ions, e. g., aluminum or iron, are widely used as coagulants in water
treatment. The high cationic charge makes them effective for destabilizing colloids. When coagulants
are added into water, destabilization of colloids occurs due to adsorption, charge neutralization or
particle entrapment (Duan and Gregory, 2003).
Flocculants (also known as flocculant aids or coagulant aids) assist the agglomerating and
enmeshing particles together. When flocculants are added, particles increase in the size, strength and
settling ability. Flocculants may be cationic, anionic, or non-ionic. They are produced from materials
having varying degrees of ionizing tendency and a wide range of molecular weight.
Although flocculants and coagulants are effectively and widely used in water treatment, their
drawbacks are big problems for applications. Using flocculant aids may change pH of the water,
increase soluble residues, volume and metal content of the sludge. Besides aluminum- and iron-based

10
coagulants, organic chemicals known as poly electrolytes may also be used as coagulant or flocculant
aids to reduce turbidity of water. Pre-hydrolysed forms of metals such as polyaluminum chloride and
poly iron sulfate are good examples. In some cases, organic chemicals are more effective, produce
strong flocs and result in less sludge volume (Duan and Gregory, 2003) compared with aluminum and
iron salts.
2.1.1.3 Factors affecting coagulation and flocculation process
The coagulation/flocculation process is affected by pH, salts, alkalinity, turbidity, temperature,
mixing, and coagulant chemicals.
The effectiveness of a coagulant is generally pH dependent. Colored waters are better treated at low
pH (4.4-6) with aluminum.
Alkalinity is needed to form in soluble compounds to precipitate them out. It could be naturally
present in the water or needed to be added as hydroxides, carbonates, or bicarbonates.
The higher temperature, the faster reaction, and the coagulation are more effective.
Time is an important factor as well. Proper mixing and detention times are very important for
coagulation.
The higher velocity causes the shearing or breaking of floc particles and lower velocity will let them
settle in the flocculation basins. Velocity around 1 ft/sec in the flocculation basins should be
maintained.
Zeta potential is the charge at the boundary of the colloidal turbidity particle and the surrounding
water. The higher zeta potential creates higher repulsion between particles; as a result, higher zeta
potential requires the higher coagulant dose. An effective coagulation may obtain at zeta potential
reduced nearly zero.
2.1.2 Gravity filtration
Rapid gravity filtration follows processes of coagulation, flocculation and sedimentation. Solid
particles are separated from liquid solution by mixing with bed materials. Sand is common traditional
material to keep suspended particles. As water passes through a bed filter media, matter (including
micro-organisms) is trapped within the media by a two-step process in which particles are moved to
the surfaces of media grains or captured flocs, and then become attached (adsorbed) to these surfaces.
Mechanical straining and adsorption are factors of successful filtration through media. By mechanical
straining, granular filters can remove particles that are much smaller than the dimensions of the
interstices between their grains. A granular filter is able to capture very fine particles, even in the
absence of particles with large size to bridge the interstices. Adsorption is a process in which the
efficiency depends on the surface properties of both adsorbents and small particles. Small particles in
close proximity to a solid surface are subjected to either electrical attraction or repulsion and also
subjected to the hydraulic forces resulting from the movement of water.

11
2.2 REMEDIATION TECHNOLOGY FOR HEAVY METALS CONTAMINATEDWATER
In order to reduce water pollution and remedy heavy metals polluted water, great efforts for
technological and technical development of treatment have been made during the past decades.
2.2.1 Chemical precipitation
The process involves the transformation of dissolved contaminants into insoluble solids, and
then contaminants are subsequently removed from liquid phase by physical methods, such as
clarification and filtration (NEESA, 1993; Nomanbhay and Palanisamy, 2005). In a precipitation
process, chemical precipitants (also known as coagulants and flocculants) are used to increase particle
size through aggregation. Treatment efficiency depends on pH and alkalinity of the water. As
conventional treatment methods, heavy metals in water are precipitated by adding sodium hydroxide
or lime during neutralization. However, complete hydroxide precipitation does not take place
especially in the presence of complexing agents (NEESA, 1993; EPA, 2000; Xu and Xu, 2008).
Chemical treatment of contaminated groundwater to remove heavy metals has been performed
in column and pilot scale experiments. Granulated lime and calcium carbonate were used as
coagulants (Lee et al., 2007). Furthermore, some investigators have developed and selectively used
1,3-benzenedaimidoethathiol to irreversibly bind soft heavy metals in aqueous solution. In the study
of Matlock et al. (2002), the chemical compound named Metx was found to remove over 90% of
several toxic heavy metals from acid mine drainage samples. In South Africa, acid mine water from
gold mine has been treated by the precipitation of heavy metals with lime and sulfides, followed by
ion exchange. The oxidation and precipitation of heavy metals with lime and subsequent sulfide-
carrier magnetite was observed to be particularly suitable for the removal of heavy metal ions from
the effluent of gold mine (Feng et al., 2000). Despite their simplicity, they are not recommended for
use since they release toxic hydrogen sulfide when pH is acidic, hence causing great hazards in case
of accidental release or over-dosages. The best suggested alternative to the traditional sulfide
treatment is the dithiocarbonate precipitation (METALSORB, 2004).
Chemical precipitation of metals has advantages: convenience, self-operation, and low
maintenance cost. However, the following disadvantages are still observed in practicing this
technique:
- The precipitates are in the form of light tiny flocs requiring an extra coagulation/flocculation.
- Large volumes of sludge are generated, inducing additional waste-disposal costs. The addition of
treatment chemicals may increase the waste sludge up to 50% (EPA, 2000).
- Regulation requirements are not always met using hydroxide and carbonate precipitation alone.
Each dissolved metal has its own distinct pH level for maximum hydroxide precipitation.

12
- Corrosive chemicals are used during process; thereby increase safety concerns (EPA, 2000;
METALSORB, 2004).
2.2.2 Ion exchange
Ion exchange is a reversible chemical reaction where metal ions from aqueous solution are
attached to charged particles. Normally, hydrocarbon derived from polymer resins is used as agents
(Vaca et al., 2001; Volesky et al., 2003). The authors reported that it successfully removed lead,
cadmium and chromium by ion exchange operation with clinoptilolite. Their study revealed effective
removal of dissolved lead and cadmium removed within 18 h in batch reactors, with higher removal
efficiencies that was greater than 95% in the acidic pH range.
2.2.3 Reverse osmosis
Reverse osmosis is membrane treatment process that use membrane as a molecular filter to
remove almost all of solutes. In this process, water molecular is passed through membrane while ionic
contaminants are inhibited to pass through. In comparison with conventional methods, this method
displays more significant advantages in removal of ionic and dissolved organic molecular
contaminants (Volesky et al., 2003; Pawlak et al., 2005). The reserve osmosis has been applied to
treat heavy metals in both small and large scale installations. However, high cost and complexity of
operation are disadvantages in using this technology.
2.2.4 Phytoremediation
Phytoremediation, is called green remediation in other word, is a remediation process that use
plants to remedy surface waters, waste waters, ground waters, soils and sediments that are
contaminated by some types of substances. The functions of plants (e.g. adsorption at root zone,
accumulation by shoot and up take by left) are involved in removal of contaminants. This method is
known to be cost effective and have fewer negative effects than physical and chemical approaches;
therefore, it has gained increasing popularity in both academic and practical sites. Studies have
demonstrated that plants such as Brassica juncea, Salsola kali, and Prosopis species cultivated in
hydroponics and agar are able to uptake significant amounts of heavy metals, suggesting possible
utilization in phytoremediation processes.
Researchers have also realized that phytoextraction can be used for the recovery of precious
metals such as gold, silver, platinum, and palladium (Gardea et al., 2005). In addition,
phytoremediation of heavy metals contaminated waters by using aquatic macro phytes have been
investigated in recent years (Kumar, 2008). Their study used roots, stems and leaves of seven
representative species of native aquatic plants (biomonitors): Ipomoea aquatica, Eichhorniacrassipes,
Typhaangustata, Echinochloacolonum, Hydrillaverticillata, Nelumbonucifera and
VallisneriaspiralisL to uptake heavy metals. The results showed that cadmium and lead fall within

13
normal range while that of cobalt and nickel were within the critical range. However, zinc and copper
showed the highest accumulation at alarming toxicity levels (Kumar et al, 2008).
Phytoremediation has advantages such as economical cost, ability to remedy more than one
contaminant in one site, but its disadvantages are dependence on region climatic condition that affects
growth and tolerance of plants as well as requirement for long time to purify the contaminants.
2.2.5 Microbial remediation
Microbial bioremediation is defined as the process by which microorganisms are stimulated to
rapidly degrade hazardous organic contaminants. Microbes decompose poisonous chemicals by using
enzymes to convert one chemical into another form and taking energy or utilizable matter from this
process. The chemical transformations generally involve breaking of large molecules into several
small molecules in simpler forms. Studies on the interactions of microorganisms with heavy metals
are gaining increasing interest in recent years. Some of these studies have indicated different metal
resistance mechanisms, interactions and processes of bacteria, protozoa and fungi. The bio-sorbents
was reported to be quite effective for the removal of metal ions from contaminated solution in low
cost and environmental friendly manner (Rani et al., 2009). Metals were removed by biosorption onto
microbial biofilm and recovered from biofilm so that the biofilm may be reused in multiple cycles
(Hutchins et al., 1986; Costley and Wallis, 2001). The study carried out by Sharma et al. (2000)
revealed that Klebsiella pneumoniae had potential ability to bioaccumulate heavy metals at high
concentrations (15 mM), showing the potential of this bacterium for remediation of heavy metals
contaminated environment. Also, the survival of Euplotesmutabilis (a ciliate protozoa) in industrial
wastewater containing high concentrations of heavy metals (cadmium, lead copper and chromium)
was shown by Rehman et al. (2008).
Similarly, the remediation of aqueous lead and cadmium ions by the fungus
Fusariumoxysporum was investigated by Sanyal et al. (2005). The use of immobilized non-living
algae biomass (bioresins) for the stripping of metals from solution was also studied (Brown, 1996). In
the result, bioresins derived from one biomass type were found to be highly effective in binding
copper, nickel and lead ions in water.
Although the advantages of microbial remediation including low-cost, required moderate capital
investment, environmental safety due to natural process have been investigated, the application of
this technology is limited to biodegradable compounds. Not all compounds are susceptible to rapid
and complete degradation. There are some concerns that the products of biodegradation may be more
persistent or toxic than the primary compound. The success is dependent on the presence of
metabolically capable microbial populations, suitable environmental growth conditions, and
appropriate levels of nutrients and contaminants.

14
2.3 ADSORPTION THEORY AND ENVIRONMENTAL APPLICATIONS
When adsorbate contacts with adsorbent, adsorption takes place. Adsorption is a process that
occur when a gas or liquid solute accumulates on the surface of a solid or a liquid adsorbent to form a
molecular or atomic film (the adsorbate). A reverse process of adsorption is desorption which is
defined as substances diffuse into solution.
2.3.1 Mechanism of Adsorption
Adsorption arises due to the fact that the surface atoms of the adsorbent are not in the same
environment as the atoms inside the bulk. Inside the adsorbent all the forces acting between the atoms
are balanced but on the surface the atoms are not surrounded by atoms or molecules on all sides, and
hence they possess unbalanced or residual attractive forces. These forces of the adsorbent are
responsible for attracting the adsorbate particles on its surface. The extent of adsorption increases with
the increase of surface area per unit mass of the adsorbent at a given temperature and pressure.
Another important factor featuring adsorption is the heat of adsorption. During adsorption, there
is always a decrease in residual forces of the surface, i.e., there is decrease in surface energy which
appears as heat. Adsorption, therefore, is invariably an exothermic process. In other words, ΔH
(enthalpy change) of adsorption is always negative. When a gaseous atom or molecule is adsorbed, its
freedom movement becomes restricted. This amount to decrease in the entropy change of the gas after
adsorption, i.e., ΔS is negative. Adsorption is thus accompanied by decrease in enthalpy as well as
decrease in entropy of the system. For a process to be spontaneous, the thermodynamic requirement is
that, at constant temperature and pressure, ΔG (decrease in Gibbs free energy) must be negative, i.e.,
there is a decrease in Gibbs free energy. On the basis of equation, ΔG = ΔH – TΔS, ΔG can be
negative if ΔH has sufficiently high negative value as –TΔS is positive. Thus, in an adsorption process,
which is spontaneous, a combination of these two factors makes ΔG negative. As the adsorption
proceeds ΔH becomes less negative ultimately ΔH becomes equal to TΔS and ΔG becomes zero. At
this state, equilibrium is attained.
There are mainly two types of adsorption of gases on solids. If accumulation of gas on the
surface of a solid occurs on account of weak van der Waals forces, the adsorption is termed as
physical adsorption or physisorption. When the gas molecules or atoms are held to the solid surface
by chemical bonds, the adsorption is termed chemical adsorption or chemisorption. The chemical
bonds may be covalent or ionic in nature. Chemisorption involves a high energy of activation and is,
therefore, often referred to as activated adsorption. Sometimes these two processes occur
simultaneously and it is not easy to ascertain the type of adsorption. A physical adsorption at low
temperature may pass into chemisorption as the temperature is increased. For example, dehydrogenate
is first adsorbed on nickel by vander Waals forces. Molecules of hydrogen then dissociate to form

15
hydrogen atoms which are held on the surface by chemisorption. Some of the important
characteristics of both types of adsorption are described below:
(i) Lack of specificity: A given surface of an adsorbent does not show any preference for a particular
gas as the van der Waals forces are universal.
(ii) Nature of adsorbate: The amount of gas adsorbed by a solid depends on the nature of gas. In
general, easily liquefiable gases (i.e., with higher critical temperatures) are readily adsorbed as van
der Waals forces are stronger near the critical temperatures. Thus, 1 g of activated charcoal adsorbs
more sulfur dioxide (critical temperature 630K), than methane (critical temperature 190K) which is
still more than 4.5 mL of dihydrogen (critical temperature 33K).
(iii) Reversible nature: Physical adsorption of a gas by a solid is generally reversible. Thus,
Solid + Gas/ Gas/Solid + Heat
More gas is adsorbed when pressure is increased and the volume of the gas decreases (the Le–
Chateliers’s principle) and the gas can be removed by decreasing pressure. Since the adsorption
process is exothermic, the physical adsorption occurs readily at low temperature and decreases with
increasing temperature (the Le-Chatelier’s principle).
(iv) Surface area of adsorbent: The extent of adsorption increases with the increase of surface area of
the adsorbent. Thus, finely divided metals and porous substances having large surface areas are good
adsorbents.
(v) Enthalpy of adsorption: No doubt, physical adsorption is an exothermic process but its enthalpy of
adsorption is quite low (20 - 40 kJ mol-1). This is because the attraction between gas molecules and
solid surface is only due to weak van der Waals forces.
2.3.2 Characteristics of chemisorption
(i) High specificity: Chemisorption is highly specific and it will only occur if there is some
possibility of chemical bonding between adsorbent and adsorbate. For example, oxygen is adsorbed
on metals by virtue of oxide formation and hydrogen is absorbed by transition metals due to hydride
formation.
(ii) Irreversibility: As chemisorption involves compound formation, it is usually irreversible in
nature. Chemisorption is also an exothermic process but the process is very slow at low temperatures
on account of high energy of activation. Like most chemical changes, adsorption often increases with
rise of temperature. Physisorption of a gas adsorbed at low temperature may change into
chemisorption at a high temperature. Usually high pressure is also favorable for chemisorption.
(iii) Surface area: Like physical adsorption, chemisorption also increases with increase of
surface area of the adsorbent.
(iv) Enthalpy of adsorption: Enthalpy of chemisorption is high (80-240 kJ mol-1) as it involves
chemical bond formation.

16
Adsorption is usually described through isotherms that determine the amount of adsorbate on
the adsorbent. From literature, several models describing process of adsorption, namely Freundlich
isotherm, Langmuir isotherm, BET isotherm, etc. are reported.
The Langmuir adsorption model is the most common model used to quantify the amount of
adsorbate adsorbed on an adsorbent as a function of partial pressure or concentration at a given
temperature.
The Langmuir isotherm is given below:
1
Where:
Y = concentration of pollutant adsorbed, mg/L
M = PAC concentration, mg/L
C = equilibrium concentration of pollutant, mg/L
a = constant (determined graphically)
b = constant (determined graphically)
Alternatively, the equation can be manipulated to linear form, as be shown below
x
To calculate "b" for the Langmuir isotherm:
b =
To calculate "a" for the Langmuir isotherm:
Slope =
The Freundlich equation is an adsorption isotherm, which is a curve relating the concentration
of a solute on the surface of an adsorbent, to the concentration of the solute in the liquid with which it
is in contact. There are basically two well established types of adsorption isotherm: the Freundlich
adsorption equation is modified from the Langmuir equation.
The Freundlich Adsorption Isotherm is mathematically expressed as
/
Or
/
where
x = mass of adsorbate
m = mass of adsorbent

17
p = Equilibriumpressure of adsorbate
C = Equilibrium concentration of adsorbate in solution.
K and 1/n are constants for a given adsorbate and adsorbent at a particular temperature.
Stephen Brunauer, Paul Emmet and Edward Teller published this theory in 1938. It is a theory for
multi-layerphysisorption and is of profound significance in the development of this field.
The Brunauer-Emmett-Teller (BET) equation is:
q =
/
where Cs= concentration at which all layers are filled and Kb = a coefficient
Its assumptions are:
Adsorbed molecules stay put
Enthalpy of adsorption is the same for any layer
Energy of adsorption is the same for layers other than the first
A new layer can start before another is finished.
2.4. NATURAL MATERIALS AND THEIR APPLICATIONS IN WATER TREATMENT
Contaminated water has ringed warning alarms for of environment degradation in the world
during the past decades. Water quality improvement plays an essential role in human life. Water
technology with treatment materials has been continuously studied and innovated and widely applied
for environment. Materials including traditional and advanced ones have obtained the increasing
interests of t scientists.
2.4.1 Plant origin coagulants
A number of effective coagulants have been proven from plant origin. Some of the common
coagulants include nirmali (Tripathi et al.,1976), M. oleifera (Olsen, 1987; Jahn, 1988), okra (Al-
Samawi and Shokrala, 1996), Cactus latifaira and Prosopis juliflora (Diaz et al., 1999), tannin from
valonia (Özacar and Sengil, 2000), apricot, peach kernel and beans (Jahn, 2001), and maize
(Raghuwanshi et al., 2002). Bhole (1995) compared 10 natural coagulants from plant seeds. The study
indicated that those from maize and rice had good coagulation efficiency when they were used as
primary coagulants or coagulant aid.
The seeds from M. oleifera have been shown to be one of the most effective as a primary
coagulant for water treatment. M. oleifera is a small plant, fast growing, drought resistant. Since the
early 1970’s a number of studies have been carried out to determine the effectiveness of its seeds for
the treatment of surface water (Olsen, 1987; Ghebremichael, 2004) using different extraction methods
for the active coagulant from M. oleifera. Utilizing artificially prepared turbid water and naturally
18
turbid raw waters, laboratory investigations have confirmed the seeds to be highly effective in the
removal of suspended solids from waters containing medium to high initial turbidities (Sutherland et
al., 1994). Pilot and full-scale plant trials carried out in Malawi water treatment works demonstrated
that the water treated by oleifera seeds may be similar in quality to that treated by aluminum sulfate
(Ghebremichael, 2004).
Chitosan, a natural coagulant from animal origin is also an effective coagulant (Pan et al., 1999;
Guibal et al., 2006). It has unique properties among biopolymers due to the presence of primary
amino groups and has characteristics of both coagulants and flocculants such as high cationic charge
density, long polymer chains, bridging of aggregates, and precipitation (in neutral or alkaline pH
conditions). It has also been used for the chelating of metal ions in near-neutral solution and the
complexation of anions in acidic solution (cationic properties due to amine protonation). Its
coagulation and flocculation properties can be used to treat particulate suspensions (organic or
inorganic) and also to treat dissolved organic materials. It has also been reported that chitosan
possesses antimicrobial properties (Chung et al., 2003).
By using natural coagulants, considerable savings in chemicals and sludge handling cost may be
achieved. Al-Samawi and Shokrala (1996) reported that 50 - 90% of alum requirement could be saved
when okra was used as a primary coagulant or coagulant aid. Apart from being less expensive, natural
coagulants produce readily biodegradable and less voluminous sludge. For example, sludge produced
from M. oleifera coagulated turbid water is only 20 - 30% of that of alum treated water (Narasiah et
al., 2002). The coagulation process in water treatment is complimented by filtration. The
successfulness of coagulation in most cases determines the performance of the filtration system,
which may be of a mono medium or dual media type.
2.4.2 Filtration media
Some of the locally available filter media that have been used in single or multimedia filtration
include crushed coconut shells, burned rice husk (Frankel, 1974),crushed apricot shell (Aksogan et al.,
2003), pumice (Ghebremichael, 2004) and palm leaves and shrimp shells (Aly et al., 2005).
Paramasivan et al. (1973) reported that high-grade bituminous coal, used in dual media filtration,
could be a good substitute for anthracite coal. In his study, Ghebremichael (2004) showed that pumice
obtained from Eritrea could be used as a dual filter media to give longer filter runs than a single
medium (sand) filter. In addition to these materials, another material that has not received much
attention and could be used for water treatment is volcanic ash.
Carboxyl methyl cellulose (CMC) (Petrov and Nenov, 2004; Barakat, 2008b),
diethylaminoethyl cellulose (Trivunac and Stevanovic, 2006), and polyethyleneimine (PEI) (Aroua et
al., 2007) were used as efficient water-soluble metal-binding polymers in combination with
ultrafiltration (UF) for selective removal of heavy metals from water. Barakat (2008b) investigated

19
the removal of Cu (II), Ni (II), and Cr (III) ions from synthetic wastewater solutions by using CMC
and polyethersulfon ultrafiltration membrane.
Ferella et al. (2007) examined the performance of surfactants enhanced ultrafiltration process
for removal of lead and arsenic by using cationic (dodecylamine) and anionic
(dodecylbenzenesulfonic acid) surfactants. The removal of lead ions was over 99%, while that for
arsenate ions was 19%, in both systems. Modified UF blend membranes based on cellulose acetate
(CA) with polyether ketone (Arthanareeswaran et al., 2007), sulfonatedpolyetherimide (SPEI)
(Nagendran et al.,2008) and polycarbonate (Vijayalakshmi et al., 2008) were recently tested for heavy
metals removal from water. It was found that CA/blend membranes displayed higher permeate flux
and lower rejection compared to pure CA membranes.
2.4.3 New adsorbents
Various low-cost adsorbents, derived from agricultural waste, industrial by-product, natural
material, or modified biopolymers, have been recently developed and applied to the removal of heavy
metals from metal-contaminated wastewater. In general, three main steps are involved in pollutant
sorption onto solid sorbent: (i) the transport of the pollutant from the bulk solution to the sorbent
surface; (ii) adsorption on the particle surface; and (iii) transport within the sorbent particle. Technical
applicability and cost-effectiveness are the key factors that play major roles in the selection of the
most suitable adsorbent to treat inorganic effluent.
Natural zeolites gained a significant interest, mainly due to their ion exchange capability.
Among the most frequently studied natural zeolites, clinoptilolite were shown to have high selectivity
for certain heavy metal ions such as Pb (II), Cd (II), Zn (II), and Cu (II). It was demonstrated that the
cation-exchange capability of clinoptilolite depends on the pre-treatment method and its ion exchange
ability (Babel and Kurniawan, 2003; Bose et al., 2002). The role of pH is very important for the
selective adsorption of different heavy metal ions onto zeolite (Basaldella et al., 2007; R´ıos et al.,
2008; Barakat, 2008a). Barakat reported that Cu (II) and Zn (II) were adsorbed at neutral and alkaline
pH. Cr (VI) was adsorbed at acidic pH while the adsorption of Mn (IV) was achieved at high alkaline
pH values. Nah et al. (2006) prepared synthetic zeolite magnetically modified with iron oxide (MMZ).
MMZ was showed high adsorption capacities for the Pb (II) ion and a good chemical resistance in a
wide pH range 5 - 11. The natural clay minerals can be modified with a polymeric material in a
manner that this significantly improves their capability to remove heavy metals from aqueous
solutions (Vengris et al., 2001; So¨ lenera et al., 2008; Abu-Eishah, 2008). Phosphate was calcined at
900ºC, nitric acidficated phosphate and zirconium phosphate have been employed as new adsorbents
for removal of heavy metals from aqueous solution (Aklil et al., 2004; Moufliha et al., 2005; Pan et
al., 2007).

20
Industrial by-products such as fly ash, waste iron, iron slags, hydrous titanium oxide, can be
chemically modified to enhance their removal performance for metal removal from wastewater. Lee
et al. (2004) studied green sands, another by-product from the iron foundry industry to remove Zn (II).
Feng et al. (2004) investigated Cu (II) and Pb (II) removal using iron slag Fly ashes were also
investigated as adsorbents for removal of toxic metals. Gupta et al. (2003) explored bagasse fly ash, a
solid waste from sugar industry, for Cd (II) and Ni (II) removal from synthetic solution at pH ranging
from 6.0 to 6.5. Alinnor (2007) used fly ash from coal-burning for removal of Cu (II) and Pb (II) ions.
Sawdust treated with 1,5-disodium hydrogen phosphate was used for adsorption of Cr (VI) at pH 2
(Uysaland Ar, 2007). Iron based sorbents such as ferrosorp plus (Fuhrman et al., 2008) and synthetic
nanocrystalline akaganeite (Deliyanni et al., 2007) were recently used for simultaneous removal of
heavy metals. Ghosh et al. (2003) and Barakat (2005) studied hydrous titanium oxide for adsorption
of Cr (VI) and Cu (II), respectively. Barakat reported that, the adsorbed Cu (II) aqueous species can
undergo surface hydrolysis reaction as pH rises. This yields a series of surface Cu (II) complexes such
as TiO–CuOH+, TiO–Cu(OH)2, and TiO–Cu(OH)3 species.
2.4.4 Modified agriculture and biological wastes (bio-sorption)
Recently, a great deal of interest in the research for the removal of heavy metals from industrial
effluent has been focused on the use of agricultural by-products as adsorbents. The use of agricultural
by-products in bioremediation of heavy metal ions is known as bio-sorption. This utilizes inactive
(non-living) microbial biomass to bind and concentrate heavy metals from waste streams by purely
physico-chemical pathways (mainly chelation and adsorption) of uptake (Igwe et al., 2005). New
resources such as hazelnut shell, rice husk, pecan shells, jackfruit, maize cob or husk can be used as
an adsorbent for heavy metal after chemical modification or conversion by heating into activated
carbon. Ajmal et al. (2000) employed orange peel for Ni (II) removal from simulated wastewater.
They found that the maximum metal removal occurred at pH 6.0. The applicability of coconut shell
charcoal (CSC) modified with oxidizing agents and/or chitosan for Cr (VI) removal was investigated
by Babel and Kurniawan (2004). Cu (II) and Zn (II) removal from real wastewater were studied using
pecan shells-activated carbon (Bansode et al., 2003) and potato peels charcoal (Amana et al., 2008).
Bishnoi et al. (2003) conducted a study on Cr (VI) removal by rice husk-activated carbon from an
aqueous solution. They found that the maximum metal removal by rice husk took place at pH 2.0.
Rice hull, containing cellulose, lignin, carbohydrate and silica, was investigated for Cr (VI) removal
from simulated solution (Tang et al., 2003). To enhance its metal removal, the adsorbent was
modified with ethylene diamine. The maximum Cr (VI) adsorption of 23.4 mg g-1 was reported to take
place at pH 2. Other type of biosorbents, such as the biomass of marine dried green algae (biological
materials) (Gupta et al., 2006), were investigated for uptaking of some heavy metals from aqueous
solution. Some of the used algae wastes were Spirogyra species (Gupta et al., 2006), Ecklonia
maxima (Fenga and Aldrich, 2004), Ulvalactuca (El-Sikaily et al., 2007), Oedogoniumsp and Nostoc

21
sp. (Gupta and Rastogi, 2008), and brown alga Fucusserratus (Ahmady-Asbchin et al., 2008). On the
whole, an acidic pH ranging 2-6 is effective for metal removal by adsorbents from biological wastes.
The mechanism of up-taking heavy metal ions can take place by metabolism-independent
metal-binding to the cell walls and external surfaces (Deliyanni et al., 2007). This involves adsorption
processes such as ionic, chemical and physical adsorption. A variety of ligands located on the fungal
walls are known to be involved in metal chelation. These include carboxyl, amine, hydroxyl,
phosphate and sulfhydryl groups. Metal ions could be absorbed by complexion with negatively
charged reaction sites on the cell surface.
2.4.5 Volcanic ash soil and its environmental applications
Volcanic ash is formed during explosive volcanic eruptions. It consists of very fine rock and
mineral particles less than 2 mm in diameter, and is rich in volcanic glass. The volcanic glass alters in
the soil formation process via incongruent dissolution to form non crystalline and poorly crystalline
aluminum silicate minerals: typically allophane and imogolite. Volcanic ash soils have been employed
for environment, water treatment and industry areas. The study of Fujita et al, 2003 indicated volcanic
ash soils adsorbed some pesticides. Allophane and imogolite bear positive charges that might attract
anions at the low pH. Phosphate anions are absorbed by allophone and imogolite at edge sites,
consequently, the phosphate was removed by using these minerals (Clark and Mcbride, 1984). Some
organic compounds, particularly organic acids, are adsorbed onto allophane surfaces via ligand
exchange (Parfitt et al. 1977) and up to 25% C is associated with allophanic soil clay fractions in
some volcanic ash soils (Parfitt and Henmi, 1982; Churchman and Tate, 1986). In contrast, positively
charged organic ions are adsorbed mainly by physical adsorption and occupy a part of the pore space
(Theng, 1972).
Natural and synthetic allophanes (Parfitt and Henmi, 1980; Clark and McBride, 1984) strongly
adsorbed phosphate in fairly large amounts ranging between 50 and 200 mmol g-l, equivalent to 2-8
phosphate ions per allophane spherule. Sulfate adsorption is strongly dependent on pH, the adsorbed
amount increased as the pH decreased from 7 to 4 (Bohn et al., 1986). Sulfate was absorbed by
displacing the H2O and OH groups at defect sites; the positive charge reduced and negative charge
increased (Rajan, 1979). The amount of sulfate adsorbed can be up to 9 times greater than the positive
charge measured by chloride adsorption at pH 5. Adsorption capacity of allophanic soils was
indicated to be100mmol S g-1inthe areas with high rainfall. Sulfate is probably added to the soil as
salts in rain water. In comparison with soils containing mainly vermiculite and micas, much less
sulfate was leached from allophanic soils (Bolan et al., 1988). Yujiarai et al. (2005) investigated
arsenate As (V) reactivity and surface speciation on amorphous aluminosilicate mineral (synthetic
allophane) by batch adsorption experiments. The adsorption isotherm indicated that As (V) uptake
increased with increasing As (V) concentration from 50 to 1000 µM .Suspended allophone-like

22
nanoparticles could contribute to the rapid transport processes (e.g., surface runoff and preferential
flow) of phosphate and As (V) in subsurface environments.
The ability of Andisols to adsorb heavy metals was demonstrated by Forbes (1976) and Abd-
Elfattah and Wada (1981). Cu and Co was specifically adsorbed on both allophane and imogolite
adsorption increased with increasing alumina content. The ESR spectra suggested that monomeric
Cu2+ adsorbed on an alumina-like surface sites where surface bonding occurred at a second site.
Distribution of Cu between these two surface sites is dependent on the SiO2/A12O3 ratio, pH, and
adsorbate concentration. The second site was probably a SiOH or A1OH group that bonded Cu (II)
with less energy by displacement of a single proton from the surface (Clark and Mc Bride, 1984).
2.4.6 Laterite and environmental applications
Laterites are highly weathered and altered residual soils formed by the in-situ weathering and
decomposition of rocks under tropical condition (Blight, 1997). Laterites are rich in sesquioxides
(Fe2O3 or Al2O3) and low in bases and primary silicates but may contain appreciable amounts of
quartz and kaolinite. Due to the presence of iron oxides lateritic soils are red in color ranging from
light through bright to brown shades. Laterite has been well known in Asian countries as a building
material for more than 1000 years. Besides, the material also has various applications in environment
remediation that has been reported in previous studies.
Udoeyo (2010) carried out batch experiments and investigated the possibility of lateric soil for
using as an adsorbent for heavy metals (Pd, Cu and As) in water. Laterite was a potential alternative
for removal of arsenic in groundwater (Maiji et al., 2006; Rahman, et al., 2008). His study estimated
the life-time of laterite as a column packing-adsorber. It worked for 70 days to achieve WHO safe
limitation (0.01 mg L-1) for water having initial arsenic concentration from 0 to30 mg L-1.. Avinash et
al, 2009 studied treatment of municipal wastewater in Mumbai, India using laterite-based constructed
soil filter. The results indicated increase of dissolved oxygen levels and reduction of chemical oxygen
demand (COD) from 135.4±79.4 to 28.8±19.5 mg L-1. The biological oxygen demand (BOD) reduced
from 92 to less than 10 mg L-1. Suspended solids reduced by 12–18 mg L-1
.when initial value was 180
mg L-1. Turbidity reduced from mean 140 to 5.0±3.4 NTU. The total coliform, fecal coliform were
3.2±0.9, 2.8±0.4, respectively.
In addition, laterite adsorbed phosphorus in natural lakes and landfills (Zhang, et al, 2011).
Wood and Atamney, (1996) examined the use of laterite in the bed medium to remove phosphorus
and heavy metals from waste water in Northern Ireland where phosphorus enrichment of lakes due to
agriculture problem and heavy metal emission from landfill sites. This study, using both laboratory
tests and pilot-scale constructed wetlands, reported the effectiveness of granular laterite in removing
phosphorus and heavy metals from landfill leachate. The laboratory studies showed that laterite was
capable of removing 99% of phosphorus from solution. A pilot-scale experiment containing laterite

23
achieved 96% removal of phosphorus. Initial removals of aluminium and iron by pilot-scale CWs
were up to 85% and 98% respectively. Percolating columns of laterite reduced Cd, Cr and Pb to
undetectable concentrations. Mitali et al. (2006) investigated kinetics and mechanism of fluoride
removal using laterite from Bankura in West Bengal. The laterite was found to be efficient for
removal of fluoride from aqueous sample, (83.3-74.4% in the temperature range 293-313 K for initial
concentration of 10 mg L-1. The removal of other anions such as Cl-, SO42-, and NO3- by laterite was
also reported to be satisfactory.
REFERENCES
Abd-Elfattah, A. and Wada, K., 1981. Adsorption of lead, copper, zinc, cobalt and cadmium by soils
that differ in cation-exchange materials. J. Soil Sci., 32, 271-283.
Abu-Eishah, S. I., 2008. Removal of Zn, Cd, and Pb ions from water by Sarooj clay. Appl. Clay Sci.,
42 (1–2), 201–205.
Ahmady-Asbchin, S., Andre‘s, Y., Ge´rente, C. and Le Cloirec, P., 2008. Biosorption of Cu (II) from
aqueous solution by Fucus serratus: surface characterization and sorption mechanisms. Bioresour.
Technol., 99, 6150–6155.
Aklil, A., Mouflihb, M.and Sebti, S., 2004. Removal of heavy metal ions from water by using
calcined phosphate as a new adsorbent. J. Hazard. Mater., A112, 183–190.
Aksogan, S., Basturk, A., Yuksel, E. and Akgiray, O., 2003. On the use of crushed shells of apricot
stones as the upper layer in dual media filters. Wat. Sci. Technol., 48 (11), 497-503.
Alinnor, J., 2007. Adsorption of heavy metal ions from aqueous solution by fly ash. J.Fuel., 86, 853–
857.
Al-Samawi, A. A. and Shokrala, E. M.., 1996. An investigation into an indigenous natural coagulant.
Enviro. Sci. Health., A31 (8), 1881 – 1897.
Amana, T., Kazi, A.A., Sabri, M.U., Banoa, Q., 2008. Potato peels as solid waste for the removal of
heavy metal copper(II) from waste water/industrial effluent. Colloids Surf. Biointerfaces., 63,
116–121.
Ajmal, M., Rao, R., Ahmad, R., Ahmad, J., 2000. Adsorption studies on Citrus reticulata (fruit peel of
orange) removal and recovery of Ni (II) from electroplating wastewater., J. Hazard. Mater.. 79,
117–131.
Aroua, M.K., Zuki, F.M., Sulaiman, N. M., 2007. Removal of chromium ions from aqueous solutions
by polymer-enhanced ultrafiltration. J. Hazard. Mater., 147, 752-758.
Arthanareeswaran, G., Thanikaivelan, P., Jaya, N., Mohana, D., Raajenthiren, M., 2007. Removal of
chromium from aqueous solution using cellulose acetate and sulfonated poly (ether ether ketone)
blend ultrafiltration membranes. J. Hazard. Mater., B139, 44-49.
24
Avinash M. K., Pravin D., Nemade, G. H., Oza, H. S., 2009. Treatment of municipal wastewater
using laterite-based constructed soil filter ECOENG-1464; No. of Pages11.
Basaldella, E. I., Va´ zquez, P. G., Iucolano, F., Caputo, D., 2007. Chromium removal from water
using LTA zeolites: effect of pH. J. Colloid Interface Sci., 313, 574–578.
Barakat, M. A., 2008a. Adsorption of heavy metals from aqueous solutions on synthetic zeolite. Res. J.
Environ. Sci.,. 2 (1), 13–22.
Bose, P., Bose, M. A., Kumar, S., 2002. Critical evaluation of treatment strategies involving
adsorption and chelation for wastewater containing copper, zinc, and cyanide. Adv. Environ. Res.,
7, 179–195.
Barakat, M. A., 2005. Adsorption behavior of copper and cyanide ions at TiO2–solution interface. J.
Colloid Interface Sci., 291, 345–352.
Babel, S., Kurniawan, T. A., 2004. Cr (VI) removal from synthetic wastewater using coconut shell
charcoal and commercial activated carbon modified with oxidizing agents and/or chitosan.
Chemosphere., 54 (7), 951–967.
Bansode, P. R.., Losso, J. N., Marshall, W. E., Rao, R. M., Portier, R. J., 2003. Adsorption of metal
ions by pecan shell-based granular activated carbons. Bioresour. Techno., 89, 115–119.
Bhole, A. G., (1995). Relative evaluation of a few natural coagulants. Journal SRT – Aqua., 44 (6),
284- 290.
Barakat, M. A., 2008b. Removal of Cu(II), Ni(II), and C r(III) ions from wastewater using
complexation–ultrafiltration technique. J. Environ. Sci. Technol., 1 (3), 151–156.
Bohn, H. L., Barrow, N. J., Rajan, S. S., Parfitt, R. L., 1986. Reactions of inorganic sulfur in soils. In:
Tabatabai, M.A. (Ed.). Sulfur in Agriculture, Agron. Monogr, vol.27. ASA, CSSA, and ISSSA,
Madison, WI, 233-249.
Bolan N. S., Sever, J. K., Tilmam, R. W., Scotter, D. R., 1988. Effects of liming and phoasphate
addition on sulphate leaching in soil. J. soil Sci., 39, 493-504.
Brown, L. M., 1996. Removal of heavy metals from water with microalgal resins 1: process
development. Water Treatment technology Program Report., No.74. US Department of the
Interior Bureau of Reclamation.
Chung, Y. C., 2006. Improvement of aquaculture wastewater using chitosan of different degrees of
deacetylation. Environ Technol., 27, 1199–208.
Clark, C. J. and Mcbride, C. L., 1984 Cation and anion retention by natural and synthetic allophane
and imogolite. Clays and Clay Minerals., 32 (4), 291-299
Churchman, C. J., Tate, K. R., 1986. Effect of Slaughterhouse Effluent and Water Irrigation upon
Aggregation in Seasonally Dry New Zealand Soil under Pasture Aust. J. Soil Res., 24, 505-16.
Costley, S. C., Wallis, F. M., 2001. Bioremediation of heavy metals in a synthetic waste water using a
rotating biological contactor. Water Res., 35 (15), 3715-3723.

25
Deliyanni, E. A., Peleka, E. N., Matis, K. A., 2007. Removal of zinc ion from water by sorption onto
iron-based nanoadsorbent. J. Hazard. Mater., 141, 176–184.
Duan J, Gregory J., 2003. Coagulation by hydrolysing metal salts. Adv Colloid Int Sci., 102, 475–502.
Deliyanni, E. A., Peleka, E. N., Matis, K. A., 2007. Removal of zinc ion from water by sorption onto
iron-based nanoadsorbent. J. Hazard.Mater., 141, 176–184.
Diaz, A., Rincon, N., Escorihuela, A., Fernandez, N., Chacin, E. and Forster, C. F., 1999. A
preliminary evaluation of turbidity removal by natural coagulants indigenous to Venzuela.
Process Biochemistry., 35 (3), 391 – 395.
Igwe, J. C., Ogunewe, D. N., Abia, A. A., 2005. Competitive adsorption of Zn (II), Cd (II) and Pb (II)
ions from aqueous and non-aqueous solution by maize cob and husk. Afr. J. Biotechnol., 4 (10),
1113–1116.
Itsusei, F., Masaaki, H., Satoshi, S., Tetsuya, N., Hiroshi, M., Ryozo., M., 2003. Sorption of
Pesticides by Volcanic Ash Soil from Mt. Aso in “Simulated Weathering” Experiments, Journal
of Health Science., 49 (3), 213–216.
Hutchins, S. R., Davidson, M. S., Brierley, J. A., Brierley, C. L., 1986. Microorganisms in
reclamation of metals. Ann. Rev. Microbiol., 40, 311–336.
El-Sikaily, A.., El Nemr, A., Khaled, A., Abdelwehab, O., 2007. Removal of toxic chromium from
wastewater using green alga Ulva lactuca and its activated carbon. J. Hazard. Mater., 148, 216–
228.
EPA (2000). Wastewater technology sheet: chemical precipitation. United State Environmental
Protection.
Forbes, E. A., Posner, A. M., and Quirk, J. P., 1976. The specific adsorption of divalent Cd, Co, Cu,
Pb, and Zn on goethite. J. Soil Sci., 27, 154-166.
Felix F. U., Robert, Br., Hilary, I., Sunyoung, B., 2010. Imo laterite soils as a sorbent for heavy
metals. IJRRAS., 4 (1).
Feng, D., Van Deventer, J.S.J., Aldrich, C., 2004. Removal of pollutants from acid mine wastewater
using metallurgical byproduct slags. Sep. Purif. Technol., 40 (1), 61–67.
Frankel, R. J., 1974. Series filtration using local filter media. J. AWWA., 66 (2), 124-127.
Fenga, D., Aldrich, C., 2004. Adsorption of heavy metals by biomaterials derived from the marine
alga Ecklonia maxima. Hydro metal lurgy., 73, 1–10.
Ferella, F., Prisciandaro, M., De Michelis, I., Veglio, F., 2007. Removal of heavy metals by
surfactant-enhanced ultrafiltration from wastewaters. Desalination., 207, 125-133.
Gupta, V.K., Jain, C.K., Ali, I., Sharma, M., Saini, S.K., 2003. Removal of cadmium and nickel from
wastewater using bagasse fly ash - a sugar industry waste. Water Res., 37, 4038-4044.
Genc-Fuhrman, H., Wu, P., Zhou, Y., Ledin, A., 2008. Removal of As, Cd, Cr, Cu, Ni and Zn from
polluted water using an iron based sorbent. Desalination., 226, 357-370.

26
Ghosh, U. C., Dasgupta, M., Debnath, S., Bhat, S. C., 2003. Studies on management of chromium
(VI)-contaminated industrial waste effluent using hydrous titanium oxide (HTO). Water, Air, Soil
Pollut., 143, 245–256.
Gupta, V. K., Rastogi, A., Saini, V. K., Jain, N., 2006. Biosorption of copper (II) from aqueous
solutions by Spirogyra species. J. Colloid Interface Sci., 296, 59-63.
Guibal, E., Van Vooren, M, Dempsey, B. A., Roussy, J., 2006. A review of the use of chitosan for the
removal of particulate and dissolved contaminants. Sep Sci Technol., 41, 2487-514.
Gregor, J. E., Nokes, C. J. and Fenton, E., 1997. Optimising natural organic matter removal from low
turbid waters by controlled pH adjustment of aluminium coagulation. Wat. Res., 31 (12), 2949 -
2958.
Ghebremichael, K., 2004. Moringa seed and pumice as alternative natural materials for drinking water
treatment. PhD Thesis. Land and Water Resources Engineering.
GWRTAC., 1997. Remediation of metals-contaminated soils and groundwater. Tech. Rep, TE-97-01,,
GWRTAC, Pittsburgh, Pa, US.
Gupta, V. K., Rastogi, A., 2008. Biosorption of lead (II) from aqueous solutions by non-living algal
biomass Oedogonium sp. and Nostoc sp.- a comparative study. Colloids Surf. Biointerfaces., 64,
170-178.
Kurniawan, T. A., Babel, S., 2003. A research study on Cr (VI) removal from contaminated
wastewater using low-cost adsorbents and commercial activated carbon. In: Second Int.Conf. on
Energy Technology towards a Clean Environment (RCETE), vol.2. Phuket, Thailand, 12–14
February, 1110–1117.
Kumar, J., Soni, H., Kumar, R. N., Bhatti, I., 2008. Bhatt Macrophytes in Phytoremediation of Heavy
Metal Contaminated Water and Sediments in Pariyej Community Reserve, Gujarat, India. Turk.
J.Fish. Aquat. Sci., 8, 193-200.
Kirpichtchikova, T. A.., Manceau, L,. Spadini, F., Panfili, M.., Marcus, A., Jacquet, T., 2006.
Speciation and solubility of heavy metals in contaminated soil using X-ray microfluorescence,
EXAFS spectroscopy, chemical extraction, and thermodynamic modeling. Geochimical
Cosmochimica Acta,, 70- 9, 2163–2190.
Lee, T. Y., Park, J. W., Lee, J. H., 2004. Waste green sands as a reactive media for the removal of
zinc from water. Chemosphere., 56, 571- 581.
Lee, M., Paik, I. S., Kim, I., Kang, H., Lee, S., 2007. Remediation of heavy metal contaminated
groundwater originated from abandoned mine using lime and calcium carbonate. J. Hazard.
Mater., 144 (1-2), 208- 214.
Moufliha, M., Aklila, A.., Sebti, S., 2005. Removal of lead from aqueous solutions by activated
phosphate. J. Hazard. Mater., B119, 183–188.
Mitali, S., Aparna, B., Partim, P., 2006. Kinetics and Mechanism of Fluoride Removal Using Laterite
Ind. Eng. Chem. Res., 45, 5920-5927.

27
Matlock, M. M., Howerton, B. S., Atwood, D. A . 2002. Chemical precipitation of heavy metals from
acid mine drainage. Water Res., 36 (19), 4757-4764.
METALSORB (2004). Heavy metal chelating agents. Available from
http://www.snf-group.com/IMG/pdf/Heavy_Metal_-METALSORB_E.pdf. Accessed 09/07/2010.
Narasiah, K. S., Vogel, A., Kramadhati, N. N., 2007. Coagulation of turbid waters using Moringa
oleifera seeds from two distinct sources. Wat. Sci. Technol., 2 (05), 83 – 88.
Nah, I. W., Hwang, K. Y., Jeon, C., Choi, H. B., 2006. Removal of Pb ion from water by magnetically
modified zeolite. Miner. Eng,. 19 (14), 1452–1455.
Nagendran, A., Vijayalakshmi, A., Arockiasamy, D. L., Shobana, K. H., Mohan, D., 2008. Toxic
metal ion separation by cellulose acetate/sulfonated poly (ether imide) blend membranes: effect of
polymer composition and additive. J. Hazard. Mater., 155 (3), 477–485.
NEESA., 1993. Precipitation of metals from ground water. NEESA Document Number 20 (2), Novel
Energy and Environmental Support Activity, Port Hueneme, CA.
Nomanbhay, S. M., Palanisamy K., 2005. Removal of heavy metal from industrial wastewater using
chitosan coated oil palm shell charcoal. Electron. J. Biotechnol., 8 (1), 15.
Olsen, A., (1987). Low technology water purification by bentonite clay and Moringa oleifera seed
flocculation as performed in Sudanese village: effects on Schistosoma masoni cercariae. Wat.
Res., 21 (5), 517 – 522.
Özacar, M. and Sengil, I. A., 2000. Effectiveness of tannins obtained from valonia as a coagulant aid
for dewatering sludge. Wat. Res., 34 (04)., 1407 – 1412.
Pan, B. C., Zhang, Q. R., Zhang, W. M., Pana, B. J., Dua, W., Zhanga, L., Xua, Q. J., Zhang, W. Z.,
2007. Highly effective removal of heavy metals by polymer-based zirconium phosphate: a case
study of lead ion. J. Colloid Interface Sci., 310, 99-105.
Pan, J. R, Huang C, Chen S, Chung, Y. C., 1999. Evaluation of a modified chitosan biopolymer for
coagulation of colloidal particles. Colloid Surf A Physicochem Eng Aspects., 147, 359-364.
Petrov, S., Nenov, V., 2004. Removal and recovery of copper from wastewater by a complexation–
ultrafiltration process.. Desalination., 162, 201-209.
Parfitt, R. L., Henmi, T., 1980 Structure of some allophanes from New Zealand. Clays & Clay
Minerals., 28, 285-294.
Parfitt, R. L., Fraser, A.R., Farmer, V.C., 1977. Adsorption on hydrous oxides: III. Fulvic and humic
acid on goethite, gibbsite and imogolite. J. Soil Sci., 28, 289-296.
Pawlak, Z., Zak, S., Zablocki, L., 2005. Removal of hazardous metals from groundwater by reverse
osmosis. Pol. J. Environ. Stud., 15 (4), 579- 583.
R´ıos, C. A., Williams, C. D., Roberts, C. L., 2008. Removal of heavy metals from acid mine drainage
(AMD) using coal fly ash, natural clinker and synthetic zeolites. J. Hazard. Mater., 156 (1-3), 23-
35.

28
Raghuwanshi, P. K., Mandloi, M., Sharma, A. J., Malviya, H. S. and Chaudhari, S., (2002).
Improving filtrate quality using agrobased materials as coagulant aid. Water Quality Research of
Canada., 37 (4), 745 - 756.
Rajan, S. S. S., 1979. Adsorption and desorption of sulfate and charge relationships inallophane clay
soil. Soil Science Soc Am., 43, 65-69.
Rahman, I.M.M., Iwakabe, K., Kawasaki, I, 2008 Laterite-A Potential Alternative for Removal of
Groundwater Arsenic J. Appl. Sci. Environ. Manage., 12 (1), 93 - 100.
Rehman A, Shakoori FR, Shakoori A. R., 2008. Heavy metal resistant freshwater ciliate, Euplotes
mutabilis, isolated from industrial effluents has potential to decontaminate wastewater of toxic
metals. Bioresour. Technol., 99 (9), 3890-3895.
Rani, M. J., Hemambika, B., Hemapriya, J, Kannan, V. R ., 2009. Comparative assessment of heavy
metal removal by immobilized and dead bacterial cells: a biosorption approach. Afr. J. Environ.
Sci. Technol., 4 (2), 077-083.
So¨ lenera, M., Tunalib, S., O¨ zcan, A.S., O¨ zcanc, A., Gedikbey, T., 2008. Adsorption
characteristics of lead (II) ions onto the clay/poly (methoxyethyl) acrylamide (PMEA) composite
from aqueous solutions. Desalination., 223, 308 -322.
Sutherland, J. P., Folkard, G. K., Mtawali, M. A. and Grant, W. D., 1994. Moringa oleifera as a
natural coagulant. 20th WEDC Conference: Affordable water supply and sanitation. Colombo, Sri
Lanka.
Sanyal A., Rautaray, D., Bansal, V., Ahmad, A., Sastry, M., 2005. Heavy metal remediation by a
fungus as a means of production of lead and cadmium carbonate crystals, Langmuir 21 (16),
7220-7224.
Sharma, P. K., Balkwill, D. L, Frenkel, A., Vairavamurthy, M. A., 2000. A new Klebsiella planticola
starin (Cd-1) grows anaerobically at high cadmium concentrations and precipitates cadmium
sulfide. Appl.Environ. Microbiol., 66 (7), 3083-3087.
Tang, P., Lee, C. K., Low, K. S., Zainal, Z., 2003. Sorption of Cr (VI) and Cu (II) in aqueous solution
by ethylenediamine modified rice hull. Environ. Technol., 24, 1243–1251.
Tripathi, P. N., Chaudhuri, M.., Bokil, S. D., 1976. Nirmali seeds-a natural occurring coagulant.
Indian Journal of Environmental Health., 18 (04), 272 – 281.
Trivunac, K., Stevanovic, S., 2006. Removal of heavy metal ions from water by complexation-
assisted ultra filtration. Chemosphere., 64 (3), 486–491.
Theng, B. K.G., 1972. Adsorption of ammonium and some primary n-alkylammonium cations by soil
allophane: J.Nature., 238, 150-151.
Uysal, M., Ar, I., 2007. Removal of Cr (VI) from industrial wastewaters by adsorption. Part I:
determination of optimum conditions. J.Hazard. Mater., 149, 482-491.
Vengris, T., Binkiene, R., Sveikauskaite, A., 2001. Nickel, copper, and zinc removal from wastewater
by modified clay sorbent. Appl. Clay Sci., 18, 183–190.

29
Vijayalakshmi, A., Arockiasam, D.L., Nagendran, A., Mohan, D., 2008. Separation of proteins and
toxic heavy metal ions from aqueous solution by CA/PC blend ultrafiltration membranes. Sep.
Purif. Techno.,. 62, 32–38.
Vaca, M. V., Callejas, R. L. P., Gehr, R, Cisneros, B. J. N., Alvarez, P. J. J., 2001. Heavy metal
removal with mexican clinoptilolite: multi-component ionic exchange. Water Res., 35(2), 373-37.
Volesky, B., 2003. Sorption and Biosorption. BV-Sorbex, Inc., St. Lambert (Montreal), (ISBN 0-
9732983-0-8) Quebec, Canada.
Jahn, S. A. A.., 1988. Using Moringa seeds as coagulants in developing countries., J. AWWA., 80 (06),
43 - 50.
Jahn, S. A. A., (2001). Drinking water from Chinese river: challenges of clarification. J Water SRT –
Aqua., 50, 15-27.
Xu, Y, Xu, T., 2008. Heavy metal complexes wastewater treatment with chelation precipitation. IEEE
Xplore,. 2789-2793.
Wood, R. B., McAtamney, R, F., 1996. Constructed wetlands for waste water treatment: the use of
laterite in thebed medium in phosphorus and heavy metal removal. Hydrobiological., 340, 323-
331.
Yuji, A., Sparks, D. L., Davis, J. A., 2005. Arsenate Adsorption Mechanisms at the Allophane-Water
Interface Environ. Sci. Technol., 39 (8), 2537-2544.

30
CHAPTER 3. EFFECTS OF MINERALOGY OF SUSPENDED MATERIALS ON
PERFORMANCE OF WEATHERED VOLCANIC ASH-BASED FLOCCULANT
___________________________________________________________________________
ABSTRACT
We examined the effect of clay mineralogy and interfacial chemistry of clay suspensions on the
performance of a flocculant prepared from weathered volcanic ash rich in allophane and imogolite.
Upon addition of the flocculant into the clay suspension and stirring, fluffy flocs formed and settled
after a standing time. The absorbance of the supernatant gradually decreased to near zero at an
optimum addition and then increased again when more flocculant was added. The optimum flocculant
addition differed significantly among the clay suspensions. Inspection of the results of the flocculation
tests and characterization of the sample clays, particularly stepwise multiple regression analyses,
suggested that the major factors affecting the performance were the effective cation exchange capacity
(ECEC), content of micaceous minerals and average particle size, of which the contribution of the
former two factors seemed weightier. This was interpreted as indicating the importance of the amount
of negative charge on the external surfaces of particles in the clay suspensions.
Key words: Water treatment, flocculation, volcanic ash, allophane, imogolite
---------------------------------------------------------------------------------------------------------------------------
3.1 INTRODUCTION
Removal of suspended materials is an essential operation in drinking water supply and waste
water treatment. In water treatment, flocculation process is commonly used to eliminate suspended
materials. Typical suspended materials in natural waters including silicate minerals, humic substances
and algae carry mostly negative surface charges and they are compensated by diffuse cation swarm
around the particles (Hunter and Liss, 1979). This arrangement of surface charge and counter cations
are termed diffuse double layer (DDL). Since the cations in DDL are not in close contact with particle
surfaces, electrostatic repulsive force operates between suspended particles to prevent their
agglomeration. A common way to remove suspension materials is to add flocculating agents to
overcome electrostatic repulsion and promote coalescence of the suspended particles to form large
flocs that settle down rapidly (Tripathy and De Ranjan, 2006). Salts of multivalent cations, e.g.,
Al3+and cationic hydroxide clusters of aluminum are commonly used as flocculants. The latter is
available on the market under the trade name of PAC and being used worldwide. Multivalent cations
tend to be adsorbed onto the counter particle surface and the development of DDL is suppressed.
Consequently, the electrostatic repulsion is overcome by London-van der Waals attraction making
particles come near and coalesce to form large flocs. Long chain synthetic polymers are also popular

31
flocculating agents applied to remove suspended materials under bridging and electrostatic patch
mechanism (Tripathy and De Ranjan, 2006).
There are little performance and safety problems in using these conventional flocculants in
closed environments like in water purification plants. However, in water processing in the open
environment, the use of the aluminum salts and synthetic polymers is often avoided in consideration
of possible physiological effects on organisms (Nakanishi and Wada, 2007). In removal of prolonged
turbidity in reservoir and lakes by flocculation-sedimentation, safer flocculants are required because
the flocs are not recovered but they are left on the lake floor for long time. Some natural substances
are gaining increasing interests as the flocculant that may have less environmental impacts in water
treatment in lakes, reservoirs and construction sites. The use of starch, guar gum, derivatives of chitin,
chitosan and carboxymethyl cellulose was reviewed by Tripathy and De Rajan (2006). Zhang et al.
(2010) reported that a microbial polymer was effective for flocculating synthetic kaolinite suspensions.
Kashiwai and Yuki (2006) tested natural allophane separated from weathered pumice and found that it
was effective for flocculating suspended clays in natural waters. Kuchibune et al. (2006) used slurry
of weathered allophanic volcanic ash to remove suspended clay particles from reservoir water.
Generally, the natural organic polymer flocculants are nontoxic to organisms and available from
renewable resources, but they have relatively low flocculation efficiency (Tripathy and De Rajan,
2006) and are not stable against microbial attack during storage. Although they are nontoxic, the high
dosage may increase the biological oxygen demand of processed water. The flocculants prepared from
allophonic weathered volcanic ash, on the other hand, were found to be as effective as PAC for
flocculating suspended clay particles in some natural reservoirs (Kuchibune et al., 2006). One of the
authors (Ienaga) has applied flocculants manufactured from weathered volcanic ash for the removal of
suspended clay particles from reservoir waters and muddy waste waters from construction sites and
found that the flocculant basically worked well, but the performance differed greatly among the
waters even when the concentrations of suspended materials were similar.
A possible flocculation mechanism is hetero-coagulation of negatively charged layer silicate
minerals and positively charged allophane, suggesting that the flocculation efficiency depends on
charge characteristics of clay particles in water environment. The present study aims to elucidate
effects of clay mineralogy and surface charge characteristics of suspended particles on the
flocculation efficiency of flocculant prepared from weathered volcanic ash.
3.2 MATERIALS AND METHODS
3.2.1 Flocculant
A commercial flocculant supplied from Astec.Co. under a trade name of TRP-Ai was used
throughout the present study. This product is made from subsurface layer of weathered volcanic ash
soil rich in allophane and imogolite by mechanical dispersion treatment followed by pH adjustment

32
with HCl. The product was thick slurry with a solid content of 132 g L-1. It was diluted three times
with distilled water just before use in the flocculation experiments.
3.2.2. Clay suspensions
Five gram portion of a soil or clay sample (Table 3.1) was mixed with 1 L of deionized water and
sonicated at 250 W for 15 min after pH adjustment to about 8 with 0.1 mol L-1 NaOH. The dispersed
suspension was put into sedimentation cylinder and the fraction having equivalent spherical diameter
of <2 µm was separated once by siphoning. This procedure was repeated for several times to obtain
sufficient amount of clay suspension for flocculation tests. The separated stock clay suspensions were
mixed and kept in a polypropylene bottle with fitted stopper and diluted with deionized water just
before use.
Table 3.1. Source of soil and clay samples
Sample name pH Organic
carbon/g kg-1
Source
K1 4.7 7.1 B horizon of Dystrochrept in Gyeonggi-Do, Korea
K4 5.1 3.4 IIB23 horizon of Hapludult in Gyeongsangnam-Do, Korea
K7 5.1 1.9 B22 horizon of Hapludalf in Jeollanam-Do, Korea
T5 5.3 4.3 B22 horizon of Haplustox in NakhonRatchasima, Thailand
O1 4.6 3.7 B21 horizon of Hapludultin Okinawa, Japan
F 5.7 18 Ap horizon of Fluvaquents in Fukuoka, Japan
Kaolinite tr. Iriki mine, Kagoshima, Japan
Montmorillonite tr. Kunipia-F supplied byKunimine Co., Tokyo, Japan
3.2.3. Characterization of clay suspensions and flocculant
Exchangeable cation composition was determined by 1 mol L-1NH4OAc extraction. A clay
suspension containing 200 mg of clay was placed on a 0.1 m membrane filter and washed with 50
mL of the NH4OAc solution under suction. The filtrate was analyzed for Ca2+, Mg2+, Na+ and K+ by
atomic absorption spectroscopy (Z2300, Hitachi, Japan).
Particle size distribution of the suspended clay minerals was determined by photon correlation
spectroscopy (ELSZ, Photal Co, Japan). The spectrometer was calibrated with spherical colloidal
latex having a diameter of 100 nm. Ζeta (ζ) potential of the suspended clay particles was determined
by a potential analyzer (Zetasizer 2000, Malvern Instruments, UK). The average ζ potential was
calculated with the preinstalled software from the electrophoretic mobility measured by laser-Doppler
velocimetry. The apparatus was calibrated with a standard latex suspension supplied by the
manufacturer.
Mineralogical analysis of the clay suspensions by X-ray diffraction (XRD) was carried out
following the procedure described by Wada and Umegaki (2001) with a Cu K radiation at 40 kV and

33
20 mA. The approximate contents of layer silicate clay minerals, gibbsite, quartz and feldspars were
estimated from the XRD peak intensities following the procedure described by Moslehuddin (1998).
Free iron oxide and hydroxide content was determined by the selective dissolution (Wada and
Greenland, 1970) using sodium dithionite, sodium citrate and sodium hydrogen carbonate. The
dissolved iron was determined by atomic absorption spectroscopy (Z2300, Hitachi, Japan). The
approximate weight of oxide and hydroxide of iron was calculated by multiplying the amount of the
extracted iron by a factor of 1.5.
3.2.4. Characterization of flocculant
The allophane plus imogolite content of the flocculant used was determined by the selective
dissolution method (Blakemore et al, 1981; ParfittandWilson,1985) with a modification by Schuppli
et al. (1983). The Si, Al and Fe concentrations in the extract were determined by atomic absorption
spectroscopy (Z2300, Hitachi, Japan). The particle size distribution was determined by repeated
sedimentation and sieving following procedure of Nguyen and Egashira (2005). This is because the
photon correlation spectrometer did not accept particles larger than several m and the software for
calculating the particle size distribution was not suitable for fibrous imogolite. The clay fraction
separated in the particle size analysis was subjected to X-ray diffraction in the same manner for clay
suspensions. The clay fraction of the flocculant was also examined in an electron microscope (JEM
100CX, JEOL Co., Japan)
3.2.5 Flocculation experiments
The flocculation experiments were performed by the Jar-test device (MJS-3H, Miyamoto Co.,
Japan) in a room at 20-24 oC. A 400 mL portion of a 500 mg L-1 clay suspension was placed in a 500
ml tall beaker in the jar tester and the impeller rod was put in the suspension. Immediately after the
addition of 0 to 40 mL of diluted flocculant, the suspension was stirred at a speed of 300 rpm for 3
min and at 50 rpm for 5 min. The flocs were allowed to settle for 30 min. A 10 mL portion of the
supernatant then was collected from 2cm below the water surface and absorbance was measured at a
wave length of 660 nm by a spectrophotometer (U1900, Hitachi, Japan). All of tests were carried out
in triplicate.
3.3 RESULTS AND DISCUSSION
3.3.1 Mineralogy of flocculant and soil clay samples
X-ray diffraction patterns of the Mg-saturated and glycerol-solvated clay samples and flocculant
are shown in Fig. 3.1. The flocculant gave faint diffraction peaks only at about 1.4, 0.7 and 0.334 nm
after Mg-saturation and glycerol-solvation but the former two peaks disappeared after heating at 550
ºC (not shown). This suggests that these peaks arose mostly from imogolite but not from layer silicate
minerals. The 0.334 nm peak persisted after heating, indicating that the flocculant contained small

34
amount of quartz. The particle size distribution showed that the flocculant comprised of 28% of
coarse sand (200-2000 m), 12% of fine sand (20-200 m), 13% of silt (2-20 m) and 47% of clay (<
2 m) by weight. The allophane plus imogolite content determined by the selective dissolution using
ammonium oxalate-oxalic acid (Blakemore, 1981; Parfitt and Wilson, 1985) was 19% on the oven-dry
basis. This value combined with the solid content of the flocculant (132 g L-1) gives the allophane plus
imogolite concentration in the flocculant to be 25 g L-1. The average Si/Al molar ratio of the allophane
and imogolite in the flocculant calculated from the selective dissolution data was 0.82. The oxalate-
oxalic acid soluble iron mineral content was 20 g kg-1 as Fe2O3. This is equivalent to the concentration
of 2.6 g L-1 in the flocculant.
Fig. 3.1. X-ray diffraction patterns of the clays in suspensions used for flocculation experiments.
Patterns for Mg-saturated and glycerol solvated specimens are shown.
Fig. 3.2 shows an electron micrograph of the < 2 m fraction of the flocculant. The aggregates of
very fine granules and threads indicate the dominance of allophane and imogolite. Although thread
like imogolite is conspicuous in this micrograph, faint peaks in the X-ray diffractogram (Fig 3.1) and
Cu K radiation 2/ o0 5 10 15 20 25 30
Intensity/ c
ps
0
2000
4000
6000
8000
0.3340.71.01.4
F
O1
T5
K7
K4
K1
Flocculant

35
the fact that pure imogolite shows fairly strong diffraction peak at around 1.2-2.0 nm (Wada, 1989)
suggest that the relative abundance of imogolite is low.
Fig. 3.2. Electron micrograph of < 2 m fraction of flocculant.
Table 3.2. Approximate mineral contents of clay samples
Sample Approximate clay mineral percentage
Mc Ch Vt VtCh Sm Kt Other
LS Gb Qz Fd Fe
K1 36 0 5 5 0 20 2 5 19 5 3K4 20 0 10 20 0 20 5 0 14 9 2K7 21 0 14 8 0 15 0 4 29 6 3T5 0 0 0 0 0 96 0 0 0 0 4O1 2 0 1 34 0 20 0 17 21 4 1F 18 1 17 3 11 18 0 4 14 11 3Montmori- llonite
0 0 0 0 100 0 0 0 0 0 0
Kaolinite 0 0 0 0 0 100 0 0 0 0 0(Mc= Mica, ChVt = Vermiculite-Chloriteintergade, Sm= Smectite, Kt= Kaolinite, Qz=Quartz, Fd
= Feldspar, Gb = Gibbsite, Other LS = Mixed layer minerals including kaolinite-smectite and mica-
vermiculaite, Fe = Oxides and hydroxides of iron)
The soil clay samples used for the flocculation test had mixed clay mineralogy except for the T5
sample that contained only kaolinite. The major clay minerals in the K1, K4 and K7 samples were
1 m

36
micaceous minerals, vermiculite-chlorite intergrade, kaolinite and quartz. The O1 sample also
contained vermiculite-chlorite intergrade, kaolinite and quartz but it lacked in micaceous minerals
(Fig. 3.1). The F sample contained significant amount of smectite as indicated by the broad diffraction
peak at 1.7-1.9 nm (Fig. 3.1). The approximate relative contents of layer silicate minerals, quartz,
feldspars and gibbsite were estimated following the procedure described by Mosslehuddin (1998) and
Nguyen (2008) and combined with the free iron oxide content determined by selective dissolution
(Wada and Greenland, 1970) to calculate the approximate mineralogical composition of the clay
samples used. Thus estimated mineralogical composition of the clay samples are listed in Table 3.2.
3.3.2 Colloidal properties of clay suspensions
The pH and electric conductivity of the suspension, exchangeable cation composition, average
particle size and the average -potential of the suspended particles are tabulated in Table 3.3. The
histograms showing the particle size distribution are shown in Fig.3. The suspension pH was in a
narrow range from 6.79 to 6.86. The electric conductivity was also not much different among samples.
The major exchangeable cation was Na+ followed by Ca2+ and Mg2+ and K+ content was low. The
prevalence of Na+ is due to the use of NaOH in the clay dispersion and separation process. Some soils
used for clay preparation were acidic (Table 3.1) and contained a significant amount of exchangeable
aluminum (data not shown). The neutral pH values of the clay suspensions indicate that the adsorbed
aluminum was replaced by Na+ and precipitated as hydroxides. The neutral pH value for the
montmorillonite suspension is due to the low clay/water ratio. The effective cation exchange capacity
(ECEC), i.e., the sum of the exchangeable cations, was 12.3, 13.5, 16.6, 6.14, 10.5, 29.8, 99.0 and
3.67 cmolc kg-1 for the K1, K4, K7, T5, O1, F, montmorillonite and kaolinite samples, respectively.
Table 3.3. Colloidal properties of clay samples
Samples pH EC/
dS m-1
Exchangeable cations/cmolckg-1 Average
particle
size/ nm
Average
potential/
mV Na+ K+ Ca+2 Mg2+
K1 6.83 0.03 6.61 0.78 3.18 1.72 161 -59.7
K4 6.80 0.02 8.34 0.40 2.66 2.05 183 -82.7
K7 6.86 0.03 5.03 0.42 4.69 6.51 285 -12.6
T5 6.82 0.02 3.35 0.40 1.68 0.72 86 -45.1
O1 6.79 0.02 8.98 0.32 0.26 0.97 128 1.1
F 6.81 0.03 4.95 2.11 17.22 5.53 187 -36.6
Montmorillonite 6.86 0.04 77.41 1.96 14.83 4.82 224 -55.7
Kaolinite 6.86 0.04 2.75 0.21 0.40 0.31 384 16.7

37
Fig. 3.3. Size distribution of suspended particles in clay suspensions used for flocculation experiment.
F
Particle diameter/ nm
0 200 400 600 800 1000
Nu
mb
er
pe
rce
nta
ge
0
10
20
30
40
50
60
Kaolinite
Particle diameter/ nm
0 200 400 600 800 10000
10
20
30
40
50
60
0 200 400 600 800 1000
Nu
mb
er
pe
rce
nta
ge
0
10
20
30
40
50
60
0 200 400 600 800 10000
10
20
30
40
50
60
0 200 400 600 800 1000
Nu
mb
er
per
cen
tag
e
0
10
20
30
40
50
60
0 200 400 600 800 10000
10
20
30
40
50
60
0 200 400 600 800 1000
Nu
mb
er
per
cen
tag
e
0
10
20
30
40
50
60
0 200 400 600 800 10000
10
20
30
40
50
60
Montmorillonite
K1 K4
K7 T5
O1 F
38
Table 3.3 and Fig. 3.3 show that the size of the suspended clay particles is far less than 1 m.
Since the clay particles are basically platy in shape, the size information from the photon correlation
spectroscopy is not straightforward. The size distribution shown in Fig. 3.3 and the calculated average
particle diameter should be taken as a matter of relativity. The T5 sample had the smallest average
particle diameter of 86 nm, while the kaolinite sample had the largest average diameter of 384 nm.
The measured -potential of the clay particles of the clay suspensions distributed mostly over -40
to -50 mV ranges. Table 3.3 lists only the averaged values. The average -potential was negative
except for the O1 and kaolinite samples. The -potential of the kaolinite sample ranged from about -
50 mV to 100 mV with a peak at around -15 mV but the averaged value was positive.
3.3.3 Flocculation experiments
Upon addition of the diluted flocculant and vigorous stirring at a speed of 300 rpm, fluffy flocs
formed. During the continued stirring at 50 rpm, the flocs grew in size and they loosely deposited on
the bottom of the beaker after 30 min of the standing time. Only a small number of flocs holding air
bubbles still floated in the suspension. Since the supernatant of the suspension after the settling time
was almost homogeneous, i.e., there was no visible turbidity gradient, a 10 mL portion of the
supernatant was sampled from a depth of 2 cm from the surface and its absorbance at 660 nm was
measured. The results of the flocculation experiments were graphically summarized in Fig. 3.4, where
the averaged absorbance and standard deviation of the three replications were plotted against the
flocculant dose. The error bar fell within the circle, indicating that the flocculation test was excellently
reproducible. As the flocculant dose increased, the absorbance decreased to near zero and increased
again. The increase in absorbance past the optimum dose is probably due to the presence of the excess
flocculent and/or re-dispersed clay particles. The near zero absorbance at the optimum dose indicates
that all the suspended clay particles interacted with the added flocculant, i.e., allophane and imogolite,
to have formed large flocs. The minimum amount of the flocculant to be added to decrease the
absorbance below 0.005 was defined as the optimum dose in the present study.
The measured optimum dose was 26, 8, 4, 6, 8, 18, 14 and 0.8 mL for the K1, K4, K7, T5, O1, F,
montmorillonite and kaolinite samples, respectively. The K1 and F samples required the larger
amount of the flocculant before all the suspended particles were flocculated followed by the K4 and
O1 samples. Of the two standard clay samples the kaolinite sample required much less dose than the
montmorillonite sample did, i.e., 0.8 mL vs.14 mL. Horikawa et al. (1976) studied the flocculation in
binary imogolite-layer silicate mixed suspensions and reported that montmorillonite almost
completely flocculated at an imogolite to montmorillonite ratio of 0.25 by weight. The observed
optimum dose for the montmorillonite sample corresponds to an allophane plus imogolite to
montmorillonite ratio of 0.23. According to Horikawa (1976), the imogolite to kaolinite ratio at
complete flocculation was about 0.01 and the kaolinite started to re-disperse at the higher ratios and

39
showed positive electrophoretic mobility. The trend in absorbance for kaolinite shown in Fig. 3.4 is
good agreement with his observation. Horikawa (1976) interpreted the difference between
montmorillonite and kaolinite in terms of the amount of surface negative charge of these minerals.
The amount of the surface negative charge would be surely one of the most important factor that
affect the flocculant requirement but the results obtained in the present study suggest that it is not
necessarily the dominant factor. For example, the K1 and K7 samples have comparable ECEC but the
optimum dose for the K1 sample was much higher than that for the K7 sample. Similarly, the
optimum dose for the K1 and F samples were larger than that for montmorillonite in spite of their
lower ECEC. It is interesting to note that the K1 and F samples having relatively high micaceous
mineral contents required larger amounts of the flocculant. To explore the factors affecting the
flocculant requirement, stepwise multiple linear regression analysis was carried out using
Mathematica 8.0. The selected variables giving the highest r2 adjusted for the degree of freedom were
the ECEC, micaceous mineral content and average particle size. The best regression equation was:
9.1295 + 0.1203 x1 + 0.4289x2 - 0.03263x3 (r2 adjusted = 0.517) (3.1)
Wherex1, x2 andx3 represent ECEC in cmolc kg-1, micaceous mineral percentage and average particle
size in nm, respectively. Fig. 5 shows the relationship between the measured optimum dose and that
predicted with the regression equation. The regression equation significantly overestimated the
optimum dose for the K4 and K7 samples and underestimated that for the kaolinite sample. For the
rest of the samples, the predicted optimum doses were fairly close to the measured ones. The analysis
of variance on the fitted model showed that the most highly contributed variable is the micaceous
mineral percentage followed by the ECEC and average particle size.
Since the leading mechanism of flocculation is the neutralization of the surface negative charge
on the suspended layer silicate mineral particles, it is reasonable to have positive coefficient for the
ECEC. The larger the ECEC, more flocculant is needed to neutralize the surface charge in general.
The negative coefficient for the average particle size is also acceptable because the larger the particle
size the smaller the number of the particles in suspensions having the same particle concentration by
weight per unit volume. However, the inclusion of the micaceous mineral percentage in the regression
equation is not straight forward. One possible interpretation is that the ECEC alone cannot account for
the amount of the surface negative charge that contributes to interparticle interaction.
The charges that are responsible for the interparticle interaction would be those on the exterior
planar surfaces of clay crystals or packets as well as those on the edge surfaces. The charges on the
interior surfaces of clay particles made up of several stacked unit silicate layers would not contribute
to the interparticle interaction. If these assumptions are correct, the ECEC is not a good measure of
the amount of the surface charges that are responsible for electrostatic interparticle interaction
particularly for clay minerals having exchangeable interlayer cations, since the ECEC represents all
the surface charges to which ammonium ions are accessible. On the other hand, it is a good estimate
of exterior surface charge for non expandable micaceous minerals. Thus, the ECEC cannot be used as

40
a single measure of the exterior surface charge of suspended particles for clays having mixed
mineralogy. The linear regression analysis using the sum of the smectite and vermiculite percentages
gave the following equation:
10.2899 + 0.1170x1 + 0.4236x2 - 0.03425x3 (adjusted r2 = 0.496) (3.2)
Where x1, x2 and x3 represent the sum of vermiculite and smectite percentages, micaceous mineral
percentage and average particle size in nm, respectively. The similar goodness of fit of these models
suggests that the amount of the exterior surface charge is the dominant factor affecting the flocculant
requirement. The smaller coefficient for smectite plus vermiculite percentage may indicate that
smaller fraction of the surface charge on these minerals contribute to interparticle interaction.
Fig. 3.4 shows that the excessive addition of the flocculant resulted in the increased absorbance.
This may be due either to the remnants of the flocculant or to the re-dispersed clay particles that were
stabilized by the excessive amounts of allophane and imogolite. Horikawa (1976) reported that the
addition of allophane and/or imogolite to the suspensions of layer silicate minerals caused initial
flocculation and re-dispersion upon excessive addition. The electrophoretic mobility of the re-
dispersed clay particle resembled that of allophane and imogolite (Horikawa, 1976). The range of the
flocculant dose in which the absorbance was kept below 0.005 was 26 to 30 mL, 8 to 10 mL, 4 to 10
mL, 6 to 12 mL, 8 to 13 mL, 17 to 23 mL and 0.8 to 5 mL for the K1, K4, K7, T5, O1, F and kaolinite
samples, respectively. There were no clear relationships between these ranges and the properties of
the suspended materials.
The flocculant used in the present study was prepared from the weathered volcanic ash
containing both allophane and imogolite. It is interesting to discuss the relative contribution of
allophane and imogolite to the removal of suspended layer silicate particles via flocculation by charge
neutralization. Both allophane and imogolite exhibit positive and negative surface charges depending
on the suspension pH (Clark and McBride, 1984) but their charge characteristics are different in terms
of the location of charge. Allophane develops both positive and negative charges on its external
surface as evidenced by its negative and positive electrophoretic mobility (Horikawa, 1976).
Imogolite develops positive charges on its external surface but the negative charges are confined to
internal surface of its tubular structural unit. Since the negative charges on the internal surface of the
tube are balanced by cations retained in the tube, imogolite does not show positive electrophoretic
mobility even when it bears net negative charge (Horikawa, 1976). Recent electronic structure
calculations on imogolite showed that the external surface of imogolite is always positively charged
(Guimaraes et al., 2007). All these suggest that imogolite would be more effective for charge
neutralization. In addition, the fibrous morphology of imogolite would favorable for bridging layer
silicate particles to form larger flocs. Using freeze-etching technique, Horikawa et al. (1976) observed
numerous layer silicate particles connected by imogolite fibers. On the other hand, imogolite is much
less abundant than allophane in weathered volcanic ash and overall contribution to the flocculation
may be smaller.

41
It is difficult to collect allophane and imogolite separately from a weathered volcanic ash but it is
possible to prepare nearly pure imogolite and allophane specimens from gel-like films and weathered
pumice grains (Wada and Wada, 1977). It would be not only scientifically interesting but also
practically important to evaluate relative efficiency in flocculating dispersed layer silicate particles
using sols of pure allophane and imogolite.
Fig. 3.4. Results of the flocculation experiments.
0 10 20 30 40
Abso
rbance
0.0
0.2
0.4
0.6
0.8
1.0
1.2
1.4
K1
0 10 20 30 400.0
0.2
0.4
0.6
0.8
1.0
1.2
1.4
K4
0 10 20 30 40
Abs
orba
nce
0.0
0.2
0.4
0.6
0.8
1.0
1.2
1.4
K7
0 10 20 30 400.0
0.2
0.4
0.6
0.8
1.0
1.2
1.4
T5
0 10 20 30 40
Abso
rbance
0.0
0.2
0.4
0.6
0.8
1.0
1.2
1.4
O1
0 10 20 30 400.0
0.2
0.4
0.6
0.8
1.0
1.2
1.4
F
Addition/ mL
0 10 20 30 40
Abs
orbance
0.0
0.2
0.4
0.6
0.8
1.0
1.2
1.4
Addition/ mL
0 10 20 30 400.0
0.2
0.4
0.6
0.8
1.0
1.2
1.4
MontmorilloniteKaolinite

42
Fig. 3.5. The relationship between the measured optimum dose and predicted dose.
3.4 CONCLUSIONS
The flocculant made from volcanic ash soil rich in allophane and imogolite can effectively
remove suspended clay particles at an optimum addition of the flocculant. The optimum dose depends
on the mineralogy of the suspended particles. The major factors affecting the optimum dose are the
ECEC, micaceous mineral content and average particle size. The ECEC and micaceous mineral
content positively correlate, on the other hand, the average particle size negatively correlates with the
optimum dose. This trend indicates that the amount of the negative charge on the external surfaces of
the suspended clay particles is the dominant factor that determines the flocculant requirement.
REFERENCES
Blakemore, L. C., Searle, P. L. and Daly, B. K., 1981. Methods for chemical analysis of soils. New Zealand Soil Beaureau Scientific Report 10A, DSIR, New Zealand.
Clark, C. J and Mcbride, M. C., 1984. Cation and anion retention by natural and synthetic allophane and imogolite.Clays Clay Miner., 32, 219–299.
Measured optimum dose/ mL
-5 0 5 10 15 20 25 30
Pre
dict
ed o
ptim
um d
ose
/ m
L
-5
0
5
10
15
20
25
30
Kaolinite
K1
FMontmorillonite
K7 K4
O1
T5

43
Guimaraes, L., Enyashin, A. N., Frenzel, J., Duarte, H. A. and Seifert, G., 2007. Imogolite nanotubes: Stability, Electronic and mechanical properties.ACS NANO.,1, 362-368.
Horikawa, Y., 1976. Electrophoretic mobility of binary mixtures of imogolite and some other clay minerals in aqueous suspensions. Clay Sci., 5, 43-50.
Horikawa, Y., Yonebayashi, K. and Hattori., 1976. Electron microscopic investigation on particle association between imogolite and other clay minerals in mixed suspensions. Clay Sci., 5, 51-56.
Hunter, K. A. and Liss, P. S., 1979. The surface charge of suspended particles in estuarine and coastal waters. Nature., 282, 823–825.
Kashiwai, J. and Yuki, K., 2006. Flocculating action of natural allophane.Engineering Dams., 239, 20-28. (in Japanese).
Kuchibune, A., Morimoto, T and Wada, S. I., 2006. Preparation of efficient coagulant from clays.Proc.16thSymposiumon Geo-Environments and Geotechniques., 63-66. (in Japanese)
Moslehuddin, A. Z. M., 1998. Mineralogy and potassium chemistry of Bangladesh paddy soil.Ph. D dissertation. Kyushu University, Japan.
Nakanishi, R and Wada, S. I., 2007. Reactivity with phosphate and phytotoxicity of hydroxyaluminosilicate ions synthesized by instantaneous mixing of aluminum chloride and sodium orthosilicate solutions.Soil Sci. Plant Nutr., 53, 545-550.
Nguyen, Q. H., 2008. Clay mineralogy of soils in Vietnam in reference to soil forming process.Ph. D dissertation, Kyushu University, Japan.
Nguyen, Q. H and Egashira, K., 2005. Particle size distribution and free iron oxides of alluvial soils from different Agro-ecological regions in Viet Nam.J. Fac.Agr.,KyushuUnvi., 50, 243-254.
Parfitt, R. L and Wilson, A. D., 1985. Estimation of allophane and halloysite in three sequences of volcanic soils, NewZealand. Catena Supplement., 7, 1-8.
Schuppli, P. A., Ross, G. J and Mckeague, J. A., 1983. The effective removal of suspended materials from pyrophosphate extracts of soils from tropical and temperate regions. Soil Sci. Soc. Am. J., 47, 1026-1032.
Tripathy, T and De Ranjan, B., 2006. Flocculation: A new way to treat the waste water. J.Physical Sciences., 10, 93-127.
Wada, K., 1989. Allophane and imogolite. In: Dixon, J. B. and Weed, S. B. editors, Minerals in Soil Environments.Madison, WI: Soil Science Society of America Press., 1051-1087.
Wada, K. and Greenland, D. J., 1970. Selective dissolution and differential infrared spectroscopy for characterization of amorphous constituents in soil clay. Clay Minerals., 8, 241-254.
Wada, S-I and Wada, K., 1977. Density and structure of allophane. Clay Miner., 12, 289-298.
Wada, S-I and Umegaki, U., 2001. Major ion and electrical potential distribution in soil under electrokinetic remediation.Environ. Sci. Technol., 35, 2151-2155.
Zhang, Z., Xia, S., Zhao, J and Zhang, J., 2010. Characterization and flocculation mechanisms of high efficiency microbial flocculant TJ-F1 from Proteus mirabilis.J.ColloidsSturf.,75, 247-251.

44
CHAPTER 4. COMPARISON OF ALLOPHANE AND IMOGOLITE SOLS AS A FLOCCULATING AGENT FOR SUSPENDED CLAY PARTICLES IN WATER ___________________________________________________________________________
ABSTRACT
To evaluate the relative flocculating power of allophane and imogolite, we conducted a series of
flocculation experiment using allophane and imogolite sols and their mixtures. Imogolite was more
effective than allophane for all five clay suspensions used. The residual turbidities of test
montmorillonite suspensions after treatment with mixed allophane and imogolite sols were nearly
equal to those calculated under the assumption that the contribution of allophane and imogolite was
additive. But the experimental turbidity was much higher than the calculated one for a soil clay
suspension.
Key word: allophane, imogolite, flocculation, water treatment
---------------------------------------------------------------------------------------------------------------------------
4.1 INTRODUCTION
Flocculation-sedimentation is the most commonly used techniques for removal of suspended
materials in drinking water purification and waste water treatment. Popular flocculant used in these
fields are inorganic salts of multivalent cations and synthetic soluble polymers. Although aluminum
ions are highly phyto-toxic (Nakanishi and Wada, 2007) and some synthetic organic polymers are
mutagenic (Mallevialle et al., 1984), there is little toxicity concern in water treatment plants because
the dose is optimized so as to minimize the residual concentration in the processed waters and the
sediments are recovered and disposed properly. However, in water processing in the open
environment, the use of the aluminum salts and synthetic polymers is often unwelcome in view of
possible adverse effects on organisms. In removal of prolonged turbidity in reservoir and lakes by
flocculation-sedimentation, safer flocculants are required because the flocks are not recovered but
they are left on the lake floor for long time. To meet these requirements, the uses of natural
biopolymers and inorganic materials have been tested as reviewed by Tripathy and De Rajan (2006).
The starch, guar gum, derivatives of chitin, chitosan and carboxymethyl cellulose are the examples for
the biopolymers (Tripathy and De Rajan, 2006; Zhang et al., 2010) and allophanic soils (Kashiwai
and Yuki, 2006; Kuchibune et al., 2006) are the examples for inorganic substances. Generally, the
natural organic polymer flocculants are nontoxic to organisms and available from renewable resources,
but they have relatively low flocculation efficiency (Tripathy and De Rajan, 2006) and are not stable
against microbial attack during storage. Although they are nontoxic, the high dosage may increase the
biological oxygen demand of processed water and sediment. The flocculants prepared from allophanic

45
weathered volcanic ash, on the other hand, are biologically inert and were found to be as effective as
PAC for flocculating suspended clay particles in some natural reservoirs (Kuchibune et al., 2006).
According to the pioneering basic research works by Horikawa (1976) and Horikawa et al.
(1976), the dominating mechanism of the flocculation of suspended clay particles by imogolite is the
surface charge neutralization as evidenced by the drastic reduction in the electrophoretic mobility.
Nga et al. (2012) examined the effect of mineralogy of suspended materials on the performance of a
commercial flocculant made from weathered volcanic ash rich in allophane and imogolite and reached
a similar conclusion. However the flocculation mechanism of allophane and imogolite may not be the
same. Single thread of imogolite can bridge many layer silicate particles as seen from the electron
micrographs of freeze-etched binary suspensions of kaolinite-imogolite and montmorillonite-
imogolite (Horikawa et al., 1976), while such bridging is not expected for allophane. If imogolite is
more effective for flocculating layer silicate particles, the imogolite content can be used as a criterion
in searching for weathered volcanic ash resources suitable for producing flocculants.
In the present study, relative flocculation efficiency of allophane and imogolite were compared.
The imogolite sample was prepared from gel-like films filling weathered pumice grains and allophane
sample was extracted from interior of the pumice grains. Flocculation experiments were conducted on
suspensions of three soil clays, kaolinite and montmorillonite.
4.2 MATERIALS AND METHODS
4.2.1 Allophane and imogolite sols
Both allophane and imogolite were separated from weathered pumice collected from the
Murasakino pumice bed in Kitakami, Iwate prefecture, Japan. For preparation of imogolite
suspension, gelatinous films filling the interstices of pumice grains were collected by hand picking
using tweezers. The collected films were suspended in deionized water and sonicated for 1 min at 24
kHz and 110 W (W-113 MkII, Honda Electronics Co., Japan) to remove fine pumice granules
occluded in the films. The purified imogolite films free from pumice granules were gently ground, re-
suspended in fresh deionized water, and the pH of the suspension was adjusted to 4.5 with HCl. 0.1
mol L-1. Imogolite was dispersed by sonication for 30 min at 19.5 kHz and 200 W (Type 4280, Kaijo
Co., Japan). The resulted uniform imogolite sol was stored in a polypropylene bottle.
The sol of allophane was prepared following the method described by Wada (2001). The
weathered pumice grains after removing imogolite films were gently crushed in a mortar and < 0.2 nm
fraction was collected. Allophane was dispersed by pH adjustment to 4.5 with 0.1 mol L-1 HCl
followed by sonication for 15 min at 19.5 kHz and 200 W (Type 4280, Kaijo Co., Japan). The fraction
having an equivalent spherical diameter of less 0.2 m was repeatedly collected by centrifugation and
stored in a polypropylene bottle.

46
The purity of the separated allophane and imogolite was checked by electron microscopy.The
Na+ and Cl- retentions by the allophane and imogolite from 0.1 mol L-1 NaCl solution were measured
as a function of solution pH basically following the method described by Wada and Okamura (1980).
For imogolite, the purified gelatinous film was used instead of dispersed imogolite sol for
convenience of solid-liquid separation by centrifugation.
4.2.2 Clay suspensions
Clay suspensions used for flocculation tests were prepared from three soil samples and two
specimen clays (Table 4.1) following the procedure described by Nga et al. (2012).
Table 4.1. Source of soil and clay samples
Sample name Source
K4 IIB23 horizon ofHapludult in Gyeongsangnam-Do, Korea
T5 B22 horizon of Haplustox in NakhonRatchasima, Thailand
F Ap horizon of Fluvaquents in Fukuoka, Japan
Kaolinite Iriki mine, Kagoshima, Japan
Montmorillonite Kunipia-F supplied by Kunimine Co., Tokyo, Japan
Five gram portion of a soil or clay sample (Table 4.1) was mixed with 1 L of deionized water and
sonicated for 15 min after pH adjustment to about 8 with 0.1 mol L-1 NaOH. The dispersed suspension
was put into sedimentation cylinder and the fraction having equivalent spherical diameter of <2 µm
was separated once by siphoning. This procedure was repeated using several portions of the sample to
obtain sufficient amount of clay suspension for flocculation tests. The separated stock clay
suspensionswere kept in a polypropylene bottle with fitted stopper and diluted with deionized water
just before use.
The clays in the prepared suspensions were characterized for exchangeable cation composition,
particle size distribution, and clay mineralogy. The detailed procedures for the characterization were
described by Nga et al. (2012).
4.2.3 Flocculation experiments
The concentration of the purified imogolite and allophane suspensions were adjusted to 4800 mg
L-1 by diluting with deionized water. The flocculation experiments were performed by a jar tester
(MJS-3H, Miyamoto Co., Japan) in a room at 20-24 oC following Nga et al. (2012). A four hundred
mL portion of a 500 mg L-1clay suspension was placed in a 500 ml tall beaker and the impeller rod
was put in the suspension. Immediately after the addition ofthe allophane or imogolite sol, the
suspension was stirred at a speed of 300 rpm for 3 min and at 50 rpm for 5 min. The flocs were
allowed to settle for 30 min. A 10 mL portion of the supernatant was collected from 2cm below the

47
water surface and absorbance was measured at a wave length of 660 nm by a spectrophotometer
(U1900, Hitachi, Japan). All of the tests were carried out in triplicate.
To evaluate the allophane to imogolite ratio in the flocculant, a series of mixed sols whose
allophane to imogolite ratios were 4:0, 3:1, 2:2, 1:3 and 0:4 were prepared by mixing stock allophane
and imogolite suspensions. The flocculation test was carried out in a similar way described above at a
predetermined dose. Approximately 10 mL of the sediment was pipetted and spread in a petri dish,
and the morphology of the flocs was recorded by photographing.
4.3 RESULTS AND DISCUSSION
4.3.1 Properties of clay suspensions
Properties of the clay suspension used for the flocculation test were summarized in Table 2. The
K4 and F sample had mixed clay mineralogy but the T5 sample contained almost only kaolinite. The
pH of the suspension was in a range from 6.80 to 6.86. The effective cation exchange capacity of the
suspended clays, i. e., the sum of exchangeable cations was in a fairly large range from 3.7 to 99
cmolc kg-1. The exchangeable cation compositions (Ca, Mg, K and Na) are not shown in the table but
the fraction of Na was the largest because NaOH was added for pH adjustment (Nga et al., 2012).
Table 4.2. Colloidal properties of clay samples
Samples pH EC/
dS m-1
Average
particle
size/ nm
ECEC/
cmolc
kg-1
Clay mineral composition
(Approximate %)
K4 6.80 0.02 183 13.5 Kaolinite(27), Vermiculite-
chlorite(22), intergrade(22),
Mica(19), Vermiculite(10)
T5 6.82 0.02 86 6.2 Kaolinite(96), Iron oxide(4)
F 6.81 0.03 187 29.8 Kaolinite(19), Vermiculite(19),
Mica (17), Smectite(10), Quartz
(13)
Montmorillonite 6.86 0.04 224 99.0 Montmorillonite(100)
Kaolinite 6.86 0.04 384 3.7 Kaolinite(100)
(ECEC; Effective Cation Exchange Capacity)

48
4.3.2 Surface charge characteristics of allophane and imogolite
Fig. 4.1 shows the surface charge characteristics of allophane and imogolite used in the present
experiments, where the chloride adsorption was plotted as the amount of positive charge and sodium
adsorption was plotted as negative charge. The crosses in the figure indicate the net surface charge, i.
e., chloride adsorption minus sodium adsorption. The allophane exhibited both positive and negative
charges over the entire pH range examined and the positive charge increased as pH decreased while
the negative charge showed the opposite trend. The charge characteristic of the imogolite was
essentially similar to that of allophane but the magnitude of the charges is fairly large and less pH
dependent. The point of zero net charge (PZNC; Sposito, 1981) was 6.04 for allophane and 6.63 for
imogolite.
Fig. 4.1. Surface charge characteristics of allophane (left) and imogolite (right). Open and closed circles indicate Cl- adsorption (positive surface charge) and Na+ adsorption (negative charge),
respectively. The cross indicates the net surface charge.
4.3.3 Relative flocculating power of allophane and imogolite
The results of the flocculation tests for montmorillonite, kaolinite and the F soil clay are
graphically presented in Fig. 4.2, where the relative absorbance of the suspension after standing time
was plotted against flocculant dose. The relative absorbance is defined as the ratio of the absorbance
after flocculation test to that of the original clay suspension. For all of the suspensions, the absorbance
of the suspension was exactly proportional to the clay concentration in a range from 0 to 500 mg L-1
and it is basically possible to calculate the concentration of clay after flocculation and sedimentation.
pH5 6 7 8
Sur
face
cha
rge/
cm
olc
kg-1
-60
-40
-20
0
20
40
pH5 6 7 8
Sur
face
cha
rge/
cm
olc
kg-1
-40
-20
0
20
40

49
However, the relative absorbance but not the calculated clay concentration was plotted in this figure
because a part of the added allophane or imogolite may have remained in the supernatant after
flocculation test and contributed to the absorbance. The pHs of the suspension after flocculation test
did not differ significantly from the original ones.
Fig. 4.2 Relative turbidity of montmorillonite (left) and F soil clay (right) suspentions after addition of allophane sol (closed circle) or imogolite sol (open square).
For montmorillonite, the absorbance sharply dropped after 10 mL addition of the imogolite
suspension. The addition of allophane was also effective but 50 mL was required to reduce the
relative absorbance below 0.01. If the remnant allophane and imogolite is negligible, the
montmorillonite concentration after an addition of 10 mL of allophane and imogolite sol is calculated
to be 172 and 10 mg L-1, respectively, indicating that imogolite sol is much more effective for
removing suspended montmorillonite particles than allophane sol. Imogolite sol was also more
effective than allophane sol for flocculating the F soil clay. At an addition of 5 mL of allophane and
imogolite sol, the clay concentration is estimated to have dropped to 165 and 3.6 mg L-1, respectively.
These values indicate that the allophane and imogolite sols are approximately twice as much effective
for the F soil clay than for montmorillonite. Kaolinite was much more sensitive than montmorillonite
and the F soil clay and it flocculated almost completely with an addition of < 1 mL of allophane or
imogolite sol. The lowest absorbance was achieved at 5 m L- and 1 mL-addition for allophane and
imogolite, respectively. The slight increase in the absorbance at larger than optimum additions is
probably due to the remnant of excessive allophane or imogolite.
The flocculation of suspended layer silicate clays by allophane and imogolite is a typical hetero-
flocculation. Unlike homo-flocculation, colloidal particles of different kind coalesce even when their
surfaces carry electric charge of the same sign if the difference in the surface potential is large enough
(Kitahara and Furusawa, 1990). Even so, the experimental results of Nga et al. (2012) that the
Addition/mL
0 10 20 30 40 500.0
0.2
0.4
0.6
0.8
1.0
Addition/mL
0 10 20 30 40 50 60
Rel
artiv
e ab
sorb
ance
0.0
0.2
0.4
0.6
0.8
1.0
Addition/mL
0 2 4 6 8 100.0
0.2
0.4
0.6
0.8
1.0
Montmorillonite FKaolinite

50
optimum dose of an allophanic flocculant depended on the amount of negative charge on the
suspended clay particles rather than on their -potential indicated that the charge neutralization is an
important factor. Since imogolite exhibits more positive charge as well as net positive charge at
around pH 6.8 (Fig. 4.1), the higher performance of imogolite is considered to be at least partly due to
the larger extent of charge neutralization.
Fig. 4.3. Relationship between relative absorbance of clay suspension after the addition of a fixed volume of mixed sols and its imogolite content. The sample name and the added volume are indicated in each graph. The dotted lines in graphs for the F soil clay and montmorillonite are calculated lines assuming allophane and imogolite contributed independently.
Each graph in Fig. 4.3 shows the relationship between relative absorbance of a clay suspension
after addition of a predetermined volume of the mixed allophane-imogolite sol and the percentage of
imogolite in the mixed sol. The volume of the sol added was 2 mL for the K4 and T5 soil clays, 5 mL
for the F soil clay and kaolinite and 10 mL for the montmorillonite. These volumes correspond to the
minimum dose of the imogolite sol required to reduce the relative absorbance to below 0.01 which
were determined by a series of preliminary experiments. The graphs in Fig. 4.3 clearly show that the
% Imogolite0 25 50 75 100
Rel
ativ
e abs
orb
ance
0.000
0.005
0.010
0.015
0.020
% Imogolite0 25 50 75 100
0.00
0.05
0.10
0.15
0.20
% Imogolite0 25 50 75 100
0.00
0.10
0.20
0.30
0.40
% Imogolite0 25 50 75 100
Rel
ativ
e ab
sorb
ance
0.00
0.10
0.20
0.30
0.40
0.50
% Imogolite0 25 50 75 100
0.000
0.005
0.010
0.015
0.020
0.025
K4 (2 mL) T5 (2 mL) F (5 mL)
Montmorillonite (10 mL) Kaolinite (5 mL)

51
imogolite sol was more effective for flocculating all five clay suspensions. Particularly for the T5, F
soil clays and montmorillonite, the relative absorbance after addition of the allophane sol was as high
as 0.15, 0.37 and 0.44 as compared to that of < 0.01 after addition of imogolite sol.
Fig. 4.4. Photographs of flocs formed after flocculation experiments on the T5 soil clay suspension. Top left: imogolite sol, top right: mixed sol containing 25% imogolite, bottom left: mixed sol containing 50% imogolite, and bottom right: imogolite sol. White spots appears on the photographs are reflections of illuminating LED lights.
Fig. 4.4 shows the photographs of the flocs formed and settled when the T5 soil clay was treated
with the sols containing 0, 25, 50 and 100% of imogolite. The morphologies of the flocs formed by
mixed sols containing 75% (not shown) and 100% imogolite were similar. The size of the flocs was
so small to resolve by naked eyes when allophane sol was applied. As the percentage of imogolite in
the mixed sol increased the size of the formed flocs distinctly increased. The treatment with the
imogolite sol yielded fairly large flocs having a span of a few mm, although it was difficult to define
the exact size and shape. These trends were common to all of the clay suspensions. The photographs
show that the flocs formed are fluffy and porous particularly when the imogolite content of the sol
was >50%. This is probably they were made up of imogolite thread bridging layer silicate clay
particles. The electron microscopic examination of a freeze-etched suspension of mixed
montmorillonite and imogolite (Horikawa et al., 1976) showed such assemblages.
All the experimental plots in Fig. 4.3 are concave. This is a natural result since the imogolite sol
is more effective than allophane sol for flocculating suspended clay particles. But it is difficult to

52
judge from these plots whether the flocculating action of allophane and imogolite was additive,
synergic or negatively synergic. If the action of allophane and imogolite is additive, the relative
absorbance of a clay suspension treated with a mixed sol can be calculated from the results of a series
of flocculation experiments with pure allophane and imogolite. The relative absorbance of a clay
suspension after an addition of 10 mL of mixed allophane-imogolite sol containing 20% imogolite, for
example, is given by the following equation;
Rmix20,10 = 1-{(1-RI, 2) + (1-RA,8)}
Where Rmix,20,10 is the expected relative absorbance after addition of 10 mL of the mixed sol
containing 20% of imogolite, RI, 2 is the relative absorbance after addition of 2 mL of the imogolite sol,
and RA8 is the relative absorbance after addition of 8 mL of the allophane sol. The latter two quantities
were read from the regression curves for the plots shown in Fig. 4.2. The Rmix value was set to 0 when
the calculated value was < 0. The dotted lines in Fig. 4.3 are the calculated curves for montmorillonite,
kaolinite and the F soil clay. The comparison of the experimental and calculated curves
formontmorillonite indicates that the flocculation action of allophane and imogolite was additive. On
the other hand, the calculated curves lies far below the experimental curves for kaolinite and the F soil
clay, indicating that the flocculation action of allophane and imogolite was negatively synergic.
The negative synergy observed for the F soil clay and kaolinite can be explained by the
association of allophane and imogolite in mixed suspensions. Horikawa et al. (1976) examined freeze-
etched suspensions of mixed allophane and imogolite and found that aggregates of allophane attached
on the threads of imogolite. Horikawa (1976) measured the electrophoretic mobility of particles in
mixed allophane and imogolite suspensions and reported that the particles in the mixed suspensions
behaved like pure imogolite. These results suggest that allophane and imogolite in mixed suspensions
do not behave independently and at least a part of allophane attaches on imogolite fibers, resulting in
less frequent collision of allophane and suspended clay particles. If all of the allophane associates
with imogolite and it no longer functions in flocculation, the relative absorbance of the F soil clay
after treatment of 5 mL of mixed sol containing 25 and 50% imogolite may approximate to the
relative absorbance after addition of 1.25 and 2.5 mL of the pure imogolite sol, respectively. The
values read from the experimental curve for imogolite in Fig. 4.2 (right) are 0.30 after 1.25 mL
addition and 0.092 after 2.5 mL addition, which are significantly higher than the experimental values
after mixed sol addition. This indicates that allophane also contributed to the flocculation to a certain
extent.
It is difficult to draw a general conclusion from this study because the number of experimental
data was limited due to the limited availability of the pure imogolite sol. A possible tentative
conclusion about the mode of interaction of allophane-imogolite mixture and layer silicate clay
minerals is that the flocculation action of allophane and imogolite is basically negatively synergic due

53
to their close association in the mixture but the extent of negativity differs depending on the properties
of layer silicate minerals. The observation of the flocs formed in ternary allophane-imogolite-layer
silicate suspensions by cryo-transmission electron microscopy will be useful in elucidating the
flocculation mechanism.
The experimental results from this study and considerations indicate that imogolite is much more
effective as a flocculating agent for layer silicate suspensions. Weathered volcanic ash containing
more imogolite is suitable for a material for manufacturing flocculating agent for processing soil clay
suspensions. The graphs for the K4 and T5 clays and kaolinite, the relative absorbance steeply
decreased as the imogolite content increased from 0 to 25%. This implies that the imogolite to
allophane ratio of 1:3 is a criterion in screening weathered volcanic ash to prepare a high performance
flocculating agent. Unfortunately, however, there is no reliable and convenient method for quantifying
allophane and imogolite. Developing such method will be important in utilization of weathered
volcanic ash resources.
4.4 CONCLUSIONS
Imogolite is much more effective as a flocculating agent for layer silicate suspensions than
allophane. Weathered volcanic ash containing more imogolite is suitable for a material for
manufacturing flocculating agent.
REFERENCES
Horikawa, Y., 1976. Electrophoretic mobility of binary mixtures of imogolite and some other clay
minerals in aqueous suspensions. Clay Sci., 5, 43-50.
Kashiwai, J and Yuki, K., 2006. Flocculating action of natural allophone. Engineering Dams., 239,
20-28.
Kitahara, F. and Furusawa, K., 1990. Modern Colloid Chemistry, Kodansha-Scientific, Tokyo. (in
Japanese).
Kuchibune, A., Morimoto, T. and Wada, S-I., 2006. Preparation of efficient coagulant from clays.
Proc.16th Symposiumon Geo-Environments and Geotechniques, 63-66. (in Japanese).
Mallevialle, J., Bruchet, A and Fiessinger, F., 1984. How safer are organic polymers in water
treatement?J. Amer. Water Works Assoc., 76, 87-93.
Nakanishi, R. and Wada, S -I., 2007. Reactivity with phosphate and phytotoxicity of hydroxyl
alumino silicate ions synthesized by instantaneous mixing of aluminum chloride and sodium
orthosilicate solutions. Soil Sci. Plant Nutr., 53, 545-550.
Nga, N. T. H., Inenaga, Y., Mori, Y. and Wada, S -I., 2012. Effects of mineralogy of suspended
materials on performance of weathered volcanic ash-based flocculant. Accepted for publication in
Clay Sci.
54
Sposito, G., 1981. The operational definition of the zero point of charge in soils. Soil Sci. Soc. Amer.
J. ,45, 292-297.
Tripathy, T and Deranjan, B., 2006. Flocculation: A new way to treat the waste water. J.Physical
Sciences, 10, 93-127.
Wada, K and Okamura, Y., 1980. Electric charge characteristics of Ando A1 and buried A1 horizon
soils.J. Soil Sci., 31, 307-314.
Wada, S-I., 2001. A procedure for separation and purification of allophane from weathered pumice.
Nendokagaku, 40, 242-248. (in Japanese).
Zhang, Z., Xia, S., Zhao, J. and Zhang, J., 2010. Characterization and flocculation mechanisms of
high efficiency microbial flocculant TJ-F1 from Proteus mirabilis. J.ColloidsSturf., 75, 247-251.

55
CHAPTER 5. MINERALOGY OF LATERITE SAMPLES FROM VIET NAM AND THEIR USE AS FLOCCULATING AGENTS FOR REMOVAL OF
SUSPENDED CLAY PARTICLES FROM WATER
__________________________________________________________________________________
ABSTRACT
The existence of suspended clay particles is one of main factors for high turbidity in water.
Flocculation is a common technique used to eliminate suspended materials from water. Currently, a
variety of flocculating agents have been found as commercial products and applied to purify water.
Most of agents works well and bring positive effects on environment. However, the use of some
agents has shown problems relating to economic benefits and environment. The treatment cost and
environmental safety evoke the increasing interests in not only developing countries but also in
developed countries. To solve these problems, many researchers have been carrying out researches to
improve materials for treatment. The present study aims at understanding mineralogy of the laterite
samples distributed in Viet Nam and at evaluating their use ability as flocculating agent for suspended
clay particle removal. Three laterite samples were used for experiments in this study. The laterite
sample collected in Thach That region (1-TT) performed the best flocculation efficiency followed by
the laterite sample collected in Hoa Lac region (2-HL). The sample collected in Quynh Tam
commune (3-QT) worked less efficiently than other two samples. Goethite, gibbisite and hematite are
considered to be the main components that are responsible for flocculation action.
Key words: Clay particle, flocculation, geothite, hematite, laterite, water processing
--------------------------------------------------------------------------------------------------------------------------
5.1 INTRODUCTION
The suspended clay particles in water are main pollutants that cause turbidity in water
environment. Removal of suspended particles is an essential operation in water treatment.
Flocculation technique is a common way that is used to remove suspended materials from natural
waters. In flocculation process, flocculating agents are added to overcome electrostatic repulsion and
promote coalescence of the suspended particles to form large flocs that settle down rapidly (Tripathy
and De Ranjan, 2006).
The synthetic agents, such as poly-diallyl dimethyl ammonium chloride (PDADMAC or Cat-
Floc), used either alone or in combination with alum, have been reported to be effective in
flocculation of negatively charged suspended particles in water (O’Melia, 1972; Faust and Aly, 1983).
Long chain synthetic polymers are also popular flocculating agents to remove suspended materials via

56
bridging and electrostatic patch mechanism (Tripathy and De Ranjan, 2006). Zhang et al. (2010)
reported that a microbial polymer was effective for flocculating synthetic kaolinite suspensions.
Chitosan, a product made from crab shell, is very effective to remove suspended organic materials
(Tripathy and De Ranjan, 2006) with less negative effects on the environment.
The flocculating agents have brought undoubted benefits in water treatment. However, negative
effects on the environment have been found by the use of some agents. Aluminum salts and synthetic
polymers cause possible physiological effects on organisms (Nakanishi and Wada, 2007) as well as
aluminum accumulation in the environment and its connection with Alzheimer disease (Stauber et al,
1999). Some natural substances such as chitosan and carboxymethyl cellulose are nontoxic to
environment, available from renewable resources and very effective for pollutant removal (Divakaran
and Pillai, 2001) but they are not stable against microbial attack during storage (Tripathy and De
Rajan, 2006; Zhang et al., 2010) and may increase the biological oxygen demand of processed water
if high dose is used. Therefore, flocculating agents with high treatment efficiency and less negative
effects on the environment is needed for advanced water treatment in aquatic systems.
Flocculants made from natural volcanic ash soil were reported by Nga et al. (2012b), which were
effective in removing pollutants from water at a low treatment cost. The flocculant made from
volcanic soil was found to be as effective as PAC for flocculating suspended clay particles in some
natural reservoirs but their flocculation efficiency largely depended on clay mineralogy (Kuchibune et
al., 2006; Nga et al., 2012a). Laterite, the in-situ weathering and decomposition products of rocks, is
abundant in the tropical and sub-tropical regions and rich in sesquioxides (Fe2O3 or Al2O3). Thus they
are possibly applied for water treatment (Blight, 1997; Nga et al., 2012b). The study of Udoeyo et al.
(2010) indicated high absorption capacity for heavy metals of laterite materials. Lateritic soils have
been used as effective sorbents for arsenic in groundwater (Majiet al., 2006; Rahman et al., 2008;
Maiti et al., 2010). In addition, laterite adsorbs phosphorous in natural lakes and landfills (Zhang et al.,
2011).
The laterite is abundantly distributed in many regions in Viet Nam due to strong laterization. The
characteristics of laterite would be different depending on regional climate and geology. The laterite
materials are of high potential use in environmental treatments, but the laterite materials in Viet Nam
have not been received due attention. Mineralogy of materials has been considered as an important
factor affecting the removal of suspended particles (Nga et al., 2012a). Therefore, in the present study,
mineralogy of laterite samples from Viet Nam and their ability as a flocculating agent to remove
suspended clay particles were investigated.

57
5.2 MATERIALS AND MOTHODS
5.2.1 Laterite samples
Three laterite samples, 1-TT, 2-HL and 3-QT, were collected from lateric soil zones in Viet Nam
indicated in Fig 5.1. The 1-TT sample was collected from a layer at a depth of 1.5m in Thach That
town where completely weathered laterite is distributed. The original sample is a hard block with dark
yellow color. The 2-HL sample was found in excavated soil at a construction site. It is a hard block
containing red solid gravels. The 3-QT sample was taken from a laterite profile at a depth of 0.5 m
from the surface. The raw sample was a hard block with black grey color.
The original samples were washed with tap water and air-dried at a room temperature. They were
gently crushed to pass through a 2-mm screen. Aliquot of the treated samples was mixed well with
distilled water, and adjusted to pH 5-6 with0.1 mol L-1 HCl and sonicated. The prepared three
flocculant samples had dry matter content of 131 gL-1, 127gL-1and 91gL-1for1-TT, 2-HL and 3-QT,
respectively.
Fig. 5.1. Sampling locations and imagines of raw laterite samples.
5.2.2 Clay suspensions
Clay suspensions used for flocculation tests were prepared from two soil samples and two
specimen clays (Table 5.1) following the procedure described by Nga et al. (2012a). A five-gram
portion of the soil or clay sample was mixed with 1 L of deionized water and sonicated for 15 min

58
after pH adjustment to about 8 with 0.1 mol L-1NaOH. The dispersed suspension was put into
sedimentation cylinder and the fraction having equivalent spherical diameter of <2 µm was separated
by siphoning. This step was repeated using several portions of the samples to obtain sufficient amount
of clay suspension for flocculation tests. The separated stock clay suspensions were kept in a
polypropylene bottle with fitted stopper and diluted with deionizer water just before use.
Table 5.1. Source of soil and clay samples
Sample name Source
T5 B22 horizon of Haplustox in NakhonRatchasima, Thailand
F Ap horizon of Fluvaquents in Fukuoka, Japan
Kaolinite Iriki mine, Kagoshima, Japan
Montmorillonite Kunipia-F supplied by Kunimine Co., Tokyo, Japan
5.2.3 Mineralogy and surface characteristic analysis of clay suspensions and laterite samples
Mineralogy of the laterite samples were analyzed for four components (clay, silt, fine sand and
coarse sand) by X-ray diffraction (RINT-2000V, Rigaku) following the procedure of Nga et al.
(2012a).
Mineralogical analysis of the clay suspensions by X-ray diffraction was carried out following the
procedure described by Wada and Umegaki (2001) with a Cu Kα radiation at 40 kV and 20 mA.
Exchangeable cation composition was determined by 1 mol L-1NH4OAc extraction. For clay
suspensions, the principle of Nga et. al. (2012) was applied. A clay suspension containing 200 mg of
clay was placed on a 0.1µm membrane filter and washed with 50 mL of the NH4OAc solution under
suction. For laterite samples, the method of Muramoto et al. (1992) was applied. Two gram portion of
a laterite sample was extracted three times with 30 mL the NH4OAc solution. The extract was
analyzed for Ca2+, Mg2+, Na+ and K+ by atomic absorption spectroscopy (Z2300, Hitachi, Japan).
Particle size distribution of the laterite samples was determined by siphoning method. The air-
dried samples after organic matter digestion were separated by sonication for 15 minutes. Clay, silt
and sand fractions were collected after respective settling time by siphoning.
Surface charge of laterite samples was determined by serial potentiometric titration method. Five
gram portion of the sample was equilibrated with NaCl solutions having different pHs for 4 hours
keeping ionic strength at 0.005 mol L-1, 0.02 mol L-1or 0.1 mol L-1. The point of zero salt effect
(PZSE), which is the pH value where net proton surface charge density is unaffected by changes in
ionic strength, was determined as the crossover pH value of potentiometric acid-base titration analysis
performed at different ionic strengths. Effects of PZSE on the vanishing of surface charge component
is indirect. Therefore, PZNC (the point of zero net charge) is interpreted instead of PZSE in this study.

59
5.2.4 Thermal analyses
Differential thermal and gravimetric analysis (DTA-TG) was carried out simultaneously using
the system of Rigaku Thermo plus EVO. The samples were heated from 20 to1000oC for at a heating
rate of 10 oC min-1. The amount of sample used in each test was 10mg.
5.2.5 Flocculation experiments
The flocculation experiments were performed witha jar tester (MJS-3H, Miyamoto Co., Japan) in
a room at 20-24 oC following the procedure of Nga et al. (2012a). A four hundred mL portion of a 500
mg L-1clay suspension was placed in a 500 mL tall beaker and the impeller rod was put in the
suspension. Immediately after the addition of predetermined dose of laterite flocculants, the
suspension was stirred at a speed of 300 rpm for 3 min and at 50 rpm for 5 min. The flocs were
allowed to settle for 30 min. A 10 ml portion of the supernatant was collected from 2cm below the
water surface and absorbance was measured at a wave length of 660 nm by a spectrophotometer
(U1900, Hitachi, Japan). All of the tests were carried out in triplicate.
5.3 RESULTS AND DISCUSSION
5.3.1 Mineralogy and surface charge characteristics of laterite samples
X-ray diffraction patterns of the Mg-saturated and glycerol-solvated clay fractions and fine sand
fractions of three laterite samples are shown in Fig. 5.2. The clay fractions of the 1-TT and 2-HL
samples showed fairly strong peaks at 0.7, 0.418, 0.35 and 0.269 nm, indicating that these samples
contain kaolinite and goethite and hematite. In addition, the 1-TT sample showed weak peak at 1.4 nm,
indicating that it contain small amount of non-expandable 2:1 layer silicates. The weak peak at 0.487
nm indicates that all the samples contain gibbsite. The 3-QT sample showed a significantly different
mineralogy in that it is dominated by quartz and contained much less amount of kaolinite but it
contained goethite and hematite. The dominance of 0.425 and 0.334 nm peaks in the X-ray diffraction
patters for fine sand samples indicate that the major mineral in the fine sand fraction is quartz. The
small but distinct peak at 0.418 and 2.69 nm shows that the fine sand fractions also contain goethite
and hematite. The silt and coarse sand fractions exhibited similar X-ray patterns.

60
Fig. 5.2. X-ray diffraction diagram of 1-TT, 2-HL and 3-QT.
The results of thermal analyses are shown in Fig. 5.3. All the samples showed clear endothermic
peaks centered at around 50, 320°C and corresponding weight losses. The 1-TT and 2-HL samples
exhibited an additional large endothermic peak at 480°C but the 3-QT sample showed only a faint
peak at that temperature. The endothermic peak at 50°C obviously came from desorption of adsorbed
water. And the peaks at 320 and 480°C are assigned to dehydration reaction of hydroxide minerals
and kaolinite, respectively. Although goethite dehydrates at lower temperature than gibbsite, the
endothermic peak centered at around 320°C contains contribution of both gibbsite and goethite. These
results harmonize with X-ray diffraction patterns shown in Fig. 5.2, particularly in that the 3-QT
sample showed very weak diffraction peak at 0.7 nm. The 2-HL and 3-QT samples showed large
endothermic peaks at around 840°C but they did not accompany weight loss. The origin of these
endothermic peaks was not identified.
The dehydration reaction of gibbsite and kaolinite are expressed as
2Al(OH)3 = Al2O3 + 3H2O (5.1)
and
Si4Al4O10(OH)8 = SiO2.Al2O3 + 4H2O (5.2)
The weight loss from 200 to 400°C was about 0.5 mg for all three samples. If this came from the
dehydration of gibbsite, the stoichiometry in the reaction (5.1) gives the gibbsite weight of 1.4 mg in
10 mg sample. Similarly, the weight of kaolinite in is estimated to be 1.4 mg for the 1-TT and 2-HL
samples and 0.71 mg for the 3-QT sample.
0.141 0.7
0.4250.418
0.334
0.325
0.269
0 10 20 30 40 50 60 70
1‐TT
2‐HL
3‐QT
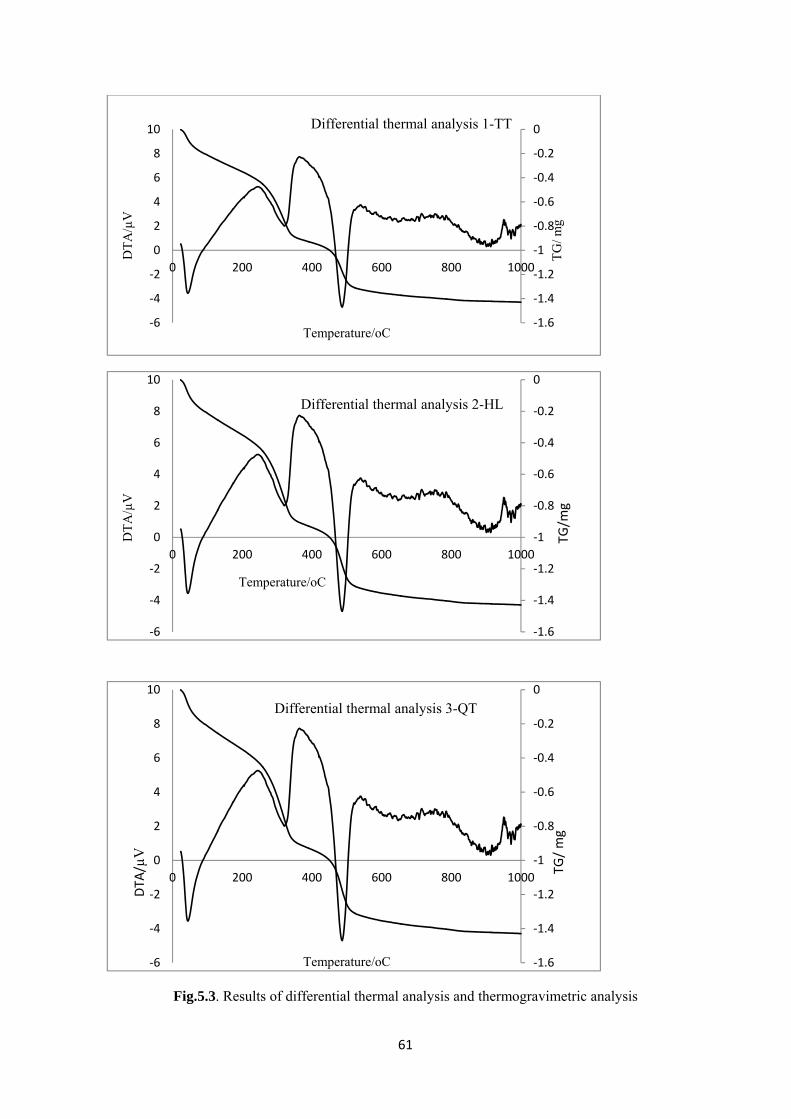
61
Fig.5.3. Results of differential thermal analysis and thermogravimetric analysis
‐1.6
‐1.4
‐1.2
‐1
‐0.8
‐0.6
‐0.4
‐0.2
0
‐6
‐4
‐2
0
2
4
6
8
10
0 200 400 600 800 1000
Temperature/oC
Differential thermal analysis 1-TTD
TA
/µV
TG
/ mg
‐1.6
‐1.4
‐1.2
‐1
‐0.8
‐0.6
‐0.4
‐0.2
0
‐6
‐4
‐2
0
2
4
6
8
10
0 200 400 600 800 1000
Differential thermal analysis 2-HL
TG/m
g
Temperature/oC
DT
A/µ
V
‐1.6
‐1.4
‐1.2
‐1
‐0.8
‐0.6
‐0.4
‐0.2
0
‐6
‐4
‐2
0
2
4
6
8
10
0 200 400 600 800 1000
Temperature/oC
Differential thermal analysis 3-QT
DTA
/µV
TG/ mg
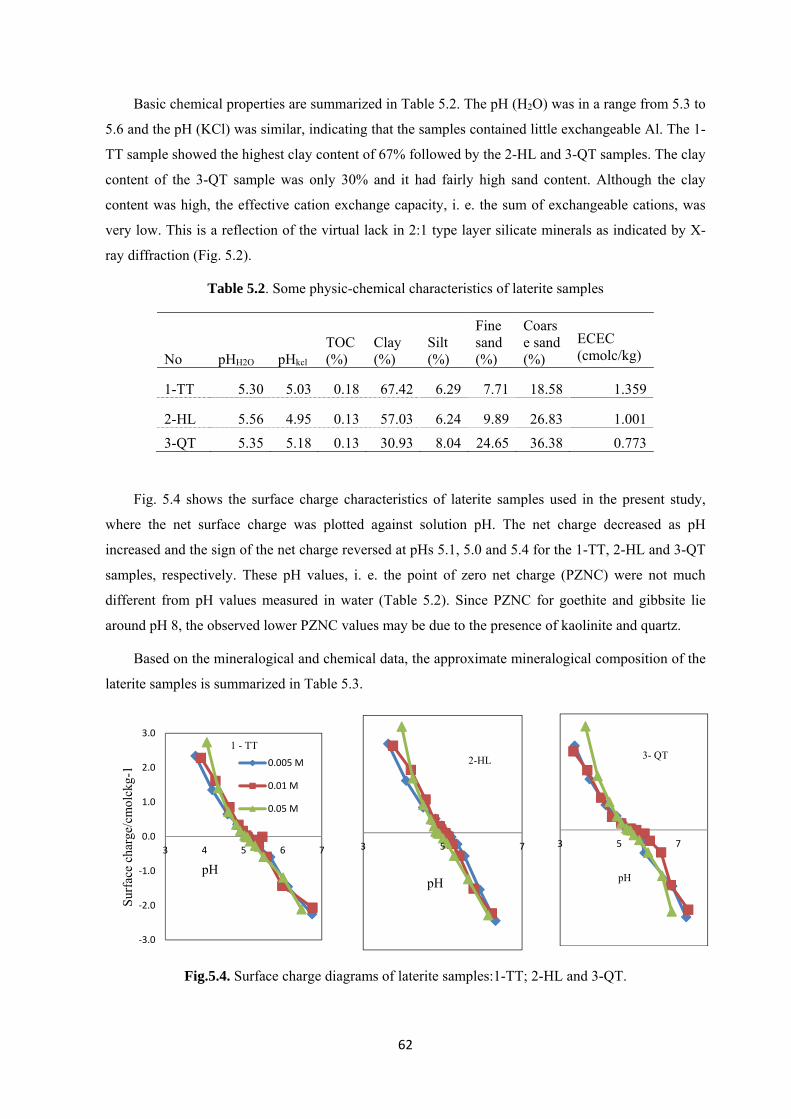
62
Basic chemical properties are summarized in Table 5.2. The pH (H2O) was in a range from 5.3 to
5.6 and the pH (KCl) was similar, indicating that the samples contained little exchangeable Al. The 1-
TT sample showed the highest clay content of 67% followed by the 2-HL and 3-QT samples. The clay
content of the 3-QT sample was only 30% and it had fairly high sand content. Although the clay
content was high, the effective cation exchange capacity, i. e. the sum of exchangeable cations, was
very low. This is a reflection of the virtual lack in 2:1 type layer silicate minerals as indicated by X-
ray diffraction (Fig. 5.2).
Table 5.2. Some physic-chemical characteristics of laterite samples
No pHH2O pHkcl TOC (%)
Clay (%)
Silt (%)
Fine sand (%)
Coarse sand (%)
ECEC (cmolc/kg)
1-TT 5.30 5.03 0.18 67.42 6.29 7.71 18.58 1.359
2-HL 5.56 4.95 0.13 57.03 6.24 9.89 26.83 1.001
3-QT 5.35 5.18 0.13 30.93 8.04 24.65 36.38 0.773
Fig. 5.4 shows the surface charge characteristics of laterite samples used in the present study,
where the net surface charge was plotted against solution pH. The net charge decreased as pH
increased and the sign of the net charge reversed at pHs 5.1, 5.0 and 5.4 for the 1-TT, 2-HL and 3-QT
samples, respectively. These pH values, i. e. the point of zero net charge (PZNC) were not much
different from pH values measured in water (Table 5.2). Since PZNC for goethite and gibbsite lie
around pH 8, the observed lower PZNC values may be due to the presence of kaolinite and quartz.
Based on the mineralogical and chemical data, the approximate mineralogical composition of the
laterite samples is summarized in Table 5.3.
Fig.5.4. Surface charge diagrams of laterite samples:1-TT; 2-HL and 3-QT.
‐3.0
‐2.0
‐1.0
0.0
1.0
2.0
3.0
3 4 5 6 7
Sur
face
cha
rge/
cmol
ckg-
1
pH
1 - TT
0.005 M
0.01 M
0.05 M
3 5 7
pH
2-HL
3 5 7
pH
3- QT

63
Table.5.3. Mineralogy identification of laterite samples
Sample Fraction Identification
1-TT Clay Mica; kaolinite; Geothite; feldspars Silt Kaolinite; Geothite; Quazt; Feldspars
Fine sand Quazt; Geothite
Coarse sand Kaolinite; Geothite; Quazt
2-HL Clay Kaolinite; Geothite; Feldspars
Silt Kaolinite; Geothite; Quazt; feldspars
Fine sand Geothite; Quazt
Coarse sand Kaolinite; Geothite; Quazt; hematite, Feldspars
3-QT Clay Kaolinite; hematite; Quazt; Feldspars
Silt Quazt
Fine sand Quazt
Coarse sand Geothite; Quazt
5.3.2 Mineralogy and colloidal properties of clay suspensions
The X-ray diffraction patterns of the soil clay samples used for the flocculation tests are shown in
Fig. 5.5. The strong peak at 0.7 and 0.35 nm in the T5 sample indicate that kaolinite predominates.
The broad at 1.7-1.9 nm and 1.0 nm in the F sample show that it contains smectite and micaseous
minerals. The approximate contents of layer silicate minerals and quartz that were estimated by the
procedure described by Mosslehuddin (1998), Nguyen (2008) and Wada and Greenland (1970) were
already reported by Nga et al. (2012a).
Fig.5.5.Mineralogy of soil clay suspensions (T5 and F samples).
0.7
T5
1.4
1.00.34
F
0 5 10 15 20 25 30 35

64
Properties of the clay suspensions used for the flocculation tests were summarized in Table 4.
The suspension pH ranged from 6.81 to 6.86. The electric conductivity was low and not much
different among samples. The T5 sample had the smallest average particle diameter of 86 nm, while
the kaolinite sample had the largest average diameter of 384 nm. The ECEC of the suspended clays
was in a large range from 3.7 to 99 cmolc kg-1. The fraction of Na was the largest among the
exchangeable cations because NaOH was added for pH adjustment (Nga et al., 2012a).
Table 5.4. Colloidal properties of clay samples
Samples pH EC/
dS m-1
Exchangeable cations/cmolckg-1 Average
particle
size/ nm
Average zeta
potential/
mV Na+ K+ Ca+2 Mg2+
T5 6.82 0.02 3.35 0.40 1.68 0.72 86 -45.1
F 6.81 0.03 4.95 2.11 17.22 5.53 187 -36.6
Montmorillonite 6.86 0.04 77.41 1.96 14.83 4.82 224 -55.7
Kaolinite 6.86 0.04 2.75 0.21 0.40 0.31 384 16.7
5.3.3 Flocculation tests
The fluffy flocks formed when the flocculants were added and clay suspensions were vigorously
stirred at a speed of 300 rpm. During the continued stirring at 50 rpm, the flocs grew in size and they
loosely deposited on the bottom of the beaker after 30 min of the standing time. A 10 mL portion of
the supernatant was sampled from a depth of 2 cm from the surface and its absorbance at 660 nm was
measured. The results of the flocculation experiments are graphically presented in Fig 6, where the
averaged relative absorbance at three replications was plotted against the flocculant dose. In general,
the absorbance decreased as the flocculant dose increased and then increased again past optimum dose.
The re-increase in absorbance is probably due to the presence of the excess flocculent and/or re-
dispersed clay particles (Nga et al., 2012a).This observation was also in good agreement with the
results by Nga et al. (2012b) on the kaolinite removal from water by volcanic and laterite materials.
The montmorillonite suspension showed different response when the 3-QT slurry was added in that
the absorbance exceeded that of the original montmorillonite suspension by about 20% (Fig. 5.6).
The lowest relative absorbance of about 0.01 indicates that 99% of the suspended clay particles
were removed from the suspension. Considering the pHs of the clay suspensions and the PZNC the
mutual flocculation of the added laterite and clay particles were due to the charge neutralization. The
suspension pHs during flocculation experiment were close to those of the original clay suspensions, i.
e., around 6.8, because the volume of the added flocculants remained mostly < 10% of the volume of
the clay suspension. Since the PZNCs are around 5, the net surface charge is negative at round pH 6.8.

65
This is seemingly contradictory to the charge neutralization. But it is not unreasonable to expect the
mechanism because gibbsite and goethite would have had positive surface charge even at pH7. Follett
(1965) proved that electrostatic attraction force was dominated in retention of amorphous and
colloidal ferric hydroxides by kaolinite. He also concluded that no bonding rearrangement occurred
upon sorption of ferric colloids onto kaolinite. Weiss and Russow (1963) also indicated a similar
association behavior of positively charged AgI particles by clay particles.
Fig. 5.6. Flocculation experiments of clay suspensions by laterite flocculants.
The results of the flocculation tests indicated that the amount of flocculant required to achieve
the lowest absorbance was different for clay suspensions. The respective optimum dose of the
flocculant made from 1-TT, 2-HL and 3-QT were 50, 70 and 120 mL for montmorillonite, 35, 40 and
60 mL for the F sample, 20, 25 and 35mL for T5 sample and 5, 6, and 9 mL for kaolinite. Nga et al.
(2012a) reported that the mineralogical characteristics of clay suspensions affected the flocculation
0
0.02
0.04
0.06
0.08
0.1
0.12
0 50 100 150
Absorbance
Flocculant dose/mL
Montmorilonite
1‐TT
2‐HL
3‐QT
0
0.1
0.2
0.3
0.4
0.5
0.6
0.7
0.8
0 20 40 60 80 100
Absorbance
Flocculant dose/mL
F
1‐TT
2‐HL
3‐QT
0
0.05
0.1
0.15
0.2
0.25
0 10 20 30 40 50
Absorbance
Flocculant dose/mL
T5
1‐TT
2‐HL
3‐QT
0.000
0.100
0.200
0.300
0.400
0.500
0 5 10 15 20 25
Absorbance
Flocculant dose/mL
Kaolinite
1‐TT
2‐HL
3‐QT

66
efficiency. According their experimental results, suspensions containing smectite required larger
flocculant dose (Nga et al., 2012a). The present results are in accordance with that, the T5 sample a
kaolinite having low ECEC needed small amount of flocculants whereas montmorillonite and the F
clay sample needed much more flocculant dose. Another factor for the very high flocculation
efficiency for kaolinitic suspensions is that kaolinite has PZNC of about 3.0 as interpreted by Nga et
al. (2012b) and Horikawa (1976).
The flocculation performance of the three laterite flocculants was obviously different. The 1-TT
sample gave the highest flocculation efficiency followed by the 2-HL sample, and 3-QT and this trend
was common to the results from all four clay suspensions. The trend was marked for
montomorillonite (Fig. 5.6). The gibbsite and goethite content of the 3-QT laterite seems comparable
with those of other laterite samples (Fig. 5.2 and 5.3). The surface charge characteristics for the three
laterite samples were also similar (Fig. 5.4). One possible reason for the observed lower flocculation
efficiency is the lower goethite content as indicated by the X-ray diffraction pattern in Fig. 5.2. In
addition fine quartz particles may have remained in the suspension. This may explain the relative
absorbance over 1 observed for montmorillonite (Fig. 5.6).
5.4 CONCLUSIONS
The flocculants made from laterites in Viet Namare able to remove suspended clay particles via
charge neutralization mechanism. The flocculation efficiency significantly depends on mineralogy
and surface charge characteristics of both clay suspensions and laterite flocculants. Iron oxide
minerals, e. g, geothite and hematite in the laterite are considered to be the factors contributing to
flocculation.
REFERENCES
Blight, G. E. ,1997. Mechanics of residual soils. A. A.Balkema, the Netherlands.
Divakaran, R. and Pillai, S., 2001. Flocculation of kaolinite suspensions in water by chitosan. Wat.Res,
16, 3904-3908.
Faust, S. D. and Aly, O. M., 1983. Removal of particulate matter by coagulation. Chemistry of water
treatment., Chapter 5. Butterworth Publisher, Boston, 277-367.
Horikawa, Y., 1976. Electrophoretic mobility of binary mixtures of imogolite and some other clay
minerals in aqueous suspensions., Clay Sci., 5, 43-50.
Kuchibune, A.,Morimoto, T. and Wada, S-I., 2006. Preparation of efficient coagulant from clays.
Proc.16th Symposiumon Geo-Environments and Geotechniques., pp.63-66. (in Japanese).

67
Maiti, A., Jayanta, K., Kumar, B., Sirshendu, D., 2010. Synthetic and natural groundwater using acid
active laterite. J.Enviromenal progress and sustainable energy., 4, 457-470.
Maji, S. K., Jal, A. J. and Pal, T., 2006. Arsenic removal from real-life groundwater by absorption on
laterite soil.J. Hazad. Mater., 151, 811-820.
Moslehuddin, A. Z. M.., 1998. Mineralogy and potassium chemistry of Bangladesh paddy soil.Ph. D.
dissertation. Kyushu University, Japan.
Nakanishi, R. and Wada, S. -I., 2007. Reactivity with phosphate and phytotoxicity of
hydroxylaluminosilicate ions synthesized by instantaneous mixing of aluminum chloride and
sodium orthosilicate solutions. Soil Sci. Plant Nutr., 53, 545-550.
Nga, N. T. H., Ienaga, Y., Mori, Y and Wada, S. -I., 2012a. Effects of mineralogy of suspended
materials on performance of weathered volcanic ash-based flocculant. J. Clay Sci., 16, 33-39.
Nga, N. T. H., Mori, Y. and Wada, S-I., 2012b. Removal of kaolinite suspensions from water using
soil based flocculants. Collaborative project for Soil and water conservation in Southeast Asian
watersheds: 34-38.
O`Melia, C. R., 1972. Physicochemical Processes for water quality control. Wiley, New York.
Rahman, I. M.., Iwakabe, M, K. and Kawasaki, J., 2008. Laterite a potential alternative for removal of
ground water arsenic. Appl.Sci.Enviro.Manage., 1, 93-100.
Stauber, J. L., Florence, T. M., Davis, C. M., Davis, Adam, M. S. and Buchana, S. J., 1999
Bioavailability of Al in alum-treated drinking water. J.Am. WaterWorks Assoc., 91, 84-93.
Tripathy, T. and Ranjan, B. D., 2006. Flocculation: A new way to treat the waste water. J.Phys. Sci.,
10, 93-127.
Udoeyo, F. F, B., Robert, Inyang, H. and Sunyoung, B., 2010. Imo lateritic soil as an absorbent for
heavy metals. IJ.RRAS., 1, 4-5.
Wada, K. and Greenland, D. J., 1970. Selective dissolution and differential infrared spectroscopy for
characterization of amorphous constituents in soil clay. Clay Miner., 8, 241-254.
Weiss, A. J. and Russow., 1963. The location of exchangeable cations on kaolinites Proc. Int. Clay
Conf., Stockholm., 1, 203-213.
Zhang, Z., Xia, S., Zao, S. Z. and Zhang, J., 2010. Characterization and flocculation mechanisms of
high efficiency microbial flocculant TJ-F1 from Proteus mirabilis.J.ColloidsSturf., 75, 247-25.

68
CHAPTER 6. REMOVAL OF PHOSPHATE FROM WATER BY LATERITE FROM VIET NAM ___________________________________________________________________________
ABSTRACT
Adsorption of phosphate in artificial model solutions onto laterite was studied by batch
experiments. Equilibrium isotherms and other adsorption experiments showed that phosphate
adsorption was slightly pH dependent whereas the materials containing ferric and aluminum
compounds are proven to be strongly pH dependent. Adsorption capacities of 1.1-1.6 mg P g-1at pH 3
and 1.0-1.4 mg P g-1at pH9 and an equilibrium concentration of less 2 mg P L-1 can be reached. The
presence of other anions, e.g., sulfates and carbonate was shown to decrease adsorption of phosphate.
In competitive adsorption in the mixed solutions of phosphate, sulfate and carbonate, laterite preferred
phosphate over sulfate and carbonate. The order of adsorption selectivity was
phosphate>sulfate>carbonate.
Key words: Adsorption, phosphorous, laterite, iron oxide mineral
--------------------------------------------------------------------------------------------------------------------------
6.1 INTRODUCTION
6.1.1 Back ground
Phosphorus (P) is an essential nutrient for the growth of organisms, but excessive amount of
phosphorus in water bodies can also cause eutrophication resulting in the bloom of aquatic plants,
growth of algae and depletion of dissolved oxygen in water and hence deteriorate water quality.
Phosphorus is released into aquatic environments in many ways including industrial, agricultural,
mining activities and mineralization of natural forest coverage. Although phosphorus contamination
in aqueous environment has attracted increasing interests recently because of damages to ecosystem,
loads of phosphorus discharged into environment has been increasing. Therefore, phosphorous
removal from water is an urgent demand for water quality improvement and environmental protection.
In recent years, several techniques for phosphorus removal from wastewater have been
developed and attracted much attention. The methods including adsorption, physical settling and
filtration process, chemical precipitation with aluminum and iron compounds, and biological
processes that rely on biomass growth of bacteria, algae, plants or intracellular bacterial
polyphosphates accumulation are mentioned in a review by Bashana and Basan (2004). Finding
advanced adsorbents to bring about high efficiency for treatment process is gaining increasing interest
of scientists. Several low-cost and natural materials such as clays, waste materials and by-products
such as montmorilonite, kaolinite, illite (Edzwald et al., 1976), palygorskite (Ye et al., 2005; Cheng

69
and Sheng, 2006), La(III)-chelex resin (Wu et al., 2007), dry iron oxide tailings (Zeng, 2009) fly ash
(Cheng et al., 2007), blast furnace slag (Oguz, 2004), hydroxides sludge (Golder et al., 2006),
activated aluminum oxide and ferric hydroxide (Genz et al., 2004), have all been investigated as
effective adsorbents to remove phosphorous in water. Despite the abundance of literature on
phosphate adsorption capacity of clay minerals and natural materials, only few studies are available
for the ability of laterite.
Laterite is formed by deep weathering in tropical and subtropical environments. The heavy
rainfall in these regions leaches out all soluble weathering products in such soils, leaving behind clay
minerals, rutile, and hydrated Al and Fe oxides which have been known for their strong interaction
with arsenate and phosphate ions in solution (Cornell and Schwertmann, 2003).So far various studies
have focused on applications of laterite for water treatment. Frederick (2008) investigated removal of
arsenic from drinking water sources of laterite thanks to metal oxy-hydroxides of aluminum and iron
in composition. Udoeyo et al. (2010) indicated high absorption capacity of laterite for aqueous heavy
metals. Lateritic soils have been used as effective sorbents for arsenic removal from groundwater
(Majiet et al., 2006; Rahman et al., 2008; Maitiet al., 2010). Nga et al. (2013) indicated good
performance of laterite materials collected from Viet Nam in removal of suspended clay particles
from water.
Instead of using synthetic compounds of high cost and toxicity to environment to remove
pollutants from water, development of natural adsorbents of low cost should be paid attention.
Laterite might be an alternative material which is effective, inexpensive and environmentally friendly.
In Viet Nam, laterite is abundant and distributed in many regions due to strong lateritirization, but
their applications to water treatment have been very few. The objective of this study is to demonstrate
that laterites from Viet Nam are effective as adsorbents in removing phosphorous from aqueous
solution. The present study focuses on evaluating the effects of pH on phosphate sorption,
determining phosphate adsorption capacity and selectivity for phosphate through a series of batch
experiments using simple and multicomponent solutions.
6.1.2Chemistry, occurrence and environmental relevance of phosphorus
6.1.2.1 Chemistry and natural occurrence
Phosphorus (P), having the atomic number 15 and an atomic weight of 30.97376is the eleventh
most abundant element in the earth’s crust and widely present in rocks, soils, waters and in living
organisms. Phosphorus compounds play a crucial role in life processes, forming the backbone of the
DNA and being involved in metabolic energy transfer as ATP and related compounds. Phosphorous is
released to environment and also among the most toxic substances known, used as chemical warfare
agents and as pesticides. There are more than 100,000 known phosphorus compounds of which the
majority contains linkages to oxygen, carbon, nitrogen and metals. Under most conditions, naturally

70
occurring phosphorus is exclusively combined with four oxygen atoms, forming the phosphate
oxyanion (Bryant, 2004).
Phosphorus in natural and waste waters is distributed between various physical compartments,
including a dissolved fraction comprising both inorganic and organic P species, a colloidal fraction
associated with both inorganic colloids such as clays and organic macromolecules including humic
and fulvic acids, particulate component including P species adsorbed to particle surfaces or retained in
the particle matrix and also a biological constituent associated with aquatic organisms such as algae or
bacteria (Dennison,1998).
In nature, phosphorus passes through several interconnected cycles. The geological cycle of
phosphorus includes erosion, transport to the oceans, sedimentation, tectonic uplift and alteration of
phosphate-containing rocks into plant-available phosphate in soils. The cycle time is several million
years (Jones,2004). Besides the geological cycle, phosphorus is cycled as part of the food chain on
land and in aquatic systems, with cycle times ranging between a few weeks and up to one year (Jones,
2004). The global P cycle has been modified extensively by modern human (agricultural, urban and
industrial) practices. As a result, fluxes of P have doubled during the past several centuries due to a
high rate of extraction of P from mineral deposits followed by widespread use in fertilizers and
detergents. Figure 6.1 illustrates the geological and biological phosphorus cycles including
anthropogenic influences.
Fig. 6.1. Geological and biological phosphorus cycle in nature.

71
In aqueous environment, phosphorous exists under different behavior depending pH values of
solutions. Figure 6.2 shows the aqueous speciation of phosphoric acid (orthophosphate). In the pH
range of most natural waters and wastewaters (pH 6-9.5), the monovalent (H2PO4-) and the divalent
(HPO42-) anions are the dominating species. For the dissociation of phosphoric acid, the equilibrium
constants are pKa1= 2.12; pKa2 = 7.21, and pKa3 = 12.67 (ionic strength of zero, T=25°C).
Speciation and charge of the phosphate influence the adsorption onto metal oxide surfaces, in turn,
phosphate removal is pH dependent.
Fig. 6.2. Aqueous speciation of phosphorus as function of pH.
6.1.2.2 Eutrophication
The pollution of surface waters by phosphates is the main cause for eutrophication and was
recognized as a problem in the middle of the twentieth century. Phosphorus is an essential nutrient for
plants and excess quantities results in extensive growth of phytoplankton, macroalgae, and higher
plants. In some cases, this includes harmful algal blooms and depletion of dissolved oxygen that
subsequently results in the decline of aquatic life (Chorus, 1999; Farmer, 2004). The research of a
survey on the extent of the problem on a global level has found that 53% of lakes and reservoirs in
Europe are eutrophic. The proportions for Africa, South East Asia, North and South America are 28%,
54%, 48%, and 41%, respectively (EU council, 1993). Point sources (e.g., from municipal wastewater
treatment plants, industrial and some agricultural) account for more than half of the phosphorus
discharged in Europe. The principal sources of phosphorus in wastewater originate from human
excreta and, in some countries, from the use of detergents. Phosphorus release to surface waters has
led to legislations, such as the European Union Urban Wastewater Directive designed to remove
phosphorus from domestic and industrial wastewater. Consequently, phosphorus removal has become
more widely employed in wastewater treatment and emissions of phosphorus from sewage into
surface waters, across Europe, have typically fallen by 30-60% since the mid-1980’s, with
72
considerable variations across the continent. Similar control measures have been implemented in the
U.S.A. and Japan. The U.S. EPA has established a maximum contaminant level for phosphorus to be
<20 mgL-1 in rivers and streams and in lakes and reservoirs during summer growing season (Report of
United State Environment Protection Agency, 2000). While sewage discharges are gradually tackled,
the relative importance of diffuse phosphorus sources, such as agriculture and soil erosion will
increase. Despite improvements in discharge and surface water quality in recent years, phosphorus
pollution remains a significant issue in developed countries. Developing countries have also severe
eutrophication problems driven by increasing fertilizer use, as well as very poor treatment of urban
wastewater from increasing populations (Farmer, 2004).
6.1.2.3 Phosphorus removal technologies
Today, the most widely applied phosphorus removal processes are chemical and biological
phosphorus removal. The principle of chemical P removal from wastewater is to transfer dissolved
phosphates into particulate form by producing chemical precipitates of low solubility by addition of
di- and tri-valent metal ions or lime. The formed precipitates and particulate phosphates are usually
removed by solid separation processes such as sedimentation, flotation or filtration (Cooper, 1994;
Tchobanoglous, 2003). Polyphosphates and organic phosphorus may take part in adsorption reactions,
but only to a limited extent and thus represent the partly removable phosphorus fraction. The
proportions of easily vs. partly removable phosphorus fractions influences process performance and
achievable levels of residual phosphorus in the effluent, which are also governed by the raw water
quality, type and dose of precipitant, location of dose application, chemical speciation, mixing
conditions, process configuration, and the target water quality. The process is robust and flexible and
phosphorus removal of more than 90% is achievable under optimized conditions.
The phenomenon of biological phosphate removal was first recognized by Greenberg et al.
(1995) who proposed that under certain conditions, activated sludge had the ability to accumulate
phosphate in excess of that required for balanced microbial growth. In later years, this was frequently
referred to as ‘luxury’ phosphate uptake and its exploitation appeared to provide the basis of a
biological alternative to chemical precipitation for phosphate removal from wastewater. Ultimately,
this led to the development of the enhanced biological phosphate removal (EBPR) process. EBPR can
be achieved through the activated sludge process by recirculating sludge through anaerobic and
aerobic conditions. This is achieved by configuring the treatment system such that an anaerobic zone
is added upstream of the traditional aerobic phase. A specialized group of microorganisms known as
polyphosphate accumulating organisms is able to gain a selective advantage by taking up carbon
sources such as volatile fatty acids under anaerobic conditions and storing them intracellularly as
carbon polymers (Tchobanoglous, 2003). When operated successfully, the EBPR process is a
relatively inexpensive and environmentally sustainable option for phosphate removal.

73
Although less frequently used in large-scale phosphorus removal from wastewater, a great
number of adsorbents have been studied and used in a variety of phosphorus removal applications as
diverse as wastewater treatment, maintenance of potable water supplies and constructed wetlands
(Douglas et al., 2004). Adsorbents enriched with Ca, Fe and/or Al performed well in phosphate
uptake capacity (Driro et al., 1999; Johansson, 1999). Table 6.4 shows a summary of phosphorus
adsorbents which have been tested in laboratory. Laterite is available adsorbent and approved for
drinking water application. Consequently, this work focuses on the potential application of laterite in
phosphorous removal.
6.2 MATERIALS AND METHODS
6.2.1. Materials
The present study used three laterite samples (1-TT, 2-HL and 3-QT) collected from lateric soil
zones in Viet Nam as adsorbents. The 1-TT sample was collected from a layer at a depth of 1.5 m in
Thach That town where completely weathered laterite distributes. The original sample is a hard block
with dark yellow color. The 2-HL sample was found in excavated soil at a construction site. It is a
hard block containing red solid gravels. The 3-QT sample was taken from a laterite profile at a depth
of 0.5 m from the surface.
The initial raw samples were washed with tap water and air-dried at a room temperature. The
fraction that passed through a 2-mm screen after gentle crushing was used as adsorbents. Their
physical and chemical properties are shown in Table 6.1.
Table 6.1. Some physic-chemical characteristics of laterite samples
No pHH2O pHkcl TOC (%)
Clay (%)
Silt (%)
Fine sand (%)
Coarse sand (%)
ECEC
(cmolc/kg)
1-TT 5.30 5.03 0.18 67.42 6.29 7.71 18.58 1.36
2-HL 5.56 4.95 0.13 57.03 6.24 9.89 26.83 1.00
3-QT 5.35 5.18 0.13 30.93 8.04 24.65 36.38 0.77
The phosphate stock solution containing 10 mmol L-1 was prepared by dissolving pure chemical
of sodium dihydrogen orthophosphate (NaH2PO4) in distilled water. Phosphate working solutions of
different concentrations were prepared by diluting the phosphate stock solution in 0.005M MgCl2
solution for adjusting ionic strength. The pH value of the phosphate working solution was measured
before and after adsorption experiments.

74
6.2.2. Mineralogy and surface charge analysis of laterite
Mineralogy of the laterite samples were analyzed for four particle size fractions (clay, silt, fine
sand and coarse sand) by X-ray diffraction (RINT-2000V, Rigaku) with a Cu Kα radiation at 40 kV
and 20 mA following the procedure of Nga et al. (2013).
Surface charge of laterite samples was determined by serial potentiometric titration method.
Five gram portion of the sample was equilibrated with NaCl solutions having different pHs for 4 h
ationic strengths of 0.005 mol L-1, 0.05 mol L-1 or 0.01 mol L-1. Proton and hydroxide ion adsorption
by laterite was calculated from pHs before and after equilibration and plotted against pH. The pHpzse
were determined from the intersection point of the curves for different ionic strengths. The net surface
charge was set to zero at pHpzse.
6.2.3. Thermal analysis
Differential thermal and gravimetric analysis (DTA-TG) was carried out simultaneously using
Rigaku thermo plus EVO. The samples were heated from room temperature to1000oC at a heating rate
of 10 ºC min-1. The amount of sample used in each test was 10mg.
6.2.4. Phosphorous adsorption experiments
To construct adsorption isotherm, 0.3 g of laterite and 50 mL of phosphate working solution at
concentrations of 0; 0.1; 0.2; 0.3; 0.4; 0.5; 0.6; 0.8; 1.0 mmol L-1were mixed in centrifuge tubes. The
tubes were capped and placed on a shaker at 170 rpm for 24 h at room temperature to ensure
equilibrium. The suspension was separated by centrifugation (2500 rpm, 15 min) and the supernatant
was filtered through a 0.45µm membrane filter. The residual concentration of phosphate was
determined by the molybdate blue spectrophotometric method. Each experiment was duplicated.
A similar procedure was adopted in the experiment on the effect of pH on phosphate adsorption.
The fixed initial phosphate concentration of 0.5 mmol L-1 was employed and the pH was adjusted by
0.1M HCl and 0.1M NaOH to cover a range from 4 to 9. The pH measurement was implemented
before shaking and after equilibration.
Phosphate adsorption kinetics was examined at 25oC and phosphate working solution at
concentration of 0.5mmol L-1. A 3 g portion of a laterite sample was added to 500 mL phosphate
solution in a 1-L bottle and shaken at 170 rpm without pH adjustment. Several mL of equilibrium
solution was sampled intervals between 0 and 24 h, immediately filtered through a 0.45 µm
membrane filter and then analyzed for P concentration.
The competitive adsorption experiments of phosphate was conducted with solutions containing
0.5 mmol L-1 sulfate, 0.5 mmol L-1carbonate and 0.5 mmol L-1phosphate, which were prepared from

75
sodium sulfate, sodium carbonate and sodium dihydrogenate orthophosphate (NaH2PO4), respectively.
Centrifuge tubes are used to contain 0.3 g of laterite and 50 mL of solution and then shaken for 24 h at
room temperature. The solutions examined include single phosphate, complex of sulfate and
phosphate and complex of phosphate, sulfate and carbonate.
The P concentration was measured after filtering through 0.045µm. The analysis of phosphate
was done by spectrophotometer using method described in standard methods of Kuo (1996). The
experiments were done in triplicate and the results were averaged.
6.3 RESULTS AND DISCUSSION
6.3.1. Mineralogy and surface charge characteristics of laterite samples
X-ray diffraction patterns of the Mg-saturated and glycerol-solvated clay fractions and fine sand
fractions of three laterite samples are shown in Fig.6.3.
Fig.6.3. X-ray diffraction pattern of laterite samples/ Clay fraction. The figures indicate d-
spacings in nm.
The clay fractions of the 1-TT and 2-HL samples showed fairly strong peaks at 0.7, 0.418, 0.35
and 0.269 nm, indicating that these samples contain kaolinite and goethite and hematite. In addition,
the 1-TT sample showed weak peak at 1.4 nm, indicating that it contain small amount of non-
expandable 2:1 layer silicates. The weak peak at 0.487 nm indicates that all the samples contain
gibbsite. The 3-QT sample showed a significantly different mineralogy in that it is dominated by
quartz and contained much less amount of kaolinite and goethite. The dominance of 0.425 and 0.334
nm peaks in the X-ray diffraction patters for fine sand samples indicate that the major mineral in the
0.14 1 0.7
0.4250.418
0.334
0.325
0.269
0
2000
4000
6000
8000
0 10 20 30 40 50 60
1‐TT
2‐HL
3‐QT
Intensity/cps
Cu Kα 2θ

76
fine sand fraction is quartz. The small but distinct peak at 0.418 and 2.69 nm shows that the fine sand
fractions also contain goethite and hematite. The silt and coarse sand fractions exhibited similar X-ray
patterns.
Basic chemical properties are summarized in Table 6.1. The pH (H2O) was in a range from 5.3
to 5.6 and the pH (KCl) was similar, indicating that the samples contained little exchangeable Al. The
1-TT sample showed the highest clay content of 67% followed by the 2-HL and 3-QT samples. The
clay content of the 3-QT sample was only 30% and it had fairly high sand content. Although the clay
content was high, the effective cation exchange capacity, i. e. the sum of exchangeable cations, was
very low. This is a reflection of the virtual lack in 2:1 type layer silicate minerals as indicated by X-
ray diffraction (Fig. 6.3).
The results of thermal analyses are shown in Fig. 6.4. All the samples showed clear endothermic
peaks centered at around 50, 320°C and corresponding weight losses. The 1-TT and 2-HL samples
exhibited an additional large endothermic peak at 480°C but the 3-QT sample showed only a faint
peak at that temperature. The endothermic peak at 50°C obviously came from desorption of adsorbed
water. And the peaks at 320 and 480°C are assigned to dehydration reaction of hydroxide minerals
and kaolinite, respectively. Since goethite dehydrates at lower temperature than gibbsite, the
endothermic peak centered at around 320°C suggests that the contribution of gibbsite was larger.
These results harmonize with X-ray diffraction patterns shown in Fig. 6.3, particularly in that the 3-
QT sample showed very weak diffraction peak at 0.7 nm. The 2-HL and 3-QT samples showed large
endothermic peaks at around 840°C but they did not accompany weight loss. The origin of these
endothermic peaks was not identified.
The dehydration reaction of gibbsite and kaolinite are expressed as
2Al(OH)3 = Al2O3 + 3H2O (6.1)
And
Si4Al4O10 (OH)8 = SiO2.Al2O3 + 4H2O (6.2)
The weight loss from 200 to 400°C was about 0.5 mg for all three samples. If this came from the
dehydration of gibbsite, the stoichiometry in the reaction (6.1) gives the gibbsite weight of 1.4 mg in
10 mg sample. Similarly, the weight of kaolinite is estimated to be 1.4 mg for the 1-TT and 2-HL
samples and 0.71 mg for the 3-QT sample. But actually the dehydration of both gibbsite and goethite
occurs at around 300°C and it is difficult to quantify these two minerals separately.

77
Fig. 6.4. Results of differential thermal analysis and thermo gravimetric analysis.
Fig. 6.5 shows the surface charge characteristics of laterite samples used in the present study,
where the net surface charge was plotted against solution pH. The net charge decreased as pH
‐1.6
‐1.4
‐1.2
‐1
‐0.8
‐0.6
‐0.4
‐0.2
0
‐6
‐4
‐2
0
2
4
6
8
10
0 200 400 600 800 1000
Temperature/oC
1-TT
DT
A/µ
V TG
/ mg
‐1.6
‐1.4
‐1.2
‐1
‐0.8
‐0.6
‐0.4
‐0.2
0
‐6
‐4
‐2
0
2
4
6
8
10
0 200 400 600 800 1000
2-HL
TG/m
g
Temperature/oC
DT
A/µ
V
‐1.6
‐1.4
‐1.2
‐1
‐0.8
‐0.6
‐0.4
‐0.2
0
‐6
‐4
‐2
0
2
4
6
8
10
0 200 400 600 800 1000
Temperature/oC
3-QT
DTA
/µV
TG/ mg

78
increased and the sign of the net charge reversed at pHs 5.1, 5.0 and 5.4 for the 1-TT, 2-HL and 3-QT
samples, respectively. These pH values, i. e. the point of zero net charge (PZNC) were not much
different from pH values measured in water (Table 6.1). Since PZNC for goethite and gibbsite lie
around pH 8, the observed lower PZNC values may be due to the presence of kaolinite and quartz.
Fig.6.5.Surface charge diagrams of laterite samples.
Based on the mineralogical and chemical data, the approximate mineralogical composition of the
laterite samples is summarized in Table 6.2.
Table6.2. Mineralogy identification of laterite samples
Sample Fraction Identification
1-TT Clay Mica; kaolinite; Geothite; feldspars
Silt Kaolinite; Geothite; Quazt; Feldspars
Fine sand Quazt; Geothite
Coarse sand Kaolinite; Geothite; Quazt
2-HL Clay Kaolinite; Geothite; Feldspars
Silt Kaolinite; Geothite; Quazt; feldspars
Fine sand Geothite; Quazt
Coarse sand Kaolinite; Geothite; Quazt; hematite, Feldspars
3-QT Clay Kaolinite; hematite; Quazt; Feldspars
Silt Quazt
Fine sand Quazt
Coarse sand Geothite; Quazt
‐3.0
‐2.0
‐1.0
0.0
1.0
2.0
3.0
3 5 7
Sur
face
cha
rge/
cmol
ckg-
1
pH
1 - TT
0.005 M
0.01 M
0.05 M
3 5 7
pH
2-HL
3 5 7
pH
3- QT

79
6.3.2 Phosphate adsorption isotherm
The phosphate adsorption isotherms of the laterite samples are shown in Fig.6.6. The phosphate
adsorption capacity increased with increasing equilibrium phosphate concentration from 0 to 1mmol
L-1. The adsorption capacity is determined at equilibrium phosphate concentration of 0.5 mmol L-1
and at pH 5-6 which corresponding to approximately 0.048 mmol g-1, 0.045 mmol g-1and 0.032 P
mmol g-1for 1-TT, 2-HL and 3-QT, respectively. The adsorption of phosphate onto laterite samples is
believed to be complexation between surface hydroxyl groups of goethite, hematite and the phosphate
ions (Seiki, et al., 2003) as expressed, for example, by equation (6.3). With further increase of the
phosphate concentration, the phosphate adsorption plateaued. As indicated by values of qm (Table 6.3),
the 1-TT sample gave the highest adsorption efficiency followed by the 2-HL sample, and 3-
QTsample. The gibbsite and goethite content of the 3-QT laterite seems comparable with those of
other laterite samples (Figs. 6.3 and 6.4). The surface charge characteristics for the three laterite
samples were also similar (Fig. 6.5). One possible reason for the observed lower phosphate adsorption
is the low gibbsite content of the 3-QT sample. The Langmuir and Freundlich equations expressed in
Eqs. (6.4) and (6.5) were used for evaluating the experimental data
Fe-OH+ HPO42-+H = Fe-OPO3
2- +H2O (6.3)
qe= qmbce/(1 + bce) (6.4)
qe= Kfce1/n (6.5)
where ce (mg L-1) and qe (mg g-1) are the equilibrium phosphorus concentrations in the aqueous and
solid phases. Here, qm (mg g-1) is the maximum adsorption capacity and b is the affinity parameter. Kfi
and 1/n are the Freundlich adsorption constant and n is interpreted as a measure of adsorption
intensity. The constants determined by least squares method are summarized in Table 6.3. The
regression coefficients (R2) are also shown in Table 6.3. The R2 values obtained for the Freundlich and
Langmuir isotherms were both above 0.976, indicating that both models can be used to describe the
adsorption of phosphate onto laterite. The Langmuir isotherm appears to be slightly better suited to
describe the equilibrium data.
Table 6.3. Estimated isotherm parameters for phosphate adsorption
Sample Langmuir Equation Freundlich Equation
qm (mg g-1) b R2 K 1/n R2
1-TT 1.01 20.2 0.991 0.055 0.233 0.993
2-HL 0.84 17.16 0.991 0.05 0.246 0.994
3-QT 0.46 13.04 0.992 0.037 0.266 0.976
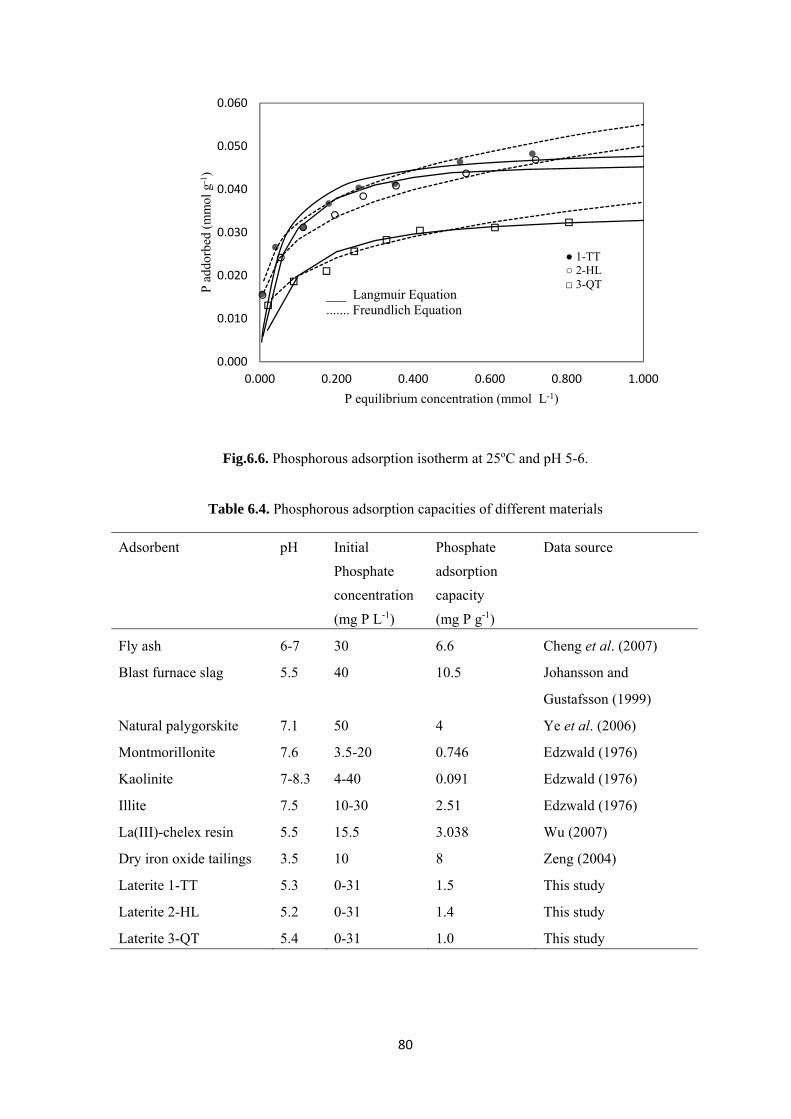
80
Fig.6.6. Phosphorous adsorption isotherm at 25oC and pH 5-6.
Table 6.4. Phosphorous adsorption capacities of different materials
Adsorbent pH Initial
Phosphate
concentration
(mg P L-1)
Phosphate
adsorption
capacity
(mg P g-1)
Data source
Fly ash 6-7 30 6.6 Cheng et al. (2007)
Blast furnace slag 5.5 40 10.5 Johansson and
Gustafsson (1999)
Natural palygorskite 7.1 50 4 Ye et al. (2006)
Montmorillonite 7.6 3.5-20 0.746 Edzwald (1976)
Kaolinite 7-8.3 4-40 0.091 Edzwald (1976)
Illite 7.5 10-30 2.51 Edzwald (1976)
La(III)-chelex resin 5.5 15.5 3.038 Wu (2007)
Dry iron oxide tailings 3.5 10 8 Zeng (2004)
Laterite 1-TT 5.3 0-31 1.5 This study
Laterite 2-HL 5.2 0-31 1.4 This study
Laterite 3-QT 5.4 0-31 1.0 This study
0.000
0.010
0.020
0.030
0.040
0.050
0.060
0.000 0.200 0.400 0.600 0.800 1.000
P a
ddor
bed
(mm
ol g
-1)
P equilibrium concentration (mmol L-1)
___ Langmuir Equation....... Freundlich Equation
● 1-TT○ 2-HL□ 3-QT

81
The phosphate adsorption capacities of laterite determined in the present study is compared with
those of common adsorbents in Table 6.4. Because the experimental conditions including initial
phosphate concentrations and pH were not exactly the same, the adsorption capacities of various
adsorbents are not strictly comparable. It is found that the adsorption capacities of laterite (1-1.5 mg P
g-1) are lower than of palygorskite, illite and blast furnace slag but higher than those of common clays
(montmorillonite, kaolinite). Therefore, laterite may be potentially attractive adsorbents for the
removal of phosphate from aqueous solutions.
6.3.3 Effect of initial pH on phosphate adsorption
Fig. 6.7 shows the dependence of phosphate adsorption on solution pH
Fig.6.7. Effect of initial pH on phosphate adsorption by laterite. ( P concentration 0.5mmolL-1, contact
time 24 h, adsorbent dose 6 g L-1.)
At pH 3, phosphate adsorption was highest: approximately 0.034-0.045 mmol g-1 at an
equilibrium concentration of 0.5 mmol L-1. The higher pH values lead to slight reduction in phosphate
adsorption. Fig. 6.7 shows that phosphate adsorption by laterite is only slightly pH-dependent.
Compared to the maximum amount of adsorbed phosphate at pH 3, less than 10% decrease was
observed at pH 9. The adsorption is possibly hindered at high pHs, because both surface of laterite
and phosphate carries more negative charges at higher pHs, which induces more intensive repulsion
between the negatively charged surface and phosphate.
6.3.4 Adsorption kinetics
The phosphate adsorption kinetic was examined under conditions of room temperature 25oC,
equilibrium concentration of 0.5 mmol L-1 and pHs 5-6. The adsorption kinetic of phosphate on the
three adsorbents performed a similar trend. Phosphate adsorbed onto laterite increased with time,
significant increase was in first 8 h and reached equilibrium at about 24 h (Fig. 6.8).
0.020
0.025
0.030
0.035
0.040
0.045
2 3 4 5 6 7 8 9
P a
dsor
bed
(mm
ol g
-1)
Initial pH
1‐TT
2‐TT
3‐QT

82
Experimental data was evaluated by kinetic adsorption equations, Power function equation (6.6) and
Elovich equation (6.7)
Power function equation: q = at b (6.6)
Simple Elovich equation: q = a + b lnt (6.7)
Where q is the amount adsorbed (mg g-1) and t is the adsorption time. The other parameters are kinetic
constants, which can be determined by regression of the experimental data. Since the power function
gave low correlation coefficients (R2) for the present experimental data (0.7) and this model was ruled
out. On the other hand, the simple Elovich equation gave acceptable correlation coefficients (R2) of
0.84, 0.82 and 0.7, for 1-TT, 2-HL and 3-QT, respectively. Therefore, the fitted curves by Elovich
equation are overlain in Fig 6.8. The suitability of the simple Elovich equation was also reported by
Yeet al. (2006) and Chen and Seng (2006).
Fig.6.8. Phosphorous adsorption kinetic data at 25◦C and pH 5-6.
6.3.5 Competitive adsorption of phosphate
Table 6.5. Amount of Phosphorus adsorbed (mmol kg-1) in mixed solution of ions
Solution
Samples
Comparison (%)
1-TT 2-HL 3-QT 1-TT 2-HL 3-QT
Single solution of phosphate 40.32 38.38 28.23 100.00 100.00 100.00
Complex solution of phosphate and sulfate 36.50 34.87 26.12 90.53 90.85 92.53
Complex solution of phosphate, carbonate and sulfate 35.33 34.02 25.22 87.62 88.64 89.34
0.01
0.02
0.03
0.04
0.05
0 10 20 30 40 50
P (
adso
rbed
mm
ol g
-1)
Time (h)
1-TT
2-HL
3-QT
Elovich 1-TT
Elovich 2-HL
Elovich 3-QT

83
Fig. 6.9. Phosphorous adsorbed on laterite from single and complex solution. Single solution: NaH2PO4 (0.5 mmol). Complex solution: NaHCO3 (0.5 mmol), Na2SO4 (0.5 mmol), NaH2PO4 (0.5 mmol).
Adsorption experiments were carried out separately with simple phosphate solutions, binary
solutions of phosphate and sulfate, ternary solutions of phosphate, sulfate and carbonate. A fixed
concentration of 0.5 mmol L-1 phosphate is mixed with the same concentration of sulfate and
carbonate anions. Amount of phosphate anion adsorbed onto laterite in the presence of sulfate and
carbonate anions is presented in Table 6.5 and plotted in Fig. 6.9. The adsorbed phosphate decreases
when sulfate and carbonate anions presented in the solutions. The amount of phosphate adsorbed on
laterite in mixed solutions was less than that in simple solutions (Table 6.5). However, the rate of
phosphate adsorbed is still higher than the rate of sulfate and carbonate adsorptions onto laterite. Thus,
the results of competitive adsorption experiments indicate that laterite could selectively adsorb
phosphate ion and is suitable for the removal of phosphate from aqueous solution. In addition,
experimental data shown in Table 6.5 also indicate the order of selectivity of adsorption of anions is
phosphate > sulfat e >carbonate.
6.4 CONCLUSIONS
In this study, three laterite samples distributed in different regions in Viet Nam were examined
for the removal of phosphate ions from aqueous solutions. The adsorption isotherms, kinetics, pH
effect, competitive adsorption and equilibrium time of phosphate onto laterite were investigated. The
combined effects of surface group of goethite and zero point charge determined the adsorption
capacity for phosphate. 1-TT performed the highest adsorption capacity (0.045 mmol g-1), followed by
2-HL (0.04 mmol g-1) and 3-QT (0.035 mmol g-1).The adsorption was rapid in first 8 h and slowly
reached adsorption equilibrium in 24 h. The results of equilibrium adsorption data fitted to both the
0
5
10
15
20
25
30
35
40
45
1‐TT 2‐HL 3‐QT
P a
dsor
bed
(mm
ol k
g-1)
Laterite
□ PO43- only
■ SO42‐,PO4
3-,CO32-
SO42‐,PO4
3-

84
Freundlich and Langmuir models. The simple Elovich equation fairly accurately described the
phosphate adsorption kinetics onto laterite. Phosphate adsorption of laterite was less pH-dependent
and laterite could selectively adsorb phosphate ion in mixed solutions containing sulfate and
carbonate. The natural laterite is a low cost adsorbent to remove phosphorous in water. However,
laterites containing smaller amount of goethite, e.g., 3-QT sample, is not recommended for water
treatment at high pHs.
REFERENCES
Bashana, L. and Bashan. Y., 2004. Recent advances in removing phosphorus from wastewater and its
future use as fertilizer (1997–2003), Water Res., 38, 4222 - 4246.
Bryant, D., 2004. The chemistry of phosphorus. In E. Valsami-Jones, editor, Phosphorus in
Environmental Technology. IWA Publishing, London.
Cheng, J., Kong, H., Wu, D., Chen, D. and Zhang, Z., 2007. Phosphate immolobilization from
aqueous solution by fly ashes in relation to their composition, J. Hazard. Mater., 139, 293-300.
Cornell, R. M. and Schwertmann, U., 2003. The iron oxides: structure, properties, reactions,
occurrences, and uses. Wiley-VCH, Weinheim, 2nd, completely revises and extended edition.
Cooper, P., Day, M. and Thomas, V., 1994. Process Options for Phosphorus and Nitrogen Removal
from Waste-Water. Journal of the Institution of Water and Environmental Management., 8 (1),
84-92.
Denison, F. H., Haygarth, P. M., 1998. Haygarth, W. A. House, and A. W. Bristow. The measurement
of dissolved phosphorus compounds: Evidence for hydrolysis during storage and implications for
analytical definitions in environmental analysis. International Journal of Environmental
Analytical Chemistry., 69 (2), 111–123.
Douglas, G. B., Robb, M. S., Coad, D. N. and Ford, P. W., 2004. A review of solid phase adsorbents
for the removal of phosphorus from natural and waste waters. In E. Valsami-Jones, editor,
Phosphorus in Environmental Technology. IWA Publishing, London.
Drizo, A., Frost, C. A., Grace, J. and Smith, K. A., 1999. Physico-chemical screening of phosphate-
removing substrates for use in constructed wetland systems. Water Research., 33 (17), 3595–3602.
Edzwald, J. K., Toensing, D. C., Leung, M.. C. Y., 1976. Phosphate adsorption reactions with clay
minerals, Environ. Sci. Technol., 10, 485-490.
EU. Council Directive (91/271/EEC) concerning urban waste-water treatment, 1991.
Farmer, A M., 2004 Phosphate pollution: a global overview of the problem. In E. Valsami-Jones,
editor, Phosphorus in Environmental Technology. IWA Publishing, London.
Ferrick, N., 2008. Mechanism of Arsenic adsorption onto laterite concreat, phd Dissertation .

85
Filipelli, G. M., 2002. The Global Phosphorus Cycle. In M.J. Kohn, editor, Phosphates - Geochemical,
Geobiological, and Materials Importance, volume 48. Mineralogical Society of America,
Washington, DC.
Genz, A., Kornmüller, A. and Jekel, M., 2004. Advanced phosphorus removal from membrane
filtrates by adsorption on activated aluminium oxide and granulated ferric hydroxide, Water Res.,
38, 3523–3530.
Golder, A. K., Samanta, A. N. and Ray, S., 2006. Removal of phosphate from aqueous solutions using
calcined metal hydroxides sludge waste generated from electro coagulation, Sep. Purif. Technol.,
52, 102–109.
Greenberg, A. E., Klein, G. and Kaufman, W. J., 1955. Effect of Phosphorus on the Activated Sludge
Process. J.Sewage and Industrial Wastes., 27 (3), 277–282.
George, T., Franklin L., Burton, H., David S. and Metcal, E., 2003. Wastewater engineering:
treatment and reuse. McGraw-Hill, Boston, 4th / edition3.
Ingrid, C and Jamie, B., 1999. Toxic cyanobacteria in water: a guide to their public health
consequences, monitoring, and management. E & FN Spon, London ; New York.
ILEC/Lake Biwa Research Institute. Survey of the State of the World’s Lakes. Technical report,
International Lake Environment Commolittee, Otsu and United Nations Environment Programe,
1988-1993.
Kuo, S., 1996. Methods of Soil analysis. Part 3. Chemical methods-SSSA. Book series no 5.
Maiti, A., Jayanta, K., Kumar, B and Sirshendu, D., 2010. Synthetic and natural groundwater using
acid active laterite. J.Enviromenal progress and sustainable energy., 4, 457-470.
Maji, S. K., Pal, A. J. and Pal, T., 2006. Arsenic removal from real-life groundwater by absorption on
laterite soil. J. Hazad. Mater., 151, 811-820.
Nga, N.T.H., Mori, Y. and Wada, S. -I., 2013. Minerology of Laterite samples from Vietnam and their
use as flocculating agents for removal of clay suspensions. J.Fac.Agr.Kyushu Univ., 58 (1), 167-
173.
Oguz, E., 2004. Removal of phosphate from aqueous solution with blast furnace slag, J. Hazard.
Mater., 114, 131–137.
Udoeyo, F. F., Robert, B., Inyang, H. and Sunyoung, B., 2010. Imo lateritic soil as an absorbent for
heavy metals. IJ.RRAS., 1, 4-5.
Rahman, I. M., Iwakabe, M, K. and Kawasaki, J., 2008. Laterite a potential alternative for removal of
ground water arsenic. Appl.Sci.Enviro.Manage., 1, 93-100.
Seiki, T., Mineaki, K. and Naohito, K., 2003. J. Colloid Interf. Sci., 257, 135
U.S. EPA. Nutrient Criteria Technical Guidance Manual: Rivers and Streams, 2000.
U.S. EPA. Nutrient Criteria Technical Guidance Manual: Lakes and Reservoirs, 2000.
Johansson, L., 1999. Industrial by-products and natural substrata as phosphorus sorbents.
Environmental Technology., 20 (3), 309–316.

86
Zeng, L., Lia, X.and Liu J., 2004. Adsorptive removal of phosphate from aqueous solutions using iron
oxide tailings,Water Res., 38, 1318–1326.
Valsami-Jones, E., .2004. The geochemistry and mineralogy of phosphorus. In E. Valsami-Jones,
editor, Phosphorus in Environmental Technology. IWA Publishing, London.
Wu, R. S., Lam, S. K., Lee, H. and Lau, .J. M. N., 2007. Removal of phosphate from water by a
highly selective La(III)-chelex resin, Chemosphere., 69, 289–294.
Ye, H., Chen, F., Sheng, Y., Sheng, G. and Fu, J., 2006. Adsorption of phosphate from aqueous
solution onto modified palygorskites, Sep. Purif. Techno., 50, 283–290.

87
CHAPTER 7. REMOVAL OF HEAVY METALS FROM WATER BY VOLCANIC ASH SOIL AND LATERITE ___________________________________________________________________________
ABSTRACT
The batch experiments of adsorption of Cu2+, Pb2+and Cd2+were carried out at laboratory scale
with artificial model solutions. Adsorption capacity was determined based on Langmuir models. The
results showed that both volcanic ash soil and laterite displayed high adsorption capacity for lead (up
to 1.0-1.2mg Pb g-1is recorded at pH5). Adsorption capacity for copper, though not as high as that of
lead, is acceptable if used in water treatment (about 0.5-0.8 mg Cu g-1at pH5). Cadmium seemed to
have been hardly removed by laterite and volcanic ash soil. The calculated adsorption capacities were
0.4mg Cd g-1for laterite and less than 0.1mg Cd g-1for volcanic ash soil at aninitial concentration of 25
mg L-1. The adsorption of heavy metals examined by laterite and volcanic ash was strongly pH
dependent. At pHs lower than 4, these materials were not effective for metals removal. From a
viewpoint of implementation, the laterite should be used after pH adjustment to over 4 for Pb, Cu, Cd
removal from wastewater. Similar way in use of volcanic ash soil is recommend for Pb and Cu, but
volcanic ash soil is not recommended for Cd removal from wastewater.
Key words: Adsorption, water treatment, heavy metals, lateirte, allophane, imogolite.
---------------------------------------------------------------------------------------------------------------------------
7.1 INTRODUCTION
7.1.1 Background
The removal of heavy-metals from wastewater discharged to effluent is one of the most
important environmental issues in the world. Pollution by heavy metals is of great concern due to the
potentially hazardous effects on the environment (Huang et al., 2008). Heavy metal pollution of water
bodies has been caused by wastes from many sources such as metal plating, mining, tanneries,
painting, car radiator manufacturing, as well as agricultural chemicals like fertilizers and fungicides
(Amanet al., 2008; Jiang et al., 2008). The industrial activities have significantly contributed to heavy
metal pollution in various ecosystems. Because of their high solubility in water, heavy metals can be
absorbed by living organisms. Once they enter the food chain, high concentrations of heavy metals
may accumulate in the human body. If the metals are ingested beyond the permitted concentration,
they may cause serious health disorders (Babel and Kurniawan, 2004). Hence, immobilization or
removal of toxic metals from water is a long-term research goal aiming at protecting human health
and environment from pollution risks.

88
Recently, numerous approaches have been studied for the development of cheaper and more
effective technologies, both to decrease the amount of wastewater produced and to improve the
quality of the treated effluent and adsorption is one of the alternative treatment methods. The
conventional methods to remove heavy metals from contaminated waters are chemical precipitation,
filtration, ion exchange, evaporation, reverse osmosis, solvent extraction, and electrochemical
treatment. However, these methods are either inefficient or expensive when heavy metal exists in
lower concentrations consequently it is important to find new methods for removing heavy metals
from natural and wastewaters. Comparing with conventional methods, adsorption method is quite
popular due to its simplicity and high efficiency, as well as due to the availability of a wide range of
adsorbents (Babel and Kurniawan, 2002). As reviewed by Babel and Kurniawan (2002), many
materials such as waste of olive oil factory (WPOOF), tea factory waste, barely straw untreated,
Partheniumhysterophorus L. activated carbon, cone biomass of T. orientalis, dye loaded sawdust, dye
groundnut shell, fly ash, peat moss, coir pith, modified coir pith, black carrot residues, deactivated
protonated yeast have been tested for nickel (II) removal from water and wastewater systems by many
scientists and engineers.
There are several reviews on water treatment through sorption. Use of chitin and chitosan to
remove metal ions from wastewater was reviewed with particular emphasis on sorption capacities and
kinetics (Gupta et al., 2011). Clay is one of the potential adsorbent as well. Similar to zeolites, clay
minerals are also important inorganic components in soil. Their sorption capabilities come from their
high surface area and exchange capacities. The negative charge on the structure of clay minerals gives
clay the capability to attract metal ions (Babel and Kurniawan, 2002). The feasibility of using
kaolinite and montmorillonite clay minerals as adsorbents for removal of toxic heavy metals was
reviewed by Gupta et al. (2011).
Industrial waste is also one of the potentially low-cost adsorbent for heavy metal removal. It
requires little processing to increase its sportive capacity. Generally, industrial wastes are generated as
by-products. Since these materials are locally available in large quantities, they are inexpensive. In
India, various types of industrial wastes such as waste slurry, lignin, iron(III) hydroxide, and red mud,
have been explored for their technical feasibility to remove heavy metals from contaminated waters
(Babel and Kurniawan, 2002).
Although these adsorbents can be employed for heavy metal removal from waste water, finding
new adsorbents with low cost, availability in local conditions is still essential for water treatment.
Laterite is the weathered product under tropical and sub-tropical condition. These products are rich in
iron and aluminum oxides which have been known with high adsorption capacity for anions and
cations in water. Laterite can remove arsenic from drinking water sources (Frederick, 2008), besides
that, they were also applied to adsorb heavy metals in industrial waste water (Udoeyo et al., 2010).
Lateritic soils have been used as effective sorbents for arsenic removal in groundwater (Maji et al.,

89
2006; Rahman et al., 2008; Maiti et al., 2010). Nga et al. (2013) investigated good performance of
laterite materials collected from Viet Nam in removal of suspended clay particles and phosphorous
from water (Chapter 6).
In the current research, we continue to characterize the metal adsorption of laterites and
volcanic ash soil samples that may be applied as adsorbents to remove heavy metals from
contaminated waters. This study will focus on experiments of adsorption isotherm and the influence
of pH on metal adsorption by laterite and volcanic ash materials.
7.1.2 Chemistry, and environmental relevance of copper, lead and cadmium
7.1.2.1 Copper
Heavy metals (elements with an atomic density greater than 6 g/cm3) are one of the most
persistent pollutants in water. Unlike other pollutants, they are difficult to degrade, but can
accumulate throughout the food chain, producing potential human health risks and ecological
disturbances. Their presence in water is due to discharges from residential dwellings, groundwater
infiltration and industrial discharges. The occurrence and accumulation of heavy metals in the
environment is a result of direct or indirect human activities, such as rapid industrialization,
urbanization and anthropogenic sources (Gardea-Torresdey et al., 2005; Martin-Gonzalez et al., 2006).
The common heavy metals that have been indentified to pollute water include arsenic, copper,
cadmium, lead, chromium, nickel, mercury and zinc.
Copper may occur as the metal and in oxidation states as copper (I) and copper (II). An unstable
copper (III) is also known. In aqueous solution, copper is present mainly as the copper (II) ion,
depending on pH, temperature, the presence of bicarbonate and sulfide, and the potential to form
ligands with organic species, such as humic, fulvic, and amino acids, certain polypeptides, and
detergents (Stiff, 1971). The free copper (I) ion can exist in aqueous solution only in exceedingly low
concentrations, and the only copper (I) compounds that are stable in water are the highly insoluble
ones, such as chloride or cyanide (Cotton and Wilkinson, 1972). Some copper (II) salts, including
chloride, nitrate, and sulfate, are soluble at low pH under oxidizing conditions. The carbonate,
hydroxide, oxide, and sulfide are less soluble, particularly at pH 7 or higher. In alkaline waters with
high carbon dioxide content, copper may precipitate as copper carbonate.
Copper and its compounds are widely distributed in nature, and copper is found frequently in
surface water and in some groundwater. Distributed water contains considerably more copper than the
original water supply because of the dissolution of copper from copper piping. Soft waters with low
pH, low alkalinity, and low conductivity are often more corrosive than hard waters, but these factors
alone cannot be used to predict the degree of metal mobilization. Eleven water chemistry variables
potassium, sodium, calcium, magnesium, manganese, chloride, nitrate, hydrogen, sulfate, dissolved

90
oxygen, and conductivity, all related to the degree of elevation of copper in the water (Maesen et al.,
1985).
It is most likely that much of the copper reported in surface waters comes from contamination
with industrial metallurgic waste. Besides, it may occur in areas contaminated by mining or smelting
activity. Welding operations, due to types of electrodes, welding on brass material, welding on
material painted with copper-containing paints, etc, are also major emission sources. Factors affecting
the balance between copper and the parent rock and the derivative soil include the degree of
weathering, the nature and intensity of the soil formation, drainage, pH, oxidation-reduction potential
and the amount of organic matter in the soil (Baker, 1956). Alkaline conditions in the soil and the
surface water favor precipitation of copper. This may cause deficiencies in plants and minimize the
effectiveness of copper-containing molluskicides. Acid conditions promote solubility of copper,
increase the concentration of ionic copper and thereby change the microorganism and other aquatic
animal populations, depending on tolerance for various levels of copper in solution (Broadbent and
Nakashima, 1971).
Copper is an important element for body metabolism, enzymatic reactions and iron utilization.
Copper deficiency (less than 2 mg day-1) is accompanied by anemia because of the inability of body to
synthesize ferric micronutrient from iron (III) at normal rate. Copper deficiency has caused anemia,
neutropenia, and disturbances of bone formation in children. Although copper is essential element for
body, it is observed to bring reverse effects in which the high level is used. Ingestion of more than 15
mg of copper has been reported to be toxic to humans. Ingestion of gram quantities of copper sulfate
resulted in death by suicide. Exceed copper consumed is accumulated in kidney, lung, liver, brain, etc.,
causing serious cancer diseases. Copper in dust, fumes or sprays cause congestion of the nasal
membrane. Various damages to lung tissue have been reported in cases of severe intoxication after
exposure to copper sulfate sprays. Exposure to copper dust causes discoloration of the skin.
Environmental and aquatic organism problems have been found from copper accumulation. The
binding of excess copper to specific sites in protein, however, can disrupt several metabolic processes
of all living organisms (Viarengo et al., 1981). Sublethal toxicity has been shown to induce changes in
many aspects of animal behavior, could mediate ecological death by disrupting the normal function
and life history of the exposed organism (Rand, 1985). When copper ends up in soil it strongly
attaches to organic matter and minerals. In surface water copper can travel great distances, either
suspended on sludge particles or as free ions.
Copper does not break down in the environment and because of that it can accumulate in plants
and animals when it is found in soils. On copper-rich soils, a few of plants can be survival. That is
why there is not much plant diversity near copper-disposing factories. Due to the effects upon plants
copper is a serious threat to the productions of farmlands. Copper can seriously influence the
proceedings of certain farmlands, depending upon the acidity of the soil and the presence of organic

91
matter. Despite of this, copper-containing manures are still applied. Copper can interrupt the activity
in soils, as it negatively influences the activity of microorganisms and earthworms. The
decomposition of organic matter may seriously slow down because of this. When the soils of
farmland are polluted with copper, animals will absorb concentrations that are damaging to their
health. Mainly sheep suffer a great deal from copper poisoning, because the effects of copper are
manifesting at fairly low concentrations.
7.1.2.2 Lead
Lead is a widespread element on the earth crust. Ionic lead, Pb (II), lead oxides and hydroxides,
and lead metal oxy anion complexes are the general forms of Pb that are released into the soil,
groundwater, and surface waters. The most stable forms of lead are Pb (II) and lead-hydroxy
complexes. Lead (II) is the most common and reactive form of Pb, forming mononuclear and
polynuclear oxides and hydroxides. The predominant insoluble Pb compounds are lead phosphates,
lead carbonates (form when the pH is above 6), and lead hydroxides (Raskin and Ensley, 2000). Lead
sulfide (PbS) is the most stable solid form within the soil matrix and forms under reducing conditions,
when increased concentrations of sulfide are present. Under anaerobic conditions a volatile organo
lead (tetramethyl lead) can be formed due to microbial alkylation.
The main sources of lead entering an ecosystem are atmospheric lead (primarily from
automobile emissions), paint chips, used ammunition, fertilizers and pesticides and lead-acid batteries
or other industrial products. The transport and distribution of lead from major emission sources, both
fixed and mobile, are mainly through air (UNEP, 1991). Lead is present in tap water as a result of its
dissolution from natural sources, but primarily from household plumbing systems in which the pipes,
solder, fittings or service connections to homes contain lead. Polyvinyl chloride (PVC) pipes also
contain lead compounds that can be leached from them and result in high lead concentrations in
drinking-water. The other major sources of lead emission are from waste plumbing system or iron
sedimentation from pipe system. The most serious source of exposure to soil lead is through direct
ingestion (eating) of contaminated soil or dust.
Lead has not been considered to be an essential element but its necessity is still a controversial
matter. It is well known to be toxic in slight excess and its effects have been more extensively
reviewed than the effects of other trace metals. Lead can cause serious injury to the brain, nervous
system, red blood cells, and kidneys (Baldwin and Marshall, 1999). Lead performs no known
essential function in the human body, it can merely do harm after uptake from food, air, or water.
Lead is a particularly dangerous chemical, as it can accumulate in individual organisms, but also in
entire food chains. Lead accumulates in the soil, particularly soil with a high organic content (US
EPA, 1986). Lead deposited on the ground is transferred to the upper layers of the soil surface, where
it may be retained for many years (up to 2000 years). In undisturbed ecosystems, organic matter in the
upper layer of soil surface retains atmospheric lead. In cultivated soils, this lead is mixed with soil to a

92
depth of 25cm (i.e., within the root zone). Atmospheric lead in the soil will continue to move into the
micro-organism and grazing food chains, until equilibrium is reached. Distribution of lead in
ecosystems can displace other metals from the binding sites on the organic matter. It may hinder the
chemical breakdown of inorganic soil fragments and lead in the soil may become more soluble, thus
being more readily available to be taken up by plants. Plants on land tend to absorb lead from the soil
and retain most of this in their roots. Although lead does not readily accumulate in the fruiting parts of
vegetable and seed products (e.g., corn, beans, squash, tomatoes, strawberries, and apples), the risks
of lead poisoning may be caused by uptake of lead from soil by leaf or dust deposits on leaf surface of
plants (Josen, 2002).
7.1.2.3 Cadmium
In the earth’s crust, cadmium appears mainly in association with ores containing zinc, lead, and
copper (in the form of complex oxides, sulfides, and carbonates). Elemental cadmium is a soft, silver-
white metal, which is recovered as a by-product of zinc mining and refining. Cadmium enters the
aquatic environment from numerous diffuse (e.g, agricultural and urban run-off, atmospheric fall-out)
and point sources, both natural and anthropogenic. Weathering and erosion of cadmium-containing
rocks result in the release of cadmium not only to the atmosphere, but also to the soil and the aquatic
system. Natural and anthropogenic sources (e.g., mine/smelter wastes, commercial fertilizers derived
from phosphate ores or sewage sludge, municipal waste landfills) contribute to the levels of cadmium
found in soil and sediments. Reported sediment concentrations of cadmium range from 0.03–1 mg kg-
1 in marine sediments to as high as 5 mg kg-1 in river and lake sediments. Relatively high
concentrations of cadmium (>1 mg kg-1) have been measured in the soil near smelters and other
industrialized areas (WHO, 2000).
The solubility of cadmium in water is influenced by the acidity of the medium. Acid rain and
the resulting acidification of soils and surface waters have increased the geochemical mobility of Cd,
and as a result its surface water concentrations tend to increase as water pH decreases (Campbell,
2006). Dissolution of suspended or sediment-bound cadmium may increase in acidity (Fleischer et al.,
1974). The concentration of cadmium in unpolluted fresh waters is generally less than 0.001 mgL-1,
the concentration of cadmium in seawater averages about 0.00015 mg L-1 (Fleischer et al., 1974,
Kirpichtchikova et al., 2006; McLaughlin, 2000). Surface waters containing in excess of a few
micrograms of cadmium per liter have probably been contaminated by industrial wastes from
metallurgical plants, plating works, plants, manufacturing cadmium pigments, textile operations,
cadmium-stabilized plastics, or nickel–cadmium batteries, or by effluents from sewage treatment
plants (Fleischer, 1974).
Although cadmium is very biopersistent but it has few toxicological properties. Once it is
absorbed by anorganism, remains resident for many years. Cadmium in the body is known to affect
several enzymes. It is believed that the renal damage that results in proteinuria is the result of Cd

93
adversely affecting enzymes responsible for reabsorption of proteins in kidney tubules. Cadmium also
reduces the activity of delta-aminolevulinic acid synthetase, arylsulfatase, alcohol dehydrogenase, and
lipoamide dehydrogenase, whereas it enhances the activity of deltaaminolevulinic acid dehydratase,
pyruvate dehydrogenase, and pyruvate decarboxylase (Manahan, 2003). The most spectacular and
publicized occurrence of cadmium poisoning resulted from dietary intake of cadmium by people in
the Jintsu River Valley, near Fuchu, Japan. The victims were afflicted by itai-itai disease, which
means ouch, ouch in Japanese. The symptoms are the result of painful osteomalacia (bone disease)
combined with kidney malfunction. Cadmium poisoning in the Jintsu River Valley was attributed to
irrigated rice contaminated from an upstream mine producing Pb, Zn, and Cd. The major threat to
human health is chronic accumulation in the kidneys leading to kidney dysfunction. Food intake and
tobacco smoking are the main routes by which Cd enters the body (Manahan, 2003).
7.2 MATERIALS AND METHODS
7.2.1 Materials
The present study used natural materials including lateite and volcanic ash samples as
adsorbents. Three laterite samples (1-TT, 2-HL and 3-QT) collected from lateric soil zones in Viet
Nam. The 1-TT sample was collected from a layer at a depth of 1.5m in Thach That town where
completely weathered laterite is distributed. The original sample is a hard block with dark yellow
color. The 2-HL sample was found in excavated soil at the construction site. It is a hard block
containing red solid gravels. The 3-QT sample was taken from the laterite profile at a depth of 0.5 m
from the surface.
The initial raw samples were washed with tap water and air-dried at a room temperature. The
particle fraction were gently crushed and passed through a 2-mm screen. The particle fraction less
than 2mm was used as adsorbents. Their physical and chemical properties are indicated in the Table
7.1.
Table 7.1. Some physic-chemical characteristics of laterite samples
No pHH2O pHKcl TOC (%)
Clay (%)
Silt (%)
Fine sand (%)
Coarse sand (%)
ECEC (cmolc kg-1)
1-TT 5.30 5.03 0.18 67.42 6.29 7.71 18.58 1.359
2-HL 5.56 4.95 0.13 57.03 6.24 9.89 26.83 1.001
3-QT 5.35 5.18 0.13 30.93 8.04 24.65 36.38 0.773
Laterite soil sample collected from Hawaii Island was also used for adsorption experiments.
Soil sample was air-dried at room temperature and ground in mortars. A particle fraction less than
2mm was used as adsorbent in the present study.

94
A volcanic ash sample was supplied from Astec.Co. under a trade name of TRP-Ai, which was
used in flocculation experiments of suspended clay particles presented in Chapter 4. This product is
made from subsurface layer of weathered volcanic ash soil rich in allophane and imogolite by
mechanical dispersion treatment followed by pH adjustment with HCl. The product is thick slurry
with a solid content of 132 g L-1. The liquid sample was dried at 105oC for overnight, and then softly
ground by mortars to collect small particles. The particle fraction less than 2mm was used as
adsorbent in this study.
Hawaii soil collected from a soil profile in Hilo, Hawaii was formed in volcanic ash under
perhumid climate. Its mineralogy and physic-chemical characteristics are presented in the Table 7.2.
Hematite, goethite, silicate minerals are dominant in mineral composition of Hawaii soil (Wada, K
and Wada, S-I, 1976). The absence of allophane and imogolite minerals in the Hawaii soil may be
ascribed to a fairly dry climate where soil was formed. The predominance of noncrystalline hydrous
alumina and iron oxides in soil reflects the strong effects of desilication in weathering of volcanic ash
(Wada, K and Wada, S-I, 1976).
Table 7.2. Mineralogy and characteristics of Hawaii soil
Mineral component Hematite, goethite (H>G), kaolinte, illite, gibbsite, quazt
Particle size distribution 2000-200µm 15.0 % 200-20µm 18.8 % 20-2µm 12.6 % <2µm 53.7 % Composition SiO2 2.8 % Al2O3 17.4 % Fe2O3 37.1 % SiO2/Al2O3 molar ratio 57.3
Total C 2.6 % Al 3.74 % Fe 14.6 % pHkcl 5.3
Simulated solutions of Cu (II), Pb (II) and Cd (II) were made from commercial reagent of
analytical grade. The stock solutions containing 1000mg/L were prepared by dissolving 3.775 g of
copper (II) nitrate trihydrate Cu(NO3)2.3H2O; 1.598 g of lead (II) nitrate Pb(NO3)2 and 2.744 g of
cadmium nitrate tetra hydrate Cd(NO3)2.4H2O in one liter of deionizer water. The working solutions
were diluted from the stock solutions at appropriate concentration. Solution of Ca(NO3)2 0.01M was
used to control ionic strength, solutions of HNO3 0.1M and NaOH 0.1M were used to adjust pH.

95
7.2.2 Analysis of mineralogy and surface charge of laterite and volcanic ash samples.
Mineralogy of particle size fractions (clay, silt, fine sand and coarse sand) of the samples were
analyzed by X-ray diffraction (RINT-2000V, Rigaku) with a Cu Kα radiation at 40 kV and 20 mA
following the procedure of Nga et al. (2013).
Surface charge of the samples was determined by serial potentiometric titration method. Five
gram portion of the sample was equilibrated with NaCl solutions having different pHs for 4 h to keep
ionic strength at 0.005mol L-1, 0.05 mol L-1or 0.01 mol L-1. Proton or hydroxide ion adsorption was
calculated from pH difference between before and after reaction, then pHpzse were determined from
the intersection point of the curves where proton and hydroxide adsorptions were plotted against pH at
different ionic strengths. The surface charge was set to zero at pHpzse and for other pH charges were
determined by shifting the proton and hydroxide adsorption isotherms. The detail procedure is
described by Lucian and Liming (1996) as below:
Place fixed amount of samples (5 g for laterite samples and 3 g for TRP-Ai) in each of capped
centrifuge plastic tube (39 tubes in total and arranged in three rows of 13 for one sample). The middle
tube in a row will be zero-addition of acid or base. Each tube in a row will contain a NaCl solution of
the same ionic strength i.e., 0.005, 0.01 and 0.005M, respectively) (Table 7.2).
To establish a pH range (i.e., 3-11) increasing amounts of 0.005M HCl or 0.005M NaOH
(standardized) was added to the tubes (0.5 mL-25 mL) as presented in Table.7.3. For the 0.005M ionic
strength row, 0.005M NaCl was added to bring the total volume in each tube to 50 mL. The remaining
ionic strength solutions (i.e., 0.05 and 0.01 M) have 1 similar sequential addition of acid and base
with further additions of ionic strength salt (0.02 and 0.1M) and distilled water to provide a 50 mL
solution aliquot at a fixed ionic strength (Table 7.3).
Samples were shaken for 4 h to get equilibrium at room temperature and a speed of 170 rpm.
Centrifuge and determine the pH of supernatant. Conductivity measurement of supernatant was
performed to determine the precise final ionic strength of equilibrium solution.
Blank sample (without soil added) was carried out in the same manner with laterite and volcanic
ash soil samples. Similarly to the procedure of the soil suspension titration, known amounts of
electrolyte, standardized acid or base and deionizer water were mixed to produce a solution of desired
pH and ionic strength. The blank sample has the same total volume as used in the soil titrations.
Equilibrium and pH measurements were all performed similar to those described above. Calculate a
∆H-∆OH (cmolckg-1) for each sample at each ionic strength examined and plot vs. equilibrium pH.

96
∆H-∆OH =
x.
where
∆H-∆OH = apparent proton surface charge density calculated by titration at given ionic strength and
pH in cmolckg-1
∆H= The different between the final H+ concentration of suspension solution and that of the blank
∆OH = The different between the final OH- concentration of suspension solution and that of the blank
pHB = pH of the blank solution
pHS = pH of the solution equilibrated with the sample
14= conditional dissociation product of water
γ = Single ion activity coefficient calculated with the Davies equation (0.71)
w= oven-dried soil sample weight (g)
Table 7.3. Amount (mL) of acid, base, ionic strength salt and distilled water necessary to establish a
50 mL aliquot consisting of a sequential pH change while maintaining an ionic strength of 0.005, 0.01
and 0.05M.
Tube No
0.005M HCl
0.005M NaOH
0.005M 0.01M 0.05M
0.005M NaCl
0.02M NaCl
Distilled water
0.1M NaCl
Distilled water
1 25 0 25 18.8 6.2 23.2 1.8
2 15 0 35 21.2 13.8 24.2 10.8
3 8 0 42 23 19 24.6 17.4
4 4 0 46 24 22 24.8 21.2
5 2 0 48 24.5 23.5 24.9 23.1
6 0.5 0 49.5 24.2 25.3 25 24.5
7 0 0 50 25 25 25 25
8 0 0.5 49.5 24.2 25.3 25 24.5
9 0 2 48 24.5 23.5 24.9 23.1
10 0 4 46 24 22 24.8 21.2
11 0 8 42 23 19 24.6 17.4
12 0 15 35 21.2 13.8 24.2 10.8
13 0 25 25 18.8 6.2 23.2 1.8

97
7. 2.3. Thermal analysis
Differential thermal and gravimetric analysis (DTA-TG) was carried out simultaneously using the
system of Rigaku Thermo plus EVO. The samples were heated from 20 to1000oC at a heating rate of
10 ºC/min. The amount of sample used in each test was 10mg.
7.2.4 Adsorption experiments
7.2.4.1 Determine dosage of adsorbents
For Copper adsorption
The adsorption of Cu2+from solutions of 5 mg L-1, 10 mg L-1and 20 mg L-1were examined with
increasing amount of adsorbents added. Amount of 0.3 g; 0.5g; 1 g; 1.5 g and 2 g of samples were
placed in centrifuge tubes and then a 50 mL volume of Cu2+ solutions were added. The samples were
shaken at a speed of 170 rpm at room temperature for equilibration (i.e., 4 h for HW sample and 24 h
for TRP-Ai and laterite samples). The supernatants were collected after centrifugation at 2500 rpm for
15 min. Copper concentration in the collected supernatants was measured by atomic absorption
spectroscopy (Hitachi, Z2300).
For Lead adsorption
The adsorbents used for this experiment are TRP-Ai, HW and three laterite samples. The different
amount of sorbents (i.e., 0.1g; 0.2g; 0.5g; 1g; 1.5 g; 2 g and 3 g) were placed in the centrifuge tubes.
A volume of 50 ml of solution of 10 mg L-1lead then was added in. The samples were shaken for 24 h
at 170 rpm at room temperature for equilibration. The supernatants were collected by centrifugation at
2500rpm for 15 min. Copper concentration was measured by atomic absorption spectroscopy (Hitachi,
Z2300).
For cadmium adsorption
Different amount of adsorbents (i.e., 0.5g; 1g; 1.5g; 2g; 2.5g; 3g; 4g for laterite samples and HW
and 0.5g; 1g; 2g; 3g; 4g; 6g for TRP-Ai) was placed in centrifuge tubes. The volume of 50 mL of
solution Cd2+ was added and then shaken for 24 h for equilibration. Supernatant was collected by
centrifugation at 2500rpm for 15 min. The Cd2+ concentration in supernatant was measured by atomic
absorption spectroscopy (Hitachi, Z2300).
7.2.5 Adsorption isotherm experiment
For the copper adsorption isotherm experiment, an appropriate amounts of adsorbents (1 g for
HW, TRP-Ai) and (2 g for laterite samples) were placed in the centrifuge tubes. Then a volume of
50mL of Cu2+solutions with concentration range from 0-30mgL-1were added. For equilibration, the
suspensions were shaken for 24 h at 170 rpm at room temperature. Centrifugation at 2500 rpm was
conducted for 15 min after equilibration and the supernatants were collected by centrifugation.

98
Copper concentration was measured by atomic absorption spectroscopy (Hitachi, Z2300). Each
experiment was duplicated.
For the lead adsorption isotherm experiment, 1 g portions of the adsorbents were placed in the
centrifuge tubes. Then a volume of 50 mL of Pb2+ solution with concentration range from 0-20 mg L-
1were added. The equilibration and Pb determination in the equilibrium solutions were done in the
same way to that for Cu.
For the Cadmium adsorption isotherm experiment, 3 g portions of adsorbents were placed in the
centrifuge tubes. Then a volume of 50 mL of Cd2+ solution with various concentrations from 0-20 mg
L-1was added. The equilibration and Pb determination in the equilibrium solutions were done in the
same way to that for Cu.
7.2.6 pH effects on heavy metal adsorption
For copper adsorption, an appropriate amount of samples (1 g of HW, TRP-Ai and 2 g of
laterite samples) were placed in centrifuge tubes. 25 mL of 0.01 M Ca(NO3)2solution was added to
maintain ionic strength at 0.005M. In order to adjust pH to desired values, predetermined volumes
(Table 7.4) of 0.1 M HNO3 or NaOH solution was added. Distilled water was used to fill up to 40 mL
(Table 7.4). Finally, 10 ml portions of 50 mg L-1 Cu2+ solution were added. Then, samples were
shaken for 24 h at 170 rpm to equilibrate. Supernatant was separated after centrifugation at 3000 rpm
for 20 min. Copper concentration measurement in supernatant was determined by atomic absorption
spectroscopy (Hitachi, Z2300). pH was measured before shaking and after equilibrium time.
A similar procedure was applied for pH effect experiments on lead and cadmium adsorption.
The amount of absorbents used for lead adsorption examples was 1 g and for cadmium adsorption
experiments was 3 g.
Table 7.4. Volume (mL) of acid and base added to adjust pH
HNO3/NaOH Ca(NO3)2 Water
HNO3 0.1 25 14.9
0.5 25 14.5
1 25 14
1.5 25 15.5
3 25 12
NaOH 0.1 25 14.9
0.2 25 14.8
0.3 25 14.7
0.5 25 14.5
1 25 14

99
7.2.7 Kinetics of heavy metal adsorption
Experiments were performed at room temperature (25oC) at a metal concentration of 10 mg L-1.
Five hundred mL of a metal solution was placed in a 1-L bottle, to which an appropriate amount (10 g
for Cu2+ and Pb2+ experiments, 30 g for Cd2+ experiments) of samples was added. The bottles were
shaken at 170 rpm without pH adjustment. Several mL of reaction solution was sampled at intervals
between 0 and 28 h. The supernatant was immediately filtered through a 0.45 µm membrane filter and
then metal concentration was measured.
The percent heavy metal adsorption was calculated using the following equation:
Metal ion adsorption (%) = (C0−Ce) ×100/C0
Where C0: initial metal ion concentration of test solution in mg L-1;
Ce: final equilibrium concentration of test solution in mg L-1.
7.3 RESULTS AND DISCUSSION
7.3.1. Mineralogy and surface charge characteristics
X-ray diffraction patterns of the Mg-saturated and glycerol-solvated clay fractions and fine sand
fractions of three laterite samples are shown in Fig. 7.1. The clay fractions of the 1-TT and 2-HL
samples showed fairly strong peaks at 0.7, 0.418, 0.35 and 0.269 nm, indicating that these samples
contained kaolinite and goethite and hematite. In addition, the 1-TT sample showed weak peak at 1.4
nm, indicating that it contain small amount of non-expandable 2:1 layer silicates. The weak peak at
0.487 nm indicates that all the samples contain gibbsite. The 3-QT sample showed a significantly
different mineralogy; it was dominated by quartz and contained much less amount of kaolinite and
goethite. The dominance of 0.425 and 0.334 nm peaks in the X-ray diffraction patters for fine sand
samples indicate that the major mineral in the fine sand fraction was quartz. The small but distinct
peak at 0.418 and 0.269 nm shows that the fine sand fractions also contain goethite and hematite. The
silt and coarse sand fractions exhibited similar X-ray patterns.
X-ray diffraction patterns of TRP-Ai sample are also shown in Fig. 7.1. This sample gave faint
diffraction peaks only at about 1.4, 0.7 and 0.334 nm after Mg-saturation and glycerol-solvation but
the former two peaks disappeared after heating at 550ºC (not shown). This suggests that these peaks
arose mostly from imogolite but not from layer silicate minerals. The 0.334 nm peak persisted after
heating, indicating that the TRP-Ai contained small amount of quartz. The particle size distribution

100
showed that it comprised of 28% of coarse sand (200-2000 m), 12% of fine sand (20-200 m), 13%
of silt (2-20 m) and 47% of clay (< 2 m) by weight.
Fig. 7.2 shows an electron micrograph of the < 2 m fraction of the TRP-Ai. The aggregates of
very fine granules and threads indicate the dominance of allophane and imogolite. Although thread
like imogolite is conspicuous in this micrograph, faint peaks in the X-ray diffractogram (Fig. 7.1) and
the fact that pure imogolite shows fairly strong diffraction peak at around 1.2-2.0 nm (Wada, 1989)
suggest that the relative abundance of imogolite was low.
Fig. 7.1. X-ray diffraction pattern of laterite samples/ Clay fraction
0.14 0.7
0.425
0.418
0.334
0.325 0.269
0
2000
4000
6000
8000
0 10 20 30 40
3-QT
2-HL
1-TT
TRP-Ai
Intensity/cps
Cu Kα 2θ

101
Fig. 7.2. Electron micrograph of < 2 m fraction of TRP-Ai.
Basic chemical properties of laterite samples are summarized in Table7.1. The pH (H2O) was in
a range from 5.3 to 5.6 and the pH (KCl) was similar, indicating that the samples contained little
exchangeable Al. The 1-TT sample showed the highest clay content of 67% followed by the 2-HL and
3-QT samples. The clay content of the 3-QT sample was only 30% and it had fairly high sand content.
Although the clay content was high, the effective cation exchange capacity, i.e. the sum of
exchangeable cations, was very low. This is a reflection of the virtual lack in 2:1 type layer silicate
minerals as indicated by X-ray diffraction (Fig. 7.1).
The results of thermal analyses are shown in Fig.7.3. All the samples showed clear endothermic
peaks centered at around 50, 320°C and corresponding weight losses. The 1-TT and 2-HL samples
exhibited an additional large endothermic peak at 480°C but the 3-QT sample showed only a faint
peak at that temperature. The endothermic peak at 50°C obviously came from desorption of adsorbed
water. And the peaks at 320 and 480°C are assigned to dehydration reaction of hydroxide minerals
and kaolinite, respectively. Although goethite dehydrates at lower temperature than gibbsite, it is
difficult to separate the contribution of these minerals to the endothermic peak centered at around
320°C. These results harmonize with X-ray diffraction patterns shown in Fig. 7.1, particularly in that
the 3-QT sample showed very weak diffraction peak at 0.7 nm. The 2-HL and 3-QT samples showed
large endothermic peaks at around 840°C but they did not accompany weight loss. The origin of these
endothermic peaks was not identified.
1 m

102
Fig. 7.3. Results of differential thermal analysis and thermogravimetric analysis
‐1.6
‐1.4
‐1.2
‐1
‐0.8
‐0.6
‐0.4
‐0.2
0
‐6
‐4
‐2
0
2
4
6
8
10
0 200 400 600 800 1000
Temperature/oC
1-TT
DT
A/µ
V TG
/ mg
‐1.4
‐1.2
‐1
‐0.8
‐0.6
‐0.4
‐0.2
0
‐15
‐10
‐5
0
5
10
0 200 400 600 800 1000
TG/m
g
2-HL
Temperature/oC
‐0.7
‐0.6
‐0.5
‐0.4
‐0.3
‐0.2
‐0.1
0
‐15
‐10
‐5
0
5
10
0 200 400 600 800 1000
Temperature/oC
3-QT
DTA
/µV
TG/ mg

103
The dehydration reaction of gibbsite and kaolinite are expressed as below
2Al(OH)3 = Al2O3 + 3H2O (7.1)
and
Si4Al4O10(OH)8 = SiO2.Al2O3 + 4H2O (7.2)
The weight loss from 200 to 400°C was about 0.5 mg for all three samples. If this came from the
dehydration of gibbsite, the stoichiometry in the reaction (1) gives the gibbsite weight of 1.4 mg in 10
mg sample. But this calculation is not convincing enough. Similarly, the weight of kaolinite in is
estimated to be 1.4 mg for the 1-TT and 2-HL samples and 0.71 mg for the 3-QT sample.
Fig. 7.4 shows the surface charge characteristics of laterite samples used in the present study,
where the net surface charge was plotted against solution pH. The net charge decreased as pH
increased and the sign of the net charge reversed at pHs 5.10; 5.00; 5.40 and 6.01 for the 1-TT, 2-HL,
3-QT and TRP-Ai samples, respectively. The net charge of HW sample was not investigated because
its characteristics were similar to that of laterites and net charge characteristics can be speculated from
that of laterite samples. These pH values, i. e. the point of zero net charge (PZNC) were not much
different from pH values measured in water (Table 7.1). Since PZNC for goethite and gibbsite lie
around pH 8, the observed lower PZNC values may be due to the presence of kaolinite and quartz.
Fig. 7.4. Surface charge diagrams of laterite samples and volcanic ash.
Based on the mineralogical and chemical data, the approximate mineralogical composition of
the laterite samples is summarized in Table 7.5. Chemical composition is presented in Table 7.6.
‐3.0
‐2.0
‐1.0
0.0
1.0
2.0
3.0
3 5 7
Sur
face
cha
rge/
cmol
ckg-
1
pH
1 - TT
0.005 M
0.01 M
0.05 M
3 5 7pH
2-HL
3 5 7
pH
3- QT
‐6.0
‐4.0
‐2.0
0.0
2.0
4.0
6.0
3 5 7
pH
TRP-Ai

104
Table 7.5. Mineralogy identification of laterite samples
Sample Fraction Identification
1-TT Clay Mica; kaolinite; Geothite; feldspars Silt Kaolinite; Geothite; Quazt; Feldspars
Fine sand Quazt; Geothite
Coarse sand Kaolinite; Geothite; Quazt
2-HL Clay Kaolinite; Geothite; Feldspars
Silt Kaolinite; Geothite; Quazt; feldspars
Fine sand Geothite; Quazt
Coarse sand Kaolinite; Geothite; Quazt; hematite, Feldspars
3-QT Clay Kaolinite; hematite; Quazt; Feldspars
Silt Quazt
Fine sand Quazt
Coarse sand Geothite; Quazt
HW Clay Kaolinite, goethite, feldspars
TRP-Ai Clay Allophane and imogolite
Table 7.6. Chemical composition (%) of laterite and volcanic ash samples (XRF analysis)
Composition 1-TT 2-HL 3-QT HW TRP-Ai
Al2O3 36.684 32.435 12.862 44.718 32.8
SiO2 34.835 32.001 69.1 9.462 52.8
Fe2O3 23.994 31.005 14.871 34.194 7.1
TiO2 3.184 3.311 0.696 5.654 1.32
K2O 0.499 0.271 0.394 1.58
P2O5 0.292 0.129
SO3 0.174 0.183 0.154 0.819 0.626
V2O5 0.153 0.151
Cr2O3 0.078 0.059 0.284
ZrO2 0.061 0.051 0.045 0.063
MnO 0.045 0.412 1.815 0.435 0.177
CuO 0.075 0.064
MgO 4.372 0.375
CaO 1.26
Na2O3 1.11
Cl- 0.564

105
7.3.2. Heavy metal adsorption
7.3.2.1 Effect of contact time
In order to determine equilibrium time of metal adsorption on to materials, the experiment was
conducted with a dose of 40 g L-1 of adsorbents at pH 4.8-5.0 and initial metal concentration of 10 mg
L-1. Copper is selected as a representative metal. A review on copper adsorption by Marc and Alan
(1981) showed that it has low adsorption affinity to hydrous metal oxides. Therefore adopting
equilibrium time determined for copper will be reasonable. Fig.7.5 shows the variation in the
adsorption of copper with contact time. It is evident from the experimental results that absorbance
decreased very rapidly in the initial 30 min and gradually afterward until equilibrium was obtained.
After 24 h, the absorbance of the reaction solutions for laterite samples (1-TT, 2-HL and 3-QT)
reached constant values. Two rest samples (HW and TRP-Ai) required 20 h to reach constant
absorbance. For all experiments carried out in the present study, equilibration time was set to 24 h.
Fig 7. 5. Effect of contact time on metal adsorption by laterite and volcanic samples.
7.3.2.2 Effect of adsorbent dose
The results for removal of heavy metals at different adsorbent doses are shown in Fig 7.6.The
experiments were carried out at initial solution pHs from 5.0-5.2. A general trend was that the
adsorption of heavy metals increased as dose of adsorbents increased. The possible reasons are that
the greater availability of adsorption sites on surfaces of adsorbents. However, the increase was less
significant when adsorbents were used with high dose (Fig.7.6). The adsorption seemed to have
reached plateau at a dose of 2 g for Cu2+, 1-1.5 g for Pb2+ and 3 g for Cd2+. These phenomena were
further investigated in other experiments in this study.
0
0.05
0.1
0.15
0.2
0.25
0.3
0 5 10 15 20 25 30
Abs
orba
nce/
abs
Time/hour
Cu
1-TT
2-HL
3-QT
TRP-Ai
HW
No adsorbentadded

106
Fig.7.6. Effects of adsorbent dose on metal adsorption by laterite and volcanic samples
0
20
40
60
80
100
0 2 4 6
Ads
orpt
ion
(%)
Adsorbent dose (g)
TT
Cu
Pd
Cd
0
20
40
60
80
100
0 2 4 6
Ads
orpt
ion
(%)
Adsorbent dose (g)
HL
Cu
Pb
Cd
0
20
40
60
80
100
0 2 4 6
Ads
orpt
ion
(%)
Adsorbent dose (g)
QT
Cu
Pb
Cd
0
20
40
60
80
100
0 2 4 6
Ads
orpt
ion
(%)
Asorbent dose (g)
HW
Cu
Pb
Cd
0
20
40
60
80
100
0 2 4 6
Ads
orpt
ion
(%)
Adsorbent dose (g)
TRP-Ai
Cu
Pb
Cd

107
Hematite, goethite in (Table7.5) laterite and allophane in TRP-Ai samples are believed to have
fairly high metal adsorption capacity. The metal ion adsorption results from surface complexation that
is the interaction of surface functional groups (i.e., Fe-OH, Al-OH and Si-OH) with metal cations.
Both outer- sphere complexation and inner-sphere complexation are believed to be involved in metal
adsorption (Donald, 2003).The metal adsorption occurs on negative surface charges of samples at the
pHs over PZNC in which the outer-sphere complexation is dominated. Adsorption of metal ions via
the inner-sphere complexation does not depend on surface charge of goethite, hematite and allophane.
Surface complexation is described by the reactions;
SOH +Mn+ = SOM(n-1) + H+
2SOH + Mn+ = (SO)2M(n-2)+2H+
where SOH is the surface functional group. M is the metal ion, having charge number of n.
The adsorbents mostly absorbed 80-90% of heavy metal added, indicating their capability to
remove Cu2+, Pb2+ and Cd2+ from wastewaters. But TRP-Ai (Fig 7.6) which adsorbed less than 40%
the added Cd2+ was an exception. The poor cadmium adsorption by volcanic ash sample (TRP-Ai) is
probably because Cd2+ has markedly high affinity for iron oxide minerals (Gadde and Laitinen, 1974;
Forbes et al., 1976) but not for aluminum oxide minerals (Kinniburgh et al., 1976). At the same
experimental conditions (i.e., pH solution 5-5.2, low ionic strength 0.005M and heavy metal
concentration of 10mgL-1), the difference in required dose of adsorbents to realize maximum removal
(i.e., 1-1.5 g for Pb2+; 2 g for Cu2+ and 3 g for Cd2+) reveals that the adsorbents adsorbed lead more
effectively than copper. Cadmium was absorbed less effectively than copper and lead.
7.3.2.3 Adsorption isotherms
The data for adsorption isotherm were obtained at fixed adsorbent dosage and varying initial
concentration of metal ions. The experimental data were analyzed based on the Langmuir and
Freundlich isotherm equations.
Langmuir equation is given by
. .
1 .
and the Freundlich equation is given by /
Where Qe is the amount of metal ions adsorbed perunit mass of adsorbent in mg g-1,
Ce is the equilibrium concentration of heavy metal ions in mgL-1,
Ke and n are Freundlich constants,

108
‘qm’ is a Langmuir constant which is a measure of adsorption capacity expressed in mgg-1,
‘Ka’ is also Langmuir constant which is a measure of energy of adsorption expressed in mg-1.
The parameters ‘qm’ and ‘Ka’ are calculated from the slope and the intercept of the plots.
Fig.7.7. Langmuir isotherm of metal adsorption by laterite and volcanic ash samples.
0
0.2
0.4
0.6
0.8
1
0 10 20 30
Qe(
mg
g-1)
Ce (mg g-1)
1-TT
Cu
Langmuir- Cu
Pb
Langmuir- Pb
Cd
Langmuir - Cd
0
0.1
0.2
0.3
0.4
0.5
0.6
0.7
0.8
0 10 20 30
Qe
(mg
g-1)
Ce (mg L-1)
HLCu
Langmuir - Cu
Pb
Langmuir - Pb
Cd
Langmuir - Cd
0
0.2
0.4
0.6
0.8
1
1.2
0 5 10 15 20 25
Qe
(mg
g-1)
Ce (mg L-1)
3-QT
Cu
Langmuir - Cu
Pb
Langmuir - Pb
Cd
Langmuir - cd
00.10.20.30.40.50.60.70.80.91
0 10 20 30
Qe
(mg
g-1)
Ce (mg L-1)
HWCu
Langmuir - Cu
Pb
Langmuir - Pb
Cd
Langmuir- Cd
0
0.5
1
1.5
2
0 5 10 15 20
Qe
(mg
g-1)
Ce (mg L-1)
TRP-AiCuLangmuir - CuPbLangmuir- PbCdLangmuir - Cd

109
Fig.7.8. Freundlich isotherm metal adsorption by laterite and volcanic ash samples.
0
0.2
0.4
0.6
0.8
1
1.2
0 5 10 15 20 25
Qe
(mg
g-1)
Ce (mg L-1)
1‐TT
CuFreundlich-CuPbFreundlich-PbCdFreundlich-Cd
0
0.1
0.2
0.3
0.4
0.5
0.6
0.7
0.8
0 5 10 15 20 25
Qe
(mg
g-1)
Ce (mg L-1)
2-HL
CuFreundlich - CuPbFreundlich - PbCdFreundlich - Cd
0
0.2
0.4
0.6
0.8
1
1.2
1.4
0 5 10 15 20 25
Qe
(mg
g-1)
Ce (mg L-1)
3-QT
CuFreundlich ‐ CuPbFreundlich‐ PbCdFreundlich ‐ Cu
0
0.2
0.4
0.6
0.8
1
0 10 20 30
Qe
(mg
g-1)
Ce (mg L-1)
HW
CuFreundlich - CuPbFreundlich - PbCdFreundlich - Cd
0
0.2
0.4
0.6
0.8
1
1.2
0 5 10 15 20
Qe
(mg
g-1)
Ce (mg L-1)
TRP-Ai
CuFreundlich - CuPbFreundlichCdFreundlich - Cd
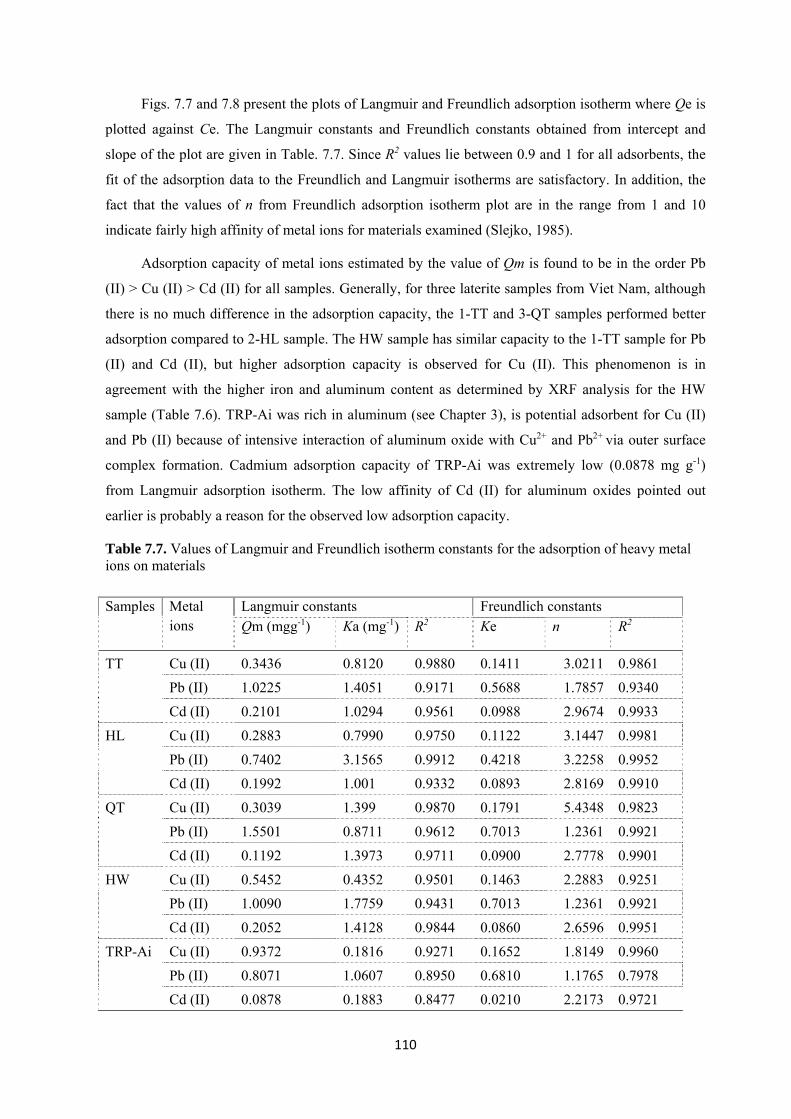
110
Figs. 7.7 and 7.8 present the plots of Langmuir and Freundlich adsorption isotherm where Qe is
plotted against Ce. The Langmuir constants and Freundlich constants obtained from intercept and
slope of the plot are given in Table. 7.7. Since R2 values lie between 0.9 and 1 for all adsorbents, the
fit of the adsorption data to the Freundlich and Langmuir isotherms are satisfactory. In addition, the
fact that the values of n from Freundlich adsorption isotherm plot are in the range from 1 and 10
indicate fairly high affinity of metal ions for materials examined (Slejko, 1985).
Adsorption capacity of metal ions estimated by the value of Qm is found to be in the order Pb
(II) > Cu (II) > Cd (II) for all samples. Generally, for three laterite samples from Viet Nam, although
there is no much difference in the adsorption capacity, the 1-TT and 3-QT samples performed better
adsorption compared to 2-HL sample. The HW sample has similar capacity to the 1-TT sample for Pb
(II) and Cd (II), but higher adsorption capacity is observed for Cu (II). This phenomenon is in
agreement with the higher iron and aluminum content as determined by XRF analysis for the HW
sample (Table 7.6). TRP-Ai was rich in aluminum (see Chapter 3), is potential adsorbent for Cu (II)
and Pb (II) because of intensive interaction of aluminum oxide with Cu2+ and Pb2+ via outer surface
complex formation. Cadmium adsorption capacity of TRP-Ai was extremely low (0.0878 mg g-1)
from Langmuir adsorption isotherm. The low affinity of Cd (II) for aluminum oxides pointed out
earlier is probably a reason for the observed low adsorption capacity.
Table 7.7. Values of Langmuir and Freundlich isotherm constants for the adsorption of heavy metal ions on materials
Samples Metal
ions Langmuir constants Freundlich constants Qm (mgg-1) Ka (mg-1) R2 Ke n R2
TT Cu (II) 0.3436 0.8120 0.9880 0.1411 3.0211 0.9861
Pb (II) 1.0225 1.4051 0.9171 0.5688 1.7857 0.9340
Cd (II) 0.2101 1.0294 0.9561 0.0988 2.9674 0.9933
HL Cu (II) 0.2883 0.7990 0.9750 0.1122 3.1447 0.9981
Pb (II) 0.7402 3.1565 0.9912 0.4218 3.2258 0.9952
Cd (II) 0.1992 1.001 0.9332 0.0893 2.8169 0.9910
QT Cu (II) 0.3039 1.399 0.9870 0.1791 5.4348 0.9823
Pb (II) 1.5501 0.8711 0.9612 0.7013 1.2361 0.9921
Cd (II) 0.1192 1.3973 0.9711 0.0900 2.7778 0.9901
HW Cu (II) 0.5452 0.4352 0.9501 0.1463 2.2883 0.9251
Pb (II) 1.0090 1.7759 0.9431 0.7013 1.2361 0.9921
Cd (II) 0.2052 1.4128 0.9844 0.0860 2.6596 0.9951
TRP-Ai Cu (II) 0.9372 0.1816 0.9271 0.1652 1.8149 0.9960
Pb (II) 0.8071 1.0607 0.8950 0.6810 1.1765 0.7978
Cd (II) 0.0878 0.1883 0.8477 0.0210 2.2173 0.9721

111
7.3.2.4 Effect of pH
pH is one of the most important parameters controlling uptake of heavy metals from wastewater
and aqueous solutions. Fig. 7.9 shows the pH effects on Cu (II), Pb (II) and Cd (II) adsorption on the
laterite and volcanic ash adsorbents. The study was conducted at a constant initial metal ion
concentration of 10 mg L-1. The adsorbent dose was 1 g of HW, TRP-Ai and 2 g of laterite samples
(1-TT, 2-HL, 3-QT) and the reaction time of 24 h was implemented for all of copper, lead and
cadmium.
Fig. 7.9. Effect of pH on metal adsorption by laterite and volcanic ash samples.
0
20
40
60
80
100
3 4 5 6 7
Adsorption (%)
pH
TRP‐Ai
Cu
Pb
Cd
PZNC
PZNC PZNC
PZNC
PZNC

112
The experimental data shows that metal ion adsorption on laterite and volcanic ash samples is
strongly pH dependent. The percentage of adsorption increased with pH to reach a maximum. The
lowest pH value to achieve the maximum adsorption is defined as optimum pH in this study and the
estimated optimum pH values are presented in Table.7.7. It is known that a steep increase in metal
adsorption occurs in a narrow pH range (Fig. 7.9). For example, percentage of Cu (II) adsorbed by the
1-TT sample was 58.5% at pH 4.54 and it increased to 100% at pH 5.59. The lead adsorption by the
1-TT sample showed a similar trend. Cadmium adsorption by the 1-TT sample was less than copper
and lead adsorption, but the adsorption of Cd also increased in a narrow pH range (5.36-6.48) from
39.36% to 97.23%. The adsorption properties of the rest laterites (2-TT, 3-QT and HW) were similar
to that of the 1-TT sample. The volcanic ash (TRP-Ai) showed even steeper increase in metal
adsorption in over narrower pH range. The copper adsorption increased from 52.66% to 100% as pH
increased from 4.43 to 4.90. Remarkably, lead adsorption on to TRP-Ai was not pH dependent as
shown in Fig. 7.9. At low pH (3.89), lead adsorption percentage was 90.63% and then it increased to
100% at above pH 4.68.
Table 7.8. Optimum pHs for metal adsorption on to laterite and volcanic ash materials
Samples Metal ions Maximum adsorption (%)
Optimal pH
1-TT Cu (II) 100 5.59
Pb (II) 100 5.58
Cd (II) 97.23 6.48
2-HL Cu (II) 100 5.42
Pb (II) 100 5.41
Cd (II) 90.1 6.52
3-QT Cu (II) 100 5.3
Pb (II) 100 5.2
Cd (II) 98.3 6.75
HW Cu (II) 100 5.25
Pb (II) 100 5.25
Cd (II) 95.31 6.17
TRP-Ai Cu (II) 100 4.9
Pb (II) 100 4.76
Cd (II) 72.4 6.02

113
The observed behavior can be interpreted in terms of dominance of surface complexation
reactions. The decrease in metal adsorption in lower pH range can be explained on the basis of
competition between proton and metal cations for the same functional groups. In addition, due to
protonation of the adsorbent surface at lower pHs turns net surface proton charge, causing
electrostatic repulsion between the surface of adsorbents and the metal ions.
The points of zero net charge (PZNC) were pHs 5.10, 5.00, 5.40 and 6.01 for the 1-TT, 2-HL,
3-QT and TRP-Ai samples, respectively, suggesting that thus electrostatic interactions affected the
adsorption behavior. Negative surface charges of adsorbents are considered to have favored the
attraction of positively charged metal ions at pHs over the PZNC.
7.4 CONCLUSION
Both volcanic and laterite have high lead adsorption capacity (up to 1.0-1.2 mg Pb g-1 is
recorded at pH5). Adsorption capacity for copper is not as high as that for lead but this is acceptable if
they are used in water treatment (about 0.5-0.8 mg Cu g-1 at pH5). It is difficult to remove cadmium
by laterite and volcanic ash soil. The adsorption capacity is 0.4 mg Cd g-1 at initial Cd concentration
of 25 mg L-1for laterite and less 0.1 mg Cd g-1for the volcanic ash soil at the same initial concentration.
Similar to ferric hydroxides, adsorption of metal cations examined by these materials is strongly pH
dependent. At pH lower than 4, these materials are ineffective to adsorb metals. The use of volcanic
ash soil and laterite is recommended to remove heavy metals from wastewater when the pH of the
target water is over 4 whereas TRP-Ai is not recommended to remove Cd.
REFERENCE
Aman, T., Kazi, A. A., Sabri, M. U. and Bano, Q., 2008. Potato peels as solid waste for the removal
of heavy metal copper (II) from waste water/industrial effluent. J. Colloids Surf., B Biointerfaces.,
63, 116–121.
Baldwin, D. R. and Marshall, W. J., 1999. Heavy metal poisoning and its laboratory investigation.
Annals of Clinical Biochemistry., 3 (36), 267–300.
Baker. D. E., 1956. Fed. Proc. 33: 1188. In Dunnick J.K. and Fowler, B. A. Cadmium. Ed. Hang, G. S.
And Sigel, H. Handbook on toxicity of inorganic compounds. Marcel Dekker, Inc., New york.
Broadbent, F. E. and Nakashima, T., 1971. Effect of added salts on nitrogen mineralization in three
California soils. Soil Sci. Soc. Am. Proc., 35, 457-460.
Campbell, P. G. C., 2006. Cadmium-A priority pollutant,” Environmental Chemistry., 6 (3), 387–388
Cotton, F. A. and Wilkinson, G., 1972. Advanced inorganic chemistry. 3rd edition. Wiley-
Interscience, Toronto.

114
Donnald, L., Sparks, I., 2003. Environmental Soil Chemistry., Book, Academic Press Publisher 2nd
edition, 142 -145.
Ferrick, N., 2008. Mechanism of Arsenic adsorption onto laterite concrete, phd Dissertation.
Fleischer, M., 1974. Environmental impact of cadmium: a review by the panel on hazardous trace
substances. Environ. Health Perspect., 7, 253.
Forbes, E. A., Posner, A. M and Quirk, J. P., 1976. The specific adsorption of divalent Cd, Co, Cu, Pb
and Zn on goethite. J. Soil.Sic., 27, 154-166.
Gadde, R. R. and Laitinen, H. A., 1974. Studies of heavy metal adsorption by hydrous iron and
manganese oxides. J.Anal. Chem., 46, 2022-2026.
Gardea-Torresdey, J., Peralta-Videa, J. R., Rosa, G. D., Parsons, J. G., 2005. Phytoremediation of
heavy metals and study of the metal coordination by X-ray absorption spectroscopy. Coord. Chem.
Rev., 249 (17-18), 1797-1810.
Gupta, S. S., Krishna, A., Bhattacharyya, G., 2011. Kinetics of adsorption of metal ions on inorganic
materials: A review. J. Advances in Colloid and Interface Science., 162, 39–58.
Huang, X., Sillanpёё, M., Dou, B., Gjessing, E. T., 2008. Water quality in the Tibetan Plateau: metal
contents of four selected rivers J. Environ. Pollut., 156, 270–277.
Kinniburgh, D. G., Jackson, M. L. and Syers, J. K., 1976. Adsorption of alkaline Earth, Transition and
heavy metal cations by hydrous oxide gels of iron and aluminum. J. Soil Sci. Soc. Am., 40, 796-
799.
Jiang, A., Pang, H., Liao, B., 2008. Removal of copper (II) ions from aqueous solution by modified
bagasse, J. Hazard. Mater., 164, 1-9.
Lucian, W. Z., Liming, H. and Vanwormhoudt, A., 1996. Charge analysis of soils and anion exchange,
Book Method of soil analysis, part 3. Chemical methods-SSSA.
Maiti, A., Jayanta, K., Kumar, B., Sirshendu, D., 2010. Synthetic and natural groundwater using acid
active laterite. J.Enviromenal progress and sustainable energy., 4, 457-470.
Marc, A. A. and Alan, J. R., 1981. Adsorption of inorganics at solid-liquid interfaces. Book. Ann
Arbor Science publisher., 91-141.
Maji, S. K., Pal, A. J. and Pal, T., 2006. Arsenic removal from real-life groundwater by absorption on
laterite soil. J. Hazad. Mater., 151, 811-820
Martin-Gonzalez, A., Díaz, S., Borniquel, S., Gallego, A., Gutierrez, J. C., 2006. Cytotoxicity and
bioaccumulation of heavy metals by ciliated protozoa isolated from urban wastewater treatment
plants. Res.Microbiol., 157, 108-118.
115
Manahan, S. E., 2003. Toxicological Chemistry and Biochemistry, CRC Press, Limited Liability
Company (LLC), 3rd edition.
Maessen, O., Freedman, B. and McCurdy, R., 1985. Metal mobilization in home well water systems
in Nova Scotia. J. Am. Water Works Assoc., 77, 73.
McLaughlin, M. J., Hamon, R. E., McLaren, R. G., Speir, T. W. and Rogers, S. L., 2000. Review: a
bioavailability-based rationale for controlling metal and metalloid contamination of agricultural
land in Australia and New Zealand, Australian Journal of Soil Research., 6 (38), 1037-1086
Nga, N.T.H., Mori , Y. and Wada, S –I., 2013. Minerology of Laterite samples from Vietnam and
their use as flocculating agents for removal of clay suspensions. J.Fac.Agr.Kyushu Univ., 58(1),
167-173.
Rahman, I. M., Iwakabe., M, K. and Kawasaki, J., 2008. Laterite a potential alternative for removal of
ground water arsenic. Appl.Sci.Enviro.Manage., 1, 93-100.
Rand, G. M. and Petrocelli, S. R., 1985. Fundamental of Aquatic Toxicology Methods and
Applications. Hemisphere Publishing Corp, Washington, D.C.
Raskin, I. and Ensley, B. D., 2000. Phytoremediation of Toxic Metals: Using Plants to Clean Up the
Environment, JohnWiley & Sons, New York, NY, USA,
Rosen, C. J., 2002. Lead in the home garden and urban soil environment, Communication and
Educational Technology Services, University of Minnesota Extension.
Sarkar, B., Hang, G. S. and Sigel, H., 1997. Handbook on toxicity of inorganic compounds. Marcel
Dekker, Inc., New York.
Sandhya, B,, Tonni, A. K., 2003. Low-cost adsorbents for heavy metals uptake from contaminated
water: a review. J. Hazardous Materials., B97, 219–243.
Slejko, F., 1985. Adsorption Technology: A Step by Step Approach to Process Evaluation and
Application, Marcell Dekker, New York.
Stiff, M. J., 1971. The chemical states of copper in polluted fresh water and a scheme of analysis for
differentiating them. Water Res., 5, 585.
Udoeyo, F. F., Robert, B., Inyang, H., Sunyoung, B., 2010. Imo lateritic soil as an absorbent for
heavy metals. IJ.RRAS., 1, 4-5.
Wada, K and Wada, S-I., 1976. Clay mineralogy of the B horizons of hydrandepts, a torrox and a
humitropept in Hawaii. J.Geoderma., 1976, 16, 139-157

116
CHAPTER 8. CONCLUSIONS AND GENERAL DISCUSSION ON PRACTICAL APPLICATIONS OF VOLCANIC ASH SOIL AND LATERITE IN
WATER TREATMENT ___________________________________________________________________________
In the following, the results of the previous chapters are discussed to evaluate suitability and
limits of these materials in practical applications to wastewater and drinking water treatment.
8. 1. WATER TURBIDITY TREATMENT BY VOLCANIC ASH AND LATERITE
The results obtained from flocculation experiments revealed that mineralogy and surface
chemistry characteristics of suspended clay particles significantly affect on their removal efficiency
from water by volcanic ash soil and laterite. The volcanic ash soil rich in allophane and imogolite
minerals is more effective than laterite containing iron oxide minerals in the removal of suspended
clay particles.
Kaolinite, a popular particle type used in ceramic industry, is removed effectively by both
volcanic ash soil and laterite. As calculated in the previous chapters, the use of 33 mg of volcanic ash
or 60 mg of laterite is necessary to remove 200 mg of kaolinite. The aluminum compounds have high
efficiency in environmental treatment, but there is concern about high cost and possible rise in
accumulated aluminum concentration. Therefore, in the current context of global climates change,
volcanic ash and laterite are suitable agents to use for waste water from ceramic industry or mining
activities.
Vermiculite or vermiculite-chlorite particles are widely used in industries as primary materials,
e. g., in agriculture as mineral compounds to improve soil hardness, etc,. However, suspension of
these minerals discharged from mining industries will pose negatively effects on ecosystem. From this
study, it was proven that these minerals can also be removed by using volcanic ash and laterite. It
could be concluded that volcanic ash and natural laterite are suitable for the removal of suspended
clay particles i.e., kaolinite, vermiculite and vermiculite-chlorite from waste water treatment. The
other clay suspended particles such as mica, monmorilinite, smectite, etc., are recommended to use
the volcanic ash and laterite with some modifications.
8.2. PHOSPHOROUS REMOVAL FROM CONTAMINATED WATER BY VOLCANIC ASH
AND LATERITE
Adsorption of phosphate onto laterite was studied. Laterites had phosphorus adsorption capacity
ranging from 1.1 to 1.6 mg P g-1 in a pH range of 3-9 and can reduce phosphorus concentration to
less 2 mg P L-1. The pH range of contaminated waters is wide, depending on characteristics of sources.
Natural water is reported to usually have a pH range from 6-7. The eutrophication water in lake and

117
river, due to nutrient contamination, is supposed to have higher pH range. Waste waters from
detergent industry also have high pH level, but in the pH of waste waters in mining zones are strongly
acidic. As is shown, phosphate adsorption onto laterite is slightly pH dependent, an approximately
10% decrease of adsorption capacities was observed when pH increased by 9 units. However, 3-QT
sample, which is representative latertie containing high quartz content, had a low adsorption capacity
at pH 8- 9. That means the use of laterite to remove phosphorous is reliable for water environment at
all pH ranges, but it is not recommended to use laterite containing higher quartz content to remove
phosphorous at alkaline pHs. The phosphorous adsorption kinetics was fast in first 8 h, and slowed
down afterwards. This characteristic contributes to reduce energy consumption in treatment process.
Result on competitive adsorption showed that laterite very much preferred phosphorous over sulfate
and carbonate. Many literature reviews reported that the adsorption behavior of phosphorous by
volcanic ash agents (Chapter 6) is similar to that by laterite. Allophane and imogolite minerals derived
from volcanic ash were considered to be effective to remove contaminants in waste water and landfill.
In addition, volcanic ash soil has been known by its strong phosphorous retention characteristics,
which sometimes causes phosphorous deficiency. From above interpretation, it can be concluded that
laterite and volcanic ash soil can be applied to phosphorous removal from water
8.3. HEAVY METAL REMOVAL FROM WASTE WATER BY VOLCANIC ASH AND
LATERITE
In comparison to heavy metal adsorption efficiency of zeolite, paragonite, montmorillonite and
kaolinite minerals, both volcanic ash soil and laterite displayed higher adsorption capacity. According
to the results of this the lead adsorption capacity ranged from 1.0 to 1.2 mg Pb g-1 at pH5. Although
adsorption capacity of copper was not as high as that of lead, the capacity of 0.5-0.8 mg Cu g-1at pH5
is acceptable in water treatment.
Cadmium adsorption capacity by laterite was much less than those for lead and copper (0.4 mg
Cd g-1 at initial Cd concentration of 25 mg L-1), but it is still higher than those of other low cost
adsorbents (zeolite, paragosite, montmorilonite and kaolinite minerals). Removal of cadmium has
been big challenges in waste water treatment because of its low affinity for aluminum and iron
hydroxides as indicated by previous studies. In recent years, cadmium treatment in water has marked
remarkable success by new technology application like RO membrane filtration. However, a high
treatment cost and energy consumption limit its application in water treatment. Therefore, both laterite
and volcanic ash will be promising alternative adsorbents to treat lead and copper in waste waters. For
the removal of cadmium, it is recommended to use laterite. The results obtained from the present
study show that selective adsorption of metals by laterite and volcanic ash soil is strongly pH
dependent. This is typical for the adsorption of heavy metal cations by oxide surfaces at near the

118
pHPZC. To achieve high removal efficiency in heavy metal treatment, these adsorbents is recommend
to use for waste water bodies having pHs over 4.
8.4. USING NATURAL LATERITE AS MEDIUM OF FILTRATION PROCESS
The traditional filtration technology using and gravel as filter media has remarkably improved
water quality, especially water turbidity. In the past, when advanced technology had not been devised
yet, this technology had been common and chosen by many users as a standard water treatment
method. In developing countries, this traditional technology has been still popularly applied until now
to purify drinking water. As is indicated by the previous studies, the medium by sand and gravels
suffers from many disadvantages including, i) incomplete removal of small particles <1 µm in size, ii)
it is difficult to remove anions and cations because sand and gravel have small specific surface area.
iii) they are not effective to treat pathogen and microbes.
The laterite is an abundantly available resources in tropical and sub-tropical areas, the use of
laterite as a medium replacing sand and gravel will improve water quality e.g., turbidity,
concentration of ionic pollutants. This material will be highly appreciated in waste water and drinking
water treatment processes.