Embed Size (px)
Citation preview
Marquette University AIM Class 2014 Equity Reports Fall 2013 Page 1
Applied Investment Management (AIM) Program
AIM Class of 2014 Equity Fund Reports
Fall 2013
Date: Friday, November 22 2013 | Time: 3:00 PM
Road Show Location: Wells Capital Management
Student Presenter Company Name Ticker Price Page No.
Danny Muench Noodles NDLS $43.17 2
Sean Whitney Verint Systems Inc. VRNT $36.07 5
Rocio Maria Diaz SunOpta Inc. STKL $9.13 8
John Hurley National Grid NGG $62.55 11
Daniel Gaide African Bank Investments Ltd. AFRVY $8.72 14
Joseph Hagen Costamare Inc. CMRE $18.79 17
Thank you for taking the time today and participating in the AIM ‘road show’ Wells Capital
Management. These student presentations are an important element of the applied learning experience in
the AIM program. The students conduct fundamental equity research and present their recommendations
in written and oral format – with the goal of adding their stock to the AIM Equity Fund. Your comments
and advice add considerably to their educational experience and is greatly appreciated. Today, each
student will spend about 5-7 minutes presenting their formal recommendation, which is then followed by
about 8-10 minutes of Q & A. Again, thank you for allowing us the opportunity to present at Wells.
For more information about AIM please contact:
David S. Krause, PhD
Director, Applied Investment Management Program
Marquette University
College of Business Administration, Department of Finance
436 Straz Hall, PO Box 1881
Milwaukee, WI 53201-1881
mailto: [email protected]
Website: MarquetteBuz/AIM AIM Blog: AIM Program Blog
Twitter: Marquette AIM Facebook: Marquette AIM
Marquette University AIM Class 2014 Equity Reports Fall 2013 Page 2
Noodles & Company (NDLS)
November 22, 2013
Danny Muench Domestic Consumer Discretionary
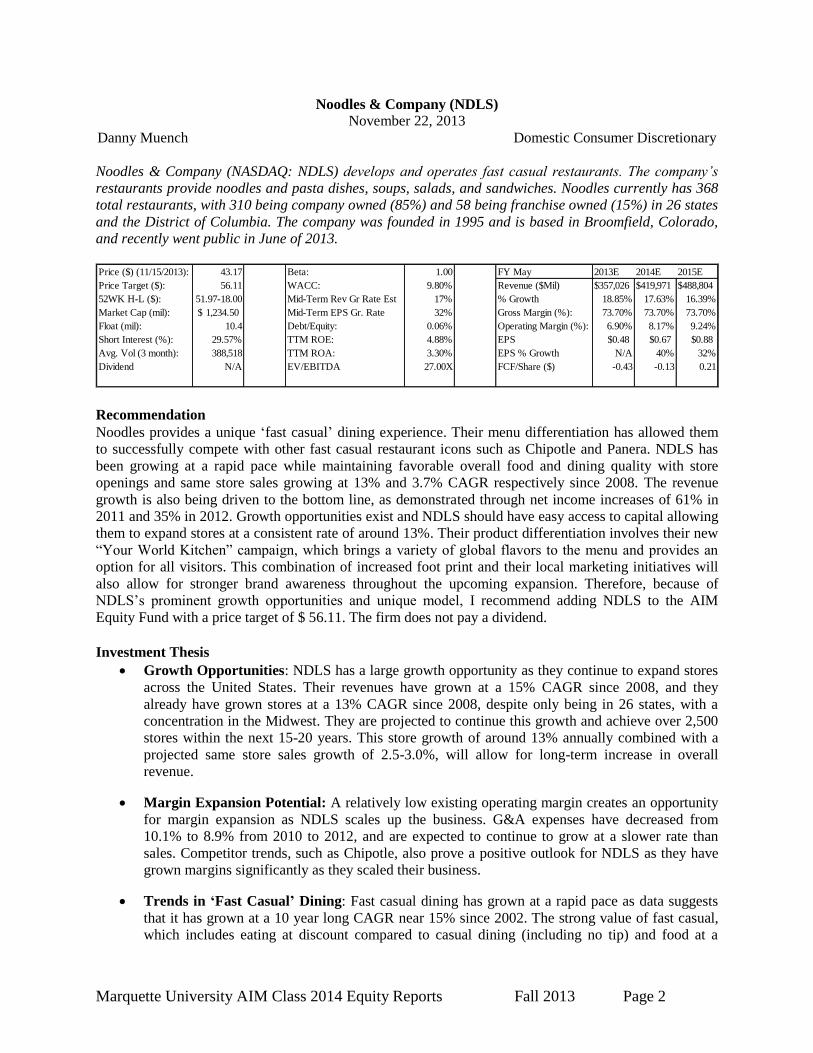
Noodles & Company (NASDAQ: NDLS) develops and operates fast casual restaurants. The company’s
restaurants provide noodles and pasta dishes, soups, salads, and sandwiches. Noodles currently has 368
total restaurants, with 310 being company owned (85%) and 58 being franchise owned (15%) in 26 states
and the District of Columbia. The company was founded in 1995 and is based in Broomfield, Colorado,
and recently went public in June of 2013.
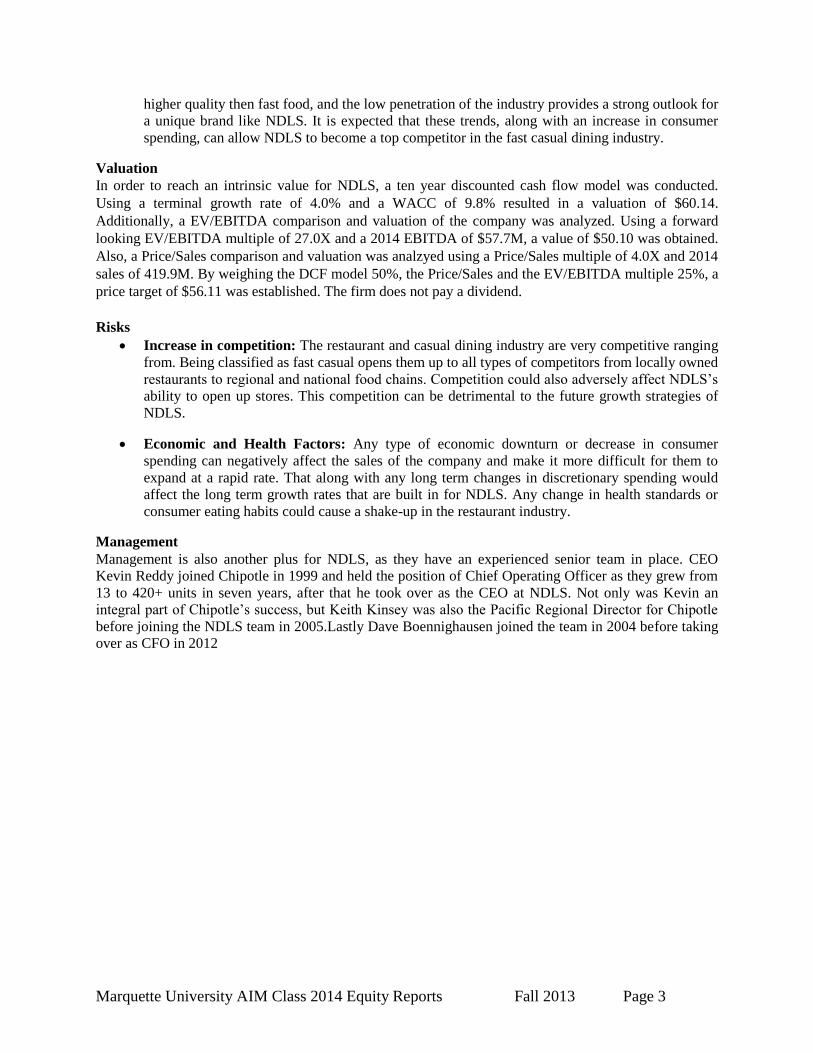
Price ($) (11/15/2013): 43.17 Beta: 1.00 FY May 2013E 2014E 2015E
Price Target ($): 56.11 WACC: 9.80% Revenue ($Mil) $357,026 $419,971 $488,804
52WK H-L ($): 51.97-18.00 Mid-Term Rev Gr Rate Est 17% % Growth 18.85% 17.63% 16.39%
Market Cap (mil): 1,234.50$ Mid-Term EPS Gr. Rate 32% Gross Margin (%): 73.70% 73.70% 73.70%
Float (mil): 10.4 Debt/Equity: 0.06% Operating Margin (%): 6.90% 8.17% 9.24%
Short Interest (%): 29.57% TTM ROE: 4.88% EPS $0.48 $0.67 $0.88
Avg. Vol (3 month): 388,518 TTM ROA: 3.30% EPS % Growth N/A 40% 32%
Dividend N/A EV/EBITDA 27.00X FCF/Share ($) -0.43 -0.13 0.21
Recommendation
Noodles provides a unique ‘fast casual’ dining experience. Their menu differentiation has allowed them
to successfully compete with other fast casual restaurant icons such as Chipotle and Panera. NDLS has
been growing at a rapid pace while maintaining favorable overall food and dining quality with store
openings and same store sales growing at 13% and 3.7% CAGR respectively since 2008. The revenue
growth is also being driven to the bottom line, as demonstrated through net income increases of 61% in
2011 and 35% in 2012. Growth opportunities exist and NDLS should have easy access to capital allowing
them to expand stores at a consistent rate of around 13%. Their product differentiation involves their new
“Your World Kitchen” campaign, which brings a variety of global flavors to the menu and provides an
option for all visitors. This combination of increased foot print and their local marketing initiatives will
also allow for stronger brand awareness throughout the upcoming expansion. Therefore, because of
NDLS’s prominent growth opportunities and unique model, I recommend adding NDLS to the AIM
Equity Fund with a price target of $ 56.11. The firm does not pay a dividend.
Investment Thesis
Growth Opportunities: NDLS has a large growth opportunity as they continue to expand stores
across the United States. Their revenues have grown at a 15% CAGR since 2008, and they
already have grown stores at a 13% CAGR since 2008, despite only being in 26 states, with a
concentration in the Midwest. They are projected to continue this growth and achieve over 2,500
stores within the next 15-20 years. This store growth of around 13% annually combined with a
projected same store sales growth of 2.5-3.0%, will allow for long-term increase in overall
revenue.
Margin Expansion Potential: A relatively low existing operating margin creates an opportunity
for margin expansion as NDLS scales up the business. G&A expenses have decreased from
10.1% to 8.9% from 2010 to 2012, and are expected to continue to grow at a slower rate than
sales. Competitor trends, such as Chipotle, also prove a positive outlook for NDLS as they have
grown margins significantly as they scaled their business.
Trends in ‘Fast Casual’ Dining: Fast casual dining has grown at a rapid pace as data suggests
that it has grown at a 10 year long CAGR near 15% since 2002. The strong value of fast casual,
which includes eating at discount compared to casual dining (including no tip) and food at a
Marquette University AIM Class 2014 Equity Reports Fall 2013 Page 3
higher quality then fast food, and the low penetration of the industry provides a strong outlook for
a unique brand like NDLS. It is expected that these trends, along with an increase in consumer
spending, can allow NDLS to become a top competitor in the fast casual dining industry.
Valuation
In order to reach an intrinsic value for NDLS, a ten year discounted cash flow model was conducted.
Using a terminal growth rate of 4.0% and a WACC of 9.8% resulted in a valuation of $60.14.
Additionally, a EV/EBITDA comparison and valuation of the company was analyzed. Using a forward
looking EV/EBITDA multiple of 27.0X and a 2014 EBITDA of $57.7M, a value of $50.10 was obtained.
Also, a Price/Sales comparison and valuation was analzyed using a Price/Sales multiple of 4.0X and 2014
sales of 419.9M. By weighing the DCF model 50%, the Price/Sales and the EV/EBITDA multiple 25%, a
price target of $56.11 was established. The firm does not pay a dividend.
Risks
Increase in competition: The restaurant and casual dining industry are very competitive ranging
from. Being classified as fast casual opens them up to all types of competitors from locally owned
restaurants to regional and national food chains. Competition could also adversely affect NDLS’s
ability to open up stores. This competition can be detrimental to the future growth strategies of
NDLS.
Economic and Health Factors: Any type of economic downturn or decrease in consumer
spending can negatively affect the sales of the company and make it more difficult for them to
expand at a rapid rate. That along with any long term changes in discretionary spending would
affect the long term growth rates that are built in for NDLS. Any change in health standards or
consumer eating habits could cause a shake-up in the restaurant industry.
Management
Management is also another plus for NDLS, as they have an experienced senior team in place. CEO
Kevin Reddy joined Chipotle in 1999 and held the position of Chief Operating Officer as they grew from
13 to 420+ units in seven years, after that he took over as the CEO at NDLS. Not only was Kevin an
integral part of Chipotle’s success, but Keith Kinsey was also the Pacific Regional Director for Chipotle
before joining the NDLS team in 2005.Lastly Dave Boennighausen joined the team in 2004 before taking
over as CFO in 2012
Marquette University AIM Class 2014 Equity Reports Fall 2013 Page 4
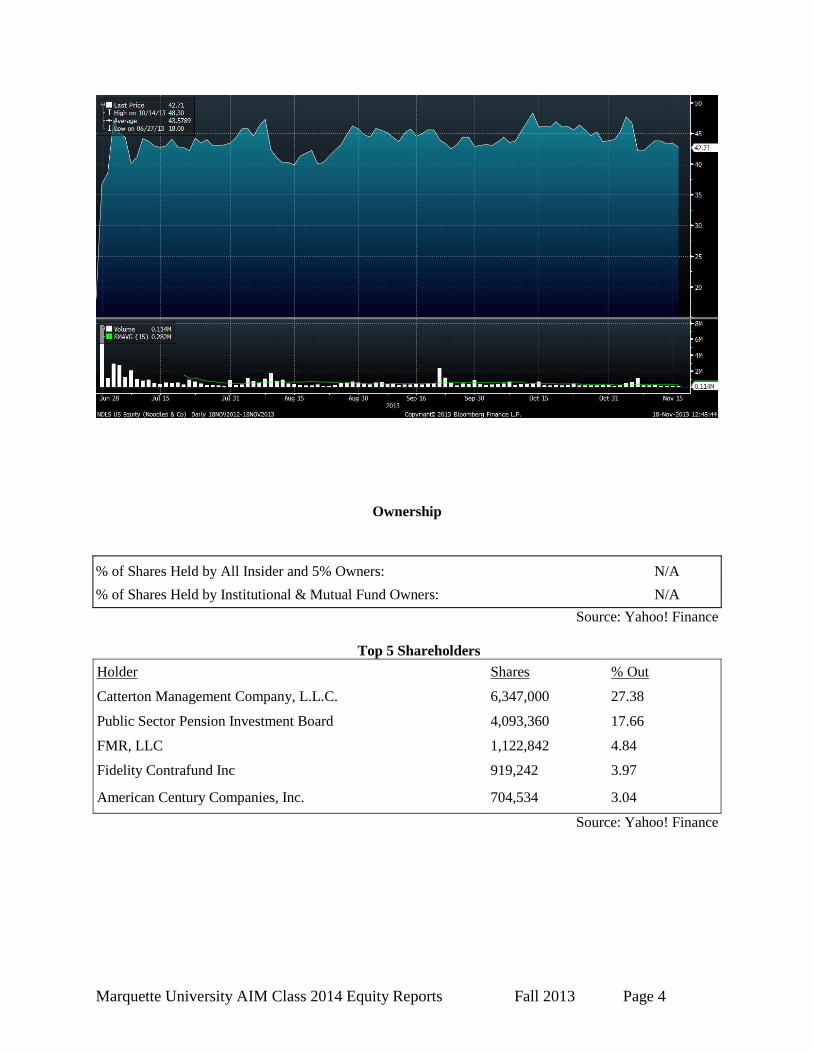
Ownership
Source: Yahoo! Finance
Top 5 Shareholders
Holder Shares % Out
Catterton Management Company, L.L.C. 6,347,000 27.38
Public Sector Pension Investment Board 4,093,360 17.66
FMR, LLC 1,122,842 4.84
Fidelity Contrafund Inc 919,242 3.97
American Century Companies, Inc. 704,534 3.04
Source: Yahoo! Finance
% of Shares Held by All Insider and 5% Owners: N/A
% of Shares Held by Institutional & Mutual Fund Owners: N/A
Marquette University AIM Class 2014 Equity Reports Fall 2013 Page 5
Verint Systems Inc. (VRNT)
November 22, 2013
Sean Whitney Information Technology
Verint Systems Inc. (NASDAQ:VRNT) is a global leader in analytic solutions. They specialize in
communications, interception, digital video security and surveillance, and enterprise business
intelligence. The software provided by Verint Systems creates analytic solutions through the collection,
retention, and analysis of voice, fax, video, email, Internet, and data transmission from multiple
communication networks. VRNT allows companies to make Big Data useful through capturing, analyzing,
and acting on huge volumes of complex underused information sources such as voice, video, and text.
VRNT serves over 10,000 organizations in over 150 countries, including over 80% of the Fortune 100.
The firm operates in two business units: Enterprise Intelligence and Security Intelligence. These are
further broken down into three operating segments: Enterprise Intelligence Solutions, Video and
Situation Intelligence Solutions, and Communications and Cyber Intelligence Solutions. The Enterprise
Intelligence segment helps enhance customer service operations in order to increase customer
satisfaction, reduce operating costs, increase customer loyalty, identify business trends, and improve
profitability. The Security Intelligence unit allows organizations to protect people, property, and
neutralize terrorism and crime.. The firm was founded in 1994 and is located in Melville, NY.
Price ($) (11/17/13) 36.07 Beta: 0.995 FY: December 2012A 2013E 2014E
Price Taget ($): 47.06 WACC 8.5% Revenue (Mil) 783 843 908
52WK Range ($): 24.60-38.33 M-Term Rev. Gr Rate Est: 6.5% % Growth 7.68% 7.70% 7.75%
Market Cap: 1,923.3 M M-Term EPS Gr Rate Est: 8.0% Gross Margin 67.30% 67.50% 67.80%
Shares Oustanding 53.3 M Debt/Equity 117.4% Operating Margin 11.05% 11.20% 11.50%
Short Interest (%): 1.2% ROA: 2.5% EPS $0.58 $0.69 $0.77
Avg. Daily Vol: 260.15 K ROE: 8.9% FCF/Share 2.43 2.63 2.83
Dividend ($): -$ 2012 Adjusted EPS: 2.47 P/E (TTM) 53.20 51.96 46.58
Yield (%): 0.00% EV/EBITDA 14.51 14.14 13.26
Recommendation
Verint Systems will continue to grow due to favorable industry trends and a strong market position. The
application software industry makes up approximately 49% of total software spending and is expected to
grow at a 6.3% CAGR over the next 5 years. The demand for big data analytics is expected to expand at a
five-year CAGR of 10%, according to IDC. This demand is driven by an increasing desire by companies
to understand customer behavior. Furthermore, the increase in overall data has created a need for big data
analytics to properly utilize and organize this information. Another high growth area VRNT is poised to
further penetrate is the cyber security market. According to marketsandmarkets, a research firm, this
market is expected to be the fastest growing segment of the IT sector for the next 5 years growing at a
CAGR of 11.3%. Due to VRNT’s significant market presence and overall experience in the security
market, they are expecting to increase their security contracts. VRNT has held case studies to gauge the
benefit of using their products which has resulted in multiple firms expressing that Verint’s application
software had paid for itself in less than a year. VRNT is leading the migration in video surveillance from
analog to IP and offers customers the ability to slowly switch from analog to IP due to the large costs
associated with direct switching. The firm’s large installed customer base is one of its strongest
competitive advantages and they consistently have had a retention rate above 90%. Due to growth
potential, positive industry trends, strong visibility and a favorable valuation, it is recommended that
VRNT be added to the AIM Fund with a target price of $47.06, which offers a potential upside of 30%.
Investment Thesis
Workforce Optimization Application Growth. The increasing demand for Workforce
Optimization (WFO) on to a unified platform has been growing in recent years. This allows
organizations to share data across multiple applications, lower total costs, share a common
Marquette University AIM Class 2014 Equity Reports Fall 2013 Page 6
database, and simplify system administration. According to Gartner less than 10% of Contact
Centers use WFO. This statistic provides VRNT with a large growth opportunity from a barely
penetrated market. Furthermore, WFO is expected to increase to 30% by 2015. Verint offers a
diversified WFO product portfolio, which gives the company a strong advantage over single
solution vendors. The firm has been receiving larger deals due to their diversified offering of
products. Additionally, VRNT has been expanding its WFO solutions to the back office and
branch operations which create opportunity for further growth. Due to Verint’s leadership
position in the WFO application, they should see benefits from this increase in demand.
Strong Visibility. Approximately 33% of revenue comes from maintenance, 5% in SaaS, and
over 50% from software sales to existing customers demanding further applications. Maintenance
and SaaS revenue are recurring, while 50% of revenues coming from sales to existing customers
have been stable as companies are consistently adding capacity and new branches. Furthermore,
only 15% of customers have purchased more than one product from the company’s portfolio of
solutions. Demand for a single vendor of unified solutions should increase cross-selling
opportunities for Verint Systems, which would generate revenue growth. Also, software
application spending and labor productivity have been strongly correlated in the past decade.
Thus, even in a low growth environment scenario, companies would still spend on software
applications to reduce costs and increase profits. Lastly, VRNT’s strong customer base across
multiple industries and geographies helps lower risk by not relying on single customers, and
promotes visibility.
Separation from Comverse. In February, 2013 VRNT eliminated the majority ownership and
control by Comverse Technology by paying $905 million, mostly in stock. The complete
independence from Comverse Technology offers multiple benefits for VRNT. The firm now has a
cleaner capital structure, increased public float, greater liquidity for investors, and a cleaner
corporate culture due to Comverse’s role in a stock option backdating scandal.
Valuation
To find the intrinsic value of VRNT, a ten-year DCF model was constructed. A WACC of 8.2% was
used, as well as a long term 2.5% terminal growth rate. The DCF model generated an intrinsic value of
$47.57 per share. A forward EV/EBITDA multiple approach was also used with a peer multiple of 17.7
and an intrinsic value of $46.55 was generated. Weighing the two values at 50/50, a price target of
$47.06 was established, representing a 30% upside. Additionally, varying the WACC and terminal growth
rate in a sensitivity analysis yielded a price range from $32-$56. The firm does not pay a dividend.
Risks
Global Economic Conditions. VRNT’s success is dependent on healthy economic conditions.
Macroeconomic weakness in the European Market has recently negatively affected Verint’s
revenue stream. Due to VRNT’s global presence, it is exposed to greater economic risk.
Debt Exposure. VRNT has a substantial amount of debt for a software company. The firm
believes the debt is cheap and bolsters its capital structure. However, if the company continues to
add debt it could put further stress on their financial situation.
Increasing Competition. VRNT was one of the first penetrators of the workforce optimization
market. If this market becomes further penetrated by large technology companies, VRNT could
face pricing pressures and market share loss.
Management
Dan Bodner is the current CEO of Verint Systems Inc. He has been with VRNT since inception and has
been the CEO since 1994. He previously held various management positions at Comverse Technology,
Inc. He recently purchased approximately $3 million shares in VRNT.
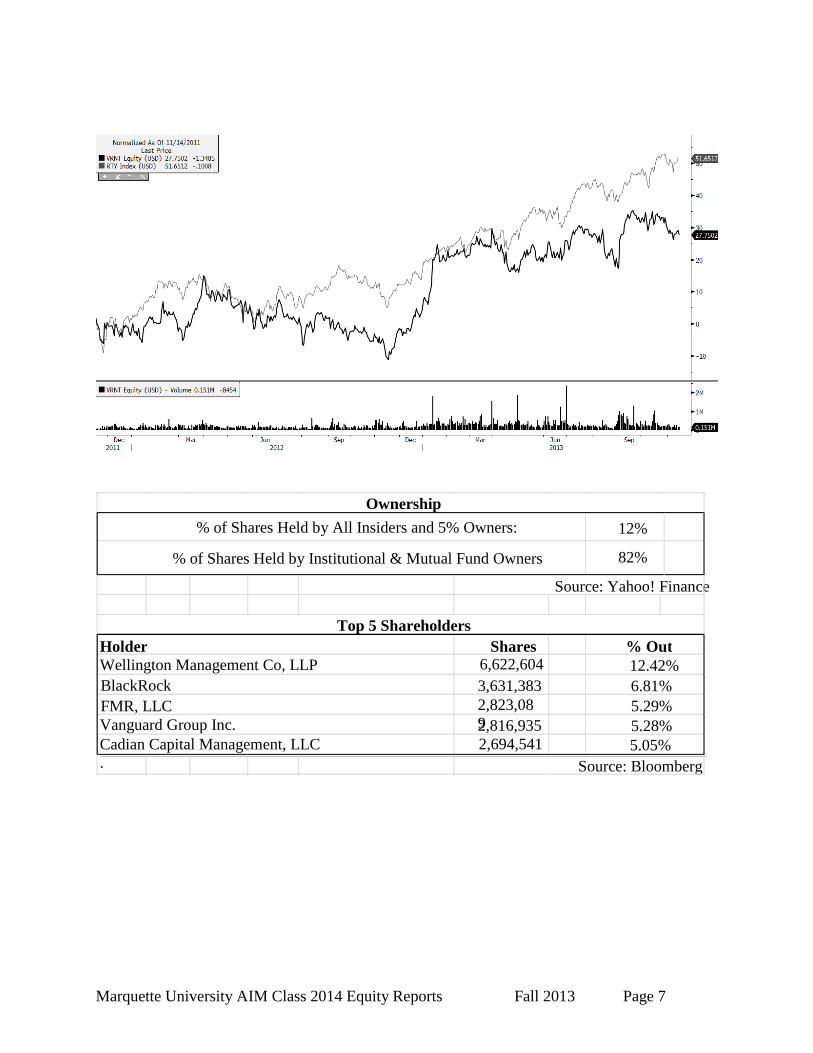
Marquette University AIM Class 2014 Equity Reports Fall 2013 Page 7
12%
82%
Shares 6,622,604
3,631,383
2,823,08
9
2,816,935
2,694,541
Top 5 Shareholders
Source: Yahoo! Finance
Source: Bloomberg
% of Shares Held by All Insiders and 5% Owners:
% of Shares Held by Institutional & Mutual Fund Owners
Ownership
Cadian Capital Management, LLC
.
% Out
12.42%
6.81%
5.29%
5.28%
5.05%
Holder
Wellington Management Co, LLP
BlackRock
FMR, LLC
Vanguard Group Inc.
Marquette University AIM Class 2014 Equity Reports Fall 2013 Page 8
SunOpta Inc (STKL)
November 22, 2013
Rocio Maria Diaz International Consumer Staples
SunOpta Inc. (Nasdaq STKL) is a leading natural, organic and specialty foods company. The company
specializes in the sourcing, processing and packaging of natural and organic food products, with a focus
on grains, fibers, and fruit-based foods. The company operates in two business segments: SunOpta Foods
(88% of revenue), which is a vertically integrated supplier of natural and organic raw materials,
ingredients and value-added products, and Opta Minerals (12%), which produces, distributes, and
recycles environmentally friendly industrial materials. From a geographic standpoint the company
operates in the U.S. (57% of revenue), Canada (29%) and other (14%). SunOpta Inc. was founded in
1973 and is headquartered in Brampton, Canada.
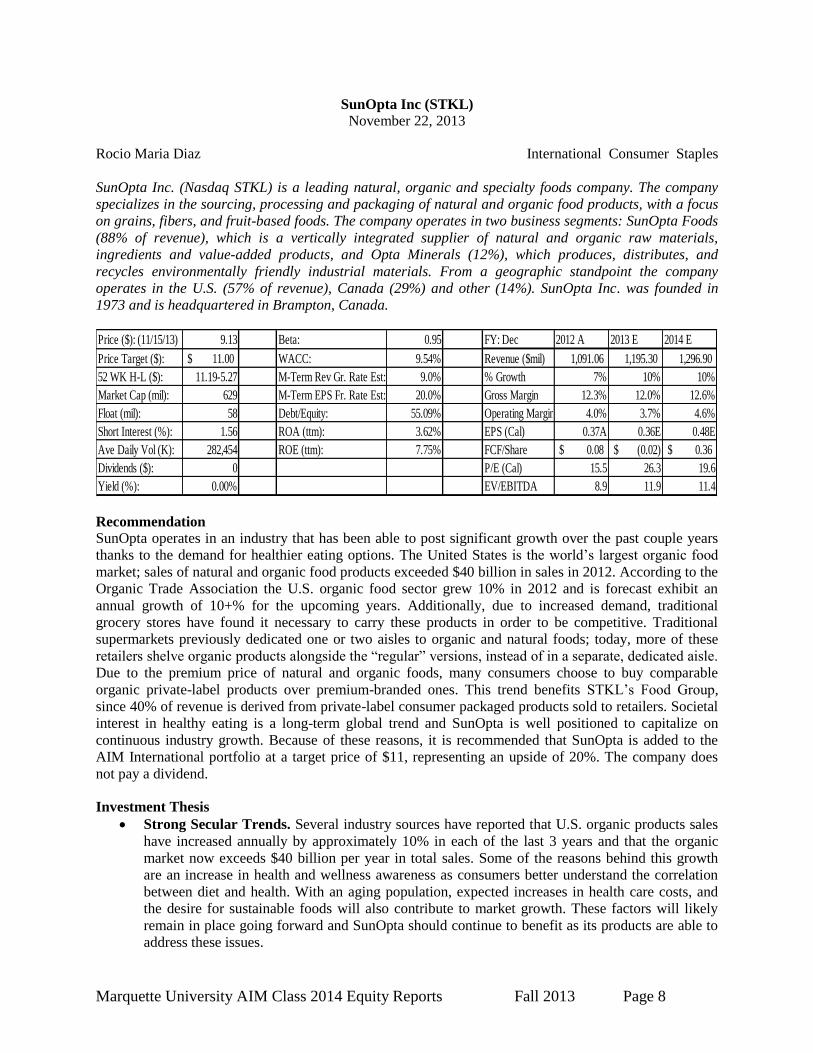
Price ($): (11/15/13) 9.13 Beta: 0.95 FY: Dec 2012 A 2013 E 2014 E
Price Target ($): 11.00$ WACC: 9.54% Revenue ($mil) 1,091.06 1,195.30 1,296.90
52 WK H-L ($): 11.19-5.27 M-Term Rev Gr. Rate Est: 9.0% % Growth 7% 10% 10%
Market Cap (mil): 629 M-Term EPS Fr. Rate Est: 20.0% Gross Margin 12.3% 12.0% 12.6%
Float (mil): 58 Debt/Equity: 55.09% Operating Margin 4.0% 3.7% 4.6%
Short Interest (%): 1.56 ROA (ttm): 3.62% EPS (Cal) 0.37A 0.36E 0.48E
Ave Daily Vol (K): 282,454 ROE (ttm): 7.75% FCF/Share 0.08$ (0.02)$ 0.36$
Dividends ($): 0 P/E (Cal) 15.5 26.3 19.6
Yield (%): 0.00% EV/EBITDA 8.9 11.9 11.4
Recommendation SunOpta operates in an industry that has been able to post significant growth over the past couple years
thanks to the demand for healthier eating options. The United States is the world’s largest organic food
market; sales of natural and organic food products exceeded $40 billion in sales in 2012. According to the
Organic Trade Association the U.S. organic food sector grew 10% in 2012 and is forecast exhibit an
annual growth of 10+% for the upcoming years. Additionally, due to increased demand, traditional
grocery stores have found it necessary to carry these products in order to be competitive. Traditional
supermarkets previously dedicated one or two aisles to organic and natural foods; today, more of these
retailers shelve organic products alongside the “regular” versions, instead of in a separate, dedicated aisle.
Due to the premium price of natural and organic foods, many consumers choose to buy comparable
organic private-label products over premium-branded ones. This trend benefits STKL’s Food Group,
since 40% of revenue is derived from private-label consumer packaged products sold to retailers. Societal
interest in healthy eating is a long-term global trend and SunOpta is well positioned to capitalize on
continuous industry growth. Because of these reasons, it is recommended that SunOpta is added to the
AIM International portfolio at a target price of $11, representing an upside of 20%. The company does
not pay a dividend.
Investment Thesis
Strong Secular Trends. Several industry sources have reported that U.S. organic products sales
have increased annually by approximately 10% in each of the last 3 years and that the organic
market now exceeds $40 billion per year in total sales. Some of the reasons behind this growth
are an increase in health and wellness awareness as consumers better understand the correlation
between diet and health. With an aging population, expected increases in health care costs, and
the desire for sustainable foods will also contribute to market growth. These factors will likely
remain in place going forward and SunOpta should continue to benefit as its products are able to
address these issues.
Marquette University AIM Class 2014 Equity Reports Fall 2013 Page 9
Expanding Profitable Segments. During the past five years, the company has made a clear shift
towards expanding the percentage of revenue coming from its consumer value-added and
packaged products segment (from 40% of revenue historically to 60% in 2012, targeting 80% by
the end of 2015), while decreasing the percentage coming from its raw materials business (from
60% of revenue historically to 40% in 2012, targeting 20% by the end of 2015). As this trend
continues, it should have a positive impact on the company’s operating margin, as value-added
products carry 10% operating margins, which is well ahead of the lower single-digit margins for
raw materials. As evidence of these efforts, in 2013 the company acquired a value-added grains
and handling facility in Bulgaria. The facility was a strategic supplier for the company, producing
value-added sunflower kernel, oil and related products. This acquisition further expanded its
global sourcing platform and value-added foods and ingredient offerings.
Margin Recovery. Even though in the third quarter of 2013 the company generated record
revenues (8.4% growth versus the third quarter last year); STKL faced 260 bps of YoY margin
compression during the quarter. Q3 2013 operating margins were negatively impacted by start-up
costs related to a newly commissioned cocoa processing facility located in The Netherlands, as
well as expansion costs related to the company’s premium juice facility in California – both being
one time-expenses in nature. Evidently, these start-up expenses are related to a variety of
expansion projects that should position SunOpta for strong sales and earnings growth for next
year and beyond.
Valuation
In order to find the intrinsic value of SunOpta, a five-year DCF model was conducted. Using a long term
growth rate of 3% and a WACC of 9.54%, resulted in a valuation of $10.81 per share. Relative valuation
methods using both P/E and P/Sales multiples were also conducted; using an average peer multiple P/E of
30x and P/S of 1.20x. Weighting these three valuations 70%, 15% and 15%, respectively, a price target of
$11 was established, which provides a potential upside of 20%. The company does not pay a dividend.
Risks
Changes in Consumer Trends. SunOpta has benefited by the increased health awareness which
has translated into strong growth in the natural and organic food industry. A negative change in
consumer trends could lead to sales declines in the future.
Volatility in Commodity Prices. SunOpta produces and uses various commodities such as
grains and fruits. The prices of these commodities can be affected by various factors, including
harvest quality and yield, and weather among others.
Loss of Key Customers. Even though SunOpta does not have any customers that represent more
than 10% of revenues, the loss of one of its customers could lead to a decrease in revenue and
earnings.
Management
Steve Bromley has been Chief Executive Officer since February 2007. Before joining SunOpta in June
2001, Mr. Bromley spent over 13 years in the Canadian dairy industry in a wide range of financial and
operational roles. The company’s CFO is Robert McKeracher, who has held this role since June 2008.
Prior to joining STKL, Mr. McKeracher was the Manager of Business Planning and Treasury at Magna
Entertainment Corp, after spending four years in public accounting at PriceWaterhouseCoopers. He is a
Chartered Accountant and holds a Bachelor of Commerce degree from The University of Toronto.
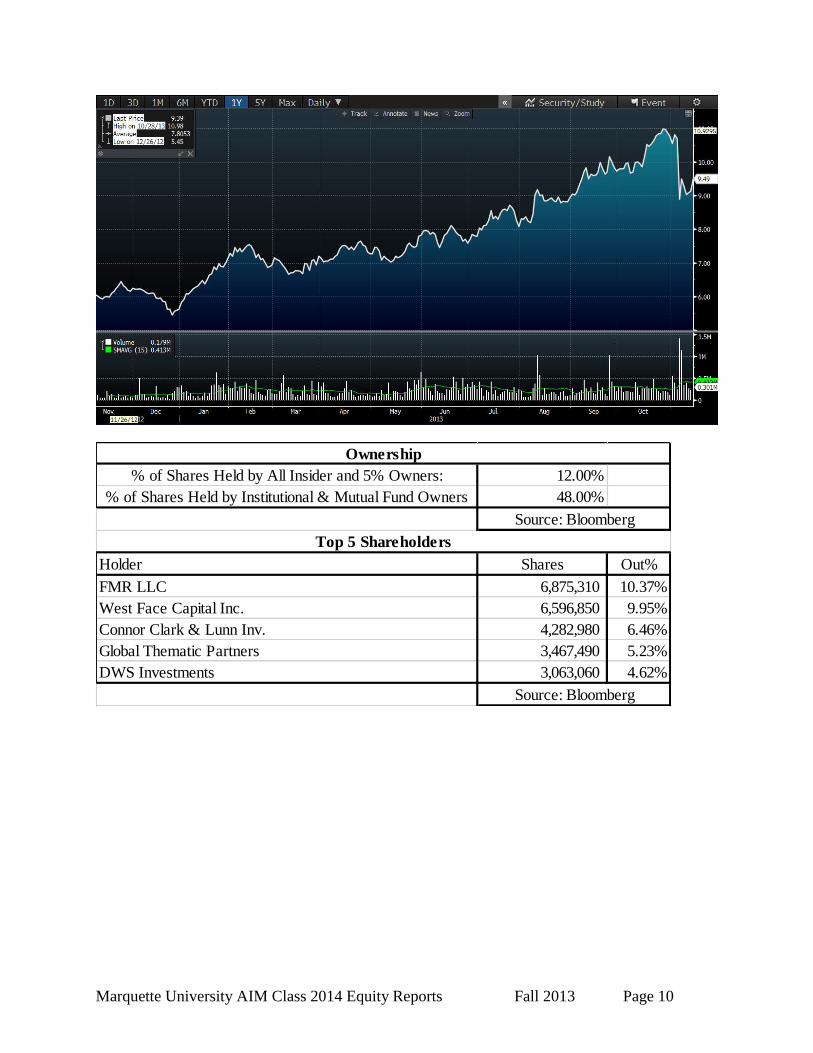
Marquette University AIM Class 2014 Equity Reports Fall 2013 Page 10
% of Shares Held by All Insider and 5% Owners: 12.00%
% of Shares Held by Institutional & Mutual Fund Owners 48.00%
Holder Shares Out%
FMR LLC 6,875,310 10.37%
West Face Capital Inc. 6,596,850 9.95%
Connor Clark & Lunn Inv. 4,282,980 6.46%
Global Thematic Partners 3,467,490 5.23%
DWS Investments 3,063,060 4.62%
Top 5 Shareholders
Ownership
Source: Bloomberg
Source: Bloomberg
Marquette University AIM Class 2014 Equity Reports Fall 2013 Page 11
National Grid (NGG)
November 22, 2013
John Hurley International Utilities
National Grid (NYSE: NGG) transmits and distributes electricity and natural gas to residential,
commercial, and industrial customers. NGG provides these services in the United Kingdom and the
United States (New York, Massachusetts, and Rhode Island). The company is comprised of many
subsidiaries that operate under different names. National Grid was founded in 1990 and is based in
London, England.
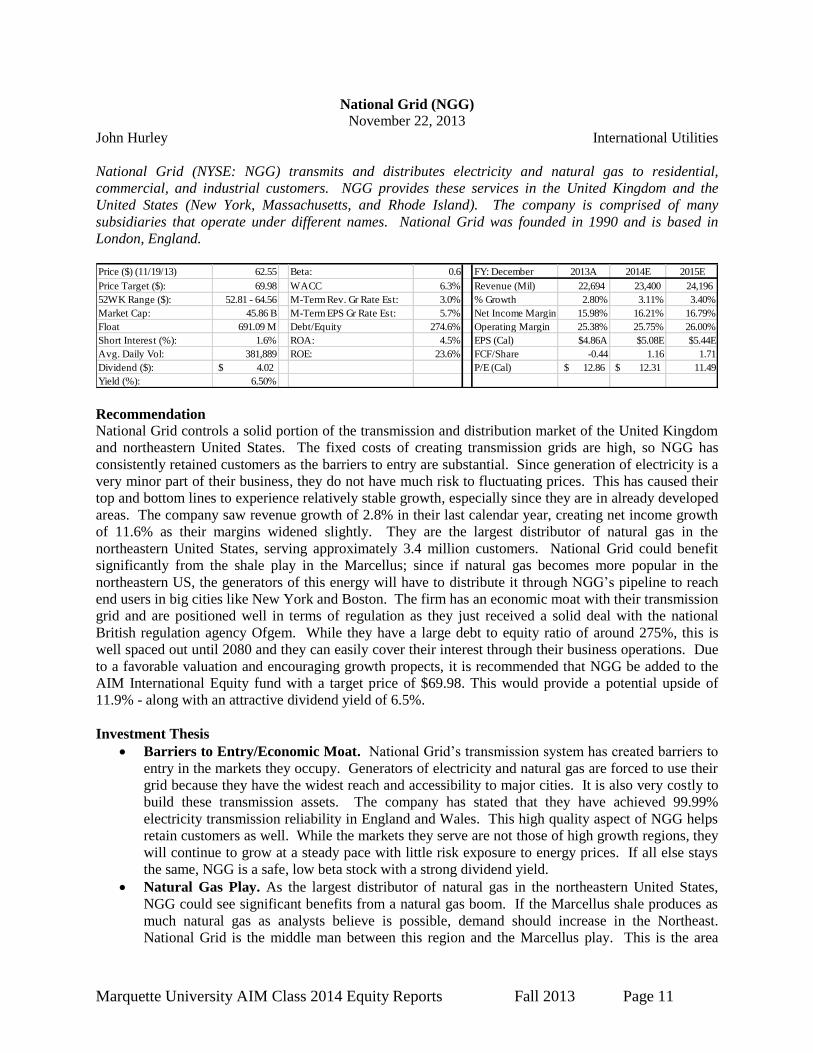
Price ($) (11/19/13) 62.55 Beta: 0.6 FY: December 2013A 2014E 2015E
Price Target ($): 69.98 WACC 6.3% Revenue (Mil) 22,694 23,400 24,196
52WK Range ($): 52.81 - 64.56 M-Term Rev. Gr Rate Est: 3.0% % Growth 2.80% 3.11% 3.40%
Market Cap: 45.86 B M-Term EPS Gr Rate Est: 5.7% Net Income Margin 15.98% 16.21% 16.79%
Float 691.09 M Debt/Equity 274.6% Operating Margin 25.38% 25.75% 26.00%
Short Interest (%): 1.6% ROA: 4.5% EPS (Cal) $4.86A $5.08E $5.44E
Avg. Daily Vol: 381,889 ROE: 23.6% FCF/Share -0.44 1.16 1.71
Dividend ($): 4.02$ P/E (Cal) 12.86$ 12.31$ 11.49
Yield (%): 6.50%
Recommendation
National Grid controls a solid portion of the transmission and distribution market of the United Kingdom
and northeastern United States. The fixed costs of creating transmission grids are high, so NGG has
consistently retained customers as the barriers to entry are substantial. Since generation of electricity is a
very minor part of their business, they do not have much risk to fluctuating prices. This has caused their
top and bottom lines to experience relatively stable growth, especially since they are in already developed
areas. The company saw revenue growth of 2.8% in their last calendar year, creating net income growth
of 11.6% as their margins widened slightly. They are the largest distributor of natural gas in the
northeastern United States, serving approximately 3.4 million customers. National Grid could benefit
significantly from the shale play in the Marcellus; since if natural gas becomes more popular in the
northeastern US, the generators of this energy will have to distribute it through NGG’s pipeline to reach
end users in big cities like New York and Boston. The firm has an economic moat with their transmission
grid and are positioned well in terms of regulation as they just received a solid deal with the national
British regulation agency Ofgem. While they have a large debt to equity ratio of around 275%, this is
well spaced out until 2080 and they can easily cover their interest through their business operations. Due
to a favorable valuation and encouraging growth propects, it is recommended that NGG be added to the
AIM International Equity fund with a target price of $69.98. This would provide a potential upside of
11.9% - along with an attractive dividend yield of 6.5%.
Investment Thesis
Barriers to Entry/Economic Moat. National Grid’s transmission system has created barriers to
entry in the markets they occupy. Generators of electricity and natural gas are forced to use their
grid because they have the widest reach and accessibility to major cities. It is also very costly to
build these transmission assets. The company has stated that they have achieved 99.99%
electricity transmission reliability in England and Wales. This high quality aspect of NGG helps
retain customers as well. While the markets they serve are not those of high growth regions, they
will continue to grow at a steady pace with little risk exposure to energy prices. If all else stays
the same, NGG is a safe, low beta stock with a strong dividend yield.
Natural Gas Play. As the largest distributor of natural gas in the northeastern United States,
NGG could see significant benefits from a natural gas boom. If the Marcellus shale produces as
much natural gas as analysts believe is possible, demand should increase in the Northeast.
National Grid is the middle man between this region and the Marcellus play. This is the area
Marquette University AIM Class 2014 Equity Reports Fall 2013 Page 12
where the firm has the potential to experience higher than historical growth. If the supply and
demand environment plays out, National Grid could see their pipelines flooded with natural gas,
increasing their top line as they are paid on a rate basis.
Diversification. The AIM International Fund currently has two utility stocks. One of the
holdings is a Brazilian water utility and the other specializes in electricity generation in Chile.
National Grid would provide much needed diversification since they focus on transmission and
distribution of energy. The United States and United Kingdom are both in periods of quantitative
easing, so hopefully the stock price reacts in favor of this policy. It would be beneficial to
diversify the risk of this sector into a safer position like NGG.
Valuation
In order to reach an intrinsic value for NGG, a ten year discounted cash flow model was conducted. A
WACC of 6.30% was combined with a terminal growth rate of 2.5% to reach a valuation of $75.70. An
EV/Sales comparables analysis was also performed to get a relative share price. Multiplying the 3.56x
EV/Sales competitor average by National Grid’s expected 2014 sales eventually led to an intrinsic value
of $70.51. Finally, a historical EV/EBITDA analysis of National Grid was done. Again looking to their
expected 2014 sales, a value of $60.11 was found. By weighing the DCF model 50%, the EV/Sales
valuation 20%, and the EV/EBITDA valuation 30%, a target price of $69.89 was reached. National Grid
also paid a dividend of $4.02 yielding 6.5%.
Risks
Location. National Grid was hurt by Hurricane Sandy when it hit the East Coast of the United
States. If another big hurricane hits their coverage area, National Grid could see their assets and
service compromised again. While they made it out last time, It would not be good for their
business if New York City loses power for days again. Being centered in two of the biggest
financial cities in the world (London and New York) are major risks as well. Terrorists and
hackers might try to access or destroy National Grid’s systems to shut down the cities. These also
are regions with much less possible growth than other areas.
Regulation and the Global Economy.- While National Grid locked in an eight year deal on their
transmission and distribution business with the national British regulatory agency Ofgem, there is
still risk of regulation in later years and in the United States. This past Summer, the world saw
the effects of regulation on the Brazilian utilities. They essentially capped these companies
potential revenues and their share prices plummeted with the economy. If fiscal stimulus does
not work as intended the UK and US could slip back into a recession. An easy way to increase
the populations disposible income is to cap what utility companies can charge end customers.
This would hurt NGG dramatically and their stock price would follow.
Management
Steve Holliday is the CEO of National Grid and has been since 2007. He has been on the Board of
National Grid since 2002. Prior to working there, he was an executive director of British Borneo Oil and
Gas. He also spent 19 years with Exxon Group where he held senior positions in the international gas
business. Holliday has a lot of experience in the energy industry. Peter Gershon is the Chairman of the
Board. He has served this position since 2011. Gershon has been the Chairman of another board
previously and was also a CEO at a different company. He has a lot of diversity and experience in
aligning managements interests with shareholders. Management seems to be very capable of leading
National Grid to continued success.
Marquette University AIM Class 2014 Equity Reports Fall 2013 Page 13
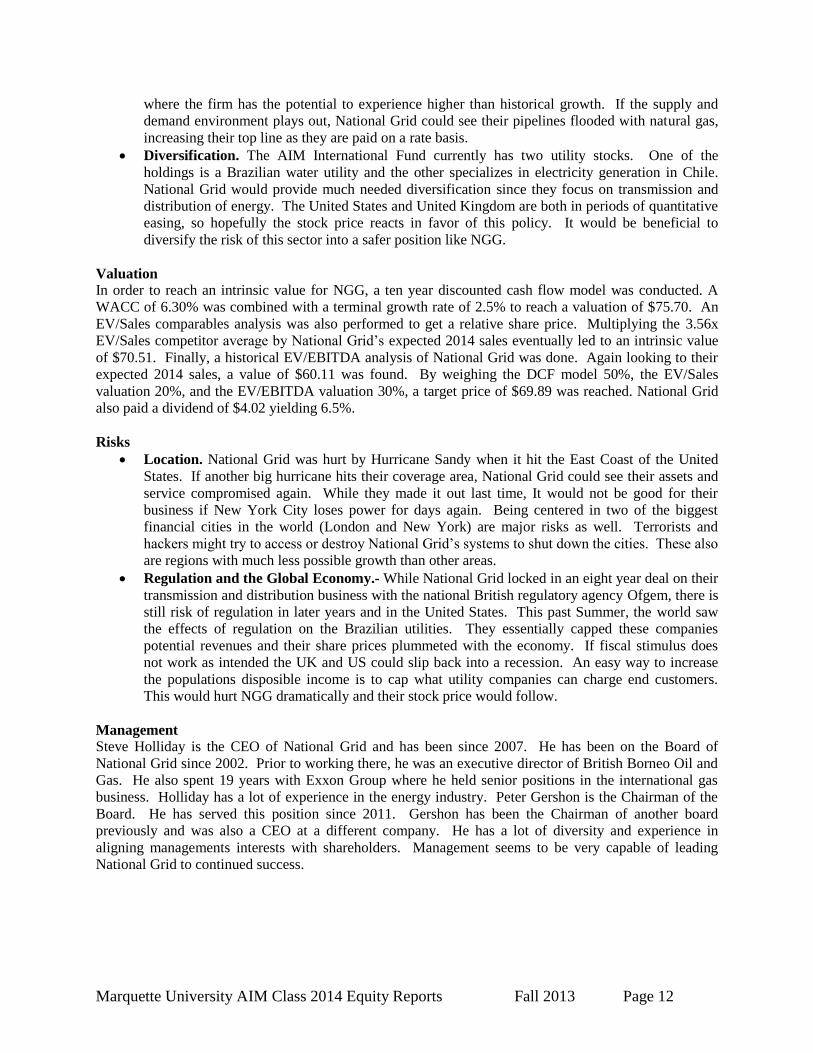
Source: Bloomberg
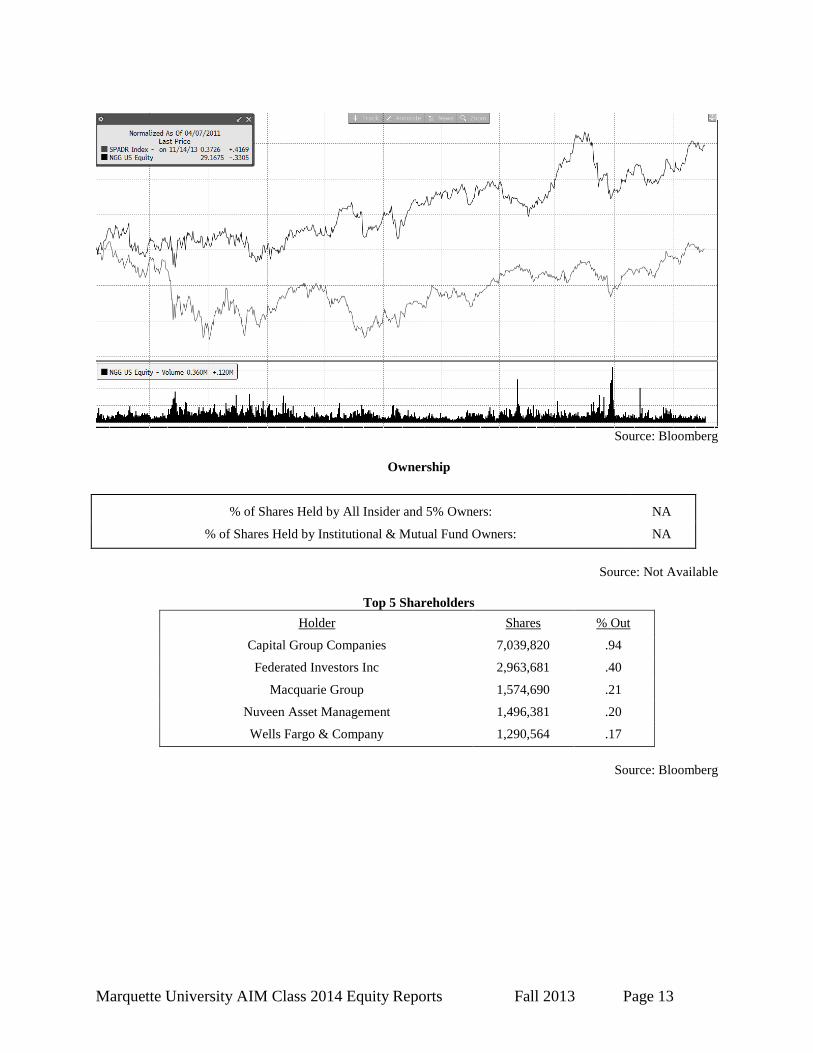
Ownership
Source: Not Available
Top 5 Shareholders
Holder Shares % Out
Capital Group Companies 7,039,820 .94
Federated Investors Inc 2,963,681 .40
Macquarie Group 1,574,690 .21
Nuveen Asset Management 1,496,381 .20
Wells Fargo & Company 1,290,564 .17
Source: Bloomberg
% of Shares Held by All Insider and 5% Owners: NA
% of Shares Held by Institutional & Mutual Fund Owners: NA
Marquette University AIM Class 2014 Equity Reports Fall 2013 Page 14
African Bank Investments Ltd. (AFRVY)
November 22, 2013
Dan Gaide International Financials
African Bank Investments (NYSE: AFRVY) is a South African loan and credit provider. AFRVY is divided
into two primary business segments: the African Bank Unit (88%) and the Ellerine Holdings Limited
(EHL) group (12%). The African Bank Unit provides financial services such as micro-financing and
credit cards to underserviced areas (LSM 2-8) of the South African population. The African Bank has
R53B ($5.2B) in advances on its books and 2.6 million credit customers. The EHL group, acquired in
2008, services more privileged areas of the South African economy (LSM 8-10) through furniture and
appliance retail and financial service operations. EHL has R4.8B ($473M) in furniture sales across
1,041 retail stores. As of September 30, 2013, AFRVY operated with over 14,000 employees primarily in
South Africa.
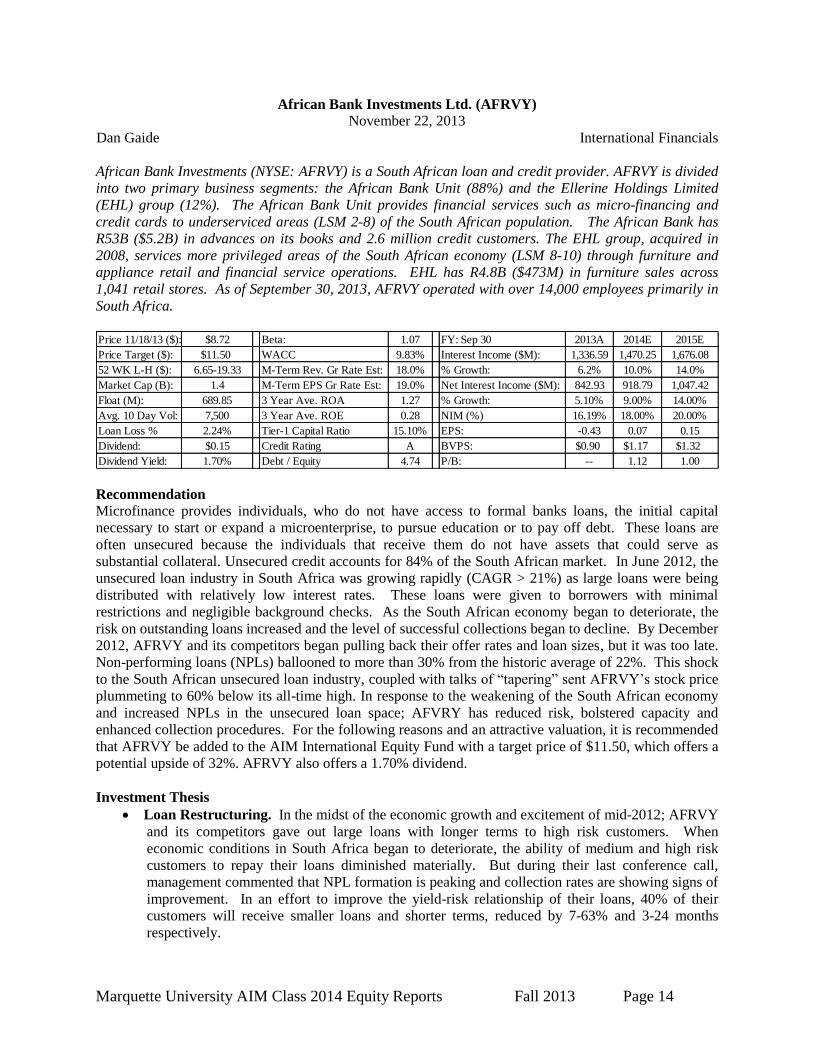
Price 11/18/13 ($): $8.72 Beta: 1.07 FY: Sep 30 2013A 2014E 2015E
Price Target ($): $11.50 WACC 9.83% Interest Income ($M): 1,336.59 1,470.25 1,676.08
52 WK L-H ($): 6.65-19.33 M-Term Rev. Gr Rate Est: 18.0% % Growth: 6.2% 10.0% 14.0%
Market Cap (B): 1.4 M-Term EPS Gr Rate Est: 19.0% Net Interest Income ($M): 842.93 918.79 1,047.42
Float (M): 689.85 3 Year Ave. ROA 1.27 % Growth: 5.10% 9.00% 14.00%
Avg. 10 Day Vol: 7,500 3 Year Ave. ROE 0.28 NIM (%) 16.19% 18.00% 20.00%
Loan Loss % 2.24% Tier-1 Capital Ratio 15.10% EPS: -0.43 0.07 0.15
Dividend: $0.15 Credit Rating A BVPS: $0.90 $1.17 $1.32
Dividend Yield: 1.70% Debt / Equity 4.74 P/B: -- 1.12 1.00
Recommendation
Microfinance provides individuals, who do not have access to formal banks loans, the initial capital
necessary to start or expand a microenterprise, to pursue education or to pay off debt. These loans are
often unsecured because the individuals that receive them do not have assets that could serve as
substantial collateral. Unsecured credit accounts for 84% of the South African market. In June 2012, the
unsecured loan industry in South Africa was growing rapidly (CAGR > 21%) as large loans were being
distributed with relatively low interest rates. These loans were given to borrowers with minimal
restrictions and negligible background checks. As the South African economy began to deteriorate, the
risk on outstanding loans increased and the level of successful collections began to decline. By December
2012, AFRVY and its competitors began pulling back their offer rates and loan sizes, but it was too late.
Non-performing loans (NPLs) ballooned to more than 30% from the historic average of 22%. This shock
to the South African unsecured loan industry, coupled with talks of “tapering” sent AFRVY’s stock price
plummeting to 60% below its all-time high. In response to the weakening of the South African economy
and increased NPLs in the unsecured loan space; AFVRY has reduced risk, bolstered capacity and
enhanced collection procedures. For the following reasons and an attractive valuation, it is recommended
that AFRVY be added to the AIM International Equity Fund with a target price of $11.50, which offers a
potential upside of 32%. AFRVY also offers a 1.70% dividend.
Investment Thesis
Loan Restructuring. In the midst of the economic growth and excitement of mid-2012; AFRVY
and its competitors gave out large loans with longer terms to high risk customers. When
economic conditions in South Africa began to deteriorate, the ability of medium and high risk
customers to repay their loans diminished materially. But during their last conference call,
management commented that NPL formation is peaking and collection rates are showing signs of
improvement. In an effort to improve the yield-risk relationship of their loans, 40% of their
customers will receive smaller loans and shorter terms, reduced by 7-63% and 3-24 months
respectively.

Marquette University AIM Class 2014 Equity Reports Fall 2013 Page 15
Bolstered Capital. In addition to the improvements of the yield-risk relationship of its loans,
AFRVY has made strides to strengthen the capital base underlying its loans. The capital base
will be strengthened predominantly through ordinary equity issuance to existing shareholders.
Management chose this form of capital raising because it will increase the buffer from a Basel III
point of non-viability, facilitate better issuance of Basel III compliant instruments and positively
impact credit rating. A maximum issuance of R4B was announced (approximately 6% of assets)
so further dilution of common equity is not expected.
Differentiated in a Growth Industry. Personal loan growth in the microfinance industry has
consistently been above 10% YoY since mid-2009, reaching highs of over 40% in late 2012.
Management of the African Bank unit expects to see its loan growth continue between 18% -
22% despite the general industry slow-down. African Bank is able to outperform its competitors
because of its access to resources and collection practices. African Bank was able to secure its
first foreign bond issue this year and its costs of funds were on average reduced to 8.6% from
9.2%. Further foreign capital acquisition should increase NIM going forward. African Bank also
differentiates itself on its collection practices by focusing on the “rehabilitation” of NPLs which
has developed the AFRVY brand and has led to a 75% business return-rate from its customers.
Returning Investor Confidence. After the shock to the unsecured loan market in 2012, many
investors have understandably been hesitant to reinvest in companies involved in this area (YTD
volume has decreased 50% from its historical average five year average). This means that
despite improvements of AFRVY fundamentals: NPLs (30.5% to 28.2%), write-offs (17.6 cents
to 6.3 cents) and impairment provisions (59.2% to 63.6%); company value has failed to improve
materially. During the most recent Quarter, 3 of the 5 largest shareholders of ABL (the equity
underlying AFRVY’s ADR) increased their positions in the company. The renewal of
shareholder confidence, inspired by continued improvement of fundamentals should drive the
price appreciation of AFRVY.
Valuation
To find the intrinsic value of AFRVY, an Excess Equity Return model, a P/B ratio analysis and a
Dividend Discount model were utilized. A WACC of 9.83% was used in the equity excess returns and
dividend model calculations; a 250 bps country premium was added. The excess equity model yielded a
value of $10.93. For the P/B model, a blended historical model was used against 2014-2018E BVPS to
yield an intrinsic value of $11.63. The DDM projected a return to the historical dividend and 2%
perpetuity growth, yielding an intrinsic value of $11.62. Weighting the different models 20%, 40% and
40%, respectively, a price target of $11.50 was established, offering a 32% upside. The current dividend
yield is about 1.70%.
Risks
South African Volatility. South Africa is an emerging market with its success largely tied to
gold, diamond, platinum and other material exports. With uncertainty looming around Federal
Reserve “tapering” and commodity prices, holding emerging market stocks contains inherent risk.
Regulatory Environment. Following the disastrous 2012 shock to the unsecured credit market,
the South African government has begun making strides to increase regulation on the financial
industry. It is unlikely that the South African government would impose overwhelming
restrictions on AFRVY because of the critical role that microfinance plays in economic
development, but increased scrutiny and regulation could diminish margins.
Management
Leonidas Kirkinis “Leon” is the founder and CEO of African Bank Investments Ltd. He founded African
Bank Investments in 1999 and participated in the acquisition of EHL in 2008. Nithiananthan Nalliah
Marquette University AIM Class 2014 Equity Reports Fall 2013 Page 16
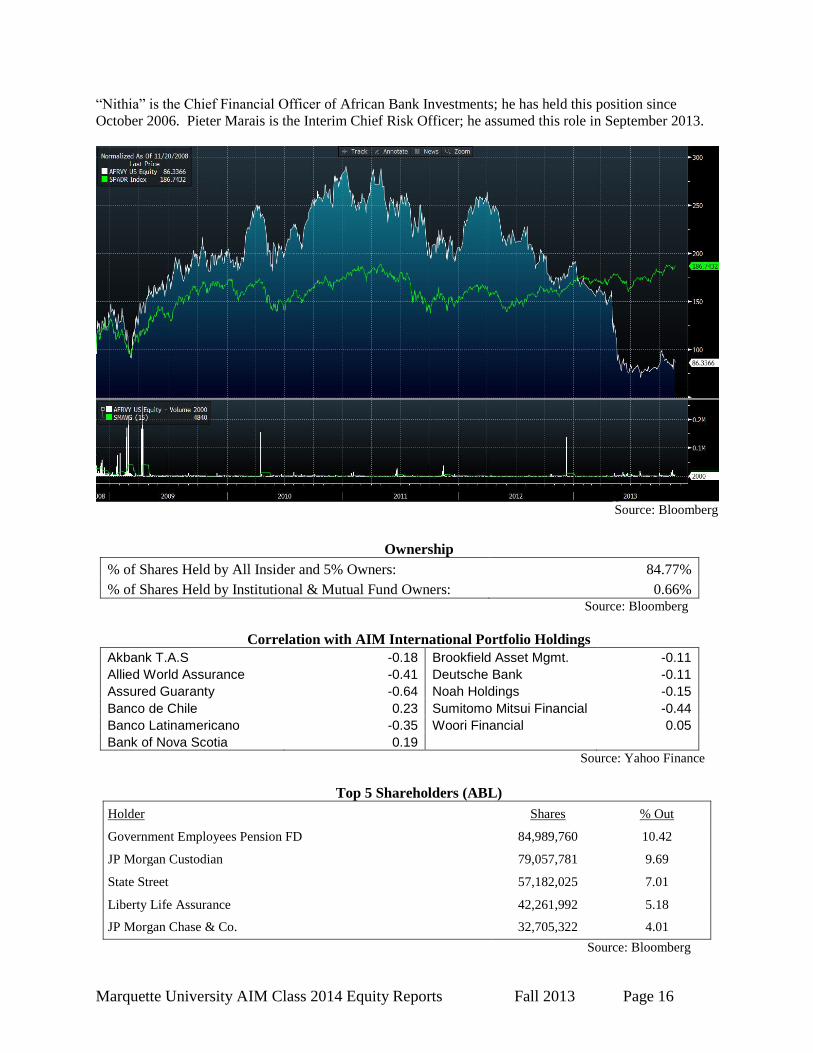
“Nithia” is the Chief Financial Officer of African Bank Investments; he has held this position since
October 2006. Pieter Marais is the Interim Chief Risk Officer; he assumed this role in September 2013.
Source: Bloomberg
Ownership
% of Shares Held by All Insider and 5% Owners: 84.77%
% of Shares Held by Institutional & Mutual Fund Owners: 0.66% Source: Bloomberg
Correlation with AIM International Portfolio Holdings
Akbank T.A.S -0.18 Brookfield Asset Mgmt. -0.11
Allied World Assurance -0.41 Deutsche Bank -0.11
Assured Guaranty -0.64 Noah Holdings -0.15
Banco de Chile 0.23 Sumitomo Mitsui Financial -0.44
Banco Latinamericano -0.35 Woori Financial 0.05
Bank of Nova Scotia 0.19
Source: Yahoo Finance
Top 5 Shareholders (ABL)
Holder Shares % Out
Government Employees Pension FD 84,989,760 10.42
JP Morgan Custodian 79,057,781 9.69
State Street 57,182,025 7.01
Liberty Life Assurance 42,261,992 5.18
JP Morgan Chase & Co. 32,705,322 4.01
Source: Bloomberg
Marquette University AIM Class 2014 Equity Reports Fall 2013 Page 17
Costamare Inc. (CMRE)
November 22, 2013
Joseph Hagen International Capital Goods
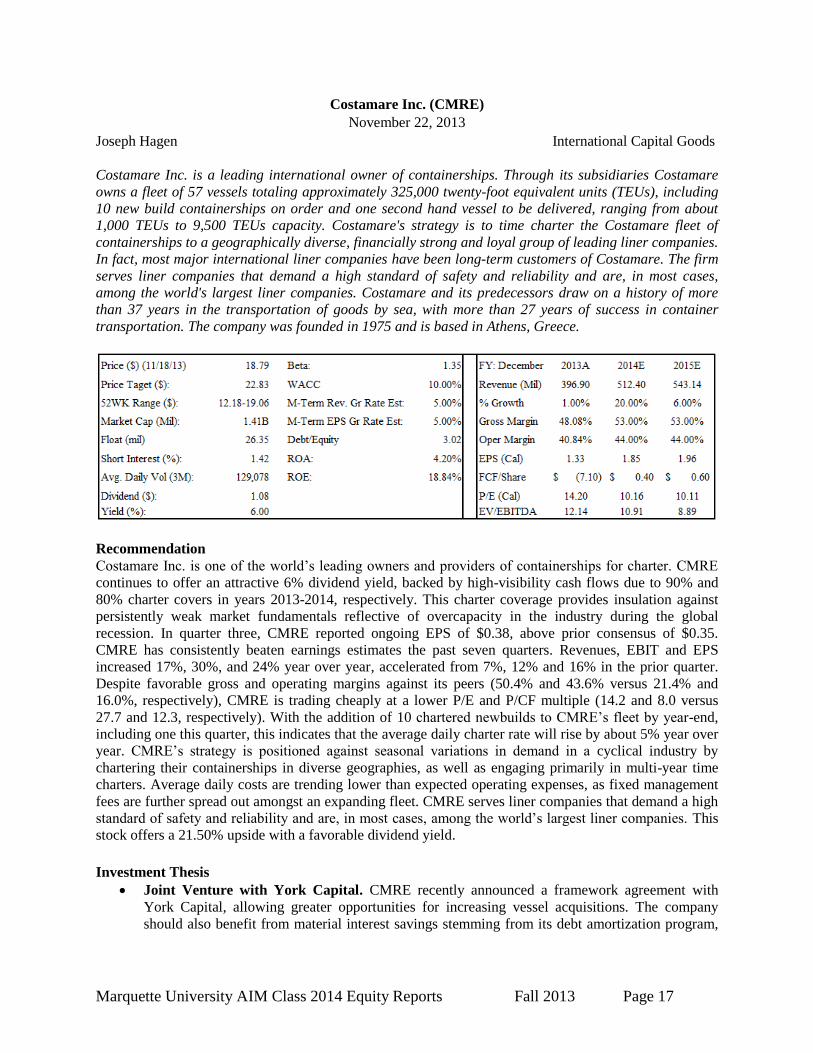
Costamare Inc. is a leading international owner of containerships. Through its subsidiaries Costamare
owns a fleet of 57 vessels totaling approximately 325,000 twenty-foot equivalent units (TEUs), including
10 new build containerships on order and one second hand vessel to be delivered, ranging from about
1,000 TEUs to 9,500 TEUs capacity. Costamare's strategy is to time charter the Costamare fleet of
containerships to a geographically diverse, financially strong and loyal group of leading liner companies.
In fact, most major international liner companies have been long-term customers of Costamare. The firm
serves liner companies that demand a high standard of safety and reliability and are, in most cases,
among the world's largest liner companies. Costamare and its predecessors draw on a history of more
than 37 years in the transportation of goods by sea, with more than 27 years of success in container
transportation. The company was founded in 1975 and is based in Athens, Greece.
Recommendation
Costamare Inc. is one of the world’s leading owners and providers of containerships for charter. CMRE
continues to offer an attractive 6% dividend yield, backed by high-visibility cash flows due to 90% and
80% charter covers in years 2013-2014, respectively. This charter coverage provides insulation against
persistently weak market fundamentals reflective of overcapacity in the industry during the global
recession. In quarter three, CMRE reported ongoing EPS of $0.38, above prior consensus of $0.35.
CMRE has consistently beaten earnings estimates the past seven quarters. Revenues, EBIT and EPS
increased 17%, 30%, and 24% year over year, accelerated from 7%, 12% and 16% in the prior quarter.
Despite favorable gross and operating margins against its peers (50.4% and 43.6% versus 21.4% and
16.0%, respectively), CMRE is trading cheaply at a lower P/E and P/CF multiple (14.2 and 8.0 versus
27.7 and 12.3, respectively). With the addition of 10 chartered newbuilds to CMRE’s fleet by year-end,
including one this quarter, this indicates that the average daily charter rate will rise by about 5% year over
year. CMRE’s strategy is positioned against seasonal variations in demand in a cyclical industry by
chartering their containerships in diverse geographies, as well as engaging primarily in multi-year time
charters. Average daily costs are trending lower than expected operating expenses, as fixed management
fees are further spread out amongst an expanding fleet. CMRE serves liner companies that demand a high
standard of safety and reliability and are, in most cases, among the world’s largest liner companies. This
stock offers a 21.50% upside with a favorable dividend yield.
Investment Thesis
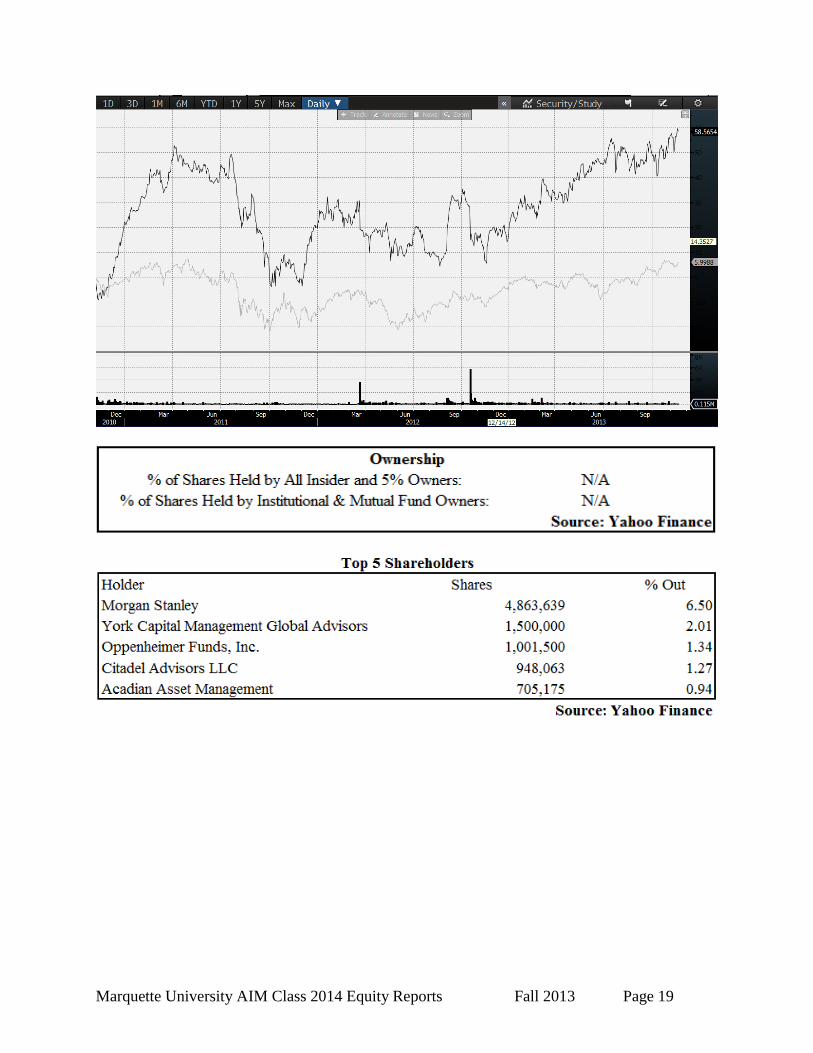
Joint Venture with York Capital. CMRE recently announced a framework agreement with
York Capital, allowing greater opportunities for increasing vessel acquisitions. The company
should also benefit from material interest savings stemming from its debt amortization program,
Marquette University AIM Class 2014 Equity Reports Fall 2013 Page 18
increasing financial flexibility in the long run. CMRE’s generation of revenues in U.S. dollars
better protects itself from volatilities associated with the Eurozone.
Increased Vessel Demand. CMRE’s larger than average vessels are in high demand as operators
increasingly extract economies of scale on major trade routes. Overall container demand is
expected to grow by 6% in 2014. This factor in conjunction with a stabilization in the Baltic Dry
Index will have positive industry implications.
Large Capacity Increase. CMRE has made substantial capital expenditures (534M) to acquire
new vessels in 2013. The ability to offer better charter rates is strongly correlated to operating a
larger fleet, and in turn will positively affect charter relations. This increase in economies of scale
will raise EPS and EBITDA margins through 2015.
Valuation
To find the intrinsic value of CMRE, a five year discounted cash flow model and EV/EBITDA multiple
appraoch was conducted. With the DCF, a WACC of 10.00% and a beta of 1.35 were used with a
terminal growth rate of 3%. The EV/EBITDA comparable resulted in a multiple of 9.3, yielding a price of
$21.70. The DCF amd EV/EBITDA were weighted equally, yielding an intrinsic value of $22.83. This
21.50% upside is based off strong exposure to faster growing emerging markets, above average flexibilty
supporting vessel acquisition, and an attractive dividend profile.
Risks
Global Economic Slowdown. In 2012 the impact of the continuing European sovereign debt
crisis and global economic slowdown, as well as uncertainty regarding the resolution of the
“fiscal cliff” in the United States, negatively impacted international trade while the supply of
containerships continued to rise. If these trends continued it would have negative implications for
the company.
Increased Operating Costs. In recent years, the supply and demand for well qualified crews has
created upward pressure on crewing costs. Also, the cost of fuel is the most significant factor in
negotiating charter rates and could have a detrimental impact on margins. CMRE does not hedge
against the price of fuel costs.
Charterer Relationships. CMRE’s revenue contracts depend on the relationship it has with its
charterers as well as their ability to make good on the payments to CMRE on time. Increased
competition from new entrants for charter contracts could increase price competition as well as
hinder the company’s ability to re-charter and/or expand with existing customers.
Management Founded by Captain Vasileios Konstantakopoulos in 1975, Costamare Management was until 2001 the
exclusive ship manager of the Costamare fleet of containerships. During this process Costamare
Management became one of the most respected containership managers in the world. The philosophy of
Costamare Management is to continuously strive to improve every aspect of operation of the
containerships it has under management. Its systems have been certified by a major classification society
for ISO 9001 quality management and for ISO 14001 environmental management.
Marquette University AIM Class 2014 Equity Reports Fall 2013 Page 19